Embed Size (px)
Citation preview
The Electric Car – Final Report
MAJOR PROJECT
RRU Students: Kenzie Field, Daniel Hall, Marnie Lorimer, Nitin Monteiro
Sponsor: Nancy Wilkin, Director of Office of Sustainability at Royal
Roads University
Faculty Advisor: Audrey Dallimore, School of Environment and
Sustainability Associate Professor

Executive Summary
This report analyzes the current state of knowledge of electric vehicles and the feasibility of
Greater Victoria’s ability to support them. Specifically to determine if the operation of electric
vehicles will reduce the greenhouse gas emissions (GHGs); CO2, CH4, and N2O, and be
economically feasible. In order to gain information, consultations are established with vehicle
dealerships, BC hydro, and early adopters. Additionally, literature reviews of the current
information available on the ‘cradle to grave’ life, the payback period and the infrastructure
requirements for electric vehicles that are required to be established within Greater Victoria are
also considered.
The ‘cradle to grave’ or life cycle assessment of the electric vehicle from creation to disposal can
benefit the environment depending on the electricity and source of energy used to charge the
vehicle. Using a renewable energy source can greatly improve the environmental cost. If using
coal power to generate electricity, then the electric vehicle is shown to have a greater
environmental impact. The Nissan leaf is very recyclable; everything but the paint and bumper.
In comparison, internal combustion vehicles have large number of components which are not
recyclable such as the generator and gas powered components. Electric vehicles are mostly
manufactured in Japan and the United States; however, parts come from all over the world. More
research on the extraction of raw materials and manufacturing electric vehicles is still required in
order to gain an accurate ‘cradle to grave’ assessment.
Although the initial price of purchasing an electric vehicle is more expensive than internal
combustion vehicles, it becomes more economically feasible in comparison to alternative fuel
sources when the annual maintenance, operational and fueling costs are analyzed. Other costs
and benefits, such as time required to fuel, distance on a full charge, self-satisfaction of being an
early adopter, and GHG reductions indicate that the electric vehicle is beneficial. It is
recommended that information should be gained from internal combustion vehicle consumers
and their reasons for not purchasing an electric vehicle. This would be done to gain a dynamic
understanding of the costs and benefits of both vehicles.

The electric vehicle infrastructure requirements for Greater Victoria are dependent on the
adoption of electric vehicles. Adoption of electric vehicles is more likely if appropriate
infrastructure is readily available; however, there is enough infrastructure for Greater Victoria’s
current early adopters. Results show that the Greater Victoria electrical power supply is not a
limiting factor to the electric vehicle infrastructure requirements of Greater Victoria. An increase
in electric vehicle adopters would require an increase in charging stations and power supply,
which is being addressed by the Province of British Columbia and BC Hydro, respectively. It is
recommended that consumers should be informed about available infrastructure to correct
preconceptions about limitations to adopting an electric vehicle. This could be accomplished by
making the results of this report public within the community by future Royal Roads University
Students.
In conclusion, the feasibility of electric vehicles as a solution to reducing GHG emissions in
Greater Victoria is dependent on the source of electricity, a decrease in the initial price, and the
increase of available infrastructure. However, more research should be conducted to further
understand the barriers behind the adoption of electric vehicles.

Table of Contents
1.0 Introduc-on 3 ......................................................................................................................Cradle to Grave Assessment 3 ..............................................................................................................
Background History of Internal Combus8on Vehicles 4 ..........................................................................Background History of Electric Vehicles 5 ..............................................................................................
1.2 Payback Period 9 ...........................................................................................................................1.2.1 Economic Payback Period 9 ............................................................................................................1.2.2 Other Costs and Benefits 9 ............................................................................................................
1.3 Infrastructure Requirements 9 .......................................................................................................1.3.1 Assessing the Electrical Power Supply 10 ......................................................................................1.3.2 Assessing the Different Electrical Charging Systems 10 ................................................................
1.4 Finding a Solu-on 10 ....................................................................................................................
2.0 Methods 12 .........................................................................................................................2.1 Cradle to Grave Assessment 12 .....................................................................................................2.2 Payback Period 12 .........................................................................................................................2.3 Infrastructure Requirements 12 .....................................................................................................
3.0 Results 13 .............................................................................................................................3.1 Cradle to Grave Assessment 13 ......................................................................................................
3.1.1 The Extrac8on Phase of Raw Materials 13 .....................................................................................3.1.2 The Transporta8on Phase of Materials to Produc8on Facility 15 ..................................................3.1.3 The Manufacturing Phase of the Electric Vehicle 15 ......................................................................3.1.4 The Use Phase of Electric Vehicles 16 ............................................................................................3.1.5 The Disposal Phase of Electric Vehicles 17 .....................................................................................
3.2 Payback Period 18 .........................................................................................................................3.2.1 Economic Payback Period 18 ..........................................................................................................3.2.2 Other Costs and Benefits 21 ..........................................................................................................
3.3 Infrastructure Requirements 23 .....................................................................................................3.3.1 Electrical Power Supply 24 .............................................................................................................3.3.2 Electrical Charging Sta8ons 29 .......................................................................................................3.3.3 Early Adopters 33 ...........................................................................................................................
4.0 Discussion 33 ........................................................................................................................4.1 Cradle to Grave Assessment 34 ......................................................................................................
4.1.1 The Extrac8on Phase of Raw Materials 34 .....................................................................................4.1.2 The Transporta8on Phase of Materials to Produc8on Facility 34 ..................................................4.1.3 The Manufacturing Phase of the Electric Vehicle 34 ......................................................................4.1.4 The Use Phase of Electric Vehicles 34 ............................................................................................4.1.5 The Disposal Phase of Electric Vehicles 35 .....................................................................................
4.2 Payback Period 35 .........................................................................................................................4.2.1 Economic Payback Period 35 ..........................................................................................................4.2.2 Other Costs and Benefits 36 ..........................................................................................................
4.3 Infrastructure Requirements 38 .....................................................................................................4.3.1 Electrical Power Supply 38 .............................................................................................................4.3.2 Electrical Charging Systems 39 ......................................................................................................4.3.3 Early Adopters 40 ...........................................................................................................................

5.0 Conclusion/Recommenda-ons 40 ........................................................................................
Appendix A 35 ............................................................................................................................1.0 Glossary of Terms 35 ......................................................................................................................2.0 Research Ques-onnaire 37 ............................................................................................................
2.1 Cradle to grave 37 ............................................................................................................................2.2 Payback period 37 .............................................................................................................................2.3 Infrastructure requirements 37 ........................................................................................................
3.0 RRU4 GreenBelt Telephone Script 39 ............................................................................................4.0 RRU4 GreenBelt Consent Form 42 ..................................................................................................5.0 Interview with Alec Tsang 44 .........................................................................................................6.0 Dealership Representa-ves Raw Data 46 .......................................................................................
6.1 Wheaton Chevrolet Representa8ve Paul Cook -‐ Chevrolet Volt 46 ..................................................6.2 Campus Nissan Representa8ve Andrew Mackintosh -‐ Nissan Leaf 47 ..............................................6.3 Metro Lexus Toyota Representa8ve Terry Kennedy -‐ Toyota Prius 48 ...............................................
7.0 Early Adopters Informa-on 50 ......................................................................................................8.0 Early Adopters Raw Data 51 ...........................................................................................................
8.1 Converted Suzuki Swi^ Owner Larry Danby: 51 ................................................................................8.2 Leaf Owner Dave Grove: 51 ..............................................................................................................8.3 Leaf Owner Brian Town: 52 ...............................................................................................................8.4 Tesla Owner Kent Rathwell: 53 .........................................................................................................
Appendix B 54 ............................................................................................................................1.0 Budget Report 54 ...........................................................................................................................
Appendix C 55 ...........................................................................................................................1.0 Payback Period Calcula-ons 55 ......................................................................................................
Appendix D 55 ............................................................................................................................1.0 Dealership Representa-ve Consent Form Signature Page 56 ..........................................................2.0 Early Adopters Consent Form Signature Page 57 ............................................................................

1.0 Introduction
The purpose of this project is to complete a report on the current state of knowledge of the
electric vehicles history, ‘cradle to grave’ assessment, payback period, infrastructure
requirements, and the feasibility of Greater Victoria to support them. Greater Victoria
encompasses the 13 easternmost communities including and surrounding Victoria, BC and
Colwood. The Solar Colwood project is a city of Colwood community initiative, which our
sponsor, Nancy Wilkin, director of the Office of Sustainability at Royal Roads University, is
associated with. The Office of Sustainability and the Solar Colwood project are working
together to build a community that supports the electric car. With Nancy Wilkin, we have been
able to connect Royal Roads University, a school dedicated to implementing sustainable energy
practices, with the Solar Colwood electric vehicle project. Through this project, Nancy Wilkin
and Solar Colwood will gain further understanding about electric vehicles in regards to
promoting implementation. With the problem of increasing greenhouse gas (GHG) emissions
(gaseous forms of elements or compounds that absorb and emit radiation) (Solomon, et al, 2007),
this project will give background information on the electric vehicle as a feasible alternative to
internal combustion vehicles in Greater Victoria.
The sponsor, Nancy Wilkin, has asked RRU4 GreenBelt (Team 4) to assess available information
to determine if the electric vehicle is an economically feasible solution to reduce greenhouse gas
emissions in Greater Victoria, when compared to other internal combustion vehicles on the
market. An evaluation of the current ‘cradle to grave’ data and future infrastructure requirements
along with an estimate of the payback period for an electric car were accomplished through
critical review of available data and interviews of electric car manufacturers, dealerships and
owners/early adopters, between January and August 2012. Recommendations to further the
study on electric vehicles, and dissemination of information to the local community are made.
1. Cradle to Grave Assessment In hopes of finding a more eco-friendly mode of transportation, which reduces GHG emissions,
an assessment of the ‘cradle to grave’ or life cycle of the electric vehicle from creation to
disposal was completed. Information was also taken from the ‘cradle to grave’ life of an internal
! 3

combustion vehicle to make a comparison and estimate the life of electric vehicle after it has
been in the market. Feasibility of the electric vehicle as an economical and environmental
solution can be determined from past literature, which obtains information on the extraction,
production, distribution, consumption and disposal of electric vehicles.
1. Background History of Internal Combustion Vehicles
The internal combustion engine (ICE) began evolving after steam engines were designed.
However, the progression of the ICE does not commence with one inventor but a number of
them worldwide and throughout time (About.com Inventors, 2012a). Both Sir Isaac Newton and
Leonardo da Vinci drew the first blueprint of an energy-powered vehicle. In 1769, French
engineer Joseph Cugnot built the first steam-powered vehicle for the military. The vehicle was
only able to travel at a speed of approximately 4.0 km/h and required frequent stops to build up
steam. The steam engine heated water in a boiler to create steam. The steam placed pressure on
pistons that turned crankshafts and in turn rotated the wheels of the vehicle. A variety of steam
vehicles such as steam coaches were invented by the 1800s. They were widely used in Britain
and United States. This same technology was used in the first trains (About.com Inventors,
2012a).
Surprisingly, the electric engine was also discovered in the 1800s. The first electric carriage was
invented approximately in the year of 1832. However, the era of steam and electric engines did
not last long and both were abandoned in favor of the gas powered engine, or internal
combustion engine (About.com Inventors, 2012a). The first gasoline powered vehicle is widely
debated, as no one single inventor was responsible for the invention. Christian Huygens, a
physicist, designed the first known internal combustion engine, which was recorded in 1680.
Following this event, a variety of engine developments were recorded. Gottlieb Daimler created
the first prototype for the modern gas engine, however, he patent was officially granted to Karl
Benz in 1886 (About.com Inventors, 2012a).
An internal combustion engine burns fuel inside the engine. A variety of fuel sources can be used
with the most successful being gasoline. Gasoline and air are sprayed into a cylinder chamber,
where the piston compresses and places pressure on the fuel. A spark plug is then used to
generate a spark that ignites the fuel, which will generate heat and hot gases that are pressurized
! 4

higher than the fuel air mixture. Due to this varying pressure, the piston will return to its original
position, the gases are vented and new fuel air mixture is introduced into the cylinder chamber.
The piston is connected to a crankshaft that rotates in a circular motion (About.com Inventors,
2012b).
The four-stroke engines that are used are considered internal combustion engines for
automobiles. The downward motion of the piston is the first stroke that intakes fuel and air into
the cylinder. The second stroke consists of the piston compressing the fuel in the chamber,
which is ignited by the spark plug. When the piston returns to its original position, the third
stroke is initiated. Finally the fourth stroke consists of the upward motion of the piston that vents
the hot gasses from the cylinder chamber (About.com Inventors, 2012b).
2. Background History of Electric Vehicles
In the 1830s Sibrandus Stratingh, a Dutch inventor produced an electromagnetic cart. From this
invention evolved actual electric vehicles that were cleaner, cost-effective and could move at
slow speeds using rechargeable batteries. The electric vehicles were very appealing in the early
20th century, out populating the gas-powered vehicles with a quieter and less harmful structure.
Columbia Runabout was the most popular electric vehicle of that time and was known to travel
40 miles up to speeds of 15 mph on a battery’s single charge. The Detroit electric vehicle,
created in 1913, was a more attractive vehicle than the gas-powered vehicle as it contained a
! 5
Figure 1 1903 Columbia Mark LX Electric Runabout (Times Special, 2007a)
Figure 2 Detroit Electric Vehicle 1913 (Kilkenny, 2009)

desired characteristic, it didn’t backfire. Before Henry Ford produced his mass production of
gasoline vehicles his wife, Clara Ford, actually drove a Detroit Electric. This car was known to
travel 80 miles before the battery would need recharging (Romero, 2009).
�
Figure 3 1974 Vanguard-Sebring CitiCar (Time Specials, 2007b)
In the 1920’s vehicles soon became more of a necessity to everyone. Henry Ford’s gasoline
powered vehicles destroyed the industry of electric vehicles, as fossil fuels became an abundant
and cheap source of energy. Through the years fuel consumption amplified with the increasing
production of gasoline vehicles. This response drove up the prices for fuel and fear was also
generated in regards to fuel supplies becoming diminished (Romero, 2009).
In 1960’s and 1970’s, the beliefs that fuel provisions would soon be decreasing and therefore, the
fuel prices beginning to rise were all contributions that established the revival of electric vehicle
prototypes, Vanguard-Sebring CitiCar, and REVA. However, these prototypes were developed to
! 6
Figure 4 2001 Toyota RAV4 EV (Time Specials, 2007d)

run off of fuel cells, using hydrogen, hydrocarbons and alcohol, in order to produce electricity.
Fuel cells were an alternative to using batteries. Speeds increased within the electric vehicles
through this era but sales did not. This ultimately halted the production in order to fabricate an
alternative electric vehicle design (Romero, 2009).
General Motors (GM), Toyota, and Tesla Motors each manufactured an electric vehicle (Romero,
2009). GM’s produced the EV1, however, it failed because the manufacturing costs were too
expensive for mass production (Romero, 2009). Additionally, the battery of the EV1 could only
work in warmer climates, therefore, not a practical buy for individuals living in colder climates
(Time Specials, 2007c). Toyota produced the Rav4 EV and it was presented in 2001 but it too
failed because charging required a wall mount, separate to the car (Romero, 2009). On a single
charge however, this car could drive up to 120miles and at a speed of 78mph (Time Specials,
2007d). Furthermore, the Tesla Roadster, presented in 2006, failed due to the high purchase
price of $90,000 (Romero, 2009). However, its battery life could withstand approximately 245
miles and in four seconds accelerate to 60 mph (Time Specials, 2007e).
In 2010 the Nissan dealership introduced the Leaf, a 100% zero emissions electric vehicle that
requires no fuel, to Japan and the United States of America. In November 2011, the Leaf was
available in Canada. The Nissan Leaf can range approximately 160km or 100miles on a fully
loaded battery, up to speeds of 144km/h or 90mph. It runs on a 24kWh lithium ion battery and
has options to charge with the 120V portable charging cable, level 1, the 240V charging dock ! 7
Figure 6 2011 Nissan Leaf (Nissan Canada, 2012)
located at home or at locations nearby, level 2, or the optional 50KW direct current fast charging
port, level 3 (Nissan Canada, 2012). These charging stations can be viewed in Figure 10 and
Figure 11.
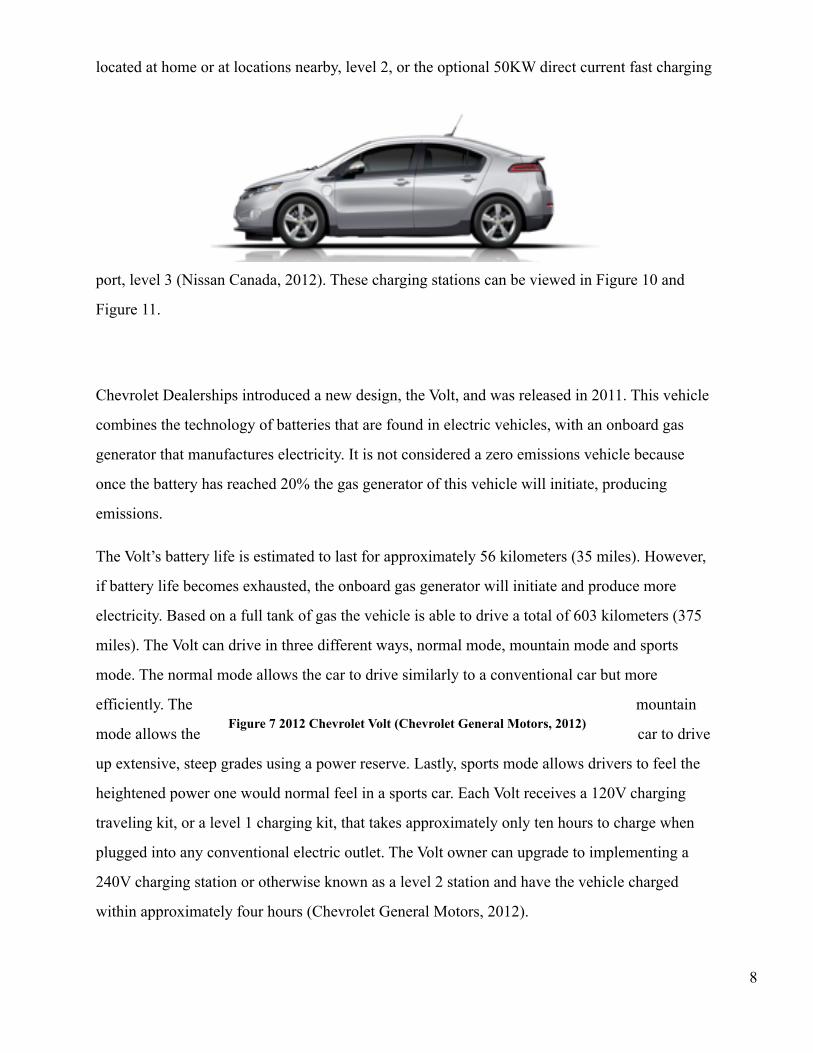
Chevrolet Dealerships introduced a new design, the Volt, and was released in 2011. This vehicle
combines the technology of batteries that are found in electric vehicles, with an onboard gas
generator that manufactures electricity. It is not considered a zero emissions vehicle because
once the battery has reached 20% the gas generator of this vehicle will initiate, producing
emissions.
The Volt’s battery life is estimated to last for approximately 56 kilometers (35 miles). However,
if battery life becomes exhausted, the onboard gas generator will initiate and produce more
electricity. Based on a full tank of gas the vehicle is able to drive a total of 603 kilometers (375
miles). The Volt can drive in three different ways, normal mode, mountain mode and sports
mode. The normal mode allows the car to drive similarly to a conventional car but more
efficiently. The mountain
mode allows the car to drive
up extensive, steep grades using a power reserve. Lastly, sports mode allows drivers to feel the
heightened power one would normal feel in a sports car. Each Volt receives a 120V charging
traveling kit, or a level 1 charging kit, that takes approximately only ten hours to charge when
plugged into any conventional electric outlet. The Volt owner can upgrade to implementing a
240V charging station or otherwise known as a level 2 station and have the vehicle charged
within approximately four hours (Chevrolet General Motors, 2012).
! 8
Figure 7 2012 Chevrolet Volt (Chevrolet General Motors, 2012)

1.2 Payback Period The payback period, as defined in the Glossary of Terms, of two electric vehicles, the Chevrolet
Volt and the Nissan Leaf are assessed. These vehicles are compared to two internal combustion
vehicles, the Chevrolet Malibu and the Chevrolet Cruze, and a hybrid vehicle, the Toyota Prius.
This is completed in order to identify the amount of time before the consumer begins making
money on their electric vehicle purchase. A qualitative assessment of the costs and benefits of
owning an electric vehicle are discussed as well in the hopes that this information will help
consumers in their purchasing decisions.
1.2.1 Economic Payback Period
The economic payback period is important because it provides consumers with economic
information on electric vehicles compared to other vehicles on the market. Factors that are
included in calculating an economic payback period includes initial price, rebate (Table 1),
annual fueling price, and maintenance cost of each vehicle (Table 2). From these factors, the
payback period (Table 3) and the savings after the payback period (Table 4) were calculated.
1.2.2 Other Costs and Benefits
There are costs and benefits of purchasing an electric vehicle other than economic ones (Table 5
and Table 6). Time costs, the distance the vehicle can travel on a charge, and the concerns of
adopting new technology can be factors included in decision making (Mackintosh, personal
communication, 2012). Benefits other than economic ones include a reduction in GHG
emissions and the self-satisfaction consumers’ gain when becoming an early adopter (Danby,
personal communication, 2012; Town, personal communication, 2012).
1.3 Infrastructure Requirements Greater Victoria will require infrastructure to accommodate an electric vehicle fleet, including
public power stations and a source of electricity. Available information on electrical power
supply for Greater Victoria was compared with estimated power requirements for electric
vehicles.
! 9

1.3.1 Assessing the Electrical Power Supply
The assessment of available information in regards to the amount of energy supplied to Greater
Victoria and the ability to sustain this energy once more electric vehicles are adopted is obtained
from Alec Tsang, Technology Strategist of B.C Hydro.
1.3.2 Assessing the Different Electrical Charging Systems
The different electrical charging systems are determined by literature reviews and information
obtained by the various dealerships in order to produce an informed table on the level 1, 2, and 3
charging stations.
1.4 Finding a Solution In the past, the electric vehicle was not adopted even with improving technology and less
environmentally damaging fuel sources. The continuous discovery of fossil fuels and the
consumption of low fuel prices predominantly outweighed the electric vehicle’s potential to
survive. Due to the consumption of fossil fuels for internal combustion engines, GHG levels
(carbon dioxide, methane, nitrous oxide) began to increase in the 1920’s and still continue to rise
(Solomon, et al., 2007). This can be seen in the 2007 IPCC Science Report, Figure 8 (Solomon,
et al., 2007).
Considering the increase in GHG emissions over the last 100 years, fossil fuel extraction
becoming finite and fossil fuel prices continuously rising, electric vehicles may be a solution. In
the last few years electric vehicles have been making a major comeback with more affordable
prices, progressive battery technology (Mackintosh, personal communication, 2012) and the help
of motivated citizens wanting to reduce GHG emissions (Town, personal communication, 2012).
! 10

!
Figure 8 GHG emission trends of carbon dioxide, methane, and nitrous oxide over the last couple centuries, this data was compiled and published in the 2007 ICPP Science Report.
! 11

2.0 Methods 2.1 Cradle to Grave Assessment Methods for obtaining available information to assess the 'cradle to grave' include:
• Literature review
• Consulting vehicle dealership with the use of ethical review through Royal Roads
University
2.2 Payback Period Methods for obtaining available information to assess the economic payback period and other
costs and benefits of the electric vehicle include:
• Using the Fuel Economy Guide (2011)
• Using the Sidney Action Toolkit (2011) (information for toolkit obtained from the Draft
Methodology for Reporting BC Local Government GHG Emissions)
• Completing an ethical review to consult with dealership representatives (Paul Cook of
Wheaton Chevrolet, Andrew Mackintosh of Campus Nissan, and Terry Kennedy of Metro
Lexus Toyota)
• Calculating economic payback period and financial savings per year
2.3 Infrastructure Requirements Methods for obtaining available information to assess the infrastructure of Greater Victoria
include:
• Literature reviews of online resources and research papers
• Interviews of infrastructure/power supply regulators and early adopters in Greater
Victoria
! 12
3.0 Results 3.1 Cradle to Grave Assessment
3.1.1 The Extraction Phase of Raw Materials
The extraction of raw materials is an essential step in the life cycle assessment. This phase of the
assessment indicates the location of the materials necessary for production of electric vehicles, as
well as the method of obtaining the materials of interest. Raw materials used to manufacture
electric vehicles can include crude oil, iron, steel, aluminum, copper, lead, nickel, rare earth
metals, and lithium, etc. These elements are generally derived from a number of regions around
the world and rarely are they obtained from one location (Petersen, 2011). This is believed to
increase the GHG’s emitted during vehicle production and is seen as an environmental cost.
The environmental cost in this report refers to the potential volume of CO2 and other air
emissions produced as a result of the various phases of the life cycle assessment of electric
vehicles. When considering the extraction of raw materials, this will include using large
machinery to excavate the earth in locations of interest in order to obtain the various materials.
The number of mining methods, which include surface, strip, open pit, placer and underground
mining consume extensive amounts of energy and produce large volumes of waste (Dodd,
2012b). The use of machinery creates an environmental cost in the form of CO2 and air
emissions emitted from running the vehicles. Additionally, these vehicles will use fuel from of
petroleum, which in itself is detrimental to the environment due to the large volumes of air
emissions produced, the large quantity of energy consumed, and the waste produced (Dodd,
2012a).
! 13
!
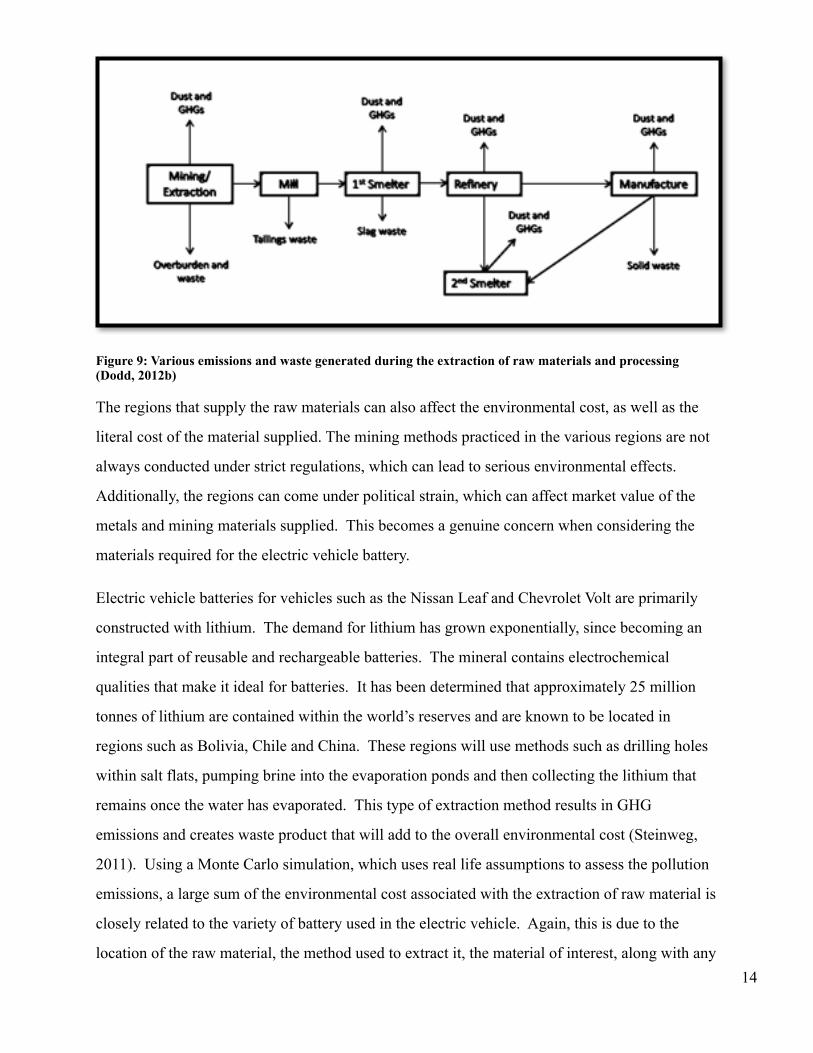
Figure 9: Various emissions and waste generated during the extraction of raw materials and processing (Dodd, 2012b)
The regions that supply the raw materials can also affect the environmental cost, as well as the
literal cost of the material supplied. The mining methods practiced in the various regions are not
always conducted under strict regulations, which can lead to serious environmental effects.
Additionally, the regions can come under political strain, which can affect market value of the
metals and mining materials supplied. This becomes a genuine concern when considering the
materials required for the electric vehicle battery.
Electric vehicle batteries for vehicles such as the Nissan Leaf and Chevrolet Volt are primarily
constructed with lithium. The demand for lithium has grown exponentially, since becoming an
integral part of reusable and rechargeable batteries. The mineral contains electrochemical
qualities that make it ideal for batteries. It has been determined that approximately 25 million
tonnes of lithium are contained within the world’s reserves and are known to be located in
regions such as Bolivia, Chile and China. These regions will use methods such as drilling holes
within salt flats, pumping brine into the evaporation ponds and then collecting the lithium that
remains once the water has evaporated. This type of extraction method results in GHG
emissions and creates waste product that will add to the overall environmental cost (Steinweg,
2011). Using a Monte Carlo simulation, which uses real life assumptions to assess the pollution
emissions, a large sum of the environmental cost associated with the extraction of raw material is
closely related to the variety of battery used in the electric vehicle. Again, this is due to the
location of the raw material, the method used to extract it, the material of interest, along with any ! 14

associated material required to manufacture the electric vehicle battery (McCleese and LaPuma,
2002).
3.1.2 The Transportation Phase of Materials to Production Facility
The transportation phase of the ‘cradle to grave’ assessment of the electric vehicle deals with the
environmental costs of transporting the raw material from the site of excavation to the production
facility. The transportation variable is rarely included in a life cycle assessment, since it is
essential for the manufacture of any vehicle and therefore will not change the overall
environmental cost when conducting a comparison test between different vehicles. However,
the mode of transportation can play a significant role in the volume of emissions produced and
can be concluded that transportation of raw materials will lead to large amounts of pollution
emitted.
According to the Nissan dealership representative from Campus Nissan, presently Leaf is
manufactured in Japan and therefore it can be assumed that raw materials not derived from the
area are transported there (Mackintosh, personal communication, 2012). It should also be noted
that purchase of a vehicle outside the country of production will require transportation of parts
and vehicle to the location of purchase. The overall movement of raw materials, parts and
vehicles add to the environmental cost of pollution emitted, and this can depend on distance from
excavation site to production facility and distance from production facility to vehicle purchase
location. However, with the potential construction of a production facility in place for 2013 in
the U.S, some of the environmental costs associated with transportation can be reduced.
Likewise for the Chevrolet Volt, it was indicated by the Chevrolet dealership representative from
Wheaton Chevrolet that production of the vehicle occurs in the U.S, which helps to reduce
environmental costs associated with transportation when purchase occurs in North America
(Cook, personal communication, 2012).
3.1.3 The Manufacturing Phase of the Electric Vehicle
The production and manufacturing phase of the ‘cradle to grave’ assessment focuses on the
environmental cost of constructing the vehicle using materials obtained from the acquisition of
raw materials. This stage greatly impacts the environment since it is very energy intensive and
will result in large volumes of pollution emitted, as well as waste products produced.
! 15

Parts and vehicle manufacturing require a large facility for production. These facilities in turn
require energy for operation. The use of energy derived from carbon or petroleum sources,
which are common amongst manufacturing facilities in the U.S., feeds into the overall
environmental costs of the life cycle, since large amounts of GHGs are produced (Ma, Balthasar,
Tait, Riera-Palou, Harrison, 2012). If the energy source is obtained from a renewable source,
such as hydro power, GHGs are greatly reduced. It can be noted that the use of recycled
materials such as aluminum can result in less energy consumption, since using recycled materials
is less energy intensive then manufacturing whole new components (McCleese and LaPuma,
2002). It is uncertain if the production facilities for Nissan and Chevrolet use recycled material
in order to construct components for their specific electric vehicle. In addition to the large
quantity of energy consumed, the manufacturing of electric vehicles will result in waste
production. Waste production can detrimentally affect the environment similar to the production
of air emissions (Dodd, 2012c).
The manufacturing phase for the battery component of an electric vehicle is the step that
differentiates the production phase of electric vehicles from internal combustion engine vehicles
(McCleese and LaPuma, 2002). In order to obtain batteries for electric vehicles, an auxiliary
manufacturing source is used to produce a functioning battery. The batteries are then shipped to
the manufacturing facility of the vehicle. As of March 2011, Nissan uses a variation of the
lithium-ion battery that includes a magnesium cathode, which is produced by Automotive Energy
Supply (Nissan NEC JV) in Japan. The Chevrolet Volt uses a lithium-ion polymer battery, which
is produced by Compact Power; a subsidiary of the Korea based LG Chem. It is still unclear
exactly where the lithium raw materials sources for both companies are located. However, the
extractions of raw materials for battery production are environmentally costly no matter the
location of the source. As for the production phase for the battery, the environmental cost is
dependent on the energy source used for the manufacturing facility (Steinweg, 2011).
3.1.4 The Use Phase of Electric Vehicles
The environmental costs of the use phase of the electric vehicles are dependent on the source of
the energy used to charge the vehicle. Electric vehicles are relatively clean burning, where the
vehicle produce limited to no air emissions. Therefore the pollution produced during the use of
the vehicle is a result of the electricity source. Coal fire or petroleum based energy source ! 16

produces large quantities of carbon dioxide, sulfur oxides, nitrogen oxides and particulate matter.
However, using electricity from a renewable energy source such as hydropower will greatly
reduce the GHGs produced and in turn reduce the environmental costs of the use of the vehicle
(McCleese and LaPuma, 2002). It can be noted that the use of the battery does not directly affect
the environmental cost of the vehicle’s use and will not produce air emissions.
In the use phase, the Nissan Leaf requires little maintenance with checkups, approximately every
six months to one year. The moving parts and fluids that regularly comprise the engine of an
internal combustion engine vehicle are not present in an electric vehicle. Therefore, maintenance
costs such as oil change are at a minimum with respect to regular up keep (Mackintosh, personal
communication, 2012). The Chevrolet Volt on the other hand contains a generator that works
similar to an internal combustion engine vehicle’s engine, where fluids and regular maintenance
is necessary for the vehicle to perform adequately (Cook, personal communication, 2012). The
maintenance aspect of the use phase does not necessarily affect the environmental cost of the
vehicle’s use, but it can affect the longevity of the vehicle’s lifespan.
3.1.5 The Disposal Phase of Electric Vehicles
The environmental costs of the disposal phase of the electric vehicle are related to the
recyclability of the vehicle components. Aluminum commonly used in manufacturing vehicle
components can be derived from recycled aluminum. It can be noted that over 50% of aluminum
from the vehicles can be recycled and used for further purposes (McCleese and LaPuma, 2002).
The dealership representative from Campus Nissan, Greater Victoria, indicated that the Leaf’s
entire makeup can be recycled except for the paint and bumpers (Mackintosh, personal
communication, 2012). Additionally, the dealership representative from Wheaton Chevrolet,
Greater Victoria, noted that a good portion of the vehicle can be recycled, but components like
the generator are much difficult to recycle due to the fluids used within (Cook, personal
communication, 2012).
! 17

Table 1: Potential recyclable components found on the Nissan Leaf and the Chevrolet Volt determined through personal communication with Campus Nissan dealership representative, Wheaton Chevrolet dealership representative and literature review (Mackintosh, personal communication, 2012; Cook, personal communication, 2012; McCleese and LaPuma, 2002).
Recycling of vehicle components benefits the environmental cost, since it is less energy
intensive as mentioned earlier, but it can also reduce the amount of waste emitted into the
environment. When comparing electric vehicles on the market to internal combustion engine
vehicles, the disposal phase indicates that electric vehicles can be environmentally beneficial due
to the component recyclability, while in contrasts, the majority of internal combustion engine
vehicles will end up in a junk yard, producing excess waste and adding to the environmental
costs (Ma et al, 2012).
3.2 Payback Period
3.2.1 Economic Payback Period
The information on initial purchases, rebates, and final prices of the vehicles is obtained from the
Fuel Economy Guide of 2011 and dealership representatives. This data is used to compare the
different prices of electric vehicles, internal combustion vehicles, and a hybrid vehicle.
Table 2: The prices, rebates and final prices of the Chevrolet Volt, Nissan Leaf, Chevrolet Malibu, Chevrolet Cruze, and Toyota Prius retrieved from dealership representatives (Mackintosh, personal communication, 2012; Cook, personal communication, 2012; Kennedy, personal communication, 2012).
Vehicle Recyclable Non Recyclable
Nissan Leaf Everything but… Paint Bumpers
Chevrolet Volt Some ability to recycle Aluminum (70-90%)
Generator Gas Powered Components
Price Factors Chevrolet
Volt
Nissan Leaf Chevrolet
Malibu
Chevrolet
Cruze
Toyota Prius
Price $43,800 $43,000 $25,000 $17,000 $25,000
Rebate $5,000 $5,000 None None None
Final Price $38,800 $38,000 $25,000 $17,000 $25,000
! 18

Values in Table 1 were obtained from three vehicle dealership representatives in Greater Victoria;
Paul Cook of Wheaton Chevrolet, Andrew Mackintosh of Campus Nissan, and Terry Kennedy of
Metro Lexus Toyota. The prices are the lowest estimated values from a range of prices of the
vehicles including different packages and features. The values include all estimated taxes and
fees.
Information on factors affecting the operational costs of the vehicles is used to compare the costs
of owning an electric vehicle to internal combustion vehicle and a hybrid vehicle.
Table 3: The annual fueling price and estimated maintenance costs of the Chevrolet Volt, Nissan Leaf, Chevrolet Malibu, Chevrolet Cruze, and Toyota Prius retrieved from the Fuel Economy Guide of 2011 and dealership representatives (US Department of Energy, 2011; Mackintosh, personal communication, 2012; Cook, personal communication, 2012; Kennedy, personal communication, 2012).
The annual fueling prices (Table 2) are based on driving 24 140.16 kilometers (15,000 miles) and
paying an average gas price of $0.94 per litre and $1.56 per night of charging from dead (US
Department of Energy, 2011; Cook, personal communication). The maintenance costs were
obtained from dealership representatives (Mackintosh, personal communication, 2012; Cook,
personal communication, 2012; Kennedy, personal communication, 2012) and indicate the
amount of money a consumer would spend on regular maintenance (oil changes, brakes checks,
etc.). These factors indicate which vehicles will cost less over their life cycle.
Operational
Factors
Chevrolet Volt Nissan Leaf Chevrolet
Malibu
Chevrolet
Cruze
Toyota
Prius
Annual Fueling
Price (Gas)
$1,543 - $2,062 $1,912 $1,071
Annual Fueling
Price
(Electricity)
$535
(Representative)
Or $569.40
(from ‘dead’)
Or $561
(Representative)
Or $569.40
(from ‘dead’)
- - -
Maintenance
Costs
$60 per year $80 per year $900 per
year
$900 per
year
$60 per
year
! 19

The ideal prices, annual consumption and maintenance were used to determine the economic
payback period of electric vehicles and compare them to internal combustion vehicles and a
hybrid vehicle.
Table 4: The economic payback period of the Chevrolet Volt and the Nissan Leaf compared to the Chevrolet Malibu, Chevrolet Cruze, and Toyota Prius.
The economic payback period was calculated by subtracting the estimated final cost of one
vehicle from another, subtracting the estimated annual fueling cost and the maintenance fees of
one vehicle from the other, making the two values equal to each other and solving for the
variable (Appendix C). The savings from the purchase of the electric vehicles, per year after the
payback period, were calculated to indicate the economic return of purchasing an electric vehicle
as opposed to purchasing an internal combustion or hybrid vehicle.
Table 5: Calculated savings of the Chevrolet Volt and the Nissan Leaf compared to the Chevrolet Malibu, Chevrolet Cruze, and Toyota Prius per year after the payback period is complete.
The savings were calculated by subtracting the sum of the annual fueling price and maintenance
costs of one vehicle from another (Appendix C). The results (Table 4) indicates that large internal
combustion vehicle cost consumers the most (when compared to smaller internal combustion or
hybrid vehicles) and that owning an electric vehicle after the payback period is complete is
economically beneficial.
Compared Vehicle Chevrolet Volt Nissan Leaf
Chevrolet Malibu 5.9 yrs 5.6 yrs
Chevrolet Cruze 10.0 yrs 9.7 yrs
Toyota Prius 10.3 yrs 9.8 yrs
Compared Vehicle Chevrolet Volt Nissan Leaf
Chevrolet Malibu $2,332.60 $2,312.60
Chevrolet Cruze $2,182.60 $2,162.60
Toyota Prius $501.60 $481.60
! 20

3.2.2 Other Costs and Benefits
Costs of purchasing an electric vehicle other than economic ones include time costs, total
distance the vehicle can travel, and concerns with adopting new technology. Benefits can include
reducing GHG emissions and the self-satisfaction consumers’ gain when becoming an early
adopter.
Table 6: The total distance on a full tank of gasoline or on a full charge, estimated fueling time, emissions per litre of gasoline consumed, and emissions per kilowatt hour of electricity consumed of the Chevrolet Volt, Nissan Leaf, Chevrolet Malibu, Chevrolet Cruze, and Toyota Prius (Mackintosh, personal communication, 2012; Cook, personal communication, 2012; Kennedy, personal communication, 2012; Lorimer, Heron, & Barrett, 2011, Nissan Canada, 2012).
Costs of the electrical vehicles include the amount of time dedicated to fueling the vehicle, as it
takes much longer than stopping at a gas station, and the limited driving range. Although fueling
time is believed to be a cost of the electric vehicle, some early adopters stated it was a benefit to
plug in the vehicle and leave it rather than waiting at a gasoline station (Larry Danby, personal
communication, 2012).
Operational
Factors
Chevrolet Volt Nissan Leaf Chevrolet
Malibu
Chevrolet
Cruze
Toyota
Prius
Total Distance
on a full tank/
charge
40 km (no gas)
400 km (with
gas)
30-50 km 600 km 800-1000
km
750-1184
km
Fueling Time 16-18hrs (lvl 1)
7hrs (lvl 2)
26mins (lvl 3)
16-18hrs (lvl 1)
7hrs (lvl 2)
26mins (lvl 3)
5-10mins 5-10mins 5-10mins
Emissions per
Litre Gas
(tCO
0.00223 - 0.00223 0.00223 0.00223
Emissions per
kWh Electricity
(tCO
0.000025 0.000025 - - 0.000025
! 21
Some early adopters stated that the distance on a full charge was not deterrent to owning an
electric vehicle and they were able to make daily commutes without difficulties (Dandy, personal
communication, 2012; Rathwell, personal communication, 2012). The results showing the total
carbon dioxide equivalency emissions (CO2, N2O, and CH4) indicate that vehicles using gasoline
as a fuel source emit more GHG per liter of gas burned than for each kWh of electricity used.
This is dependent on source of electricity; the source for Greater Victoria is hydro power. These
emission values are environmental operational benefits of the electric vehicles.
Another benefit of electric vehicles expressed by dealership representatives in Greater Victoria is
the life expectancy. It is believed that the life expectancy of electric vehicles is longer than that
of internal combustion and hybrid vehicles. The reasoning for this is the same as for the
difference in maintenance costs; electric vehicles contain less “moving components” and
required fluids within the interior (Mackintosh, personal communication, 2012). Early adopters
also expressed their perceived benefits and costs of owning electric vehicles. Many of these
perceptions included the benefits mentioned by dealership representatives and self-satisfaction
for being n early adopter of an environmentally friendly movement.
! 22

Table 7: The perceptions of owning electric vehicles as compared to internal combustion vehicles (Danby, personal communication, 2012; Grove, personal communication, 2012; Town, personal communication, 2012; Rathwell, personal communication, 2012).
The perceptions of the electric vehicle early adopters included all benefits associated with
owning an electric vehicle. Possible costs (such as concerns with new technology) were not
stated.
3.3 Infrastructure Requirements
As more consumers in Greater Victoria begin to adopt electric vehicles, the electrical
infrastructure will need to accommodate the growth in power consumption. Available
information on electrical power supply for Greater Victoria was compared with estimated power
requirements for electric vehicles. Electric vehicle charging station infrastructure is somewhat
limited in Greater Victoria but is growing. In order to predict future infrastructure requirements it
is important to consider the rate of adoption consumers will take with electric vehicles. It has
been recognized that consumers are very concerned about driving range, frequency of charging
stations, and time required for charge when considering the adoption of electric vehicles (Giffi et
al., 2011). Charging stations in Greater Victoria can be found at local Thrifty’s, City of Greater
Victoria Parkades, Canadian Tires, the Fairmont Empress Hotel, the Royal Bay Bakery, the
Westshore Recreation Center in Colwood, and Park and Ride locations in Colwood. In 2012,
approximately 2% of vehicles on BC’s roads are electric vehicles of some type (Tsang, 2012).
Early Adopter Perceptions
Danby Enjoys not having to pay bills (maintenance costs and annual fueling
prices)
Grove Passionate about the energy of the future and enjoys being the solution.
Enjoys driving a “giant flashlight”
Town Enjoys the idea about regenerative fuel
Rathwell Enjoys being the solution; “one electric vehicle take two internal
combustion vehicles off the road”
! 23

3.3.1 Electrical Power Supply
Power consumption in BC is approximately 90% hydroelectric and 10% imported from other
provinces in Canada and the U.S.A. (Ross, 2011). BC Hydro is currently retrofitting the power
system with modern Smart Grid technology. The largest issue to date is inefficient use of energy
by consumers (Tsang, 2012) and this is being addressed through the installation of the smart grid.
3.3.1.1 Affects of Electric Vehicles on Electrical Load
Alec Tsang, Chief Technology Strategist at BC Hydro, discussed the current power load situation
and how electric vehicles may affect current and future power supply in BC. Electric vehicle
power consumption currently comprises 0.5% of the power load in relation to all other
consumption (Tsang, 2012). If all vehicles on the road in BC were to switch over to electric
vehicles, the estimated marginal load increase would be 18-19%, relative to current consumption
(Tsang, 2012). The load growth for electric vehicles has been gradual and large spikes in use are
not forecasted for the near future (Tsang, 2012).
!
Figure 10 Here it is graphically shown the percentage of 2000 consumers that are considering the purchase of electric vehicles (EV), their outlook and the amount of consumers who actually own electric vehicles (Giffi et al., 2010).
The barriers to adoption that consumers are facing include: familiarity, brand, range, charging,
infrastructure, and price and cost of ownership. Customers are unfamiliar with alternative fuel
technologies other than hybrid vehicles, which have been advertised for the last 10 years at an
approximate cost of $1 billion to the respective manufacturers that produce hybrids. Educational
! 24

messages to consumers need to address incorrect preconceptions on electric vehicle issues like
charging, range, repair costs and the driving experience. This campaign may have a higher cost
than hybrids since it will require a more radical transition from internal combustion vehicles than
hybrids.
Certain vehicle characteristics like the brand of electric vehicle, is expected to impact customer
acceptance. Toyota, Honda and Ford have built “electric vehicle equity” with consumers in that
they have large “green campaigns” with their hybrid vehicles. Nissan and Chevrolet are
expected to face challenges and higher costs to educate loyal consumers. The range of most
electric vehicles on the market is around 100 km on a single charge and it is estimated that 88%
of drivers travel less than 100 km each day. However, most consumers reported that they expect
a vehicle to have a range of 300 km, which is equivalent to the range of many internal
combustion vehicles. Charging time is another issue and only 17% of polled consumers were
willing to spend eight hours to charge a vehicle while 34% were willing to wait four hours. 54%
of surveyed consumers would not consider purchasing an electric vehicle until charging stations
are widely available and as easy-to-locate as a gas station is today (Giffi et al., 2010).
! 25

!
Figure 11 Typical driving distances per day for respondent Canadian consumers and the range anxiety they have when purchasing or operating an electric vehicle as their primary source of transportation (Giffi et al., 2011).
Approximately 66% of respondents were unwilling to pay more for an electric vehicle and listed
convenience to charge, range, and cost to charge as extremely or very important electric vehicle
considerations. Consumers perceive electric vehicles as better for the environment but also see
internal combustion vehicles as better in terms of range, maintenance costs, convenience, and
purchase price. As the price of gasoline increases customers are more likely to consider electric
vehicles. However, as internal combustion vehicle fuel efficiency increases they are less likely
to consider electric vehicles (Giffi et al., 2011).
! 26

!
Figure 12 Consumer willingness to pay is dependent upon internal combustion vehicle technology and the price of gasoline (Giffi et al., 2011).
Power supply interruption may arise due to bottlenecks at distribution transformers, which would
be localized issues that are not associated with marginal load increase (Tsang, 2012). Marginal
load increase forecasts for varying electric vehicle market penetrations have shown that Level 1
(16A, 2kW) and Level 2 (30A, 8kW) charging stations have a minimal impact on marginal load
but Level 3 (125A, 50kW) charging stations would have a great impact (Ross, 2011). The Time-
of-Use (TOU) will also impact the stress applied to the power grid by electric vehicles. Charging
during peak consumption periods will create a much larger impact in electrical load compared to
negligible effects from off-peak charging (Ross, 2011). This is discussed further in section
3.3.1.3 Greenhouse Emissions.
3.3.1.2 Future Pricing Trends
Pricing trends are determined on 2-3 year rate cycles that are based on the Long-Term Rate
Forecast (LTRF) generated by BC Hydro for their Integrated Resource Plan (IRP). The LTRF is
an estimate of future energy rates that requires many assumptions and is therefore highly
uncertain (BC Hydro, 2011). Future revenue requirements can be difficult to establish and any
future rate increases are based on BC Hydro’s detailed assessment of its expected revenues and
costs at the time of filing, which take into account the operating conditions and plans forecast for
! 27

the relevant period. The assumptions required for the LTRF cover a wide range of variables that
include: external forecasts of interest rates, inflation rates, and exchange rates; timing and
magnitude of capital programs and projects; demand-side management expenditures and other
revenue requirements must consider unstable characteristics for the cost of energy, operating
costs, amortization rates, trade income, deferral account transfers and recoveries (BC Hydro,
2011).
Capacity contracts are normally a mix of a steady, inexpensive power source and a quick
responding power source to cover load fluctuations. Request for Proposals (RFP) are solicited
by BC Hydro for ancillary services. These are energy calls for private or out-of-province energy
providers to supply BC Hydro with secondary sources of energy. These services normally
include thermal sources, like coal-fired power, fast-reacting sources, like gas turbines, and green
providers like micro-hydroelectric or wind power. Coal-fired power provides a steady,
inexpensive source of power but responds slowly to load fluctuations. Gas turbine and pumped-
storage hydroelectric power respond quickly to load fluctuation but carry a higher cost (Tsang,
2012).
3.3.1.3 Greenhouse Gas Emissions
Greater Victoria residents have the opportunity to utilize clean, renewable, hydroelectric energy
when charging their electric vehicles. Since the supplied power is dependent on the TOU, or
more accurately the time when the consumer charges their vehicle, the GHG emissions created
during each charging cycle will fluctuate (Ross, 2011). Charging during peak hours (7AM –
12AM), (Tsang, 2012), would be supplied from hydroelectric dams, which produces very few
GHGs in comparison to thermal power plants (Dodd, 2012a), in BC. Charging during this time
does have drawbacks because it will increase total load during heavy-use periods and cost the
consumer more. The higher cost is due to reduced availability of power and increased strain on
the power grid system (Dodd, 2012a).
Charging during off-peak hours (12AM – 7AM), (Tsang, 2012), would be supplied from thermal
plants in the U.S.A. or other Canadian provinces (Dodd, 2012a). However, the thermal plants
normally run 24 hours per day, which causes them to produce a surplus of energy that is never
consumed (Dodd, 2012a). Purchasing surplus energy during off-peak hours is less expensive,
! 28
has negligible impact on the power grid and consumes energy that would have otherwise been
wasted.
3.3.1.4 Smart Grid Technologies & Infrastructure
Smart Grid Technology provides a modern, automated, intelligent power delivery system that
supports additional services and benefits to customers, the environment, and the economy. Smart
Grid Technology would provide real-time control and knowledge of the electrical distribution
system and allow: monitoring the electrical system to allow for better system efficiency;
communication between the end user and the grid; and allow utilities to incentivize beneficial
end user behavior (Ross, 2011). The ENEL Telegstore Project in Italy is the largest advanced
meter program in the world with 27 million meters networked (NETL, 2007). A total investment
of 2.1 billion € in 2005 is now producing 500 million € in savings per year and delivering better
service at lower cost. The advanced metering and communications are important characteristics
that should be reviewed, acclimated based on individual grid characteristics, and implemented in
order to achieve efficient grid modernization (NETL, 2007).
Smart Meter Infrastructure (SMI) offers in-house display of a homes power consumption. SMI
could inform consumers of TOU hourly loading that displays the hourly production of GHGs.
The aim of this program is to provide transmission savings of 80% and user savings of 20% by
reducing inefficient production and consumption (Ross, 2011). Vehicle-to-grid is not an efficient
technology because there is no financial gain to recycle energy. Transporting the energy from the
vehicle to the power grid would result in an overall net energy loss and it is inefficient to
overload the system (Tsang, 2012).
3.3.2 Electrical Charging Stations
Electric charging systems are stations where an electric vehicle can be charged, using charged
battery banks. These can be installed in houses, public places such as malls, movie theatres,
commercial business areas, banks, municipality buildings, recreational centers and more. To this
point there are three different levels of charging, level 1, level 2, and level 3 that contain different
voltages (EcoTransportation, 2012).
! 29

Table 7 Different charging station levels that explains voltage, where the stations may be located and how long does each level take to charge the electric vehicle (EcoTransportaion, 2012).
(EcoTransportaion, 2012) (Nissan Canada, 2012)
Electric energy can charge through direct connection from a 110 to 120-volt outlet, typical home
outlet, or a standalone charging station. In both cases an extension power cord from an outlet in
the wall or station, is connected to the electric vehicle to charge the battery. This is referred to as
a conduction charger, energy being transferred. The stand-alone charging systems have monitors
incorporated to observe battery voltage, temperature and current. The charging system takes
Stations Voltage Normal Found
Charging from
Charging Time
Level 1 110 - 120 Homes 120 voltage with 15 amp current = 10
hours to charge 15,000 watt battery = 20
hours or more to charge a (direct
connection)
At 120V and 15amps the leaf will take 16-18 hours from a depleted batter
Level 2 220-280 Homes, areas of
greater parking
facilities such as
grocery stores, malls,
restaurants, and
recreational buildings
240 voltage with 30 amp current = ~4-6
hours depending on provided current)
(direct connection)
AT 220V and 40amps the leaf will take approximately 7 hours from a depleted batter
Level 3 440 located in areas of
commercial and gas
stations
At 50-60 amps the leaf will take 26 minutes
to charge to 80% from a depleted batter
! 30

these variables into account, which helps minimize time spent inputting electricity. Additionally,
this information helps expand battery life of the vehicle (EcoTransportation, 2012).
! !
Figure 13: Level 1 (left) portable charging station (Stevens, 2011) and level 2 (right) home installed charging
stations (Nissan Canada, 2012).
Furthermore, induction chargers include energy (high voltage and current) from the energy
power grid that is being transferred directly to electro-magnet inductive paddles, which performs
as half a transformer. The other half of the transformer is within the electric vehicle. These two
magnet half’s need to be in complete contact with each other in order for current to be passed
from the outlet to the battery of the car. Charging at the highest current available increases
efficiency. High current is capped however, programed to not overheat the vehicles battery
(EcoTransportation, 2012).
! 31

�
Figure 14 An electric charging station installed at the Fairmont Empress Hotel (CBC British Columbia, 2011)
Additionally, electric vehicles plugged into the grid will use the smart grid to excess power that
is idling, which also increases efficiency. Moreover, when the electric vehicle is plugged into an
outlet not charging and there is an increase in voltage in the grid, the vehicle charger will sense
this and automatically turn on to power the vehicle. An example of this would be increased
power in the grid during nighttime when activities for electricity are low (EcoTransportation,
2012). Nissan recommends programming your car for specific charging hours to gain the max
amount of power for the least amount of money (Nissan Canada, 2012).
Electric energy in Canada is extremely cheap. The current national average for Canada,
according to Nissan Canada website, stands to be approximately $0.0938/kWh. At this rate,
charging an electric vehicle from 0% battery life to 100% battery life would only cost roughly
$2.25 (Nissan Canada, 2012). Since May 30, 2012, the Fraser Basin Council is offering
provincial Community Charging Infrastructure fund is offering $2.74 million to supplement the
installation of up to 570 new electric vehicle charging stations in cities throughout the province
(FBC, 2012). There are 24 stations on Vancouver Island, nineteen Level 1 (120 volt) stations and
six Level 2 (240 volt) stations in Greater Victoria. The charging locations in Victoria, BC are
displayed in Figure 13. Groups like Sun Country Highway are working to increase EV charging
! 32

station coverage throughout North America to encourage the adoption of EVs. By July 5, 2012
they had installed 18 Level 2 charging stations in 12 communities throughout Vancouver Island
(Wilson, 2012).
!
Figure 15 Map of electric vehicle charging stations around Victoria, BC. There are 24 total stations: nineteen Level 1 stations and 6 Level 2 stations Retrieved from http://www.plugshare.com/.
3.3.3 Early Adopters
Four Greater Victoria individuals who did purchase and frequently utilize private electric
vehicles did not report issues with the charging infrastructure of Greater Victoria. Most reported
that they only use their vehicles for short distance travel around town and do use other vehicles
for longer transport. The discussions with early adopters can be found in Appendix A 8.0.
4.0 Discussion
! 33

Is there sufficient evidence to determine if the electric vehicle is a feasible solution to reduce
green house gas emissions when compared to other vehicles on the market?
4.1 Cradle to Grave Assessment
4.1.1 The Extraction Phase of Raw Materials
The ‘cradle to grave’ assessment demonstrates the environmental cost of the vehicle from
extraction of raw materials, to transportation, to production, to use and finally disposal of the
vehicle. Through extensive research of case studies and reports, it was determined that during
the extraction phase of raw materials, the production of GHG is emitted in high volumes and
waste is created through mining methods and machinery used during the extraction process. The
majority of the environmental costs can be associated to the mining of the material used to
construct the battery and this is due to the extraction of the metal ores and other rare metals
needed for a functioning battery (Dodd, 2012a).
4.1.2 The Transportation Phase of Materials to Production Facility
The transportation phase is inevitable in order to take the raw materials to the vehicle production
facility. The distance required for travel can dictate the amount of air emissions produced, where
a longer travel time will increase the environmental costs (Mackintosh, personal communication,
2012).
4.1.3 The Manufacturing Phase of the Electric Vehicle
The manufacturing phase is dependent on the source of energy used to supply the production
facility. Energy sources such as coal fire will lead to an increase to the overall environmental
costs, while renewable energy source such as hydro power will reduce the environmental cost
(McCleese and LaPuma, 2002). The manufacturing of the electric vehicle battery are conducted
by auxiliary companies and shipped to the production facility (Steinweg, 2011).
4.1.4 The Use Phase of Electric Vehicles
Similarly, the environmental costs during the use phase are dependent on the source of the
energy used to charge the vehicle. The electric vehicle is relatively clean burning and will
produce little to no emissions when running. However, if the electricity used to charge the
! 34

vehicle is derived from coal fire, GHG production is increased. In contrast, electricity from
renewable source can reduce the production of GHGs (McCleese and LaPuma, 2002).
4.1.5 The Disposal Phase of Electric Vehicles
The disposal phase is dependent on the recyclability of the vehicle components. The ability to
reuse materials from old components of discarded vehicles can reduce energy consumption and
in turn reduce the environmental costs (McCleese and LaPuma, 2002).
Since the electric vehicles of interests (Nissan Leaf and Chevrolet Volt) have only been on the
market for approximately two years, a full ‘cradle to grave’ assessment cannot be accurately
conducted. The life cycle assessment of the Nissan Leaf and Chevrolet Volt are similar except
during the use phase and disposal phase. The gas generator of the Volt can add additional
environmental costs during its use and can make the vehicle difficult to recycle.
4.2 Payback Period 4.2.1 Economic Payback Period
The initial price, rebate savings, and overall price paid in British Columbia for the cars studied,
Table 1, shows the savings between the different types of vehicles during initial purchase. When
applied to all vehicles on the market the results indicate that the initial purchases, including
rebates, of electric vehicles are the most expensive, followed by hybrid vehicles and then internal
combustion vehicles. This indicates that electric vehicles are expensive when compared to other
vehicles on the market using alternative energy sources.
The operational costs of the vehicles, Table 2, greatly add to the feasibility of owning an electric
vehicle. The annual fueling price for the electric vehicles is lower due to the alternative fuel
source (hydro electricity) costing much less than gasoline. The price from ‘dead’ was calculated
to indicate the price of charging the vehicle from zero charge every night of the year, Appendix
C. The maintenance costs of an electric vehicle is less due to fewer moving components within
the interior and less fluids required for operation (Mackintosh, personal communication, 2012).
The economic payback periods, Table 3, show the amount of time before an electric vehicle
consumer makes a return on their investment. Factors affecting this are the operational costs. The
calculation for the economic period included the operational costs; annual fueling price and
maintenance fees. These factors affect the economic payback period of the electric vehicle
! 35

compared to the internal combustion and hybrid vehicles as they may decrease the time an
electric car owner will see a return on their investment. The results, Table 3, show that it takes
less time before seeing a return if compared to larger vehicles which burn more gasoline when
driven.
Although only two operational costs were factored into this equation, more affect the time before
a return is seen. These values would also depend on how the vehicle is driven, the actually
gasoline fueling price at the time, the source of electricity for the electric vehicles, the type of
regular maintenance preformed, an increase or decrease in fueling prices, and an change in
knowledge, technology or manufacturing processes of the vehicles (Mackintosh, personal
communication, 2012; Cook, personal communication, 2012).
It is expected that there will be an increase in gasoline prices and that the technology and
manufacturing processes of electric vehicles will increase (Trading Economics, 2012;
Mackintosh, personal communication, 2012). These two factors are expected to decrease the
payback period of the electric vehicle when compared to internal combustion and hybrid
vehicles.
The return on an electric vehicle investment, Table 4, is also expected to increase if gasoline
prices are to increase as believed. Presently, there is a greater return per year on the purchase of
an electric vehicle when compared to larger vehicles requiring a larger amount of gasoline than
smaller vehicles or hybrid vehicles, Table 4. The calculated return on the electric vehicle
investment is large when the life expectancy is taken into account (Section 4.2.2.).
4.2.2 Other Costs and Benefits
Other costs and benefits of purchasing an electric vehicle, other than economic ones, exist as
perceived by owners, Table 5. Certain costs and benefits, including time, total distance the
vehicle can travel, concerns with adopting new technology, reducing GHG emissions and the
self-satisfaction consumers’ gain when becoming an early adopter, were analyzed.
The fueling time required could be seen as an added cost to owning an electric vehicle. This
criterion may be a deterrent for purchasing an electric vehicle as the owner may feel they are
losing time. The fueling time for electric vehicles was shown to be much longer (with each
! 36

charging level) than fueling an internal combustion or hybrid vehicle, Table 5. However, some
early adopters see it as a beneficial alternative using a gasoline pumping location; waiting in line,
odours. As adopters are able to plug their vehicles in during off-peak hours at home, they do not
have to wait for their vehicles to fuel-up (Larry Danby, personal communication, 2012).
The results for the distance travelled on a full tank of gasoline or charge show that internal
combustion, hybrid, and electric vehicles that can use gasoline can travel longer distances than
vehicles using electricity alone, Table 5. This is seen as a cost of the electric vehicle to potential
owners (Mackintosh, personal communication, 2012). This also if believed to be a cost to the
safety of the owner due to the increased risk of not being within an area with adequate electric
vehicle infrastructure. However, some early adopters stated that the range of the electric vehicle
did not deter their daily commutes (Dandy, personal communication, 2012; Rathwell, personal
communication, 2012).
The green house gas emissions from each of the vehicles indicate that internal combustion,
hybrid, and electric vehicles that can use gasoline emit more CO2, N2O, and CH4 than vehicles
using electricity alone, Table 5. However, this is dependent on source of electricity. Greater
Victoria’s source is hydropower, which is how the values were calculated. An assumption is used
where kWh from electricity consumed in infrastructure is the same as in electric vehicles. If
using hydro power and the assumption is maintained, the results show that it is a benefit to own
an electric vehicle as the consumer will emit less green house gases driving an electric vehicle
than ones using gasoline. As well, if carbon emissions were taxed in the future, there would be a
greater benefit to owning a vehicle that emits less.
The life expectancy of the electric vehicle is also believed to be greater than that of an internal
combustion vehicle or a hybrid vehicle, for the same reason; less “moving components” and
fluids (Mackintosh, personal communication, 2012). With a longer life and less expenses after
initial purchase, the electric vehicle could potentially be a feasible alternative to gasoline
vehicles because consumers could see a greater return on their investment after the payback
period is complete, Table 4.
The perceived benefits and costs expressed by early adopters (Table 6) included benefits gained
by owning an electric vehicle. Costs were not expressed. As well, some early adopters have
! 37

gained self-satisfaction by being a role model for an alternative fuel source movement because
this is their “passion” (Grove, personal communication, 2012). This is considered a benefit.
4.3 Infrastructure Requirements
4.3.1 Electrical Power Supply
Electrical power supply to Greater Victoria is not currently in jeopardy of overloading due to the
charging of electric vehicles. All electric vehicles on the road in BC currently constitute
approximately 0.5% of the base electrical load and make up only 2% of the vehicles operated in
BC (Tsang, 2012). However, mass adoption of electric vehicles by consumers would have a
considerable impact on power distribution if it were to occur.
Petroleum is a finite resource and it is highly likely that electric vehicles will become a primary
source of travel for many individuals since they are powered by a variety of energy sources.
However, the timeframe of this switch is difficult to predict. A comparison of internal
combustion vehicles and electric vehicles shows that consumers perceive internal combustion
vehicles as being more affordable, reliable and available (Giffi et al., 2010). Education
campaigns from electric vehicle manufacturers and early adopters would help clear false
preconceptions that consumers may have regarding charging, range, repair costs and the driving
experience.
Although consumers are concerned about the lack of infrastructure for electric vehicles, 88%
have reported that they drive less than 100 km each day, which is below the maximum battery
capacity of most electric vehicles on the market. The time of charge is also an inconvenience to
many consumers and only 34% reported they were willing to wait 4 hours to charge their
vehicles battery (Giffi et al., 2010). Consumers do perceive electric vehicles as being better for
the environment but the difference in initial investment, convenience of fuel and reliability of
internal combustion vehicles is too large a barrier for many consumers to overcome (Giffi et al.,
2010).
The price of power in Greater Victoria will be dictated by many variables and is currently being
predicted to increase over the next 10 years (BC Hydro, 2010). However, the cost of electrical
! 38

energy should remain to be a small fraction of the cost for gasoline and offers the option of
variable power sources from a single outlet.
GHG emissions resulting from the charging of an electric vehicle are completely dependent on
the TOU (Ross, 2011). Charging during peak hours would result in fewer GHGs produced but it
imposes more stress on the power grid at a higher cost to BC Hydro. Charging during off-peak
hours would consume GHGs that are being produced by 24-hour thermal plant operations and
impose negligible stress on the power grid. In the future, BC Hydro may incentivize off-peak
charging of electric vehicles by reducing the price of power relative to peak hour charging.
BC Hydro’s Smart Metering Program will help reduce inefficient power usage, aid in the
education of consumers about their consumption and will allow BC Hydro to incentivize off-
peak charging of electric vehicles while allowing for a more flexible power distribution system
that is much safer and faster at identifying issues (BC Hydro, 2010). The use of a 27 million
smart meters in Italy has shown that a modern grid is capable of providing huge savings for
producers and consumers.
4.3.2 Electrical Charging Systems
There are currently 24 commercially available electric vehicle charging stations in the Greater
Victoria area and some consumers may not have access to charging stations from their homes.
Support from the Community Charging Infrastructure fund will help EV groups and BC
communities’ jumpstart their electric vehicle infrastructure. Increases in charging station
infrastructure and continued support from electric vehicle groups and the provincial government
will likely persuade consumers to consider an electric vehicle for their next purchase.
Future trends will likely be dictated by the cost differences between electric vehicles and internal
combustion vehicles, infrastructure development and technological advances in efficiency and
range of electric vehicles and internal combustion vehicles. Realizing that adoption will take
time as consumers become more familiar with electric vehicles means that infrastructure
development is a crucial step to informing consumers that electric vehicles can be a convenient
form of travel. The installation of more charging stations in the Greater Victoria region will help
increase the acceptance of electric vehicles while having minimal/negligible impact to the power
! 39

grid and distribution. BC Hydro is aware of increasing electric vehicle adoption is taking the
proper steps to upgrade grid technology and educate consumers on how to manage their
consumption.
4.3.3 Early Adopters
Early adopters in Greater Victoria are working together to inform other drivers of the benefits an
electric vehicle can provide. The four early adopters we consulted were content with the
charging station infrastructure in Greater Victoria.
Researching peer-reviewed articles and case studies helped provide insight to the feasibility of
electric vehicles in Greater Victoria. Our methodology is limited by the lack of quantitative
information for the life cycle, payback period and charging station infrastructure for electric
vehicles. The amount of energy and emissions required to manufacture an electric vehicle are
highly dependent on the manufacturer and their production pathways. We are confident that our
results are accurate but more research should be done to confirm our findings.
5.0 Conclusion/Recommendations
Upon consideration of the life cycle assessment of the electric vehicles, it can be concluded that
the source of energy required in the manufacturing, as well as used to charge a vehicle, can affect
the overall environmental cost. A renewable energy source that provides electricity can reduce
GHG emissions and in turn reduce the environmental impacts. When considering the electric
vehicles of interest, the Nissan Leaf and the Chevrolet Volt, both can be considered as potential
vehicles that can reduce GHGs when under the right circumstances. In order to obtain a clear
picture of the ‘cradle to grave’ assessment of the Leaf and Volt, it is recommended that further
research be conducted when information becomes available.
The results indicate which vehicle type will cost less over its life cycle and the other costs and
benefits of each. It was found that, over its life cycle, the electric vehicle costs less. It is also
found that there are other benefits, including not waiting at gasoline stations, emitting less GHG,
increased life expectancy and the gained feeling of self-satisfaction, to owning an electric
vehicle. These results indicate that the electric vehicle is feasible for consumers purchasing a
vehicle in Greater Victoria, depending on their ability to afford the initial cost of the electric ! 40
vehicle. Recommendations to further the data would be to find out the costs that are deterring
individuals from purchasing the electric vehicles. Methods for this include consulting non
electric vehicle consumers which are not passionate about the change they wish to see in the
vehicle market.
The conversion of internal combustion vehicles to electric vehicles improves the sustainability of
existing resources and thereby avoids the consumption of limited resources for production of
new electric vehicles. Further research should be done regarding the conversion of internal
combustion vehicles to electric vehicles. The infrastructure requirements for Greater Victoria are
currently meeting the demands of early adopters but will need significant upgrades in order to
persuade more consumers that electric vehicles are reliable. BC Hydro’s upgrade to a modern
grid is progressing and aims to reduce inefficient consumption and distribution. It will help
educate consumers about their energy consumption and prepare the grid for a greater level of
electric vehicle adoption by consumers. However, consumer adoption of electric vehicles will
likely be a slow process as infrastructure is upgraded and the technology of electric vehicles
improves to provide equivalent investment costs and range of travel as internal combustion
vehicles.
! 41

References
About.com Inventors. (2012a). The History of the Automobile. Available from http://
inventors.about.com/library/weekly/aacarsgasa.htm#ic [cited 29 April 212]
About.com Inventors. (2012b). The History of Engines-How Engines Work. Available from
http://inventors.about.com/library/inventors/blinternalcombustion.htm [cited 29 April 212]
Baptista, I., Camus, C., Silva, C., Farias, T. 2009. Impact of the Introduction of Electric Based
Vehicles in Sao Miguel Island. Massachusetts Institute of Technology. Cambridge,
Massachusetts.
BC Hydro. (2010, December 14). 2011 Integrated Resource Plan Technical Advisory Committee
Summary Brief: Long-Term Rate Forecast. Retrieved May 15, 2012 from
www.bchydro.com
Bossche, P., Mierlo, J., Maggetto, G. The Brussels Capital Region: A Case Study for Electric
Vehicle Infrastructure Deployment. Retrieved January 2012. URL: etecmc10.vub.ac.be/
etecphp/publications/EVS18infravdb.pdf
CBC British Columbia. (2011, October Tuesday). Empress car-charger, missing women,
wheelchair basketball, nearly Nobel and open data. Retrieved July 10, 2012 from http://
www.cbc.ca/ontheisland/2011/10/11/empress-car-charger-missing-women-wheelchair-
basketball-nearly-nobel-and-open-data/
Chevrolet General Motors. (2012). Chevrolet Volt. Retrieved May 22, 2012 from http://
www.chevrolet.com/volt-electric-car/
Cook, P. (2012). Personal Comminication. Victoria.
Delucchi, M. Lipman, T. November 1st, 2001. An Analysis of the Retail and Lifecycle Cost of
Battery-Powered Electric Vehicles. Available http://www.spinnovation.com/sn/
Articles_on_V2G/An_analysis_of_the_retail_and_lifecycle_co st_of_battery-
powered_electric_vehicles.pdf [cited 2 May 2012]
! 42

Dodd, M. (2012a). Petroleum and Petrochemicals lecture notes.
Dodd, M. (2012b). Metals and Their Ores lecture notes.
EcoTransportation. (2012). EV Charger. Retrieved April 10, 2012, from Charging the Electric
Revolution: http://www.evcharger.com/
Fraser Basin Council. 2012. Community Charging Infrastructure. Retrieved from: http://
www.fraserbasin.bc.ca/programs/community_charging_infrastructure.html
Giffi, C., Gardner, M., Hill, R., Hasegawa, M. 2010. Gaining Traction: A customer view of
electric vehicle mass adoption in the U.S. automotive market. Deloitte Development
LLC. Retrieved from: http://www.deloitte.com
Giffi, Hasegawa, Ranich, Drew, Vitale. February 10, 2011. Deloitte Research Working Paper:
Canada EV Findings. Deloitte Development LLC. Retrieved from: http://
www.deloitte.com
Kennedy, T. (2012). Personal Comminication. Victoria.
Kilkenny, N. (2009). Who Killed the Electric Car? Retrieved May 8, 2012, from http://
www.reformation.org/who-killed-electric-car.html
Kromer, S. Kriepe, E. Reichenbach, D. Stark, R. (February 24, 1999). Life Cycle Assessment of
a Car Tire. Continental AG. Retrieved from: http://www.conti-online.com/generator/www/
com/en/continental/csr/themes/ecology/download/oekobilanz_en.pdf
Lorimer, M., Heron, G., & Barrett, S. (2011). Sidney Climate Action Toolkit. Victoria: Town of
Sidney.
Ma, H. Balthasar, F. Tait, N. Riera-Palou, X. Harrison, A. (2012). A New Comparison Between
the Life Cycle Greenhouse Gas Emissions of Battery Electric Vehicles and Internal
Combustion Vehicles. Energy Policy, (44): 160-173
Mackintosh, A. (2012). Personal Comminication. Victoria.
! 43

McCleese, D.L. LaPuma, P.T. (February, 5 2002). Using Monte Carlo Simulation in Life Cycle
Assessment for the Electric and Internal Combustion Vehicles. Available from http://
www.springerlink.com/content/p411424q30102n32/ [cited 29 April 2012]
National Energy Technology Laboratory. August 2007. Modern Grid Benefits. US Department of
Energy, Office of Electricity Delivery and Energy Reliability. Retrived from: http://
www.netl.doe.gov/smartgrid/
Nemry, F., Leduc, G., Munoz, A. 2009. Plug-in Hybrid and Batter-Electric Vehicles: State of the
reserach and development and comparative analysis of energy and cost efficiency. Institute
for Prospective Technological Studies, Joint Research Centre, European Commission.
Seville, Spain.
Nissan Canada. (2012). Nissan Canada Offical Site. Retrieved May 29, 2012 from Nissan LEAF
Electric Car: http://www.nissan.ca/vehicles/ms/leaf/en/faq.aspx#/faq
Petersen, J. (February 11, 2011). Electric Vehicles and the Natural Resource Cliff. Retrieved May
8, 2012 from http://www.altenergystocks.com/archives/2011/02/
electric_vehicles_and_the
_natural_resource_cliff_1.html
Solomon, S., Qin, D., Manning , M., Chen, Z., Marquis, M., Averyt, K. B., et al. (2007). IPCC
Fourth Assessment Report: Climate Change 2007: The Physical Science Basis.
Cambridge University Press, Cambridge, United Kingdom and New York, NY, USA.
Stevens, T. (2011, March 31). Leviton announces Evr-Green 120 portable EV charger, pledges
no unsightly shedding of leaves . Retrieved May 8, 2012 from http://www.engadget.com/
2011/03/31/leviton-announces-evr-green-120-portable-ev-charger-pledges-no/
Steinweg, T. (March 2011). The Electric Car Battery Sustainability in the Supply Chain.
Retrieved May 16, 2012 from http://somo.nl/publications-en/Publication_3642/
Romero, F. (2009, January 13). A BRIEF HISTORY OF The Electric Car. Retrieved May 1, 2012
from TIME Business: http://www.time.com/time/business/article/0,8599,1871282,00.html
! 44

Ross, D. (2011, September 26). Smart Grid Deployment in BC: A Case Study. Retrieved May 15,
2012 from http://www.emc-mec.ca/ev2011ve/en/program.html
Time Specials. (2007b). 1974 Vanguard-Sebring CitiCar. Retrieved May 8, 2012 from The
History of the Electric Car: http://www.time.com/time/specials/2007/article/
0,28804,1669723_1669725_1669738,00.html
Time Specials. (2007c). 1997 GM EV1. Retrieved May 8, 2012 from http://www.time.com/time/
specials/2007/article/0,28804,1669723_1669725_1669741,00.html
Time Specials. (2007d). 2001 Toyota RAV4 EV. Retrieved May 8, 2012 from http://
www.time.com/time/specials/2007/article/0,28804,1669723_1669725_1669743,00.html
Time Specials. (2007e). 2006 Tesla Roadster. Retrieved May 8, 2012 from http://www.time.com/
time/specials/2007/article/0,28804,1669723_1669725_1669747,00.html
Times Special. (2007a). 1903 Columbia Mark LX Electric Runabout. Retrieved May 8, 2012 from http://www.time.com/time/specials/2007/article/0,28804,1669723_1669725_1669729,00.html
Tsang, A. (2012, May 15). Notes from telephone interview.
US Department of Energy. (2011). Fuel Economy Guide. http://www.fueleconomy.gov/feg/
feg2011.pdf
Wilson, C. (2012, July 5). Island’s charging stations signal electric car’s arrival. Retrieved July
25, 2012 from http://www.timescolonist.com/business/Island+charging+stations+signal
+electric+arrival/6887136/story.html
! 45

Appendix A 1.0 Glossary of Terms
• Charging Station - An element of the infrastructure that supplies electrical energy for the
recharging electric vehicles. Charging stations can supply varying amounts of energy
that differ in charging time: Level 1 (110 volt), Level 2 (240 volt) and Level 3 (480 volt).
• ‘Cradle to Grave’ - The life cycle of a product, more specifically from creation to disposal. Electric Vehicle (EV) - A vehicle that uses electricity as its only source of power.
• Environmental Cost - The potential volume of CO2 and other air emissions produced as a result of the various phases of the life cycle assessment of electric vehicles.
• Feasible Solution - A solution that provides an overall reduction in GHG emissions and saves consumers money when considering the lifetime operation of a vehicle.
• Green House Gas (GHG) Emissions - The gaseous form of an element or compound that absorbs and emits radiation within the thermal infrared range. Primary GHG’s are water vapour, carbon dioxide, methane, nitrous oxide and ozone.
• Hybrid Electric Vehicles (HEV) - Uses two or more power sources to move a vehicle; internal combustion engine combined with an electric motor.
• Infrastructure - Includes the charging stations and electrical power source required to charge an electric vehicle.
• Internal combustion vehicle - A vehicle that contains an engine in which the combustion of a fossil fuel occurs with the oxidation of air in a combustion chamber.
• Payback Period - The length of time required for a consumer to see a return on their initial investment in an electric vehicle when compared to the purchase and operation of an internal combustion engine vehicle.
• Smart Grid Technology – modern, automated, intelligent power delivery system that supports additional services and benefits to customers, the environment, and the economy.
• Time-of-Use – the time of day and duration a customer will be powering their electric vehicle.
! 35

• Vehicle-to-grid - A battery powered vehicle that uses excess battery capacity to provide power to the electrical grid in response to peak load demands. The rechargeable battery can serve to absorb excess nighttime generation.
! 36

2.0 Research Questionnaire
2.1 Cradle to grave • Where are the electric vehicles constructed?
• Where does the initial manufacture of electric vehicle parts occur?
• What are the raw materials necessary for production of your products?
• Where do you purchase the raw materials for vehicle parts?
• What parts of an electric vehicle are classified as recyclable?
• How long does an electric vehicle battery last?
• Has there been a calculation of the GHG emissions for the manufacturing facility?
• Is there additional information of GHG emissions for operations of additional facilities?
2.2 Payback period • How much electric energy is required to power an electric vehicle in kilowatt per hour?
• How much electric energy is required to power a hybrid vehicle in kilowatt per hour?
• What GHG emissions are produced from the low emissions diesel and hybrid vehicles?
• How long will it take for consumers to expect a return on their investment?
• What are the initial costs of an electric vehicle in comparison to a similar size, and mileage of low emissions diesel vehicles?
• What is the estimated lifetime of an electric vehicle in comparison to a similar size, and mileage of low emissions diesel vehicles?
• What are the maintenance requirements for an electric vehicle in comparison to a similar size, and mileage of low emissions diesel vehicles?
• What are your current sales trends for each vehicle?
2.3 Infrastructure requirements
• How will the charging stations work for a home and for a public location?
• Will BC Hydro supply all the electricity or will we have to go elsewhere in order to supply the power? Alberta? US?
• How much electricity is BC Hydro providing to Greater Victoria at the moment?
! 37

• How much electricity can BC Hydro provide if electric vehicles production was increased?
! 38

3.0 RRU4 GreenBelt Telephone Script
RRU4GreenBelt TELEPHONE SCRIPT
Hello, our group is RRU4 GreenBelt (Kenzie, Marnie, Dan and Nitin) and we are conducting a research project, which is a requirement for a Bachelor’s of Environmental Degree Program at Royal Roads University. Our credentials with Royal Roads University can be established by telephoning our Faculty of School of Environment and Sustainability Advisor, Dr. Audrey Dallimore at 250-391-2580.
The objectives of our research project are to:
1. Research the available data and assess the ‘cradle to grave’ impact of an electric vehicle.2. Estimate the payback period for consumers that purchase electric vehicles.3. Assess the available information for infrastructure requirements to accommodate electric
vehicles in Greater Victoria.4. Present our research findings through a report and presentation to the sponsor and faculty of
Royal Roads University. Provide recommendations to further the studies on electric vehicles and how to disseminate information to the local community.
In addition to submitting our final report to Royal Roads University in partial fulfillment for a Bachelor in Environmental Science degree, we will also be sharing the research findings with our sponsor Nancy Wilkin, Director of the Office of Sustainability at Royal Roads University, and our Faculty of School of Environment and Sustainability Advisor, Dr. Audrey Dallimore. As a research project, the information will be used within subsequent studies in the following year.
The methodologies for objectives 1-4 are as follows:
Methodology for Objective 1:
a) Conduct an assessment of the information available on a ‘cradle to grave’ of an internal combustion engine vehicle.
b) Compare the available ‘cradle to grave’ information of an internal combustion engine vehicle with the ‘cradle to grave’ information of an electric vehicle.
Methodology for Objective 2:
a) Assess payback period of an electric vehicle through a comparison with internal combustion engine vehicle from initial purchase through operational cost.
Methodology for Object 3:
a) Assessing the electrical power supply of B.C. Hydro when compared to Alberta coal power.! 39

b) Assessing the different electrical charging systems available in order to determine how much energy would be needed for supplying the systems.
Methodology of Objective 4:
a) Compile research findings into a presentation suitable for the general public and formulate recommendations based on findings.
The generalized questions below are examples that could be foreseen within the interview:
• Where are the electric vehicles constructed?• Where does the initial manufacture of electric vehicle parts occur?
• What are the initial costs of an electric vehicle in comparison to a similar size, and mileage an internal combustion vehicle?
• How much electricity is BC Hydro providing to Greater Victoria at the moment?
Your name was chosen as a prospective participant because of your knowledge pertaining to the electric vehicle.
Information will be recorded in hand-written format. Where appropriate the information will be summarized, in anonymous format if requested, in the body of the final report. Any comments provided will be applied within the project unless the participant specifies anonymity beforehand. All documentation will be kept strictly confidential between the four team members, sponsor, and faculty advisor until the final presentation, report and ongoing research.
The data will be provided to Nancy Wilkin, where raw data may be provided to students continuing project in subsequent years. If an individual decides to withdraw from the voluntary questionnaire, the raw data obtained up until the point of withdrawal will be kept and used within the main body of the report. Any information given after this point will be destroyed and will not appear within the report, the presentation, nor be given to the sponsor or Royal Roads University.
A copy of the final report will be published and archived in the RRU Library.
You are not compelled to participate in this research project. If you choose not to participate, you are free to withdraw at any time without prejudice. Similarly, if you choose not to participate in this research project, this information will also be maintained in confidence.
Would you be interested in participating in our project? Yes ____ NO ____
Do you want this information to be anonymous, with only
the company name present in the report? Yes ____ NO ____
! 40

! 41

4.0 RRU4 GreenBelt Consent Form
RESEARCH CONSENT FORM
Our names are Marnie Lorimer, Kenzie Field, Nitin Monteiro and Daniel Hall, and this research project is part of the requirement for our Bachelor of Science Environmental Science degree at Royal Roads University. Our credentials with Royal Roads University can be established by telephoning Dr. Audrey Dallimore, a faculty member of the School of Environment and Sustainability at 250 391-2580 or by email at [email protected].
This document constitutes an agreement to participate in our research project, the objective of which to determine if the electric vehicle is a better environmental and economical choice than current internal combustion vehicles. Our sponsor for this project is Mrs. Nancy Wilkin, Director of Sustainability at Royal Roads University. We would like to invite you to be a participant in our research project; The New Electric Car – Energy Saver or Energy Guzzler?
The research questionnaire will consist of fact based questions that will pertain to the cost of an electric vehicle and internal combustion vehicles. The manufacturing process of each vehicle will be assessed in the questionnaire and this may take an approximate 20 minutes to 60 minutes to complete. The foreseen questions will refer to:
Research Questionnaire Objective 1 “cradle to grave” life cycle
• Where are the electric vehicles constructed? • Where does the initial manufacture of electric vehicle parts occur? • What are the raw materials necessary for production of your products? • Where do you purchase the raw materials for vehicle parts? • What parts of an electric vehicle are classified as recyclable? • How long does an electric vehicle battery last? • Has there been a calculation of the GHG emissions for the manufacturing facility? • Is there additional information of GHG emissions for operations of additional facilities?
Objective 2 “payback period” of the vehicles • How much electric energy is required to power an electric vehicle in kilowatt per hour? • How much electric energy is required to power a hybrid vehicle in kilowatt per hour? • What kind of GHG emissions are produced from the low emissions diesel and hybrid vehicles? • How long will it take for consumers to expect a return on their investment? • What are the initial costs of an electric vehicle in comparison to a similar size, and mileage of a
low emissions diesel vehicle? • What is the estimated lifetime of an electric vehicle in comparison to a similar size, and mileage
of a low emissions diesel vehicle? • What are the maintenance requirements for an electric vehicle in comparison to a similar size,
and mileage of a low emissions diesel vehicle? • What are your current sales trends for each vehicle?
! 42

Objective 3 “infrastructure requirements and impacts on electrical power consumption”
• How will the charging stations work for a home and for a public location? • Will BC Hydro supply all the electricity or will we have to go elsewhere in order to supply the
power? Alberta? US? • How much electricity is BC Hydro providing to Greater Victoria at the moment? • How much electricity can BC Hydro provide if electric vehicles production was increased?
In addition to submitting our final report to Royal Roads University in partial fulfillment for a Bachelor of Science Environmental Science degree, we will also be sharing our research findings with Nancy Wilkin. During the course of our research only Ms. Nancy Wilkin and Dr. Audrey Dallimore will have access to our raw data.
Information will be recorded in hand-written format and, where appropriate, summarized, in anonymous format unless permission is given to identify names and company, in the body of the final report. At no time will any specific comments be attributed to any individual unless specific agreement has been obtained beforehand. Participants who wish to maintain anonymity through the project will be labeled using randomly assigned letters. All documentation will be kept strictly confidential. The raw data retention period will be to the end of the month of the date of which our convocation falls within (approximately October 2012). The raw data will then be archived at Royal Roads University and copies of the report will be kept by each team member and participants involved. These copies of the report are officially theirs to archive. If at any time a participant chooses to withdraw from the research process, the information that they have provided after this point will be destroyed immediately. Information received before withdrawal will be used within our research project.
The research information gathered from research participants will be compiled into a report and within a presentation will be provided to the sponsor, Ms Nancy Wilkin and the Department of Sustainability at Royal Roads University. The compiled information may also be used by subsequent major project groups who may undertake further work involving this topic. There is no anticipated conflict of interest between RRU4 GreenBelt group and participants. Any and all questions you have, as the participant will be answered before the interview. Research participants will not be given a formal copy of the report but are welcome to be present for the final presentation and receive an electronic copy at the request of the sponsor.
You are not compelled to participate in this research project. If you do choose to participate, you are free to withdraw at any time without prejudice. Similarly, if you choose not to participate in this research project, this information will also be maintained in confidence.
By signing this letter, you give free and informed consent to participate in this project.
Name: (Please Print): __________________________________________________
Consent to use name in report: ___________________________________________
Consent to use company name in report: ___________________________________
Signature: ___________________________________________________________
Date: _______________________________________________________________
! 43
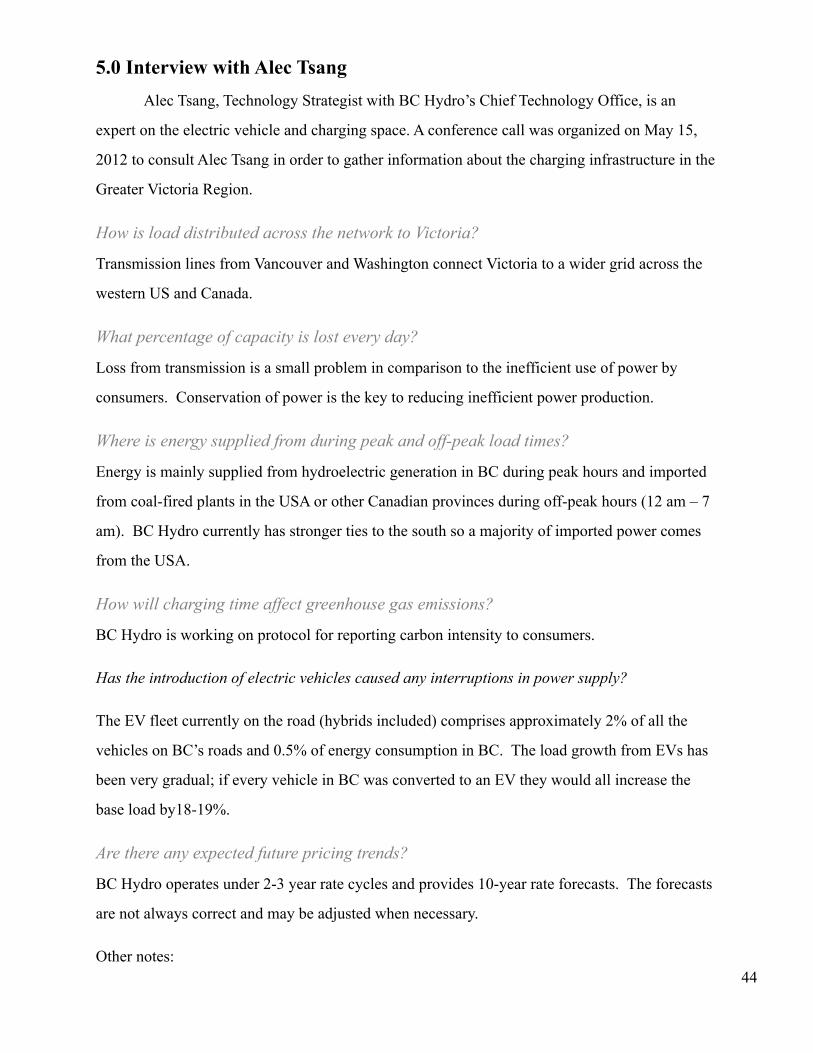
5.0 Interview with Alec Tsang Alec Tsang, Technology Strategist with BC Hydro’s Chief Technology Office, is an
expert on the electric vehicle and charging space. A conference call was organized on May 15,
2012 to consult Alec Tsang in order to gather information about the charging infrastructure in the
Greater Victoria Region.
How is load distributed across the network to Victoria?
Transmission lines from Vancouver and Washington connect Victoria to a wider grid across the
western US and Canada.
What percentage of capacity is lost every day?
Loss from transmission is a small problem in comparison to the inefficient use of power by
consumers. Conservation of power is the key to reducing inefficient power production.
Where is energy supplied from during peak and off-peak load times?
Energy is mainly supplied from hydroelectric generation in BC during peak hours and imported
from coal-fired plants in the USA or other Canadian provinces during off-peak hours (12 am – 7
am). BC Hydro currently has stronger ties to the south so a majority of imported power comes
from the USA.
How will charging time affect greenhouse gas emissions?
BC Hydro is working on protocol for reporting carbon intensity to consumers.
Has the introduction of electric vehicles caused any interruptions in power supply?
The EV fleet currently on the road (hybrids included) comprises approximately 2% of all the
vehicles on BC’s roads and 0.5% of energy consumption in BC. The load growth from EVs has
been very gradual; if every vehicle in BC was converted to an EV they would all increase the
base load by18-19%.
Are there any expected future pricing trends?
BC Hydro operates under 2-3 year rate cycles and provides 10-year rate forecasts. The forecasts
are not always correct and may be adjusted when necessary.
Other notes: ! 44
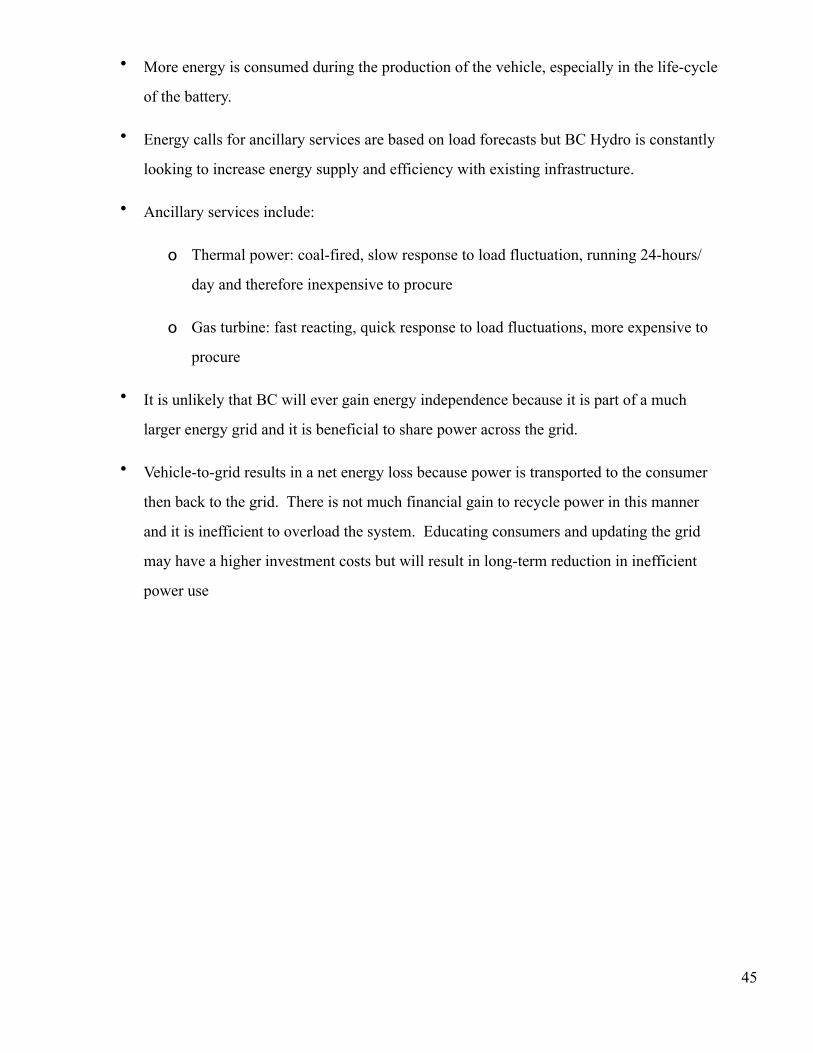
• More energy is consumed during the production of the vehicle, especially in the life-cycle
of the battery.
• Energy calls for ancillary services are based on load forecasts but BC Hydro is constantly
looking to increase energy supply and efficiency with existing infrastructure.
• Ancillary services include:
o Thermal power: coal-fired, slow response to load fluctuation, running 24-hours/
day and therefore inexpensive to procure
o Gas turbine: fast reacting, quick response to load fluctuations, more expensive to
procure
• It is unlikely that BC will ever gain energy independence because it is part of a much
larger energy grid and it is beneficial to share power across the grid.
• Vehicle-to-grid results in a net energy loss because power is transported to the consumer
then back to the grid. There is not much financial gain to recycle power in this manner
and it is inefficient to overload the system. Educating consumers and updating the grid
may have a higher investment costs but will result in long-term reduction in inefficient
power use
! 45
6.0 Dealership Representatives Raw Data
6.1 Wheaton Chevrolet Representative Paul Cook - Chevrolet Volt
What is the price of the vehicle
The overall price of the Volt ranges between $43,800-$51,000. There is a rebate of $5,000.
Where are the vehicles parts manufactured?
Vehicle parts are manufactured in Germany, while the vehicle itself is constructed in the United States. The Volt is constructed on a demand basis due to the cost of the vehicle.
What is the price and travel range of comparison vehicles?
The Malibu’s price range is $25,000-$36,000 depending on the features included. There is no rebate and the vehicle can run for 600km on a full tank. The Cruze ranges from $17,000-$29,000 and does not have a rebate. The vehicle can run for 800-1000km on a full tank.
What type of battery is used?
The Volt uses a 12-volt lithium ion battery with run down protection
What type of system is used to run the vehicle?
The Volt is constructed on a demand basis due to the construction cost of the vehicle. Since it has both an electrical and gas generator system, the Volt is very intricate and is an originally designed system for the electric vehicle
! 46

How far can the vehicle travel? And what is an estimate of the battery usage?
With the construction of the vehicle, it was noted that having both electrical and gas generator component make the Volt a very intricate and original system for electric vehicle. The vehicle can run 50-80km on a full charge, which sums up to the use of roughly 60% of the battery. The car can run for 400km total if the gas portion of the vehicle is used. This way, the Volt does not limit you as a fully electric car does. The gas generator consists of 9.0L, where upon it automatically starts once the battery reaches 20%. This is ideal for longer trips outside of the city.
What parts of the vehicle are recyclable?
Most of the electrical components are recyclable, but not the generator due to the fluids used within.
What is the estimated price for annual maintenance and fuel?
Once a year maintenance costing $60 should be preformed. Maintenance costs would increase if you are using the gas portion of the vehicle regularly. Car uses gas after one year automatically because gas has a shelf life of approximately one year, even if you don’t need the gas. Annual fueling costs are expected to be $535 and the vehicle should cost $1.56 to charge from a ‘dead’ battery.
What is the estimated life expectancy?
Life expectancy is longer if you rarely use the gas portion of the vehicle.
Contact information
Tel: 250-382-7121
6.2 Campus Nissan Representative Andrew Mackintosh - Nissan Leaf
What is the price of the vehicle The estimated overall price of the Leaf, including taxes and additional fees is $43,000. The rebate for the Leaf is $5,000.
Where are the vehicles parts manufactured?
Vehicle parts are manufactured in Japan, while the vehicle itself is also constructed in Japan. The vehicles are built on a demand basis and shipped to the location of purchase.
What is the price and travel range of comparison vehicles? No response.
! 47

What type of battery is used?
The Leaf uses a lithium ion magnesium battery, which respond better to high energy charging, as well as repeated charging.
What type of system is used to run the vehicle? No response.
How far can the vehicle travel? And what is an estimate of the battery usage? The distance traveled on a full charge is 30-50km, approximately 5-7hrs.
What parts of the vehicle are recyclable?
The entire makeup of the vehicle is recyclable except for the paint, front bumper and back bumper. At the present there is discussion for recycling of batteries by using them as storage units for solar panels. Since vehicles are still new, future use of products from the Leaf are still to be determined.
What is the estimated price for annual maintenance and fuel? Internal combustion vehicles require maintenance every 5,000-7,000km, which cost approximately $900 annually. Maintenance on the Leaf is approximately $80 annually.
What is the estimated life expectancy? Life expectancy of all electric vehicles is expected to be longer than internal combustion vehicles because of less ‘moving components’.
Additional information provided? There is a new $1.4 billion manufacturing facility to be built in Tennessee for 2013.
Contact information
Tel: 250-475-2227
Mobile: 250-589-4991
6.3 Metro Lexus Toyota Representative Terry Kennedy - Toyota Prius
What is the price of the vehicle The overall price of the hybrid ranges from 25,000 to 35,000, depending on features included. The Prius does not have a rebate.
! 48

Where are the vehicles parts manufactured? Possible production and manufacturing of parts and vehicle in Japan and transported to North America.
What is the price and travel range of comparison vehicles? No response.
What type of battery is used?
The Prius uses a Nickel-Hydride battery and a gas engine. Since 2001, 99% of hybrid vehicles are still using their original batteries with no complaints.
What type of system is used to run the vehicle? Do not have to plug it in.
How far can the vehicle travel? And what is an estimate of the battery usage? The total distance on a full tank is 750-1184km.
What parts of the vehicle are recyclable? No response.
What is the estimated price for annual maintenance and fuel?
The maintenance of a hybrid vehicle should be every 8000km or twice a year and has the same annual cost as an internal combustion vehicle. The Prius will require regular maintenance since it is also gas powered.
What is the estimated life expectancy? The life expectancy is expected to be longer than an internal combustion vehicle because of the battery life.
Contact information
Tel: 250-386-3516
Mobile: 250-881-5848
! 49

7.0 Early Adopters Information
Table 1 A gathering was held at Royal Road Bakery, located on 3337 Metchosin Road, on May
8th, 2012 in regards to consulting with early electric vehicle adopters and a special appearance of
the VTRUX, a full size 4X4 pick-up truck and the Tesla Roadster. At this gathering questions
were asked after ethical review forms were signed. Our early adopters that have accepted to
participate in this report are:
Early Adopter Contact Information General Information
David Grove Phone Number: 250.478.3717
Email: [email protected]
owner of Royal Bay Bakery
Kent Rathwell owner of the Tesla Roaster and
in partnership with the VTRUX
Larry Danby Email: [email protected] owner of converted Suzuki
Swift into an electric vehicle,
and Mitsubishi Miev
Brian Town owner of a Nissan Leaf
! 50

8.0 Early Adopters Raw Data
8.1 Converted Suzuki Swift Owner Larry Danby:
What are the differences between electric vehicles and other vehicles? Differences from internal combustion vehicles include a quieter running vehicle and fewer expenses on maintenance. Plugs right into the house, therefore, convenient; don’t have to wait at gas station with smells. It takes a total of 6 hours to charge on average and can be driven a total of approximately 70km on a single charge, good for daily commutes to work and grocery stores.
What are the initial costs of an electric vehicle in comparison to a similar size, and
mileage of a low emissions diesel vehicle?
The swift cost $15,000 for the conversion and it costs $10 a month for fuel (electricity) on average. On average, saves $250 a month on fuel.
What are the maintenance requirements for an electric vehicle in comparison to a similar
size, and mileage of a low emissions diesel vehicle? No maintenance fees so far, as well, can buy everything needed downtown. If you charge your vehicle slowly, the battery will last forever. If you charge it fast, it won’t last.
Advantages of Electric Vehicles Can charge electric vehicles at off-peak hours and it`s nice never having to go to a gas station. Need to keep the battery happy, therefore, use heat and coolants to keep it at the right temperature. Reason for becoming an early adopter
Why be an Early Adopter Doesn’t like paying bills.
8.2 Leaf Owner Dave Grove:
What are the differences between electric vehicles and other vehicles? No comment
What are the initial costs of an electric vehicle in comparison to a similar size, and
mileage of a low emissions diesel vehicle? No comment
! 51

What are the maintenance requirements for an electric vehicle in comparison to a similar
size, and mileage of a low emissions diesel vehicle? No comment
Advantages of Electric Vehicles No comment
Why be an Early Adopter Energy of the future is something he really cares about. It is a passion. As well, driving his Leaf is like driving a flashlight.
8.3 Leaf Owner Brian Town:
What are the differences between electric vehicles and other vehicles? Approximately 1 penny for 1km. Nissan clocks your movements online so you can see how much electricity you are using and how much money you are spending. The engine in the front of the vehicle is a false engine. It is put in for the mindset of the owner. Consumers are not yet ready to see a car without an engine. It is 26% more efficient than an internal combustion vehicle and 95% electricity efficiency. Not losing so much power with an electric vehicle. Even if there was a coal fire power plant built here to accommodate everyone (if everyone has an electric vehicle), emissions would still be reduced by 40%.
What are the initial costs of an electric vehicle in comparison to a similar size, and
mileage of a low emissions diesel vehicle? No comment
What are the maintenance requirements for an electric vehicle in comparison to a similar
size, and mileage of a low emissions diesel vehicle? No comment
Advantages of Electric Vehicles No comment
Why be an Early Adopter Likes the idea of regenerative fuel.
! 52
8.4 Tesla Owner Kent Rathwell:
What are the differences between electric vehicles and other vehicles? Electric vehicle range is quite good on a full charge. It takes approximately the same amount of time to charge as the Chevy Volt. Differences from internal combustion vehicles include more torque while driving and quiet.
What are the initial costs of an electric vehicle in comparison to a similar size, and
mileage of a low emissions diesel vehicle? The price of electric vehicles is expected to decrease as manufacturing and technology increases. The vehicle is too new to be eligible for rebates.
What are the maintenance requirements for an electric vehicle in comparison to a similar
size, and mileage of a low emissions diesel vehicle? No comment
Advantages of Electric Vehicles No comment
Why be an Early Adopter One electric vehicle takes two internal combustion vehicles off the road.
! 53

Appendix B 1.0 Budget Report
!
! 54

Appendix C 1.0 Payback Period Calculations
Calculation for annual fueling price for electric vehicles (only using electricity) and charging
from dead every night for a year. Price of $1.56 was given by dealership representative (Wheaton
Chevrolet)
$1.56 x 365 = $569.40
Sample calculation for the economic payback period of the Nissan Leaf compared to the
Chevrolet Malibu. It factors in the estimated annual fueling price and the annual maintenance
costs of each vehicle.
$38,000 (Leaf) - $25,000 (Malibu) = $13,000
($2,062 + $900 (Malibu per year)) - ($569.40 + $80 (Leaf per year)) = $2,312.6 per year
$13,000 = $2,312.6 x
x = $13,000/$2,312.6 = 5.6 years
Appendix D ! 55

1.0 Dealership Representative Consent Form Signature Page
!
!
!
! 56

2.0 Early Adopters Consent Form Signature Page
!
!
! 57

!
! 58