Embed Size (px)
Citation preview
1
RSPB/NE Countdown 2010 Biodiversity Action Funded Project
Bringing Reedbeds to Life
October 2009 – March 2011
Wildlife Survey Technical Report
March 2011
Chloe Hardman
RSPB Reedbed Project Officer
2
Table of Contents
Chapter 1: Introduction to Bringing Reedbeds to Life and background to the survey sites
Chapter 2: Environmental gradients in reedbeds
Chapter 3: Overview of invertebrate results
Chapter 4: Water trap surveys with particular focus on Diptera
Chapter 5: Pitfall trap surveys with particular focus on Coleoptera
Chapter 6: Light trap surveys for moths
Chapter 7: Aquatic invertebrates
Chapter 8: Aquatic plants
Chapter 9: Amphibians
Chapter 10: Water vole and mink
Chapter 11: Recommendations for further work and conclusions
3
Acknowledgements
We are extremely grateful to the Natural England Countdown 2010 Biodiversity Action Fund for part
funding this project. Thank you to the many volunteers who have given their time and enthusiasm,
this is very much appreciated.
To all site staff involved in the project, thank you for allowing us to survey on your reserves, for
providing the support needed to undertake this work and for being interested and enthusiastic
about the findings. To everyone who has attended events throughout the project, thank you for
sharing ideas and taking time to consider our results.
Special thanks to Donna Harris (former RSPB Reedbed Project Officer), who designed, planned and
implemented the wildlife survey programme and started the analysis process. Many thanks also to
Anna Doeser (former RSPB Reedbed Survey Assistant), who carried out much of the fieldwork in
2009. To Nick Droy and Jane Sears for guiding the project and always being ready to offer advice,
and to the steering group for their helpful inputs along the way.
The following people have all made contributions to the project, for which we are very grateful.
Apologies to those who have been involved who are not listed here, we thank you too.
Malcolm Ausden, Chris Bailey, John Baker, Mareth Basset, John Baxter, Trevor Beebee, John
Blackburn, Sergio Boggio, Vivienne Booth, Ruth Brandt, Banks Brian, Paul Britten, Gavin Broad, John
rooks, Alan Brown, Andy Brown, Leslie Brown, Nigel Butcher, Mark Champion, Liz Charman, Sean
Clancy, Simon Clarke, Jon Clifton, Steve Couch, Ellie Crane, John Crispin, Ian Dawson, Rachel
Devereux, Ian Dillon, Sarah Eaton, Mike Edwards, Natasha Ewins, Dan Forman, Jim Foster, David
Fouracre, Paul Gambling, Tony Gent, William George, Gillian Gilbert, Andy Godfrey, Colin Gooch,
Karen Gray, Stephen Gregory, Richard Griffiths, Lionel Grooby, Catherine Guha, Martin Guha, Mark
Gurney, Robin Hanson, Ian Harding, Lauren Harrington, Phil Heath, David Heaver, Steve Henson,
Steve Hughes, Emma Hutchins, Paul Hyde, Barbara Ismay, John Ismay, Rebecca Jannaway, June
Jukes, Roger Key, Vicky Kindemba, Heather Kingsley, Carol Laidlaw, Sue Lawson, Carolyn Leader,
Martin Lester, Owen Leyshon, Amanda Lloyd, Rhoda Ludford, David Macdonald, Liz Mackley, Jenny
Macpherson, David Mainwaring, Keith Mathews, James McGill, Steve Meakins, Thomas Merckx,
Darren Moorcroft, Tom Moorhouse, Chris Nall, Pascale Nicolet, Richard Noble, Amy Norris, Steffen
Oppel, Tim Pankhurst, Mark Parsons, Ann Patterson, Adam Peacock, Fran Perry, Mike Phillips,
Richard Price, Tony Prichard, Andrew Proctor, Stephen Ridgeway, Ben Ring, Dave Rogers, James
Selby, Matt Self, David Sewell, Andy Sharpe, David Sheppard, Mike Shurmer, Norman Sills, Jen Smart,
Andy Stokes, Alan Stubbs, Ray Summers, Mark Telfer, Jamie Thompson, Martin Townsend, Tom
Walters, Stuart Warrington, Mandy West, James Wheeler, Graham White, David Wildling, Ellen
Wilson, Simon Wotton.
4
Chapter 1: Introduction to Bringing Reedbeds to Life and background to the survey sites
C J Hardman, N Droy
Bringing Reedbeds to Life is an innovative programme of scientific research and habitat monitoring, coupled with practical habitat management advice and training. It represents one of the largest co-ordinated programmes of such work on reedbed wetlands for over a decade. The project is led by RSPB and co-funded by Natural England via the Countdown 2010 Biodiversity Action Fund, and is therefore being delivered in England only. However, the results and information will be applicable across the whole of the UK and beyond. Bringing Reedbeds to Life has been carried out in partnership with organisations and individuals across a range of sites in England.
The project aims to generate a better understanding of the requirements of a wider range of reedbed wildlife. This enhanced understanding will be used to inform advice, training, management and future conservation strategies across England’s reedbeds.
The project has four key themes:
i. Wildlife surveys
ii. Bittern nesting investigations
iii. Reedbed audits across 30 sites & management advice
iv. National advisory programme to disseminate project results and update best practice advice
As part of the wildlife survey component of the project we have surveyed invertebrates, amphibians, mammals, plants and habitat on reedbed sites to find out what reedbed habitat conditions support the highest biodiversity. The habitat variables measured were chosen to represent some of the key environmental gradients found within reedbeds. Some of these habitat variables have also been measured at 30 reedbed sites across the UK as part of the auditing programme.
Reedbed
Reedbed-wetlands have large areas dominated by common reed Phragmites australis. Reed is part of at least 40 National Vegetation Classification communities or sub-communities. Reedbeds are successional habitats, and will naturally succeed from wet areas where young reed dominates, to drier areas where litter accumulates allowing more plants to colonise and eventually for scrub to dominate. Reedbed management provides tools to slow or halt this natural succession, in order to maintain all stages of reedbed succession within a site. Reedbeds therefore are highly managed dynamic systems.
According to the Biodiversity Action reporting System (BARS), there is currently 7,770ha of reedbed in the UK, which includes 5,200ha within England. It is therefore a rare habitat supporting many rare and declining species of conservation priority, and as such has been the focus of substantial research, monitoring and management action.
Consequently, a wide variety of action has been undertaken to safeguard both the habitat, and some of the characteristic species which depend upon it. This includes the creation of new reedbed areas, and the ongoing restoration and management of existing sites. In addition, long term monitoring of species such as bittern has been undertaken, along with a large programme of policy and site safeguarding action, information sharing and training, and other action aimed at improving both the extent and quality of habitat. Sea level rise, and the threat this poses to East Anglican sites in particular, has placed another layer of urgency on this work.
Recent initiatives such as the Wetland Vision, and the move towards a landscape scale approach to conservation, have also highlighted the importance of reedbed as part of a broader wetland mosaic.
5
The minerals industry in particular, has also been identified as one sector that can play an important role to the creation of new reedbed areas, through projects such as Nature after Minerals.
In 1994 reedbeds were considered one of the rarest habitats in the UK, and were largely in a state of neglect owing to a lack of management. The decline in bitterns (Botaurus stellaris) in the UK to a low of 11 boomers at 7 English sites prompted a programme of reedbed restoration. English Nature commenced its Bittern Recovery Project in 1994. This was followed by “emergency action” to restore at least 350 ha of reedbed, funded by the first EU Life - Nature funded project (from 1996 to 2000). This first phase focused on 13 sites in the core Suffolk/Norfolk breeding areas. The second EU Life –Nature funded project (from 2002 to 2006) created more than 300 ha of new reedbed, restored a further 350 ha of reedbed and restored and created nearly 40km of ditches on 19 sites. This second phase was focused away from the core breeding areas, to encourage range expansion of bitterns in the UK. This work has been successful in increasing bittern numbers: in 2010, 41 Bittern nests were identified at a total of 17 sites in six counties.
This research stems from the desire to investigate the importance of reedbed habitat for a wider range of wildlife. Concern that previous restoration work had changed reedbed habitats in a way that was not beneficial for all taxonomic groups, particularly invertebrates, sparked the need for a survey of reedbed wildlife and a study of what habitat within reedbed it is found in. This will enable reedbed management plans to be more holistic and support habitat for broad biodiversity. It will also inform the scientific basis on which reedbed creation schemes are designed.
Armed with this emerging information, reedbed habitat and management audits have been undertaken across over 30 key sites in England, to compare the ‘ideal’ with the current health and well being of such sites. In this way we can take a fresh look strategically, at whether the current reedbed resource is being designed, restored and managed to maximise its wildlife potential. This sits alongside an ongoing programme of information sharing, training and advice for reedbed managers to ensure that best practice is disseminated widely, and relevant action taken. The vibrant partnership which has been developed through this work will form the foundation for further work and thought in this area.
Wildlife survey programme aims and objectives
The wildlife survey component of this project aimed to provide a broad overview of the wildlife in reedbeds, and the specific habitat within reedbed that is used.
Key Questions:
1. What species are found within reedbed nature reserves? 2. What habitat conditions are these species associated with?
The nature of this study was to investigate as broad a range of biodiversity as possible, in as much detail as possible to answer these questions to a level that can inform reedbed management. It was decided to look at habitat variables rather than associations with management since management practices are very rarely recorded in sufficient detail for use in scientific analysis. Many of the analyses in this project are exploratory, evaluating associations between wildlife and a wide range of habitat variables. This elucidates habitat variables that appear important in supporting species diversity. Individual studies on the influence of each habitat variable would reveal greater detail about the optimal habitat matrices that will maximise biodiversity.
Background to the sites
The majority of wildlife surveys were conducted at three key sites, Hickling Broad, Norfolk (Norfolk Wildlife Trust), Ham Wall, Somerset (RSPB) and Stodmarsh, Kent (Natural England). Invertebrates
6
and water voles were surveyed at Hickling Broad, Ham Wall and Stodmarsh. Ham Wall and Stodmarsh were surveyed for amphibians. In addition, Far Ings, Lincolnshire, (Lincolnshire Wildlife Trust) and Wicken Fen, (Cambridgeshire) National Trust were surveyed for mink and water voles using mink rafts. Sites were chosen on the basis of ensuring a relevant geographical spread in the major reedbed areas, and to be in some way representative of a variety of site histories and management regimes.
Key sites at which majority of surveys were carried out:
Hickling Broad
Owned and managed by: Norfolk Wildlife Trust
Size: 600 hectares
Grid Ref: TG 420200
Location: In the NE of the Broads National Park, just north of the A149 at Potter Heigham.
2-3 miles from the sea(www.freemaptools.com)
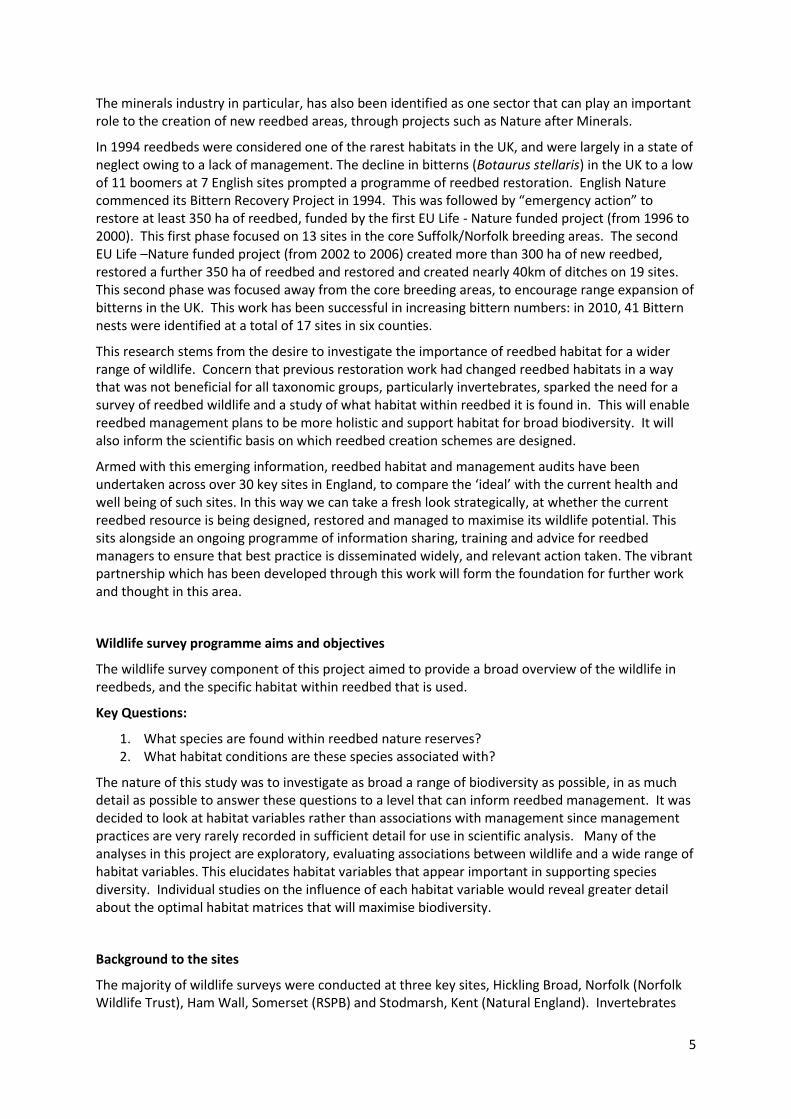
Hickling Broad has been managed by the Norfolk Wildlife Trust since 1944. It is 600 Hectares in size and is included in designated SSSI, SPA, Ramsar Site and NNR areas. The current management plan aims to increase populations of bittern, bearded tits and marsh harriers. The reserve encompasses 200 hectares of reedbed fringing the broad, 32 hectares of recently created reedbed, 33 hectares of Cladium bed and over 180 hectares of open water, along with grazing marsh and wet woodland.
The Hundred Acre Reedbed was created between 1997 and 1999 with a LIFE 1 project grant to provide bittern habitat. It is about 32 hectares in size and protected by flood walls. Greater control of water levels is possible here whereas levels are not controllable on the older reedbed surrounding the broad. However Hundred Acre reedbed is fed by water from the Broad so levels do fluctuate with the Broad. The Broad fluctuates with the tide since Hickling is only 2-3 miles from the sea. High tides can raise levels, whilst low river flow in summer can make levels fall substantially. Hydrological management aims for 10-20 cm of water across most of the reedbed. Water levels are drawn down in October/November ready for reed cutting then raised again in early January/February.
On Hundred Acre reedbed, 40% of the area is under commercial cutting (western block) and 60% under rotational cut and burn (eastern block) on a ten year rotation. There are 10 grazing Highland cattle for seasonal grazing of bunds. There is no active scrub control as encroachment is not currently a problem. There are also pockets of sedge cutting. The tall herb fen and meadow has little management.
From 2005 to 2008 ditches were cleaned at less than 1 km per annum in Hundred Acre and around the rest of the broad ditches were cleaned in the 1990s. There is a Broads wide mink control programme. Mink rafts are used on the site but not in Hundred Acre yet. Fox control is carried out by a contractor. Little is known about fish populations since the electro-fishing survey in 2000 by RSPB did not record any fish. Shoals of small fish have been observed in Hundred Acre by the warden and it is expected that the Broad supports good stocks.
Ham Wall
Grid ref: ST 460400
Location: in the Avalon Marshes on the Somerset Levels near Glastonbury
7
Owned and managed by RSPB
Size: 235 Hectares
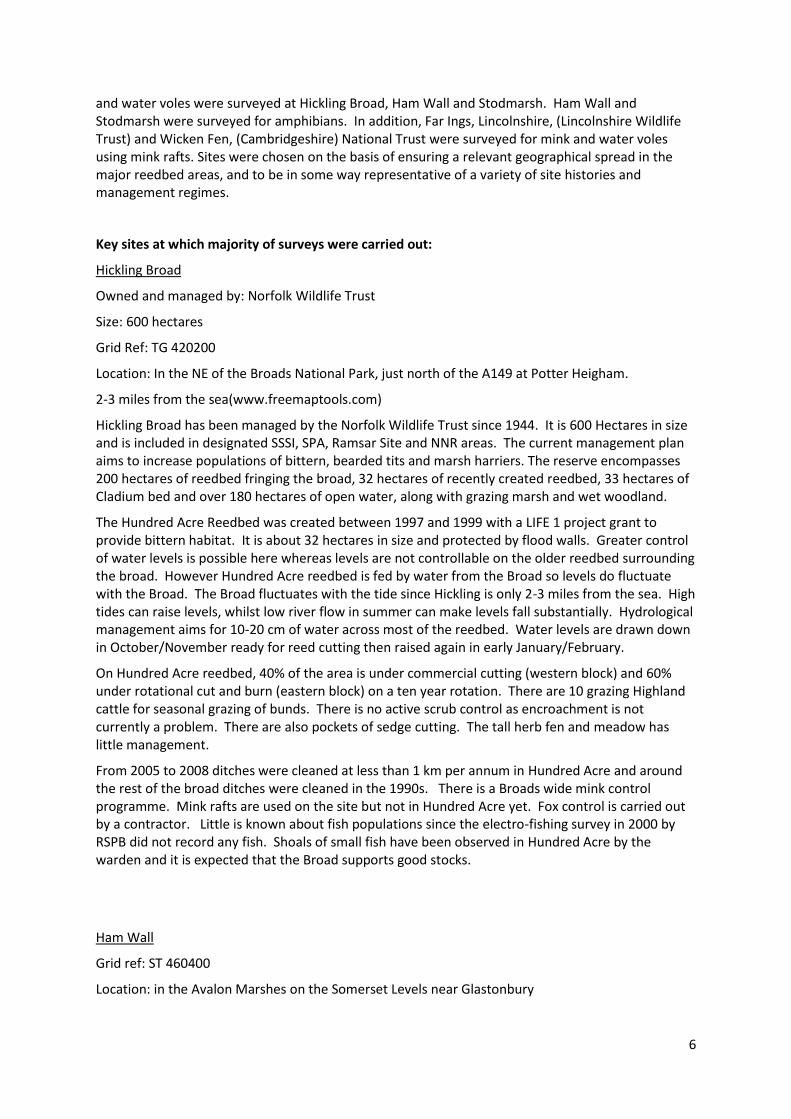
8 miles from the sea (www.freemaptools.com)Ham Wall is a designated NNR and has been managed by RSPB since 1994. The site has been restored from a peat extraction site to a wetland reserve. In 2000 there were 18 hectares of reedbed, which increased to 60 by 2005. There are now 118 hectares of freshwater reedbed, 15 hectares of swamp, 6 hectares of wet woodland and 8 hectares of dry and marshy grassland. The current management aims to maintain the reedbed and swamp habitats for breeding bittern and marsh harrier, and to increase the population of bearded tit. Management is also focused on maintaining other habitats for breeding birds, small mammals and invertebrates. The wet woodland is important for some red data book invertebrates.
The surrounding area is mostly used for agriculture and peat extraction. Just across the road is Shapwick Heath NNR managed by Natural England. Westhay Moor NNR, managed by the Somerset Wildlife Trust, is two kilometres away
Bittern management is a high priority. Bitterns first bred at the site in 2008 and numbers have increased over the years. The reedbed is probably overall the wettest of the three sites in this project, with management at Ham Wall aiming for over 90% wet reedbed. The aim for water levels is between 20 and 100 cm of water in the reedbed between February and July. There is plenty of reed-water interface created by edge sculpting. There are 16 phases which can be connected or isolated by the control of sluices.
The oldest section of the site is 14 years old and is currently being rejuvenated using different techniques in different blocks, such as cutting, grazing and burning. The idea is to take the reedbed back to its earliest successional stage again an allow reed to recolonise. The Ham Wall management plan aims for 80 % of the reedbed to be between 1 and 16 years old.
Mink control is carried out. Twelve rafts are used to monitor mink sign. Traps are then set and the animals dispatched with an air rifle. Scrub control is carried out, with all scrub removed from the reed cut areas each year. The site is grazed by highland cattle. There are high fish stocks, and some species such as rudd were introduced. Starling damage affected up to 70 % of the reedbed for the last 3 years. Huge flocks flatten and break dead reed and deposit large quantities of droppings.
Ham Wall will be an interesting case study here because it is the youngest site surveyed. We will examine what species have colonised the site, how the diversity and abundance of species compared to other sites and what habitat variables are associated with areas of highest diversity within the reedbed.
Stodmarsh
Owned and managed by: Natural England
Size: 242 Hectares
Grid ref: TR 222620
Location: East of Canterbury in the River Great Stour valley
5 miles from the sea (www.freemaptools.com)
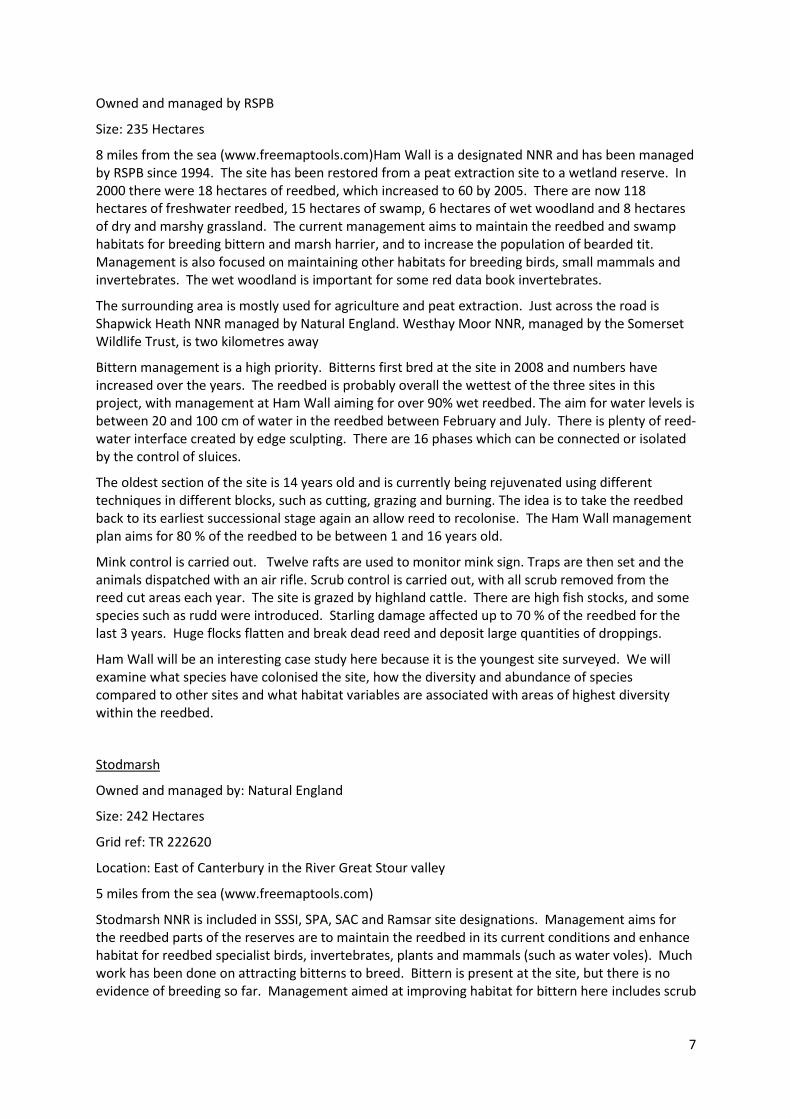
Stodmarsh NNR is included in SSSI, SPA, SAC and Ramsar site designations. Management aims for the reedbed parts of the reserves are to maintain the reedbed in its current conditions and enhance habitat for reedbed specialist birds, invertebrates, plants and mammals (such as water voles). Much work has been done on attracting bitterns to breed. Bittern is present at the site, but there is no evidence of breeding so far. Management aimed at improving habitat for bittern here includes scrub
8
removal, edge reprofiling, ditch restoration and habitat creation. There is a diverse and healthy fish population (four species and one hybrid according to electro-fishing survey).
Parts of the site are linked to the river which has tidal influences. Stodmarsh is about 4-5 miles from the sea. Saline influence does not reach this far up the river. Other parts of the reserve are protected from the river by the Lampen Wall flood defence. There are two main areas of reedbed, separated by grazing marsh in the centre. Grove Ferry reedbed at the eastern end was created in 1998, whereas the main reedbed at the western end is older. There is a large lake at the western end of the reserve which is tidal and connected to the river. Further west there are privately owned reedbeds, which NE has some influence on as they are within the SSSI.
Hydrological management at the site can be divided into two large areas, the western area connected to the river by a drop board sluice and the Grove Ferry and main reedbed areas which are separated from the river by the Lampen Wall. In the western area, the sluice is opened in winter so water levels vary with the tidal river. In May the board is replaced to try to maintain high water levels in the summer, even when river flow drops. Inside the Lampen Wall, water is supplied by the Lampen Stream. Levels are drawn down from September to allow management to take place and are raised again in at the end of January. However winter flooding can overtop the Lampen Wall and make management more difficult. The Lampen wall also leaks, so when the lake level is high water needs to be allowed out of the reedbed to compensate. Further work to water control structures is needed to facilitate this.
Hydrological management at Stodmarsh has changed since 2008. Work has been done to maximise spring levels in the old reedbed east of the Lampen Wall. Water levels are now raised 2 weeks earlier (in Jan rather than mid Feb) and are maintained at a higher level. There has been an effort to flush more water through this reedbed where circumstances are appropriate (when water is available and not required for neighbour’s abstraction). There is also a more planned draw-down during the summer and autumn where attempts are made to maintain flow through the reedbed whilst the levels are dropped to replicate a natural draw-down. At Grove Ferry, levels in the middle and southern sections have been compromised by the presence of Crassula helmsii and the need for low levels in autumn and early winter for treatment of the plant.
There are short, long and no-cutting regimes in place on the reserve. The reedbed east of the Lampen Wall has 5 double whale compartments (though weather conditions and staff numbers generally have meant that this rotation is longer). Much of the remainder is cut on roughly a 15 year rotation. In the last 3 years staff have cut one compartment each winter using a 360 with a Bradshaw bucket, burning up the cut reed. At Grove the reedbed is still developing. 3 winters ago staff cut 2/3rds of a compartment with the 360. The tidal lake redbed is generally too wet to cut with the machinery available. Consultants have looked at the feasibility of other methods of reedbed management, cutting and use of the reed. This has provided costed options which allow us to look at future funding. At Grove most of the ditches were reprofiled and cleaned after the site was bought by NE in 1998 so are only now reaching a state where they require cleaning. Extensive work was done in the older reedbed in the mid 1990s using EU Life money. Better access is being installed for excavators as there are some compartments where ditch management is not possible. This should be completed in the next 2 years and includes some ditch management in different areas.
Scrub control takes place in most winters. Last winter extensive cutting was undertaken in the reedbed east of the Lampen Wall. Previously extensive work was done at Grove. This winter cutting needs following up with stump treatment and elimination of willows from one of the last remaining area of willow scrub near the boat house. Future plans are for work on scrub and ditches on the main lake reedbed.
Mink control has been in place with trapping from 2008-2010. This has been limited trapping in spring and autumn. This autumn the programme has been much more intensive. Ian has been out
9
most weeks from mid August and to date 14 mink have been removed from the reserves (previous trapping efforts tended to yield 2-3 mink).
Additional sites at which mink and water vole surveys were carried out:
Far Ings
Owned and managed by: Lincolnshire Wildlife Trust
Size: 65.8 hectares
Grid ref: TA 011229 and 023230
Location: On Humber estuary, 17 miles from the sea
Far Ings was formerly a clay yard that was acquired by the Lincolnshire Wildlife Trust in 1983. Over the past 15 years, management has improved the reedbed habitat with the aim of attracting nesting bitterns. Bitterns began breeding at the site again in 2000 after an absence of 21 years. Reed cutting on rotation is carried out.
Wicken Fen
Owned and managed by: National Trust
Size: 666 hectares and growing
Grid ref: TL 562705
Location: Cambridgeshire Fens, 35 miles from the sea
Wicken Fen the National Trust’s oldest Nature Reserve and is undergoing expansion as part of the Wicken Fen Vision. The reserve is on peat substrate, and contains a range of wetland habitats such as sedge fen, carr, rough pasture, reedbed, pools, dykes and abandoned claypits. Two very different management strategies are used: some areas are intensively managed with sedge cutting and watercourse clearing. Other areas are under extensive management which aims to let natural processes drive changes in the landscape.
10
CHAPTER 2: What are the main environmental gradients within reedbeds?
C J Hardman
Contents
Habitat variables ................................................................................................................................... 10
Summary of environmental gradients in our dataset ........................................................................... 11
Audit data.............................................................................................................................................. 11
Ordination plots of audit data .............................................................................................................. 14
Environmental gradients across the three key sites (Ham Wall, Hickling Broad and Stodmarsh) ....... 19
Conclusion ............................................................................................................................................. 23
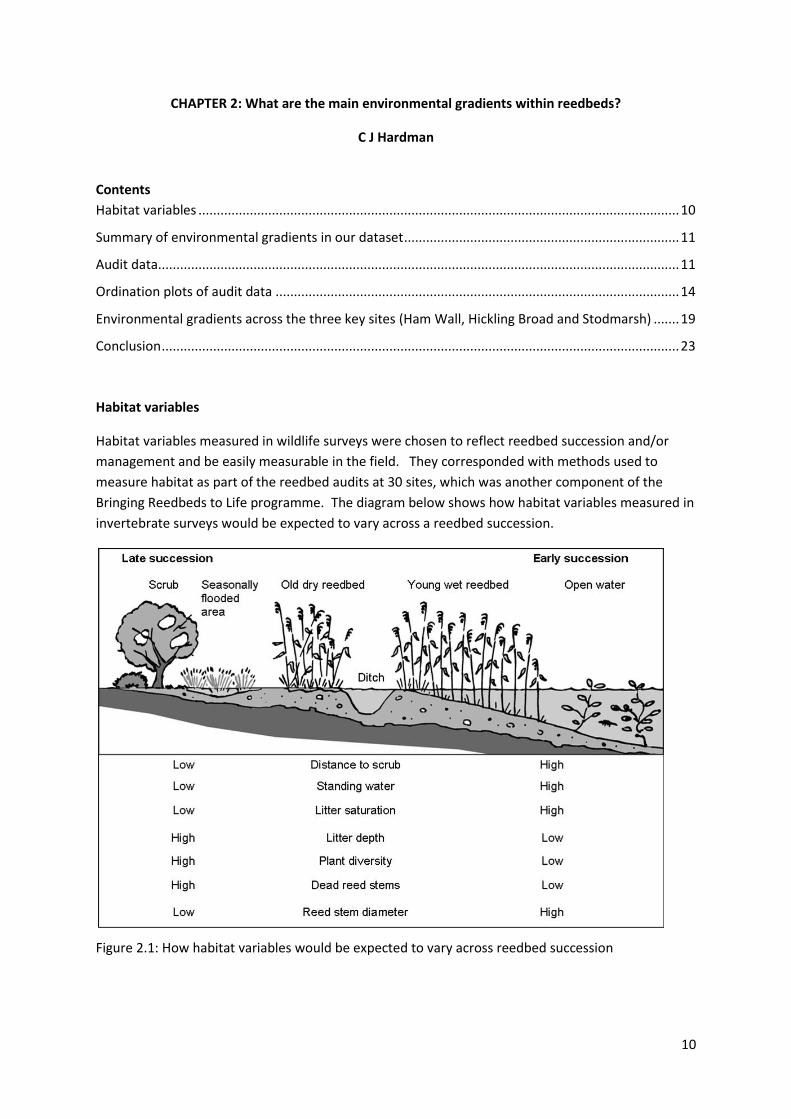
Habitat variables
Habitat variables measured in wildlife surveys were chosen to reflect reedbed succession and/or
management and be easily measurable in the field. They corresponded with methods used to
measure habitat as part of the reedbed audits at 30 sites, which was another component of the
Bringing Reedbeds to Life programme. The diagram below shows how habitat variables measured in
invertebrate surveys would be expected to vary across a reedbed succession.
Figure 2.1: How habitat variables would be expected to vary across reedbed succession
11
In addition to the trends seen in this diagram, reedbed management such as cutting/burning can be
expected to reduce reed height and stem diameter, reduce the number of dead stems, and increase
stem density and number of panicles.
Summary of environmental gradients in our dataset
Habitat variables measured across reedbeds were analysed using principle components
analysis to find out what the main environmental gradients within our reedbed dataset
were. We were able to do this analysis on both the audit data (from 27 sites) and the
invertebrate data (from 3 sites). Principle components analysis simplifies the different
habitat variables measured into a number of composite variables that best explain the
variation between sampling points.
Across the 27 sites from which habitat data from reedbed audits were available, the main
environmental gradients were differences in i) a composite of reed height, live stem density
and reed diameter, ii) a composite of dead stem density, total stem density and litter depth
and iii) a composite of live stem density and water level.
Across the 3 sites from which habitat data from invertebrate surveys were available, the
main environmental gradients were differences in i) a composite of reed stem diameter,
number of months the point is wet and litter depth, ii) a composite of stem density, distance
to scrub and plant species richness, ii) a composite of dead stems, stems with panicles and
reed height
The environmental gradients can be explained in terms of the way reed varies with cutting
and succession
Ham Wall was most different to the other two sites in terms of these habitat variables.
Other key gradients will exist such as salinity and variation in oxygen content of the litter (not measured at these points).
These key gradients were tested for correlations with invertebrate diversity, as described in
the terrestrial invertebrates results section.
Audit data
Key environmental gradients in the audit data were increasing stem diameter, decreasing live stem
density and increasing reed height (PC1), followed by a gradient of decreasing percentage of dead
stems, decreasing total stem density and decreasing litter depth (PC2). Next was a gradient of
increasing live stem density and increasing water level (PC3).
30 sites across England were surveyed as part of the RSPB’s reedbed auditing programme. This
included both RSPB and non-RSPB sites, of a range of ages. Sufficient data for PCA was available for
27 of the sites and this was from a total of 210 quadrats. Three reserves (Fowlmere, Stodmarsh and
Strumpshaw) could not be included because not all habitat variables were available. The sites used
in analysis were: Barnes WWT, Broomfleet, Dearne, Dingle, Dungeness, Far Ings, Ham Wall, Hicking
Broad, Icklesham, Lakenheath, Lee Valley, Leighton Moss, Malltraeth, Marazion, Minsmere, Newport
Wetlands, North Warren, Otmoor, Radipole, Rye Meads, Shapwick, Siddick, St Aidan's, Thatcham,
Titchwell, Westhay Moor and Wigan Flashes.
The amount of variation explained by each component was fairly low, with the first two components
only explaining 49% of the variance.
12
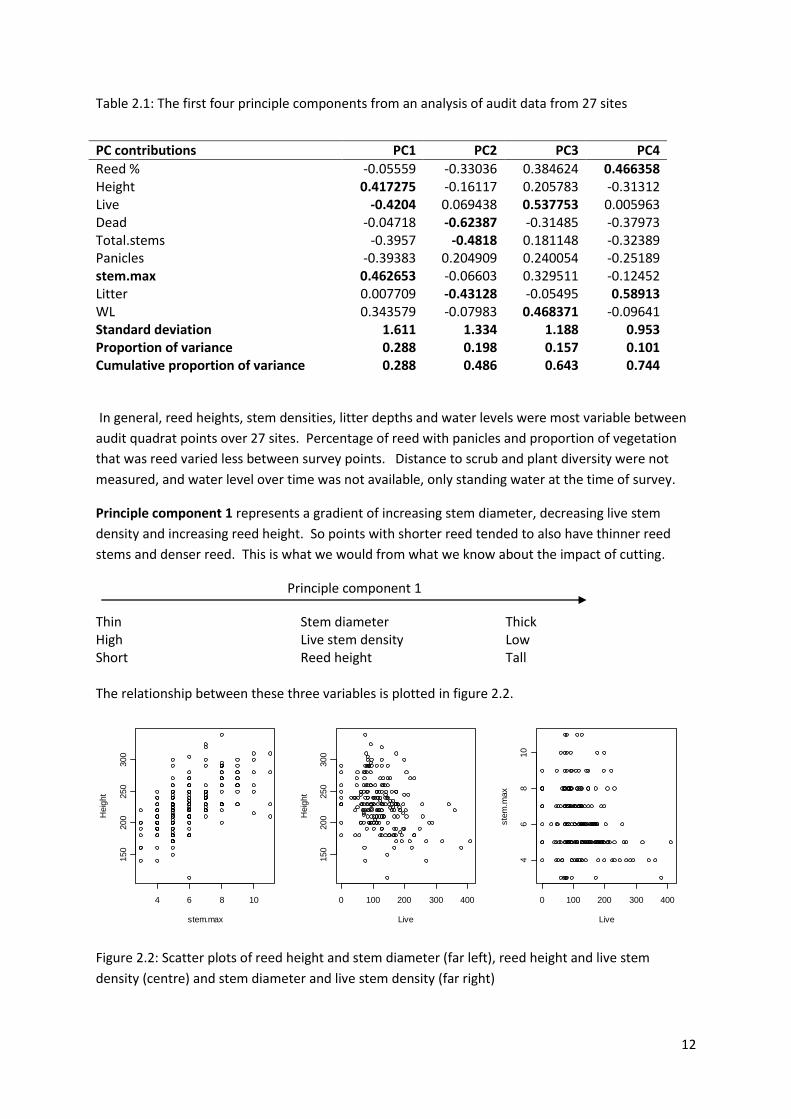
Table 2.1: The first four principle components from an analysis of audit data from 27 sites
In general, reed heights, stem densities, litter depths and water levels were most variable between
audit quadrat points over 27 sites. Percentage of reed with panicles and proportion of vegetation
that was reed varied less between survey points. Distance to scrub and plant diversity were not
measured, and water level over time was not available, only standing water at the time of survey.
Principle component 1 represents a gradient of increasing stem diameter, decreasing live stem
density and increasing reed height. So points with shorter reed tended to also have thinner reed
stems and denser reed. This is what we would from what we know about the impact of cutting.
Principle component 1
Thin Stem diameter Thick High Live stem density Low Short Reed height Tall The relationship between these three variables is plotted in figure 2.2.
Figure 2.2: Scatter plots of reed height and stem diameter (far left), reed height and live stem
density (centre) and stem diameter and live stem density (far right)
4 6 8 10
150
200
250
300
stem.max
Heig
ht
0 100 200 300 400
150
200
250
300
Live
Heig
ht
0 100 200 300 400
46
810
Live
ste
m.m
ax
PC contributions PC1 PC2 PC3 PC4
Reed % -0.05559 -0.33036 0.384624 0.466358 Height 0.417275 -0.16117 0.205783 -0.31312 Live -0.4204 0.069438 0.537753 0.005963 Dead -0.04718 -0.62387 -0.31485 -0.37973 Total.stems -0.3957 -0.4818 0.181148 -0.32389 Panicles -0.39383 0.204909 0.240054 -0.25189 stem.max 0.462653 -0.06603 0.329511 -0.12452 Litter 0.007709 -0.43128 -0.05495 0.58913 WL 0.343579 -0.07983 0.468371 -0.09641 Standard deviation 1.611 1.334 1.188 0.953 Proportion of variance 0.288 0.198 0.157 0.101 Cumulative proportion of variance 0.288 0.486 0.643 0.744
13
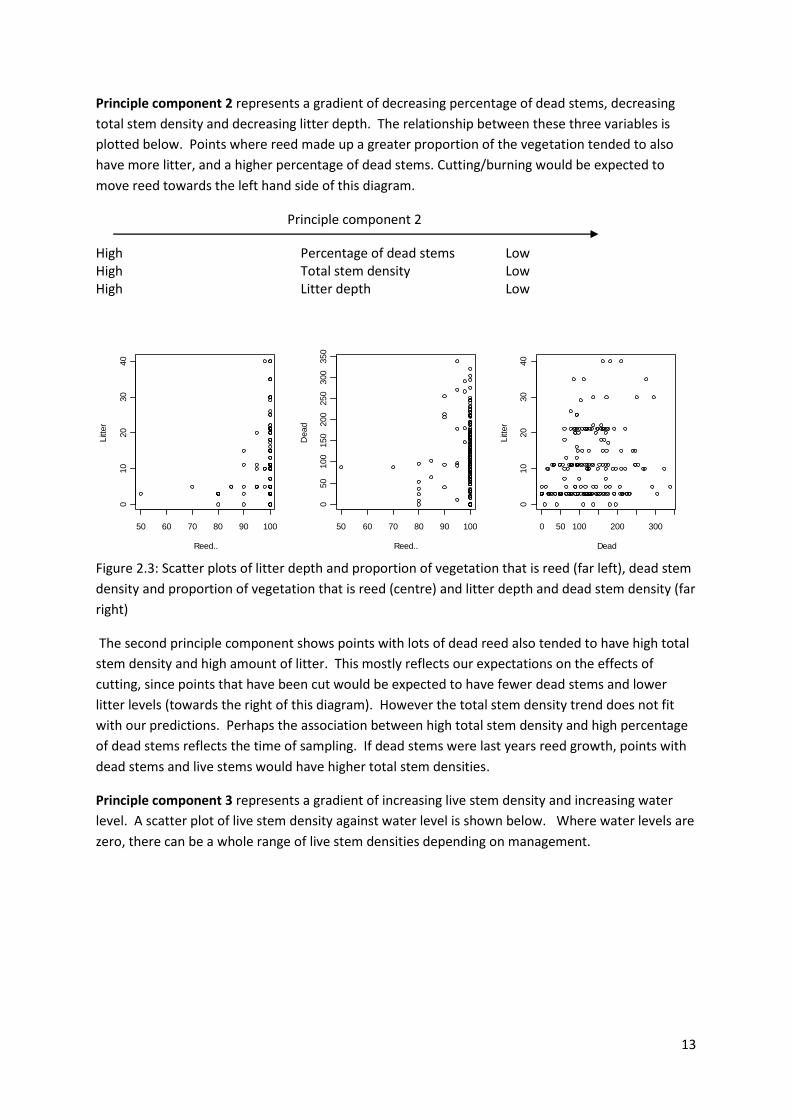
Principle component 2 represents a gradient of decreasing percentage of dead stems, decreasing
total stem density and decreasing litter depth. The relationship between these three variables is
plotted below. Points where reed made up a greater proportion of the vegetation tended to also
have more litter, and a higher percentage of dead stems. Cutting/burning would be expected to
move reed towards the left hand side of this diagram.
Principle component 2
High Percentage of dead stems Low High Total stem density Low High Litter depth Low
Figure 2.3: Scatter plots of litter depth and proportion of vegetation that is reed (far left), dead stem
density and proportion of vegetation that is reed (centre) and litter depth and dead stem density (far
right)
The second principle component shows points with lots of dead reed also tended to have high total
stem density and high amount of litter. This mostly reflects our expectations on the effects of
cutting, since points that have been cut would be expected to have fewer dead stems and lower
litter levels (towards the right of this diagram). However the total stem density trend does not fit
with our predictions. Perhaps the association between high total stem density and high percentage
of dead stems reflects the time of sampling. If dead stems were last years reed growth, points with
dead stems and live stems would have higher total stem densities.
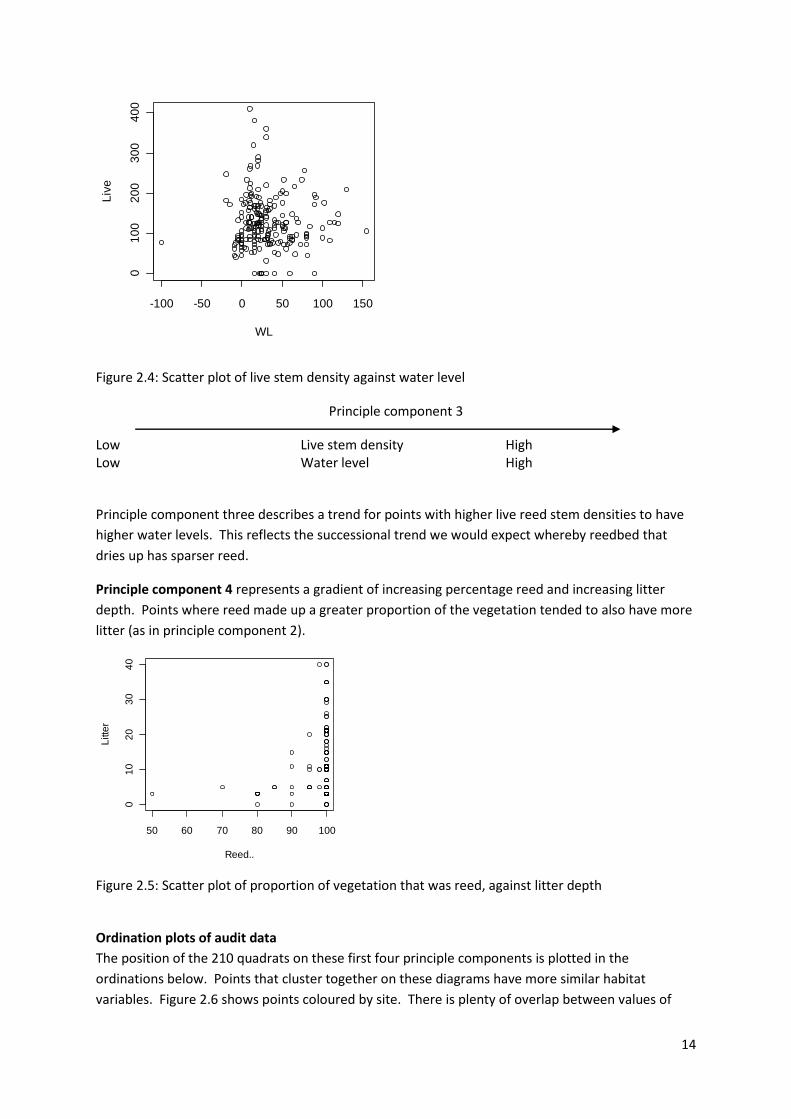
Principle component 3 represents a gradient of increasing live stem density and increasing water
level. A scatter plot of live stem density against water level is shown below. Where water levels are
zero, there can be a whole range of live stem densities depending on management.
50 60 70 80 90 100
010
20
30
40
Reed..
Litt
er
50 60 70 80 90 100
050
100
150
200
250
300
350
Reed..
Dead
0 50 100 200 3000
10
20
30
40
Dead
Litt
er
14
Figure 2.4: Scatter plot of live stem density against water level
Principle component 3
Low Live stem density High Low Water level High
Principle component three describes a trend for points with higher live reed stem densities to have
higher water levels. This reflects the successional trend we would expect whereby reedbed that
dries up has sparser reed.
Principle component 4 represents a gradient of increasing percentage reed and increasing litter
depth. Points where reed made up a greater proportion of the vegetation tended to also have more
litter (as in principle component 2).
Figure 2.5: Scatter plot of proportion of vegetation that was reed, against litter depth
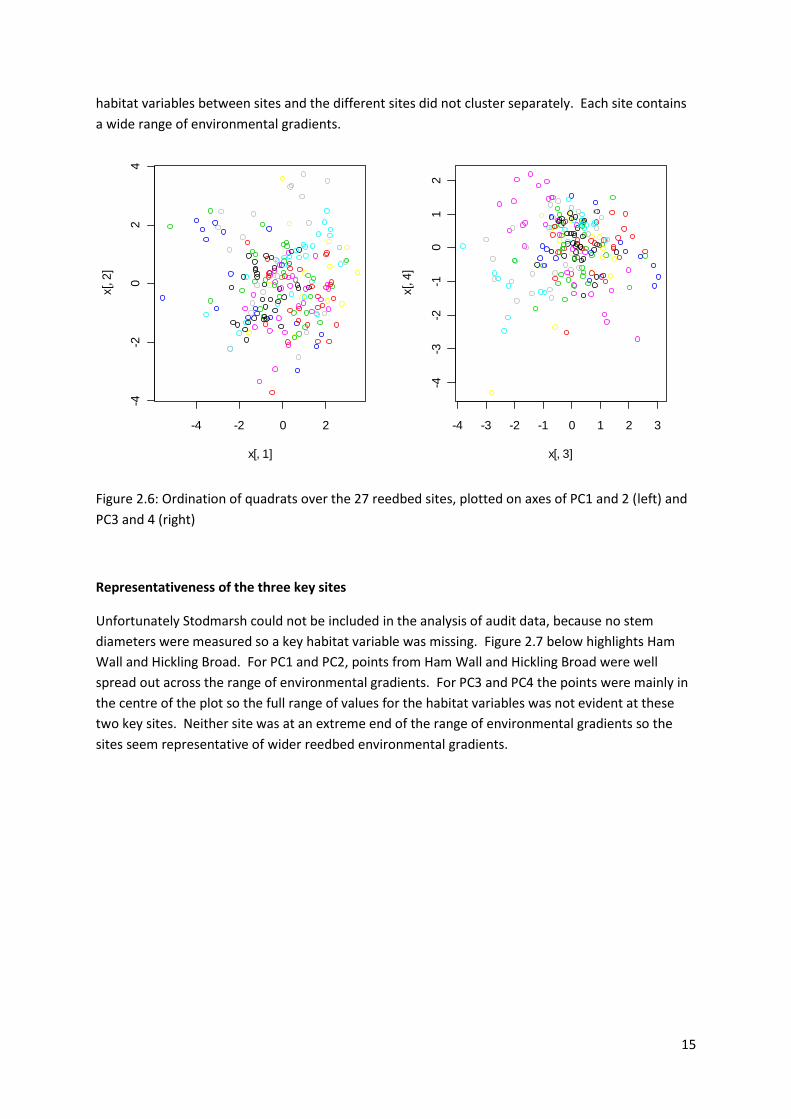
Ordination plots of audit data
The position of the 210 quadrats on these first four principle components is plotted in the
ordinations below. Points that cluster together on these diagrams have more similar habitat
variables. Figure 2.6 shows points coloured by site. There is plenty of overlap between values of
-100 -50 0 50 100 150
01
00
20
03
00
40
0
WL
Liv
e
50 60 70 80 90 100
01
02
03
04
0
Reed..
Litte
r
15
habitat variables between sites and the different sites did not cluster separately. Each site contains
a wide range of environmental gradients.
Figure 2.6: Ordination of quadrats over the 27 reedbed sites, plotted on axes of PC1 and 2 (left) and
PC3 and 4 (right)
Representativeness of the three key sites
Unfortunately Stodmarsh could not be included in the analysis of audit data, because no stem
diameters were measured so a key habitat variable was missing. Figure 2.7 below highlights Ham
Wall and Hickling Broad. For PC1 and PC2, points from Ham Wall and Hickling Broad were well
spread out across the range of environmental gradients. For PC3 and PC4 the points were mainly in
the centre of the plot so the full range of values for the habitat variables was not evident at these
two key sites. Neither site was at an extreme end of the range of environmental gradients so the
sites seem representative of wider reedbed environmental gradients.
-4 -2 0 2
-4-2
02
4
x[, 1]
x[, 2
]
-4 -3 -2 -1 0 1 2 3-4
-3-2
-10
12
x[, 3]
x[, 4
]
16
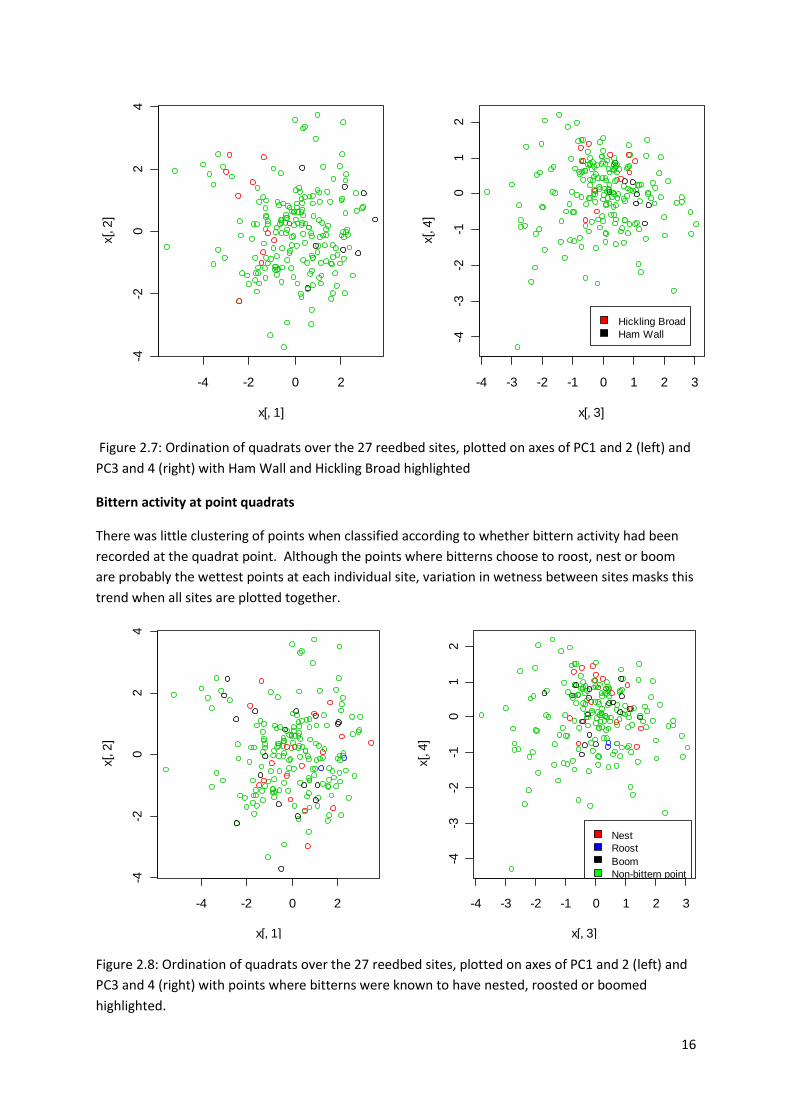
Figure 2.7: Ordination of quadrats over the 27 reedbed sites, plotted on axes of PC1 and 2 (left) and
PC3 and 4 (right) with Ham Wall and Hickling Broad highlighted
Bittern activity at point quadrats
There was little clustering of points when classified according to whether bittern activity had been
recorded at the quadrat point. Although the points where bitterns choose to roost, nest or boom
are probably the wettest points at each individual site, variation in wetness between sites masks this
trend when all sites are plotted together.
Figure 2.8: Ordination of quadrats over the 27 reedbed sites, plotted on axes of PC1 and 2 (left) and
PC3 and 4 (right) with points where bitterns were known to have nested, roosted or boomed
highlighted.
-4 -2 0 2
-4-2
02
4
x[, 1]
x[, 2
]
-4 -3 -2 -1 0 1 2 3
-4-3
-2-1
01
2
x[, 3]x[, 4
]
Hickling Broad
Ham Wall
-4 -2 0 2
-4-2
02
4
x[, 1]
x[, 2
]
-4 -3 -2 -1 0 1 2 3
-4-3
-2-1
01
2
x[, 3]
x[, 4
]
Nest
Roost
Boom
Non-bittern point
17
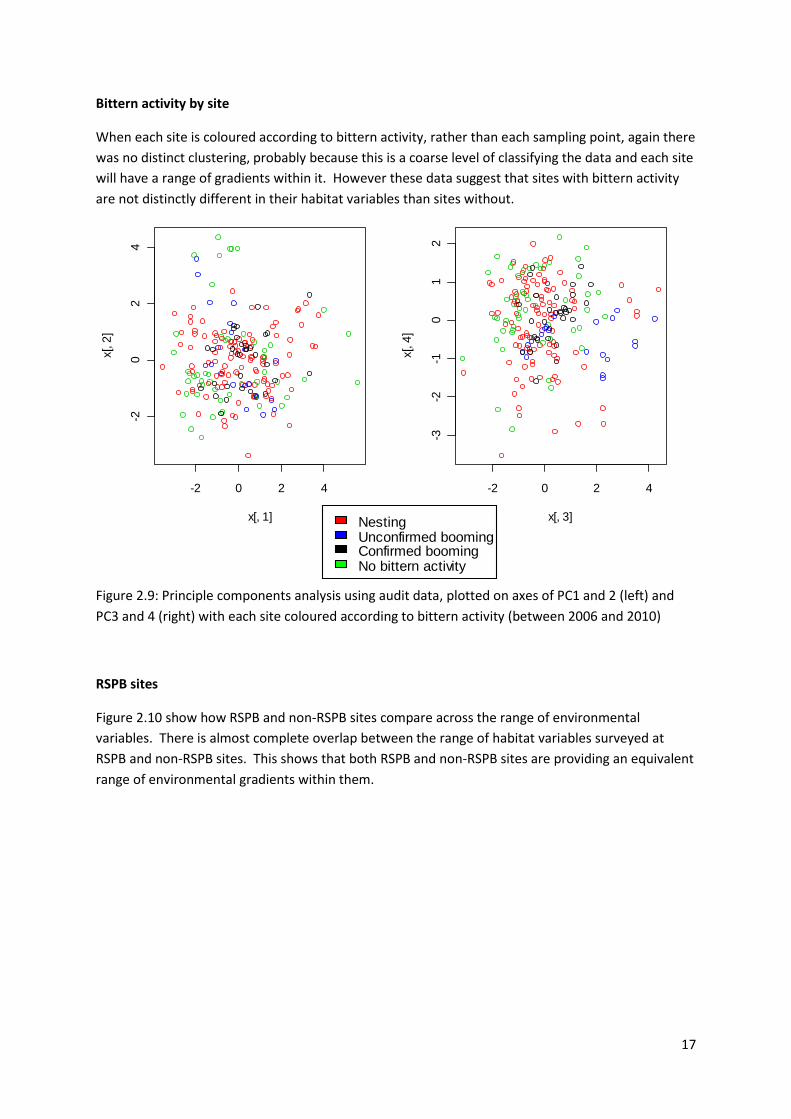
Bittern activity by site
When each site is coloured according to bittern activity, rather than each sampling point, again there
was no distinct clustering, probably because this is a coarse level of classifying the data and each site
will have a range of gradients within it. However these data suggest that sites with bittern activity
are not distinctly different in their habitat variables than sites without.
Figure 2.9: Principle components analysis using audit data, plotted on axes of PC1 and 2 (left) and
PC3 and 4 (right) with each site coloured according to bittern activity (between 2006 and 2010)
RSPB sites
Figure 2.10 show how RSPB and non-RSPB sites compare across the range of environmental
variables. There is almost complete overlap between the range of habitat variables surveyed at
RSPB and non-RSPB sites. This shows that both RSPB and non-RSPB sites are providing an equivalent
range of environmental gradients within them.
-2 0 2 4
-20
24
x[, 1]
x[, 2
]
-2 0 2 4
-3-2
-10
12
x[, 3]
x[, 4
]
-2 0 2 4
-20
24
x[, 1]
x[, 2
]
NestingUnconfirmed boomingConfirmed boomingNo bittern activity
18
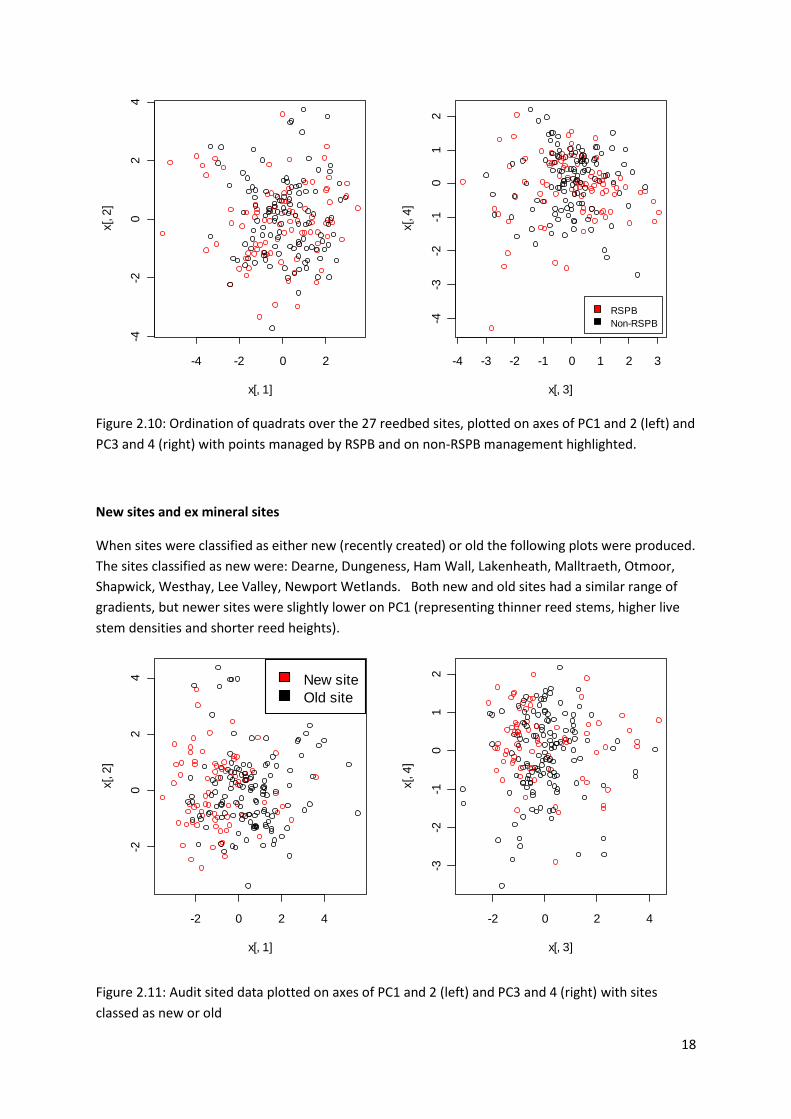
Figure 2.10: Ordination of quadrats over the 27 reedbed sites, plotted on axes of PC1 and 2 (left) and
PC3 and 4 (right) with points managed by RSPB and on non-RSPB management highlighted.
New sites and ex mineral sites
When sites were classified as either new (recently created) or old the following plots were produced.
The sites classified as new were: Dearne, Dungeness, Ham Wall, Lakenheath, Malltraeth, Otmoor,
Shapwick, Westhay, Lee Valley, Newport Wetlands. Both new and old sites had a similar range of
gradients, but newer sites were slightly lower on PC1 (representing thinner reed stems, higher live
stem densities and shorter reed heights).
Figure 2.11: Audit sited data plotted on axes of PC1 and 2 (left) and PC3 and 4 (right) with sites
classed as new or old
-4 -2 0 2
-4-2
02
4
x[, 1]
x[, 2
]
-4 -3 -2 -1 0 1 2 3
-4-3
-2-1
01
2
x[, 3]
x[, 4
]
RSPB
Non-RSPB
-2 0 2 4
-20
24
x[, 1]
x[, 2
]
-2 0 2 4
-3-2
-10
12
x[, 3]
x[, 4
]
New site
Old site
-2 0 2 4
-3-2
-10
12
x[, 3]
x[, 4
]
New site
Old site
19
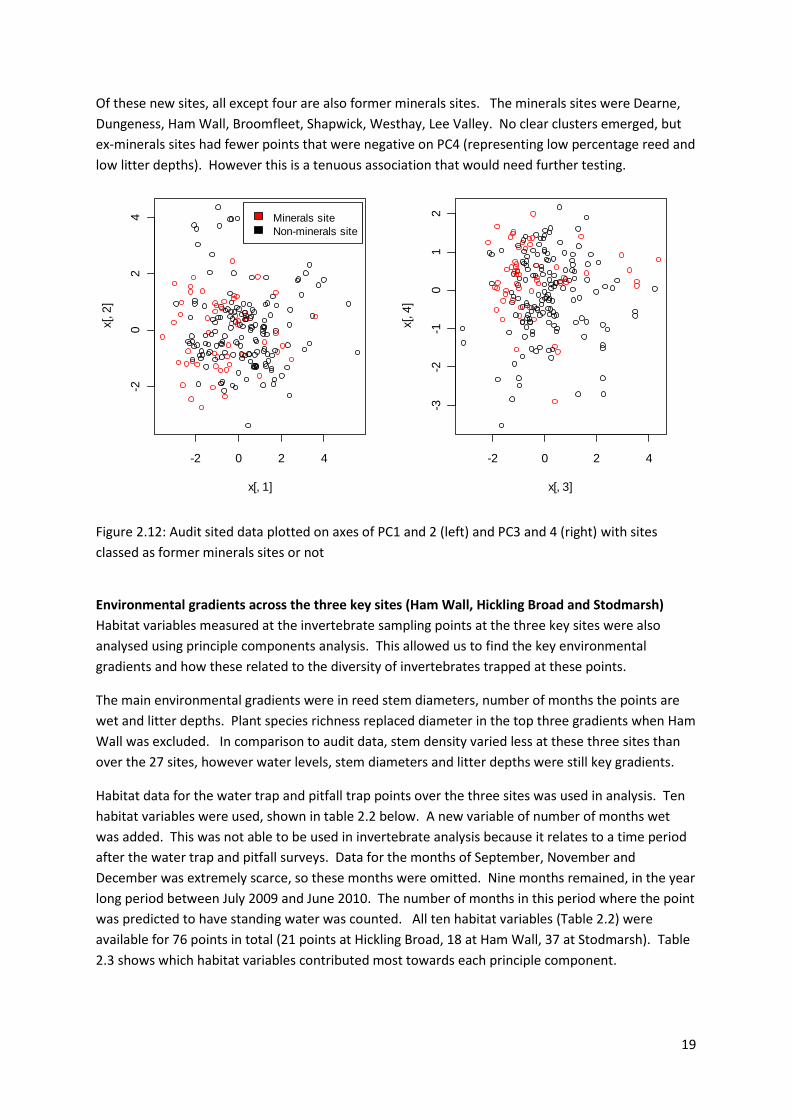
Of these new sites, all except four are also former minerals sites. The minerals sites were Dearne,
Dungeness, Ham Wall, Broomfleet, Shapwick, Westhay, Lee Valley. No clear clusters emerged, but
ex-minerals sites had fewer points that were negative on PC4 (representing low percentage reed and
low litter depths). However this is a tenuous association that would need further testing.
Figure 2.12: Audit sited data plotted on axes of PC1 and 2 (left) and PC3 and 4 (right) with sites
classed as former minerals sites or not
Environmental gradients across the three key sites (Ham Wall, Hickling Broad and Stodmarsh)
Habitat variables measured at the invertebrate sampling points at the three key sites were also
analysed using principle components analysis. This allowed us to find the key environmental
gradients and how these related to the diversity of invertebrates trapped at these points.
The main environmental gradients were in reed stem diameters, number of months the points are
wet and litter depths. Plant species richness replaced diameter in the top three gradients when Ham
Wall was excluded. In comparison to audit data, stem density varied less at these three sites than
over the 27 sites, however water levels, stem diameters and litter depths were still key gradients.
Habitat data for the water trap and pitfall trap points over the three sites was used in analysis. Ten
habitat variables were used, shown in table 2.2 below. A new variable of number of months wet
was added. This was not able to be used in invertebrate analysis because it relates to a time period
after the water trap and pitfall surveys. Data for the months of September, November and
December was extremely scarce, so these months were omitted. Nine months remained, in the year
long period between July 2009 and June 2010. The number of months in this period where the point
was predicted to have standing water was counted. All ten habitat variables (Table 2.2) were
available for 76 points in total (21 points at Hickling Broad, 18 at Ham Wall, 37 at Stodmarsh). Table
2.3 shows which habitat variables contributed most towards each principle component.
-2 0 2 4
-20
24
x[, 1]
x[, 2
]
-2 0 2 4
-3-2
-10
12
x[, 3]
x[, 4
]
-2 0 2 4
-3-2
-10
12
x[, 3]
x[, 4
]
Minerals site
Non-minerals site
20
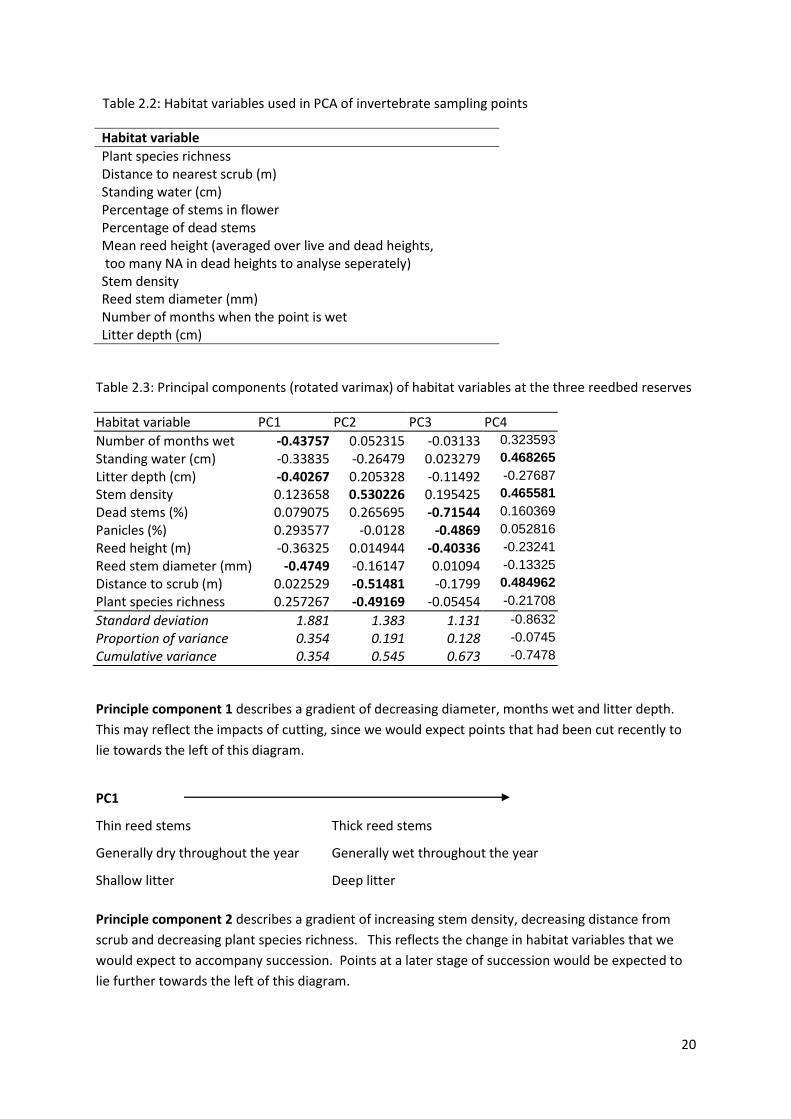
Table 2.2: Habitat variables used in PCA of invertebrate sampling points
Habitat variable
Plant species richness Distance to nearest scrub (m) Standing water (cm) Percentage of stems in flower Percentage of dead stems Mean reed height (averaged over live and dead heights, too many NA in dead heights to analyse seperately) Stem density Reed stem diameter (mm) Number of months when the point is wet Litter depth (cm)
Table 2.3: Principal components (rotated varimax) of habitat variables at the three reedbed reserves
Habitat variable PC1 PC2 PC3 PC4
Number of months wet -0.43757 0.052315 -0.03133 0.323593
Standing water (cm) -0.33835 -0.26479 0.023279 0.468265
Litter depth (cm) -0.40267 0.205328 -0.11492 -0.27687
Stem density 0.123658 0.530226 0.195425 0.465581
Dead stems (%) 0.079075 0.265695 -0.71544 0.160369
Panicles (%) 0.293577 -0.0128 -0.4869 0.052816
Reed height (m) -0.36325 0.014944 -0.40336 -0.23241
Reed stem diameter (mm) -0.4749 -0.16147 0.01094 -0.13325
Distance to scrub (m) 0.022529 -0.51481 -0.1799 0.484962
Plant species richness 0.257267 -0.49169 -0.05454 -0.21708
Standard deviation 1.881 1.383 1.131 -0.8632
Proportion of variance 0.354 0.191 0.128 -0.0745
Cumulative variance 0.354 0.545 0.673 -0.7478
Principle component 1 describes a gradient of decreasing diameter, months wet and litter depth.
This may reflect the impacts of cutting, since we would expect points that had been cut recently to
lie towards the left of this diagram.
Principle component 2 describes a gradient of increasing stem density, decreasing distance from
scrub and decreasing plant species richness. This reflects the change in habitat variables that we
would expect to accompany succession. Points at a later stage of succession would be expected to
lie further towards the left of this diagram.
PC1
Thin reed stems Thick reed stems
Generally dry throughout the year Generally wet throughout the year
Shallow litter Deep litter
21
-4 -2 0 2
-2-1
01
2
x[, 1]
x[, 2
]
HB
HW
SM
-4 -2 0 2
-2-1
01
2
x[, 1]
x[, 2
]
Principle component 3 describes a gradient of decreasing percentage of dead stems, decreasing
percentage of panicles and decreasing mean height. This reflects the change we would expect from
cutting/burning which would make reed shorter with less dead stems. Depending on the time of
year of sampling, panicles may only be present on last years reed (dead stems) so when dead stems
decrease along the gradient, so do panicles.
Principle component 4 describes a gradient of increasing level of standing water, increasing stem
density and increasing distance from scrub. This reflects what we would expect along a gradient of
succession, with early successional habitat having more water, dense stems and being far from
scrub.
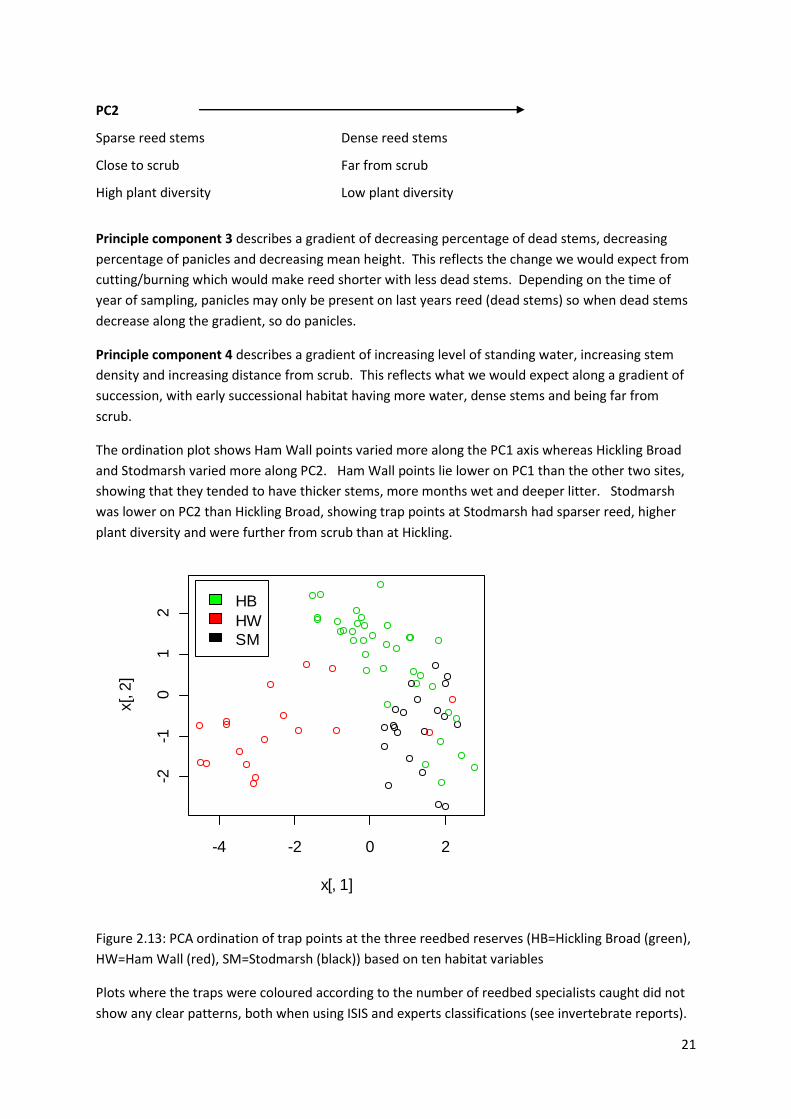
The ordination plot shows Ham Wall points varied more along the PC1 axis whereas Hickling Broad
and Stodmarsh varied more along PC2. Ham Wall points lie lower on PC1 than the other two sites,
showing that they tended to have thicker stems, more months wet and deeper litter. Stodmarsh
was lower on PC2 than Hickling Broad, showing trap points at Stodmarsh had sparser reed, higher
plant diversity and were further from scrub than at Hickling.
Figure 2.13: PCA ordination of trap points at the three reedbed reserves (HB=Hickling Broad (green),
HW=Ham Wall (red), SM=Stodmarsh (black)) based on ten habitat variables
Plots where the traps were coloured according to the number of reedbed specialists caught did not
show any clear patterns, both when using ISIS and experts classifications (see invertebrate reports).
PC2
Sparse reed stems Dense reed stems
Close to scrub Far from scrub
High plant diversity Low plant diversity
22
-2 0 2 4
-2-1
01
2
x[, 1]
x[, 2
]
Conservation score
Zero
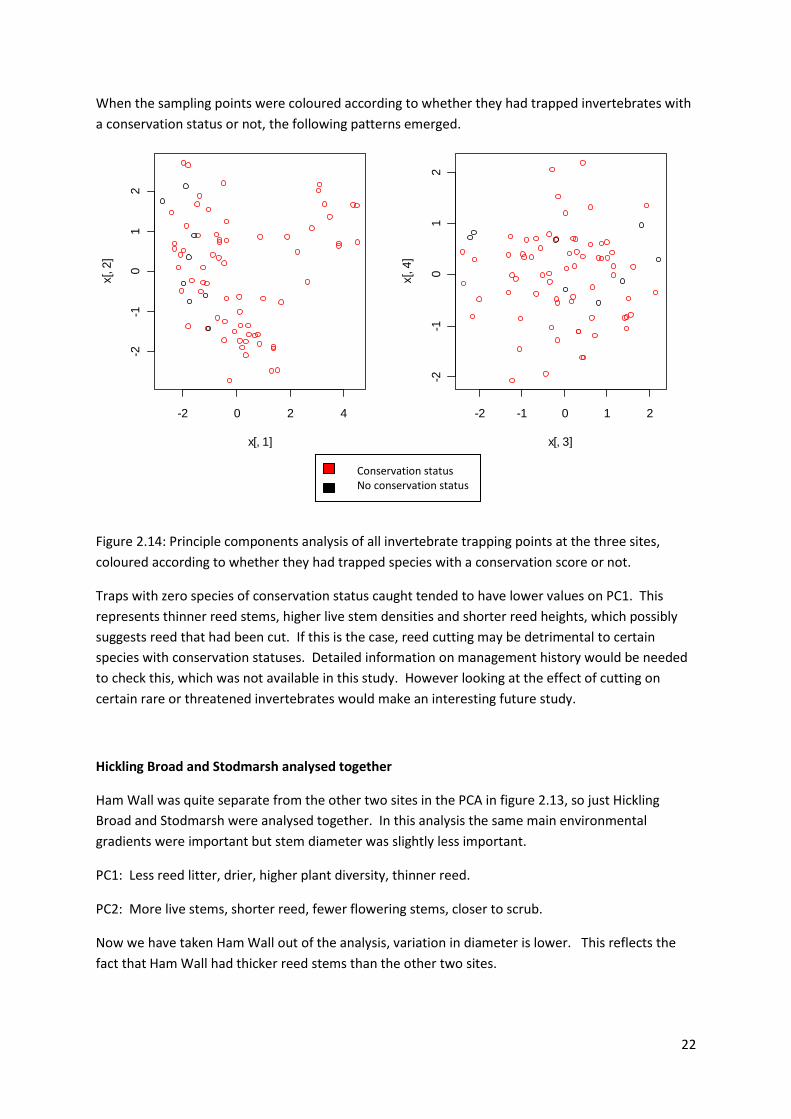
When the sampling points were coloured according to whether they had trapped invertebrates with
a conservation status or not, the following patterns emerged.
Figure 2.14: Principle components analysis of all invertebrate trapping points at the three sites,
coloured according to whether they had trapped species with a conservation score or not.
Traps with zero species of conservation status caught tended to have lower values on PC1. This
represents thinner reed stems, higher live stem densities and shorter reed heights, which possibly
suggests reed that had been cut. If this is the case, reed cutting may be detrimental to certain
species with conservation statuses. Detailed information on management history would be needed
to check this, which was not available in this study. However looking at the effect of cutting on
certain rare or threatened invertebrates would make an interesting future study.
Hickling Broad and Stodmarsh analysed together
Ham Wall was quite separate from the other two sites in the PCA in figure 2.13, so just Hickling
Broad and Stodmarsh were analysed together. In this analysis the same main environmental
gradients were important but stem diameter was slightly less important.
PC1: Less reed litter, drier, higher plant diversity, thinner reed.
PC2: More live stems, shorter reed, fewer flowering stems, closer to scrub.
Now we have taken Ham Wall out of the analysis, variation in diameter is lower. This reflects the
fact that Ham Wall had thicker reed stems than the other two sites.
-2 0 2 4
-2-1
01
2
x[, 1]
x[, 2
]
-2 -1 0 1 2
-2-1
01
2x[, 3]
x[, 4
]
Conservation status No conservation status
23
Conclusion
The major environmental gradients in reedbeds depend on the sites surveyed, where sampling
points are placed, and what habitat variables are measured. By looking at 210 quadrats across 27
sites, we have a large sample size. The data showed that reed attributes affected by cutting regimes
(reed heights, stem densities, stem diameters, litter levels, water levels) varied most between
points. Effects of natural succession were also seen.
When the three invertebrate sampling sites (76 points in total) were analysed, water levels, stem
diameters and litter depths were still key gradients, however stem densities were less variable.
Analysing the three invertebrate sites revealed Ham Wall to be most different to the other sites.
Being a new reedbed reserve in the SW , Ham Wall has slightly different environmental gradients to
the older reedbeds in the SE.
This analysis did not include certain habitat variables that are likely to be key environmental
gradients within reedbeds, such as oxygen levels, soil type and salinity, so further work on these
variables is recommended.