Embed Size (px)
Citation preview
I_, J
"1WR-181 68
RSRM Nozzle Actuator Bracket/
Lug Fracture MechanicsQualification Test Final Report
July 1993OcO
Prepared for o
National Aeronautics and Space Administration _' -_ _George C. Marshall Space Flight Center 0. c ._Marshall Space Flight Center, Alabama 35812
Contract No. NAS8-30490DR No. 5-3WBS No. HQ301 05 07ECS No. SS1253
____b_ CORPORA TION
SPACE OPERATIONS
PO Box 707, Brigham City, UT 84302-0707 (801)863-3511
Publication= No. 920819
0
https://ntrs.nasa.gov/search.jsp?R=19940012607 2018-05-30T19:44:44+00:00Z
_l'__l_ CORPORA T/ON
SPACE OPERATIONS
TWR-18168
RSRM Nozzle Actuator Bracket/
Lug Fracture Mechanics Qualification
Test Final Report
Prepared by:
• #r PeggyaKelley
Systems Planning and Interfaces
D. E. Campbell
Systems Plan>ning & Interfaces j
Project Engineering
Approved by:
T. Nhan
Structural Analysis
RSRM Fracture Control
Technical Subcommittee
F. Duersch " G.E. Paul -
Systems Assurance Requirements and Verifications
!
-'_, ///
; Data Management/ReleaseECS No. SS1253
T_ CORPORA TION
SPACE OPERATIONS
CONTENTS
Section
6
INTRODUCTION ...................................... 1
TEST OBJECTIVES ..................................... 2
EXECUTIVE SUMMARY ................................. 3
3.1
3.2
3.2.1
3.2.2
3.3
SUMMARY .................................... 3
CONCLUSIONS .................................. 3
Phase 1 Conclusions ............................... 3
Phase 2 Conclusions ............................... 4
RECOMMENDATIONS ............................. 4
INSTRUMENTATION ................................... 7
PHOTOGRAPHY ....................................... 7
TEST ITEM DESCRIPTION ................................ 8
6.1 PHASE 1 TESTING ............................... 8
6.2 PHASE 2 TESTING ............................... 8
RESULTS AND DISCUSSION .............................. 14
7.1 PHASE 1 ...................................... 14
7.1.1 Analytical Model ................................. 14
7.1.2 Critical Loads ................................... 14
7.2 PHASE 2 ...................................... 22
APPLICABLE DOCUMENTS ............................... 25
Attachments
A Thiokol Memos L633-FY93-M112-Rev A and L711-FY93-M348 ......... A-I
B NASA Memo SA51(192-90): Actuator Bracket Gracture Mechanics Testing . . B-1
9208t9-1.# ii TWR-18168
T_._--_ CORPORA flO N
SPA CE OPERA TIONS
FIGURES
1
2
3
4
5
6
7
8
9
10
11
12
13
14
15
Pa e
Phase 1 Testing Results ................................... 4
Specimen 2-1 Starter Notch Location ........................... 5
Specimen 2-2 Starter Notch Location ........................... 6
Square Lug Model/Test Specimen Geometry and Dimensions ............ 9
Comparison of Analytical Model to Actuator Bracket ................. 10
Phase 1 Test Specimen .................................... 11
Phase 1 Test Fixture ..................................... 12
Phase 2 Test Specimen and Configuration ........................ 13
Comparison of Failure Load Versus Crack Area .................... 17
Phase 1 Post-test, Specimen
Phase 1 Post-test, Specimen
Phase 1 Post-test, Specimen
Phase 1 Post-test, Specimen
Phase 1 Post-test, Specimen
Phase 1 Post-test, Spec,men
1 ............................... 19
2 ............................... 20
3 ............................... 21
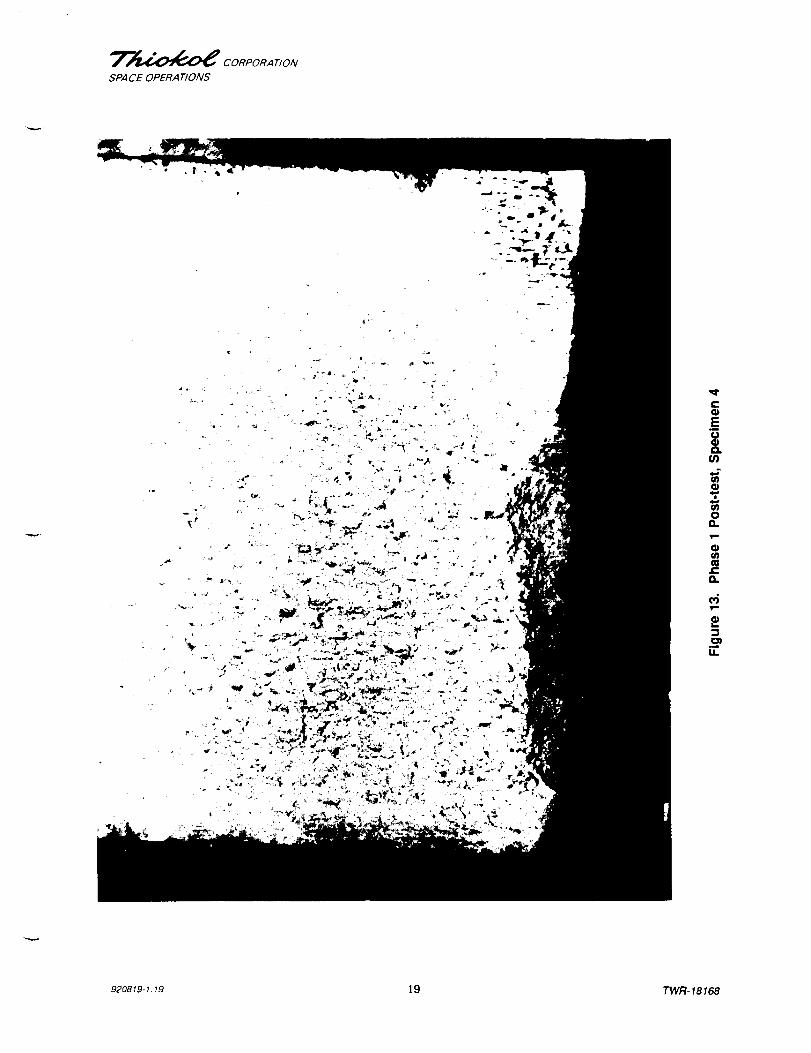
4 ............................... 22
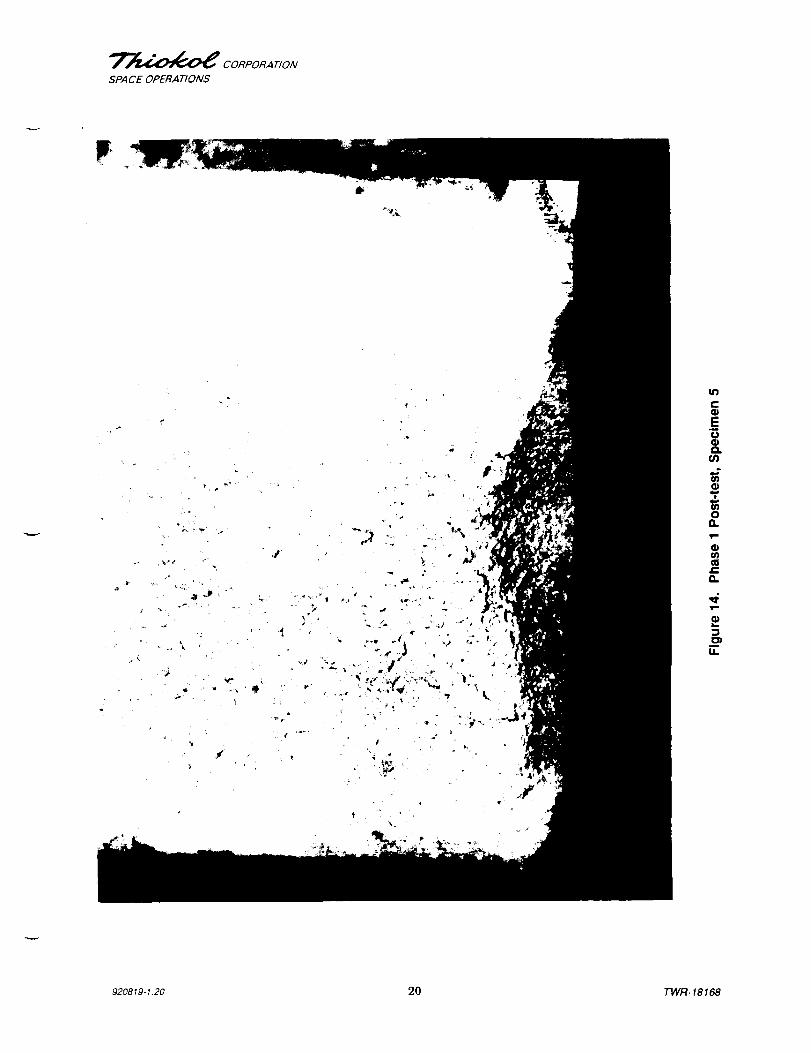
5 ............................... 23
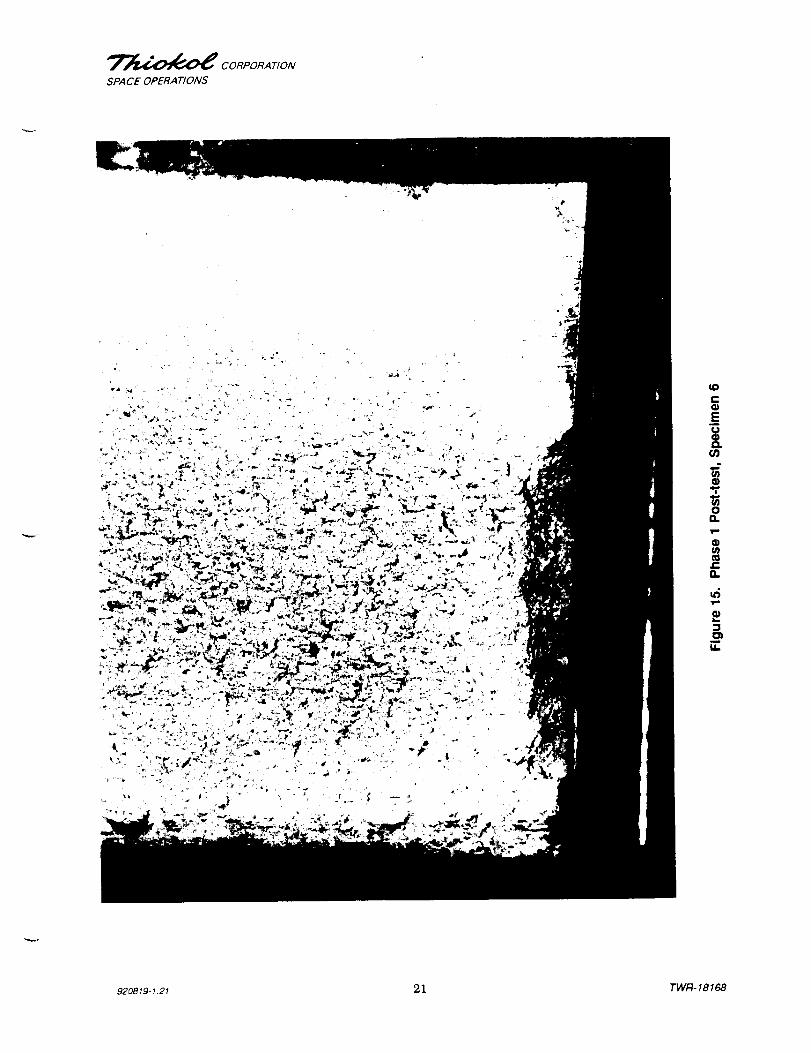
6 ............................... 24
TABLES
Table
Flight Load Spectrum .................................... 23
920819-I.iii iii TVVR-18168
__ CORPORA T/ON
SPA CE OPERA TIONS
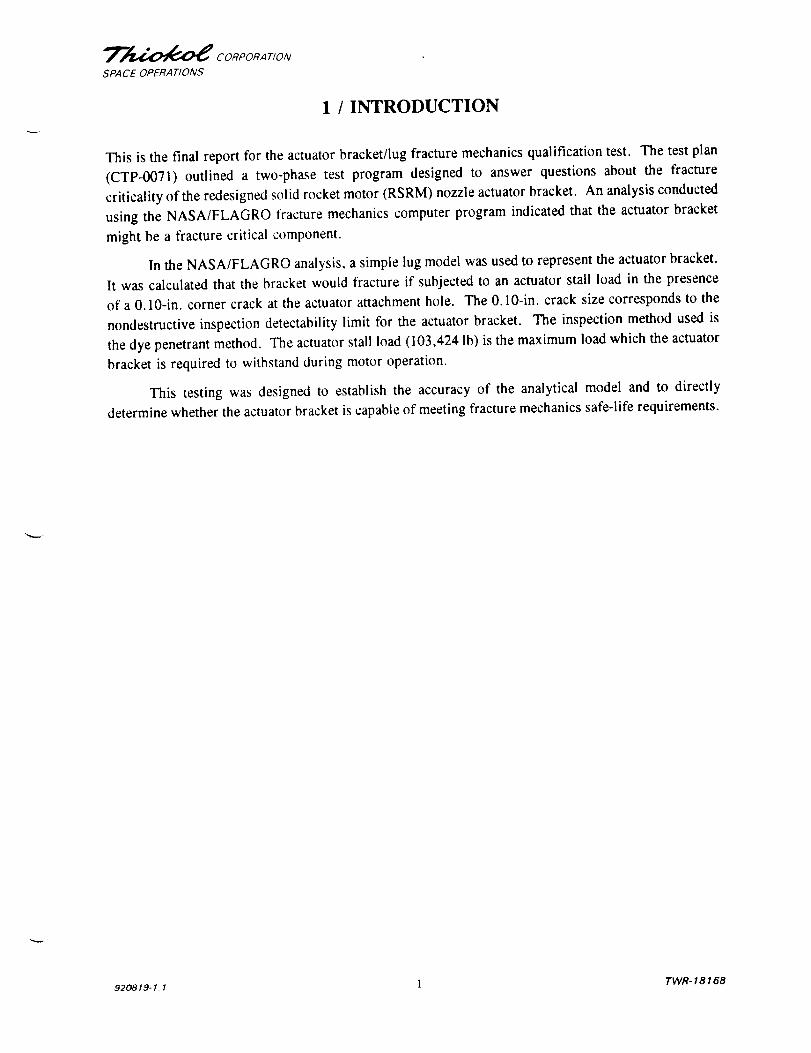
1 / INTRODUCTION
This is the final report for the actuator bracket/lug fracture mechanics qualification test. The test plan
(CTP-0071) outlined a two-phase test program designed to answer questions about the fracture
criticality of the redesigned solid rocket motor (RSRM) nozzle actuator bracket. An analysis conducted
using the NASA/FLAGRO fracture mechanics computer program indicated that the actuator bracket
might be a fracture critical component.
In the NASA/FLAGRO analysis, a simple lug model was used to represent the actuator bracket.
It was calculated that the bracket would fracture if subjected to an actuator stall load in the presence
of a 0.10-in. corner crack at the actuator attachment hole. The 0.10-in. crack size corresponds to the
nondestructive inspection detectability limit for the actuator bracket. The inspection method used is
the dye penetrant method. The actuator stall load (103,424 Ib) is the maximum load which the actuator
bracket is required to withstand during motor operation.
This testing was designed to establish the accuracy of the analytical model and to directly
determine whether the actuator bracket is capable of meeting fracture mechanics safe-life requirements.
920819-1. t 1 TWR-18168
T_ CORPORATION
SPACE OPERAT/ONS
2 / TEST OBJECTIVES
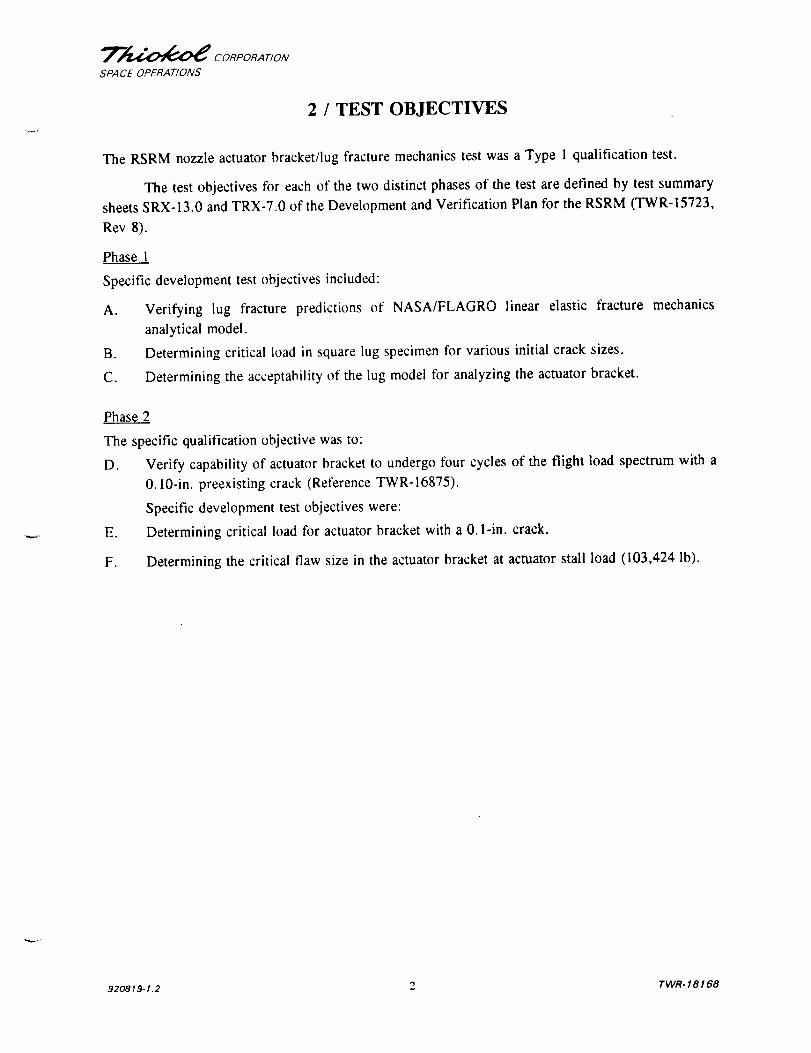
The RSRM nozzle actuator bracket/lug fracture mechanics test was a Type 1 qualification test.
The test objectives for each of the two distinct phases of the test are defined by test summary
sheets SRX-13.0 and TRX-7.0 of the Development and Verification Plan for the RSRM (TWR-15723,
Rev 8).
Phase 1
Specific development test objectives included:
A.
B.
C.
Verifying lug fracture predictions of NASA/FLAGRO linear elastic fracture
analytical model.
Determining critical load in square lug specimen for various initial crack sizes.
Determining the acceptability of the lug model for analyzing the actuator bracket.
mechanics
Phase 2
The specific qualification objective was to:
D. Verify capability of actuator bracket to undergo four cycles of the flight load spectrum with a
0.10-in. preexisting crack (Reference TWR-16875).
Specific development test objectives were:
E. Determining critical load for actuator bracket with a 0.1-in. crack.
F. Determining the critical flaw size in the actuator bracket at actuator stall load (103,424 Ib).
TWR-18168920819-1.2
_-__--4_ CORPORA T/ON
SPACE OPERATIONS
3 / EXECUTIVE SUMMARY
3.1 SUMMARY
CTP-0071, released 25 July 1988, outlined a two-phase test program designed to answer
questions about the suspected fracture criticality of the RSRM nozzle actuator bracket. The
need for this testing became apparent after performing a fracture mechanics analysis of the
actuator bracket. The analysis showed that with a preexisting crack of 0.10 in., the bracket
would fail on the first occurrence of actuator stall load. This size of crack is equal to the
detectability limit of the dye penetrant method used for inspection of the bracket.
It was not known how well the analytical model represented real actuator bracket
behavior. The decision was made to perform the necessary tests to answer this question. It
was also decided to design the testing in such a way as to directly verify the ability of the
actuator bracket to meet the requirements regarding fatigue crack growth.
Phase 1 of the testing addressed the accuracy of the analytical model. The test
specimen was a pin-loaded square lug designed to represent the analytical model. Test
results showed that the analytical model was conservative by a factor of 2.0 to 3.0 for
predicting failure loads in the crack size range of interest. For crack sizes ranging from
0.075- to 0.2-in. surface length, the experimental failure loads ranged from 157,400 to 119,000
lb, respectively (Figure 1). The analytical predictions ranged from 64,000 to 41,000 lb,
respectively.
Certification of the actuator bracket's fracture mechanics safe-life requirements was
conducted in Phase 2 of testing.
Four Phase 2 tests were planned, but only two were completed before a test fLxture
failure prompted the cancellation of the remaining tests. The two successful tests, using
flight-configured actuator brackets (Drawing No. 1U51242), demonstrated compliance with
the fracture mechanics safe-life requirements. Actuator bracket (Drawing No. 1U75643) was
not tested, however, the difference in the configuration of the two brackets does not have a
structural impact on the test results. Both brackets are qualified. The tests verified that the
bracket could withstand four cyclings of the flight load spectrum while having a preexisting
0.11-in. crack at the suspected critical location. Tests included actuator stall loads.
3.2 CONCLUSIONS
3.2.1 Phase 1 Conclusions
Test Objective
Verify lug fracture predictions ofNASA/FLAGRO linear elastic fracture me-
chanics analytical model.
Conclusion
Verified. Analytical model is conservative
by a factor of 2.0 to 3.0 critical load for thecrack size range of interest.
Determine critical load in square lug speci-men for various initial crack sizes.
Determined. Results listed in Figure 1.
Determine the acceptability of the lug
model for analyzing the actuator bracket.
Determined. The lug model is not accept-able for analysis when linear elastic as-
sumptions are violated. Results are con-servative by a factor of 2.0 to 3.0 criticalload.
920819-1.3 3 TWR-18168
_"_ CORPORAT/ON
SPACE OPERAT/ONS
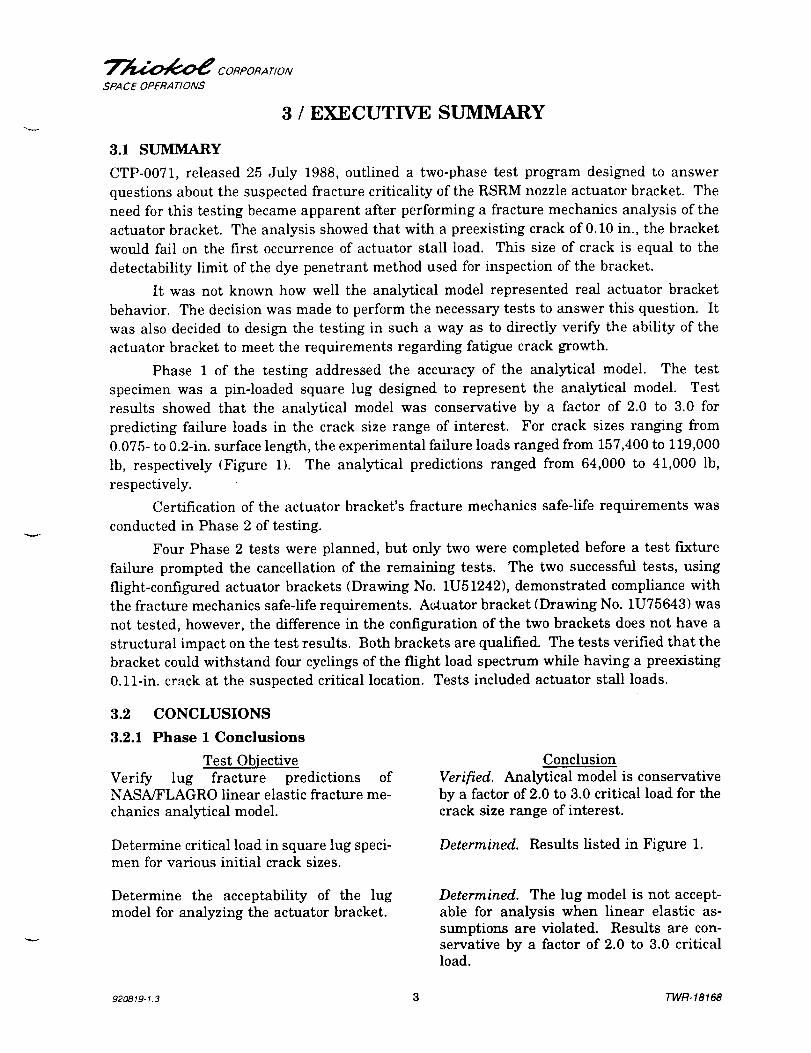
Top View
,/i
i
i
aI "
c
Crack
3.2.2
Specimen c (in.)
0.0750.0750.0900.1950.1000.215
a (in.)
0.0950.0900.1150.2700.1550.315
Failure Load(Ib)
157,387158,089153,088119,089146,975126,006
A038272a
Figure 1.
Phase 2 Conclusions
Test Objective
Verify capability of actuator bracket to undergo
four cycles of the flight load spectrum with a
0.10 by 0.10-in. radius preexisting cornercrack.
Phase 1 Testing Results
Conclusion
Verified. Test specimen 2-1 (Figure 2) sur-
vived four cycles of a load spectrum equivalent
to flight load spectrum (reference Attachment
A) and afterwards did not fail under a staticload of 237,000 lb. Pre-cracking loads applied
to test specimen 2-2 (Figure 3) did not produce
fatigue crack initiation at the starter notch.
Testing was not continued for this specimen.
Determine the critical load for the actuator
bracket with a 0.10 by 0.10-in. crack.
Test was cancelled per NASA memo SA51(192
-90) due to test fixture failure (Attachment B).
Determine the critical flaw size in the actuator
bracket at the actuator stall load (103,424 Ib).Test was cancelled per NASA memo SA51(192
-90) due to test fixture failure (Attachment B).
3.3 RECOMMENDATIONS
Test results of this test verify that the actuator bracket is qualified to undergo four cycles of the flight
load spectrum with a 0.10 by 0.10-in. radius preexisting corner crack.
It is recommended that the assumptions of linear elastic fracture mechanics be checked for
validity when using the NASA/FLAGRO model. It is also recommended that the results obtained using
the NASA/FLAGRO model be validated by testing and additional analysis techniques.
920819-I.4 4 TWR-I8168
_P'__--_ CORPORATION
SPACE OPERATIONS
X
]
X
X
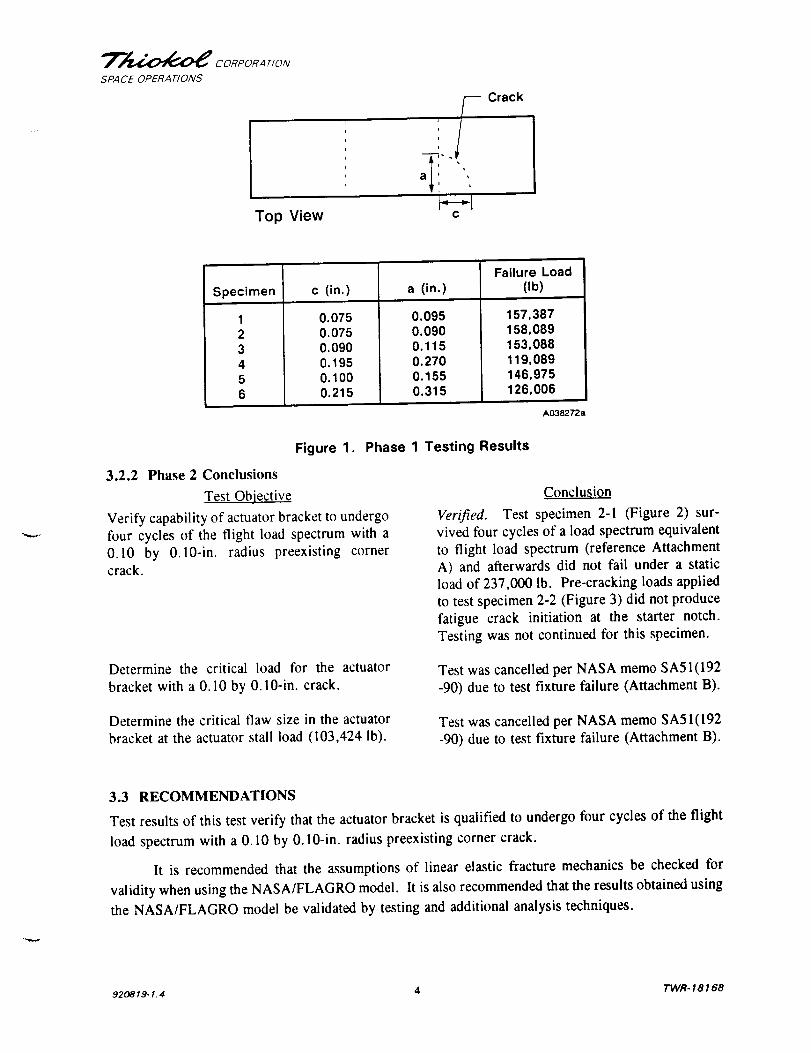
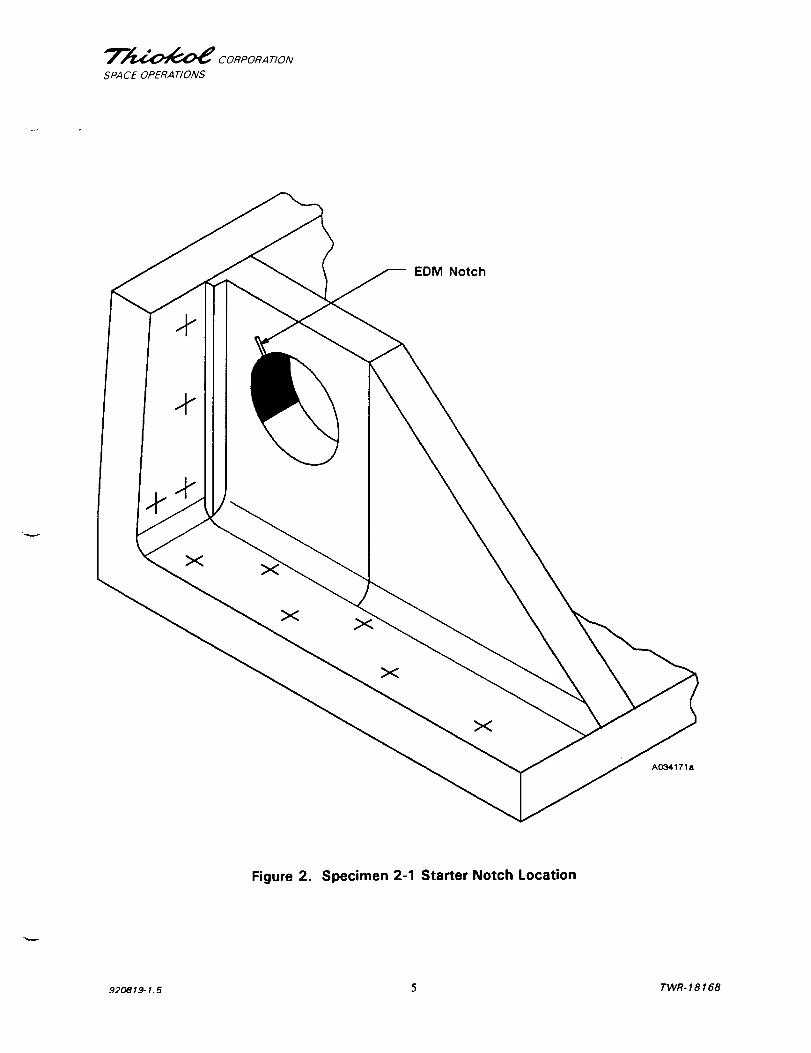
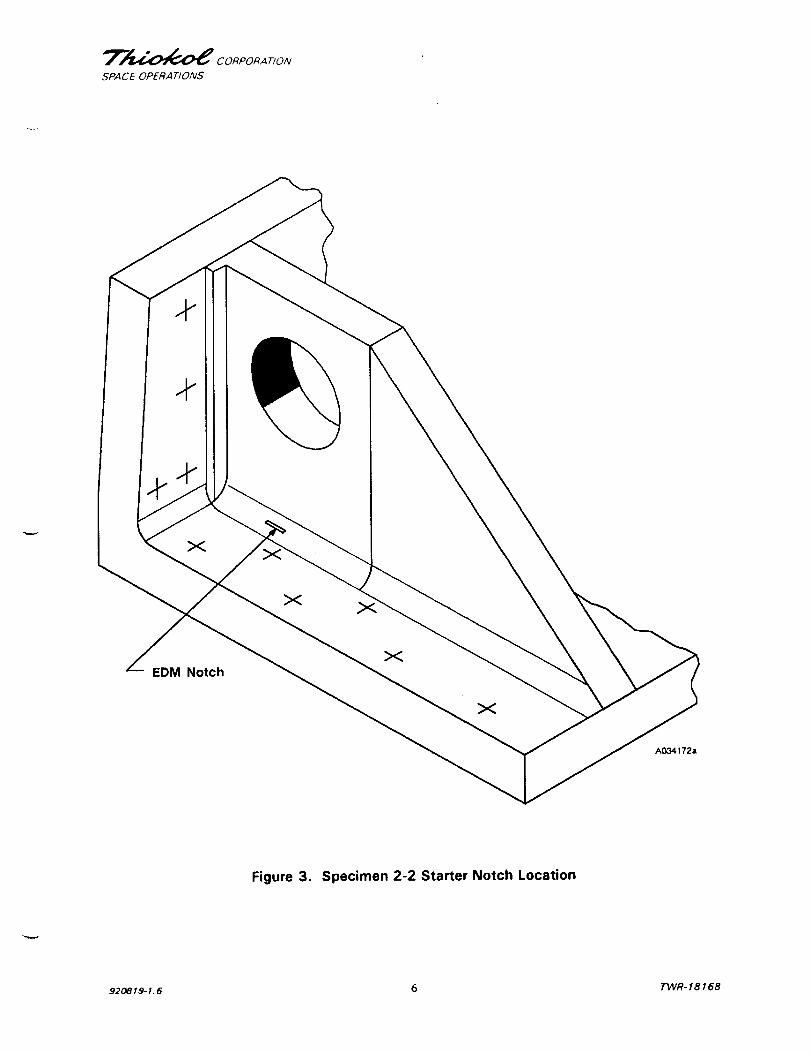
EDM Notch
X
A034171a
Figure 2. Specimen 2-1 Starter Notch Location
920819-1.5 5 TWR-18168
_m._ CORPORA T/ON
SPACE OPERATIONS
X
X
X
A034172a
Figure 3. Specimen 2-2 Starter Notch Location
920819-1.6 6 TWR-18168
T_-_--_ CORPORATION
SPA CE OPERA T/ONS
4 / INSTRUMENTATION
Instrumentation measurements for Phases 1 and 2 consisted of:
A. Applied load
B. Displacement
C. Crack length
D. Number of loading cycles
E. Strain
Load cells were used for both cyclic and static loading measurements. Displacement
measurements were made using the testing machine's ability to measure crosshead displacement. Strain
measurements were taken with strain gages bonded to test specimens 2-1 and 2-4. Crack surface length
was measured with an optical microscope.
5 / PHOTOGRAPHY
Still black and white photographs of the test specimens were taken. Copies of the photographs (Series
No. 117798) are available from the Thiokol Corporation Photographic Services department.
920819-1.7 7 TWR-18168
_ CORPORATION
SPACE OPERATIONS
6 / TEST ITEM DESCRIPTION
Testing was conducted in two phases. In Phase 1 six square lug specimens, constructed
of 1.0-in. thick 7075-T73 rolled aluminum plate, were tested. Phase 2 test specimens were
flight-configured actuator brackets (Drawing No. 1U51242). The bracket was machined
from a single rough forging of 7075-T7351 aluminum.
To facilitate fatigue crack initiation in the desired location, starter notches were cut
in the specimens using an electrical discharge machining (EDM) process. Fatigue cracks
were induced by cyclically loading the test specimens. The loads used to initiate and grow
the fatigue cracks prior to testing (precracking loads) were determined in accordance with
ASTM-E399-83. After precracking, each specimen was statically loaded to failure. The
peak load and a load versus crosshead displacement curve was recorded during the failure
loading.
The difference between the minimum flight temperature of 65°F for the actuator
bracket area and the ambient test environment is insignificant.
6.1 PHASE 1 TESTING
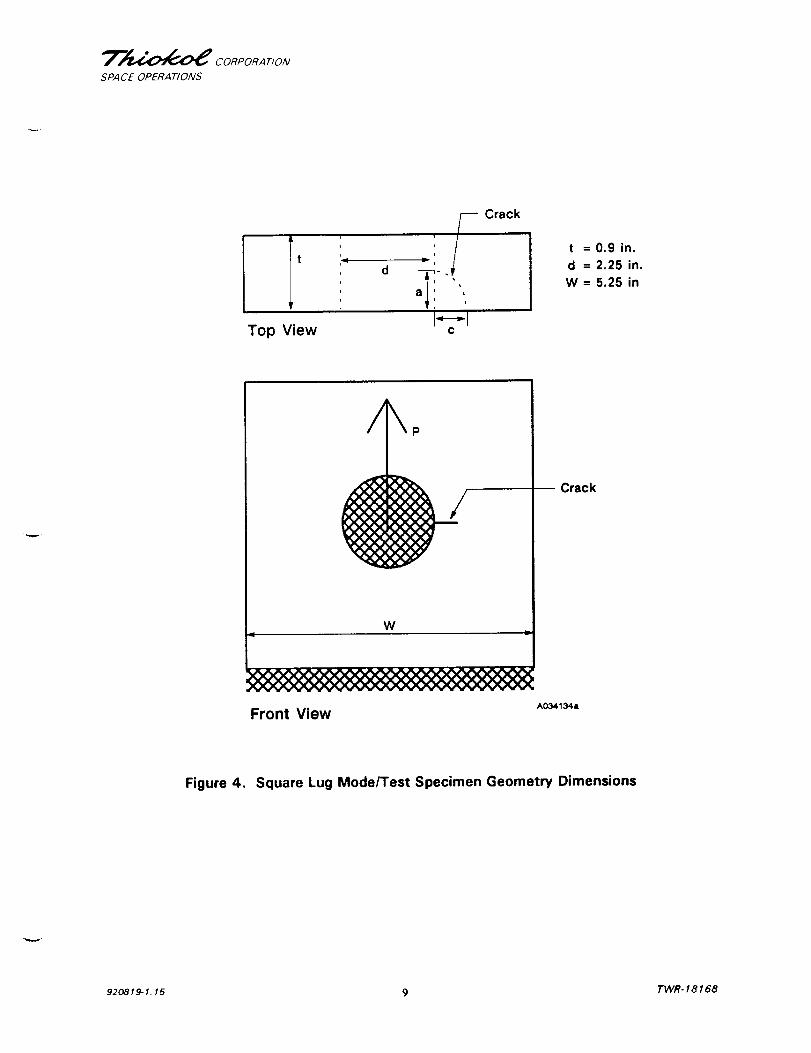
Phase I investigated the accuracy of the NASA/FLAGRO pin-loaded lug fracture mechanics
model. The test specimens were designed to duplicate the analytical model. Figure 4
illustrates the configuration of the NASA/FLAGRO model.
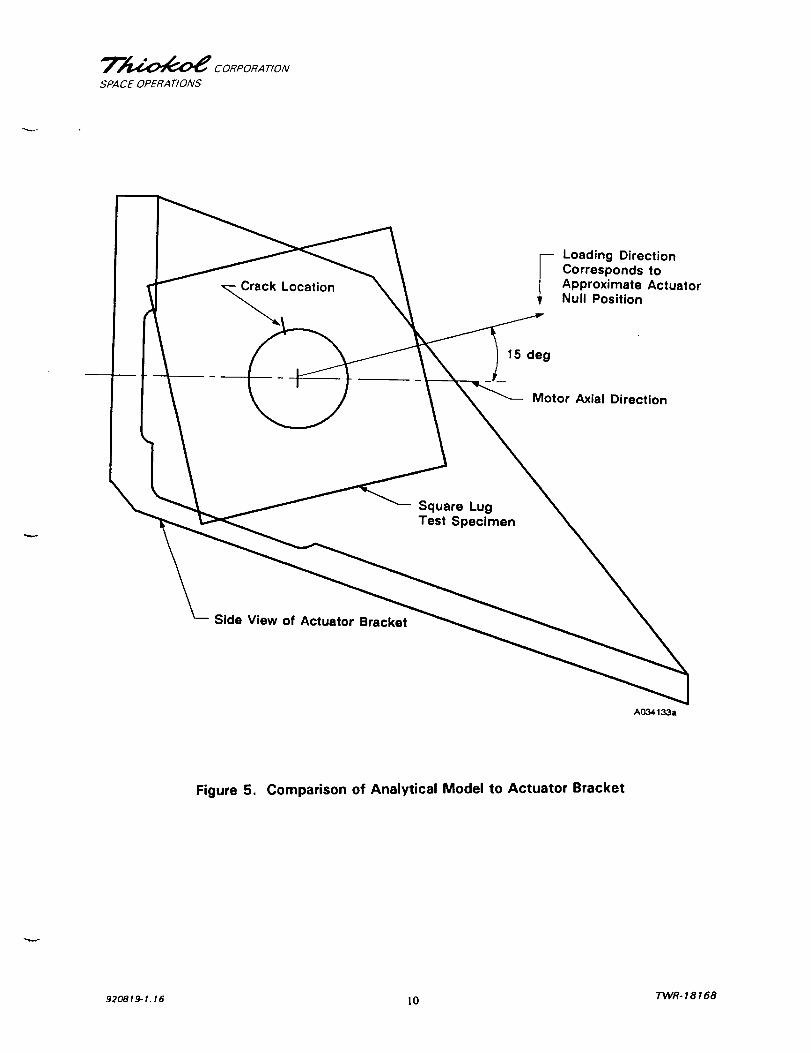
The model consisted of a square lug, pin-loaded through the central hole. A corner
crack existed at the corner of the pin-loaded hole in the plane normal to the loading
direction. The dimensions shown in Figure 4 were chosen to represent actuator bracket
behavior using a simple square lug model. Figure 5 illustrates how the square lug model
relates to the real actuator bracket.
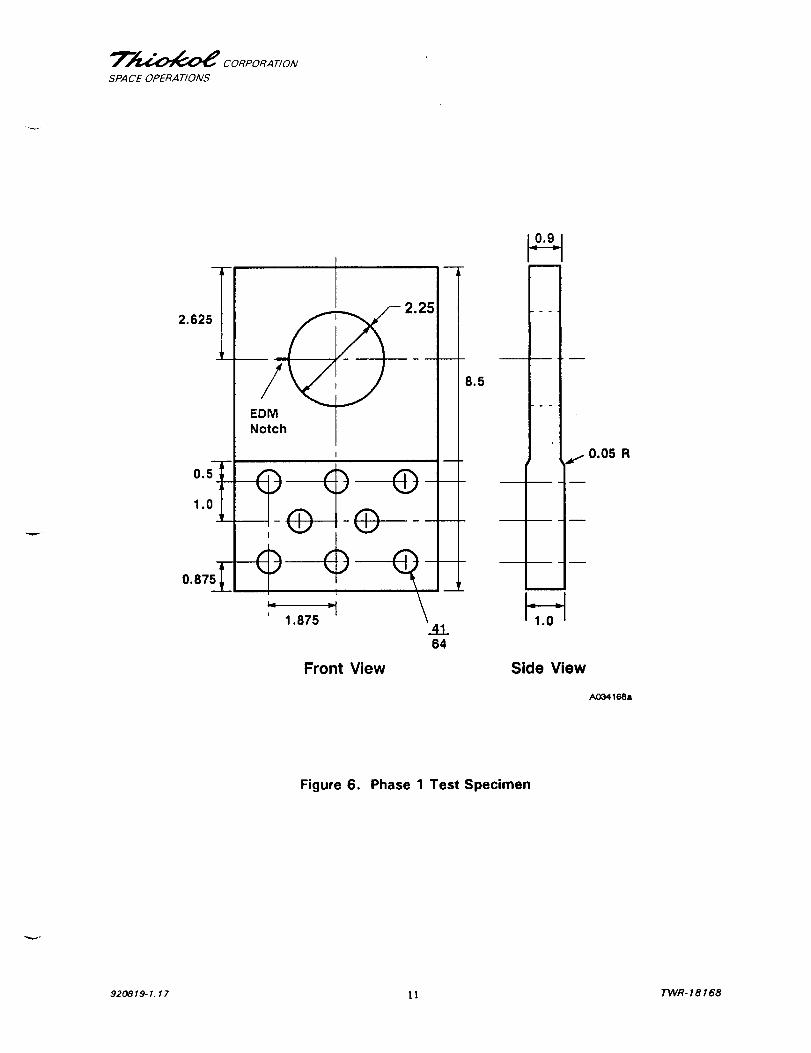
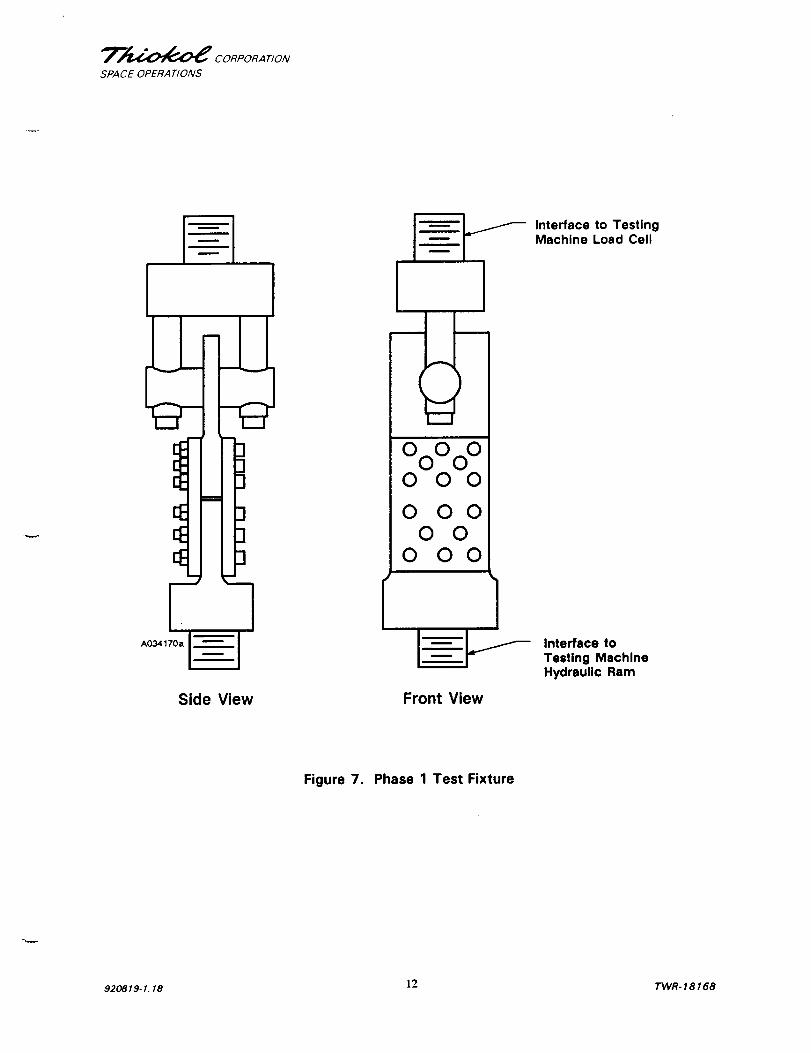
The Phase 1 test specimen and apparatus is shown in Figures 6 and 7. The lower
portion of the aluminum specimen was clamped tightly between two steel plates, providing
a rigidly fixed boundary condition at the lower edge of the specimen's upper lug region.
6.2 PHASE 2 TESTING
Three of the four Phase 2 specimens were notched in a location adjacent to the actuator
attachment hole (Figure 2). Specimen 2-3 was given two notches, one on each side of the
bracket while specimens 2-1 and 2-4 were given a single notch on only one bracket flange.
The EDM notch in specimen 2-2 was located in the fillet at the base of one of the bracket
flanges where it joins the bracket base (Figure 3).
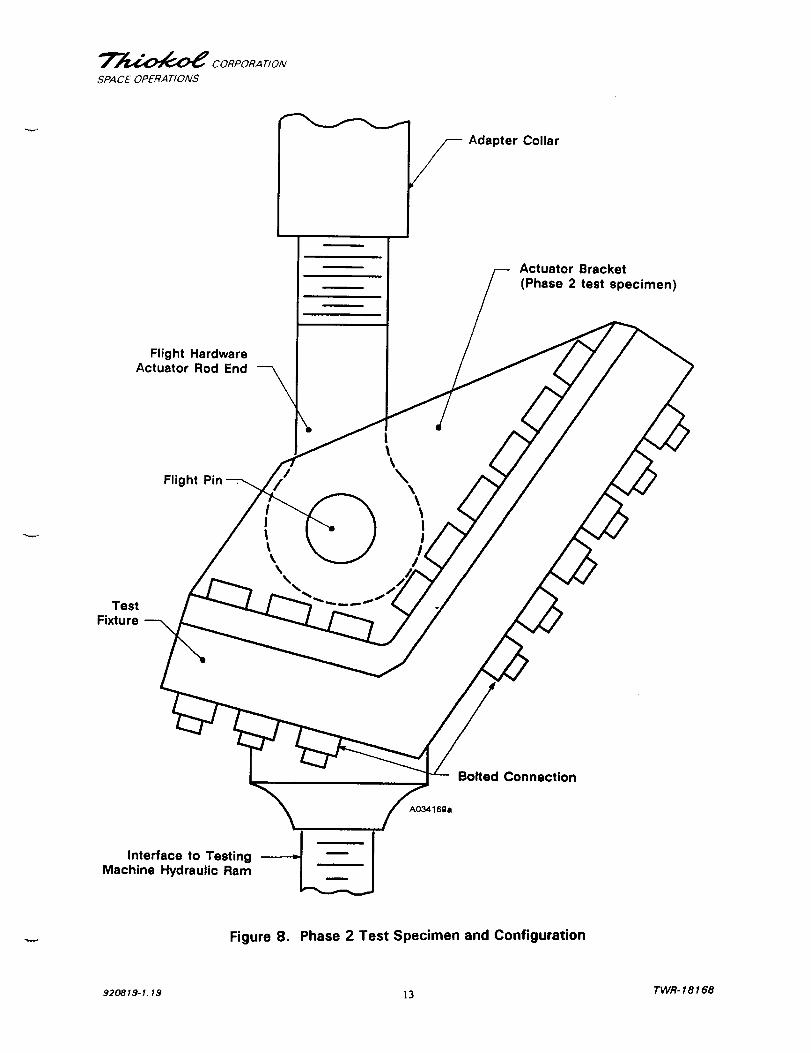
The test apparatus (Figure 8) was designed to simulate the loading experienced by
the actuator bracket during nozzle vectoring.
Two of the specimens were tested before a failure in the test fixture prompted the
cancellation of the remaining tests. The specimens tested were those designated as 2-1 and
2-2 in CTP-0071. Since these specimens were directly related to the qualification objective,
it was decided that continued testing was not necessary.
92o819-1.8 8 TWR-18168
_"_ CORPORA T/ON
SPACE OPERATIONS
i
i.
l
Top View
Crack
t = 0.9 in.
d = 2.25 in.
W = 5.25 in
//_p
W
Crack
Front View ^o_I_,
Figure 4. Square Lug Mode/Test Specimen Geometry Dimensions
920819-I. 15 9 TWR-18168
T,__ CORPORA T/ON
SPACE OPERATIONS
_ Location
Loading Direction
Corresponds toApproximate ActuatorNull Position
15 deg
Motor Axial Direction
\ Square LugTest Specimen
Side View of Actuator Bracket
A034133a
Figure 5, Comparison of Analytical Model to Actuator Bracket
920819-1. t6 10 TWR-18168
_"_ CORPORA T/ON
SPACE OPERATIONS
2.625___
_2.25
EDM
Notch
4164
Front View
°
Side View
A034168a
Figure 6. Phase 1 Test Specimen
920819-1.17 II TWR-18168
_'_ CORPORA T/ON
SPA CE OPERA TIONS
i m
i
EE_ 3EE' Zl
FqI
Side View
OoOoO0 O0
0 O00 0
0 O0
Front View
Interface to TestingMachine Load Cell
Interface to
Testing Machine
Hydraulic Ram
Figure 7. Phase 1 Test Fixture
920819°I. 18 12 TWR-18168
T_j_4_ CORPORA T/ON
SPACE OPERATIONS
/-Adapter Collar
Actuator Bracket(Phase 2 test specimen)
Flight HardwareActuator Rod End
Test
Fixture ---_
Flight Pin
Ill
\
!
\\
II
I IInterface to Testing -----_ _ I
Machine Hydraulic Ram
A03416ga
Bolted Connection
Figure 8. Phase 2 Test Specimen and Configuration
920819-1.19 13 TWR- 18168
_'__--_ CORPORATION
SPA CE OPERA TIONS
7
RESULTS AND DISCUSSIONS
7.1 PHASE 1
The specific objectives of Phase 1 were to determine the accuracy of the lug fracture predictions from
the NASA/FLAGRO fracture mechanics model and to determine critical loads in the square lug test
specimen for three different initial crack sizes.
7.1.1 Analytical Model
To investigate the accuracy of the analytical model for Phase 1 applications, the actual crack sizes from
each test specimen were analyzed with the NASA/FLAGRO model. The corner cracked lug model
produces a solution for the stress intensity at each of the two ends of the crack front where it intersects
the surface of the lug. The solution was assumed to represent the critical condition when either one
of the two stress intensity values became equal to the fracture toughness of the material. A value of
26 ksiV'in, was used for the fracture toughness of 7075-T73 aluminum. This value was taken from the
material property database contained in the NASA/FLAGRO program. This value is for the T-L
orientation of the material which corresponds to the orientation of the cracks relative to the grain
orientation in the specimens.
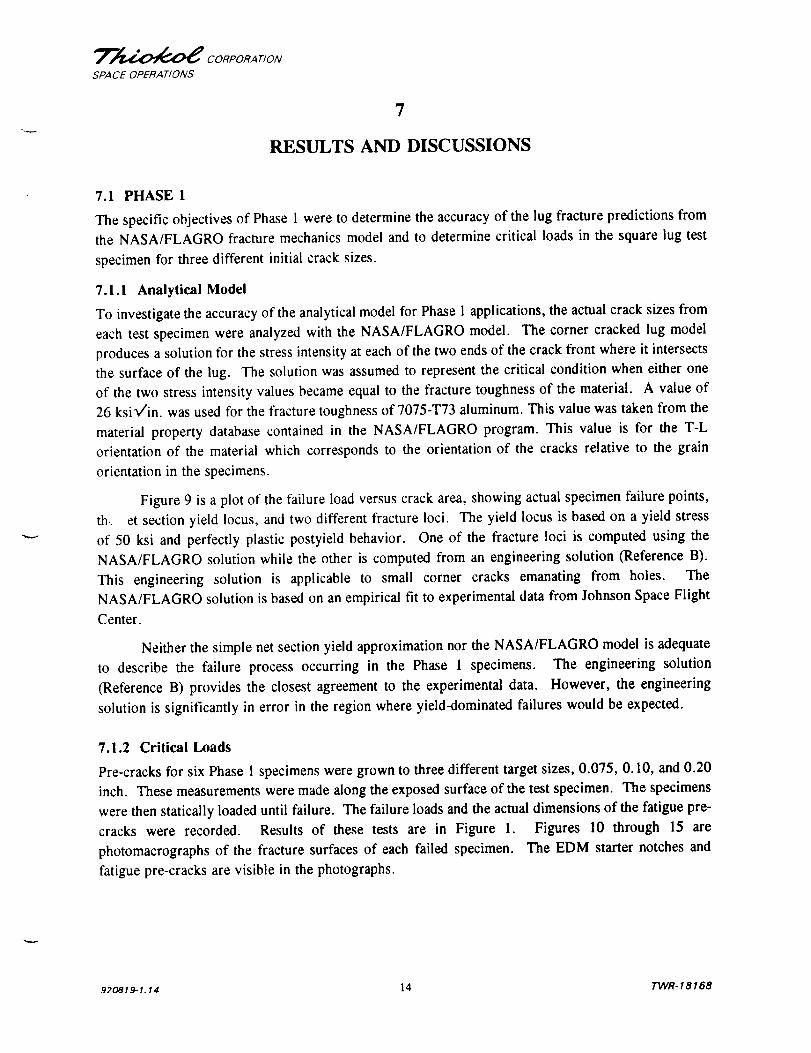
Figure 9 is a plot of the failure load versus crack area, showing actual specimen failure points,
th.. et section yield locus, and two different fracture loci. The yield locus is based on a yield stress
of 50 ksi and perfectly plastic postyield behavior. One of the fracture loci is computed using the
NASA/FLAGRO solution while the other is computed from an engineering solution (Reference B).
This engineering solution is applicable to small corner cracks emanating from holes. The
NASA/FLAGRO solution is based on an empirical fit to experimental data from Johnson Space Flight
Center.
Neither the simple net section yield approximation nor the NASA/FLAGRO model is adequate
to describe the failure process occurring in the Phase 1 specimens. The engineering solution
(Reference B) provides the closest agreement to the experimental data. However, the engineering
solution is significantly in error in the region where yield-dominated failures would be expected.
7.1.2 Critical Loads
Pre-cracks for six Phase 1 specimens were grown to three different target sizes, 0.075, 0.10, and 0.20
inch. These measurements were made along the exposed surface of the test specimen. The specimens
were then statically loaded until failure. The failure loads and the actual dimensions of the fatigue pre-
cracks were recorded. Results of these tests are in Figure 1. Figures 10 through 15 are
photomacrographs of the fracture surfaces of each failed specimen. The EDM starter notches and
fatigue pre-cracks are visible in the photographs.
920819- I. 14 14 TWR- 18168
T_ CORPORATION
SPA CE OPERA TIONS
Residual Strength
Square Lug With Corner Crack
J3
m0_I
L,.
0
200,000-
150,000-
100,000-
50,000-
00.00
Yield locus
Broek Fracture locus
FLAGRO Fracture locus
• • _ • Actual failures
i I i , I i I i I l I , I i I0.01 0.02 0.03 0,04 0.05 0.06 0.0
Crack Area (in. 2)
Figure 9. Comparison of Failure Load Versus Crack Area
A038271 a
920819-1.21 ].5 TWR-18168
_-_---_ CORPORATION
SPACE OPERATIONS
E
0a.
¢_
r-a.
2
m
92o8_9-_. _6 16 TWR-18168
_ CORPORA T/ON
SPACE OPERATIONS
e-Q}
E
Q)
(t}
Q)"T,
0
m
e"
_mfB
El.
920819-1.17 17 TWR- 18168
_ CORPORA T/ON
SPACE OPERATIONS
E
0
-i
920819-1.18 18 TWR-18168
_ CORPORAT/ON
SPACE OPERATIONS
i(I}
=..(}
¢6
.=
I
U.
920819-1.19 19 TWR-18168
_'_/_--_CORPORA_ON
SPACE OPERATIONS
)
E
0
920819-1.20 20 TIW'R - 18168
"_{_4_ CORPORATION
SPACE OPERATIONS
_D
I=
E
(I)
,,,;,
0O.
_m
(n
J=o.
u_
920819-1.21 2] TWR-18168
"__ CORPORAT/ONSPACEOPERATIONS
The results show that the comer cracked lug fracture mechanics solution contained in the
NASA/FLAGRO model is conservative by a factor of 2.0 to 3.0 for predicting critical loads in ?075-
T73 aluminum. The mason for these conservative results is the violation of linear elastic assumptions
which are needed to ensure the validity of the analytical model.
The method of linear elastic fracture mechanics is valid only when the crack tip plastic zone is
small, relative to the crack size. For 7075-T73 aluminum, this assumption is not valid for the crack
sizes used in this test.
7.2 PHASE 2
The specific development objectives called for determining the critical load of a flight-configured
actuator bracket (Drawing No. IU51242) with an initial corner crack of 0.10 in., and determining the
critical flaw size in a flight-configured actuator bracket (Drawing No. IU51242) at the actuator stall
load. However, these development objectives were not satisfied due to a test fixture failure before the
testing was conducted.
The qualification objective for Phase 2 was to verify the capability of the actuator bracket to
withstand four applications of the flight load spectrum with an initial comer crack of 0.10 inch.
Specimen 2-1 contained an EDM starter notch adjacent to the actuator attachment hole
(Figure 2). Approximately 12,000 cycles of pre-cracking load were required to grow a fatigue pre-crack
of 0.10 in. length on exposed surface of bracket.
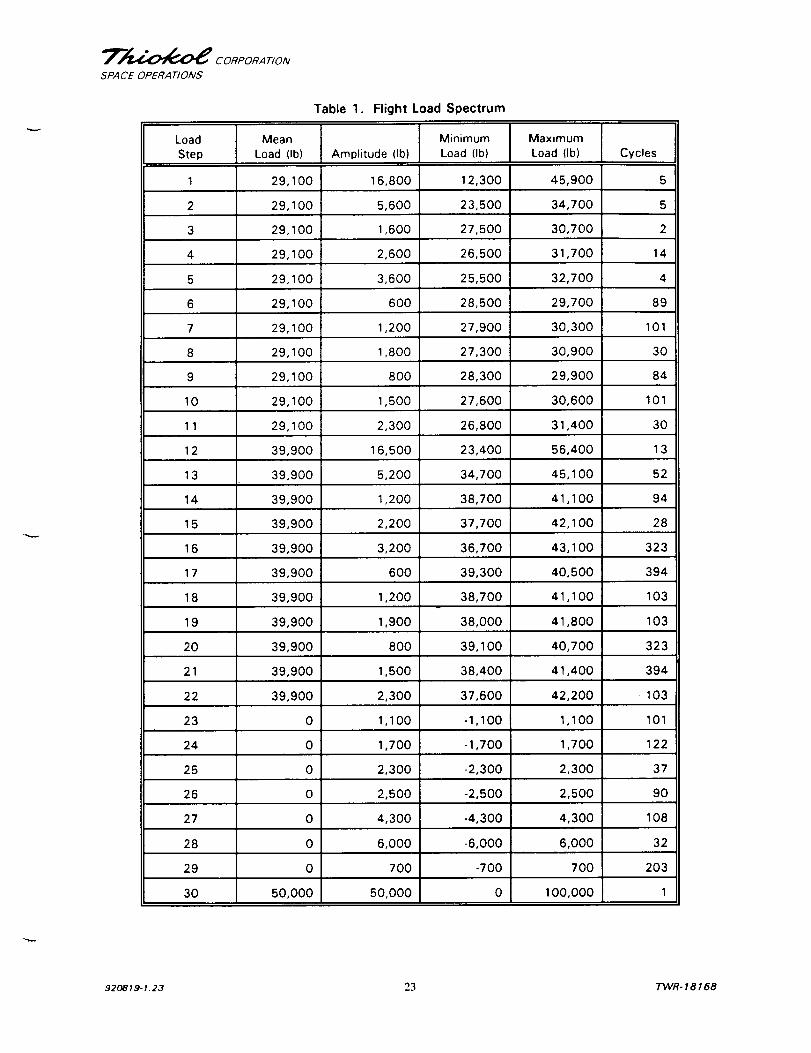
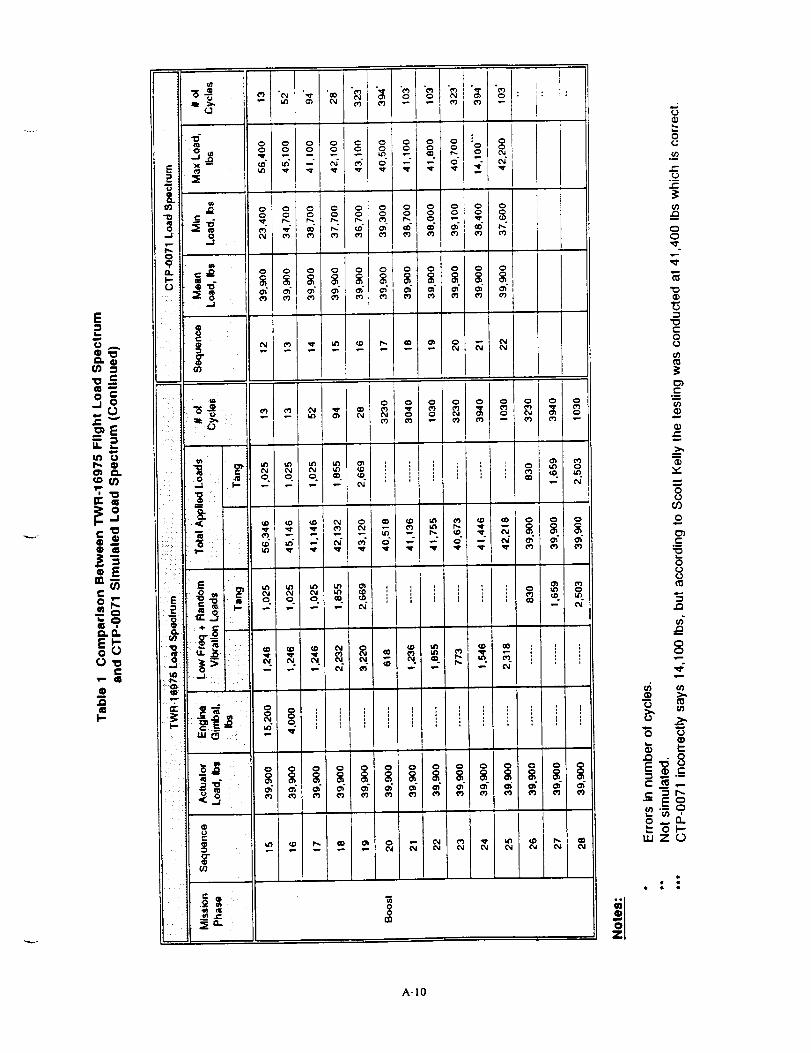
Four cycles of the flight load spectrum (Table 1) were applied to specimen 2-1 following
measurement of the pre-crack. Four cycles of the flight load spectrum (Table 1) were applied to
specimen 2-1 following measurement of the precrack. This load spectrum is not identical to the load
spectrum identified in TWR-16801. The reasons for this difference are the following:
a. The load simulated in CTP-0071 is from TWR-16975 (Tables 8.1-1 through 8.1-5), not from
TWR-16801, Rev. B, Vol. II. At the time the test plan was written, TWR-16975 was the only
available source of the fatigue flight load spectrum.
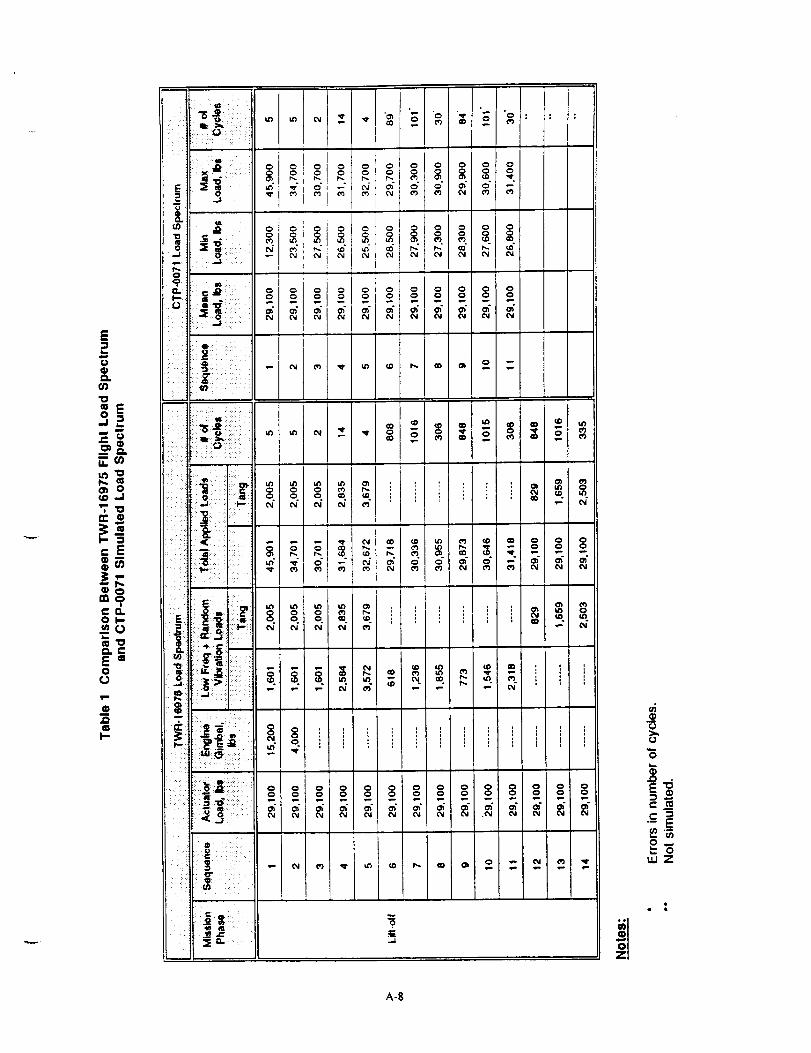
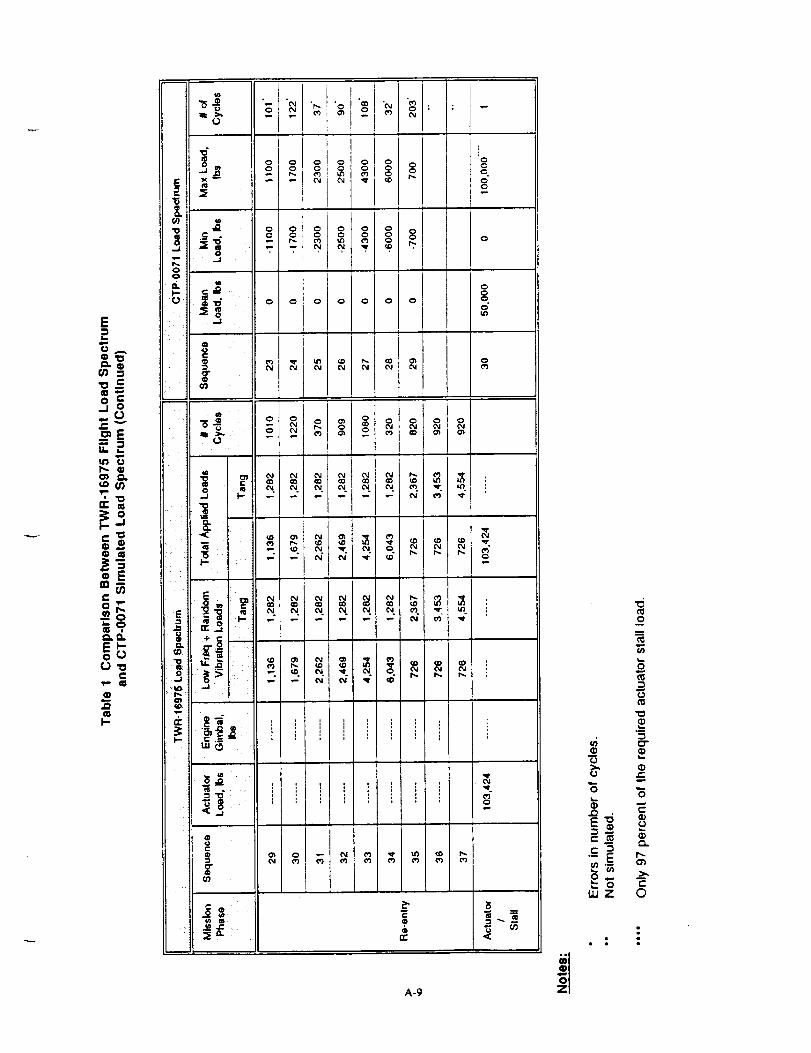
b. There are discrepancies between CTP-007 ! load spectrum and TWR-16975 flight load spectrum:
• There were typographical errors in the number of cycles.
- Some loads were left out because of no cyclic loads.
• Accelerations were not included. (See details in Attachment A, Table 1, Page A-8)
Fracture mechanics crack growth analyses (see Attachment A) were performed to compare CTP-
CTP-0071 simulates flight loads.0071 load spectrum with load spectrum specified in TWR-16801.
The NASA/FLAGRO program was used in the analyses.
92o8_9-1.z2 22 TWR-18168
T_ CORPORATION
SPACE OPERA TIONS
Table 1. Flight Load Spectrum
LoadStep
Mean
Load (Ib)
29,100
29,100
29,100
29,100
29,100
29,100
29,100
29,100
29,100
Amplitude (Ib)
16,800
5,600
1,600
2,600
3,600
6OO
1,200
1,800
80O
MinimumLoad (Ib)
12,300
23,500
27,500
26,500
25,500
28,500
27,900
27,300
28,300
Maximum
Load (Ib)
45,900
34,700
30,700
31,700
32,700
29,700
30,300
30,900
29,900
10 29,100 1,500 27,600 30,600
11 29,100 2,300 26,800 31,400
12 39,900 16,500 23,400 56,400
13
14
15
39,900 5,200 34,700 45,100
39,900 1,200 38,700 41,100
39,900 2,200 37,700 42,100
3,200
600
1,200
1,900
8OO
1,500
2,300
39,900
1,100
16
39,900
39,900
39,900
39,900
39,900
39,900
36,700
39,300
38,700
38,O00
39,100
38,400
37,600
-1,100
-1,7001,700
43,100
40,500
41,100
17
18
19
20
21
22
23
24
25
26
27
28
29
3O
41,800
40,700
41,400
42,200
1,100
1,700
0 2,300 -2,300 2,300
0 2,500 -2,500 2,500
0 4,300 -4,300 4,300
0 6,000 -6,000 6,000
0 700 -700 700
50i000 50,000 100,000
Cycles
5
5
2
14
4
89
101
3O
84
101
30
13
52
94
28
323
394
103
103
323
394
-103
101
122
37
90
108
32
203
920819-I. 23 23 TWR- 18168
_'__ CORPORA T/ON
SPACE OPERATIONS
The results presented in Attachment A, Table 2, Page A-I 1 indicated that after four mission
cycles of loading, the stress intensity factors caused by the required load spectrum are higher than the
CTP-071 load spectrum by three percent. This is because the required actuator stall load is 103,424 lb
whereas the CTP-071 stall load is only 100,000 lb (due to machine capability limitation). However,
it is still smaller than the fracture toughness of the material, according to the results from Phase 1 of
CTP-0071. The required load spectrum would make an initial corner crack of 0.10 in. grow to
0.100173 in., whereas CTP-0071 load spectrum would make the same initial corner crack grow to
0.100168 in. which is only 0.005 percent less than 0.100173 inch.
The effect of the CTP-0071 load spectrum is equivalent to the required load spectrum.
Consequently, the results from CTP-0071 can be used to qualify the actuator bracket.
The flight loading resulted in approximately 0.004 in. of additional crack growth. The bracket
was then statically loaded to 237,000 lb in an attempt to fail the bracket at the crack. Failure of the
test fixture at 237,000 Ib forced the test to be terminated prior to test specimen failure. There was
approximately 0.006 in. of crack extension following application of the static load.
The damage to the test fixture was so severe that major repairs would have been required for
testing to resume. Since the qualification objective had been successfully accomplished, further testing
was canceled per NASA memo SA51(192-90) (Attachment A).
Specimen 2-2 contained an EDM starter notch located in the fillet at the base of the bracket web
where it meets the bracket base plate (Figure 3). A pre-cracking load was applied to specimen 2-2 for
500,000 cycles in an attempt to initiate fatigue crack growth at the starter notch. No fatigue crack
initiation was produced during this period, resulting in the conclusion of testing specimen 2-2.
920819-1.24 24 TWR-18168
_"_(__ CORPORA T/ON
SPA CE OPERA T/ONS
8
APPLICABLE DOCUMENTS
CTP-0071
TWR-15723
CPWI-3600A
TWR-16875
ASTM E399-83
Reference 1
SA51 (192-90)
RSRM Nozzle Actuator Bracket/Lug Fracture Mechanics Qualification TestPlan
Development and Verification Plan for the Redesigned Solid Rocket Motor
Prime Equipment Contract End Item (CEI) Detail Specification
Fracture Control Plan for Space Shuttle RSRM Nozzle
Standard Test Method for Plane-Strain Fracture Toughness of MetallicMaterials
Broek, D., Elementary Engineering Fracture Mechanics, Third Edition, The
Hague, 1983, pp. 352-356
NASA Memo Canceling Further Testing (Attachment B)
920819-1.25 25 TWR- 18168
_F'__--4_ CORPORA TION
SPACE OPERATIONS
Attachment A
92o8t9-i. 7 A-1 TWR-18168
_'_ CORPORATION
SPA CE OPERA T/ONS
24 May 1993
L633-FY93-MII2 Rev. A
TO:
CC:
FROM:
SUBJECT:
K. F. Lueders
Systems Planning and Interfaces
G. M. Berhold, D. E. Campbell, R. V. Cook, J. V. Daines,
T. K. Lai, B. Paul, K. W. Stephens, R. K. Wilks
T. T. Nhan
Nozzle Structural Analysis
Crack Growth Comparison between Actuator Bracket CTP-O071 Load
Spectrum and Required Fatigue Flight Load Spectrum
REFERENCES:
A.
B.
C°
Do
mo
F.
Kelly, S., CTP-O071 Revision C, "RSRM Nozzle Actuator Bracket/Lug
Fracture Mechanics Qualification Test Plan," 25 July 1988.
McCormack, J. D., Interoffice Memo L711-FY93-M348, "Nozzle
Actuator Fatigue Loads," 23 February 1993. (Attached)
McCormack, J. D., TWR-16801 Volume 2 Revision A, "RSRM Design
Loads Data Book - Volume 2: Post-Separation, Fatigue, and
Interface Loads," Thiokol Corporation, To be released.
Composite Group, TWR-16975 Rev. B, "RSRM Nozzle Stress Report,"
Morton Thiokol, Inc., i February 1989.
Rebello, C. J. and Phipps B. E., TWR-15995, "Space Shuttle RSRM
Nozzle Materials Data Book," Morton Thiokol, Inc. 19 January1989.
Jensen, K. R., and Richards, M. C., TWR-IO211, "Mass Properties
Quarterly Status - Space Shuttle Solid Rocket Motor," Thiokol
Corporation, 5 March 1993.
1.0 INTRODUCTION
Concern has been raised whether CTP-O071 (see Reference A) test results can
be used to qualify the actuator bracket as it was intended. The reason for
the concern is that the flight load spectrum simulated by CTP-O071 is not the
A-2
L633-FY93-MII2 Rev. AK. F. Lueders
-2- 24 May 1993
same as the required flight load one as documented in Interoffice MemoL711-FY93-M348, dated 23 February 1993 (see Reference B) which will beincorporated in TWR-16081Vol. 2 Rev.B (see Reference C).
This memois to document the crack growth analyses of the fatigue loadspectrum simulated by CTP-O071 and the required load spectrum andcorresponding conclusion.
The memois revised because there were two errors in the number of cycles ofthe required flight load spectrum.
2.0 BACKGROUNDINFORMATION
As stated in CTP-0071, one of the test objectives is: "to verify thecapability of actuator bracket to undergo four cycles of the flight loadspectrum with a 0.i0 inch pre-existing crack." However, the flight loadspectrum in CTP-0071 is different from the actual required flight loadspectrum.
The reasons for this discrepancy are the following:
(a) The load simulated in CTP-0071 is from TWR-16975 (see Reference
D, Tables 8.1-1 through 8.1-5), not from TWR-16801 (see Reference
C). At the time the test plan was written, TWR-16975 was the
only available source of the fatigue flight load spectrum because
the required fatigue load spectrum, which will be presented in
TWR-16801 Volume 2 Revision B (see Reference C), did not exist.
(b) There are discrepancies between CTP-0071 load spectrum and
TWR-16975 flight load spectrum:
o
o
Several errors are typos in the number of cycles;
Some loads were left out because of no cyclic loads.Accelerations were not included.
See more details in Table I.
3.0 SUMMARY AND CONCLUSION
Fracture mechanics crack growth analyses were performed to compare CTP-O071
load spectrum, intended to simulate flight loads, and the required load
spectrum specified in Interoffice memo L711-FY93-M348 (see Reference B). The
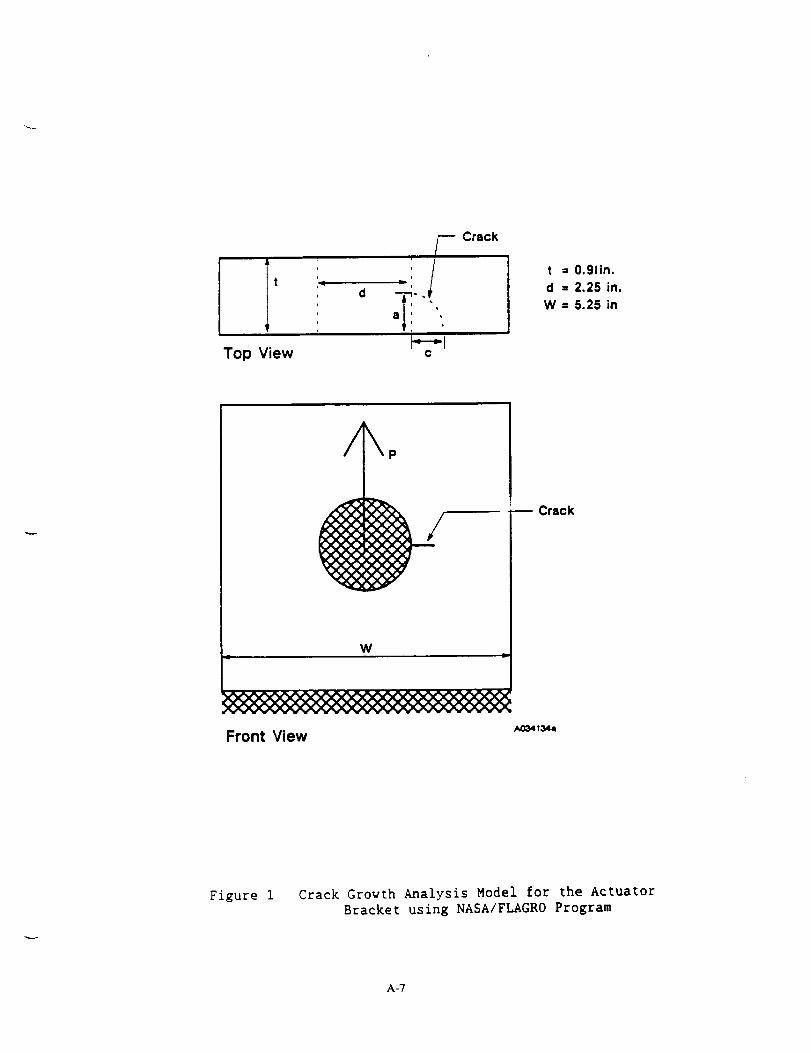
NASA/FLAGRO program was used in the analyses. The crack growth model is
presented in Figure I. The results are presented in Table 2.
The results indicated that after four mission cycles of loadings, the stress
intensity factors caused by the required load spectrum are higher than the
one caused by CTP-O071 load spectrum by three percent. This is because the
required actuator stall load is 103,424 ibs whereas the CTP-O071 simulated
A-3
L633-FY93-MII2 Rev. AK. F. Lueders
-3- 24 May 1993
actuator stall load is only i00,000 ibs. However, it is still smaller thanthe fracture toughness of the material, according to the results fromphase I of CTP-O071. The required load spectrum would makean initial cornercrack of 0.i0 inch grow to 0.100173 inch, whereas CTP-0071 load spectrumwould make the same initial corner crack grow to 0.100168 inch which is only0.005% less than 0.100173 inch.
Therefore, the effect of the CTP-O071load spectrum is equivalent to therequired load spectrum. Consequently, the results from CTP-O071can be usedto qualify the actuator bracket.
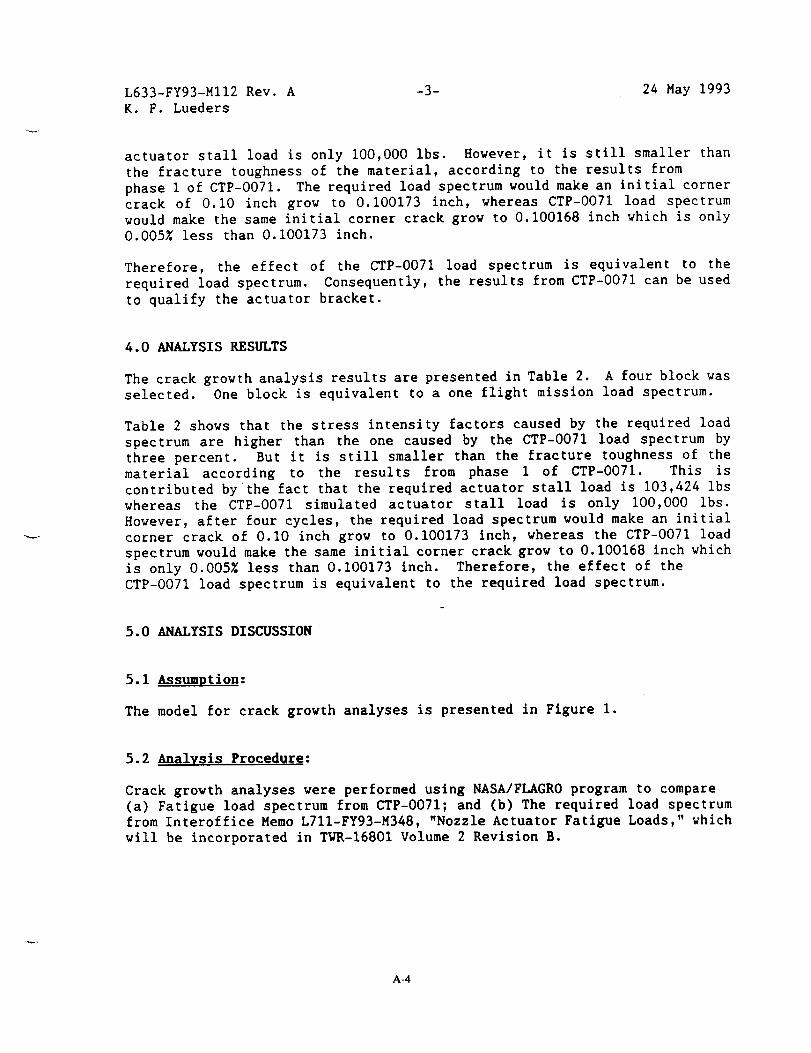
4.0 ANALYSIS RESULTS
The crack growth analysis results are presented in Table 2. A four block was
selected. One block is equivalent to a one flight mission load spectrum.
Table 2 shows that the stress intensity factors caused by the required load
spectrum are higher than the one caused by the CTP-0071 load spectrum by
three percent. But it is still smaller than the fracture toughness of the
material according to the results from phase 1 of CTP-O071. This is
contributed by the fact that the required actuator stall load is 103,424 ibs
whereas the CTP-O071 simulated actuator stall load is only I00,000 Ibs.
However, after four cycles, the required load spectrum would make an initial
corner crack of 0.I0 inch grow to 0.100173 inch, whereas the CTP-O071 load
spectrum would make the same initial corner crack grow to 0.100168 inch which
is only 0.005% less than 0.100173 inch. Therefore, the effect of the
CTP-0071 load spectrum is equivalent to the required load spectrum.
5.0 ANALYSIS DISCUSSION
5.1 A_sumption:
The model for crack growth analyses is presented in Figure I.
5.2 Analysis Procedure:
Crack growth analyses were performed using NASA/FLAGRO program to compare
(a) Fatigue load spectrum from CTP-0071; and (b) The required load spectrum
from Interoffice Memo L711-FY93-M348, "Nozzle Actuator Fatigue Loads," which
will be incorporated in TWR-16801 Volume 2 Revision B.
A-4
L633-FY93-MII2 Rev. AK. F. Lueders
-4- 24 May 1993
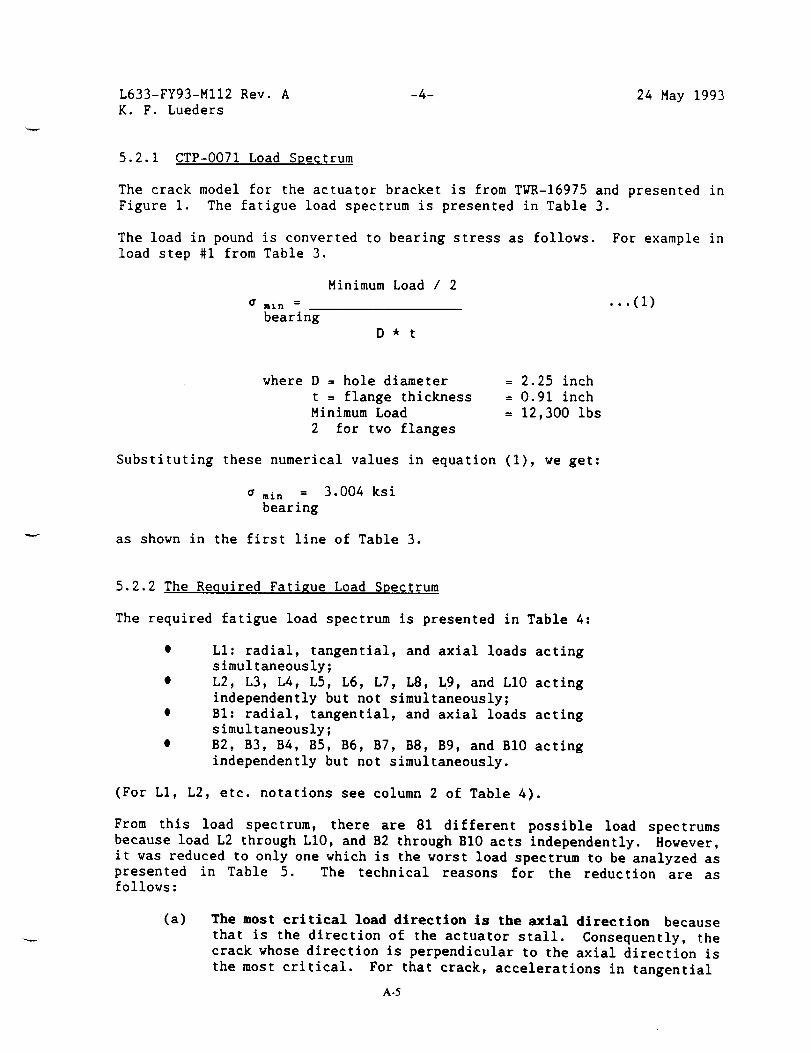
5.2.1 CTP-O071 Load Spectrum
The crack model for the actuator bracket is from TWR-16975 and presented in
Figure i. The fatigue load spectrum is presented in Table 3.
The load in pound is converted to bearing stress as follows. For example in
load step #l from Table 3.
Minimum Load / 2
rain .... (I)
bearing
D* t
where D = hole diameter
t = flange thickness
Minimum Load
2 for two flanges
= 2.25 inch
= 0.91 inch
= 12,300 Ibs
Substituting these numerical values in equation (I), we get:
•in = 3.004 ksi
bearing
as shown in the first line of Table 3.
5.2.2 The Required Fatigue Load Spectrum
The required fatigue load spectrum is presented in Table 4:
LI: radial, tangential, and axial loads acting
simultaneously;
L2, L3, L4, L5, L6, L7, L8, L9, and L10 acting
independently but not simultaneously;
BI: radial, tangential, and axial loads acting
simultaneously;
B2, B3, B4, B5, B6, B7, B8, B9, and BlO acting
independently but not simultaneously.
(For LI, L2, etc. notations see column 2 of Table 4).
From this load spectrum, there are 81 different possible load spectrums
because load L2 through LIO, and B2 through BIO acts independently. However,
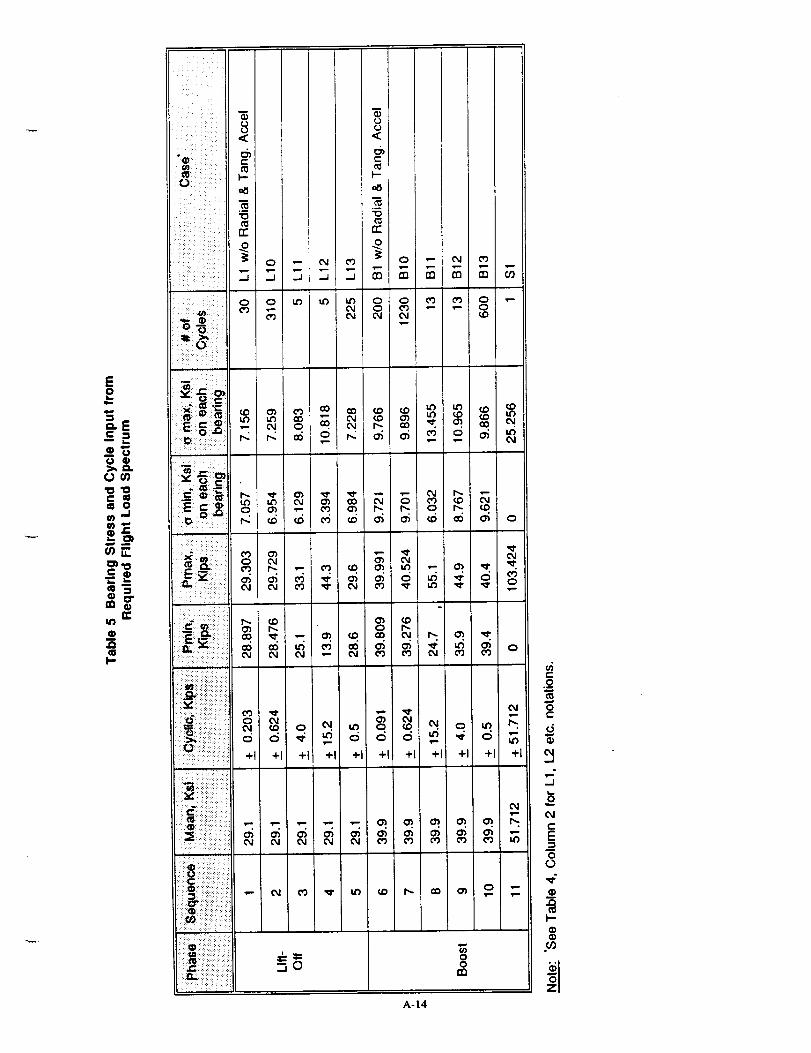
it was reduced to only one which is the worst load spectrum to be analyzed as
presented in Table 5. The technical reasons for the reduction are asfollows:
(a) The most critical load direction is the axial direction because
that is the direction of the actuator stall. Consequently, thecrack whose direction is perpendicular to the axial direction is
the most critical. For that crack, accelerations in tangential
A-5
L633-FY93-M112 Rev. A
K. F. Lueders
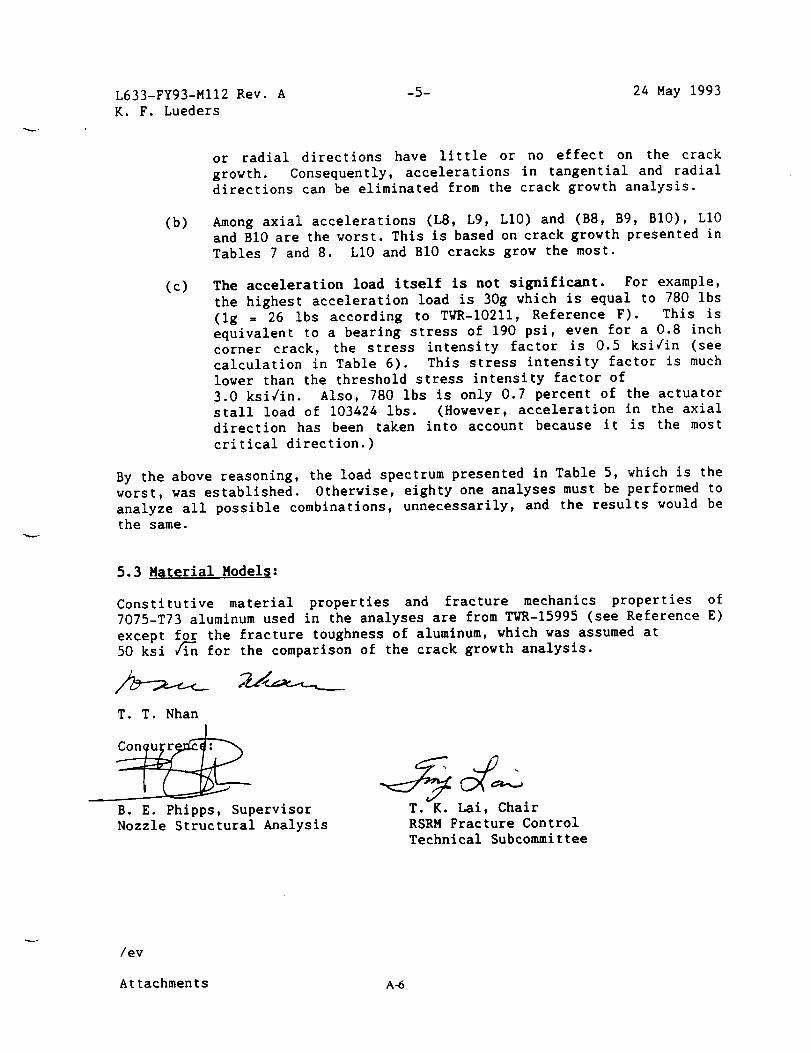
-5- 24 May 1993
or radial directions have little or no effect on the crack
growth. Consequently, accelerations in tangential and radialdirections can be eliminated from the crack growth analysis.
(b) Among axial accelerations (L8, L9, LI0) and (B8, B9, BIO), LI0
and BI0 are the worst. This is based on crack growth presented in
Tables 7 and 8. LI0 and BI0 cracks grow the most.
(c) The acceleration load itself is not significant. For example,
the highest acceleration load is 30g which is equal to 780 ibs
(ig = 26 ibs according to TWR-10211, Reference F). This is
equivalent to a bearing stress of 190 psi, even for a 0.8 inchcorner crack, the stress intensity factor is 0.5 ksi/in (see
calculation in Table 6). This stress intensity factor is much
lower than the threshold stress intensity factor of
3.0 ksi/in. Also, 780 ibs is only 0.7 percent of the actuator
stall load of 103424 ibs. (However, acceleration in the axial
direction has been taken into account because it is the most
critical direction.)
By the above reasoning, the load spectrum presented in Table 5, which is the
worst, was established. Otherwise, eighty one analyses must be performed to
analyze all possible combinations, unnecessarily, and the results would be
the same.
5.3 Material Models:
Constitutive material properties and fracture mechanics properties of
7075-T73 aluminum used in the analyses are from TWR-15995 (see Reference E)
except for the fracture toughness of aluminum, which was assumed at
50 ksi /_n for the comparison of the crack growth analysis.
T. T. Nhan
B. E. Phipps, Supervisor
Nozzle Structural Analysis
T. K. Lai, Chair
RSRM Fracture Control
Technical Subcommittee
/ev
Attachments A-6
B
i
i
d
Crack
,ja ! ,
_*--"1Top View c
t = 0.91in.
d = 2.25 in.
W = 5.25 in
I
@W
Crack
Front View/uO_,134a
Figure i Crack Growth Analysis Model for the Actuator
Bracket using NASA/FLAGRO Program
A-7
EEel,
OQ. iiill °
iii_i_ _ _ _i_ _ !iiiiiill _ _
t_
¢D
•_ i!i _il!_i__ii: ¸'_:!ii iii_ i I,-/
=E
o_-
0
0 0 0 (_3 t'_
01 _v)
0 0 ¢_ r'-
N: N N _" .- c_
iii!iii ,,i:_::_!_i̧ ¸_¸¸'_¸__i_
O
_ i : i i i i i : i i i :
0 0 0 0 0 0 0 0 0 0 0 0 0C3 0 0 C3 0 0 0 0 0 0 0 0 0
_-,_- _- _ _ _- _- _- _- _- _- _- _- _-
i̧ !_,_i_ii!iiii!i_!_.
e
O
o-'- ouJz
.__._ ._•5: _. ._l
A-8
JA
_E
_oU3
W
Q rtE_o_
c•,- aB
0
.Q
I-.
_0
• °
,o c_,o o
oo
03 O_ _ c_
o c_ o oo o o oo
O O O O O O O
o ° o _ o o o o o
'OO
OO
O
O
O
O
o _ _ _ _ _ c_ _. _ _ _ i
•_ . rr" ,..,t i
_ I _'° r,._ _0_ _ _ _ _ _ _ :
t
gOd 03 C_ if3 t_ O_ _ _ 03
i
c
A-9o
O
c_
C_
OO
I_ 0
° : :
m
A-IO
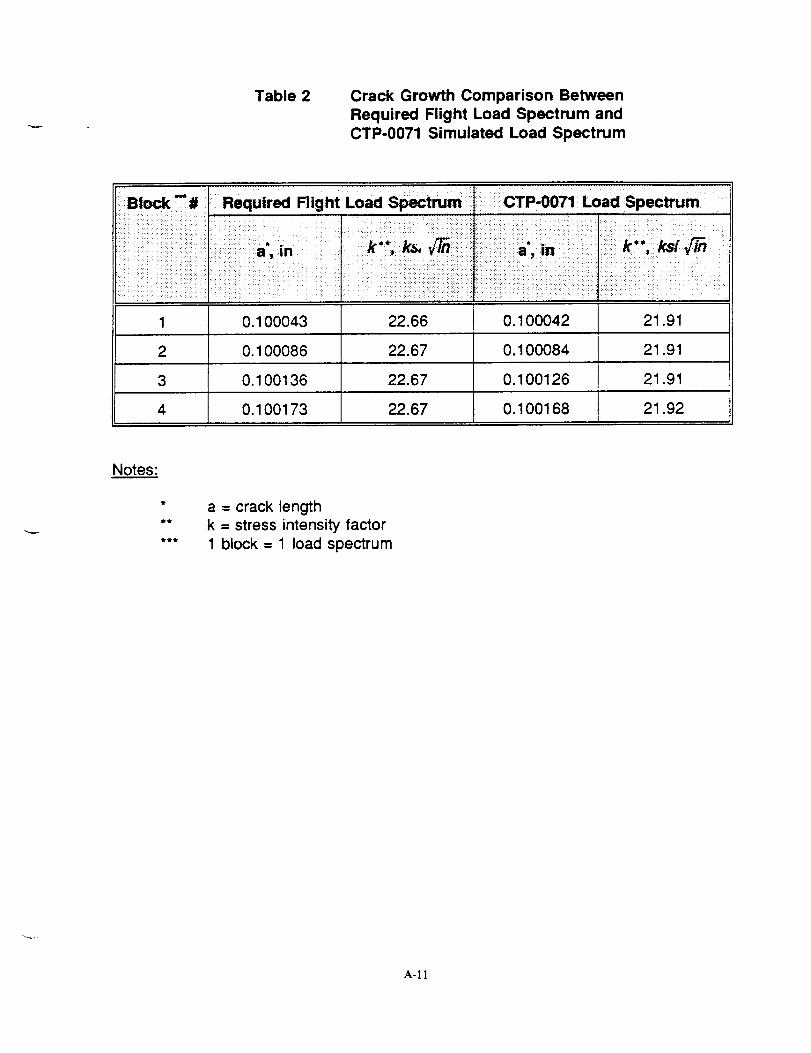
Table 2 Crack Growth Comparison Between
Required Flight Load Spectrum andCTP-0071 Simulated Load Spectrum
Block -# Required Flight Load Spectrum _I CTP-0071 Load Spectrum
1 0.100043 22.66 O. 100042 21.91
2 O.100086 22.67 O. 100084 21.91
3 O.100136 22.67 O. 100126 21.91
4 0.100173 22.67 0.100168 21.92
Notes:
t
t_
t_t
a = crack length
k = stress intensity factor
1 block = 1 load spectrum
A-11
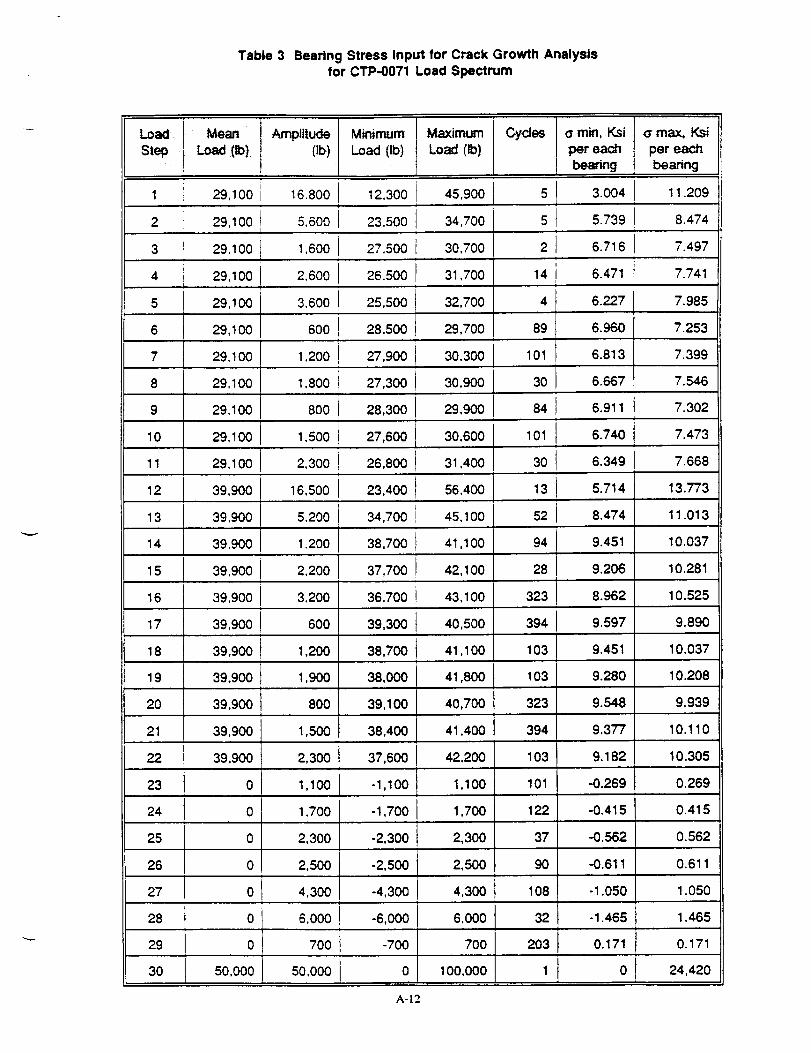
Table 3 Bearing Stress Input for Crack Growth Analysisfor CTP-0071 Load Spectrum
Load
Step
10
11
Mean
Load (b)
29,100
29,100
29,100
29,100
29,100
29,100
Amplitude Minimum Maximum
(Ib) Load (Ib) Load (Ib)
16.800
5,600
1,600
2,600
3.600
600
12,300
23,500
27,500
26,500
25,500
28.500
45,900
34,700
30,700
31,700
32,700
29,700I
Cycles
2
14
4
89
a min, Ksi
per each
bearing
3.004
5.739
6.716
6.471
6.227
6.960
G max, Ksi
per each
bearing
11.209
8.474
7.497
7.741
7.985
7.253
29,100 1,200 27,900 30,300 101 6.813 7.399
29,100 1,800 27,300 30,900 30 6.667 7.546
29,100 800 28,300 29.900 84 6.911 7.302
6.740 7.473
6.349 7.668
30,600 101
3031,400
56,400 13 5.714 13.773
52 8.474 11.013
1.50029,100 27,600
29,100 2,300 26,800
12 39,900 16,500 23,400i
45,10013 39,900 5.200 34,700
14 39,900 1,200 38,700 41,100 94 9.451 10.037
15 39,900 2,200 37,700 42,100 28 9.206 10.281
32339,900 3.20016
17
36,700
39,300
43,100
40,500
41,100
8.962J
9.597
9.45138,700
39,900 600
18
19
39,900 1,200
394
103
10.525
9.890
10.037
39,900 1,900 38,000 41,800 103 9.280 10.208
20 39,900 800 39,100 40,700 323 9.548 9.939
1,500 38,400 41,400 394 9.377 10.110
42,200
1,100
1,700
21
22
23
24
25
26
27
28
37,600
-1,100
103
101
122
37
90
108
32
-1,700
-2,300
-2,500
-4,300
-6,000
39,900
39,900 2,300
1,100
1,700
2,300
2,500
4,300
9.182
-0.269
-0.415
-0.562
-0.611
-1.050
-1.4656,000
0
0
0
0
0
2,300
2,500
4,300
6,000
10.305
0.269
0.415
0.562
0.611
1.050
1.465
29 0 700 -700 700 203 0.171 0.171
30 50,000 50,000 0 100,000 1 0 24,420
A-12
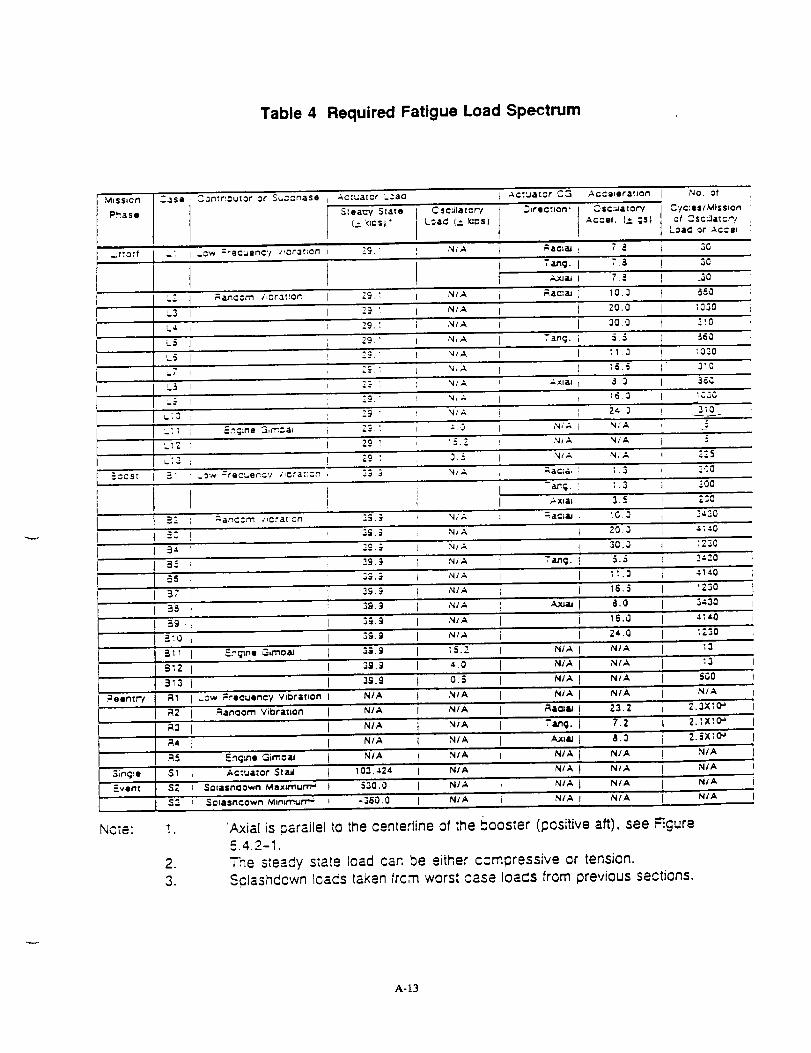
Table 4 Required Fatigue Load Spectrum
t
_.1S@ C._nmou(or or S_--c_ase _ Ac:uatcr '.:aa
S_eacy S:ate
(- '<:¢s j"
C s¢:Ra[cr_/
L:a¢ (: lqrns)
Ac:uatcr C,_ ACC@leraoxon
Osc:lia[ ot'y
At:el. (* ;S;
NO. of
'_t,'orf .: .ow =recuen¢'! w,3r3¢_on :;9.' N,A _a¢;aJ 7_
Tang. 7._ 30
:2
_3
, L4
L_
'.5
.7
_2
=-3
3A
_.'_tTC C,_1 /i=t'3(Ior7
_Dw -'"ec_ePc'/ /,C,_<3,::_._
= arTc:t'_ # ic.'3¢;crt
I 55
37
38
5g,i
:710
_I I j _._G1ne Ginnoal
_2 I
2._.:
29.1
29,1
29.7
:c..;
2._.;
3_._
"_._. _
39.._
3g._
'_S.9
39._
3S.9
N/A
NIA
NYA
NIA
=e@rlTf'/
NIA
NIA
N/A
N/A
N,A
NIA
"_,A
,',4/a
-". 0
:5.2
'4_A
;q/._
NtA
NzA
N/A
N/A
N/A
NIA
,NIA
NIA
:5.2
4,0
0.5
N/A
NIA
NIA
NIA
313 I
R1 ) Low ;reauenc't vi0rat_on
_4C:_U
Tanq.
N,'_
.Nl_.A
"&n_.
*_P-C:&J
T4Lnq.
_%xJ4U
NYA
N;'A
N/A
N/A
_aQm
Ta.,_q.
R2 I _anaom ViOrat:on
_3 I
7,_.
10.0
20.0
30.0
:5.5
i6 0
2_. 3
N;A
NtA
;.3
1.3
3.. =
10.J
20J
30.0
5.5
_I.3
16.5
:1.0
16._
ZA.0
NtA
N/A
NIA
N/A
23.2
Cyc;esl Mtssl@n
of C SC:_l=_ :,-!
LOAC or AC:el_
_0
_50
;030
S60
:030
3"_0
3_C,
;C3G
5
225
":,':g
200
3¢30
A_A0
:230
2_20
4140
_Z30
3430
AIA0
lZ30
13
13
SGO
NiA
Z.3X_O _
7.2 1 2.:x:o-
¢1.o
=,5 I =.nqme Gi/1_,@_ NtA N/A N/A N/A
Single S1 t Ac'.uator Stad 103.424 N/A N/A NIA t NtA
=vent SZ I Solasnaown Max=murf_ 530,0 NIA NIA N/A t NIA
I $3 I SOlaSrlcown Minlmul'r_ -'_60.0 NIA NIA N/A l NIA
j 2.SXI(P
I N/A
Note:
23
'Axial is parallel to the centerline of the _oos:er (positive aft), see Figure5.4.2-1.
The s:eady s:ate load can be either compressive or tension.Sclashdown leads taken _rcm wors_ case loads from previous sections.
A-13
o
(J(/)
o.J
v) ,-r"
n-tno
.Q(B
I-
!!!!!?_i?i?_ii_!_: :i.__ _iiil_ii__i
_t) iz3 c_4 o_ oo _ o ¢o co
HI ,,,
D,- CO O_ QOC_ f'- O P-
i_i_i_iiiiiiiiiii_iiiiiiiii_ili! .9
!iiiio'iiii!iiiiiii!iii_iiii_iilI _ _ _, _'_ F-.e_ :°!iiii_!ii!iiiiiiiii!iiiiiil" = ° " = ° = " ° = "ili_iiiiiii!!iiiiiiiiiiiiiii!!_!.......................................+1 +1 +1 +1, +1 +1 +1 +1 +1 +1 +1
/
A-14
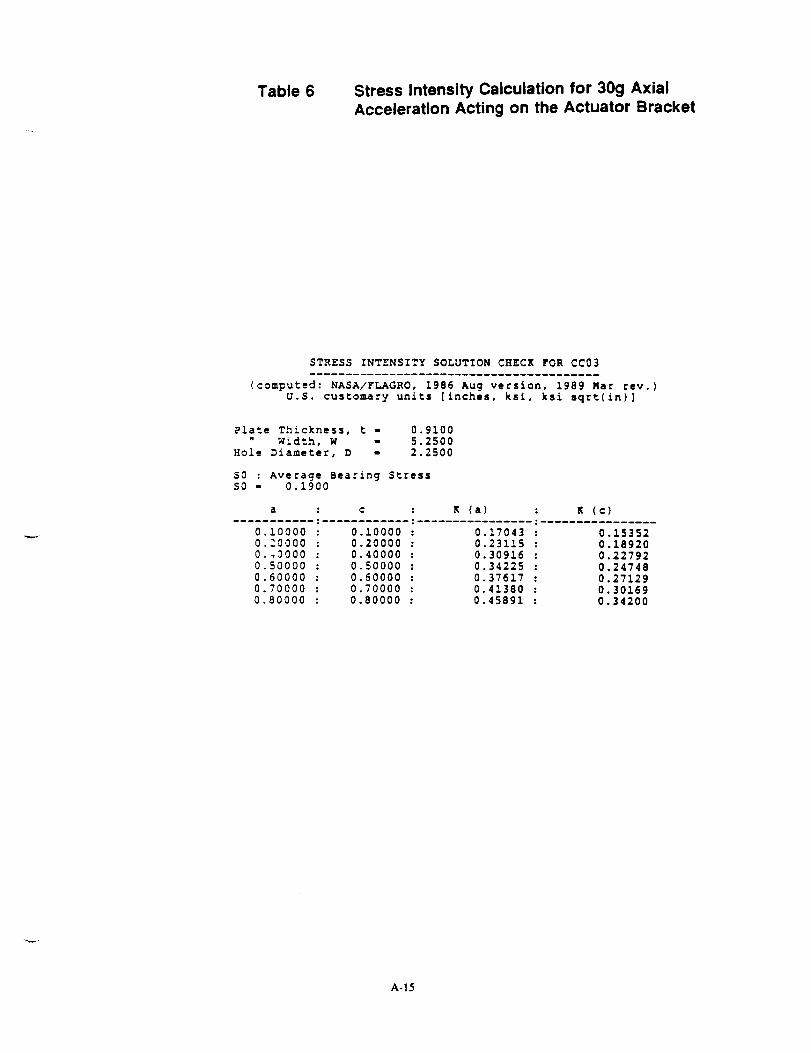
Table 6 Stress Intensity Calculation for 30g AxialAcceleration Acting on the Actuator Bracket
STRESS INTENSITY SOLUTION CHECK FOR CC03
(computed: NASA/FLAGRO, 1986 Aug version, 1989 Rat rev.)
U.S. customary units [inches, ksi, ksi sqrt(in)]
Plate Thickness, t - 0.9100
" Width, w - 5.2500
Hole Diameter, D - 2.2500
S0 : Averaqe Bea_ing StressS0 - 0.1900
a : c : K (a)
0.10000 : 0.10000 :
0.20000 : 0.20000 :
0._0000 : 0.40000 :
0.50000 : 0.50000 :
0.60000 : 0.60000 :
0.70000 : 0.70000 :
0.80000 : 0.80000 :
: K (c)
0.17043 :
0.23115 :
0.30916 :
0.34225 :
0.37617 :
0.41380 :
0.45891 :
0.15352
0.18920
0.22792
0.24748
0.27129
0.30169
0.34200
A-15
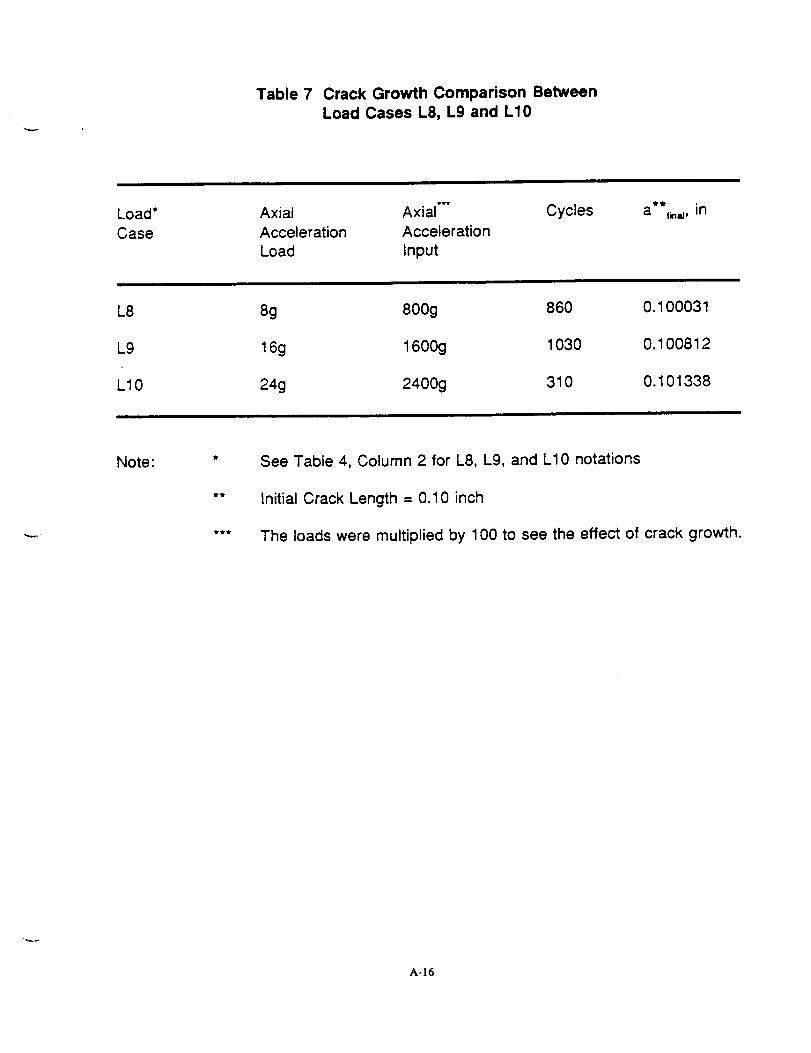
Table 7 Crack Growth Comparison Between
Load Cases L8, L9 and L10
Load*
Case
ttt
Axial Axial
Acceleration Acceleration
Load Input
Cycles a**_,_, in
L8
L9
L10
8g 800g 860 0.100031
16g 1600g 1030 0.100812
24g 2400g 310 0.101338
Note: See Table 4, Column 2 for L8, L9, and L10 notations
Initial Crack Length = 0.10 inch
The loads were multiplied by 100 to see the effect of crack growth.
A-16
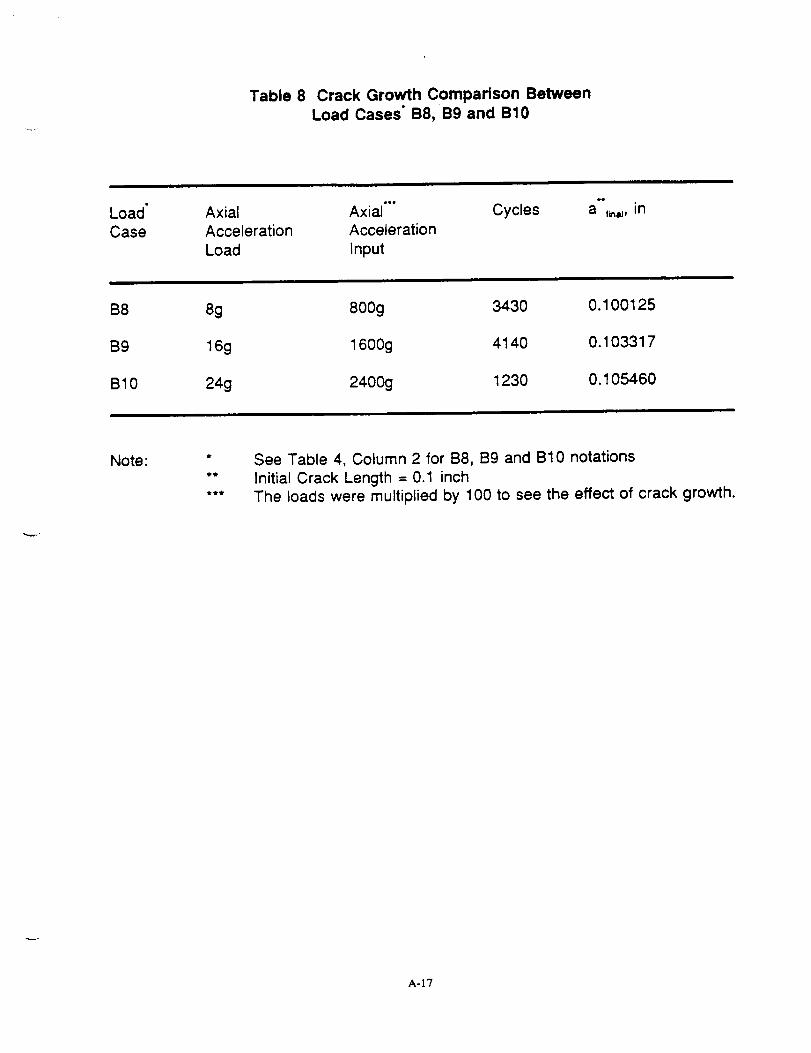
Table 8 Crack Growth Comparison BetweenLoad Cases" B8, B9 and B10
Load"
Case
Axial Axial'" Cycles a"f,,,_, in
Acceleration Acceleration
Load Input
B8
B9
B10
8g
16g
24g
800g 3430 0.100125
1600g 4140 0.103317
2400g 1230 0.105460
Note: t
tt
See Table 4, Column 2 for B8, B9 and B10 notations
Initial Crack Length = 0.1 inchThe loads were multiplied by 100 to see the effect of crack growth.
A-17
_CORPORA_ON
SPACE OPERATIONS
23 February 1993
L711-FY93-M348
TO:
FROM:
SUBJECT:
T. Nhan
Nozzle Structural Analysis
J. D. McCormack
System Analysis
Nozzle Actuator Fatigue Loads
The table and figure in this memorandum (Table 5.4.2-1 and Figure
5.4.2-1), are the proposed table and figure to be placed in TWR-
16801, Volume 2, Revision B. This data is provided to support
release of a Design Engineering document that necessarily must be
released prior to the release of TWR-16801, Volume 2, Revision B
(planned to be released by the end of March).
_. D. _McCormack
Systems Analysis
Concurrence :
D. R. Mason, Supervisor
Systems Analysis
JDM/tlw
A-18
Miss:cn
P_ase
',.Jftorf
I Case I
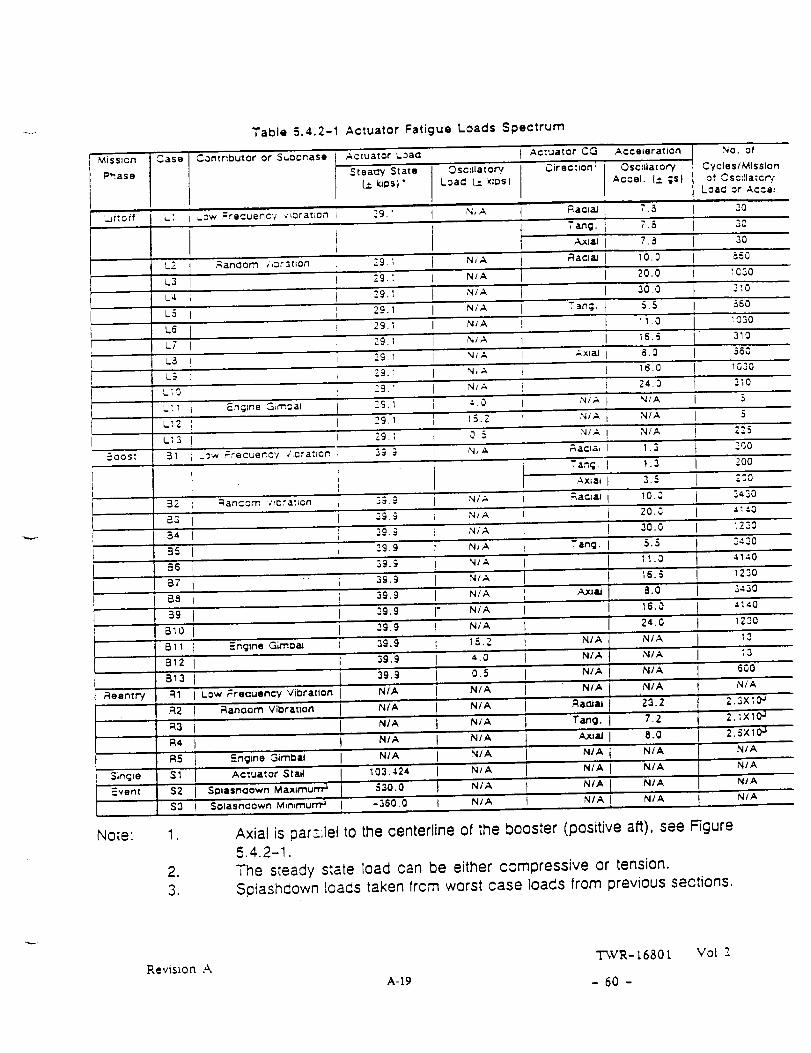
Table 5.4.2-1 Actuator Fatigue Loads Spectrum
Contributor or Suoonase Actuator L._aa
$ tea_7 State
(± _i=s)"
Ac:uator C,_ Acceleratlon
Osc:ilatcry 0Jr ec',lon : Osczliat ory
Loa_ I__ ki_s) Accei. (_ ;s)
N<_. ot
Cycles/Mission
of Csc:ilatcP:'Loa¢ or Accai
__: _.ow =recuency J_orat;on _9.: N,A 3030
NiA
N/A
._ at_ (3OtT1 '/,Or 30on Z9.1
2.9.1
"2
Aaa_al 7.3
Tang. 7.8
Axial 7.
_ac,aJ 10.3
20.0
30,0
Tang. 5.5
11.0
30
550
_C30L.3
L4 29.1 N/A :,',0
L5 29.1 N,'A 550
L5 29. _ N/A '0,30ii
L7 NIA
LS 29. l N/A
L_ 29. : N,A 1O30
L_O Z9.1 NtA 3]0
:,.0
29.1
29.1-'I EnQ:ne _irnCal
310
36G
L_2 29.1 15.2
L;3 29.1 O 5 2.25
5ocs: I _I __w ;recuenc'¢ 4icrat_on 3;.3 N,A Z_0, 2.00
_.=3.9_anccrn ,'m.ratlonB2
=.3
34
85
85
@7
88
3,_. -3
39.9
3g.9
3g._
3£.9
39.9
,_/_
NzA
N/A
N/A
N/A
NIA
N/A
89
810
_9.9 I- NIA
39.9 l N/A
3g.9 I "= _
3g.9 I =.0
39.9 I o.s
N/A ! N/A
NIA I N/A
N/A I N/A
_=nq_ne Girno,_
Event S2
_6.5
Ax_m 8.0
_6.0
2.4.3
NIA N/A
NiA N/A
N/A NIA
Aac:a, I.3
T an q . I. 3
Ax, m 3.
AaC_a_ I 0.0
2.0.0
30.0
r anq. 5.5
11.0
_6.5
Ax_ 8.0
_6.0
24.0
NIA NtA
NIA NIA
NIA N/A
NIA N/A
_aaim Z3.2
Tang. 7.2
Ax_ 8.0
NIA NtA
NIA N/A
N/A N/A
N/A NIA$3
L0w Freauency Vibration
Banoorn Vibratton
SOlasnaown Min_rnur'n 'a
i
N/A I NIA
Engine Girnio al NIA ] NIA
Actuator Stall I 103.424 I NIASDlasnoown Maximu rrt3 530.0 I NIA
{ -360.0 t NIA
130
3¢,30
=: :.0
:230
_430
4140
1230
5430
4140
1230
13
;3
500
N/A
I 2.3X_0 _2._xIo _
t '?'"SXlO_
NIA
NIA
NIA
1 NIA
Note: 1.
2.
3.
Axial is par-:lel to the centerline of the booster (positive aft), see Figure
= 4.2-1.,,a,
The steady state load can be either compressive or tension.
Splashdown Ioacis taken frcm worst case loads from previous sections.
Revision A
A-19
Vol _-
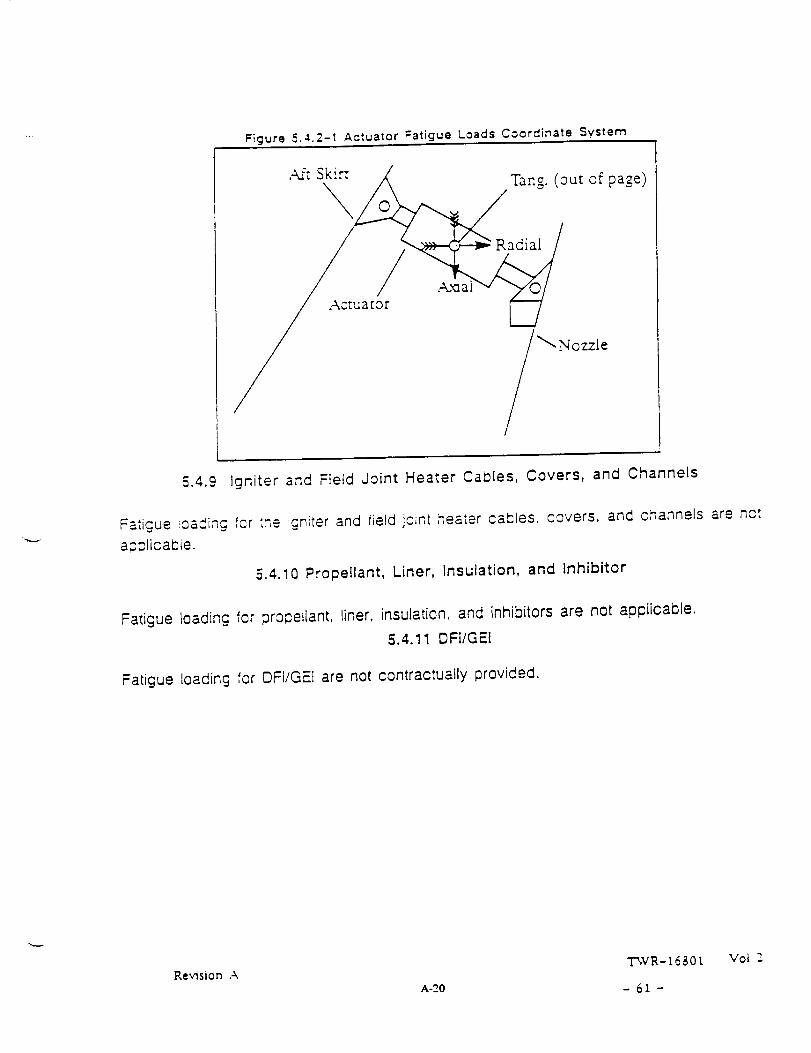
Figure 5.4.2-1 Actuator Fatigue Loads Coordinate System
,_ S__ Tan=_.(outofpa_e)
5.4.9 Igniter and Field Joint Heater Cables, Covers, and Channels
Fatigue !oaC.iag for the icniter and fietd joint heater cables, covers, and channels are act
a;plicaCie.
5.4.10 Propellant, Liner, Insulation, and Inhibitor
Fatigue loading for propellant, liner, insulation, and inhibitors are not applicable.
5.4.11 DFI/GEI
Fatigue loading for OFt/GEl are not contractually provided.
Revision AA-20
Voi _
_"_._C--_ CORPORATION
SPACE OPERATIONS
Attachment B
920819-I. I B-I TWR-18168
t,Jat_onal,_,eronaut_cs ar, d
Space Adm_ntslralron
George C. Marshall Space Flight CenterMarshall Space Fhght Cenler_ Alabama
35812
SA51(192-90)
Davis/4-5264
hSA
APR 1 .! 1990
Thiokol Corporation
Attn: Mr. C. A. Speak
P. O. Box 707, M/S E60
Brigham City, UT 84302-0707
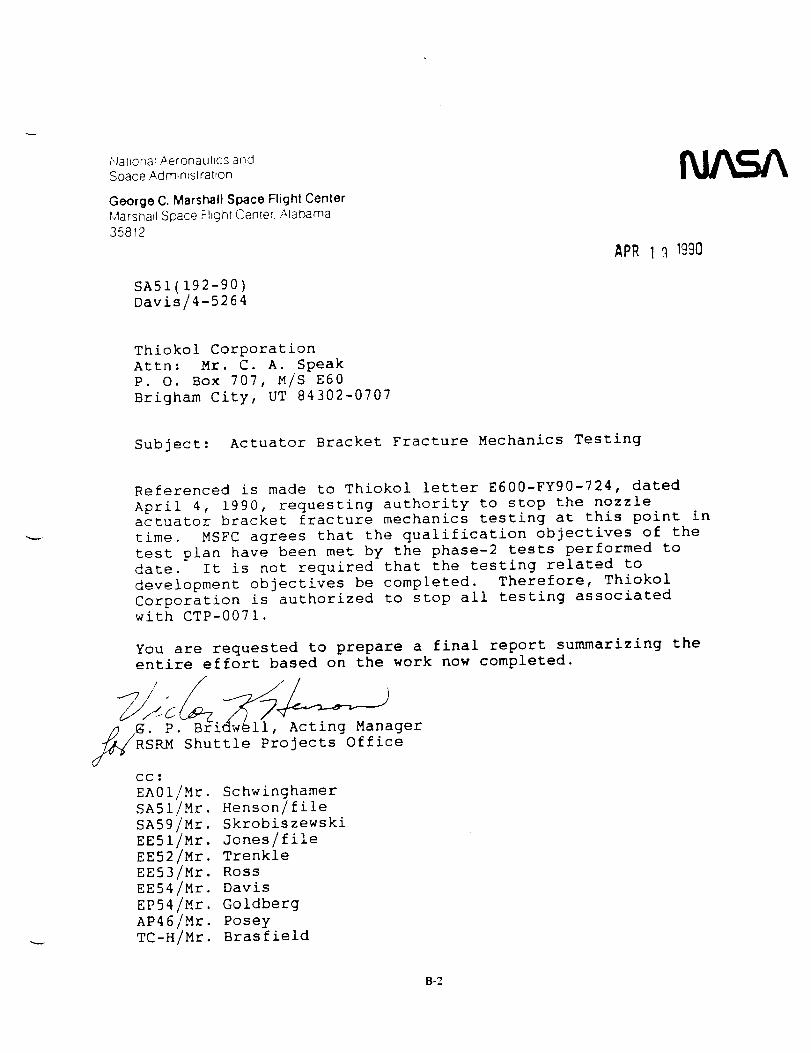
Subject: Actuator Bracket Fracture Mechanics Testing
Referenced is made to Thiokol letter E600-FY90-724, dated
April 4, 1990, requesting authority to stop the nozzleactuator bracket fracture mechanics testing at this point in
time. MSFC agrees that the qualification objectives of the
test plan have been met by the phase-2 tests performed to
date. It is not required that the testing related to
development objectives be completed. Therefore, Thiokol
Corporation is authorized to stop all testing associated
with CTP-0071.
You are requested to prepare a final report summarizing the
entire effort based on the work now completed.
__ P. Bridw_ll, Acting ManagerRM Shuttle Projects Office
cc:
EA01/Mr. Schwinghamer
SA51/Mr. Henson/file
SA59/Mr. Skrobiszewski
EE51/Mr. Jones/file
EE52/Mr
EE53/Mr
EE54/Mr
EP54/Mr
AP46/Mr
TC-H/Mr
Trenkle
Ross
Davis
Goldberg
PoseyBrasfield
B-2
_"_ CORPORA T/ON
SPA CE OPERA TIONS
DISTRIBUTION
Recipient
G. Berhoid
D. Campbell
F. Duersch
G. Laird
P. Kelley
T. Nhan
T. Lai
B. Phipps
S. Kelly
R. Papasian
G. Paul
Data Management
Print Crib
No. of
1
1
1
1
1
1
1
1
1
31
1
1
5
Mail Stop
L82
L71
851
E68
L71
L63
L63
L63
L50
E62A
L71
L71F
MICRO