Embed Size (px)
Citation preview
RSWrVl Limited an LNJ Bhilwara Group Company
September 21, 2018
BSE Limited Corporate Relationship Department, lst Floor, New Trading Ring, Rotunda Building, P.J. Towers, Dalal Street, MUMBAI - 400 001.
Scrip Code: 500350
Dear Sir,
PROUD TO BE JNDJAN PRIVJl EGED TO BE GLOBAL
Pursuant to Regulation 34 of the SEBI (Listing Obligations and Disclosure Requirements) Regulations, 2015 please find enclosed herewith Annual Report of the Company duly approved and adopted by the Members of the Company in their Meeting held on 13th September, 2018.
Thanking you,
Yours faithfully, For RSWM LIMITED
SURENDER GUPTA COMPANY SECRETARY FCS-2615
Encl.: As above
(Formerly Rajasthan Spinning & Weaving Mills Limited)
Corporate Office : Bhilwara Towers, A-12, Sector-1
Naida - 201 301 (NCR-Delhi), India Tel. : +91-120-4390300 (EPABX)
Fax: +91-120-4277841 Website : www.rswm.in
GSTIN: 09AAACR9700M1Z1
Regd. Office : Kharigram, Post Office Gulabpura - 311 021 Dist!. Bhilwara, (Rajasthan), India Tel.: +91-1483-223144 to 223150, 223478 Fax: +91-1483-223361, 223479 Website : www.lnjbhilwara.com GSTIN: 08AAACR9700M1Z3
Corporate Identification Number: L 17115RJ1960PLC008216
ANNUAL REPORT 2017-18
Envisioning a better future.
Contents
02 | Blueprint for a Better Future
04 | Group Introduction
05 | RSWM Ltd. at a Glance
06 | What Drives Us Ahead 08 | The Evolution of RSWM
10 | Our Value Creating Business Model
16 | Our Presence
17 | Brands We Serve
18 | Chairman’s Message
20 | Managing Director’s Message
22 | Financial Snapshot
23 | Our People
24 | Our Facilities
26 | Sustainability
28 | Board of Directors
30 | Corporate Information
Corporate Overview02-30
31 | Management Discussion and Analysis
38 | Directors’ Report
44 | Annexures to Directors’ Report
76 | Corporate Governance Report
96 | 6 Years Highlights
Management Reports31-96
97 | Standalone Financial Statements
177 | Consolidated Financial Statements
Financial Statements97-221
Forward-Looking Statements
We have exercised utmost care in the preparation of this report. It contains forecasts and/or information relating to forecasts. Forecasts are based on facts, expectations, and/or past figures. As with all forward looking statements, forecasts are connected with known and unknown uncertainties, which may mean that the actual result may deviate significantly from the forecast. Forecasts prepared by the third parties, or data or evaluations used by third parties and mentioned in this communication, may be inappropriate, incomplete, or falsified. We cannot assess whether information in this report has been taken from third parties, or these provide the basis of our own evaluations, such use is made known in this report. As a result of the above mentioned circumstances, we can provide no warranty regarding the correctness, completeness and upto-date nature of information taken and declared as being taken, from third parties, as well as for forward looking statements, irrespective of whether these derive from third parties or ourselves. Readers should keep this in mind. We undertake no obligation to publicly update any forward-looking statements, whether as a result of new information, future events or otherwise.
We’re weaving the next level of our success journey by setting our goals higher, innovating through our products better, and aiming to create values that last longer. Our strategies and actions are inspired by our visions of a future that’s dynamic, sustainable and a whole lot better. And we are committed to reach it, sooner!
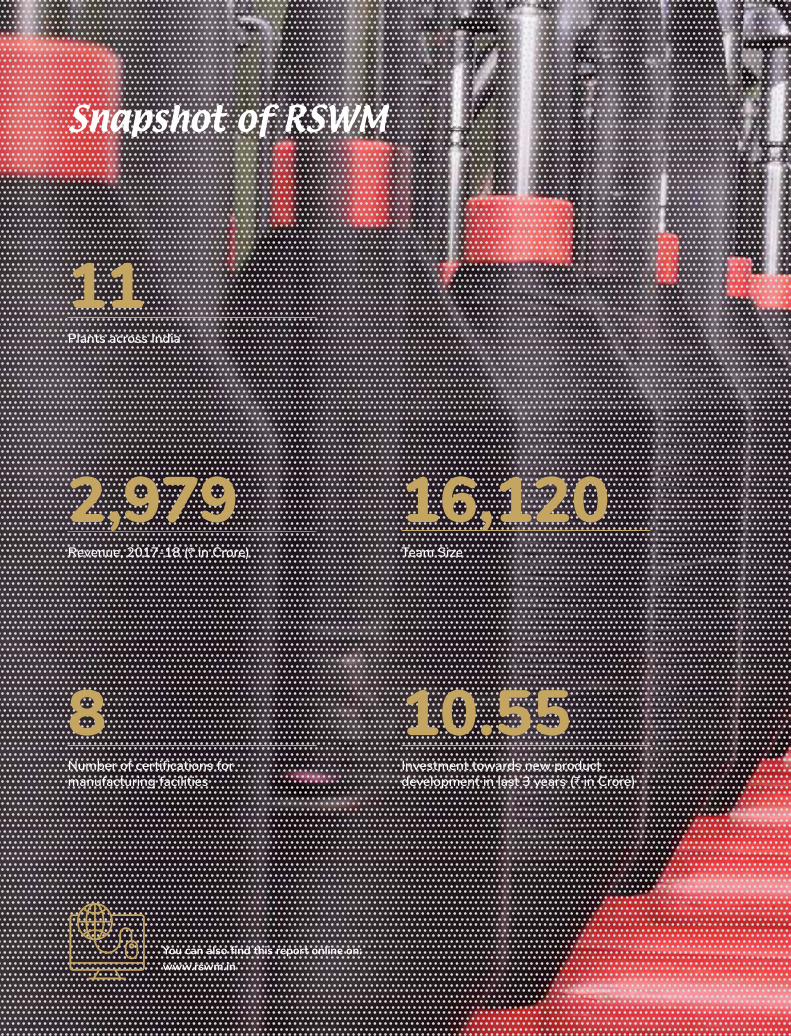
Snapshot of RSWM
You can also find this report online on: www.rswm.in
11Plants across India
2,979Revenue, 2017-18 (H in Crore)
8Number of certifications for manufacturing facilities
16,120Team Size
10.55Investment towards new product development in last 3 years (H in Crore)
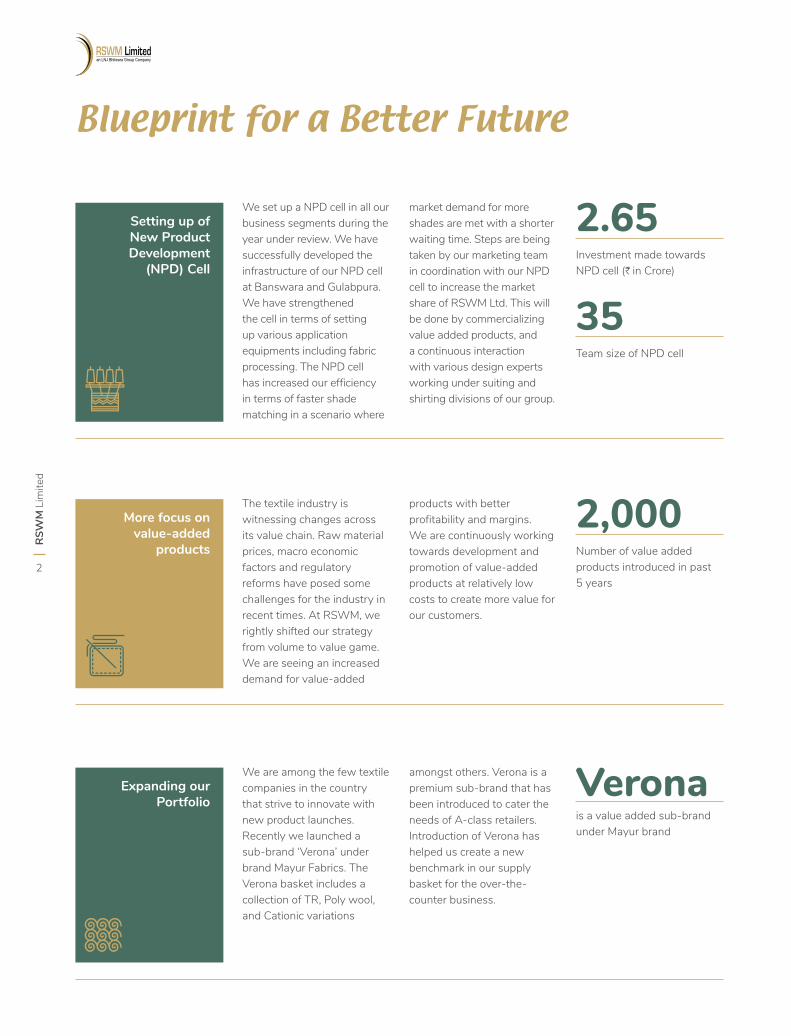
Blueprint for a Better Future
Setting up of New Product Development
(NPD) Cell
Expanding our Portfolio
More focus on value-added
products
We set up a NPD cell in all our business segments during the year under review. We have successfully developed the infrastructure of our NPD cell at Banswara and Gulabpura. We have strengthened the cell in terms of setting up various application equipments including fabric processing. The NPD cell has increased our efficiency in terms of faster shade matching in a scenario where
The textile industry is witnessing changes across its value chain. Raw material prices, macro economic factors and regulatory reforms have posed some challenges for the industry in recent times. At RSWM, we rightly shifted our strategy from volume to value game. We are seeing an increased demand for value-added
We are among the few textile companies in the country that strive to innovate with new product launches. Recently we launched a sub-brand ‘Verona’ under brand Mayur Fabrics. The Verona basket includes a collection of TR, Poly wool, and Cationic variations
market demand for more shades are met with a shorter waiting time. Steps are being taken by our marketing team in coordination with our NPD cell to increase the market share of RSWM Ltd. This will be done by commercializing value added products, and a continuous interaction with various design experts working under suiting and shirting divisions of our group.
products with better profitability and margins. We are continuously working towards development and promotion of value-added products at relatively low costs to create more value for our customers.
amongst others. Verona is a premium sub-brand that has been introduced to cater the needs of A-class retailers. Introduction of Verona has helped us create a new benchmark in our supply basket for the over-the-counter business.
2.65Investment made towards NPD cell (H in Crore)
2,000Number of value added products introduced in past 5 years
Veronais a value added sub-brand under Mayur brand
35Team size of NPD cell
RSW
M L
imite
d
2
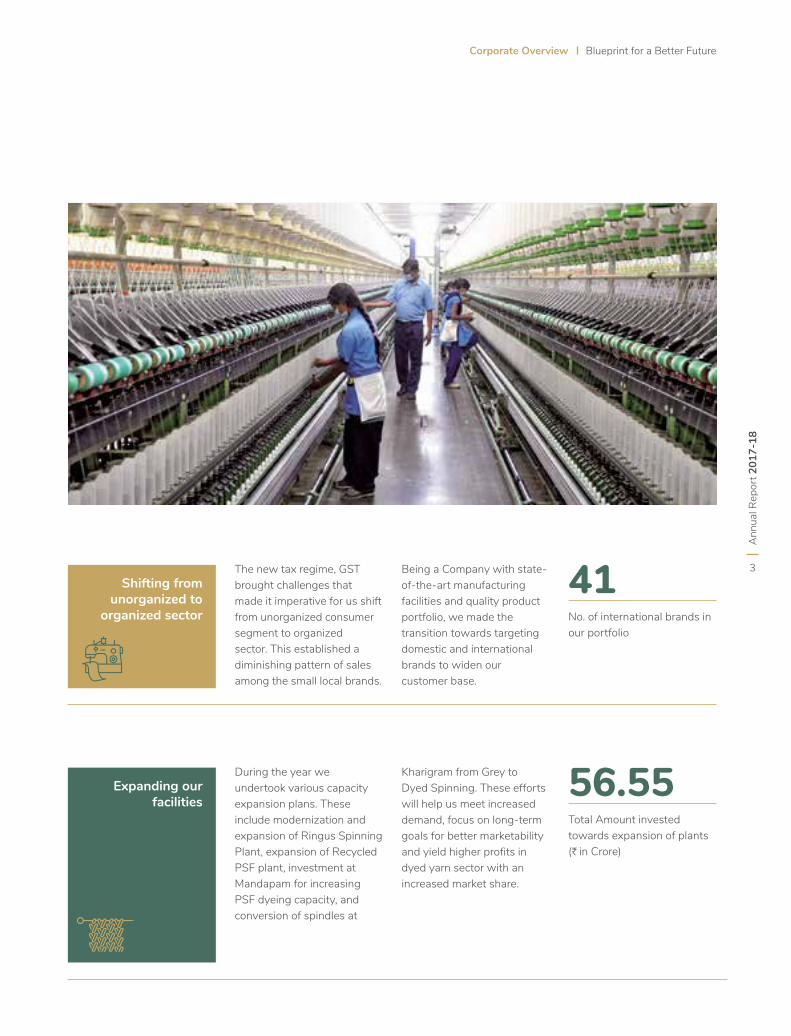
Expanding our facilities
During the year we undertook various capacity expansion plans. These include modernization and expansion of Ringus Spinning Plant, expansion of Recycled PSF plant, investment at Mandapam for increasing PSF dyeing capacity, and conversion of spindles at
Kharigram from Grey to Dyed Spinning. These efforts will help us meet increased demand, focus on long-term goals for better marketability and yield higher profits in dyed yarn sector with an increased market share.
56.55Total Amount invested towards expansion of plants (H in Crore)
Shifting from unorganized to
organized sector
The new tax regime, GST brought challenges that made it imperative for us shift from unorganized consumer segment to organized sector. This established a diminishing pattern of sales among the small local brands.
Being a Company with state-of-the-art manufacturing facilities and quality product portfolio, we made the transition towards targeting domestic and international brands to widen our customer base.
41No. of international brands in our portfolio
Ann
ual R
epor
t 201
7-18
3
Corporate Overview Blueprint for a Better Future
Group Introduction
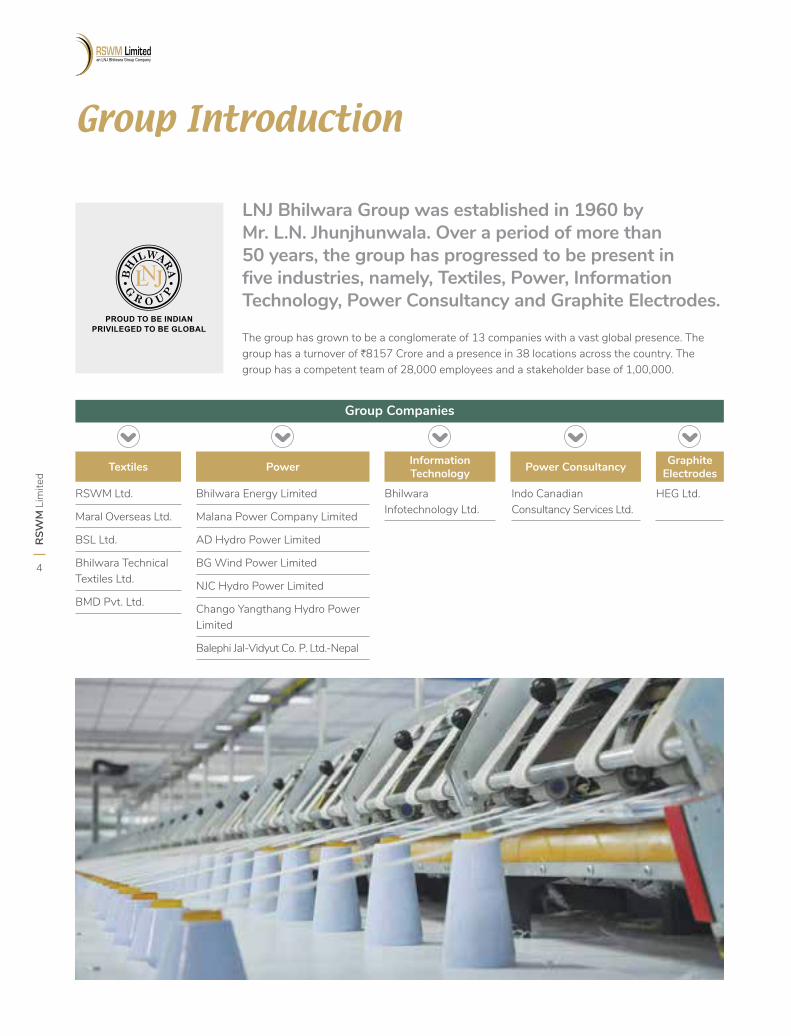
LNJ Bhilwara Group was established in 1960 by Mr. L.N. Jhunjhunwala. Over a period of more than 50 years, the group has progressed to be present in five industries, namely, Textiles, Power, Information Technology, Power Consultancy and Graphite Electrodes.
The group has grown to be a conglomerate of 13 companies with a vast global presence. The group has a turnover of H8157 Crore and a presence in 38 locations across the country. The group has a competent team of 28,000 employees and a stakeholder base of 1,00,000.
Textiles
RSWM Ltd.
Maral Overseas Ltd.
BSL Ltd.
Bhilwara Technical Textiles Ltd.
BMD Pvt. Ltd.
Bhilwara Energy Limited
Malana Power Company Limited
AD Hydro Power Limited
BG Wind Power Limited
NJC Hydro Power Limited
Chango Yangthang Hydro Power Limited
Balephi Jal-Vidyut Co. P. Ltd.-Nepal
Bhilwara Infotechnology Ltd.
Indo Canadian Consultancy Services Ltd.
HEG Ltd.
Power Information Technology Power Consultancy Graphite
Electrodes
Group Companies
Registered Office
Kharigram, P.O. Gulabpura - 311 021
Dist. Bhilwara (Rajasthan), India
Website: www.rswm.in/www.lnjbhilwara.com
CIN: L17115RJ1960PLC008216
RSW
M L
imite
d
4
RSWM Ltd. at a Glance
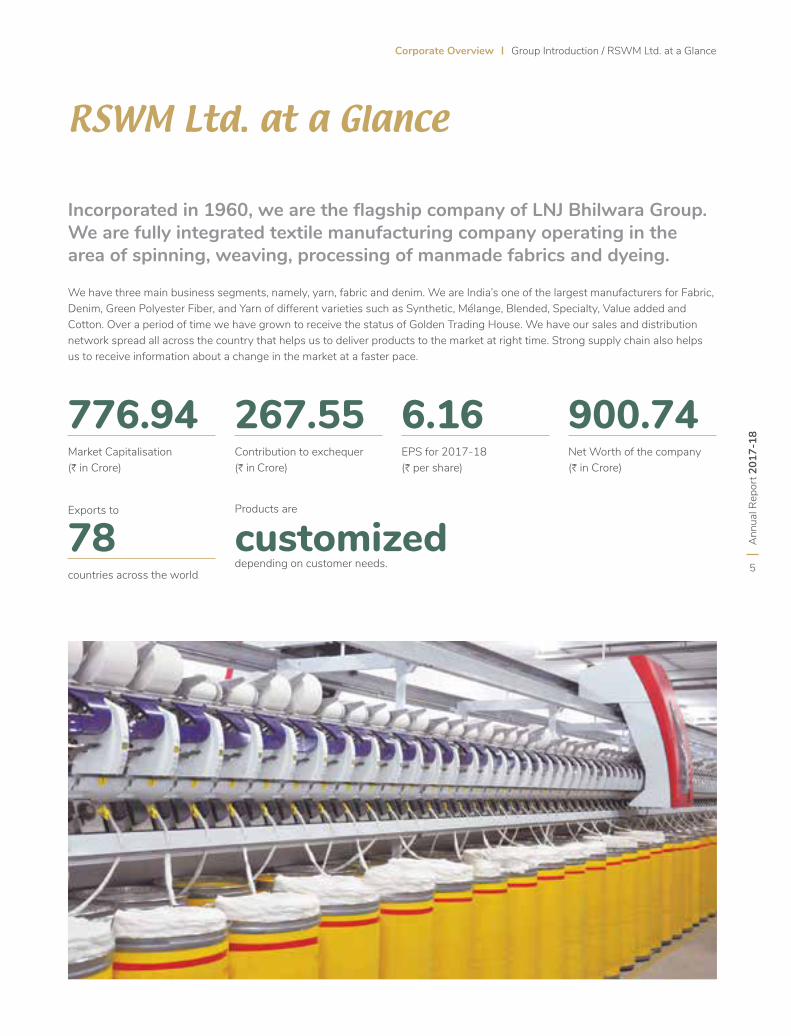
Incorporated in 1960, we are the flagship company of LNJ Bhilwara Group. We are fully integrated textile manufacturing company operating in the area of spinning, weaving, processing of manmade fabrics and dyeing.
We have three main business segments, namely, yarn, fabric and denim. We are India’s one of the largest manufacturers for Fabric, Denim, Green Polyester Fiber, and Yarn of different varieties such as Synthetic, Mélange, Blended, Specialty, Value added and Cotton. Over a period of time we have grown to receive the status of Golden Trading House. We have our sales and distribution network spread all across the country that helps us to deliver products to the market at right time. Strong supply chain also helps us to receive information about a change in the market at a faster pace.
776.94Market Capitalisation (H in Crore)
6.16EPS for 2017-18 (H per share)
78countries across the world
267.55Contribution to exchequer (H in Crore)
900.74Net Worth of the company (H in Crore)
Products are
customized depending on customer needs.
Exports to
Ann
ual R
epor
t 201
7-18
5
Corporate Overview Group Introduction / RSWM Ltd. at a Glance
What Drives Us Ahead
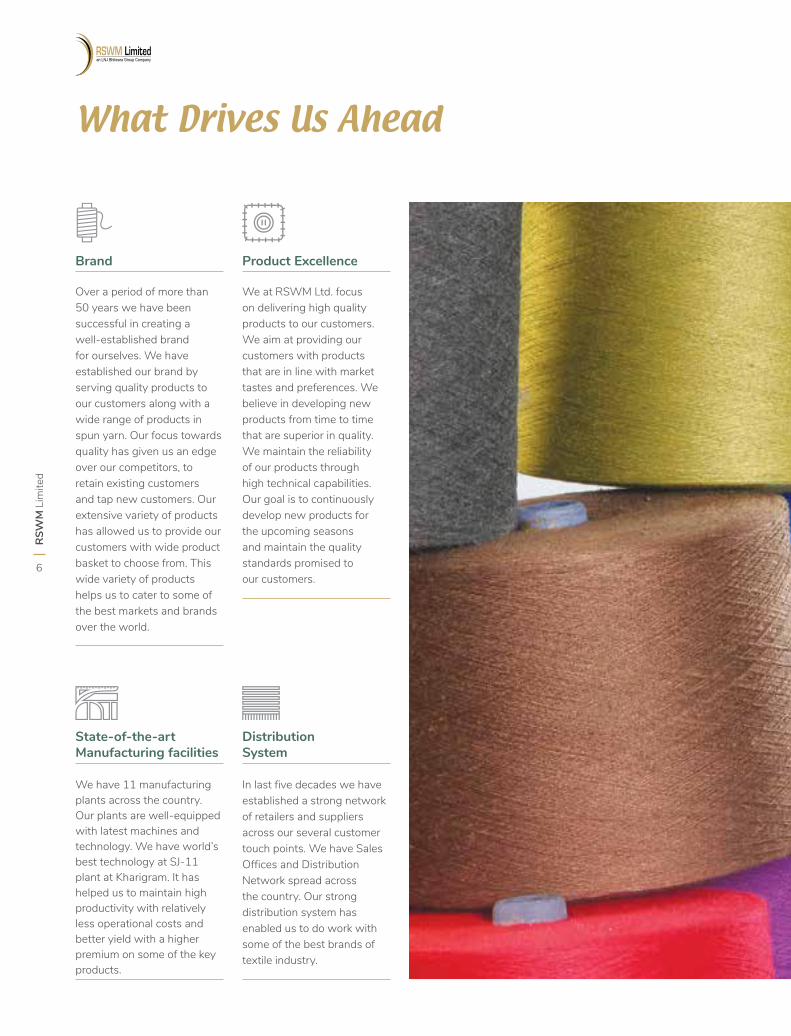
Over a period of more than 50 years we have been successful in creating a well-established brand for ourselves. We have established our brand by serving quality products to our customers along with a wide range of products in spun yarn. Our focus towards quality has given us an edge over our competitors, to retain existing customers and tap new customers. Our extensive variety of products has allowed us to provide our customers with wide product basket to choose from. This wide variety of products helps us to cater to some of the best markets and brands over the world.
Brand
We at RSWM Ltd. focus on delivering high quality products to our customers. We aim at providing our customers with products that are in line with market tastes and preferences. We believe in developing new products from time to time that are superior in quality. We maintain the reliability of our products through high technical capabilities. Our goal is to continuously develop new products for the upcoming seasons and maintain the quality standards promised to our customers.
Product Excellence
We have 11 manufacturing plants across the country. Our plants are well-equipped with latest machines and technology. We have world’s best technology at SJ-11 plant at Kharigram. It has helped us to maintain high productivity with relatively less operational costs and better yield with a higher premium on some of the key products.
State-of-the-art Manufacturing facilities
In last five decades we have established a strong network of retailers and suppliers across our several customer touch points. We have Sales Offices and Distribution Network spread across the country. Our strong distribution system has enabled us to do work with some of the best brands of textile industry.
Distribution System
RSW
M L
imite
d
6
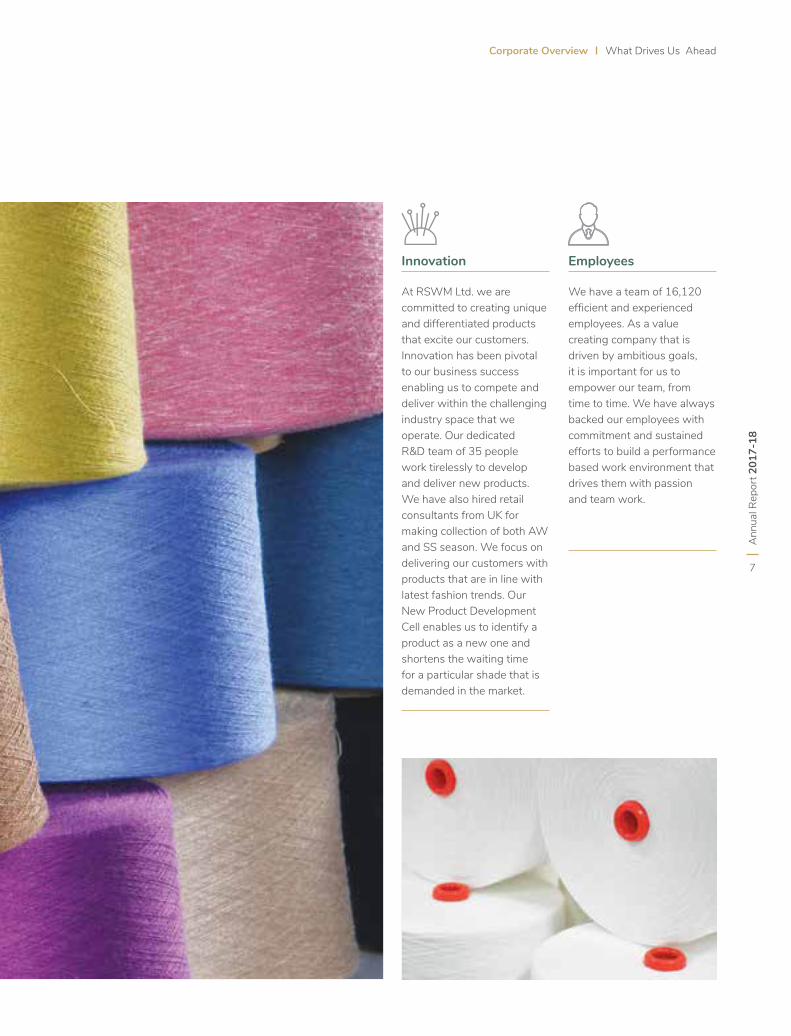
Innovation Employees
At RSWM Ltd. we are committed to creating unique and differentiated products that excite our customers. Innovation has been pivotal to our business success enabling us to compete and deliver within the challenging industry space that we operate. Our dedicated R&D team of 35 people work tirelessly to develop and deliver new products. We have also hired retail consultants from UK for making collection of both AW and SS season. We focus on delivering our customers with products that are in line with latest fashion trends. Our New Product Development Cell enables us to identify a product as a new one and shortens the waiting time for a particular shade that is demanded in the market.
We have a team of 16,120 efficient and experienced employees. As a value creating company that is driven by ambitious goals, it is important for us to empower our team, from time to time. We have always backed our employees with commitment and sustained efforts to build a performance based work environment that drives them with passion and team work.
Ann
ual R
epor
t 201
7-18
7
Corporate Overview What Drives Us Ahead
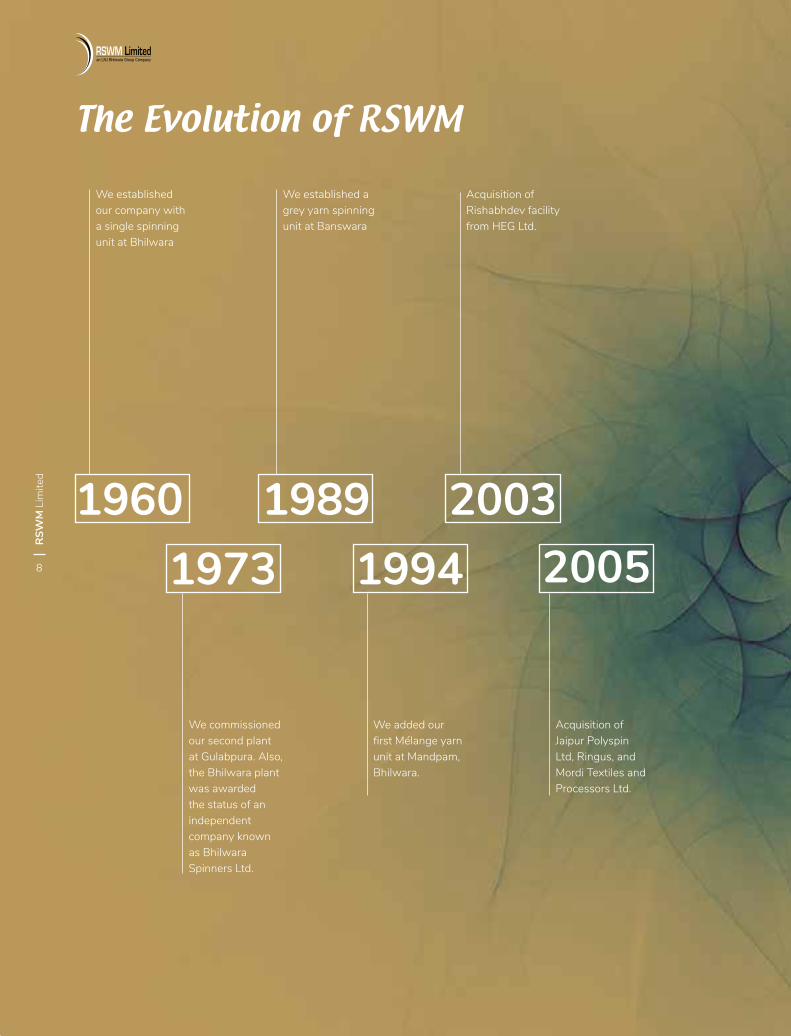
The Evolution of RSWM
19601973
19891994 2005
2003
We established our company with a single spinning unit at Bhilwara
We commissioned our second plant at Gulabpura. Also, the Bhilwara plant was awarded the status of an independent company known as Bhilwara Spinners Ltd.
We established a grey yarn spinning unit at Banswara
We added our first Mélange yarn unit at Mandpam, Bhilwara.
Acquisition of Jaipur Polyspin Ltd, Ringus, and Mordi Textiles and Processors Ltd.
Acquisition of Rishabhdev facility from HEG Ltd.
RSW
M L
imite
d
8
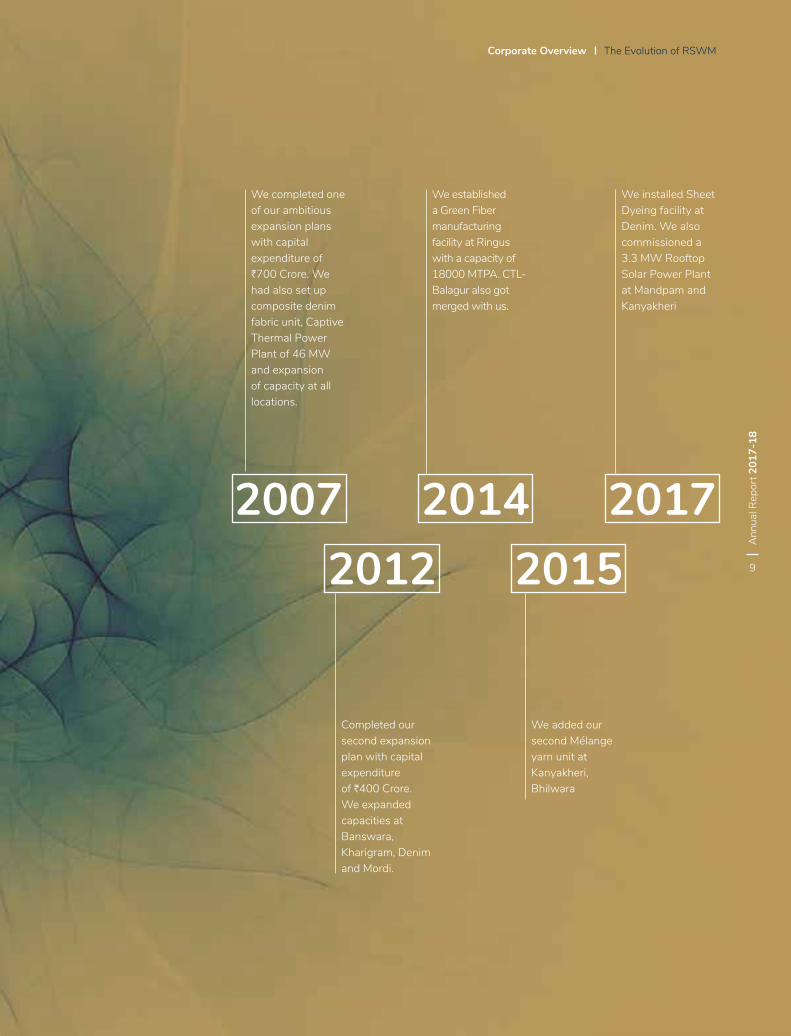
20072012
20142015
2017
We completed one of our ambitious expansion plans with capital expenditure of H700 Crore. We had also set up composite denim fabric unit, Captive Thermal Power Plant of 46 MW and expansion of capacity at all locations.
Completed our second expansion plan with capital expenditure of H400 Crore. We expanded capacities at Banswara, Kharigram, Denim and Mordi.
We established a Green Fiber manufacturing facility at Ringus with a capacity of 18000 MTPA. CTL-Balagur also got merged with us.
We added our second Mélange yarn unit at Kanyakheri, Bhilwara
We installed Sheet Dyeing facility at Denim. We also commissioned a 3.3 MW Rooftop Solar Power Plant at Mandpam and Kanyakheri
Corporate Overview The Evolution of RSWM
Ann
ual R
epor
t 201
7-18
9
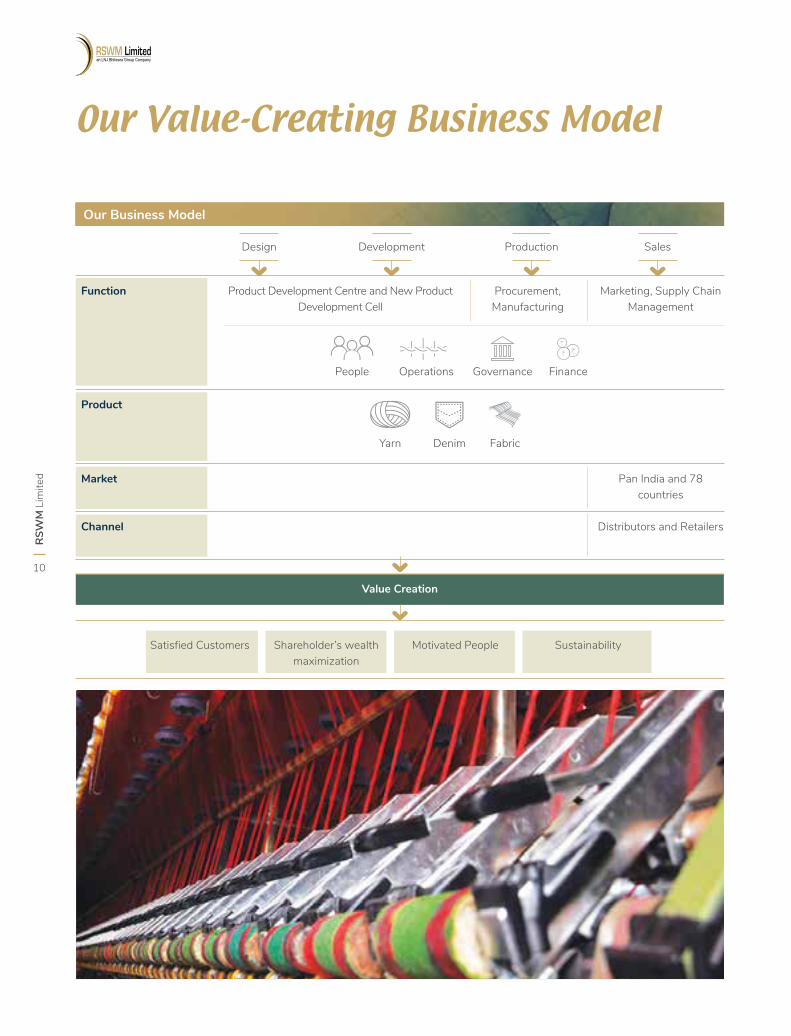
Our Value-Creating Business Model
Our Business Model
Function
Product
Market
Channel
Value Creation
Design Development Production Sales
Product Development Centre and New Product Development Cell
Yarn
People GovernanceOperations Finance
Denim Fabric
Procurement, Manufacturing
Marketing, Supply Chain Management
Pan India and 78 countries
Distributors and Retailers
Shareholder’s wealth maximization
Satisfied Customers SustainabilityMotivated People
RSW
M L
imite
d
10
For Customers
For Shareholders
For People
We at RSWM Ltd., have given utmost importance to our customers. We have taken required steps to provide them with the latest products in time. Our customer centric approach enabled us to have a client base of more than 600 clients
Our aim is to provide maximum return to our shareholders. With this we have focused on wealth maximization of our shareholders rather than profit maximization. Our shareholders have always put their trust and confidence on us and we have respected this by way of providing return to them.
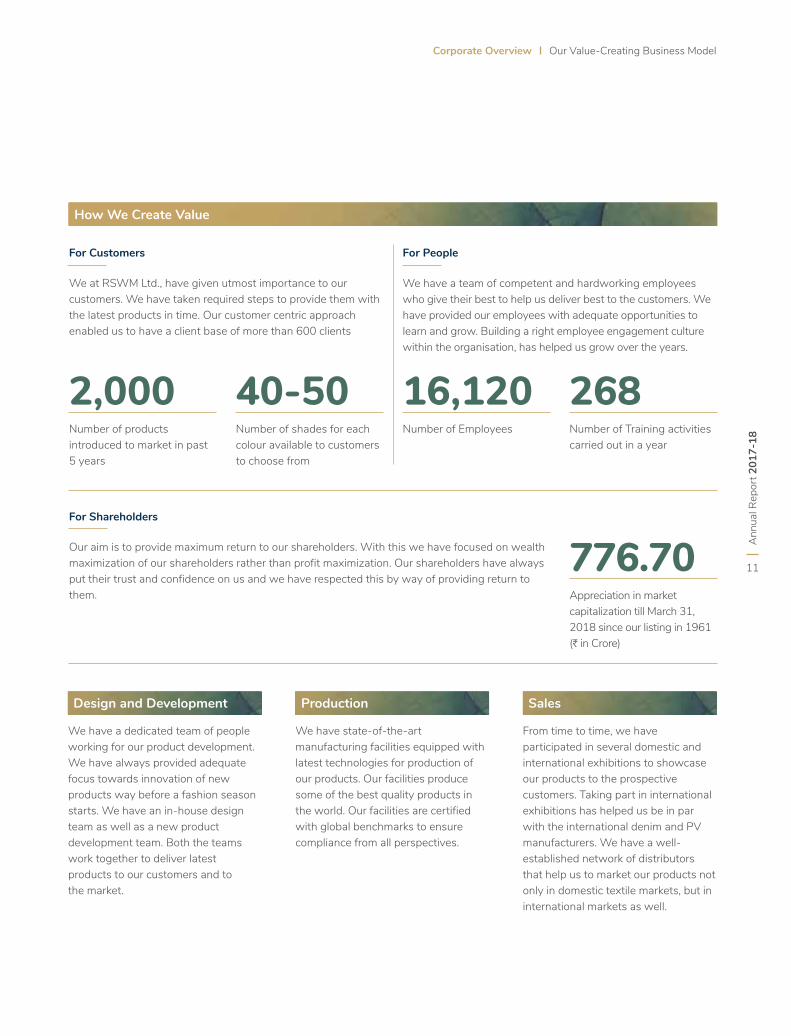
We have state-of-the-art manufacturing facilities equipped with latest technologies for production of our products. Our facilities produce some of the best quality products in the world. Our facilities are certified with global benchmarks to ensure compliance from all perspectives.
We have a dedicated team of people working for our product development. We have always provided adequate focus towards innovation of new products way before a fashion season starts. We have an in-house design team as well as a new product development team. Both the teams work together to deliver latest products to our customers and to the market.
From time to time, we have participated in several domestic and international exhibitions to showcase our products to the prospective customers. Taking part in international exhibitions has helped us be in par with the international denim and PV manufacturers. We have a well-established network of distributors that help us to market our products not only in domestic textile markets, but in international markets as well.
We have a team of competent and hardworking employees who give their best to help us deliver best to the customers. We have provided our employees with adequate opportunities to learn and grow. Building a right employee engagement culture within the organisation, has helped us grow over the years.
How We Create Value
Design and Development Production Sales
2,000 16,12040-50 268
776.70
Number of products introduced to market in past 5 years
Number of EmployeesNumber of shades for each colour available to customers to choose from
Number of Training activities carried out in a year
Appreciation in market capitalization till March 31, 2018 since our listing in 1961 (H in Crore)
Ann
ual R
epor
t 201
7-18
11
Corporate Overview Our Value-Creating Business Model
Our Business Segment
Revenue from different segments
Yarn (H in Crore)
15/16
16/17
17/18
2481.83
2512.91
2472.50
Fabric and Denim (H in Crore)
15/16
16/17
17/18
462.96
483.29
470.59
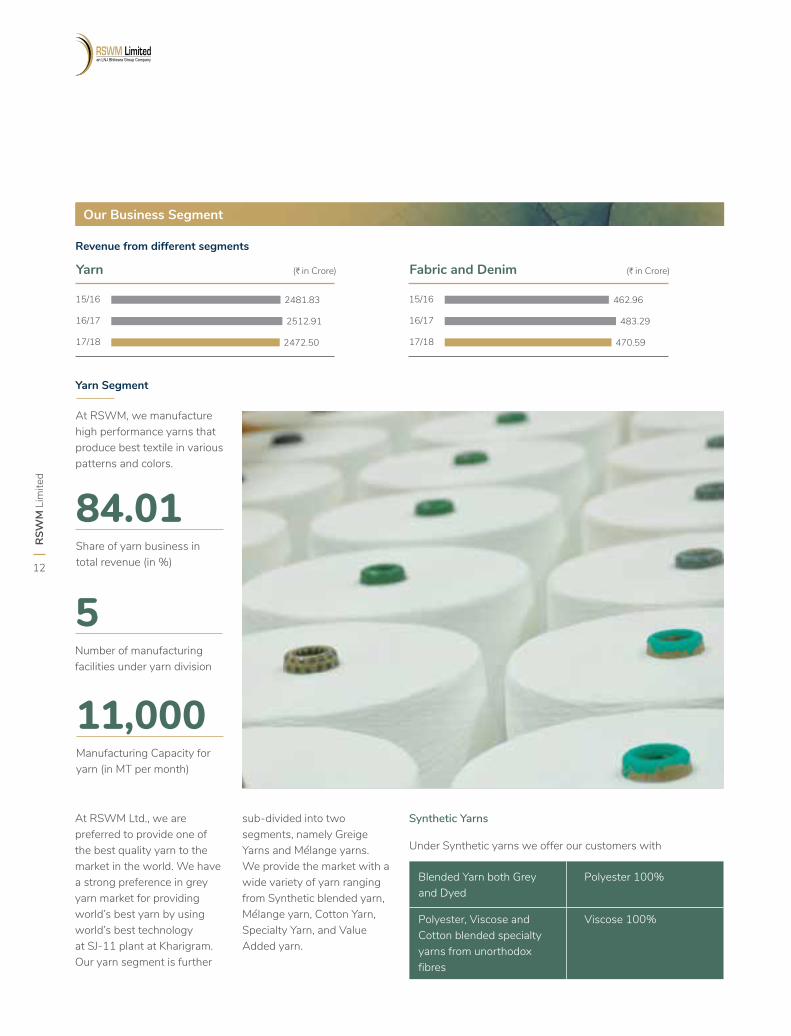
Yarn Segment
At RSWM, we manufacture high performance yarns that produce best textile in various patterns and colors.
At RSWM Ltd., we are preferred to provide one of the best quality yarn to the market in the world. We have a strong preference in grey yarn market for providing world’s best yarn by using world’s best technology at SJ-11 plant at Kharigram. Our yarn segment is further
sub-divided into two segments, namely Greige Yarns and Mélange yarns. We provide the market with a wide variety of yarn ranging from Synthetic blended yarn, Mélange yarn, Cotton Yarn, Specialty Yarn, and Value Added yarn.
Synthetic Yarns
Under Synthetic yarns we offer our customers with
Blended Yarn both Grey and Dyed
Viscose 100%
Polyester 100%
Polyester, Viscose and Cotton blended specialty yarns from unorthodox fibres
84.01
11,000
5
Share of yarn business in total revenue (in %)
Manufacturing Capacity for yarn (in MT per month)
Number of manufacturing facilities under yarn division
RSW
M L
imite
d
12
Mélange Yarns Three tier Measures in Yarn business:
We provide mélange yarn that is high value cotton yarn which is produced by combining two or more fibres. It is considered as a fancy yarn that is generally used for casual wear, sport wear, business suits, shirts, bed linen, decorative fabrics and other high end home furnishings. We have been creating superior quality mélange yarns since more than two decades. We produce and sell mélange yarns under the brand name Melantra.
1. To increase the value addition by diverting attention towards faster commercialization of new products, furnishing yarns and other value added yarns, we have also launched a well-defined CRM plan to meet our objective of gaining increased share of business in different market segment across the world. The CRM plan is ready for execution with direct involvement of business heads in different markets throughout the year.
2. To reduce the overall raw material cost incurred by us. This can be done by replacing RIL PSF with high tenancy captive recycled PSF in dyed yarns and selective qualities of grey yarns. This is in line with our strategic approach to add capacity of 25000 TPA in our captive plant of Recycled PSF plant from September 2018.
3. We have undertaken a measure of cost rationalization in 2017-18 and this exercise shall continue in 2018-19. Measure of cost rationalization includes steps to reduce operational costs in whichever way possible to save costs. This cost saving strategy includes energy conservation and increasing efficiency by updating into latest technology.
75,072
13,405
Spindles available for production of Mélange Yarn
Quantity produced of Mélange Yarn in 2017-18 (in MT)
Ann
ual R
epor
t 201
7-18
13
Corporate Overview Our Value-Creating Business Model
4.95
92
3
249
112.36
Share of fabric business in total revenue (in %)
Weaving (in %)
74Process House (in %)
Capacity Utilisation
Number of sub-brands under Mayur Fabrics
Number of manufacturing units under fabric division
Number of collections under Mayur Fabrics
Quantity of Fabric produced during the year (in Lakhs Mtrs.)
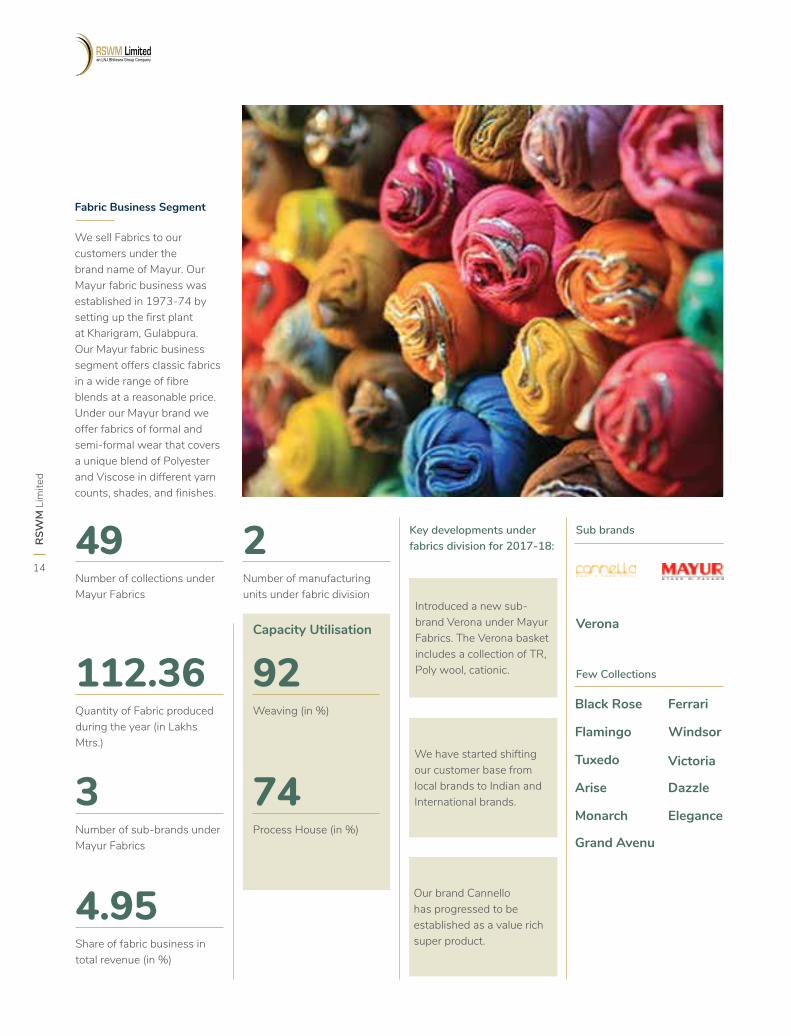
Fabric Business Segment
We sell Fabrics to our customers under the brand name of Mayur. Our Mayur fabric business was established in 1973-74 by setting up the first plant at Kharigram, Gulabpura. Our Mayur fabric business segment offers classic fabrics in a wide range of fibre blends at a reasonable price. Under our Mayur brand we offer fabrics of formal and semi-formal wear that covers a unique blend of Polyester and Viscose in different yarn counts, shades, and finishes.
Key developments under fabrics division for 2017-18:
Introduced a new sub-brand Verona under Mayur Fabrics. The Verona basket includes a collection of TR, Poly wool, cationic.
Our brand Cannello has progressed to be established as a value rich super product.
We have started shifting our customer base from local brands to Indian and International brands.
Sub brands
Verona
Few Collections
Black Rose
Flamingo
Tuxedo
Arise
Monarch
Victoria
Ferrari
Windsor
Grand Avenu
Dazzle
Elegance
RSW
M L
imite
d
14
11.04 85
720
Share of denim business in revenue for FY 2017-18 (in %)
21.27Exports to top 10 clients (in Lakhs Mtrs)
Capacity Utilisation in FY 2017-18 (in %)
Number of products launched in denim business in past 3 years
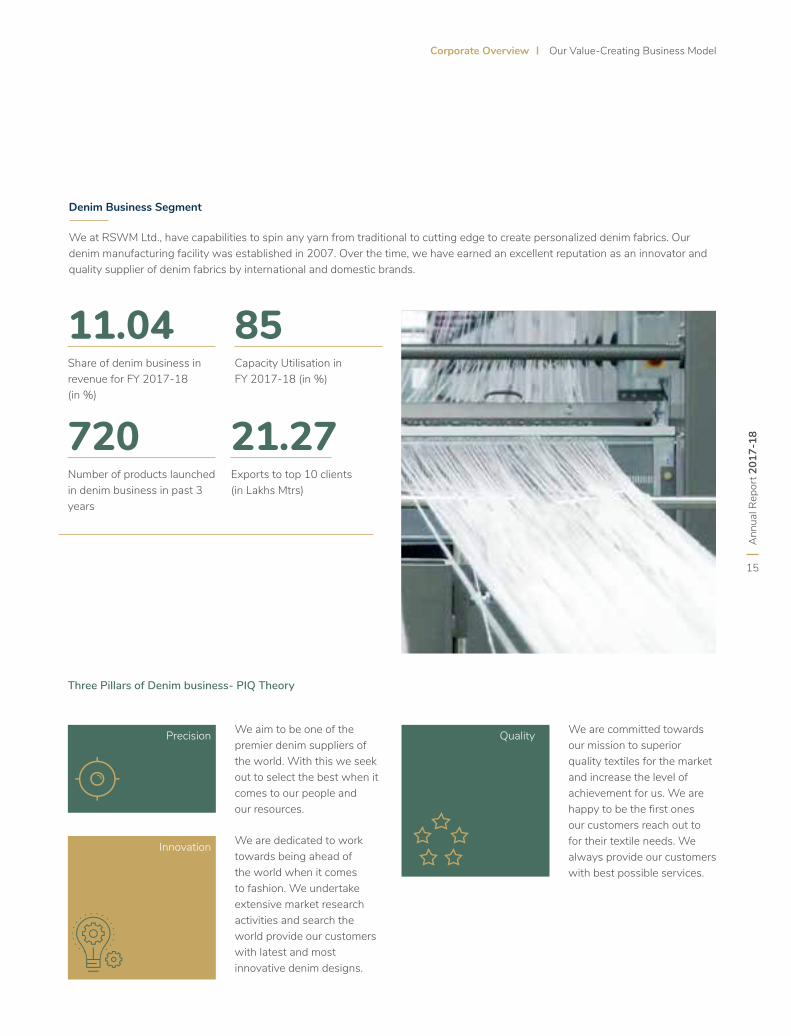
Denim Business Segment
We at RSWM Ltd., have capabilities to spin any yarn from traditional to cutting edge to create personalized denim fabrics. Our denim manufacturing facility was established in 2007. Over the time, we have earned an excellent reputation as an innovator and quality supplier of denim fabrics by international and domestic brands.
Three Pillars of Denim business- PIQ Theory
We aim to be one of the premier denim suppliers of the world. With this we seek out to select the best when it comes to our people and our resources.
We are committed towards our mission to superior quality textiles for the market and increase the level of achievement for us. We are happy to be the first ones our customers reach out to for their textile needs. We always provide our customers with best possible services.
We are dedicated to work towards being ahead of the world when it comes to fashion. We undertake extensive market research activities and search the world provide our customers with latest and most innovative denim designs.
Precision Quality
Innovation
Ann
ual R
epor
t 201
7-18
15
Corporate Overview Our Value-Creating Business Model
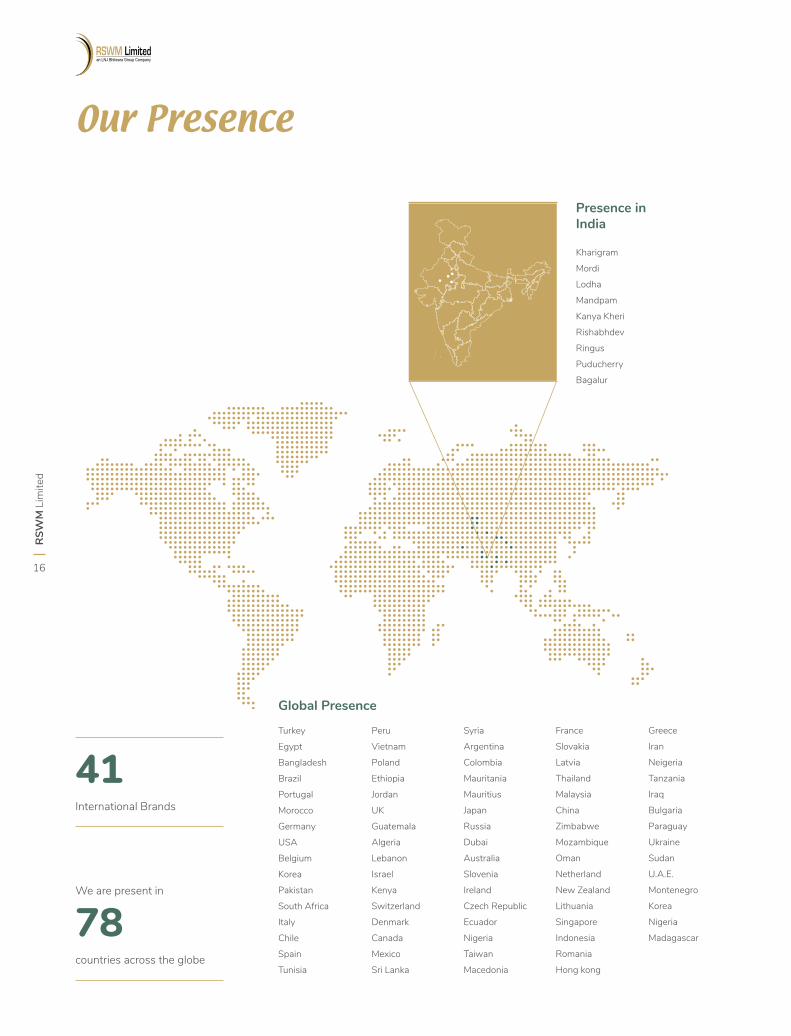
Our Presence
Presence in India
Global Presence
41International Brands
We are present in
78countries across the globe
Turkey
Egypt
Bangladesh
Brazil
Portugal
Morocco
Germany
USA
Belgium
Korea
Pakistan
South Africa
Italy
Chile
Spain
Tunisia
Peru
Vietnam
Poland
Ethiopia
Jordan
UK
Guatemala
Algeria
Lebanon
Israel
Kenya
Switzerland
Denmark
Canada
Mexico
Sri Lanka
Syria
Argentina
Colombia
Mauritania
Mauritius
Japan
Russia
Dubai
Australia
Slovenia
Ireland
Czech Republic
Ecuador
Nigeria
Taiwan
Macedonia
France
Slovakia
Latvia
Thailand
Malaysia
China
Zimbabwe
Mozambique
Oman
Netherland
New Zealand
Lithuania
Singapore
Indonesia
Romania
Hong kong
Greece
Iran
Neigeria
Tanzania
Iraq
Bulgaria
Paraguay
Ukraine
Sudan
U.A.E.
Montenegro
Korea
Nigeria
Madagascar
Kharigram
Mordi
Lodha
Mandpam
Kanya Kheri
Rishabhdev
Ringus
Puducherry
Bagalur
RSW
M L
imite
d
16
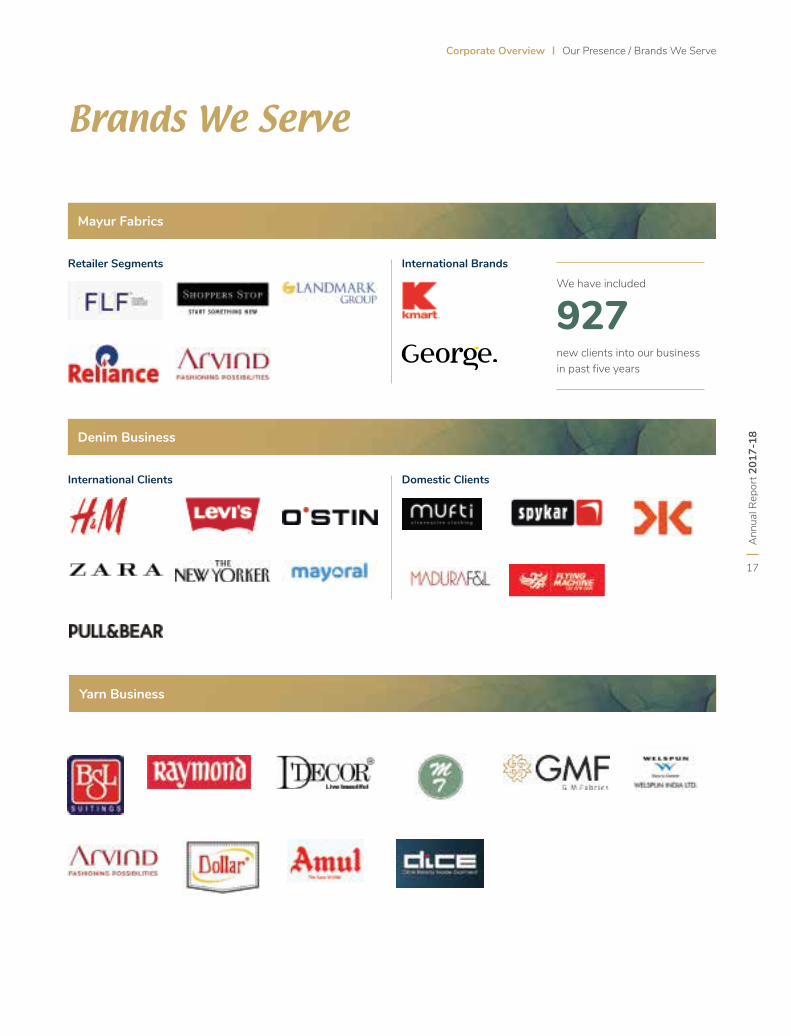
Brands We Serve
Retailer Segments
International Clients
International Brands
Domestic Clients
Mayur Fabrics
Denim Business
Yarn Business
We have included
927new clients into our business in past five years
Ann
ual R
epor
t 201
7-18
17
Corporate Overview Our Presence / Brands We Serve
Chairman’s Message
Dear Shareholders,
It gives me immense pleasure to present the annual report for year under review for RSWM Ltd.
RSWM Ltd. is an integral part of LNJ Bhilwara Group. We are a leading textile manufacturing company that deals in three business segments, namely, yarn, denim, and fabric.
To begin with let me present you highlights for the year 2017-18. The global economy grew at a rate of 3% in 2017 and it is estimated to grow at 3.1% in 2018. The global economy expanded despite various challenges such as US President imposing high tariff for products imported from China, quantitative tightening adopted by various countries, and rise in crude oil prices. It is expected that this growth in global economy will be driven more by the emerging markets and developing economies like China, India, and Euro Area than by advanced economies like UK and USA.
The Indian economy which experienced a cyclical trend growing at a rate of 6.7% in 2017-18. During the year, Indian economy was driven by various reforms such as the Make in India and the new tax regime, GST. The
new indirect tax, GST that was introduced during the 2nd quarter of the year brought with it numerous challenges for the Indian industries. Textile industry was one of those industries that was hit the most first by demonetization and then by GST. With easing out of the effects of these reforms the country is expected to grow at 7.5% in 2018-19. It is expected that in coming years the Indian economy will grow to be a worth $5 trillion economy.
Over the years, the textile industry has witnessed changes in consumption patterns which required the players like us to focus more towards value added products. China is one of the dominant players in the textile industry, but with lower labour and production costs, India is emerging to be the top player in textile industry all over the world. Indian textile industry is the third largest textile exporter of world with a value of $40 billion.
During the year, the textile industry of India faced various challenges, such as volatility in raw material prices, rise in cotton prices due to pink ball worm attack, and GST which made it difficult for the dealers and retailers to adjust with the country’s new tax regime. The Indian textile industry was witnessing
a price war along with a tough competition from big players in the market. Despite these challenges, the textile industry is expected to grow with increase in demand from exports side and stabilization in GST.
We at RSWM Ltd., being an organized player were not free from the effects of challenges posed in front of the textile industry. Despite this, we were able to perform better than other players of the industry. We did so by shifting our focus towards production and selling of value added products. In an industry where consumers are demanding more of value added products, shifting towards value creation helped us to retain our market share. We also moved towards a cost rationalization process where we took various measures to reduce our costs in terms of operational costs and raw material costs. During the year, we saw a cost saving of H19.16 Crore. We have also taken various expansion measures by incurring a capital expenditure of H56.55 Crore. We expanded our RCPF plant at Ringus, expansion of Ringus spinning plant and conversion of Kharigram plant from Grey to Dyed spinning.
Way Forward
The global economy as well as the Indian economy is expected to grow in the coming years. The textile industry is expected to experience an increased demand with players of the industry focusing towards value creation as well as cost reduction. In the time forward we have planned to shift our focus of customer base from unorganised customers to Indian and International brands. This is mainly due to the diminishing pattern of local customers. In the coming years, we will also be focusing towards the various expansion activities we have planned to undertake.
I would further like to take this opportunity to thank our stakeholders in being with us in a time where our industry is going through a tough situation. I would like to thank the management and board of directors for their support and coordination. I would also like to thank our shareholders for keeping their faith upon us. I hope that we will receive support from all of you as we keep on moving forward.
RSW
M L
imite
d
18
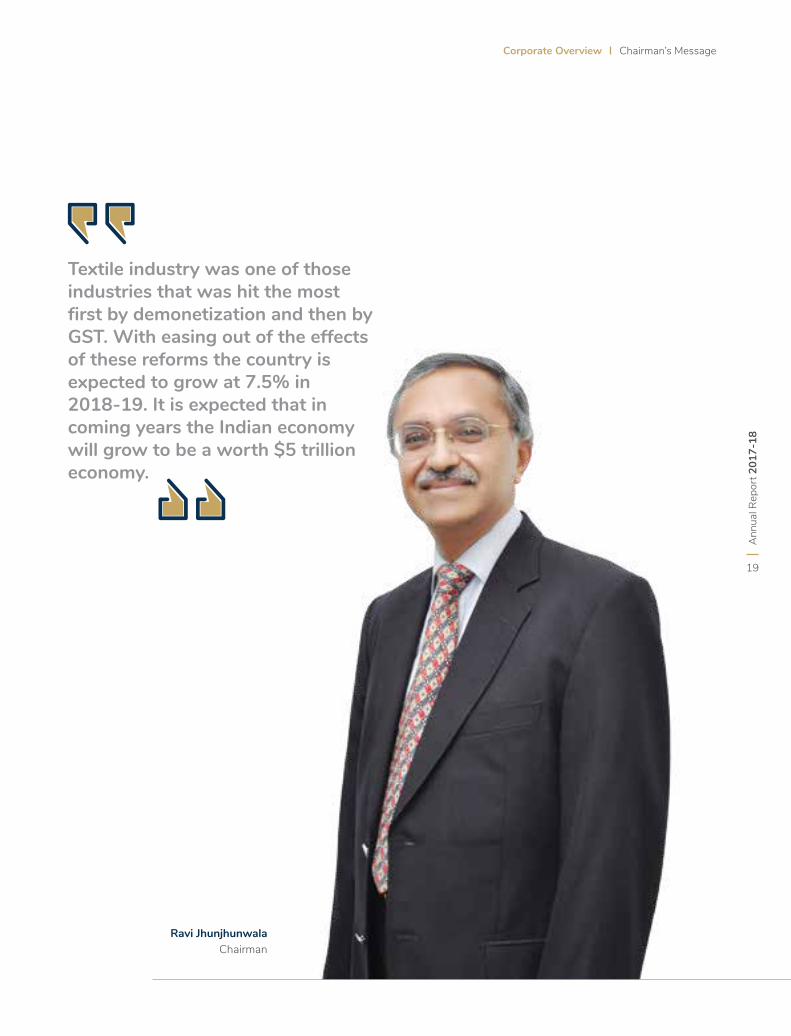
Textile industry was one of those industries that was hit the most first by demonetization and then by GST. With easing out of the effects of these reforms the country is expected to grow at 7.5% in 2018-19. It is expected that in coming years the Indian economy will grow to be a worth $5 trillion economy.
Ravi JhunjhunwalaChairman
Ann
ual R
epor
t 201
7-18
19
Corporate Overview Chairman’s Message
Managing Director’s Message
How did your company perform in 2017-18?
Financial year 2017-18 was a disturbing one for the whole textile industry as well for the Company. The overall performance was not that satisfactory but it was better than our competitors. We were ready to take challenges and thus we retained our growth levels. Our revenue declined by 1.60% from H3,027.78 in 2016-17 to H2,979.28 Crore in 2017-18. We recorded a positive Net Profit of H14.50 Crore. We also moved towards production of value-added products that will help us improve our margins.
What were the measures taken by you to face the challenges?
The textile industry has been facing a change. A change in customer preference towards value added products, a change by the players of industry towards cost reduction and a volatility in raw material prices. Our well-placed cotton purchase policy helped us to deal with the volatility in cotton prices. When everyone in the value chain was moving towards cost reduction, we also moved towards cost rationalization by taking steps to reduce our operational costs. We have shifted our
We also moved towards production of value-added products that will help us improve our margins.
RSW
M L
imite
d
20
focus more towards the value added products to serve the market with what it needs.
What steps were taken by you for cost rationalization?
We have high operational cost which drives our profits down. During the year, we adopted a cost rationalization measure where we reduced our operational costs and focused on cost savings in terms of energy savings, reduction in stores cost, reduction in raw material cost, etc. Along with cost reduction, we also focused on increase in productivity. Operational costs are high due to use of old machines, and in this regard we are taking steps to expand our capacity and upgrade our facilities.
What were the major developments during the year?
We at RSWM Ltd., have taken various measures during financial year 2017-18. These measures or steps helped us to maintain our market share despite of a gap between demand and supply. The major steps taken by us includes:
Setting up of New Product Development cell for all the business segments
and is in line with latest trends and taste.
We have started to work on the Autumn / Winter and Spring / Summer collection of 2019. We plan to complete the work on these collection during FY2018-19.
Shift of customer base from local brands to Indian and International brands
We have launched a new sub-brand Verona under Mayur fabrics
We are converting our grey yarn spinning to dyed yarn spinning as dyed yarn sector offers long term marketability and profitability
What are your plans for financial year 2018-19?
As we move ahead in time, there will be a stabilization in the impact created by GST. We have undertaken a lot of initiatives or measures in 2017-18. We plan to continue with it in 2018-19 while taking the following measures in 2018-19.
We plan to modernize our spinning facilities in this financial year.
We have started the 25000 TPA expansion of Recycled PSF plant. We have planned to complete this expansion plan by the end of first half of this financial year.
With the need to modify our products with a change in fashion trend, we have planned to launch new products that are currently in process
We will continue to rationalize costs in FY2018-19 as well. We have planned to further reduce costs and increase our efficiency.
Riju JhunjhunwalaManaging Director
RSWM EDGETM
The RSWM EDGETM collection offers a distinctive variety of functional, sustainable and premium yarns to the market. The wide range of functional yearns offered
by us is divided into 10 categories under the RSWM EDGETM collection. The functional yarns offered under RSWM EDGETM includes:
Did you know?
Mélange
UV protection- shield
Lustre- Luxe
Thermo regulation- Adapt
Odourless- Fresh
Elastic- Flex
Warmth and luxury- Wool
Moisture Management- Wick
Wellness- Revive
Change
Ann
ual R
epor
t 201
7-18
21
Corporate Overview Managing Director’s Message
Financial Snapshot
14/15 14/15
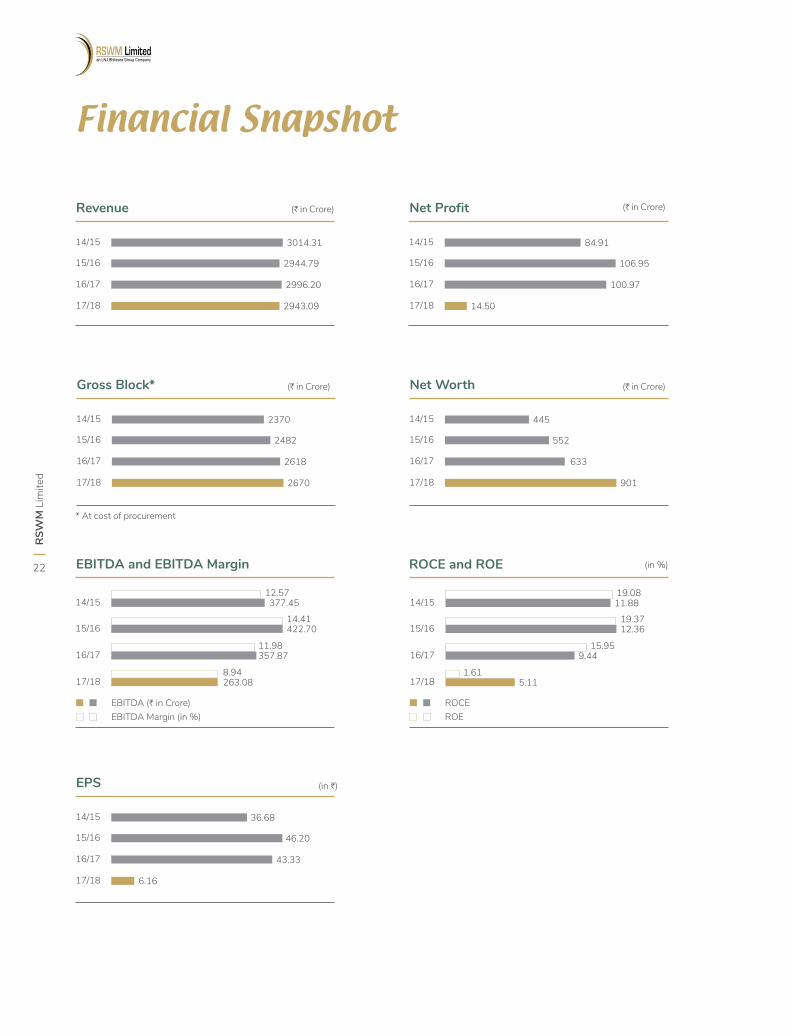
EBITDA and EBITDA Margin ROCE and ROE
EBITDA (H in Crore) ROCE EBITDA Margin (in %) ROE
15/16 15/16
16/17 16/17
17/18 17/18
377.45 11.8812.57 19.08
14.41 19.37
11.98 15.95
8.94 1.61
422.70 12.36
357.87 9.44
14/15
Revenue (H in Crore) (H in Crore)
(H in Crore)(H in Crore)
(in H)
15/16
16/17
17/18
3014.31
2944.79
2996.20
2943.09
14/15
Net Profit
15/16
16/17
17/18
84.91
106.95
100.97
14.50
14/15
EPS
15/16
16/17
17/18
36.68
46.20
43.33
6.16
14/15
Net Worth
(in %)
15/16
16/17
17/18
445
552
633
901
14/15
Gross Block*
15/16
16/17
17/18
2370
2482
2618
2670
263.08 5.11
* At cost of procurement
RSW
M L
imite
d
22

Our People
628Staff Members were added in last 2 years
13Women Employees in 2017-18 (in %)
We at RSWM, have laid down various training practices and methodologies for our employees and workmen. We also have various HR monitored development activities that are carried out from time to time for employees at different levels. These activities are carried at stipulated intervals or as per the requirement by an external hiring expert or deputing staff at lead development centers.
HR Activities:
We celebrated 3rd International Yoga Day on 21st June 2017 at Mandpam and Kharigram.
The 71st Independence Day was celebrated by us with excitement and enthusiasm at Kharigram, Mandpam, Bagalur, Rishabhdev, LNJ Denim and Ringus.
Lodha Staff club organized an excursion trip to Kerala, for our staff and their family members.
We organized a grand party on eve of New Year on 31st December 2017.
Training and Workshop Activities
At RSWM Ltd., we ensure the safety of our workers & staff, and we also stand beside our workforce having faith in their values and beliefs. In this regard, we conduct Mock Drills that take place in every 6 months. On 3rd May 2017, one such Mock Drill was conducted on at our Lodha Plant, Banswara collectively by security department, safety department, and all the concerned people.
We conducted a workshop Art of Living (Happiness Programme) and Yoga Camp was held on 9th November 2017 in LNJ Nagar Colony, Mordi for our staff and their families.
Ann
ual R
epor
t 201
7-18
23
Corporate Overview Financial Snapshot / Our People
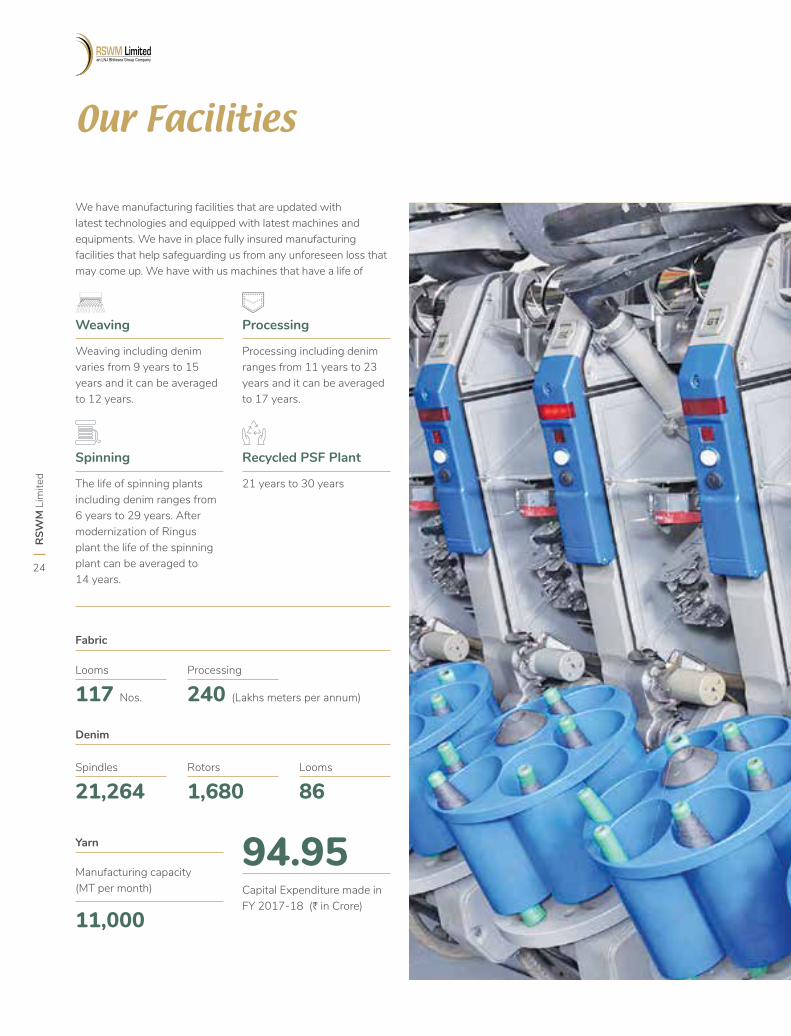
Our Facilities
We have manufacturing facilities that are updated with latest technologies and equipped with latest machines and equipments. We have in place fully insured manufacturing facilities that help safeguarding us from any unforeseen loss that may come up. We have with us machines that have a life of
Recycled PSF Plant
Weaving
Spinning
Processing
21 years to 30 years
Weaving including denim varies from 9 years to 15 years and it can be averaged to 12 years.
The life of spinning plants including denim ranges from 6 years to 29 years. After modernization of Ringus plant the life of the spinning plant can be averaged to 14 years.
Processing including denim ranges from 11 years to 23 years and it can be averaged to 17 years.
Looms
117 Nos.
Spindles
21,264
Processing
240 (Lakhs meters per annum)
Rotors
1,680 Looms
86
94.95
Fabric
Yarn
Denim
Capital Expenditure made in FY 2017-18 (H in Crore)
11,000
Manufacturing capacity (MT per month)
RSW
M L
imite
d
24
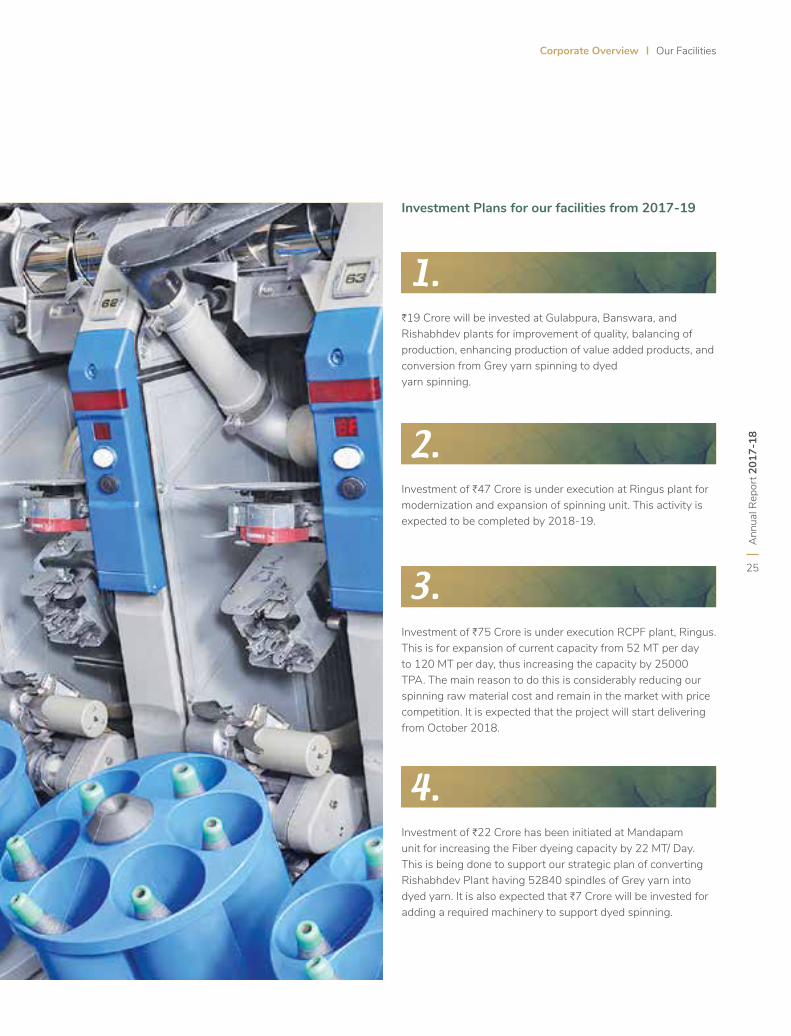
Investment Plans for our facilities from 2017-19
H19 Crore will be invested at Gulabpura, Banswara, and Rishabhdev plants for improvement of quality, balancing of production, enhancing production of value added products, and conversion from Grey yarn spinning to dyed yarn spinning.
Investment of H47 Crore is under execution at Ringus plant for modernization and expansion of spinning unit. This activity is expected to be completed by 2018-19.
Investment of H75 Crore is under execution RCPF plant, Ringus. This is for expansion of current capacity from 52 MT per day to 120 MT per day, thus increasing the capacity by 25000 TPA. The main reason to do this is considerably reducing our spinning raw material cost and remain in the market with price competition. It is expected that the project will start delivering from October 2018.
Investment of H22 Crore has been initiated at Mandapam unit for increasing the Fiber dyeing capacity by 22 MT/ Day. This is being done to support our strategic plan of converting Rishabhdev Plant having 52840 spindles of Grey yarn into dyed yarn. It is also expected that H7 Crore will be invested for adding a required machinery to support dyed spinning.
1.
2.
3.
4. A
nnua
l Rep
ort 2
017-
18
25
Corporate Overview Our Facilities
Sustainability
Water Management
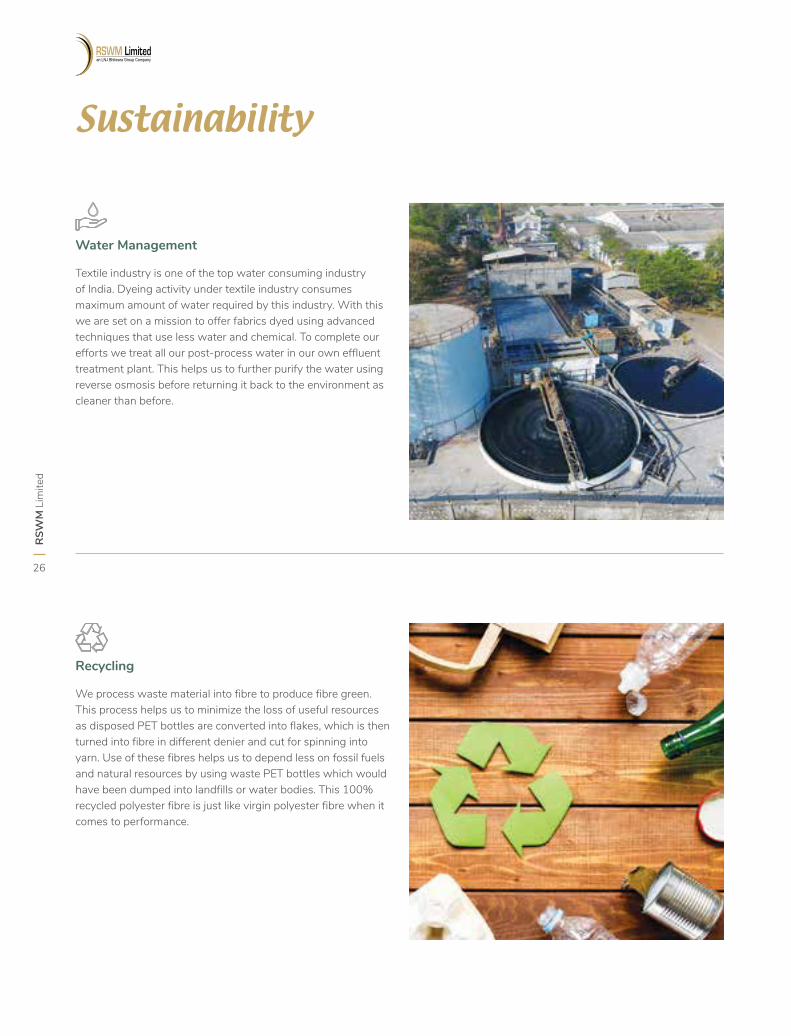
Textile industry is one of the top water consuming industry of India. Dyeing activity under textile industry consumes maximum amount of water required by this industry. With this we are set on a mission to offer fabrics dyed using advanced techniques that use less water and chemical. To complete our efforts we treat all our post-process water in our own effluent treatment plant. This helps us to further purify the water using reverse osmosis before returning it back to the environment as cleaner than before.
Recycling
We process waste material into fibre to produce fibre green. This process helps us to minimize the loss of useful resources as disposed PET bottles are converted into flakes, which is then turned into fibre in different denier and cut for spinning into yarn. Use of these fibres helps us to depend less on fossil fuels and natural resources by using waste PET bottles which would have been dumped into landfills or water bodies. This 100% recycled polyester fibre is just like virgin polyester fibre when it comes to performance.
RSW
M L
imite
d
26
Clean Energy
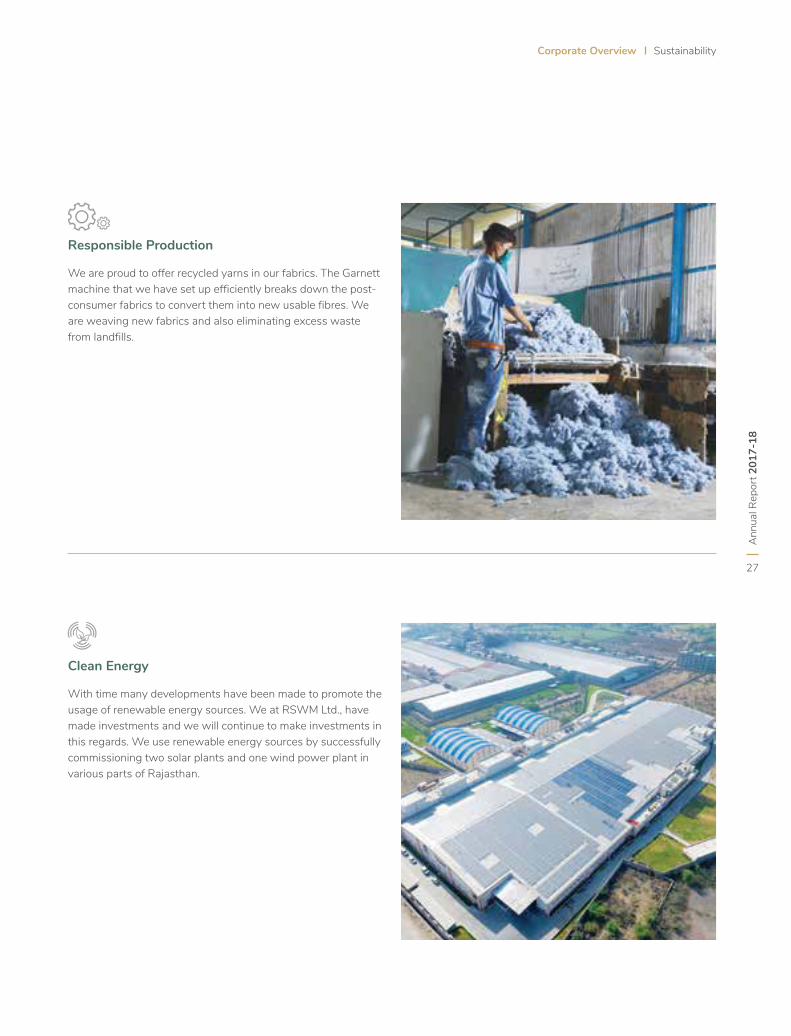
With time many developments have been made to promote the usage of renewable energy sources. We at RSWM Ltd., have made investments and we will continue to make investments in this regards. We use renewable energy sources by successfully commissioning two solar plants and one wind power plant in various parts of Rajasthan.
Responsible Production
We are proud to offer recycled yarns in our fabrics. The Garnett machine that we have set up efficiently breaks down the post-consumer fabrics to convert them into new usable fibres. We are weaving new fabrics and also eliminating excess waste from landfills.
Ann
ual R
epor
t 201
7-18
27
Corporate Overview Sustainability
Board of Directors
Shri Ravi Jhunjhunwala
Shri Dharmendar Nath Davar
Shri Shekhar Agarwal
Shri Arun Churiwal
Shri Riju Jhunjhunwala
Dr. Kamal Gupta
Shri Jagdish Chandra Laddha
Shri Ravi Jhunjhunwala is a Non-Executive Promoter Director and Chairman of the Company and LNJ Bhilwara Group. Shri Ravi Jhunjhunwala holds a degree in B.Com (Hons.) and is also an MBA from
the Centre D’etudes Indutrielles (CEI) Geneva. Shri Ravi Jhunjhunwala is also Managing Director of HEG Limited and Malana Power Company Limited. His leadership has enabled the group to establish a presence
in more the 75 countries across five continents today. He is also active on number of National Management forums and is associated with various chambers of commerce including CII.
Shri Dharmendar Nath Davar is an Independent Director of the Company and had joined the Board on November 10, 2004. He holds a masters
degree in Economics and a CAIIB. Shri D. N. Davar is a consultant in the areas of finance and corporate laws. He is also a part-time
consultant in the World Bank, UNIDO and Kreditanstalt fur, Wiederaufbau (KfW). Shri D. N.Davar was formerly the Executive Chairman of IFCI.
Shri Shekhar Agarwal is a Promoter, Non-Executive Director of the Company. Shri Shekhar Agarwal is also Vice Chairman of the Company.
He is a B. Tech (Mech.) from Indian Institute of Technology, Kanpur and has done his Masters in Science from University of Chicago.
He has an experience of three decades in the Textile Industry. He was the past Chairman of Confederation of Indian Textiles Industry (CITI).
Shri Arun Churiwal is a Non-Executive and Non-Independent Director of RSWM Limited. He is also the Chairman and Managing
Director of BSL Limited. Shri Churiwal holds a degree in B.A (Hons.). He joined the Board of the Company as a Director on October 23,
2003. He is an eminent industrialist with a rich experience in the textile industry.
Shri Riju Jhunjhunwala is Managing Director of RSWM Ltd. He is also the Managing
Director of Bhilwara Energy Ltd. A graduate in Business Management Studies, Shri
Riju Jhunjhunwala is an industrialist with diversified business experience.
Dr. Kamal Gupta is an Independent Director of the Company and joined the Board on December 26, 1987. Dr. Gupta is a FCA, FICWA and Ph.D. He has
an expertise in the areas of finance, accounting and corporate laws. He was formerly a Technical Director with the Institute of Chartered Accountants of
India. Dr. Gupta is a well-known consultant in the field of accounting, auditing and corporate laws and is the Chairman of the Audit Committee of the Company.
Shri Jagdish Chandra Laddha is a FCA with 4 decades of rich experience in textiles.
He is a Non-Independent Non-Executive Director of the Company. He had been
associated with the Company in various capacities in the past.
RSW
M L
imite
d
28
Shri Amar Nath Choudhary
Smt. Archana Capoor
Shri Deepak Jain
Shri Priya Shankar Dasgupta
Shri Amar Nath Choudhary, a Commerce graduate, is also a fellow member of The Institute of Company
Secretaries of India (ICSI) and The Institute of Chartered Accountants of India(ICAI). He holds a degree in law as well.
Shri A. N. Choudhary has a rich and diversified experience in the textile industry.
Smt. Archana Capoor is an Independent Director of the Company. She is a graduate in Science (Chemistry),
MBA (Finance & Market Research). Smt. Capoor is noted professional and has more than 34 years of
experience across various sectors including Tourism and Housing Sector.
Shri Deepak Jain is a business graduate from Illinois Institute of Technology, USA with specialisation in operations management and international business. He brings with him 19 years of rich experience in the industry and at present is the Managing Director of Lumax Industries Limited, a part of D. K. Jain Group.
Shri Deepak Jain has been actively involved with CII and ACMA. He is currently holding the position of Co-chairman, northern region and Chairman HR/IR & Skill Development Committee of Automotive Component Manufacturers Association of India (ACMA), Vice President of Toyota Kirloskar Supplierís Association, Member
of the Delhi Chapter of Entrepreneurs Organizations (EO), Member of the Young Presidentí Organizations (YPO) and Past President of the Supplier Club, Honda Cars India Limited.
Shri P. S. Dasgupta has been engaged in the practice of law since 1978. He had worked as a senior associate for 15 years with JB Dadachanji & Co. where he was regularly consulted on strategic corporate and commercial issues. In 1992, he set up his own practice and founded
New Delhi Law Offices (NDLO), offering full spectrum legal services. Under his guidance and support, NDLO provides highly specialized legal advisory services in various areas of strategic investments - like inbound and outbound, entry strategy, mergers, acquisitions and
restructuring, consolidation and liquidation, finance, securities and capital markets, infrastructure, technology transfer, anti-dumping and real estate. He is a specialist, inter alia, in structuring and negotiation of joint ventures and foreign collaborations & devising entry strategies.
Ann
ual R
epor
t 201
7-18
29
Corporate Overview Board of Directors
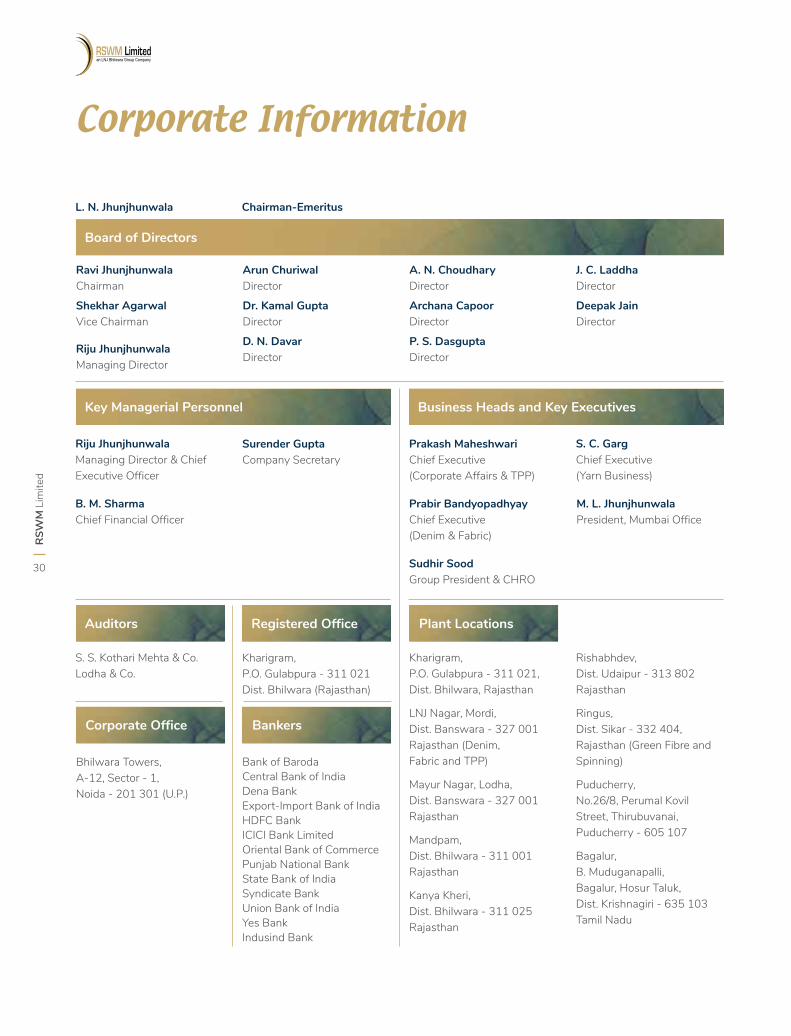
Corporate Information
Ravi JhunjhunwalaChairman
Shekhar Agarwal Vice Chairman
Riju Jhunjhunwala Managing Director
Arun Churiwal Director
Dr. Kamal Gupta Director
D. N. Davar Director
A. N. Choudhary Director
Archana CapoorDirector
P. S. Dasgupta Director
J. C. Laddha Director
Deepak Jain Director
Chairman-EmeritusL. N. Jhunjhunwala
Board of Directors
Riju Jhunjhunwala Managing Director & Chief Executive Officer
S. S. Kothari Mehta & Co.Lodha & Co.
Kharigram, P.O. Gulabpura - 311 021, Dist. Bhilwara, Rajasthan
LNJ Nagar, Mordi, Dist. Banswara - 327 001 Rajasthan (Denim, Fabric and TPP)
Mayur Nagar, Lodha, Dist. Banswara - 327 001Rajasthan
Mandpam, Dist. Bhilwara - 311 001 Rajasthan
Kanya Kheri, Dist. Bhilwara - 311 025 Rajasthan
Rishabhdev, Dist. Udaipur - 313 802 Rajasthan
Ringus, Dist. Sikar - 332 404, Rajasthan (Green Fibre and Spinning)
Puducherry,No.26/8, Perumal Kovil Street, Thirubuvanai, Puducherry - 605 107
Bagalur,B. Muduganapalli, Bagalur, Hosur Taluk, Dist. Krishnagiri - 635 103 Tamil Nadu
Prakash Maheshwari Chief Executive (Corporate Affairs & TPP)
B. M. Sharma Chief Financial Officer
Kharigram, P.O. Gulabpura - 311 021Dist. Bhilwara (Rajasthan)
Prabir Bandyopadhyay Chief Executive (Denim & Fabric)
Sudhir SoodGroup President & CHRO
M. L. Jhunjhunwala President, Mumbai Office
Surender Gupta Company Secretary
Bhilwara Towers,A-12, Sector - 1,Noida - 201 301 (U.P.)
Bank of BarodaCentral Bank of IndiaDena BankExport-Import Bank of IndiaHDFC BankICICI Bank LimitedOriental Bank of CommercePunjab National BankState Bank of IndiaSyndicate BankUnion Bank of IndiaYes BankIndusind Bank
S. C. GargChief Executive (Yarn Business)
Key Managerial Personnel
Auditors Plant LocationssRegistered Office
Corporate Office Bankers
Business Heads and Key Executives
RSW
M L
imite
d
30
Ann
ual R
epor
t 201
7-18
31
Management Reports Management Discussion and Analysis
Management Discussion and Analysis
Global Economic Overview
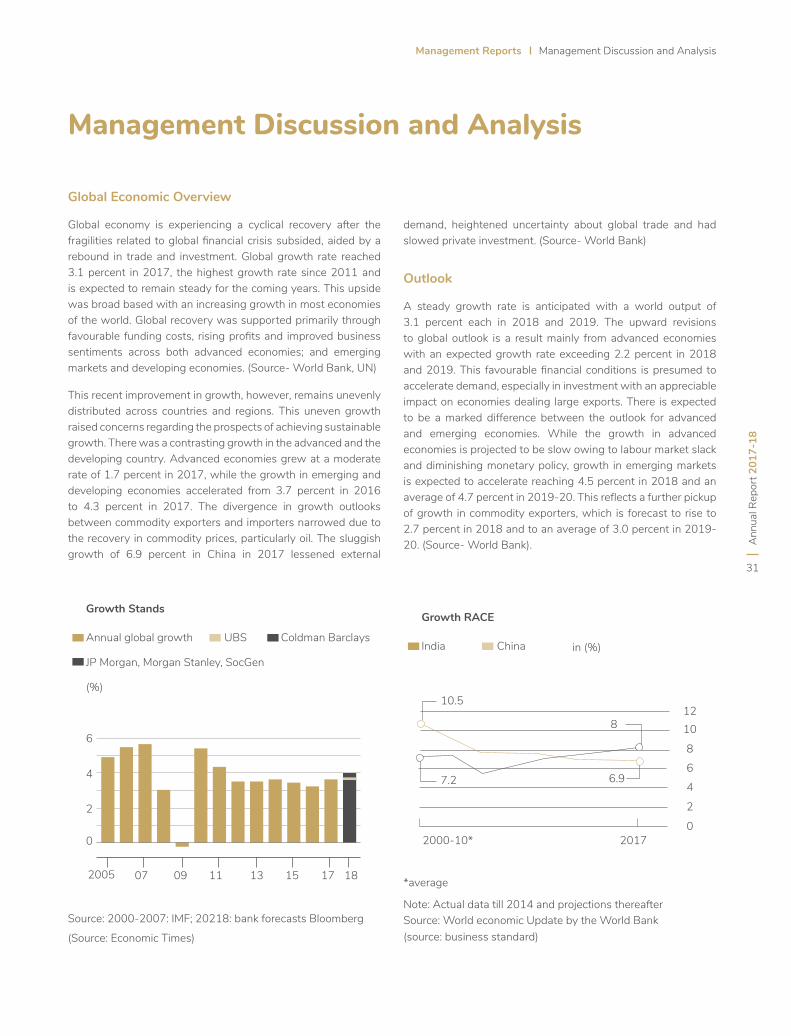
Global economy is experiencing a cyclical recovery after the fragilities related to global financial crisis subsided, aided by a rebound in trade and investment. Global growth rate reached 3.1 percent in 2017, the highest growth rate since 2011 and is expected to remain steady for the coming years. This upside was broad based with an increasing growth in most economies of the world. Global recovery was supported primarily through favourable funding costs, rising profits and improved business sentiments across both advanced economies; and emerging markets and developing economies. (Source- World Bank, UN)
This recent improvement in growth, however, remains unevenly distributed across countries and regions. This uneven growth raised concerns regarding the prospects of achieving sustainable growth. There was a contrasting growth in the advanced and the developing country. Advanced economies grew at a moderate rate of 1.7 percent in 2017, while the growth in emerging and developing economies accelerated from 3.7 percent in 2016 to 4.3 percent in 2017. The divergence in growth outlooks between commodity exporters and importers narrowed due to the recovery in commodity prices, particularly oil. The sluggish growth of 6.9 percent in China in 2017 lessened external
demand, heightened uncertainty about global trade and had slowed private investment. (Source- World Bank)
Outlook
A steady growth rate is anticipated with a world output of 3.1 percent each in 2018 and 2019. The upward revisions to global outlook is a result mainly from advanced economies with an expected growth rate exceeding 2.2 percent in 2018 and 2019. This favourable financial conditions is presumed to accelerate demand, especially in investment with an appreciable impact on economies dealing large exports. There is expected to be a marked difference between the outlook for advanced and emerging economies. While the growth in advanced economies is projected to be slow owing to labour market slack and diminishing monetary policy, growth in emerging markets is expected to accelerate reaching 4.5 percent in 2018 and an average of 4.7 percent in 2019-20. This reflects a further pickup of growth in commodity exporters, which is forecast to rise to 2.7 percent in 2018 and to an average of 3.0 percent in 2019-20. (Source- World Bank).
(source: business standard)
Growth RACE
India in (%)China
Note: Actual data till 2014 and projections thereafter Source: World economic Update by the World Bank
*average
2000-10* 2017
10.5
7.2 6.9
81210
8
6
4
2
0
(Source: Economic Times)
Source: 2000-2007: IMF; 20218: bank forecasts Bloomberg
Growth Stands
Annual global growth
JP Morgan, Morgan Stanley, SocGen
(%)
UBS Coldman Barclays
6
4
2
0
07 09 11 13 15 17 182005
RSW
M L
imite
d
32
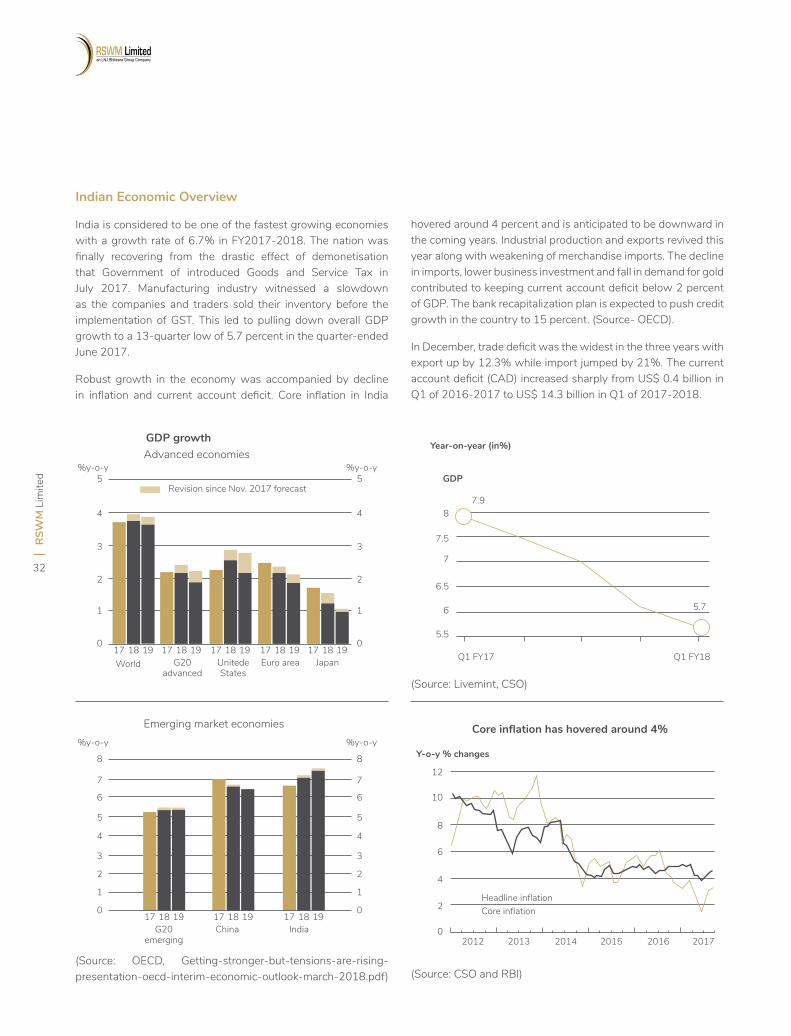
Indian Economic Overview
India is considered to be one of the fastest growing economies with a growth rate of 6.7% in FY2017-2018. The nation was finally recovering from the drastic effect of demonetisation that Government of introduced Goods and Service Tax in July 2017. Manufacturing industry witnessed a slowdown as the companies and traders sold their inventory before the implementation of GST. This led to pulling down overall GDP growth to a 13-quarter low of 5.7 percent in the quarter-ended June 2017.
Robust growth in the economy was accompanied by decline in inflation and current account deficit. Core inflation in India
hovered around 4 percent and is anticipated to be downward in the coming years. Industrial production and exports revived this year along with weakening of merchandise imports. The decline in imports, lower business investment and fall in demand for gold contributed to keeping current account deficit below 2 percent of GDP. The bank recapitalization plan is expected to push credit growth in the country to 15 percent. (Source- OECD).
In December, trade deficit was the widest in the three years with export up by 12.3% while import jumped by 21%. The current account deficit (CAD) increased sharply from US$ 0.4 billion in Q1 of 2016-2017 to US$ 14.3 billion in Q1 of 2017-2018.
Revision since Nov. 2017 forecast
Advanced economiesGDP growth
World Unitede States
G20 advanced
Euro area Japan
%y-o-y5 5
4 4
3 3
2 2
1 1
017 17 17 17 1718 18 18 18 1819 19 19 19 19
0
%y-o-y
(Source: OECD, Getting-stronger-but-tensions-are-rising-presentation-oecd-interim-economic-outlook-march-2018.pdf)
Emerging market economies
G20 emerging
China India
%y-o-y
8 8
7 7
6
5
4
3
6
5
4
3
2 2
1 1
017 17 1718 18 1819 19 19
0
%y-o-y
(Source: Livemint, CSO)
87.9
GDP
Year-on-year (in%)
Q1 FY17 Q1 FY18
7.5
5.7
7
6.5
6
5.5
(Source: CSO and RBI)
Core inflation has hovered around 4%
12
10
8
6
4
2
02012
Headline inflationCore inflation
2013 2014 2015 2016 2017
Y-o-y % changes
Management Reports Management Discussion and Analysis
Ann
ual R
epor
t 201
7-18
33
Outlook
The growth of India is presumed to increase to 7.6% in the fiscal year 2019. This growth will be due to a number of factors namely, suppression of one time effects of demonetisation and GST, formalization of economy, strengthening of global outlook, low borrowing cost, increase in credit supply, higher infrastructure spending as well as recapitalization of public sector. At the same time, risks associated oil price rising and delayed NPA resolution can delay the growth of the economy. (Source- Goldman Sachs)
Expectation of inflation increasing from 6% to 6.75% by June 2019 may compel Reserve Bank of India to raise rates. Owing to shift in consumer behavior and expenditure pattern, India is expected to be the third largest consumer economy by 2025 with its consumption tripling to US$ 4 trillion. (Source- ibef, Economic Times)
Global Textile Industry
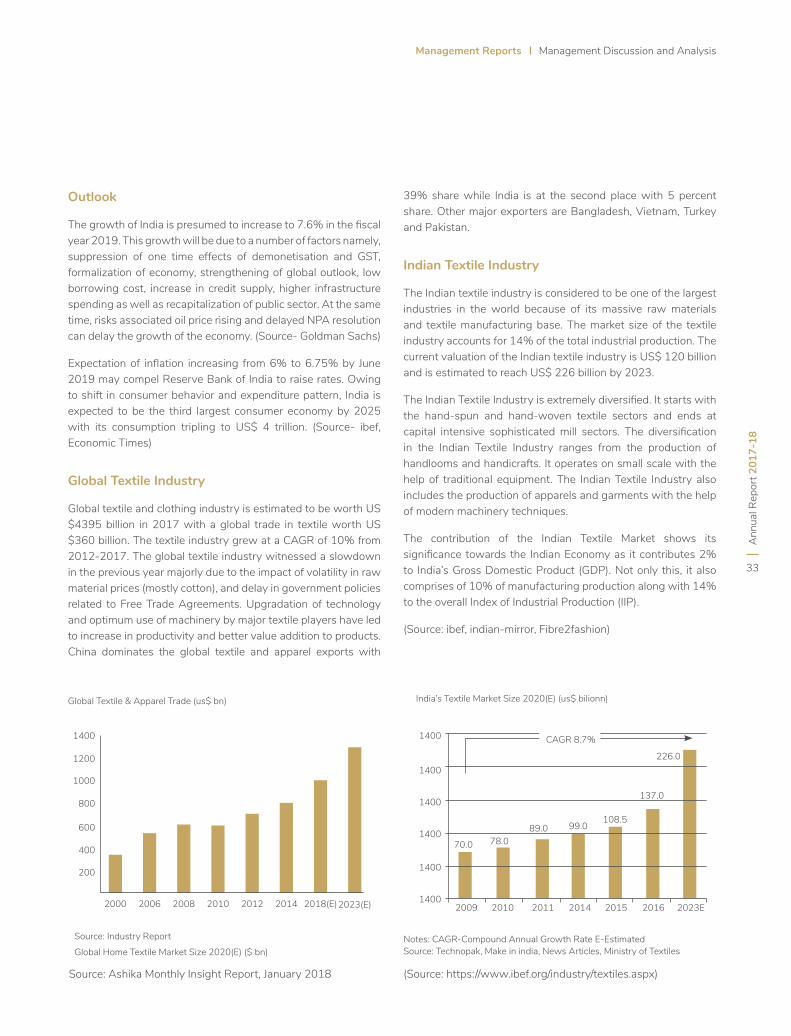
Global textile and clothing industry is estimated to be worth US $4395 billion in 2017 with a global trade in textile worth US $360 billion. The textile industry grew at a CAGR of 10% from 2012-2017. The global textile industry witnessed a slowdown in the previous year majorly due to the impact of volatility in raw material prices (mostly cotton), and delay in government policies related to Free Trade Agreements. Upgradation of technology and optimum use of machinery by major textile players have led to increase in productivity and better value addition to products. China dominates the global textile and apparel exports with
39% share while India is at the second place with 5 percent share. Other major exporters are Bangladesh, Vietnam, Turkey and Pakistan.
Indian Textile Industry
The Indian textile industry is considered to be one of the largest industries in the world because of its massive raw materials and textile manufacturing base. The market size of the textile industry accounts for 14% of the total industrial production. The current valuation of the Indian textile industry is US$ 120 billion and is estimated to reach US$ 226 billion by 2023.
The Indian Textile Industry is extremely diversified. It starts with the hand-spun and hand-woven textile sectors and ends at capital intensive sophisticated mill sectors. The diversification in the Indian Textile Industry ranges from the production of handlooms and handicrafts. It operates on small scale with the help of traditional equipment. The Indian Textile Industry also includes the production of apparels and garments with the help of modern machinery techniques.
The contribution of the Indian Textile Market shows its significance towards the Indian Economy as it contributes 2% to India’s Gross Domestic Product (GDP). Not only this, it also comprises of 10% of manufacturing production along with 14% to the overall Index of Industrial Production (IIP).
(Source: ibef, indian-mirror, Fibre2fashion)
Source: Ashika Monthly Insight Report, January 2018
Global Home Textile Market Size 2020(E) ($ bn)
Source: Industry Report
1400
Global Textile & Apparel Trade (us$ bn)
1200
1000
800
600
400
200
2000 2006 2008 2010 2012 2014 2018(E)2023(E)
(Source: https://www.ibef.org/industry/textiles.aspx)
India’s Textile Market Size 2020(E) (us$ bilionn)
1400
1400
1400
1400
1400
14002009
70.0 78.089.0 99.0
108.5
137.0
226.0
2010 2011 2014 2015 2016 2023E
Source: Technopak, Make in india, News Articles, Ministry of TextilesNotes: CAGR-Compound Annual Growth Rate E-Estimated
CAGR 8.7%
RSW
M L
imite
d
34
Strengths of the Indian Textile Industry (source: Silicon india, UKessays)
• Cheap labour acts as a backbone of Indian economy and provides a competitive advantage. Cheap labour reduces the cost of production.
• The Indian textile industry is independent. It has a complete chain beginning from the procurement of raw materials to the production of finished goods.
• The spinning sector provides great advantage to the Indian industry. It has presence in all the process of operations and value chain.
• The export of textile industry in India has huge potential of becoming the biggest exporter in this industry.
• India is self-reliant as it is the base of raw materials. Cotton is the major requisite in textile industry and India produces cotton of various varieties.
• High investment in this sector along with support from Government is helping the textile industry flourish in India.
Challenges faced by the Indian Textile Industry
• Indian Textile Industry experiences immense competition from the developing countries, especially China.
• The scale of this industry is smaller, thus, adversely impacting the profitability and demand for its products.
• Demand of exports will undergo fluctuations due to elimination of the Quota System.
• The strict and costly environmental standards impact the performance and efficiency of the company.
• Continuous Quality Improvement is essential to be implemented as there is a wide variety in the domestic demand and the foreign demand.
• Poor innovation and technology in India compared to other nations like China and USA impact the cost and supply of products.
• Lack of skilled manpower and low investment in this industry slows the growth and hampers the ability to surpass other nations.
Segments of Indian Textile
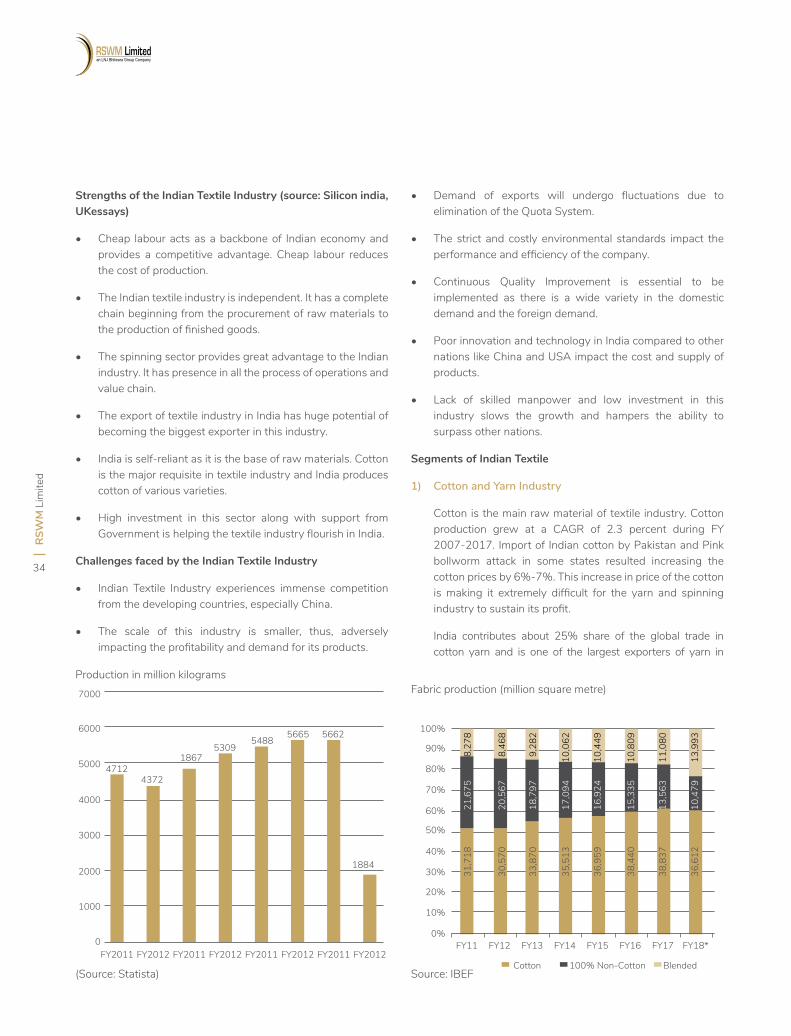
1) Cotton and Yarn Industry
Cotton is the main raw material of textile industry. Cotton production grew at a CAGR of 2.3 percent during FY 2007-2017. Import of Indian cotton by Pakistan and Pink bollworm attack in some states resulted increasing the cotton prices by 6%-7%. This increase in price of the cotton is making it extremely difficult for the yarn and spinning industry to sustain its profit.
India contributes about 25% share of the global trade in cotton yarn and is one of the largest exporters of yarn in
Production in million kilograms
(Source: Statista)
7000
FY2011 FY2011 FY2011 FY2011FY2012 FY2012 FY2012 FY2012
6000
5000 47124372
18675309
54885665 5662
1884
4000
3000
2000
1000
0
Source: IBEF
FY11
100%
31,7
18
30,5
70
33,8
70
35,5
13
36,9
59
38,4
40
38,8
37
36,6
12
Cotton 100% Non-Cotton Blended
90%
80%
70%
60%
50%
40%
30%
20%
10%
0%FY12 FY13 FY14 FY15 FY16 FY17 FY18*
Fabric production (million square metre)
21,6
758,
278
20,5
678,
468
18,7
979,
282
17,0
9410
,062
16,9
2410
,449
15,3
3510
,809
13,5
6311
,080
10,4
7913
,993
Management Reports Management Discussion and Analysis
Ann
ual R
epor
t 201
7-18
35
the world. Cotton yarn accounts for 71.64 percent in 2017, thus, having the largest share in the total yarn industry. The financial year was not favourable for the export of yarn industry. Export suffered drastically as China shifted its import from India to Vietnam to avoid the 3.5% import duty that Indian yarn levies. Reduction in consumption caused due to GST and withdrawal of export incentives by the Government hampered the export of cotton yarns to the extent of 30%. (Source: Economic times, Times of India and ibef)
2) Fabric Industry
Fabric production in India increased from 52,665 million square metres in FY07 to 61,084 millin square metres in FY18. Cotton yarn is a major segment for fabric in the country and it accounts for around 59.94% of total fabric production. The fabric sector of Indian textile industry will get a boost as India and Bangladesh plans to increase their cooperation in order to promote investment and trade of fabrics. (Soruce: IBEF)
3) Denim Industry
Denim segment in India is one of the leading segments in India with a CAGR of 15%-18%. With an installed capacity of 1.5 billion metres a year and an employer to 400,000 workers, India is the second largest denim manufacturer in the world. The nation presently has 46 denim fabric mills which has increased rapidly from 30 denim fabric mills in 2012.
Presently denim production capacity is 1500 million metres and is expected to further expand by 150 million metres, thus, proving the rapidity with which the industry is growing. Low manufacturing cost of denim, growing urbanization, high disposable income, youth dominant population and government initiatives are the main drivers of growth in this segment. Since the implementation of GST, The H 15,000-crore denim industry has shut about 30-40 per cent of its operating capacity due to weak domestic demand and reduced potential for export. With the various initiatives the Government is taking to achieve its target of attaining 20% share of global textile trade, the denim industry is expected to expand tremendously. (Source: Business standard)
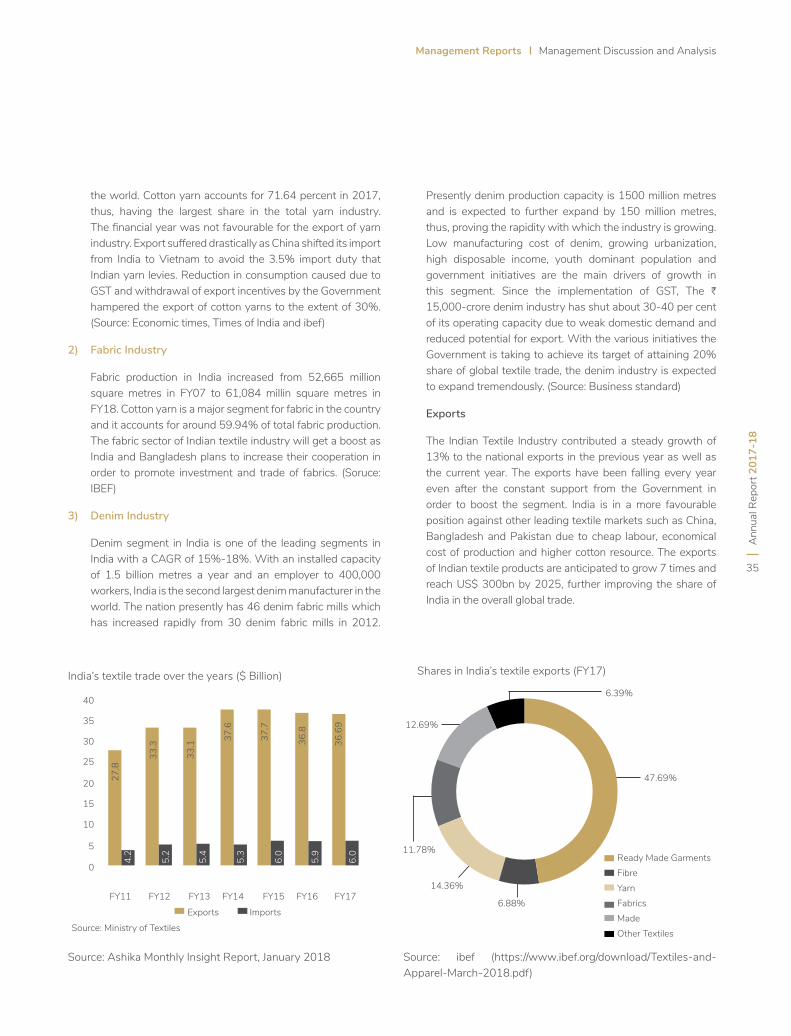
Exports
The Indian Textile Industry contributed a steady growth of 13% to the national exports in the previous year as well as the current year. The exports have been falling every year even after the constant support from the Government in order to boost the segment. India is in a more favourable position against other leading textile markets such as China, Bangladesh and Pakistan due to cheap labour, economical cost of production and higher cotton resource. The exports of Indian textile products are anticipated to grow 7 times and reach US$ 300bn by 2025, further improving the share of India in the overall global trade.
Source: Ashika Monthly Insight Report, January 2018
India’s textile trade over the years ($ Billion)
FY11
27.8
33.3
33.1
37.6
37.7
36.8
36.6
9
FY12 FY13
ExportsSource: Ministry of Textiles
Imports
FY14 FY15 FY16 FY17
40
35
30
25
20
15
10
5
0
4.2
5.2
5.4
5.3
6.0
5.9
6.0
Source: ibef (https://www.ibef.org/download/Textiles-and-Apparel-March-2018.pdf)
Shares in India’s textile exports (FY17)
Ready Made Garments
47.69%
6.39%
6.88%
14.36%
11.78%
12.69%
FibreYarnFabricsMadeOther Textiles
RSW
M L
imite
d
36
Government Initiatives
The Indian Government has launched various initiatives in order to ensure the expansion of the textile industry. It has also kept in mind its ability to serve the National and the International market in an effective and an efficient manner.
• A technology upgradation scheme called SAATHI (Sustainable and Accelerated Adoption of Efficient Textile Industries to Help small Industries) was launched by the Union Ministry of Textiles, Government of India along with the Energy Efficiency Services Ltd (EESL), in order to revive the powerloom sector in India.
• With a view to generate employment and promote khadi, the Government plans to connect as many as 50 million women to the spinning wheel (charkha) in the next 5 years.
• Organisation of ‘Hastkala Sahyog Shivirs’ by the textile ministry in 421 handloom-handicrafts across the country is anticipated to benefit over 1.2 lakh weavers and artisans.
• The ministry of India invested H 690 crores for constructing 21 ready made garment manufacturing units in seven states with the objective of developing and modernizing the indian textile sector.
• A mega package for the powerloom sector will be introduced by the Government of India which will include insurance covers, social welfare schemes, along with tax benefits and marketing support which is expected to increase the status of power loom weavers in the country.
• Minimum Support Price (MSP) is being announced by the government in order to protect the interest of cotton and jute farmers. Procurement of cotton and jute from farmers is being conducted by the Cotton corporation of India and the Jute Corporation of India.
• For the garment sector, a special package of H 6,000 crores was launched with the aim of creating one crore jobs in three years and also to attract investment worth US$ 11 billion
(Source: ibef)
Budgetary Allocations impacting the textile sector
• There was a 14.7% increase in the budget allotted to the Texile sector.
• The allocation made to the Amended Technology Upgradation Fund Scheme (ATUFS) increased from H 1,956 crore in 2017-18 to H 2,300 crore in 2018-19
• The provision for Rebate of State Levies (RoSL) increased from H 1,939 crore in the previous year to H 2,222 crore in the current year
• There was an increase in the basic custom duty on silk fabric which increased from10% to 20%. This was to save the industry from dumping from China
(source: Economic times, Hindustan business)
Road Ahead
Uplifted by both strong domestic consumption and export demand, the future for the Indian Textile Industry is promising. The retail sector has experienced a rapid growth in the past decade with the entry of several international players because of consumerism and disposable income on the rise. High economic growth led to the derivation of higher disposable income. This led to the growth in demand for products creating huge domestic market. The presence of brands like Marks & Spencer, Guess and Next is set to increase as the organized apparel segment is expected to grow at a steady CAGR of 13%. (Source : ibef)
Information and Technology
At RSWM Ltd., IT has always been one of the important part of the business. Growth and investment towards IT facilitates smooth business processes and provides timely and accurate information to take important decisions. IT systems have been installed at all levels and divisions across the Company. IT functions at RSWM Ltd. have always been supported by governance activities through IT security policies and frameworks. Efforts are being made continuously to ensure improved processes & technology and assure that solutions are user friendly, scalable and reduces use of paper.
The Company has made an investment of around H25 crore towards information technology in the previous five years. Major efforts have been directed towards upgrading business processes with integration across business functions, ensure adequate support to users of IT systems and improve IT assets and resource management through better processes.
Human Resource
The Company has a team of around 16,000 competent and efficient employees and workers across various locations including contractual workers and marketing employees. It has laid down various training practices and methodologies for workmen. HR governed development activities are also undertaken by it for staff at different levels of the organization on a regular as well as need based basis including hiring of external experts or deputing staff at lead development centre.
Management Reports Management Discussion and Analysis
Ann
ual R
epor
t 201
7-18
37
The Company has laid down a 360 degree unbiased appraisal system for its employees.
Financial Review
Financial year 2017-18 was a challenging one for the Company despite this it recorded a strong revenue of H2979.28 crore. This was mainly because of strong distribution network base established by it. The Company registered an EBITDA margin of 8.94% and PAT of H14.50 crore in FY18. Liquidity position of the Company improved as it was able to increase its cash and cash equivalents position from H2.82 crore in FY17 to H10.72 crore in FY19. With a long-term objective and growth plans set for the coming years, it increased its capital expenditure from H19.68 crore in 2016-17 to H56.55 crore in 2017-18. Since 1961, the Company has witnessed a robust growth of H776.70 crore in its market capitalization.
In 2017-18, the quantity sold of yarn stood at 1349 Lakh Kg, and that of fabric stood at 114 Lakh Meter. The quantity sold of denim increased from 191 Lakh Meter in 2016-17 to 203 Lakh Meter in 2017-18. During the year, yarn division continued to be the highest contributor to the country’s revenue with revenue of H2472 crore.
Outlook
Moving ahead, the Company plans to modernize its spinning facilities with latest technologies and equipment. It plans to complete the expansion of Recycled PSF plant which will increase the capacity to 25000 MTPA. The Company also plans to launch new products in the market to be in line with change in fashion trends and change in customer tastes and preferences. It also plans to complete its Autumn / Winter and Spring / Summer Collection for 2019 during FY19. In the coming years, it will continue to rationalize the costs and increase efficiency.
Risk Mitigation
Geographical Risk
Concentration in few geographical areas can lead to an increase in business as well as operational risk. This might has the Company will be affected by performance of a limited number of geographies. Over the years, the Company has placed itself well in textile industry across globe. It has a well-established presence in various Indian states and 78 countries across the world.
Present across
78Countries in world
Marketing Risk
It involves the risk of not being able to market the products and thus lead to a loss in the business. In a consumer centric industry, it is important to make the products available at right place, time and for the right audience. The Company has a strong network of distributors and retailers which helps it to market its products faster than its competitors.
Cost RiskCotton is one of the main raw material for the Company. Any fluctuation in the price of cotton might affect revenue of the Company. This further might lead to an offset of competitive edge for the Company. Throughout the year RSWM Ltd. has taken various measures to rationalize its cost and increase its efficiency. The Company has also updated its facilities with latest equipment and technologies that helps it to further reduce its costs and strengthen its competitive position.
Quality Risk
Being in a consumer centric industry, the Company has the responsibility to ensure best quality products for its customers. Over the years, RSWM Ltd. has received various certifications for its products. Some of the certifications include, Oeko-Tex-100, ISO 9001:2008, Global Recycled Standards, OHSAS 18001:2007, ISO 14001:2004, etc.
Internal Control Systems and their Adequacy
RSWM maintains a system of well-established policies and procedures for internal control of operations and activities. It continuously strives to integrate the entire organisation – from strategic support functions like finance, human resources and regulatory affairs to core operations like research, manufacturing and supply chain management.
The internal audit function is further strengthened in consultation with statutory auditors for monitoring statutory and operational issues.
The Company has appointed independent agencies as internal auditors. The prime objective of this audit is to test the adequacy and effectiveness of all internal control systems and suggest improvements. Significant issues are brought to the attention of the audit committee for periodical review.
Moreover, the Company has obtained ISO 9001 and ISO 14001 certifications and adheres to standard operating practices in its manufacturing and operating activities.
RSW
M L
imite
d
38
Directors’ Report
Dear Members,
The Directors present the Annual Report together with the audited Balance Sheet and the Statement of Profit and Loss of RSWM Limited for the year ended March 31, 2018.
Company’s Performance
Your Company’s performance during the year 2017-2018 is summarized below:
Financial Results
Number of Meetings of the Board
The particulars of the meetings held during the year along with the details regarding the meetings attended by the directors form part of the Corporate Governance Report.
The composition of the Board and its committees has also been given in detail in the report on Corporate Governance.
Dividend and other Appropriations
Your Directors are pleased to recommend a dividend on Equity Shares @ 20% i.e. H2 per Equity Share of H10/- each for the year ended the March 31, 2018.
The proposal for payment of dividend on Equity Shares of the Company will absorb an amount of H5.70 Crore (inclusive of dividend distribution tax).
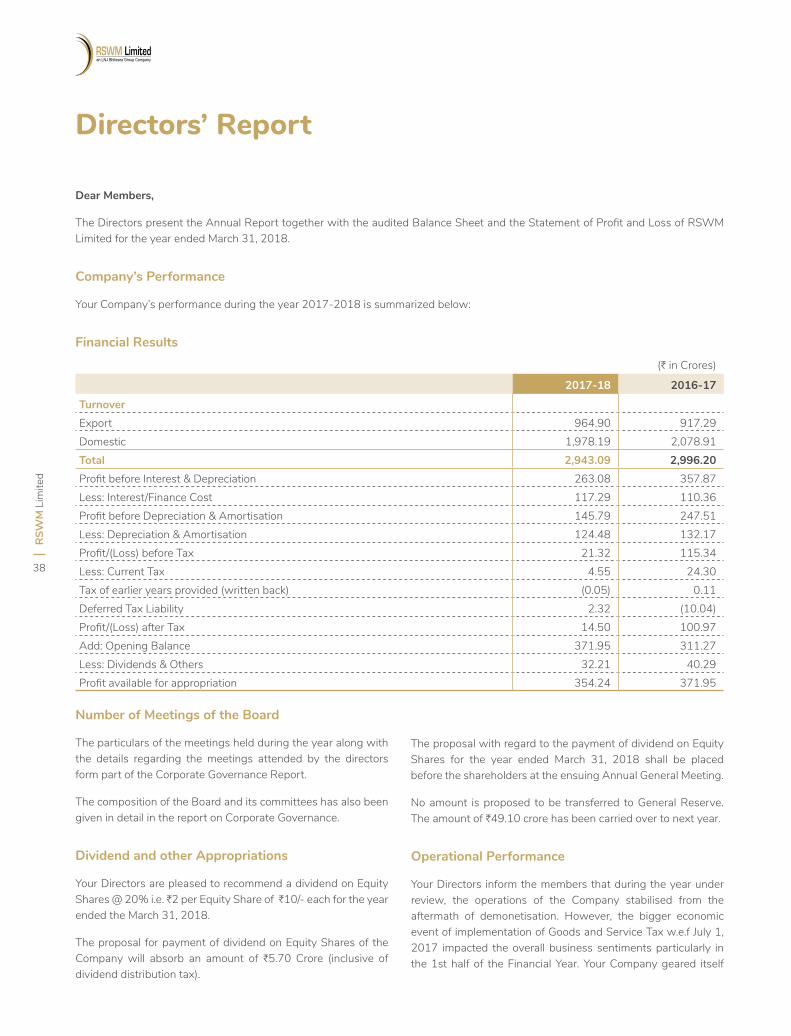
(H in Crores)
2017-18 2016-17
TurnoverExport 964.90 917.29Domestic 1,978.19 2,078.91Total 2,943.09 2,996.20Profit before Interest & Depreciation 263.08 357.87Less: Interest/Finance Cost 117.29 110.36Profit before Depreciation & Amortisation 145.79 247.51Less: Depreciation & Amortisation 124.48 132.17Profit/(Loss) before Tax 21.32 115.34Less: Current Tax 4.55 24.30Tax of earlier years provided (written back) (0.05) 0.11Deferred Tax Liability 2.32 (10.04)Profit/(Loss) after Tax 14.50 100.97Add: Opening Balance 371.95 311.27Less: Dividends & Others 32.21 40.29Profit available for appropriation 354.24 371.95
The proposal with regard to the payment of dividend on Equity Shares for the year ended March 31, 2018 shall be placed before the shareholders at the ensuing Annual General Meeting.
No amount is proposed to be transferred to General Reserve. The amount of H49.10 crore has been carried over to next year.
Operational Performance
Your Directors inform the members that during the year under review, the operations of the Company stabilised from the aftermath of demonetisation. However, the bigger economic event of implementation of Goods and Service Tax w.e.f July 1, 2017 impacted the overall business sentiments particularly in the 1st half of the Financial Year. Your Company geared itself
Ann
ual R
epor
t 201
7-18
39
Management Reports Director’s Report
to face the challenges and made all efforts to continue its operations with full efficiency and vigour.
Despite all the difficulties, your Company recorded a marginal decrease in turnover at H2,943.09 Crores against H2996.20 Crores in the previous year. However, operating profit of the Company declined to H263.08 crore from H357.87 crore recorded in the previous year. Profit before depreciation also declined to H145.79 Crores against H247.51 Crores recorded in the previous year and the profit after tax also decreased to H14.50 Crores against H100.97 Crores in the previous year. Your Directors inform the member that the financial statements of your Company have been drawn on the Ind-AS for the financial year ended March 31, 2018 with comparatives.
Your Company took various steps to overcome the situation which included rationalisation, modernisation and capex programme on need priority basis. Apart from this, the Company enhanced its focus on marketing and value addition to achieve the optimum benefits. Your Company also focused on cost reduction to improve the profitability along with better product mix and improving efficiency. Your Directors inform the members that due to above steps the profitability of the Company improved substantially in the second half of the Financial Year under review. The above measures are expected to result positively in the current Financial Year also.
The analytical review of the Company’s performance and its businesses, including initiatives in the areas of human resources and information technology, have been presented in the section on Management Discussion and Analysis of the Annual Report.
Working results of last three financial years 2015-16 to 2017-18 are given in Annexure – 1 and form part of this report.
Expansion and Modernization
Your Directors in their previous report had reported about the commissioning of Denim Sheet Dyeing project which resulted in enhancing the production capacity of Denim Fabric to 25 million meters from 17 million meters per annum. However, the full benefits of this expansion could not be realized due to market conditions in the backdrop of GST implementation.
Your Directors had also reported in previous report about the completion of phase-I of debottlenecking and up-gradation of equipments and facilities across various units of the Company. Your Directors had also reported the initiation of phase II of Technology up-gradation & debottlenecking programme to further modernise the facilities and equipments at various units of the Company. Your Directors feel pleasure
in informing the members that this programme has been completed during the year at a capital outlay of H42.29 crores. The above programme has resulted in modernising the equipment and facilities across various units of the Company. Your Directors further inform the members that your Company, during the year had installed and operationalised. 3.6 M.W Roof Top Solar Power facility at its Mandpam and Kanyakheri Units which had been built at a total cost of H16.05 crores.
Your Directors inform the members that your Company has outlined further capex of H56.55 crores for modernisation of spinning facility at Ringus unit as well as expansion of capacity of Recycled Polyester Fibre at the same location. This programme is likely to be operational in the current financial year.
Your Directors are hopeful that with the completion of debottlenecking and up-gradation of facilities as well as implementation of new initiatives, the overall productivity and profitability of the Company will improve considerably.
Subsidiary Companies, Joint Ventures & Associates
Your Directors inform the members that during the financial year under review, your Company has no Subsidiary.
During the year under review, your Company continued to receive wind power supply from LNJ Power Ventures Limited. This green power initiative also enables your Company to meet its Renewable Power Obligations. Your Directors further inform the members that during the year its Joint Venture partner M/s Bhilwara Energy Limited exited from the Wind Power business and accordingly M/s Hero Wind Energy Private Limited were inducted as Joint Venture partner in their place.
Further as reported in the previous report, your Company is holding significant investment in Bhilwara Energy Limited and is represented by Shri Riju Jhunjhunwala, Managing Director of your Company on their Board where also he is holding the position of Managing Director. Accordingly, M/s Bhilwara Energy Limited continues to be associate of your Company.
Your Directors inform the members that in line with the emphasis of government on Skill Development, your Company decided to undertake the skill development related activities and accordingly acquired 40.66% stake in the form of subscription of 7,50,000 shares in LNJ Skills & Rozgar Private Limited which is involved in skill development activities. Accordingly, LNJ Skills & Rozgar Private Limited has become associate of your Company.
A statement containing the salient features of the financial statements of LNJ Power Ventures Limited, Bhilwara Energy
RSW
M L
imite
d
40
Limited and LNJ Skills & Rozgar Private Limited in the prescribed format AOC 1 is annexed as Annexure - II.
Contribution to the Exchequer
Your Company has contributed an amount of H 267.55 Crores in terms of taxes and duties to the Exchequer.
Corporate Social Responsibility
Your Directors feel pleasure to inform the members that your Company has been on the forefront to fulfil its obligation towards the society at large and accordingly made its contribution in whole gamut of activities such as sanitation and safe drinking water, eradicating hunger, poverty and malnutrition, ensuring environmental sustainability, ecological balance, protection of national heritage, promotion of rural sports etc. Your Directors in their previous report had informed the members that at the request of State Government of Rajasthan, your Company had undertaken to build the damaged wall of Check Dam at Beneshwar near Mordi, Banswara. Your Directors feel pleasure to inform the members that during the year under review an amount of H99.37 lakhs was spent towards this project. Your Company also sponsored for Rajasthan Heritage Development Project. An amount of H10 lakhs was incurred towards this. These activities were besides the other activities undertaken by the Company from time to time.
Your Directors inform the members that the Corporate Social Responsibility Committee comprising of Shri Arun Churiwal, Shri Riju Jhunjhunwala and Shri Amar Nath Choudhary monitors the expenditure incurred on the CSR activities and formulate an annual budget for these activities. Your Directors also review the progress periodically.
The details of the CSR spend by the Company are annexed as Annexure III forming part of this report.
Energy Conservation, Technology Absorption and Foreign Exchange Earnings and Outgo
Your Directors inform the members that your Company continuously looks out for energy conservation measures in all areas of operation across its various units. Similarly, your Company endeavours to lookout for up-gradation and absorption of technology. Your Company also spends continuously on Research and Development. Your Directors are glad to inform the members that your Company is a net foreign exchange earner. The relevant detail as required to be disclosed with respect to Energy Conservation, Technology Absorption
and Foreign Exchange Earnings and Outgo pursuant to Section 134(3) (m) of the Companies Act, 2013 read with the Rule 8(3) of the Companies (Accounts) Rules, 2014 are given in Annexure – IV forming part of this report.
Extract of Annual Return
Pursuant to Section 92 of the Companies Act, 2013 read with Rule 12 of The Companies (Management and Administration) Rules, 2014, the extract of Annual Return in prescribed format MGT-9 is annexed as Annexure – V.
Directors & Key Managerial Personnel
Shri Ravi Jhunjhunwala and Shri Arun Churiwal, Directors retire by rotation and being eligible offer themselves for reappointment.
During the financial year under review, Smt. Geeta Mathur, Independent Woman Director resigned from the Board with effect from 9th November, 2017 due to her time commitments. Further, Shri Prakash Maheshwari, Executive Director also resigned from the Board with effect from 31st March, 2018 due to completion of his term. Your Directors place on record their appreciation for the services rendered by Smt. Geeta Mathur and Shri Prakash Maheshwari during their tenure on the Board.
Your Directors further inform the members that Smt. Archana Capoor was co-opted on the Board as an Additional Director in the category of Independent Director with effect from 13th February, 2018. Smt. Archana Capoor brings with her vast experience in the field of Finance and Market Research. Your Directors further inform the members that the term of Shri Priya Shankar Dasgupta as Independent Director is due for completion on 15th September, 2018. Your Directors upon commendation of Nomination and Remuneration Committee proposed to re-appoint Shri Priya Shankar Dasgupta for the second term of 5 years w.e.f 16th September, 2018. The proposal for confirmation of appointment of Smt Archana Capoor and re-appointment of Shri Priya Shankar Dasgupta as Independent Director(s) for a term of 5 years shall be put up before the ensuing Annual General Meeting.
Your Directors further inform the members that declarations have been taken from the Independent Directors at the beginning of the financial year stating that they meet the criteria of independence as specified under sub-section (6) of Section 149 of the Companies Act, 2013 and Regulation 16(1)(b) of the SEBI (Listing Obligations and Disclosure Requirements) Regulations, 2015.
Ann
ual R
epor
t 201
7-18
41
Management Reports Director’s Report
During the year, Shri Riju Jhunjhunwala, Managing Director & CEO, Shri Surender Gupta, Company Secretary and Shri B.M. Sharma, Chief Financial Officer acted as Key Managerial Personnel.
Directors’ Appointment and Remuneration Policy
As your Directors informed the members in their previous report, a Nomination and Remuneration Policy had been framed by your Company for the appointment of Directors and Senior Management and fixation of their remuneration. The Nomination and Remuneration Policy as framed is annexed as Annexure VI and forms part of this report.
Your Directors inform the members that the Nomination and Remuneration Committee as well your Directors endeavour to follow the policy and all appointments at Board and Senior Management are considered at the meetings of the Committee and the Board.
Annual Evaluation by the Board
Your Board of Directors, during the financial year under review, carried out annual evaluation of its own performance as well as its Committees and also of the individual Directors in the manner as enumerated in the Nomination and Remuneration Policy in accordance with the provisions of Companies Act, 2013 and SEBI (Listing Obligations and Disclosure Requirements) Regulations, 2015. Your Directors feel pleasure in informing the members that the performance of the Board as a whole and its members individually was adjudged satisfactory.
Particulars of Loans, Guarantees or Investments
Details of Loans, Guarantees and Investments are given in the Notes to the Financial Statements at appropriate places.
Particulars of Contracts or Arrangements with Related Parties
All contracts/ arrangements/ transactions entered into by the Company during the financial year with the related parties are on arm’s length basis and in the ordinary course of business. During the financial year, there was no material contracts or arrangements entered into by the Company with any of the
related party. Your Directors draw attention of the members to Note No.39 to the financial statements, which contain particulars with respect to related parties. The policy on dealing with the related party transactions as approved by the Board of Directors is disclosed on the website of the Company under the following link
http: //www.rswm.in/wp-content /themes/rswm/template-investors/pdf/various-policies/Related_Party_Transaction_Policy-2018.pdf
Significant and Material Orders Passed by the Regulators or Courts
During the year under review, there were no significant and materials orders passed by the Regulators or Courts.
Risk Management Policy
The Company has adopted the risk management policy which aimed at creating and protecting shareholders value by minimizing threats and losses and identifying and maximizing opportunities. Your Directors periodically review the risks associated with the business or which threaten the prospects of the Company.
Internal Control Systems
Your Directors inform the members that your Company has put in place strong internal control systems commensurating with the size of the Company. Further, your Directors take utmost care to ensure that all assets are properly safeguarded and reliable information is provided to the management. Your Directors endeavour to inform the member that all the obligations of the Company are properly adhered to.
Your Directors place utmost importance on continuous strengthening of internal control systems. As reported in the previous report, your Company has put in place a system whereby all areas of the operations of the Company are reviewed by the internal as well as external professionals and independent audit firms. Your Company takes adequate measures with respect to gaps, if any, reported. The Audit Committee of your Company regularly monitors the annual operating plans, risk assessment and minimization procedures as well as mitigation plans.
RSW
M L
imite
d
42
Your Directors endeavour to continuously improve and monitor the internal control systems.
Particulars of Employees
The information pursuant to Section 197 read with Rule 5 of the Companies (Appointment and Remuneration of Managerial Personnel) Rules, 2014, of the employees is annexed as Annexure –VII.
Further, pursuant to Rule 5(2) of the Companies (Appointment and Remuneration of Managerial Personnel) Rules, 2014, the relevant statement is annexed as Annexure - VIII.
Auditors
Statutory Auditors
During the year under review, M/s S. Bhargava Associates, Chartered Accountant (Firm Registration No 003191C), Joint Statutory Auditors of the Company retired at the conclusion of the 56th Annual General Meeting as they became ineligible for re-appointment pursuant to Section 139 of the Companies Act, 2013 and rules made thereunder. M/s S. Bhargava & Associates rendered their services over the years and your Board places on record its appreciation of their services as Joint Statutory Auditors of the Company.
M/s Lodha & Co, Chartered Accountants (Firm Registration No.301051E), were appointed as Joint Statutory Auditors of the Company at the 56th Annual General Meeting of the Company held on 27th September, 2017 for a term of 5 years till the conclusion of 61st Annual General Meeting subject to ratification by members at every subsequent Annual General Meeting.
Further, M/s S. S. Kothari Mehta & Co., Chartered Accountants (Firm Registration No.000756N), Joint Statutory Auditors of the Company, were appointed at the 53rd Annual General Meeting of the Company held on September 16, 2014 for a term of 5 years till the conclusion of 58th Annual General Meeting subject to ratification by members at every subsequent Annual General Meeting.
Your Directors inform the members that in accordance with the amendment notified by MCA on 7th May, 2018, the requirement of ratification of the appointment of Statutory Auditors at every Annual General Meeting has been omitted and is no longer required. Accordingly, the notice convening the ensuing Annual General Meeting does not carry resolutions with regard to ratification of appointment of Statutory Auditors.
However, both the Statutory Auditors have confirmed their eligibility under Section 141 of the Companies Act, 2013 and the Rules framed thereunder.
The observations of the Auditors, if any, are explained wherever necessary, in the appropriate notes to the accounts. The Auditors’ Report does not contain qualification, reservation or adverse remark.
Internal Auditors
Your Directors, during the year under review, appointed M/s. P. K. Deora & Co., Chartered Accountants (Firm Registration No.004167N), M/s. BGJC & Associates LLP, Chartered Accountants (Firm Registration No.003304N) and M/s. ASM Bhargava & Co., Chartered Accountants (Firm Registration No.019378C) to act as the Internal Auditors of the Company for the financial year 2017-18 pursuant to Section 138 of the Companies Act, 2013 read with The Companies (Accounts) Rules, 2014.
Secretarial Auditor
Your Directors, during the year under review, also appointed Shri Mahesh Gupta, Practicing Company Secretary (Membership No. FCS 2870 and CP No.1999) Proprietor of M/s Mahesh Gupta & Company, Company Secretaries, Delhi as the Secretarial Auditor of the Company for the financial year 2017-18 pursuant to Section 204 of the Companies Act, 2013 read with The Companies (Appointment and Remuneration of Managerial Personnel) Rules, 2014. The Report of Secretarial Audit is annexed as Annexure IX.
Cost Auditor
Your Directors inform the Members that pursuant to Section 148 of the Companies Act, 2013 read with The Companies (Cost Records and Audit) Rules, 2014, Textile Companies are required to get their cost records audited. In this connection, the Board of Directors of the Company on the commendation of Audit Committee had approved the appointment of M/s. N. D. Birla & Company, Cost Accountants, (Firm Registration No. 000028), Ahmedabad as the Cost Auditor of the Company for the year ending March 31, 2018.
Corporate Governance
Report on Corporate Governance along with the Certificate of Auditors M/s. S. S. Kothari Mehta & Co., Chartered Accountants (Firm Registration No 000756N), Plot No-68, Okhla Industrial Area, Phase III, New Delhi -110020 and M/s. Lodha & Co., Chartered Accountants (Firm Registration No.301051E), 12, Bhagat Singh Marg, New Delhi – 110 001 confirming compliance
Ann
ual R
epor
t 201
7-18
43
Management Reports Director’s Report
to conditions of Corporate Governance as stipulated under SEBI (Listing Obligations and Disclosure Requirements) Regulations, 2015, form part of the Annual Report.
Whistle Blower Policy
Your Directors inform the Members that with the objective of pursuing the business in a fair and transparent manner by adopting the highest standards of professionalism, honesty, integrity and ethical behavior and to encourage and protect the employees who wish to raise and report their genuine concerns about any unethical behavior, actual or suspected fraud or violation of Company’s Code of Conduct, the Company has adopted a Whistle Blower Policy. Policy adopted by the Company contains a framework whereby the identity of the complainant is not disclosed. The policy has been disclosed on the website of the Company, the link of which is given hereunder:
http: //www.rswm.in/wp-content /themes/rswm/template-investors/pdf/various-policies/RSWM-Whistle-Blower-Policy-2018.pdf
Management Discussion and Analysis Report
Management Discussion and Analysis Report as required by SEBI (Listing Obligations and Disclosure Requirements) Regulations, 2015, forms part of the Annual Report.
Directors’ Responsibility Statement.
Pursuant to Section 134(3) (c) of the Companies Act, 2013, the Directors state that:
(a) in the preparation of the annual accounts, the applicable accounting standards had been followed along with proper explanation relating to material departures;
(b) they had selected such accounting policies and applied them consistently and made judgments and estimates that are reasonable and prudent so as to give a true and fair view of the state of affairs of the Company at the end of the financial year and of the profit and loss of the Company for that period;
(c) they had taken proper and sufficient care for the maintenance of adequate accounting records in accordance with the provisions of this Act for safeguarding the assets of the Company and for preventing and detecting fraud and other irregularities;
(d) they had prepared the annual accounts on a going concern basis; and
(e) they had laid down internal financial controls to be followed by the Company and that such internal financial controls are adequate and were operating effectively.
(f) they had devised proper systems to ensure compliance with the provisions of all applicable laws and that such systems were adequate and operating effectively.
Acknowledgements
Your Directors take this opportunity to thank customers, members, suppliers, bankers, business partners / associates, Central and State Governments for their consistent support and co-operation extended to the Company. We also acknowledge the significant contribution made by the employees by their dedication and hard work and trust reposed on us. We look forward to have the same support in our endeavour to help the Company to grow faster.
For and on behalf of the Board
Ravi JhunjhunwalaChairmanDIN - 00060972
Place: Noida (U.P)Date: May 10, 2018
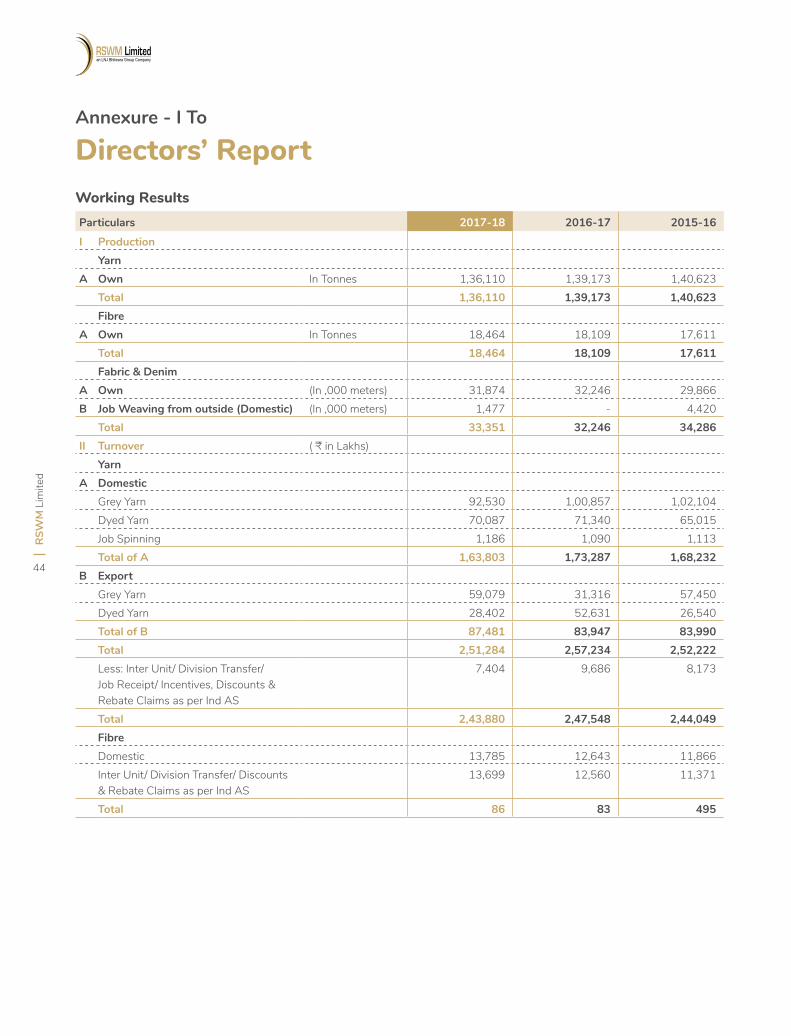
RSW
M L
imite
d
44
Annexure - I To
Working ResultsParticulars 2017-18 2016-17 2015-16
I ProductionYarn
A Own In Tonnes 1,36,110 1,39,173 1,40,623 Total 1,36,110 1,39,173 1,40,623 Fibre
A Own In Tonnes 18,464 18,109 17,611 Total 18,464 18,109 17,611 Fabric & Denim
A Own (In ,000 meters) 31,874 32,246 29,866 B Job Weaving from outside (Domestic) (In ,000 meters) 1,477 - 4,420
Total 33,351 32,246 34,286 II Turnover ( ₹ in Lakhs)
YarnA Domestic
Grey Yarn 92,530 1,00,857 1,02,104 Dyed Yarn 70,087 71,340 65,015 Job Spinning 1,186 1,090 1,113 Total of A 1,63,803 1,73,287 1,68,232
B ExportGrey Yarn 59,079 31,316 57,450 Dyed Yarn 28,402 52,631 26,540 Total of B 87,481 83,947 83,990 Total 2,51,284 2,57,234 2,52,222 Less: Inter Unit/ Division Transfer/ Job Receipt/ Incentives, Discounts & Rebate Claims as per Ind AS
7,404 9,686 8,173
Total 2,43,880 2,47,548 2,44,049 FibreDomestic 13,785 12,643 11,866 Inter Unit/ Division Transfer/ Discounts & Rebate Claims as per Ind AS
13,699 12,560 11,371
Total 86 83 495
Directors’ Report
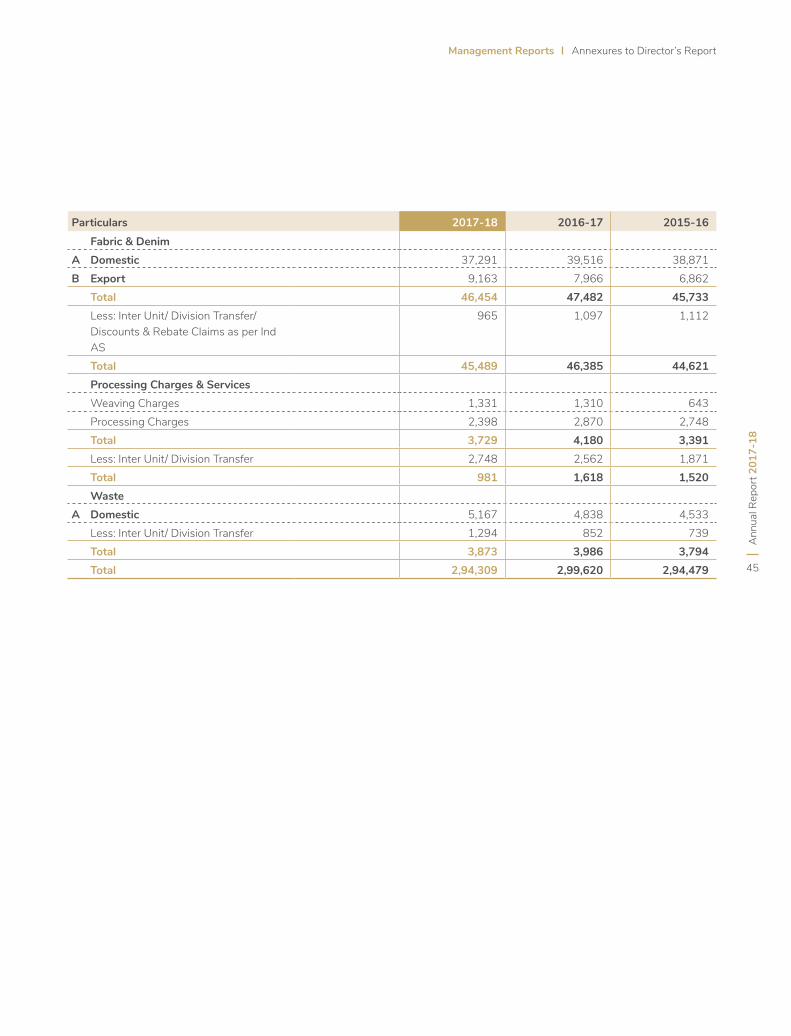
Ann
ual R
epor
t 201
7-18
45
Management Reports Annexures to Director’s Report
Particulars 2017-18 2016-17 2015-16Fabric & Denim
A Domestic 37,291 39,516 38,871 B Export 9,163 7,966 6,862
Total 46,454 47,482 45,733 Less: Inter Unit/ Division Transfer/ Discounts & Rebate Claims as per Ind AS
965 1,097 1,112
Total 45,489 46,385 44,621 Processing Charges & ServicesWeaving Charges 1,331 1,310 643 Processing Charges 2,398 2,870 2,748 Total 3,729 4,180 3,391 Less: Inter Unit/ Division Transfer 2,748 2,562 1,871 Total 981 1,618 1,520 Waste
A Domestic 5,167 4,838 4,533 Less: Inter Unit/ Division Transfer 1,294 852 739 Total 3,873 3,986 3,794 Total 2,94,309 2,99,620 2,94,479
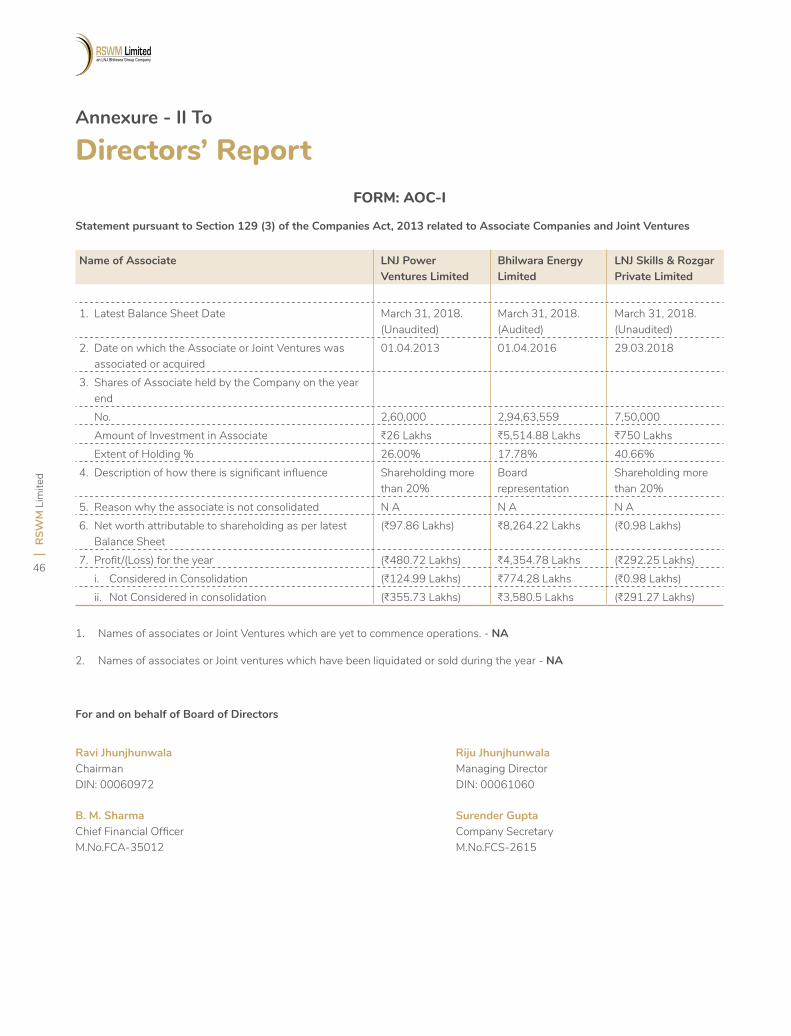
RSW
M L
imite
d
46
Annexure - II To
Directors’ ReportFORM: AOC-I
Statement pursuant to Section 129 (3) of the Companies Act, 2013 related to Associate Companies and Joint Ventures
1. Names of associates or Joint Ventures which are yet to commence operations. - NA
2. Names of associates or Joint ventures which have been liquidated or sold during the year - NA
For and on behalf of Board of Directors
Ravi Jhunjhunwala Riju JhunjhunwalaChairman Managing DirectorDIN: 00060972 DIN: 00061060
B. M. Sharma Surender GuptaChief Financial Officer Company SecretaryM.No.FCA-35012 M.No.FCS-2615
Name of Associate LNJ Power Ventures Limited
Bhilwara Energy Limited
LNJ Skills & Rozgar Private Limited
1. Latest Balance Sheet Date March 31, 2018. (Unaudited)
March 31, 2018. (Audited)
March 31, 2018. (Unaudited)
2. Date on which the Associate or Joint Ventures was associated or acquired
01.04.2013 01.04.2016 29.03.2018
3. Shares of Associate held by the Company on the year end
No. 2,60,000 2,94,63,559 7,50,000 Amount of Investment in Associate C26 Lakhs C5,514.88 Lakhs C750 Lakhs Extent of Holding % 26.00% 17.78% 40.66%4. Description of how there is significant influence Shareholding more
than 20%Board representation
Shareholding more than 20%
5. Reason why the associate is not consolidated N A N A N A6. Net worth attributable to shareholding as per latest
Balance Sheet(C97.86 Lakhs) C8,264.22 Lakhs (C0.98 Lakhs)
7. Profit/(Loss) for the year (C480.72 Lakhs) C4,354.78 Lakhs (C292.25 Lakhs) i. Considered in Consolidation (C124.99 Lakhs) C774.28 Lakhs (C0.98 Lakhs) ii. Not Considered in consolidation (C355.73 Lakhs) C3,580.5 Lakhs (C291.27 Lakhs)
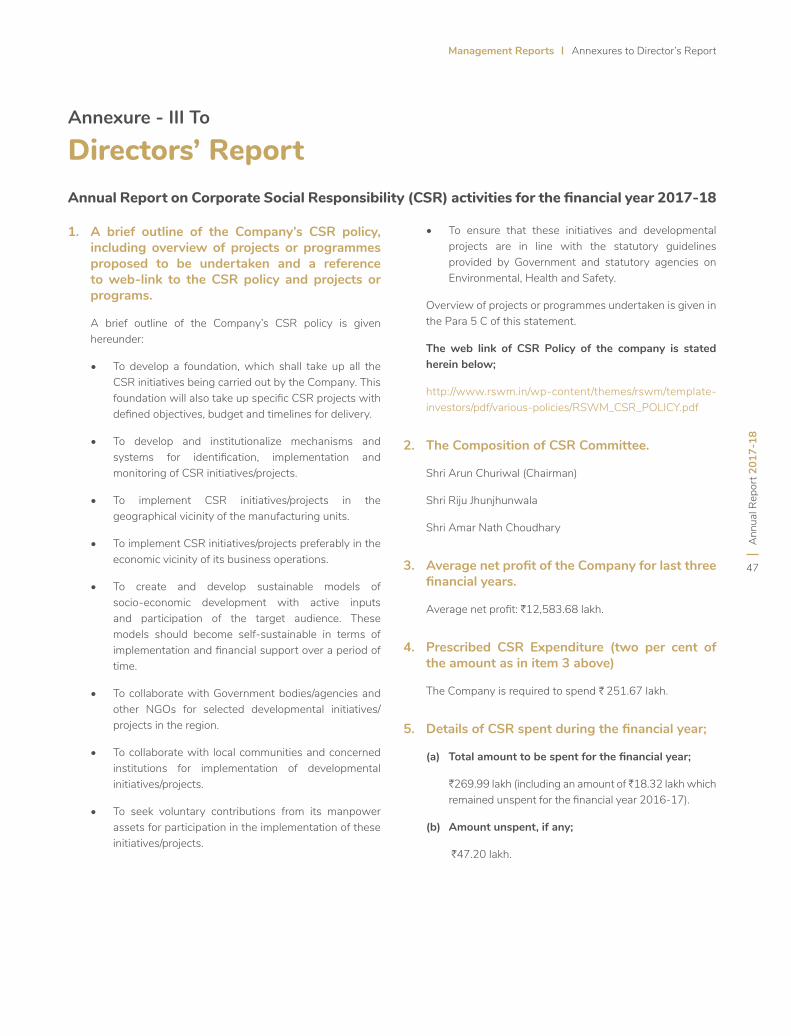
Ann
ual R
epor
t 201
7-18
47
Management Reports Annexures to Director’s Report
Annexure - III To
Directors’ Report
1. A brief outline of the Company’s CSR policy, including overview of projects or programmes proposed to be undertaken and a reference to web-link to the CSR policy and projects or programs.
A brief outline of the Company’s CSR policy is given hereunder:
• To develop a foundation, which shall take up all the CSR initiatives being carried out by the Company. This foundation will also take up specific CSR projects with defined objectives, budget and timelines for delivery.
• To develop and institutionalize mechanisms and systems for identification, implementation and monitoring of CSR initiatives/projects.
• To implement CSR initiatives/projects in the geographical vicinity of the manufacturing units.
• To implement CSR initiatives/projects preferably in the economic vicinity of its business operations.
• To create and develop sustainable models of socio-economic development with active inputs and participation of the target audience. These models should become self-sustainable in terms of implementation and financial support over a period of time.
• To collaborate with Government bodies/agencies and other NGOs for selected developmental initiatives/projects in the region.
• To collaborate with local communities and concerned institutions for implementation of developmental initiatives/projects.
• To seek voluntary contributions from its manpower assets for participation in the implementation of these initiatives/projects.
Annual Report on Corporate Social Responsibility (CSR) activities for the financial year 2017-18
• To ensure that these initiatives and developmental projects are in line with the statutory guidelines provided by Government and statutory agencies on Environmental, Health and Safety.
Overview of projects or programmes undertaken is given in the Para 5 C of this statement.
The web link of CSR Policy of the company is stated herein below;
http://www.rswm.in/wp-content/themes/rswm/template-investors/pdf/various-policies/RSWM_CSR_POLICY.pdf
2. The Composition of CSR Committee.
Shri Arun Churiwal (Chairman)
Shri Riju Jhunjhunwala
Shri Amar Nath Choudhary
3. Average net profit of the Company for last three financial years.
Average net profit: H12,583.68 lakh.
4. Prescribed CSR Expenditure (two per cent of the amount as in item 3 above)
The Company is required to spend H 251.67 lakh.
5. Details of CSR spent during the financial year;
(a) Total amount to be spent for the financial year;
H269.99 lakh (including an amount of H18.32 lakh which remained unspent for the financial year 2016-17).
(b) Amount unspent, if any;
H47.20 lakh.
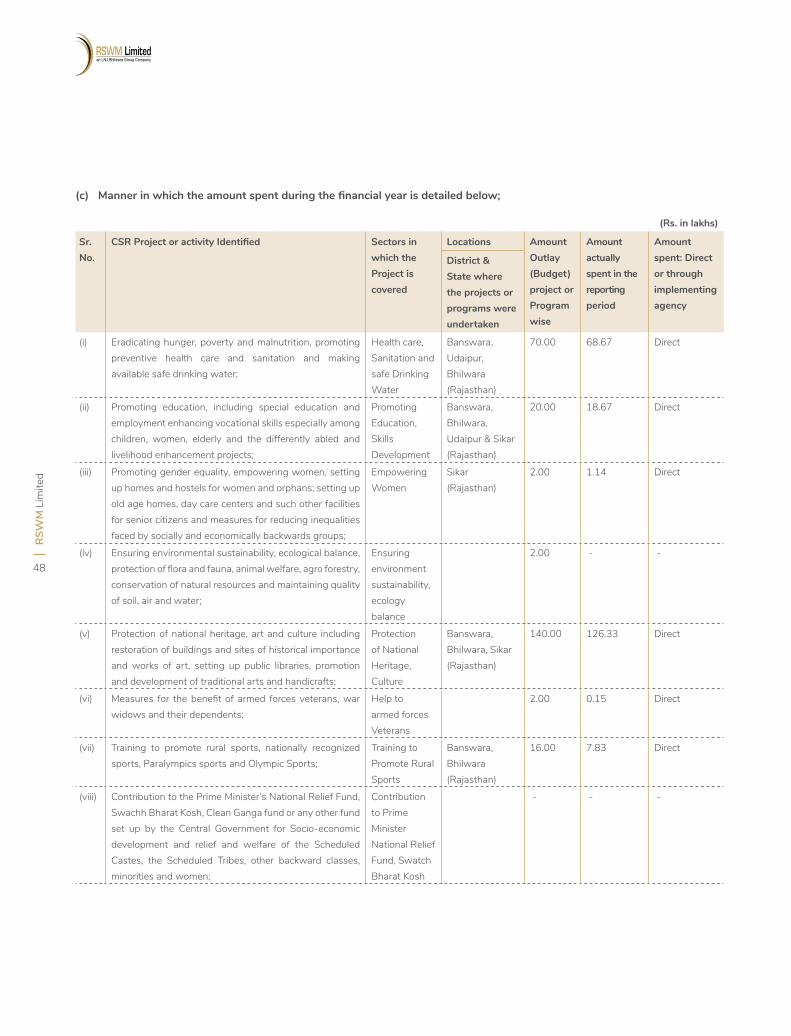
RSW
M L
imite
d
48
(c) Manner in which the amount spent during the financial year is detailed below;
(Rs. in lakhs)
Sr. No.
CSR Project or activity Identified Sectors in which the Project is covered
Locations Amount Outlay (Budget) project or Program wise
Amount actually spent in the reporting period
Amount spent: Direct or through implementing agency
District & State where the projects or programs were undertaken
(i) Eradicating hunger, poverty and malnutrition, promoting preventive health care and sanitation and making available safe drinking water;
Health care, Sanitation and safe Drinking Water
Banswara, Udaipur, Bhilwara (Rajasthan)
70.00 68.67 Direct
(ii) Promoting education, including special education and employment enhancing vocational skills especially among children, women, elderly and the differently abled and livelihood enhancement projects;
Promoting Education, Skills Development
Banswara, Bhilwara, Udaipur & Sikar (Rajasthan)
20.00 18.67 Direct
(iii) Promoting gender equality, empowering women, setting up homes and hostels for women and orphans; setting up old age homes, day care centers and such other facilities for senior citizens and measures for reducing inequalities faced by socially and economically backwards groups;
Empowering Women
Sikar (Rajasthan)
2.00 1.14 Direct
(iv) Ensuring environmental sustainability, ecological balance, protection of flora and fauna, animal welfare, agro forestry, conservation of natural resources and maintaining quality of soil, air and water;
Ensuring environment sustainability, ecology balance
2.00 - -
(v) Protection of national heritage, art and culture including restoration of buildings and sites of historical importance and works of art, setting up public libraries, promotion and development of traditional arts and handicrafts;
Protection of National Heritage, Culture
Banswara, Bhilwara, Sikar (Rajasthan)
140.00 126.33 Direct
(vi) Measures for the benefit of armed forces veterans, war widows and their dependents;
Help to armed forces Veterans
2.00 0.15 Direct
(vii) Training to promote rural sports, nationally recognized sports, Paralympics sports and Olympic Sports;
Training to Promote Rural Sports
Banswara, Bhilwara (Rajasthan)
16.00 7.83 Direct
(viii) Contribution to the Prime Minister’s National Relief Fund, Swachh Bharat Kosh, Clean Ganga fund or any other fund set up by the Central Government for Socio-economic development and relief and welfare of the Scheduled Castes, the Scheduled Tribes, other backward classes, minorities and women;
Contribution to Prime Minister National Relief Fund, Swatch Bharat Kosh
- - -
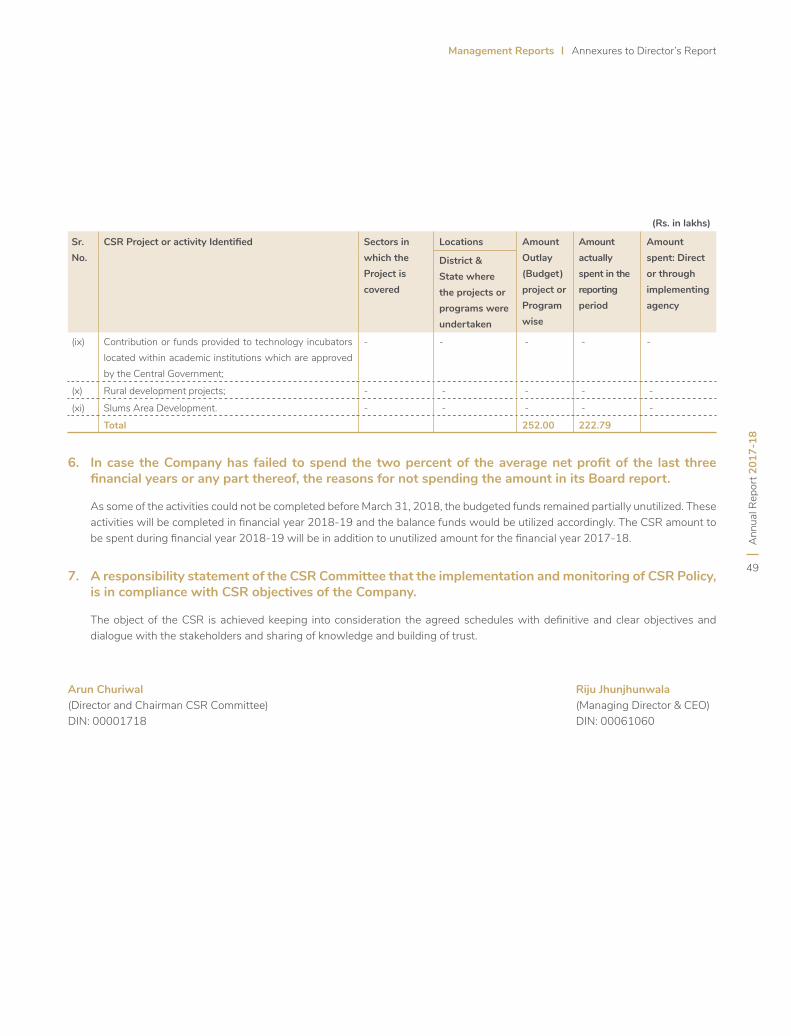
Ann
ual R
epor
t 201
7-18
49
Management Reports Annexures to Director’s Report
(Rs. in lakhs)
Sr. No.
CSR Project or activity Identified Sectors in which the Project is covered
Locations Amount Outlay (Budget) project or Program wise
Amount actually spent in the reporting period
Amount spent: Direct or through implementing agency
District & State where the projects or programs were undertaken
(ix) Contribution or funds provided to technology incubators located within academic institutions which are approved by the Central Government;
- - - - -
(x) Rural development projects; - - - - -
(xi) Slums Area Development. - - - - -
Total 252.00 222.79
6. In case the Company has failed to spend the two percent of the average net profit of the last three financial years or any part thereof, the reasons for not spending the amount in its Board report.
As some of the activities could not be completed before March 31, 2018, the budgeted funds remained partially unutilized. These activities will be completed in financial year 2018-19 and the balance funds would be utilized accordingly. The CSR amount to be spent during financial year 2018-19 will be in addition to unutilized amount for the financial year 2017-18.
7. A responsibility statement of the CSR Committee that the implementation and monitoring of CSR Policy, is in compliance with CSR objectives of the Company.
The object of the CSR is achieved keeping into consideration the agreed schedules with definitive and clear objectives and dialogue with the stakeholders and sharing of knowledge and building of trust.
Arun Churiwal Riju Jhunjhunwala(Director and Chairman CSR Committee) (Managing Director & CEO)DIN: 00001718 DIN: 00061060
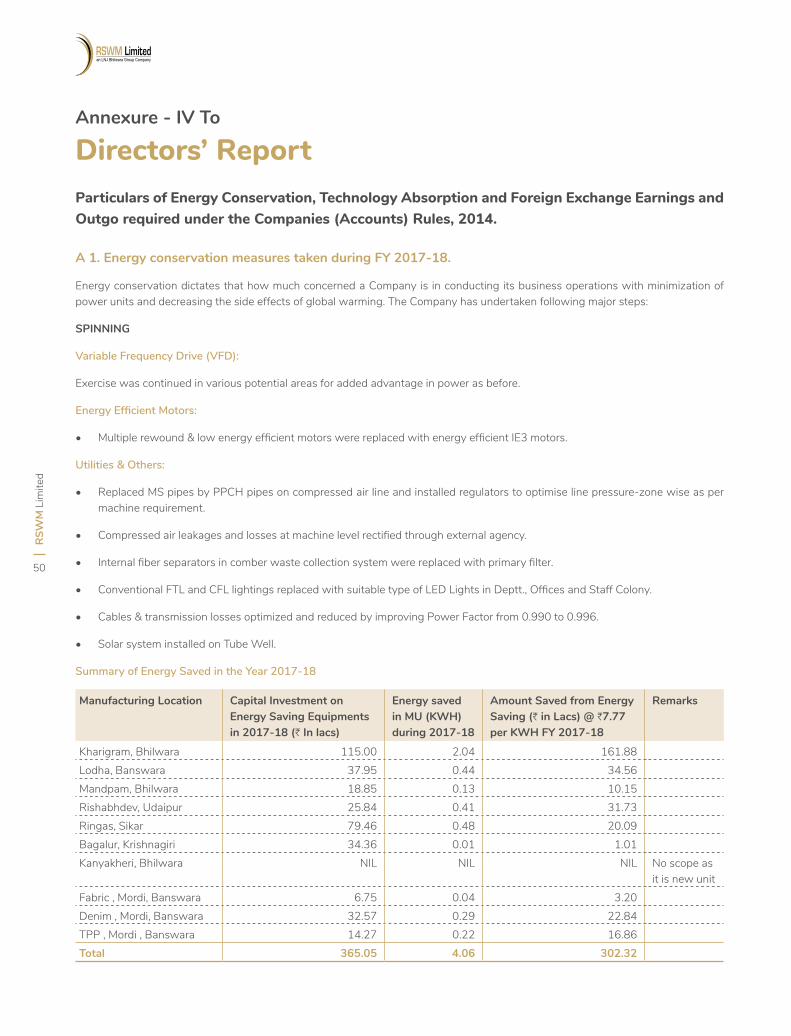
RSW
M L
imite
d
50
Annexure - IV To
Directors’ ReportParticulars of Energy Conservation, Technology Absorption and Foreign Exchange Earnings and Outgo required under the Companies (Accounts) Rules, 2014.
A 1. Energy conservation measures taken during FY 2017-18.
Energy conservation dictates that how much concerned a Company is in conducting its business operations with minimization of power units and decreasing the side effects of global warming. The Company has undertaken following major steps:
SPINNING
Variable Frequency Drive (VFD):
Exercise was continued in various potential areas for added advantage in power as before.
Energy Efficient Motors:
• Multiple rewound & low energy efficient motors were replaced with energy efficient IE3 motors.
Utilities & Others:
• Replaced MS pipes by PPCH pipes on compressed air line and installed regulators to optimise line pressure-zone wise as per machine requirement.
• Compressed air leakages and losses at machine level rectified through external agency.
• Internal fiber separators in comber waste collection system were replaced with primary filter.
• Conventional FTL and CFL lightings replaced with suitable type of LED Lights in Deptt., Offices and Staff Colony.
• Cables & transmission losses optimized and reduced by improving Power Factor from 0.990 to 0.996.
• Solar system installed on Tube Well.
Summary of Energy Saved in the Year 2017-18
Manufacturing Location Capital Investment on Energy Saving Equipments in 2017-18 (H In lacs)
Energy saved in MU (KWH) during 2017-18
Amount Saved from Energy Saving (H in Lacs) @ H7.77 per KWH FY 2017-18
Remarks
Kharigram, Bhilwara 115.00 2.04 161.88 Lodha, Banswara 37.95 0.44 34.56 Mandpam, Bhilwara 18.85 0.13 10.15 Rishabhdev, Udaipur 25.84 0.41 31.73 Ringas, Sikar 79.46 0.48 20.09Bagalur, Krishnagiri 34.36 0.01 1.01 Kanyakheri, Bhilwara NIL NIL NIL No scope as
it is new unitFabric , Mordi, Banswara 6.75 0.04 3.20 Denim , Mordi, Banswara 32.57 0.29 22.84 TPP , Mordi , Banswara 14.27 0.22 16.86 Total 365.05 4.06 302.32
Ann
ual R
epor
t 201
7-18
51
Management Reports Annexures to Director’s Report
2. Steps taken to utilize alternative sources of energy:
Installed Roof Top Solar Power Plant of 1.8 MW capacity at Mandpam in July, 2018 with generation of approximately 7,000 units per day.
DENIM
• Replaced mono-block pumps with energy efficient pumps in lamella and tertiary clarifier.
• Reduced air consumption by changing latest damping cylinder in Open End machine and replacing diffuser in biological tank to reduce the air consumption.
• Steam consumption reduced by reducing pressure 3.5 to 1.5 in finishing machine along with traps’ replacement with insulation.
FABRIC
• Replaced old vertical type pumps with energy efficient single stage vertical pumps for CIP, OSB, WAC and permeate water pumping.
• Installed Effimax 4000 system of Forbes Marshall make in Thermopac to monitor and control speed of ID Fan, FD Fan and coal feed automatically as per requirement to minimize the coal consumption.
TPP
• Reduced auxiliary power consumption by installing VFD at Boiler Fans.
• Reduced lighting power consumption by using LED fittings.
• Energy saved by Operations’ optimization. Refer following details:
• Optimizing CT fan operation on 4 cells by monitoring of cooling water pressure.
• Reduction of discharge Air Pressure for compressors of ash handling system.
• Reduction of discharge Air Pressure for compressors of Instrument air.
FIBER DIVISION
• RHS Dryer air blower fan controlled with VFD.
3. Energy Conservation Plan for the Year 2018-19
SPINNING
Variable Frequency Drive:
• To install VFD at areas like Compressors, Humidity Plants etc. as a continued activity.
Energy Efficient Motors:
• To replace low energy efficient & multiple re-wound motors by IE4 Motors as a continued activity.
• To replace old mono block pumps in humidity plant by new high efficient pumps as per previous years.
Utility & Others:
• To install Centrifugal Compressor (4344 CFM) to fulfil entire plant compressed air requirement, projecting considerable saving potential.
• To replace obsolete M21 Spindles of R/F having wharve dia of 21mm by new spindles of 18mm wharve dia for power saving.
• To arrest leakages of compressed air network by undergoing AMC with external expert agency after implementation.
• To install PLC/HMI Controller to control SA & RA Fan in Auto mode w.r.t to RH & Temp.
• To replace overhead travelling cleaner’s impeller by energy efficient impellers.
• To install stationary filter in place of rotary filter in LR-6 R/F M/cs.
• To install automated system for controlling the speed of supply of air and return air fans of H. Plant.
• To install LED base tube lights as an ongoing exercise.
• To install new aluminum compressed air pipe line for ring frame section.
• To replace R/F m/c. pneumafil fan impeller as per existing new m/c.
DENIM
• To replace cooling fan motor in Stenter of Finishing.
• To replace hood fan motor in Dyeing and Finishing.
RSW
M L
imite
d
52
• To install LED lighting as a continued activity.
• To install AC Drive in supply air & return air fans in H. Plant.
FABRIC
• To replace low energy efficient pumps in ETP, RO plant and Water Softening by high energy efficient ones.
• To install pneumatic pressure powered pump for condensate water recovery outside the finishing plant.
• To replace CFL and HPSV street lights by LED lights.
• To install PRVs at compressed air-line network to optimize air consumption as per pressure requirement.
TPP
• To install 11 KV MV drives for BFP.
• To install VFD drive for Inst. Compressor.
• To retrofit Instrument Air Dryer from BHR to HOC type.
FIBER DIVISION
• Automation in prewash and caustic tank pump motor (5.5 Kw) with level sensor and butterfly valve.
• To install vapor absorption chiller machine (VAM) in new 70 MT plant operation.
• Automation in RHS Dryer M/c. Hood Blower controlled through VFD with temp. sensor & controller.
• Bale press condenser replacement with cyclomax. Total quantity – 3 nos.
4. Steps to be taken to utilize alternative sources of energy:
• Plan to install Solar Power Plant of 22.8 MW capacity at different units of RSWM Limited, all under Opex plan, as per details given below:-
11.00 MW at LNJ Nagar Mordi, Banswara (all on Ground)
8.14 MW at Kharigram (6.74MW on Ground and 1.4 MW on Roof Top)
2.50 MW at Lodha (1 MW on Ground and 1.5 MW on Roof Top)
1.16 MW at Ringas (On Roof Top)
B. Technological upgradation and absorption (in 2017-18)
(a) New Products
SPINNING
• Launched booklets with new developments separately for Knitting, Sweater Knitting, Woven & Home Linen Segments.
• Developed more qualities with waste which is similar to Inj. Slub but cost effective.
• Introduced loop yarn with different blends from 100% Polyester to Bamboo/Cotton/Wool/Linen for Home Linen and Knitting.
• Introduced quality with cationic fibers with slubs.
• Developed qualities with different colour metallic fibers for knitting segments.
• Developed varied new qualities with dyed coarser fibers.
• Developed new range for Core Spun Lycra with fancy effects in 100% Polyester, Poly/Viscose, Poly/Cotton, Poly/Linen and with Neppy and Natural Slubs for Denim applications.
• Developed qualities first time by dyeing Nylon & Wool fibers for Suiting and Knitting.
• Developed qualities with acrylic fibers with fancy effects for Shawls & Dress Material Market.
• Introduced functional yarns with FR Viscose & Aramid Fibers for high end applications.
• Introduced Linen Look quality in 100% Polyester for Home Linen.
• Showcased new qualities at Premiere Vision Exhibition held in Paris in Feb.,18 in our stall.
• Introduced & commercialized new products using fibers like Recrotherm, XT2, Copron, Beltron, Viscose 8D, Ecofast cotton, Flat, dumb-bell, nano polyester, nylon tbl etc. to meet ever changing requirements of the Protective Wear, Active Wear, Knitwear, Woven, Home Furnishing and Fashion Industry.
• Developed different Wool Blends, Filasia in different Blends, Slub & Core Spun, Canonized Cotton with 100% Cotton.
• Developed different types of slub grindle products (Spun & Filament) such as spiral slub with Poly /Flex, Vis/Flex, neppyslub etc.
Ann
ual R
epor
t 201
7-18
53
Management Reports Annexures to Director’s Report
• Developed Eli spun yarn in Tencel and Excel for end of use sewing threads to fulfill the cellulosic sewing applications.
• Developed variety of Slubs (variable length, dia & No of slubs) and neppy fancy yarns for different effect, well accepted by export and domestic market.
• Developed hairy yarns with use of course denier for export and domestic market.
• Successfully produced variety of fancy yarns like Neppy yarn, Roving Grindle, Magic Slub, Course Slub Yarn Grindle with Filament and Multi Fold Combinations.
• Developed new product of Elite compact yarns in multifold.
• Developed embroidery yarn using VSF, Bamboo, Excel, Modal, Tencel fibres.
• Added NPD Cell at Ringus where we have developed many new Fancy Yarns for widening our new product basket.
• Developed Autumn Cool quality by using dyed cotton noil blended with Polyester & Viscose. It goes for T-Shirts with fascinating effects.
• Developed new qualities with use of short dyed Polyester Fibers.
• Fancy Yarn qualities developed like Dazay Plus and Wintej which have a wide range of bright shades to attract customers.
• Manufactured functional yarns such as Bamboo Charcoal, Sea Shell for International Brands.
• Introduced fancy filaments with melange yarn, TFO grindle product for fancy effect.
• Melange has developed a range of soft premium blends for Cosy Feel with different fibres.
• Introduced PCW (Post Consumer Waste) for fancy effect in yarn as per customer’s demand.
• Introduced Cashmere Wool with fancy effect for Sheeting segment for international brands.
• Introduced recycled garnetted cotton in melange yarn with 100% cotton and recycled polyester.
• Produced cationic polyester with cotton blends in weaving for brighter melange effect after dyeing.
• Produced softer feel European linen with cotton blends and successfully commercialized it.
• Introduced D/frame and S/Frame grindle melange yarn for innovative melange effects.
• Produced cotton neps material in 100% cotton melange for domestic markets.
• Successfully commercialized naturefresh (without soda and salt dyeing on room temperature) in normal as well as fancy yarns.
• Introduced sulphur dyeing product in 20+ colors for replacing INDIGO dyed yarn.
• Chemical recipe optimization done by changing recipe in reduction clearing for cost saving of 16% to 20% in dark & extra heavy dark shades.
DENIM
• Developed Sustainable Denim and supplying to leading International Brands. It includes PCW (Post Consumer Waste), Recycled Denim Fabrics upto 20% PCW Content, Organic / BCI Products, Sustainable Blends, Less Water and Energy Dyed Denim Fabrics etc.
• Introduced Quilted Denim Fabric for Jacketing. Also developed 360˚ Stretch and Vertical Stretch Denim Fabric.
• Developed a range of Super Denims, containing soft premium blends for Cosy Feel.
• Developed Technical Indigos, Knit Look, Structured, Double Cloth Fabrics in differentiated Color Cast and Finishes.
• Introduced 100% Lyocell and its Blends in Denim Fabric, to get soft hand fabrics.
• Developed Functional Denim Fabrics having properties such as All Weather, Anti Bacterial, Anti Inflammatory, Moisture Management, Water Repellent etc.
FABRIC
• Jacquards with weft Lycra that suits Ceremonial functions.
• PVL (Poly Vis Linen) blend to give durability with Cool touch.
• Heavy Base Wool Blended Jackets, to enhance the property of warmthness.
RSW
M L
imite
d
54
• Fire Retardant Fabric for Aviation Industries.
• 100 % Cotton with Fire Retardant property.
• Fire Retardant Fabric with Strength of Aramid Fibre, gives durability with Fire protection.
• 4 Way Stretch (both ways lycra), to provide ultra comfort.
• Acrylic base Jackets Economy product, alternate of wool.
• Successfully developed Innerduct Fabric, to be used in optical Cable guard.
• Wool rich collection (around 90 % Wool blend), made for soft touch high class executives.
• Protex Cotton Antistatic Fire Retardant treated fabric , to be used in Oil Industries.
• Poly Wool Modal fabric for soft touch wool wear.
• Anti-Bacterial Fabric that gives long lasting freshness(odor free Fabric).
• Print Collection ,trendy fashion for young generation.
• 100% Viscose Fabric for Ladies Wear.
FIBER DIVISION:
• Supreme Black has been developed for Premium Segment.
(b) Technology Absorption
SPINNING
• Twisted lycra assembly winder of latest generation installed to increase twisted lycra yarns’ production from 15 MT/month to 55 MT/month.
• Unit No.9 of Kharigram having 43,300 spindles was converted successfully from less profitable commodity, grey synthetic yarns to dyed synthetic yarns.
• Unit No.3 and 5 were expanded with additional preparatory m/cs to increase production by 100 MT/month & better utilize the available infrastructure with reduced unabsorbed losses.
• Aqua splicers were installed at Lodha on 4 TFO’s to increase output of Ne 2/40s cotton combed yarn.
• High Speed D/Fs were added by replacing obsolete DO/2S D/Fs at Lodha to increase production.
• Created facility for 90 MT/month extra production in Unit No.8 at Lodha with possibility of about 200 MT/month of Denim yarns, in count range of 6s to 16s.
• NPD infrastructure strengthened at Lodha with addition of a wide range of fabric/dyeing m/cs, garment (Hank Sweater Knitting m/c.), lycra unit etc.
• Installed more Glycerin Bath Sample Dyeing M/cs. (12 pots) at Kharigram and Ringas to manage increasing shade matching requirement.
• Modernization plan was taken under execution in Ringas Spinning Plant with required m/cs’ installation with increase of ring spindles from 27,840 spindles to 32,736 spindles with addition of 4,896 spindles. With above modernization fully in place in FY 2018-19, Q1 end, all 42 old obsolete DJ-5 R/Fs of 35 years old generation shall be replaced.
• Slub attachment unit of latest generation was added to have improved quality of slub yarn with 10% increase in productivity.
• Compact yarn’s provision of make Suessen created at Kanyakheri on 4 Nos. R/Fs.
DENIM
• Installed spectrophotometer in lab so that the exact sulphur concentration in the dye bath can be measured for better shade consistency.
• Fully automated Washing m/c was installed so as to do controlled blanket washing and thus better quality consistency in denim fabric.
• Ingenious kiss –roll technology installed for better moisturing of the fabric before sanfor causing better shrinkage control.
• Introduced powder hydro feeder in Rope dyg m/c has helped us in maintaining better ORP in the dye bath.
• Sulphur Tank was provided as in sheet dyeing, there was no scope of taking back the sulphur liquor from dyeing tank to the storage. So whenever we use sulphur style, we have to drain the whole dye liquor which itself is a huge wastage. A simple arrangement of pipe line and motor is used to resolve the problem.
TPP
• Upgraded Battery Bank (2V, 200 AH, 180 cells) for critical controls from VRLA type to OPZs type.
Ann
ual R
epor
t 201
7-18
55
Management Reports Annexures to Director’s Report
• Installed pneumatic Vibrators in fuel hoppers of boilers.
FIBER DIVISION
Process Optimization
• Optimized quality of raw material with consistent product quality.
• Increased raw material to fiber recovery.
Waste Reduction
• Reduced SS Grade Production.
• Reduced waste % in Draw line Process.
Cost Reduction
• Utilities and fixed cost reduced with constructive efforts in the process optimization.
Capex Proposals for 2018-19 :
SPINNING
• To provide Cyclone System to increase stuffing of dyed fibre preparation in mixing bins.
• To convert Uster Quantum II EYC to reduce contamination complaints.
• To convert building mechanism from mechanical to electrical to improve cop quality & content of Jingwei Ring frames.
• To replace TFO’s having high power consumption by energy efficient latest generation VJ 120 MD TFO’s to save power considerably.
• To install Fancy Tops D/F for producing multiple shades effect in yarn.
• To create provision of Elitwist and Elite yarns in grey cotton set up.
• To replace obsolete Bale Plucker by a MBO+RV Beater in Unit No.4-6.
• To replace obsolete Autoconer Schlafhorst-238 (146 version) by Schlafhorst-AC-6 for quality requirement.
• To provide Sprinkler System in RM Godowns where Cotton/ Viscose is stored.
• To convert Rishabhdev Unit from Grey to Dyed Yarn Spinning.
• To add twisting capacity at Rishabhdev plant by replacing high power cost old TFOs by latest generation TFO’s to realize considerable power saving.
• Expansion of Spinning plant undertaken for increase of spindles from 27,840 to 32,796 spindles by addition of 4,896 spindles.
• To expand fibre dyeing capacity by 22 MT of Polyester Dyeing to support Rishabhdev plant & reduce dyeing cost in Melange Business. This includes auto dispensing system with replacement of some obsolete m/cs also.
DENIM
• Stenter-6 (old stenter-1) VSD, Pad steam Display, LCB -1, LCB-2 VSD and ring frame drive up gradation to Increase productivity and decrease damage of fabric & down time.
• Upgradation and revamping in Knotting machine/Stand to increase productivity of knotting machine.
• U rotor technology for creating yarn with bold slub can be prepared which will have less rolling and snarling tendency in weaving preparatory.
• To introduce combers and lab former to make combed yarn which is very much in demand for denim application.
• Transport system to help in creeling the Ring frame from Speed frame and thus the manpower requirement and material handling will be reduced.
• Creel and m/c modification for making Elitwist yarn to help in producing yarns like 2/30s and 2/40s which is very much in use in denim products.
• Weft straightening unit to further help in maintaining minimum bowing in the fabric.
• Chilling unit: To maintain fabric temperature at the exits of the sanfor unit and thereby ensuring dimensional stability of the processed fabric.
• Storage of pick density by using a software to help in maintaining the records of the ppi of processed fabric and thus ensuring fabric quality.
FABRIC
• To refurbish Effluent Treatment Plant (ETP).
• To procure two nos VDR-16& 20 Teflon Coating Cylinders for rotational maintenance.
RSW
M L
imite
d
56
• To replace Relax Scouring Machine’s Tank (Perfortex Washer nos. 1&2).
• To dornier Jacquard (one no.) harnness and module change.
• To install new heald frames for E-shedding Toyota 810 Looms (12 nos).
• To install online Loom Monitoring System.
• To convert of Non-AGS looms with AGS system in Toyota 810 loom shed.
• To replace 10 nos Toyota 610 worn out beam gears.
• To procure new Weavers’ Beam (10 nos) for Picanol Rapier Loom.
Expenditure Incurred on Research & Development during FY 2017-18
TPP
• Migration of DCS hardware module from Rx-220P to ET-200 type due to obsolescence.
• Upgradation of ESP controllers due to obsolescence.
FIBER DIVISION
• Major expansion planned & taken under execution with increase in production capacity by 70 MT/Day i.e. from 50 MT/Day to 120 MT/Day. The expansion also includes varied product range, e.g. dope dyed shades (other than black), 3D conjugate fibres, low cost medium tenacity recycled PSF etc.
C. Foreign Exchange Earnings and Outgo
1. Activities relating to export, initiatives to increase exports, development of new export markets for product and services and export plan.
The Company has continued to maintain focus and avail export opportunities based on economic consideration. During the year, the Company has made exports worth H 927.01 Crores($150.45 million) on FOB basis.
2. Total Foreign Exchange Earned and Used
Sl. No
Unit Capex (J in Lakhs) Recurring (J in Lakhs) Total (J in Lakhs)
1 Lodha 56.19 327.08 383.272 Rishabhdev - 71.87 71.873 Kharigram 2.74 314.92 317.664 Melange - 153.82 153.825 Bagalur 187.50 69.19 256.696 Denim 2.25 219.99 222.247 Fabric - 64.16 64.168 Ringas 5.86 102.51 108.379 Kanyakheri 0.10 32.04 32.1410 RCPF - 50.94 50.94
Total 254.64 1406.52 1661.16
Particulars J in croreForeign Exchange earned in terms of actual inflows 927.01Foreign Exchange used in terms of actual outflow 89.08
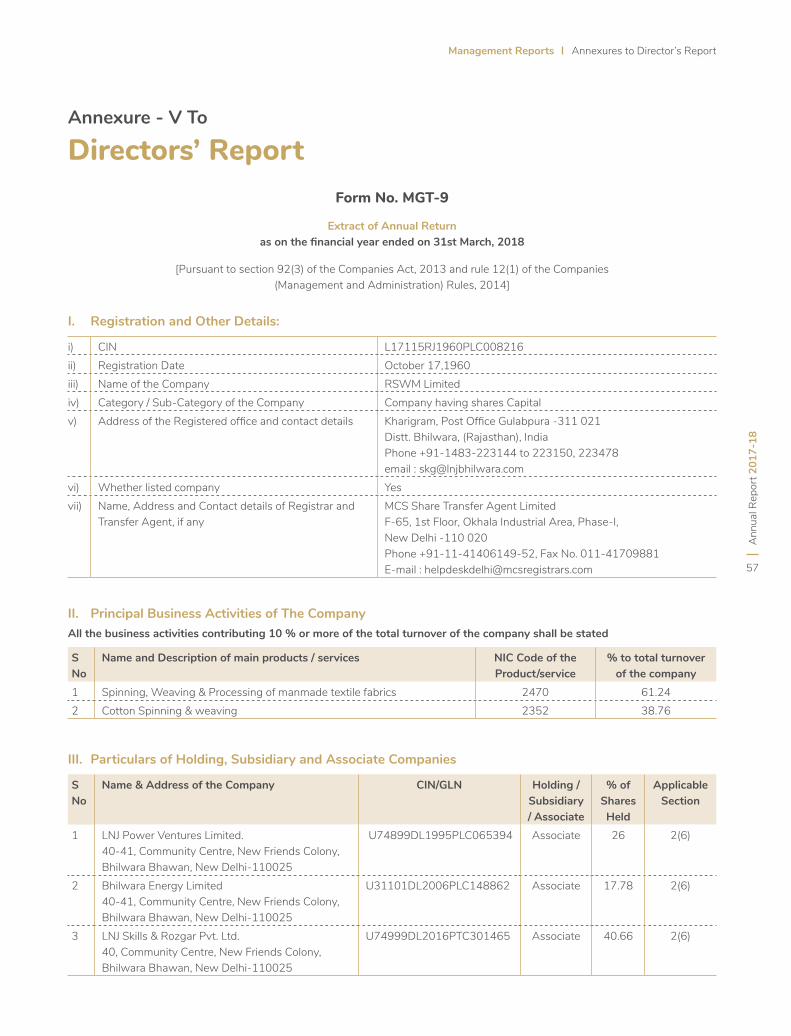
Ann
ual R
epor
t 201
7-18
57
Management Reports Annexures to Director’s Report
Annexure - V To
Directors’ ReportForm No. MGT-9
Extract of Annual Returnas on the financial year ended on 31st March, 2018
[Pursuant to section 92(3) of the Companies Act, 2013 and rule 12(1) of the Companies (Management and Administration) Rules, 2014]
i) CIN L17115RJ1960PLC008216ii) Registration Date October 17,1960iii) Name of the Company RSWM Limitediv) Category / Sub-Category of the Company Company having shares Capitalv) Address of the Registered office and contact details Kharigram, Post Office Gulabpura -311 021
Distt. Bhilwara, (Rajasthan), IndiaPhone +91-1483-223144 to 223150, 223478email : [email protected]
vi) Whether listed company Yesvii) Name, Address and Contact details of Registrar and
Transfer Agent, if anyMCS Share Transfer Agent LimitedF-65, 1st Floor, Okhala Industrial Area, Phase-I,New Delhi -110 020Phone +91-11-41406149-52, Fax No. 011-41709881E-mail : [email protected]
S No
Name and Description of main products / services NIC Code of the Product/service
% to total turnover of the company
1 Spinning, Weaving & Processing of manmade textile fabrics 2470 61.242 Cotton Spinning & weaving 2352 38.76
S No
Name & Address of the Company CIN/GLN Holding / Subsidiary / Associate
% of Shares Held
Applicable Section
1 LNJ Power Ventures Limited. 40-41, Community Centre, New Friends Colony, Bhilwara Bhawan, New Delhi-110025
U74899DL1995PLC065394 Associate 26 2(6)
2 Bhilwara Energy Limited40-41, Community Centre, New Friends Colony, Bhilwara Bhawan, New Delhi-110025
U31101DL2006PLC148862 Associate 17.78 2(6)
3 LNJ Skills & Rozgar Pvt. Ltd.40, Community Centre, New Friends Colony, Bhilwara Bhawan, New Delhi-110025
U74999DL2016PTC301465 Associate 40.66 2(6)
I. Registration and Other Details:
II. Principal Business Activities of The Company
III. Particulars of Holding, Subsidiary and Associate Companies
All the business activities contributing 10 % or more of the total turnover of the company shall be stated
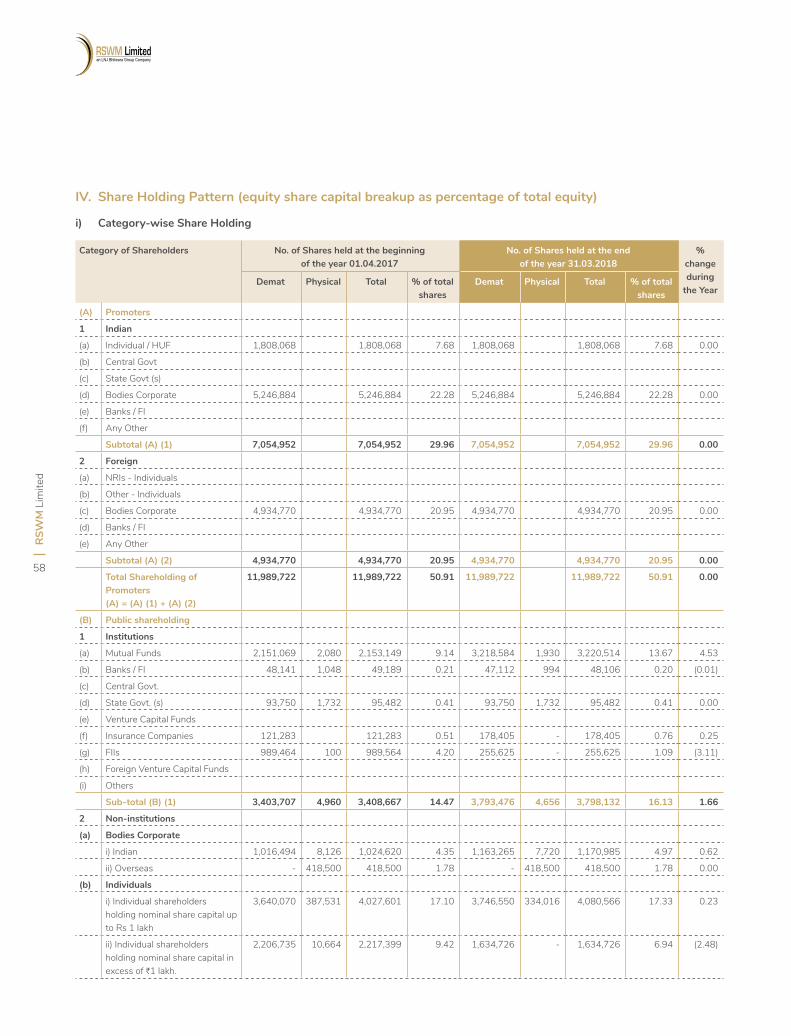
RSW
M L
imite
d
58
IV. Share Holding Pattern (equity share capital breakup as percentage of total equity)
i) Category-wise Share Holding
Category of Shareholders No. of Shares held at the beginning of the year 01.04.2017
No. of Shares held at the end of the year 31.03.2018
% change during
the YearDemat Physical Total % of total
sharesDemat Physical Total % of total
shares
(A) Promoters
1 Indian
(a) Individual / HUF 1,808,068 1,808,068 7.68 1,808,068 1,808,068 7.68 0.00
(b) Central Govt
(c) State Govt (s)
(d) Bodies Corporate 5,246,884 5,246,884 22.28 5,246,884 5,246,884 22.28 0.00
(e) Banks / FI
(f) Any Other
Subtotal (A) (1) 7,054,952 7,054,952 29.96 7,054,952 7,054,952 29.96 0.00
2 Foreign
(a) NRIs - Individuals
(b) Other - Individuals
(c) Bodies Corporate 4,934,770 4,934,770 20.95 4,934,770 4,934,770 20.95 0.00
(d) Banks / FI
(e) Any Other
Subtotal (A) (2) 4,934,770 4,934,770 20.95 4,934,770 4,934,770 20.95 0.00
Total Shareholding of Promoters (A) = (A) (1) + (A) (2)
11,989,722 11,989,722 50.91 11,989,722 11,989,722 50.91 0.00
(B) Public shareholding
1 Institutions
(a) Mutual Funds 2,151,069 2,080 2,153,149 9.14 3,218,584 1,930 3,220,514 13.67 4.53
(b) Banks / FI 48,141 1,048 49,189 0.21 47,112 994 48,106 0.20 (0.01)
(c) Central Govt.
(d) State Govt. (s) 93,750 1,732 95,482 0.41 93,750 1,732 95,482 0.41 0.00
(e) Venture Capital Funds
(f) Insurance Companies 121,283 121,283 0.51 178,405 - 178,405 0.76 0.25
(g) FIIs 989,464 100 989,564 4.20 255,625 - 255,625 1.09 (3.11)
(h) Foreign Venture Capital Funds
(i) Others
Sub-total (B) (1) 3,403,707 4,960 3,408,667 14.47 3,793,476 4,656 3,798,132 16.13 1.66
2 Non-institutions
(a) Bodies Corporate
i) Indian 1,016,494 8,126 1,024,620 4.35 1,163,265 7,720 1,170,985 4.97 0.62
ii) Overseas - 418,500 418,500 1.78 - 418,500 418,500 1.78 0.00
(b) Individuals
i) Individual shareholders holding nominal share capital up to Rs 1 lakh
3,640,070 387,531 4,027,601 17.10 3,746,550 334,016 4,080,566 17.33 0.23
ii) Individual shareholders holding nominal share capital in excess of H1 lakh.
2,206,735 10,664 2,217,399 9.42 1,634,726 - 1,634,726 6.94 (2.48)
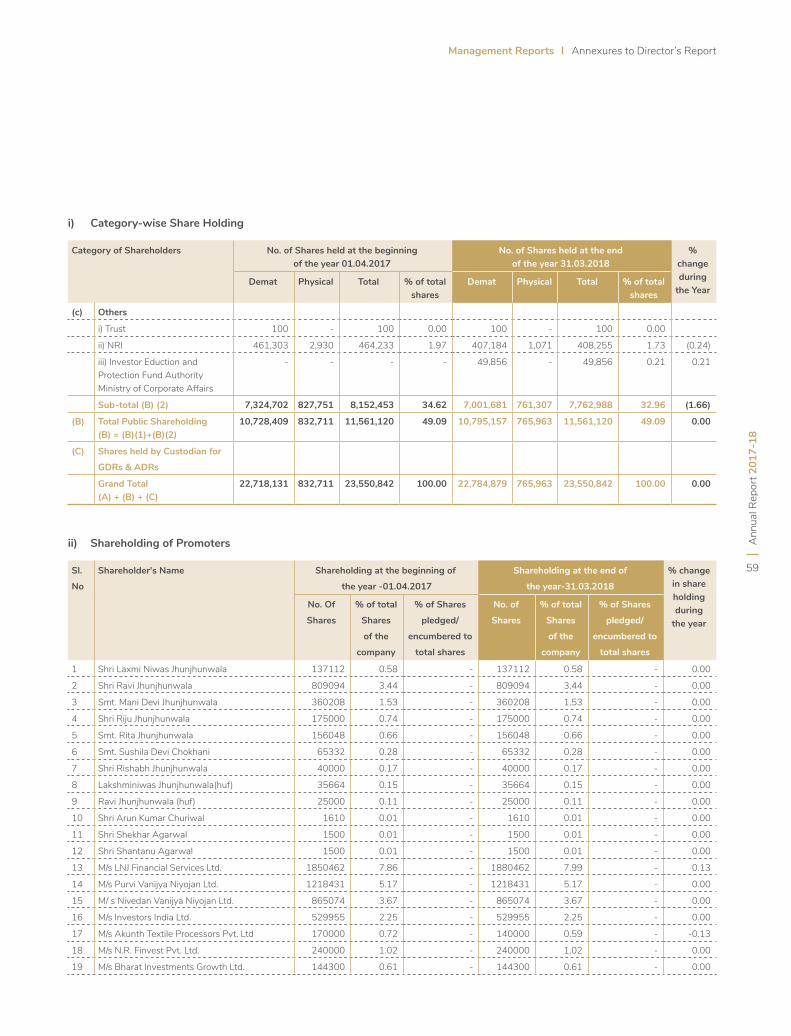
Ann
ual R
epor
t 201
7-18
59
Management Reports Annexures to Director’s Report
i) Category-wise Share Holding
ii) Shareholding of Promoters
Category of Shareholders No. of Shares held at the beginning of the year 01.04.2017
No. of Shares held at the end of the year 31.03.2018
% change during
the YearDemat Physical Total % of total
sharesDemat Physical Total % of total
shares
(c) Others
i) Trust 100 - 100 0.00 100 - 100 0.00
ii) NRI 461,303 2,930 464,233 1.97 407,184 1,071 408,255 1.73 (0.24)
iii) Investor Eduction and Protection Fund Authority Ministry of Corporate Affairs
- - - - 49,856 - 49,856 0.21 0.21
Sub-total (B) (2) 7,324,702 827,751 8,152,453 34.62 7,001,681 761,307 7,762,988 32.96 (1.66)
(B) Total Public Shareholding (B) = (B)(1)+(B)(2)
10,728,409 832,711 11,561,120 49.09 10,795,157 765,963 11,561,120 49.09 0.00
(C) Shares held by Custodian for
GDRs & ADRs
Grand Total (A) + (B) + (C)
22,718,131 832,711 23,550,842 100.00 22,784,879 765,963 23,550,842 100.00 0.00
Sl.
No
Shareholder's Name Shareholding at the beginning of
the year -01.04.2017
Shareholding at the end of
the year-31.03.2018
% change in share holding during
the year
No. Of
Shares
% of total
Shares
of the
company
% of Shares
pledged/
encumbered to
total shares
No. of
Shares
% of total
Shares
of the
company
% of Shares
pledged/
encumbered to
total shares
1 Shri Laxmi Niwas Jhunjhunwala 137112 0.58 - 137112 0.58 - 0.00
2 Shri Ravi Jhunjhunwala 809094 3.44 - 809094 3.44 - 0.00
3 Smt. Mani Devi Jhunjhunwala 360208 1.53 - 360208 1.53 - 0.00
4 Shri Riju Jhunjhunwala 175000 0.74 - 175000 0.74 - 0.00
5 Smt. Rita Jhunjhunwala 156048 0.66 - 156048 0.66 - 0.00
6 Smt. Sushila Devi Chokhani 65332 0.28 - 65332 0.28 - 0.00
7 Shri Rishabh Jhunjhunwala 40000 0.17 - 40000 0.17 - 0.00
8 Lakshminiwas Jhunjhunwala(huf) 35664 0.15 - 35664 0.15 - 0.00
9 Ravi Jhunjhunwala (huf) 25000 0.11 - 25000 0.11 - 0.00
10 Shri Arun Kumar Churiwal 1610 0.01 - 1610 0.01 - 0.00
11 Shri Shekhar Agarwal 1500 0.01 - 1500 0.01 - 0.00
12 Shri Shantanu Agarwal 1500 0.01 - 1500 0.01 - 0.00
13 M/s LNJ Financial Services Ltd. 1850462 7.86 - 1880462 7.99 - 0.13
14 M/s Purvi Vanijya Niyojan Ltd. 1218431 5.17 - 1218431 5.17 - 0.00
15 M/ s Nivedan Vanijya Niyojan Ltd. 865074 3.67 - 865074 3.67 - 0.00
16 M/s Investors India Ltd. 529955 2.25 - 529955 2.25 - 0.00
17 M/s Akunth Textile Processors Pvt. Ltd 170000 0.72 - 140000 0.59 - -0.13
18 M/s N.R. Finvest Pvt. Ltd. 240000 1.02 - 240000 1.02 - 0.00
19 M/s Bharat Investments Growth Ltd. 144300 0.61 - 144300 0.61 - 0.00
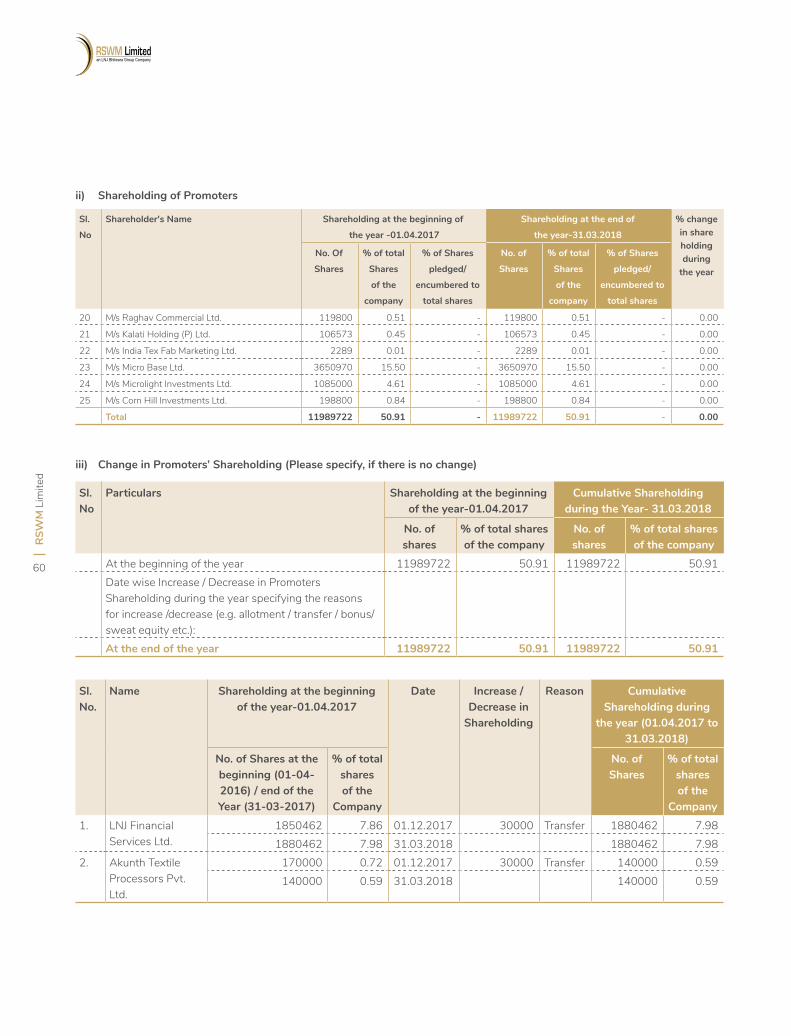
RSW
M L
imite
d
60
Sl.
No
Shareholder's Name Shareholding at the beginning of
the year -01.04.2017
Shareholding at the end of
the year-31.03.2018
% change in share holding during
the year
No. Of
Shares
% of total
Shares
of the
company
% of Shares
pledged/
encumbered to
total shares
No. of
Shares
% of total
Shares
of the
company
% of Shares
pledged/
encumbered to
total shares
20 M/s Raghav Commercial Ltd. 119800 0.51 - 119800 0.51 - 0.00
21 M/s Kalati Holding (P) Ltd. 106573 0.45 - 106573 0.45 - 0.00
22 M/s India Tex Fab Marketing Ltd. 2289 0.01 - 2289 0.01 - 0.00
23 M/s Micro Base Ltd. 3650970 15.50 - 3650970 15.50 - 0.00
24 M/s Microlight Investments Ltd. 1085000 4.61 - 1085000 4.61 - 0.00
25 M/s Corn Hill Investments Ltd. 198800 0.84 - 198800 0.84 - 0.00
Total 11989722 50.91 - 11989722 50.91 - 0.00
Sl. No
Particulars Shareholding at the beginningof the year-01.04.2017
Cumulative Shareholding during the Year- 31.03.2018
No. of shares
% of total shares of the company
No. of shares
% of total shares of the company
At the beginning of the year 11989722 50.91 11989722 50.91Date wise Increase / Decrease in Promoters Shareholding during the year specifying the reasons for increase /decrease (e.g. allotment / transfer / bonus/ sweat equity etc.):At the end of the year 11989722 50.91 11989722 50.91
Sl. No.
Name Shareholding at the beginningof the year-01.04.2017
Date Increase / Decrease in
Shareholding
Reason Cumulative Shareholding during
the year (01.04.2017 to 31.03.2018)
No. of Shares at the beginning (01-04-2016) / end of the Year (31-03-2017)
% of total shares of the
Company
No. of Shares
% of total shares of the
Company1. LNJ Financial
Services Ltd.1850462 7.86 01.12.2017 30000 Transfer 1880462 7.981880462 7.98 31.03.2018 1880462 7.98
2. Akunth Textile Processors Pvt. Ltd.
170000 0.72 01.12.2017 30000 Transfer 140000 0.59140000 0.59 31.03.2018 140000 0.59
ii) Shareholding of Promoters
iii) Change in Promoters’ Shareholding (Please specify, if there is no change)
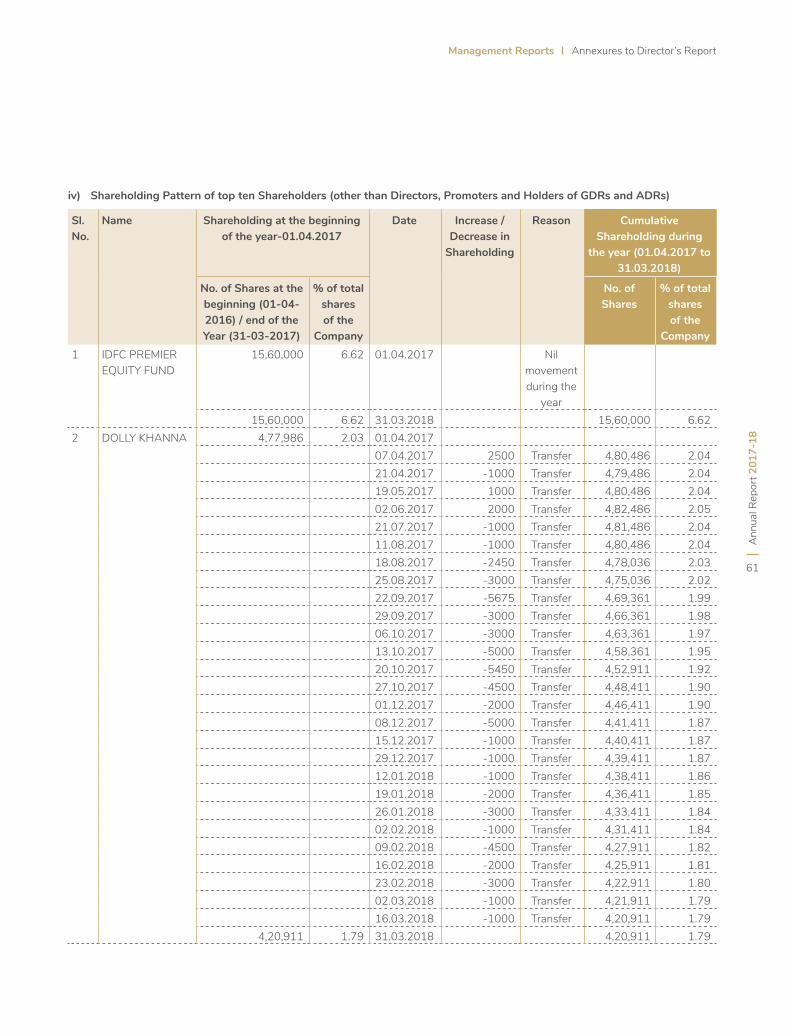
Ann
ual R
epor
t 201
7-18
61
Management Reports Annexures to Director’s Report
Sl. No.
Name Shareholding at the beginningof the year-01.04.2017
Date Increase / Decrease in
Shareholding
Reason Cumulative Shareholding during
the year (01.04.2017 to 31.03.2018)
No. of Shares at the beginning (01-04-2016) / end of the Year (31-03-2017)
% of total shares of the
Company
No. of Shares
% of total shares of the
Company1 IDFC PREMIER
EQUITY FUND 15,60,000 6.62 01.04.2017 Nil
movement during the
year
15,60,000 6.62 31.03.2018 15,60,000 6.62 2 DOLLY KHANNA 4,77,986 2.03 01.04.2017
07.04.2017 2500 Transfer 4,80,486 2.04 21.04.2017 -1000 Transfer 4,79,486 2.04 19.05.2017 1000 Transfer 4,80,486 2.04 02.06.2017 2000 Transfer 4,82,486 2.05 21.07.2017 -1000 Transfer 4,81,486 2.04 11.08.2017 -1000 Transfer 4,80,486 2.04 18.08.2017 -2450 Transfer 4,78,036 2.03 25.08.2017 -3000 Transfer 4,75,036 2.02
22.09.2017 -5675 Transfer 4,69,361 1.99 29.09.2017 -3000 Transfer 4,66,361 1.98 06.10.2017 -3000 Transfer 4,63,361 1.97 13.10.2017 -5000 Transfer 4,58,361 1.95 20.10.2017 -5450 Transfer 4,52,911 1.92
27.10.2017 -4500 Transfer 4,48,411 1.90 01.12.2017 -2000 Transfer 4,46,411 1.90 08.12.2017 -5000 Transfer 4,41,411 1.87 15.12.2017 -1000 Transfer 4,40,411 1.87 29.12.2017 -1000 Transfer 4,39,411 1.87 12.01.2018 -1000 Transfer 4,38,411 1.86 19.01.2018 -2000 Transfer 4,36,411 1.85 26.01.2018 -3000 Transfer 4,33,411 1.84
02.02.2018 -1000 Transfer 4,31,411 1.8409.02.2018 -4500 Transfer 4,27,911 1.8216.02.2018 -2000 Transfer 4,25,911 1.8123.02.2018 -3000 Transfer 4,22,911 1.8002.03.2018 -1000 Transfer 4,21,911 1.7916.03.2018 -1000 Transfer 4,20,911 1.79
4,20,911 1.79 31.03.2018 4,20,911 1.79
iv) Shareholding Pattern of top ten Shareholders (other than Directors, Promoters and Holders of GDRs and ADRs)
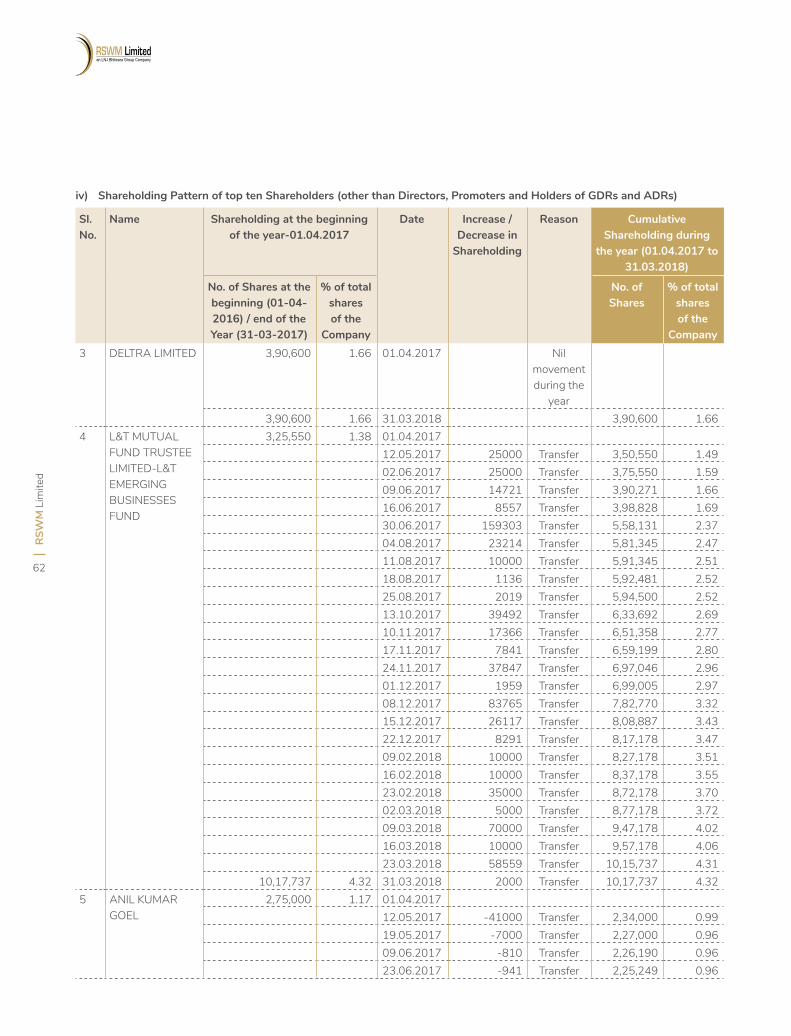
RSW
M L
imite
d
62
Sl. No.
Name Shareholding at the beginningof the year-01.04.2017
Date Increase / Decrease in
Shareholding
Reason Cumulative Shareholding during
the year (01.04.2017 to 31.03.2018)
No. of Shares at the beginning (01-04-2016) / end of the Year (31-03-2017)
% of total shares of the
Company
No. of Shares
% of total shares of the
Company3 DELTRA LIMITED 3,90,600 1.66 01.04.2017 Nil
movement during the
year
3,90,600 1.66 31.03.2018 3,90,600 1.66 4 L&T MUTUAL
FUND TRUSTEE LIMITED-L&T EMERGING BUSINESSES FUND
3,25,550 1.38 01.04.2017 12.05.2017 25000 Transfer 3,50,550 1.49 02.06.2017 25000 Transfer 3,75,550 1.59 09.06.2017 14721 Transfer 3,90,271 1.66 16.06.2017 8557 Transfer 3,98,828 1.69 30.06.2017 159303 Transfer 5,58,131 2.37 04.08.2017 23214 Transfer 5,81,345 2.47 11.08.2017 10000 Transfer 5,91,345 2.51 18.08.2017 1136 Transfer 5,92,481 2.52 25.08.2017 2019 Transfer 5,94,500 2.52
13.10.2017 39492 Transfer 6,33,692 2.6910.11.2017 17366 Transfer 6,51,358 2.7717.11.2017 7841 Transfer 6,59,199 2.8024.11.2017 37847 Transfer 6,97,046 2.9601.12.2017 1959 Transfer 6,99,005 2.9708.12.2017 83765 Transfer 7,82,770 3.3215.12.2017 26117 Transfer 8,08,887 3.4322.12.2017 8291 Transfer 8,17,178 3.4709.02.2018 10000 Transfer 8,27,178 3.5116.02.2018 10000 Transfer 8,37,178 3.5523.02.2018 35000 Transfer 8,72,178 3.7002.03.2018 5000 Transfer 8,77,178 3.7209.03.2018 70000 Transfer 9,47,178 4.0216.03.2018 10000 Transfer 9,57,178 4.0623.03.2018 58559 Transfer 10,15,737 4.31
10,17,737 4.32 31.03.2018 2000 Transfer 10,17,737 4.325 ANIL KUMAR
GOEL 2,75,000 1.17 01.04.2017
12.05.2017 -41000 Transfer 2,34,000 0.99 19.05.2017 -7000 Transfer 2,27,000 0.96
09.06.2017 -810 Transfer 2,26,190 0.9623.06.2017 -941 Transfer 2,25,249 0.96
iv) Shareholding Pattern of top ten Shareholders (other than Directors, Promoters and Holders of GDRs and ADRs)
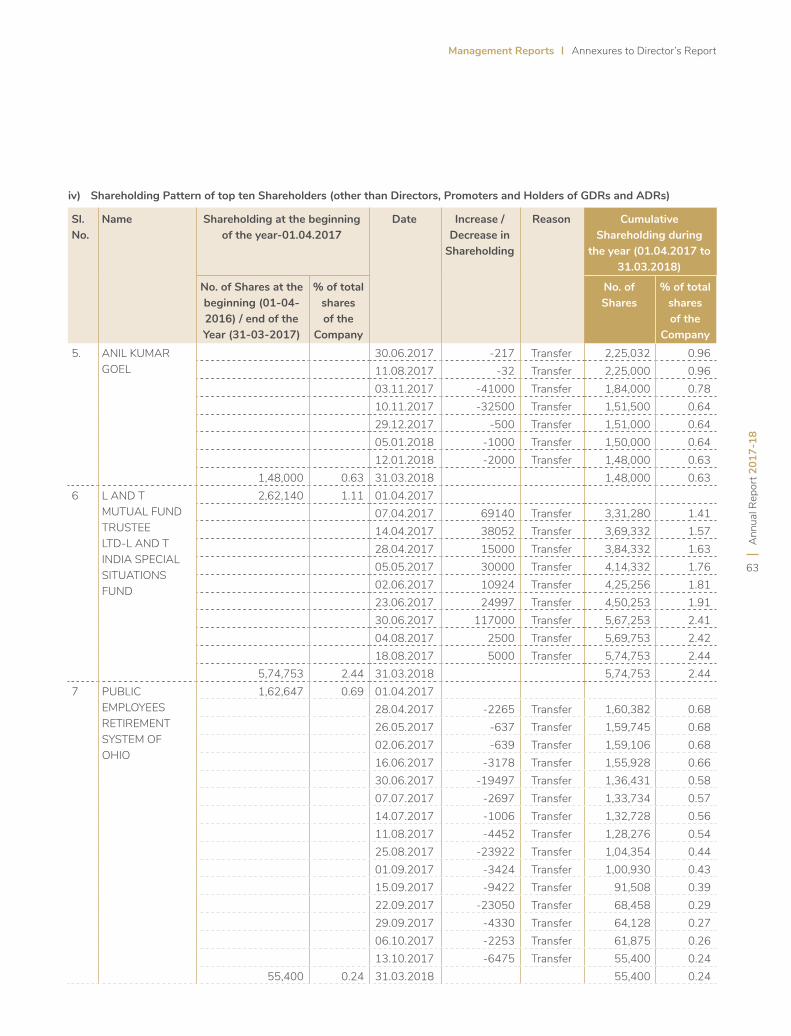
Ann
ual R
epor
t 201
7-18
63
Management Reports Annexures to Director’s Report
Sl. No.
Name Shareholding at the beginningof the year-01.04.2017
Date Increase / Decrease in
Shareholding
Reason Cumulative Shareholding during
the year (01.04.2017 to 31.03.2018)
No. of Shares at the beginning (01-04-2016) / end of the Year (31-03-2017)
% of total shares of the
Company
No. of Shares
% of total shares of the
Company5. ANIL KUMAR
GOEL30.06.2017 -217 Transfer 2,25,032 0.9611.08.2017 -32 Transfer 2,25,000 0.9603.11.2017 -41000 Transfer 1,84,000 0.7810.11.2017 -32500 Transfer 1,51,500 0.6429.12.2017 -500 Transfer 1,51,000 0.6405.01.2018 -1000 Transfer 1,50,000 0.6412.01.2018 -2000 Transfer 1,48,000 0.63
1,48,000 0.63 31.03.2018 1,48,000 0.636 L AND T
MUTUAL FUND TRUSTEE LTD-L AND T INDIA SPECIAL SITUATIONS FUND
2,62,140 1.11 01.04.2017 07.04.2017 69140 Transfer 3,31,280 1.41
14.04.2017 38052 Transfer 3,69,332 1.5728.04.2017 15000 Transfer 3,84,332 1.6305.05.2017 30000 Transfer 4,14,332 1.7602.06.2017 10924 Transfer 4,25,256 1.8123.06.2017 24997 Transfer 4,50,253 1.9130.06.2017 117000 Transfer 5,67,253 2.4104.08.2017 2500 Transfer 5,69,753 2.4218.08.2017 5000 Transfer 5,74,753 2.44
5,74,753 2.44 31.03.2018 5,74,753 2.447 PUBLIC
EMPLOYEES RETIREMENT SYSTEM OF OHIO
1,62,647 0.69 01.04.2017 28.04.2017 -2265 Transfer 1,60,382 0.68
26.05.2017 -637 Transfer 1,59,745 0.6802.06.2017 -639 Transfer 1,59,106 0.6816.06.2017 -3178 Transfer 1,55,928 0.6630.06.2017 -19497 Transfer 1,36,431 0.5807.07.2017 -2697 Transfer 1,33,734 0.5714.07.2017 -1006 Transfer 1,32,728 0.5611.08.2017 -4452 Transfer 1,28,276 0.5425.08.2017 -23922 Transfer 1,04,354 0.4401.09.2017 -3424 Transfer 1,00,930 0.4315.09.2017 -9422 Transfer 91,508 0.3922.09.2017 -23050 Transfer 68,458 0.2929.09.2017 -4330 Transfer 64,128 0.2706.10.2017 -2253 Transfer 61,875 0.2613.10.2017 -6475 Transfer 55,400 0.24
55,400 0.24 31.03.2018 55,400 0.24
iv) Shareholding Pattern of top ten Shareholders (other than Directors, Promoters and Holders of GDRs and ADRs)
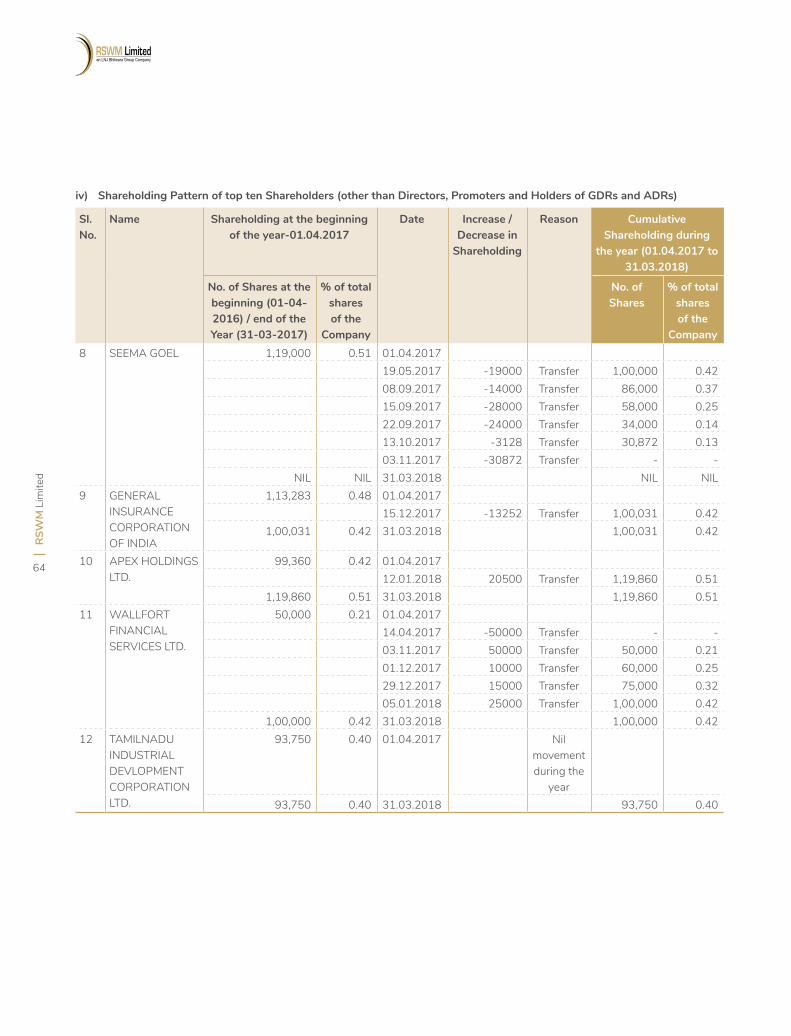
RSW
M L
imite
d
64
Sl. No.
Name Shareholding at the beginningof the year-01.04.2017
Date Increase / Decrease in
Shareholding
Reason Cumulative Shareholding during
the year (01.04.2017 to 31.03.2018)
No. of Shares at the beginning (01-04-2016) / end of the Year (31-03-2017)
% of total shares of the
Company
No. of Shares
% of total shares of the
Company8 SEEMA GOEL 1,19,000 0.51 01.04.2017
19.05.2017 -19000 Transfer 1,00,000 0.42 08.09.2017 -14000 Transfer 86,000 0.37
15.09.2017 -28000 Transfer 58,000 0.2522.09.2017 -24000 Transfer 34,000 0.1413.10.2017 -3128 Transfer 30,872 0.1303.11.2017 -30872 Transfer - -
NIL NIL 31.03.2018 NIL NIL 9 GENERAL
INSURANCE CORPORATION OF INDIA
1,13,283 0.48 01.04.201715.12.2017 -13252 Transfer 1,00,031 0.42
1,00,031 0.42 31.03.2018 1,00,031 0.42
10 APEX HOLDINGS LTD.
99,360 0.42 01.04.2017 12.01.2018 20500 Transfer 1,19,860 0.51
1,19,860 0.51 31.03.2018 1,19,860 0.51 11 WALLFORT
FINANCIAL SERVICES LTD.
50,000 0.21 01.04.2017 14.04.2017 -50000 Transfer - - 03.11.2017 50000 Transfer 50,000 0.21 01.12.2017 10000 Transfer 60,000 0.25 29.12.2017 15000 Transfer 75,000 0.32 05.01.2018 25000 Transfer 1,00,000 0.42
1,00,000 0.42 31.03.2018 1,00,000 0.42 12 TAMILNADU
INDUSTRIAL DEVLOPMENT CORPORATION LTD.
93,750 0.40 01.04.2017 Nil movement during the
year
93,750 0.40 31.03.2018 93,750 0.40
iv) Shareholding Pattern of top ten Shareholders (other than Directors, Promoters and Holders of GDRs and ADRs)
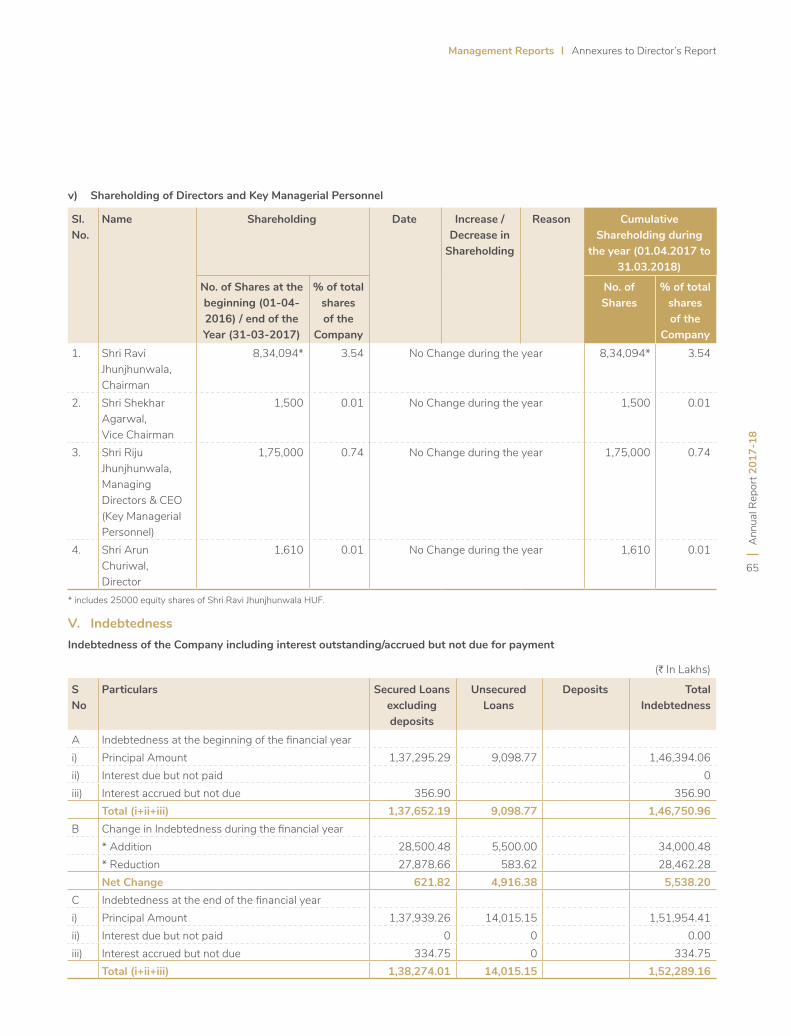
Ann
ual R
epor
t 201
7-18
65
Management Reports Annexures to Director’s Report
Sl. No.
Name Shareholding Date Increase / Decrease in
Shareholding
Reason Cumulative Shareholding during
the year (01.04.2017 to 31.03.2018)
No. of Shares at the beginning (01-04-2016) / end of the Year (31-03-2017)
% of total shares of the
Company
No. of Shares
% of total shares of the
Company1. Shri Ravi
Jhunjhunwala, Chairman
8,34,094* 3.54 No Change during the year 8,34,094* 3.54
2. Shri Shekhar Agarwal,Vice Chairman
1,500 0.01 No Change during the year 1,500 0.01
3. Shri Riju Jhunjhunwala, Managing Directors & CEO (Key Managerial Personnel)
1,75,000 0.74 No Change during the year 1,75,000 0.74
4. Shri Arun Churiwal,Director
1,610 0.01 No Change during the year 1,610 0.01
(H In Lakhs)
S No
Particulars Secured Loans excluding deposits
Unsecured Loans
Deposits Total Indebtedness
A Indebtedness at the beginning of the financial yeari) Principal Amount 1,37,295.29 9,098.77 1,46,394.06ii) Interest due but not paid 0iii) Interest accrued but not due 356.90 356.90
Total (i+ii+iii) 1,37,652.19 9,098.77 1,46,750.96B Change in Indebtedness during the financial year
* Addition 28,500.48 5,500.00 34,000.48* Reduction 27,878.66 583.62 28,462.28Net Change 621.82 4,916.38 5,538.20
C Indebtedness at the end of the financial year i) Principal Amount 1,37,939.26 14,015.15 1,51,954.41ii) Interest due but not paid 0 0 0.00iii) Interest accrued but not due 334.75 0 334.75
Total (i+ii+iii) 1,38,274.01 14,015.15 1,52,289.16
v) Shareholding of Directors and Key Managerial Personnel
V. IndebtednessIndebtedness of the Company including interest outstanding/accrued but not due for payment
* includes 25000 equity shares of Shri Ravi Jhunjhunwala HUF.
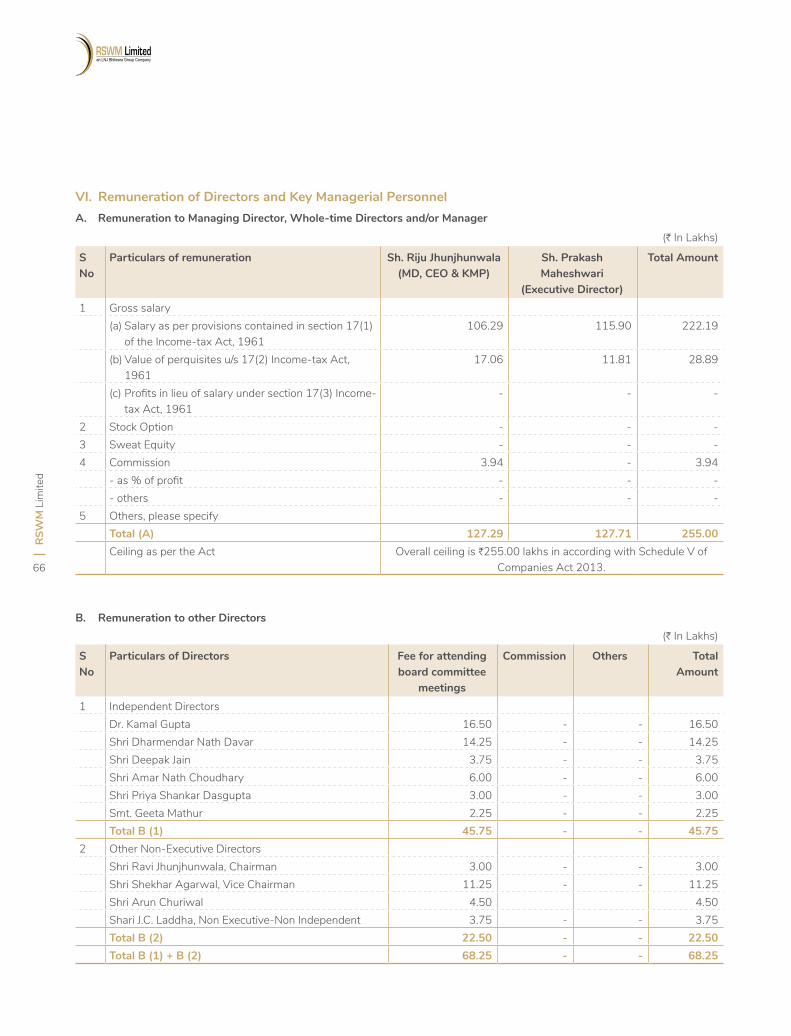
RSW
M L
imite
d
66
(H In Lakhs)
S No
Particulars of remuneration Sh. Riju Jhunjhunwala(MD, CEO & KMP)
Sh. Prakash Maheshwari
(Executive Director)
Total Amount
1 Gross salary (a) Salary as per provisions contained in section 17(1)
of the Income-tax Act, 1961106.29 115.90 222.19
(b) Value of perquisites u/s 17(2) Income-tax Act, 1961
17.06 11.81 28.89
(c) Profits in lieu of salary under section 17(3) Income- tax Act, 1961
- - -
2 Stock Option - - -3 Sweat Equity - - -4 Commission 3.94 - 3.94
- as % of profit - - -- others - - -
5 Others, please specifyTotal (A) 127.29 127.71 255.00Ceiling as per the Act Overall ceiling is H255.00 lakhs in according with Schedule V of
Companies Act 2013.
(H In Lakhs)
S No
Particulars of Directors Fee for attending board committee
meetings
Commission Others Total Amount
1 Independent DirectorsDr. Kamal Gupta 16.50 - - 16.50Shri Dharmendar Nath Davar 14.25 - - 14.25Shri Deepak Jain 3.75 - - 3.75Shri Amar Nath Choudhary 6.00 - - 6.00Shri Priya Shankar Dasgupta 3.00 - - 3.00Smt. Geeta Mathur 2.25 - - 2.25Total B (1) 45.75 - - 45.75
2 Other Non-Executive DirectorsShri Ravi Jhunjhunwala, Chairman 3.00 - - 3.00Shri Shekhar Agarwal, Vice Chairman 11.25 - - 11.25Shri Arun Churiwal 4.50 4.50Shari J.C. Laddha, Non Executive-Non Independent 3.75 - - 3.75Total B (2) 22.50 - - 22.50Total B (1) + B (2) 68.25 - - 68.25
VI. Remuneration of Directors and Key Managerial PersonnelA. Remuneration to Managing Director, Whole-time Directors and/or Manager
B. Remuneration to other Directors
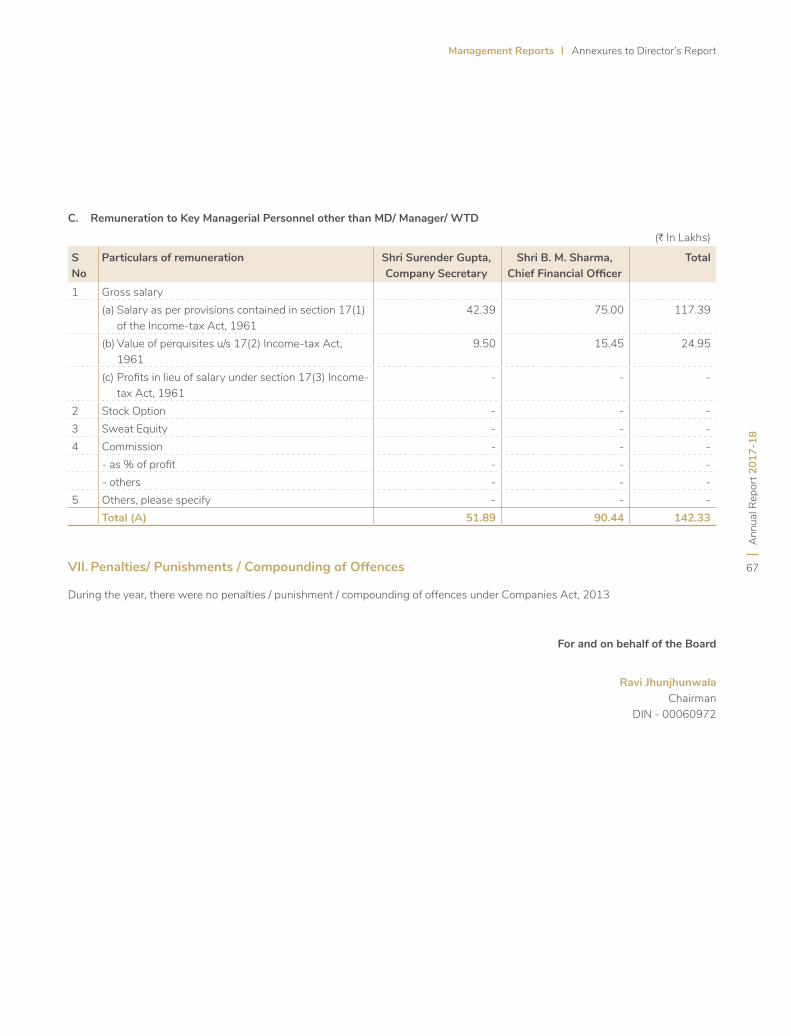
Ann
ual R
epor
t 201
7-18
67
Management Reports Annexures to Director’s Report
(H In Lakhs)
S No
Particulars of remuneration Shri Surender Gupta, Company Secretary
Shri B. M. Sharma, Chief Financial Officer
Total
1 Gross salary (a) Salary as per provisions contained in section 17(1)
of the Income-tax Act, 196142.39 75.00 117.39
(b) Value of perquisites u/s 17(2) Income-tax Act, 1961
9.50 15.45 24.95
(c) Profits in lieu of salary under section 17(3) Income- tax Act, 1961
- - -
2 Stock Option - - -3 Sweat Equity - - -4 Commission - - -
- as % of profit - - -- others - - -
5 Others, please specify - - -Total (A) 51.89 90.44 142.33
VII. Penalties/ Punishments / Compounding of Offences
During the year, there were no penalties / punishment / compounding of offences under Companies Act, 2013
For and on behalf of the Board
Ravi JhunjhunwalaChairman
DIN - 00060972
C. Remuneration to Key Managerial Personnel other than MD/ Manager/ WTD
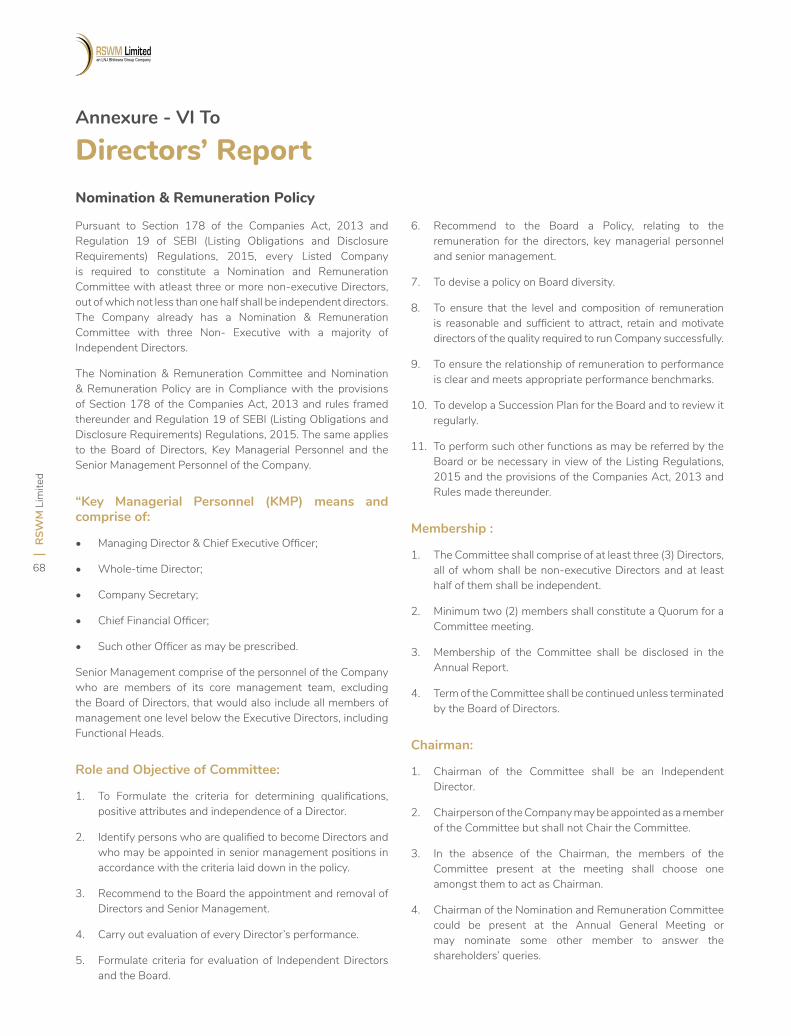
RSW
M L
imite
d
68
Annexure - VI To
Directors’ ReportNomination & Remuneration Policy
Pursuant to Section 178 of the Companies Act, 2013 and Regulation 19 of SEBI (Listing Obligations and Disclosure Requirements) Regulations, 2015, every Listed Company is required to constitute a Nomination and Remuneration Committee with atleast three or more non-executive Directors, out of which not less than one half shall be independent directors.The Company already has a Nomination & Remuneration Committee with three Non- Executive with a majority of Independent Directors.
The Nomination & Remuneration Committee and Nomination & Remuneration Policy are in Compliance with the provisions of Section 178 of the Companies Act, 2013 and rules framed thereunder and Regulation 19 of SEBI (Listing Obligations and Disclosure Requirements) Regulations, 2015. The same applies to the Board of Directors, Key Managerial Personnel and the Senior Management Personnel of the Company.
“Key Managerial Personnel (KMP) means and comprise of:
• Managing Director & Chief Executive Officer;
• Whole-time Director;
• Company Secretary;
• Chief Financial Officer;
• Such other Officer as may be prescribed.
Senior Management comprise of the personnel of the Company who are members of its core management team, excluding the Board of Directors, that would also include all members of management one level below the Executive Directors, including Functional Heads.
Role and Objective of Committee:
1. To Formulate the criteria for determining qualifications, positive attributes and independence of a Director.
2. Identify persons who are qualified to become Directors and who may be appointed in senior management positions in accordance with the criteria laid down in the policy.
3. Recommend to the Board the appointment and removal of Directors and Senior Management.
4. Carry out evaluation of every Director’s performance.
5. Formulate criteria for evaluation of Independent Directors and the Board.
6. Recommend to the Board a Policy, relating to the remuneration for the directors, key managerial personnel and senior management.
7. To devise a policy on Board diversity.
8. To ensure that the level and composition of remuneration is reasonable and sufficient to attract, retain and motivate directors of the quality required to run Company successfully.
9. To ensure the relationship of remuneration to performance is clear and meets appropriate performance benchmarks.
10. To develop a Succession Plan for the Board and to review it regularly.
11. To perform such other functions as may be referred by the Board or be necessary in view of the Listing Regulations, 2015 and the provisions of the Companies Act, 2013 and Rules made thereunder.
Membership :
1. The Committee shall comprise of at least three (3) Directors, all of whom shall be non-executive Directors and at least half of them shall be independent.
2. Minimum two (2) members shall constitute a Quorum for a Committee meeting.
3. Membership of the Committee shall be disclosed in the Annual Report.
4. Term of the Committee shall be continued unless terminated by the Board of Directors.
Chairman:
1. Chairman of the Committee shall be an Independent Director.
2. Chairperson of the Company may be appointed as a member of the Committee but shall not Chair the Committee.
3. In the absence of the Chairman, the members of the Committee present at the meeting shall choose one amongst them to act as Chairman.
4. Chairman of the Nomination and Remuneration Committee could be present at the Annual General Meeting or may nominate some other member to answer the shareholders’ queries.
Ann
ual R
epor
t 201
7-18
69
Management Reports Annexures to Director’s Report
Frequency of Meetings:
The meetings of the Committee shall be held at such regular intervals as may be required.
Committee Members’ Interests:
1. A member of the Committee is not entitled to be present when his or her own remuneration is discussed at a meeting or when his or her performance is being evaluated.
2. The Committee may invite such executives, as it considers appropriate, to be present at the meetings of the Committee.
Voting:
1. Matters arising for determination at Committee meetings shall be decided by a majority of votes of Members present and voting and any such decision shall, for all purposes, be deemed to be a decision of the Committee.
2. In the case of equality of votes, the Chairman of the meeting will have a casting vote.
Appointment of Directors/KMP/Senior Officials:
While recommending a candidate for appointment, the Committee shall have regard to:
• Assessing the appointee against a range of criteria which includes but is not limited to qualifications, skills, experience, background and other qualities required to operate successfully;
• The experience and knowledge that the appointee brings to the role of KMP/Senior Officials, which, in turn, will enhance the skill sets and experience of the Board as a whole;
• The nature of existing positions held by the appointee including directorship and such other relationships and the impact of the same on the Company’s welfare.
Letter of Appointment:
Each Independent Director is required to sign the duplicate copy of the letter of appointment issued by the Company, which contains the terms and conditions of his/her appointment.
Policy on Board Diversity:
The Nomination and Remuneration Committee shall ensure that the Board of Directors have the combination of Directors from
different areas/fields or as may be considered appropriate in the best interests of the Company. The Board shall have atleast one Board member who has accounting/financial management expertise.
Remuneration of Directors, Key Managerial Personnel and Senior Management:
The salaries of Directors, Key Management Personnel and other senior officials shall be based and determined on the individual person’s responsibilities and performance and in accordance with the limits as prescribed statutorily, if any.
1. Fixed Pay :
The Key Management Personnel (KMP) and Senior Management shall be eligible for a monthly remuneration as may be approved by the Board on the recommendation of the Committee in accordance with the statutory provisions of the Companies Act, 2013, and the rules made thereunder for the time being in force. The salary paid need to be competitive and reflective of the individual’s role, responsibility and experience in relation to performance of day-to-day activities to be usually reviewed on an annual basis.
2. Minimum Remuneration :
If, in any financial year, the Company has no profits or its profits are inadequate, the Company shall pay remuneration to its Managerial Personnel in accordance with the provisions of Schedule V of the Companies Act, 2013 and if it is not able to comply with such provisions, with the prior approval of the concerned authorities.
3. Provision for excess remuneration :
If any Managerial Personnel draws or receives, directly or indirectly by way of remuneration any such sums in excess of the limits prescribed under the Companies Act, 2013 or without the prior sanction of the concerned authorities, where required, he/she shall refund such sums to the Company and until such sum is refunded, hold it in trust for the Company. The Company shall not waive recovery of such sum refundable to it, unless permitted by the concerned authorities.
4. Increment :
Increments to the existing remuneration/compensation structure may be recommended by the Committee to the Board, which should be within the slabs approved by the Shareholders in the case of Managerial Person.
RSW
M L
imite
d
70
Remuneration to Non-Executive/Independent Director:
1. Remuneration/Commission:
The remuneration/commission shall be in accordance with the statutory provisions of the Companies Act, 2013, and the Rules made thereunder for the time being in force.
2. Sitting Fees:
The Non- Executive/Independent Director may receive remuneration by way of fees for attending meetings of Board or Committee(s) thereof. Provided that the amount of such fees shall not exceed the maximum amount as provided in the Companies Act, 2013, per meeting of the Board or Committee or such amount as may be prescribed by the Central Government from time to time.
Other Provisions:
• Section 197(1) of the Companies Act, 2013 provides that the total managerial remuneration payable by the Company to its Directors including Managing Director and Whole Time Director, and its Manager in respect of any financial year shall not exceed eleven percent of the net profits of the Company computed in the manner laid down in Section 198 in the manner as prescribed under the Act.
• The Company, with the approval of the Shareholders and Central Government, may authorise the payment of remuneration exceeding eleven percent of the net profits of the company, subject to the provisions of Schedule V.
• The Company may, with the approval of the shareholders, authorise the payment of remuneration upto five percent of the net profits of the Company to any one of its Managing Director/Whole Time Director/Manager and ten percent in case of more than one such official in accordance with the provisions of the Companies Act, 2013.
• The Company may pay remuneration to its Directors, other than Managing Director and Whole Time Director upto one percent of the net profits of the Company, if there is a Managing Director or Whole Time Director or Manager and three percent of the net profits in any other case.
• The Independent Directors shall not be entitled to any Stock Option.
Evaluation/Assessment of Directors/KMPs/Senior Officials of the Company
The evaluation/assessment of the Directors, KMPs and the senior officials of the Company is to be conducted on an annual basis and to satisfy the requirements of the Listing Regulation, 2015.
The following criteria may assist in determining how effective the performance of the Directors/KMPs/Senior officials has been:
• Leadership & stewardship abilities
• Assess policies, structures & procedures
• Regular monitoring of corporate results against projections
• Contributing to clearly define corporate objectives & plans
• Obtain adequate, relevant & timely information.
• Review achievement of strategic and operational plans, objectives, budgets
• Identify, monitor & mitigate significant corporate risks
• Directly monitor & evaluate KMPs, senior officials
• Review management’s Succession Plan
• Effective meetings
• Clearly defining role & monitoring activities of Committees
• Review of ethical conduct
Evaluation following the aforesaid parameters, will be conducted by the Independent Directors for each of the Executive/Non-Independent Directors in a separate meeting of the Independent Directors.
The Executive/Non-Independent Directors along with the Independent Directors will evaluate/assess each of the Independent Directors’ relative to the aforesaid parameters. Only the Independent Director being evaluated, will not participate in the said evaluation discussion.
Deviations From this Policy:
Deviations from elements of this policy, when deemed necessary in the interests of the Company, will be made if there are specific reasons to do so in an individual case.
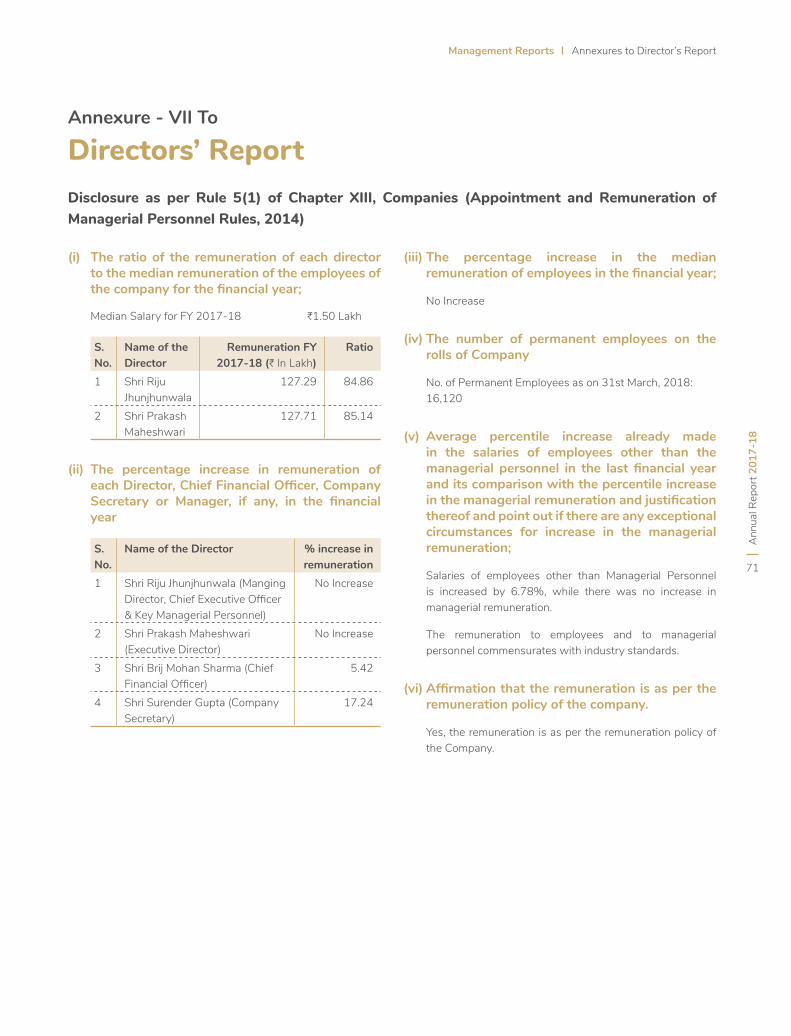
Ann
ual R
epor
t 201
7-18
71
Management Reports Annexures to Director’s Report
(i) The ratio of the remuneration of each director to the median remuneration of the employees of the company for the financial year;
Median Salary for FY 2017-18 H1.50 Lakh
S. No.
Name of the Director
Remuneration FY 2017-18 (H In Lakh)
Ratio
1 Shri Riju Jhunjhunwala
127.29 84.86
2 Shri Prakash Maheshwari
127.71 85.14
(ii) The percentage increase in remuneration of each Director, Chief Financial Officer, Company Secretary or Manager, if any, in the financial year
S. No.
Name of the Director % increase in remuneration
1 Shri Riju Jhunjhunwala (Manging Director, Chief Executive Officer & Key Managerial Personnel)
No Increase
2 Shri Prakash Maheshwari (Executive Director)
No Increase
3 Shri Brij Mohan Sharma (Chief Financial Officer)
5.42
4 Shri Surender Gupta (Company Secretary)
17.24
(iii) The percentage increase in the median remuneration of employees in the financial year;
No Increase
(iv) The number of permanent employees on the rolls of Company
No. of Permanent Employees as on 31st March, 2018: 16,120
(v) Average percentile increase already made in the salaries of employees other than the managerial personnel in the last financial year and its comparison with the percentile increase in the managerial remuneration and justification thereof and point out if there are any exceptional circumstances for increase in the managerial remuneration;
Salaries of employees other than Managerial Personnel is increased by 6.78%, while there was no increase in managerial remuneration.
The remuneration to employees and to managerial personnel commensurates with industry standards.
(vi) Affirmation that the remuneration is as per the remuneration policy of the company.
Yes, the remuneration is as per the remuneration policy of the Company.
Annexure - VII To
Directors’ ReportDisclosure as per Rule 5(1) of Chapter XIII, Companies (Appointment and Remuneration of Managerial Personnel Rules, 2014)
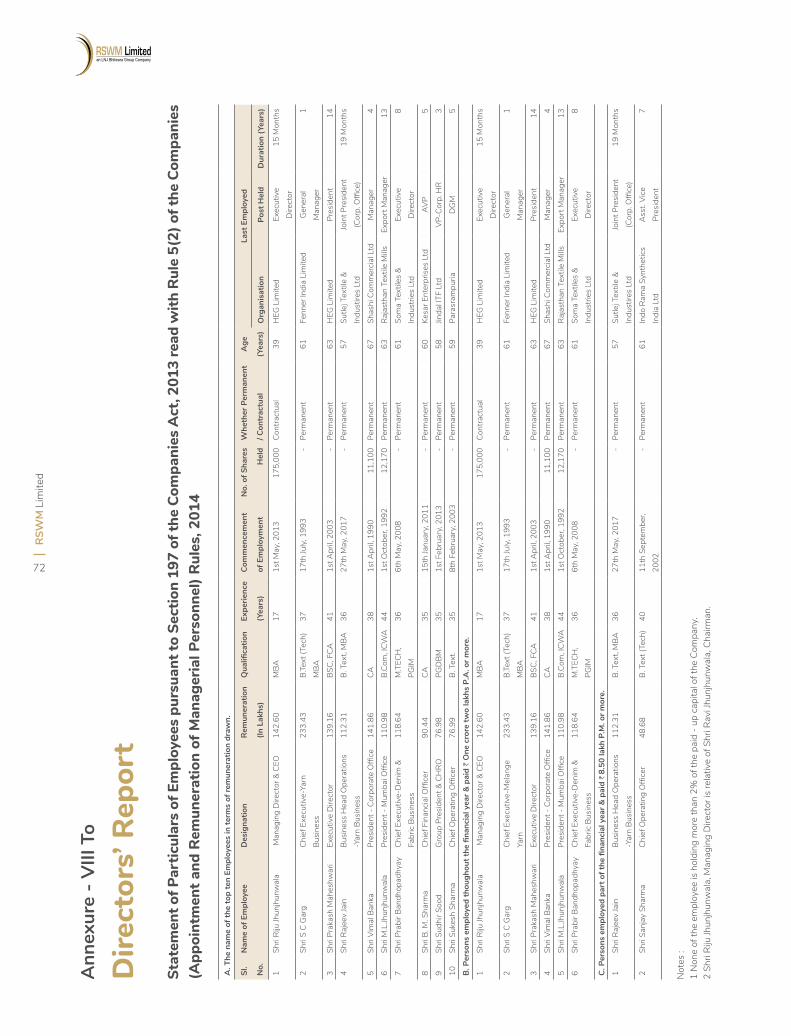
RSW
M L
imite
d
72
Ann
exur
e -
VIII
To
Dire
ctor
s’ R
epor
tSt
atem
ent o
f Par
ticul
ars
of E
mpl
oyee
s pu
rsua
nt to
Sec
tion
197
of th
e Co
mpa
nies
Act
, 201
3 re
ad w
ith R
ule
5(2)
of t
he C
ompa
nies
(A
ppoi
ntm
ent a
nd R
emun
erat
ion
of M
anag
eria
l Per
sonn
el) R
ules
, 201
4
Not
es :
1 N
one
of th
e em
ploy
ee is
hol
ding
mor
e th
an 2
% o
f the
pai
d - u
p ca
pita
l of t
he C
ompa
ny.
2 Sh
ri R
iju Jh
unjh
unw
ala,
Man
agin
g D
irect
or is
rela
tive
of S
hri R
avi J
hunj
hunw
ala,
Cha
irman
.
A. T
he n
ame
of th
e to
p te
n Em
ploy
ees
in te
rms
of re
mun
erat
ion
draw
n.
Sl.
No.
Nam
e of
Em
ploy
eeD
esig
natio
nR
emun
erat
ion
(In L
akhs
)
Qua
lifica
tion
Expe
rienc
e
(Yea
rs)
Com
men
cem
ent
of E
mpl
oym
ent
No.
of S
hare
s
Hel
d
Whe
ther
Per
man
ent
/ Con
trac
tual
Age
(Yea
rs)
Last
Em
ploy
ed
Org
anis
atio
nPo
st H
eld
Dur
atio
n (Y
ears
)
1Sh
ri R
iju Jh
unjh
unw
ala
Man
agin
g D
irect
or &
CEO
142.
60M
BA17
1st M
ay, 2
013
175,
000
Cont
ract
ual
39H
EG L
imite
dEx
ecut
ive
Dire
ctor
15 M
onth
s
2Sh
ri S
C G
arg
Chie
f Exe
cutiv
e-Ya
rn
Busi
ness
23
3.43
B.Te
xt (T
ech)
M
BA37
17th
July
, 199
3-
Perm
anen
t61
Fenn
er In
dia
Lim
ited
Gen
eral
M
anag
er1
3Sh
ri Pr
akas
h M
ahes
hwar
iEx
ecut
ive
Dire
ctor
139.
16BS
C, F
CA41
1st A
pril,
2003
-Pe
rman
ent
63H
EG L
imite
dPr
esid
ent
14
4Sh
ri R
ajee
v Ja
inBu
sine
ss H
ead
Ope
ratio
ns
-Yar
n Bu
sine
ss11
2.31
B. T
ext,
MBA
3627
th M
ay, 2
017
-Pe
rman
ent
57Su
tlej T
extil
e &
Indu
stire
s Lt
dJo
int P
resi
dent
(C
orp.
Offi
ce)
19 M
onth
s
5Sh
ri V
imal
Ban
kaPr
esid
ent -
Cor
pora
te O
ffice
141.
86CA
381s
t Apr
il, 19
9011
,100
Perm
anen
t67
Shas
hi C
omm
erci
al L
tdM
anag
er4
6Sh
ri M
.L.Jh
unjh
unw
ala
Pres
iden
t - M
umba
i Offi
ce11
0.98
B.Co
m, I
CWA
441s
t Oct
ober
, 199
212
,170
Perm
anen
t63
Raj
asth
an T
extil
e M
illsEx
port
Man
ager
13
7Sh
ri Pr
abir
Band
hopa
dhya
yCh
ief E
xecu
tive-
Den
im &
Fa
bric
Bus
ines
s11
8.64
M.T
ECH
, PG
IM36
6th
May
, 200
8-
Perm
anen
t61
Som
a Te
xtile
s &
Indu
strie
s Lt
dEx
ecut
ive
Dire
ctor
8
8Sh
ri B.
M. S
harm
aCh
ief F
inan
cial
Offi
cer
90.4
4CA
3515
th Ja
nuar
y, 2
011
-Pe
rman
ent
60Ke
sar E
nter
pris
es L
tdAV
P5
9Sh
ri Su
dhir
Sood
Gro
up P
resi
dent
& C
HRO
76.9
8PG
DBM
351s
t Feb
ruar
y, 2
013
-Pe
rman
ent
58Jin
dal I
TF L
tdV
P-Co
rp. H
R3
10Sh
ri Su
kesh
Sha
rma
Chie
f Ope
ratin
g O
ffice
r76
.99
B. T
ext.
358t
h Fe
brua
ry, 2
003
-Pe
rman
ent
59Pa
rasr
ampu
riaD
GM
5
B. P
erso
ns e
mpl
oyed
thou
ghou
t the
fina
ncia
l yea
r & p
aid
H O
ne c
rore
two
lakh
s P.
A. o
r mor
e.
1Sh
ri R
iju Jh
unjh
unw
ala
Man
agin
g D
irect
or &
CEO
142.
60M
BA17
1st M
ay, 2
013
175,
000
Cont
ract
ual
39H
EG L
imite
dEx
ecut
ive
Dire
ctor
15 M
onth
s
2Sh
ri S
C G
arg
Chie
f Exe
cutiv
e-M
elan
ge
Yarn
23
3.43
B.Te
xt (T
ech)
M
BA37
17th
July
, 199
3-
Perm
anen
t61
Fenn
er In
dia
Lim
ited
Gen
eral
M
anag
er1
3Sh
ri Pr
akas
h M
ahes
hwar
iEx
ecut
ive
Dire
ctor
139.
16BS
C, F
CA41
1st A
pril,
2003
-Pe
rman
ent
63H
EG L
imite
dPr
esid
ent
14
4Sh
ri V
imal
Ban
kaPr
esid
ent -
Cor
pora
te O
ffice
141.
86CA
381s
t Apr
il, 19
9011
,100
Perm
anen
t67
Shas
hi C
omm
erci
al L
tdM
anag
er4
5Sh
ri M
.L.Jh
unjh
unw
ala
Pres
iden
t - M
umba
i Offi
ce11
0.98
B.Co
m, I
CWA
441s
t Oct
ober
, 199
212
,170
Perm
anen
t63
Raj
asth
an T
extil
e M
illsEx
port
Man
ager
13
6Sh
ri Pr
abir
Band
hopa
dhya
yCh
ief E
xecu
tive-
Den
im &
Fa
bric
Bus
ines
s11
8.64
M.T
ECH
, PG
IM36
6th
May
, 200
8-
Perm
anen
t61
Som
a Te
xtile
s &
Indu
strie
s Lt
dEx
ecut
ive
Dire
ctor
8
C. P
erso
ns e
mpl
oyed
par
t of t
he fi
nanc
ial y
ear &
pai
d H
8.5
0 la
kh P
.M. o
r mor
e.
1Sh
ri R
ajee
v Ja
inBu
sine
ss H
ead
Ope
ratio
ns
-Yar
n Bu
sine
ss11
2.31
B. T
ext,
MBA
3627
th M
ay, 2
017
-Pe
rman
ent
57Su
tlej T
extil
e &
Indu
stire
s Lt
dJo
int P
resi
dent
(C
orp.
Offi
ce)
19 M
onth
s
2Sh
ri Sa
njay
Sha
rma
Chie
f Ope
ratin
g O
ffice
r 48
.68
B. T
ext (
Tech
)40
11th
Sep
tem
ber,
2002
-Pe
rman
ent
61In
do R
ama
Synt
hetic
s In
dia
Ltd
Ass
t. V
ice
Pres
iden
t7
Ann
ual R
epor
t 201
7-18
73
Management Reports Annexures to Director’s Report
Annexure - IX To
Directors’ ReportFORM NO. MR-3
Secretarial Audit ReportFor The Financial Year Ended 31St March, 2018
[Pursuant to section 204(1) of the Companies Act, 2013 and rule No.9 of the Companies (Appointment and Remuneration of Managerial Personnel) Rules, 2014]
To,The Members,RSWM LIMITEDCIN:L17115RJ1960PLC008216Kharigram, P.O. Gulabpura, Distt. Bhilwara, Rajasthan -311021
We have conducted the secretarial audit of the compliance of applicable statutory provisions and the adherence to good corporate practices by RSWM LIMITED (hereinafter called the Company). Secretarial Audit was conducted in a manner that provided us a reasonable basis for evaluating the corporate conducts/statutory compliances and expressing our opinion thereon.
Based on our verification of the Company’s books, papers, minute books, forms and returns filed and other records maintained by the Company and also the information provided by the Company, its officers, agents and authorized representatives during the conduct of secretarial audit, we hereby report that in our opinion, the Company has, during the audit period covering the financial year ended on 31st March, 2018 complied with the statutory provisions listed hereunder and also that the Company has proper Board-processes and compliance-mechanism in place to the extent, in the manner and subject to the reporting made hereinafter:
We have examined the books, papers, minute books, forms and returns filed and other records maintained by the Company for the financial year ended on 31st March, 2018 according to the provisions of:
(i) The Companies Act, 2013 (the Act) and the rules made thereunder;
(ii) The Securities Contracts (Regulation) Act, 1956 (‘SCRA’) and the rules made thereunder;
(iii) The Depositories Act, 1996 and the Regulations and Bye-laws framed thereunder;
(iv) Foreign Exchange Management Act, 1999 and the rules and regulations made thereunder to the extent of Foreign Direct Investment, Overseas Direct Investment and External Commercial Borrowings;
(v) The following Regulations and Guidelines prescribed under the Securities and Exchange Board of India Act, 1992 (‘SEBI Act’):-
a) The Securities and Exchange Board of India (Substantial Acquisition of Shares and Takeovers) Regulations, 2011.
b) The Securities and Exchange Board of India (Prohibition of Insider Trading) Regulations, 2015
c) The Securities and Exchange Board of India (Issue of Capital and Disclosure Requirements) Regulations, 2009 – Not Applicable as the Company did not issue any securities during the financial year under review.
d) The Securities and Exchange Board of India (Share Based Employee Benefits) Regulations, 2014 - Not Applicable as the Company has not granted any Options to its employees during the financial year under review.
e) The Securities and Exchange Board of India (Issue and Listing of Debt Securities) Regulations, 2008 – Not applicable as the Company has not issued any debt securities during the financial year under review.
f) The Securities and Exchange Board of India (Registrars to an Issue and Share Transfer Agents) Regulations, 1993 regarding the Companies Act and dealing with client- Not Applicable as the Company is not registered as Registrars to an Issue and Share Transfer Agents during the financial year under review.
g) The Securities and Exchange Board of India (Delisting of Equity Shares) Regulations, 2009- Not Applicable as the Company has not got delisted its equity shares from any stock exchange during the financial year under review.
RSW
M L
imite
d
74
h) The Securities and Exchange Board of India (Buyback of Securities) Regulations, 1998- Not Applicable as the Company has not bought back any of its securities during the financial year under review.
vi) The management has identified and informed the following laws as being specifically applicable to the company:
1. Textile Committee Act, 1963
2. Cotton Textile Order,1986
3. Textile ( Development and Regulation) order, 2001 under Bureau of Indian Standard Act, 1986
We have also examined compliance with the applicable clauses of the following:
(i) Secretarial Standards issued by The Institute of Company Secretaries of India
(ii) The Listing Agreement entered into by the Company with National Stock Exchange of India Limited and BSE Limited and SEBI (Listing Obligations and Disclosure Requirements) Regulations, 2015
During the period under review the Company has complied with the provisions of the Act, Rules, Regulations, Guidelines, Standards etc. mentioned above subject to the following observation:
The Company was required to spend H252 Lakhs on identified CSR activities as mentioned in Schedule VII, pursuant to Section 135(5) of the Companies Act, 2013. Out of above stated amount, Company spent H222.79 lakhs during the year.
We further report that:
The Board of Directors of the Company is duly constituted with proper balance of Executive Directors, Non-Executive Directors and Independent Directors. The changes in the composition of the Board of Directors that took place during the period under review were carried out in compliance with the provisions of the Act.
Adequate notice is given to all Directors to schedule the Board Meetings, agenda and detailed notes on agenda are sent at least seven days in advance, and a system exists for seeking and
obtaining further information and clarifications on the agenda items before the meeting and for meaningful participation at the meeting.
All decisions at Board Meeting and Committee meetings are carried out unanimously and the views of dissenting members, if any, are captured and recorded as part of the minutes of Board of Directors or Committees of the Board, as the case may be.
We further report that based on the compliance mechanism established by the Company and on the basis of the Certificates issued by the Managing Director & CEO and CFO were taken on record by the Board of Directors at their meeting(s), we are of the opinion that the management has adequate systems and processes in the Company commensurate with the size and operations of the Company to monitor and ensure compliance with applicable laws, rules, regulations and guidelines.
We further report that during the audit period;
1. Pursuant to Section 180(1) (a) of the Companies Act, 2013, the Company has obtained approval of the members by way of special resolution for creation of mortgage(s) and charge(s) in addition to the existing mortgages, charges and hypothecations created by the Company.
2. Pursuant to Section 180(1) (a) of the Companies Act, 2013, the Company has obtained approval of the members by way of special resolution for creation of mortgage(s) and charges on such terms and conditions as may be decided by the Board up to an aggregate amount H2000 crore.
Place: Delhi For Mahesh Gupta and CompanyDate: 10th May, 2018 Company Secretaries
Mahesh Kumar Gupta Prop. FCS No.: 2870 C P No.: 1999
This report is to be read with our letter of even date which is annexed as ‘Annexure –A” and forms an integral part of this report.
Ann
ual R
epor
t 201
7-18
75
Management Reports Annexures to Director’s Report
To,The Members,RSWM LIMITEDCIN:L17115RJ1960PLC008216Kharigram, P.O. Gulabpura, Distt. Bhilwara, Rajasthan -311021
Our report of even date is to be read along with this letter.
1) Maintenance of Secretarial records is the responsibility of the management of the Company. Our responsibility is to express an opinion on these Secretarial records based on our audit.
2) We have followed the audit practices and processes as were appropriate to obtain reasonable assurance about the correctness of the contents of the Secretarial records. The verifications were done on test basis to ensure that correct facts are reflected in Secretarial records. We believe that the processes and practices, we followed provide a reasonable basis for our opinion.
3) We have not verified the correctness and appropriateness of financial records and Books of Accounts of the Company.
4) The compliance of the provisions of Corporate and other applicable laws, rules, regulations and standards is the responsibility of the management. Our examination was limited to the verification of procedures on test basis.
5) Wherever required, we have obtained the management’s representation about the compliance of laws, rules and regulations and happening of events etc.
6) The Secretarial Audit report is neither an assurance as to the future viability of the Company nor of the efficiency or effectiveness with which the management has conducted the affairs of the Company.
Place: Delhi For Mahesh Gupta and CompanyDate: 10th May, 2018 Company Secretaries
Mahesh Kumar Gupta Prop. FCS No.: 2870 C P No.: 1999
RSW
M L
imite
d
76
Corporate Governance Report
aligned with the Company’s best interests. It is committed to the goal of sustainably elevating the Company’s value creation.
The Company has a balanced mix of Executive and Non-Executive Directors as on 31st March, 2018. The Board comprised of Twelve Directors including two Executive Directors, ten Non-Executive Directors, of which six are Independent Directors. Shri Riju Jhunjhunwala, Managing Director and CEO and Shri Prakash Maheshwari, Executive Director conducted the day to day management of the Company subject to the supervision and control of the Board of Directors. During the year, Smt. Archana Capoor was appointed as an Additional Independent Director on the Board with effect from 13th February, 2018. The proposal for regularization of Smt. Archana Capoor as an Independent Director will be placed in ensuing Annual General Meeting.
Number of Board Meetings
During 2017-18, the Board of RSWM met five times on — 12th May, 2017, 8th August, 2017, 30th August, 2017, 7th November, 2017 and 13th February, 2018. The maximum time gap between any two consecutive meetings was less than four months. The frequency of the meetings are enough for the Board to undertake its duties effectively and the outstanding items of previous meetings were followed up and taken up in the next meeting.
The Company in consultation with all the Directors of the Company prepared a tentative calendar for the next meetings of the Board/Committee to ensure the presence of all the Directors in the meetings. The inputs for the Agenda items are taken well in advance so as to cover all the relevant items and information and same are sent well in advance to all the Directors of the Company so as to enable the Directors to become aware of all the facts on timely basis.
Directors’ Attendance Record and Directorship Held
Sl. No.
Name of Director Position Category No. of meetings
held in 2017-18 during
tenure
No. of meetings attended
No. of outside Director-ships
of public companies*
No. of Membership (s) / Chairmanship (s) of Board Committees in
other Companies as on 31.03.2018 #
1. Shri Ravi Jhunjhunwala
Chairman Promoter - Non-Executive
5 4 8 5 (including 1 as Chairman)
2. Shri Shekhar Agarwal
Vice Chairman
Promoter - Non–Executive
5 5 4 3
3. Shri Riju Jhunjhunwala
Managing Director
Promoter - Executive
5 5 6 3 (including 1 as Chairman)
Corporate Governance Philosophy
The Company has a strong legacy of fair, transparent and ethical governance practices. The Company’s goal is to find creative and productive ways of enchanting its stakeholders i.e. investors, customers & associates, while fulfilling the role of a responsible corporate representative committed to the best practices. This approach to value creation emanates from our belief that sound governance system, based on relationship and trust, is integral to create enduring value for all.
The Company’s Corporate Governance policies ensures, among others, the accountability of the Board of Directors and the importance of its decisions to all its participants viz. employees, investors, customers, regulators etc. The Company believes that good Corporate Governance is a continuous process and strives to improve the Corporate Governance practices to meet stakeholders’ expectations.
This chapter, along with the chapters on Management Discussion and Analysis and Additional Shareholder Information, Company’s Reports comply with the SEBI (Listing Obligations and Disclosure Requirements) Regulations, 2015.
Board of Directors
Composition
The composition of the Board represents a fine blend of professionals from various backgrounds which enables the Board to discharge its responsibilities more efficiently and provide effective leadership. At RSWM, it is our belief that an enlightened Board consciously creates a culture of leadership to provide a long-term vision and policy approach to improve the quality of governance. The Board’s actions and decisions are
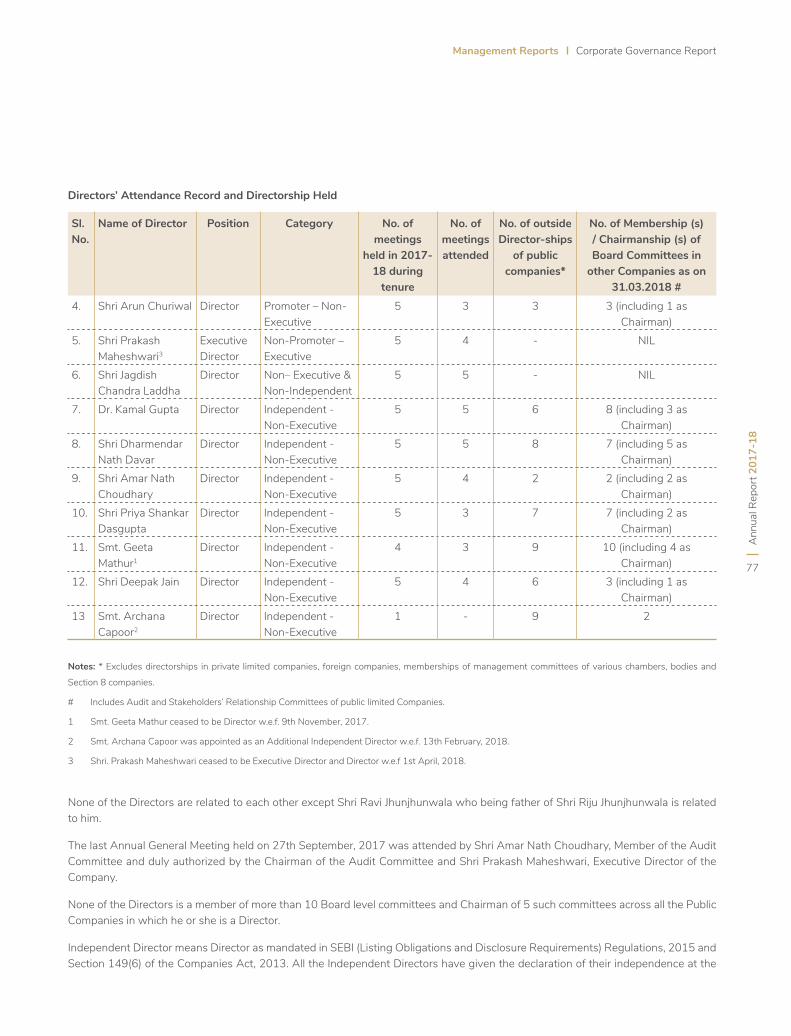
Ann
ual R
epor
t 201
7-18
77
Management Reports Corporate Governance Report
Notes: * Excludes directorships in private limited companies, foreign companies, memberships of management committees of various chambers, bodies and
Section 8 companies.
# Includes Audit and Stakeholders’ Relationship Committees of public limited Companies.
1 Smt. Geeta Mathur ceased to be Director w.e.f. 9th November, 2017.
2 Smt. Archana Capoor was appointed as an Additional Independent Director w.e.f. 13th February, 2018.
3 Shri. Prakash Maheshwari ceased to be Executive Director and Director w.e.f 1st April, 2018.
None of the Directors are related to each other except Shri Ravi Jhunjhunwala who being father of Shri Riju Jhunjhunwala is related to him.
The last Annual General Meeting held on 27th September, 2017 was attended by Shri Amar Nath Choudhary, Member of the Audit Committee and duly authorized by the Chairman of the Audit Committee and Shri Prakash Maheshwari, Executive Director of the Company.
None of the Directors is a member of more than 10 Board level committees and Chairman of 5 such committees across all the Public Companies in which he or she is a Director.
Independent Director means Director as mandated in SEBI (Listing Obligations and Disclosure Requirements) Regulations, 2015 and Section 149(6) of the Companies Act, 2013. All the Independent Directors have given the declaration of their independence at the
Directors’ Attendance Record and Directorship Held
Sl. No.
Name of Director Position Category No. of meetings
held in 2017-18 during
tenure
No. of meetings attended
No. of outside Director-ships
of public companies*
No. of Membership (s) / Chairmanship (s) of Board Committees in
other Companies as on 31.03.2018 #
4. Shri Arun Churiwal Director Promoter – Non-Executive
5 3 3 3 (including 1 as Chairman)
5. Shri Prakash Maheshwari3
Executive Director
Non-Promoter – Executive
5 4 - NIL
6. Shri Jagdish Chandra Laddha
Director Non– Executive & Non-Independent
5 5 - NIL
7. Dr. Kamal Gupta Director Independent - Non-Executive
5 5 6 8 (including 3 as Chairman)
8. Shri Dharmendar Nath Davar
Director Independent - Non-Executive
5 5 8 7 (including 5 as Chairman)
9. Shri Amar Nath Choudhary
Director Independent - Non-Executive
5 4 2 2 (including 2 as Chairman)
10. Shri Priya Shankar Dasgupta
Director Independent - Non-Executive
5 3 7 7 (including 2 as Chairman)
11. Smt. Geeta Mathur1
Director Independent - Non-Executive
4 3 9 10 (including 4 as Chairman)
12. Shri Deepak Jain Director Independent - Non-Executive
5 4 6 3 (including 1 as Chairman)
13 Smt. Archana Capoor2
Director Independent - Non-Executive
1 - 9 2
RSW
M L
imite
d
78
beginning of the financial year or at the time of their co-option on the Board.
Familiarization Programme for Independent Directors
During the year, the Independent Directors from time to time were apprised with the overview of the business operations and business model of the Company. Independent Directors were provided with certain documents which helped them understand the nature of industry. The presentation was made by Managing Director giving an overview of Annual Operating Plans and budgets of the Company. The presentations were also made by the external experts on developments in the industry. All Independent Directors met periodically with other Key Managerial Personnel, functional heads of the units, head of HR, IT department etc to help them understand the impediments in their functioning and any guidance needed by them for effective and smooth functioning as well as to gauge the service and product management, risk management and other areas related to the Company.
The details on the Company’s Familiarization Programme for Independent Directors can be accessed at: http://www.rswm.in/investors/familiarization-programme/
Information Supplied to the Board
The Board has complete access to all information about the Company. The following information is regularly provided to the Board:
• Annual operating plans and budgets and any update thereof.
• Capital budgets and any updates thereof.
• Quarterly results for the Company and its operating divisions and business segments.
• Minutes of the meetings of the Audit Committee and other Committees of the Board.
• Information on recruitment and remuneration of senior officers just below the level of the Board, including the appointment or removal of Chief Financial Officer and Company Secretary.
• Show cause, demand, prosecution notices and penalty notices which are materially important.
• Fatal or serious accidents, dangerous occurrences, any material effluent or pollution problems.
• Any material default in financial obligations by the Company, or substantial non-payment for goods sold by the Company.
• Any issue, which involves possible public or product liability claims of substantial nature, including any judgment or order which, may have passed strictures regarding the conduct of the Company or taken an adverse view regarding another enterprise that can have negative implications on the Company.
• Details of any joint venture or collaboration agreement.
• Transactions that involve substantial payment towards goodwill, brand equity or intellectual property.
• Significant labour problems and their proposed solutions. Any significant development in Human Resources/Industrial Relations front like signing of wage agreement, implementation of Voluntary Retirement Scheme etc.
• Sale of material nature of investments, subsidiaries, assets, which is not in the normal course of business.
• Quarterly details of foreign exchange exposures and the steps taken by the management to limit the risks of adverse exchange rate movements, if material.
• Non-compliance of any regulatory, statutory or listing requirements and shareholders’ services such as non-payment of dividend, delay in share transfer etc.
• Quarterly compliance reports and investors’ grievances reports.
The Board is presented with detailed notes on these matters, as part of the agenda papers of the meeting or directly tabled at the Board meetings, as and when required.
The Board reviews the declaration made by the Management regarding compliance with applicable laws on quarterly basis as well as steps taken by the Company to rectify instances of non-compliances, if any.
Directors with Materially Significant Pecuniary Relationship or Business Transaction with the Company
All Executive Directors receive salaries, allowances, perquisites and commission, while all Non-Executive Directors are paid sitting fees for attending the Board meetings as well as Committee meetings. There have been no materially significant pecuniary relationships or transactions between the Company and its Directors in the financial year under review.
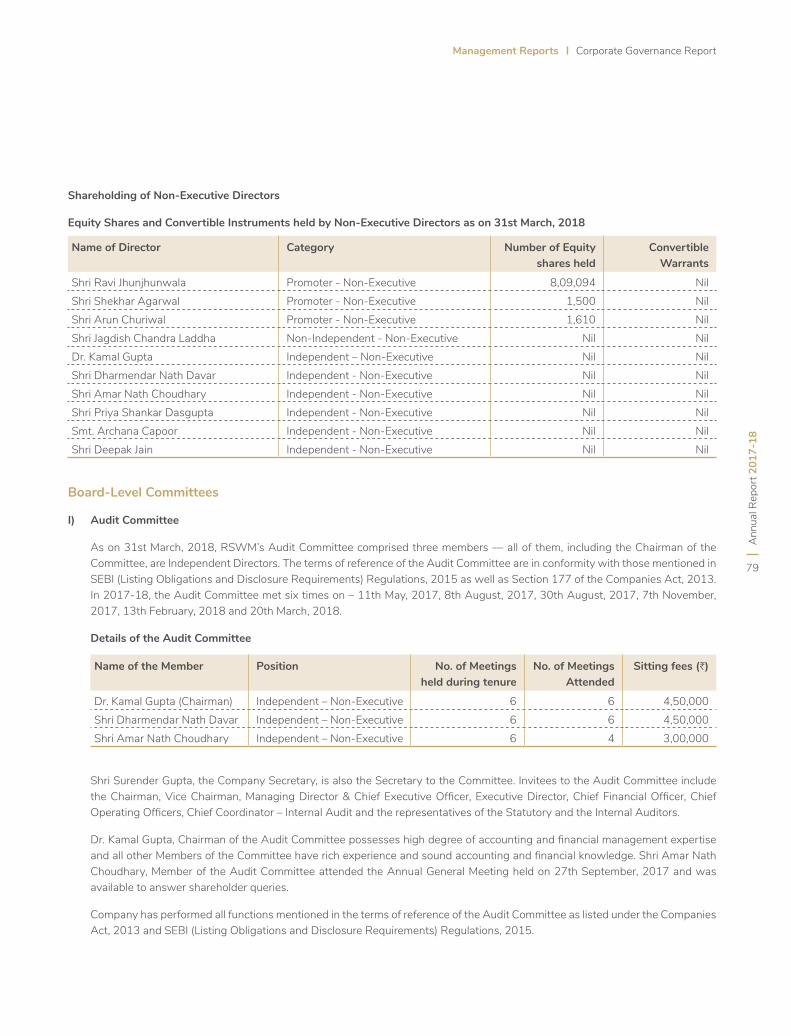
Ann
ual R
epor
t 201
7-18
79
Management Reports Corporate Governance Report
Shareholding of Non-Executive Directors
Equity Shares and Convertible Instruments held by Non-Executive Directors as on 31st March, 2018
Board-Level Committees
I) Audit Committee
As on 31st March, 2018, RSWM’s Audit Committee comprised three members — all of them, including the Chairman of the Committee, are Independent Directors. The terms of reference of the Audit Committee are in conformity with those mentioned in SEBI (Listing Obligations and Disclosure Requirements) Regulations, 2015 as well as Section 177 of the Companies Act, 2013. In 2017-18, the Audit Committee met six times on – 11th May, 2017, 8th August, 2017, 30th August, 2017, 7th November, 2017, 13th February, 2018 and 20th March, 2018.
Details of the Audit Committee
Shri Surender Gupta, the Company Secretary, is also the Secretary to the Committee. Invitees to the Audit Committee include the Chairman, Vice Chairman, Managing Director & Chief Executive Officer, Executive Director, Chief Financial Officer, Chief Operating Officers, Chief Coordinator – Internal Audit and the representatives of the Statutory and the Internal Auditors.
Dr. Kamal Gupta, Chairman of the Audit Committee possesses high degree of accounting and financial management expertise and all other Members of the Committee have rich experience and sound accounting and financial knowledge. Shri Amar Nath Choudhary, Member of the Audit Committee attended the Annual General Meeting held on 27th September, 2017 and was available to answer shareholder queries.
Company has performed all functions mentioned in the terms of reference of the Audit Committee as listed under the Companies Act, 2013 and SEBI (Listing Obligations and Disclosure Requirements) Regulations, 2015.
Name of Director Category Number of Equity shares held
Convertible Warrants
Shri Ravi Jhunjhunwala Promoter - Non-Executive 8,09,094 NilShri Shekhar Agarwal Promoter - Non-Executive 1,500 NilShri Arun Churiwal Promoter - Non-Executive 1,610 NilShri Jagdish Chandra Laddha Non-Independent - Non-Executive Nil NilDr. Kamal Gupta Independent – Non-Executive Nil NilShri Dharmendar Nath Davar Independent - Non-Executive Nil NilShri Amar Nath Choudhary Independent - Non-Executive Nil NilShri Priya Shankar Dasgupta Independent - Non-Executive Nil NilSmt. Archana Capoor Independent - Non-Executive Nil NilShri Deepak Jain Independent - Non-Executive Nil Nil
Name of the Member Position No. of Meetings held during tenure
No. of Meetings Attended
Sitting fees (H)
Dr. Kamal Gupta (Chairman) Independent – Non-Executive 6 6 4,50,000Shri Dharmendar Nath Davar Independent – Non-Executive 6 6 4,50,000Shri Amar Nath Choudhary Independent – Non-Executive 6 4 3,00,000
RSW
M L
imite
d
80
RSWM has systems and procedures in place to ensure that the Audit Committee mandatorily reviews:
• Management Discussion and Analysis of the financial condition and results of operations of the Company.
• Statement of significant related party transactions (as defined by the Audit Committee), submitted by the management.
• Internal audit reports relating to internal control weaknesses.
• Review of the appointment, removal and terms of remuneration of the Chief Internal Auditor.
• Review of various policies of the Company.
• Review with the management, the quarterly financial statements before submission to the Board.
• The uses/applications of funds raised through public issues, rights issues, preferential issues by major category (capital expenditure, sales and marketing, working capital among others), as part of the quarterly declaration of financial results whenever applicable.
• Statement certified by the Statutory Auditors, on an annual basis detailing the use of funds raised through public issues, rights issues, preferential issues for purposes other than those stated in the offer document/prospectus/notice, if applicable.
The Audit Committee is empowered to:
• Investigate any activity within its terms of reference and to seek any information it requires from any employee.
• Obtain legal or other independent professional advice and to secure the attendance of outsiders with relevant experience and expertise, when considered necessary.
Internal Financial Control and its adequacy.
A company’s Internal Financial Control identifies opportunities for improvement and draws up recommendations and good practices that can be used as a benchmark to develop or strengthen their internal control systems and enhance the reliability of their financial statements. The Company has laid down policies
and procedures for ensuring the orderly and efficient conduct of its business including safeguarding of assets, prevention and detection of frauds and errors, the accuracy and completeness of the accounting records and timely preparation and disclosure of financial information.
Pursuant to Section 148 of the Companies Act, 2013 read with the Companies (Cost Records and Audit) Rules, 2014, M/s. N.D. Birla & Co., Cost Accountants, were appointed as Cost Auditor for conducting the cost audit of the Company for the financial year ended 31st March, 2018. Their Report in respect of the financial year 2017-18 shall be filed with the Government on or before the due date.
II) Nomination and Remuneration Committee
a) Terms of Reference
The terms of reference of Nomination and Remuneration Committee are in line with the provisions as contained in Section 178 of the Companies Act, 2013 and Regulation 19 of SEBI (Listing Obligations and Disclosure Requirements) Regulations, 2015, which included the following:-
• Identify persons who are qualified to become Directors and who may be appointed in senior management in accordance with the criteria and recommend to the Board their approval and removal.
• Carry out the evaluation of directors performance.
• Formulate the criteria for determining qualification, positive attributes and independence of a director.
• Recommend to the Board a policy relating to the remuneration for the directors, KMP and other Employees.
• Carry out such other functions as are required or appropriate in discharging their duties.
• Devising a policy on diversity of Board of Directors.
• To determine whether to extend or continue the term of appointment of Independent Director on the basis of the report of performance evaluation of Independent Directors.
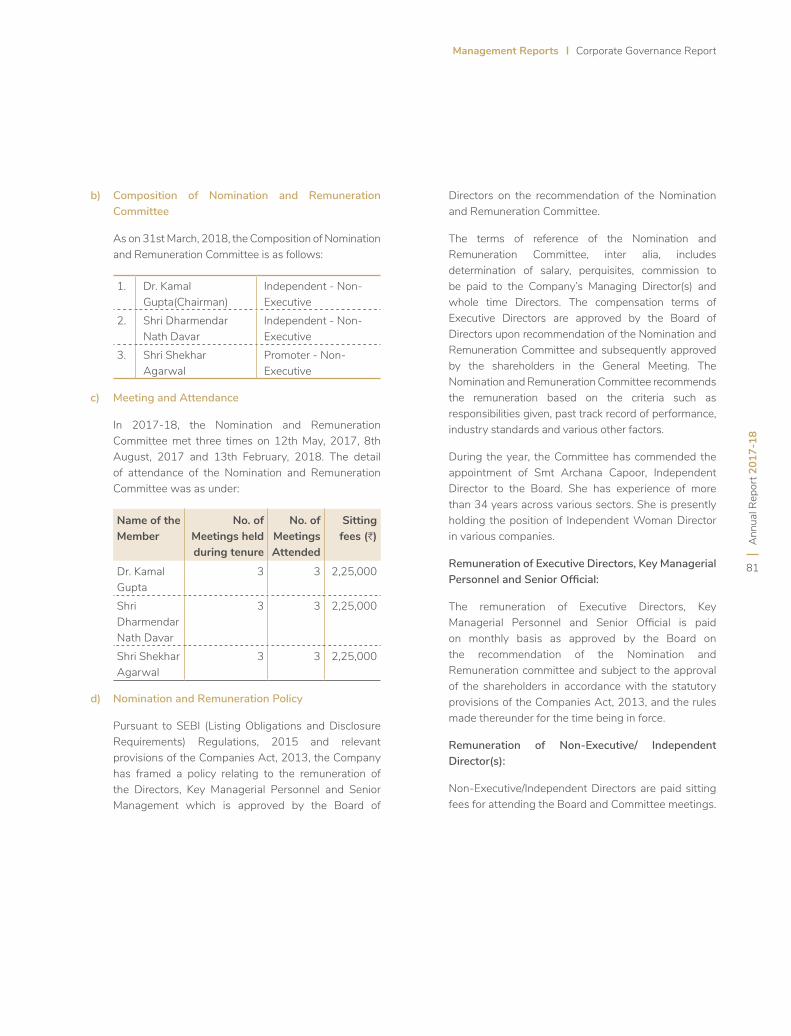
Ann
ual R
epor
t 201
7-18
81
Management Reports Corporate Governance Report
b) Composition of Nomination and Remuneration Committee
As on 31st March, 2018, the Composition of Nomination and Remuneration Committee is as follows:
1. Dr. Kamal Gupta(Chairman)
Independent - Non-Executive
2. Shri Dharmendar Nath Davar
Independent - Non-Executive
3. Shri Shekhar Agarwal
Promoter - Non-Executive
c) Meeting and Attendance
In 2017-18, the Nomination and Remuneration Committee met three times on 12th May, 2017, 8th August, 2017 and 13th February, 2018. The detail of attendance of the Nomination and Remuneration Committee was as under:
Name of the Member
No. of Meetings held during tenure
No. of Meetings Attended
Sitting fees (H)
Dr. Kamal Gupta
3 3 2,25,000
Shri Dharmendar Nath Davar
3 3 2,25,000
Shri Shekhar Agarwal
3 3 2,25,000
d) Nomination and Remuneration Policy
Pursuant to SEBI (Listing Obligations and Disclosure Requirements) Regulations, 2015 and relevant provisions of the Companies Act, 2013, the Company has framed a policy relating to the remuneration of the Directors, Key Managerial Personnel and Senior Management which is approved by the Board of
Directors on the recommendation of the Nomination and Remuneration Committee.
The terms of reference of the Nomination and Remuneration Committee, inter alia, includes determination of salary, perquisites, commission to be paid to the Company’s Managing Director(s) and whole time Directors. The compensation terms of Executive Directors are approved by the Board of Directors upon recommendation of the Nomination and Remuneration Committee and subsequently approved by the shareholders in the General Meeting. The Nomination and Remuneration Committee recommends the remuneration based on the criteria such as responsibilities given, past track record of performance, industry standards and various other factors.
During the year, the Committee has commended the appointment of Smt Archana Capoor, Independent Director to the Board. She has experience of more than 34 years across various sectors. She is presently holding the position of Independent Woman Director in various companies.
Remuneration of Executive Directors, Key Managerial Personnel and Senior Official:
The remuneration of Executive Directors, Key Managerial Personnel and Senior Official is paid on monthly basis as approved by the Board on the recommendation of the Nomination and Remuneration committee and subject to the approval of the shareholders in accordance with the statutory provisions of the Companies Act, 2013, and the rules made thereunder for the time being in force.
Remuneration of Non-Executive/ Independent Director(s):
Non-Executive/Independent Directors are paid sitting fees for attending the Board and Committee meetings.
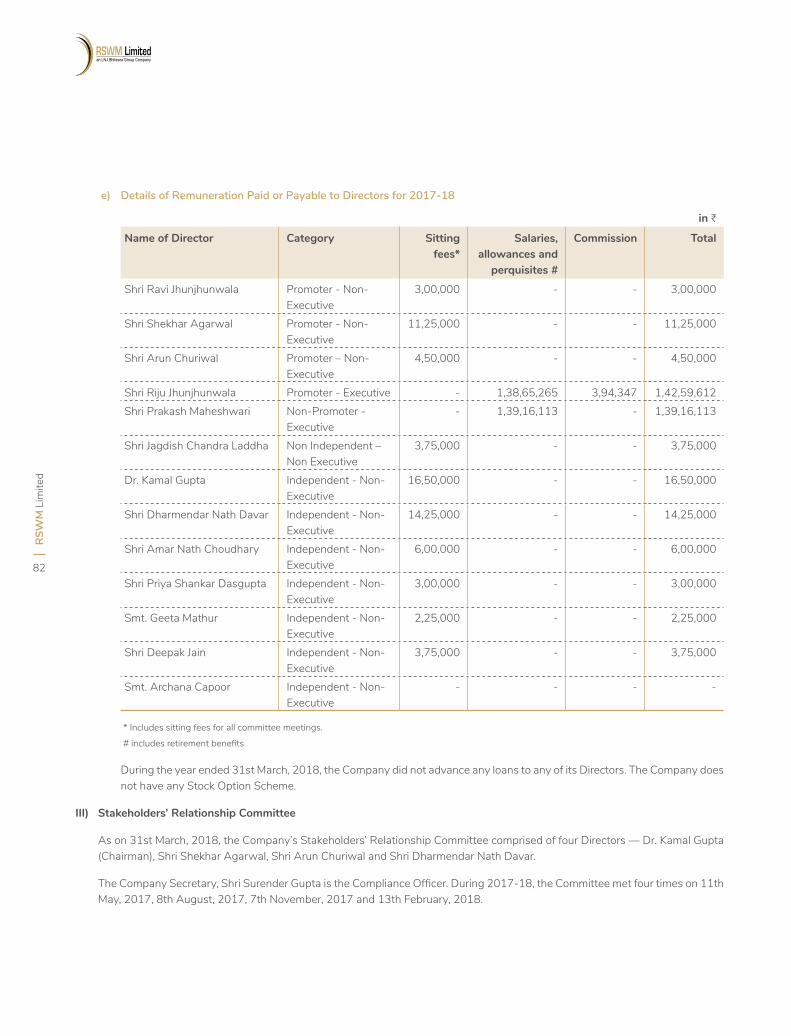
RSW
M L
imite
d
82
e) Details of Remuneration Paid or Payable to Directors for 2017-18
* Includes sitting fees for all committee meetings.
# includes retirement benefits
During the year ended 31st March, 2018, the Company did not advance any loans to any of its Directors. The Company does not have any Stock Option Scheme.
III) Stakeholders’ Relationship Committee
As on 31st March, 2018, the Company’s Stakeholders’ Relationship Committee comprised of four Directors — Dr. Kamal Gupta (Chairman), Shri Shekhar Agarwal, Shri Arun Churiwal and Shri Dharmendar Nath Davar.
The Company Secretary, Shri Surender Gupta is the Compliance Officer. During 2017-18, the Committee met four times on 11th May, 2017, 8th August, 2017, 7th November, 2017 and 13th February, 2018.
in H
Name of Director Category Sitting fees*
Salaries, allowances and
perquisites #
Commission Total
Shri Ravi Jhunjhunwala Promoter - Non-Executive
3,00,000 - - 3,00,000
Shri Shekhar Agarwal Promoter - Non-Executive
11,25,000 - - 11,25,000
Shri Arun Churiwal Promoter – Non-Executive
4,50,000 - - 4,50,000
Shri Riju Jhunjhunwala Promoter - Executive - 1,38,65,265 3,94,347 1,42,59,612Shri Prakash Maheshwari Non-Promoter -
Executive- 1,39,16,113 - 1,39,16,113
Shri Jagdish Chandra Laddha Non Independent – Non Executive
3,75,000 - - 3,75,000
Dr. Kamal Gupta Independent - Non-Executive
16,50,000 - - 16,50,000
Shri Dharmendar Nath Davar Independent - Non-Executive
14,25,000 - - 14,25,000
Shri Amar Nath Choudhary Independent - Non-Executive
6,00,000 - - 6,00,000
Shri Priya Shankar Dasgupta Independent - Non-Executive
3,00,000 - - 3,00,000
Smt. Geeta Mathur Independent - Non-Executive
2,25,000 - - 2,25,000
Shri Deepak Jain Independent - Non-Executive
3,75,000 - - 3,75,000
Smt. Archana Capoor Independent - Non-Executive
- - - -
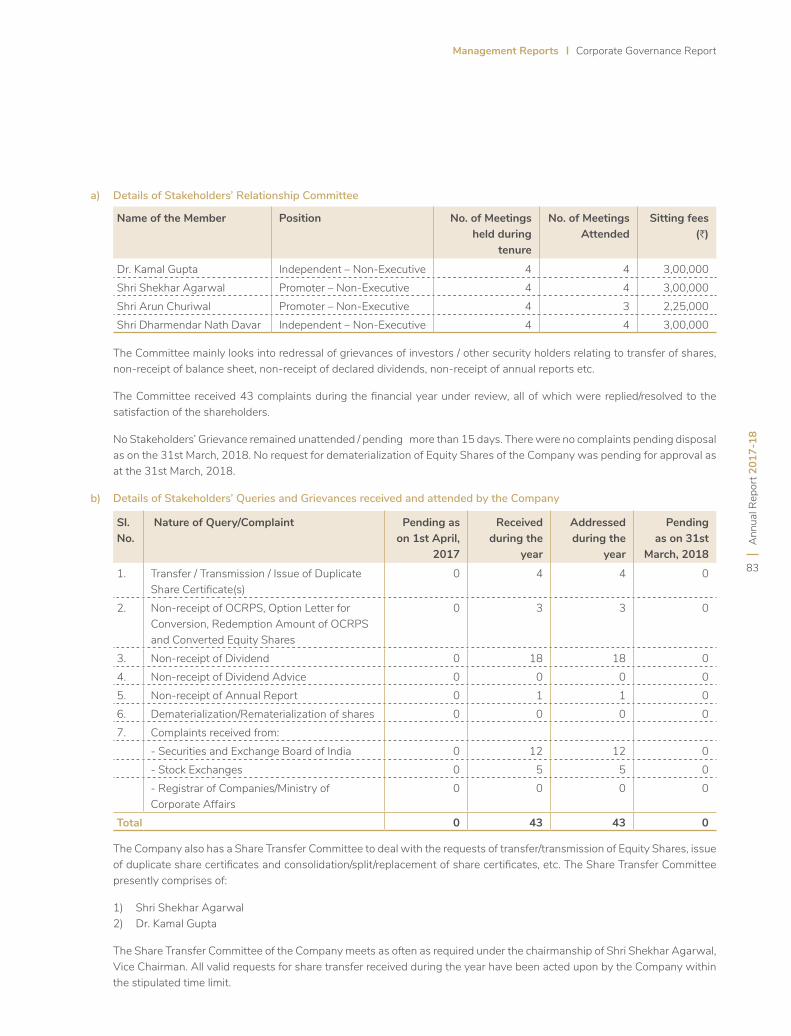
Ann
ual R
epor
t 201
7-18
83
Management Reports Corporate Governance Report
The Committee mainly looks into redressal of grievances of investors / other security holders relating to transfer of shares, non-receipt of balance sheet, non-receipt of declared dividends, non-receipt of annual reports etc.
The Committee received 43 complaints during the financial year under review, all of which were replied/resolved to the satisfaction of the shareholders.
No Stakeholders’ Grievance remained unattended / pending more than 15 days. There were no complaints pending disposal as on the 31st March, 2018. No request for dematerialization of Equity Shares of the Company was pending for approval as at the 31st March, 2018.
b) Details of Stakeholders’ Queries and Grievances received and attended by the Company
The Company also has a Share Transfer Committee to deal with the requests of transfer/transmission of Equity Shares, issue of duplicate share certificates and consolidation/split/replacement of share certificates, etc. The Share Transfer Committee presently comprises of:
1) Shri Shekhar Agarwal 2) Dr. Kamal Gupta
The Share Transfer Committee of the Company meets as often as required under the chairmanship of Shri Shekhar Agarwal, Vice Chairman. All valid requests for share transfer received during the year have been acted upon by the Company within the stipulated time limit.
Sl. No.
Nature of Query/Complaint Pending as on 1st April,
2017
Received during the
year
Addressed during the
year
Pending as on 31st
March, 2018
1. Transfer / Transmission / Issue of Duplicate Share Certificate(s)
0 4 4 0
2. Non-receipt of OCRPS, Option Letter for Conversion, Redemption Amount of OCRPS and Converted Equity Shares
0 3 3 0
3. Non-receipt of Dividend 0 18 18 04. Non-receipt of Dividend Advice 0 0 0 05. Non-receipt of Annual Report 0 1 1 06. Dematerialization/Rematerialization of shares 0 0 0 07. Complaints received from:
- Securities and Exchange Board of India 0 12 12 0- Stock Exchanges 0 5 5 0- Registrar of Companies/Ministry of Corporate Affairs
0 0 0 0
Total 0 43 43 0
Name of the Member Position No. of Meetings held during
tenure
No. of Meetings Attended
Sitting fees (H)
Dr. Kamal Gupta Independent – Non-Executive 4 4 3,00,000Shri Shekhar Agarwal Promoter – Non-Executive 4 4 3,00,000Shri Arun Churiwal Promoter – Non-Executive 4 3 2,25,000Shri Dharmendar Nath Davar Independent – Non-Executive 4 4 3,00,000
a) Details of Stakeholders’ Relationship Committee
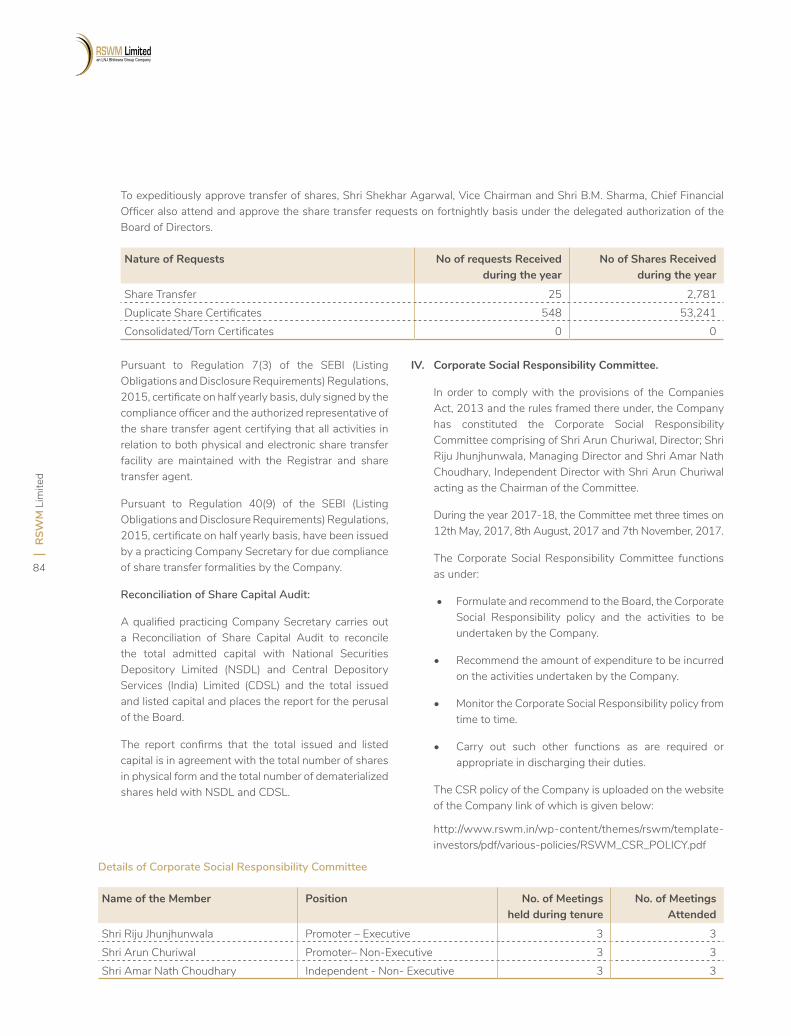
RSW
M L
imite
d
84
To expeditiously approve transfer of shares, Shri Shekhar Agarwal, Vice Chairman and Shri B.M. Sharma, Chief Financial Officer also attend and approve the share transfer requests on fortnightly basis under the delegated authorization of the Board of Directors.
Nature of Requests No of requests Received during the year
No of Shares Received during the year
Share Transfer 25 2,781Duplicate Share Certificates 548 53,241Consolidated/Torn Certificates 0 0
Details of Corporate Social Responsibility Committee
Name of the Member Position No. of Meetings held during tenure
No. of Meetings Attended
Shri Riju Jhunjhunwala Promoter – Executive 3 3Shri Arun Churiwal Promoter– Non-Executive 3 3Shri Amar Nath Choudhary Independent - Non- Executive 3 3
Pursuant to Regulation 7(3) of the SEBI (Listing Obligations and Disclosure Requirements) Regulations, 2015, certificate on half yearly basis, duly signed by the compliance officer and the authorized representative of the share transfer agent certifying that all activities in relation to both physical and electronic share transfer facility are maintained with the Registrar and share transfer agent.
Pursuant to Regulation 40(9) of the SEBI (Listing Obligations and Disclosure Requirements) Regulations, 2015, certificate on half yearly basis, have been issued by a practicing Company Secretary for due compliance of share transfer formalities by the Company.
Reconciliation of Share Capital Audit:
A qualified practicing Company Secretary carries out a Reconciliation of Share Capital Audit to reconcile the total admitted capital with National Securities Depository Limited (NSDL) and Central Depository Services (India) Limited (CDSL) and the total issued and listed capital and places the report for the perusal of the Board.
The report confirms that the total issued and listed capital is in agreement with the total number of shares in physical form and the total number of dematerialized shares held with NSDL and CDSL.
IV. Corporate Social Responsibility Committee.
In order to comply with the provisions of the Companies Act, 2013 and the rules framed there under, the Company has constituted the Corporate Social Responsibility Committee comprising of Shri Arun Churiwal, Director; Shri Riju Jhunjhunwala, Managing Director and Shri Amar Nath Choudhary, Independent Director with Shri Arun Churiwal acting as the Chairman of the Committee.
During the year 2017-18, the Committee met three times on 12th May, 2017, 8th August, 2017 and 7th November, 2017.
The Corporate Social Responsibility Committee functions as under:
• Formulate and recommend to the Board, the Corporate Social Responsibility policy and the activities to be undertaken by the Company.
• Recommend the amount of expenditure to be incurred on the activities undertaken by the Company.
• Monitor the Corporate Social Responsibility policy from time to time.
• Carry out such other functions as are required or appropriate in discharging their duties.
The CSR policy of the Company is uploaded on the website of the Company link of which is given below:
http://www.rswm.in/wp-content/themes/rswm/template-investors/pdf/various-policies/RSWM_CSR_POLICY.pdf
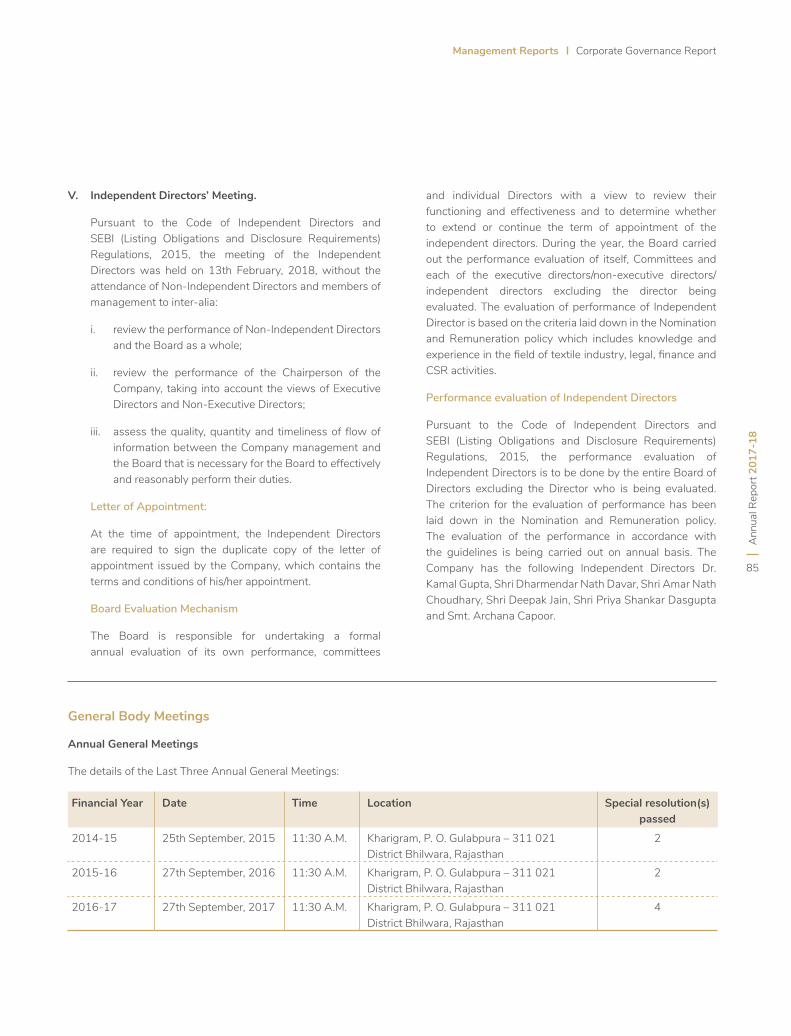
Ann
ual R
epor
t 201
7-18
85
Management Reports Corporate Governance Report
V. Independent Directors’ Meeting.
Pursuant to the Code of Independent Directors and SEBI (Listing Obligations and Disclosure Requirements) Regulations, 2015, the meeting of the Independent Directors was held on 13th February, 2018, without the attendance of Non-Independent Directors and members of management to inter-alia:
i. review the performance of Non-Independent Directors and the Board as a whole;
ii. review the performance of the Chairperson of the Company, taking into account the views of Executive Directors and Non-Executive Directors;
iii. assess the quality, quantity and timeliness of flow of information between the Company management and the Board that is necessary for the Board to effectively and reasonably perform their duties.
Letter of Appointment:
At the time of appointment, the Independent Directors are required to sign the duplicate copy of the letter of appointment issued by the Company, which contains the terms and conditions of his/her appointment.
Board Evaluation Mechanism
The Board is responsible for undertaking a formal annual evaluation of its own performance, committees
and individual Directors with a view to review their functioning and effectiveness and to determine whether to extend or continue the term of appointment of the independent directors. During the year, the Board carried out the performance evaluation of itself, Committees and each of the executive directors/non-executive directors/independent directors excluding the director being evaluated. The evaluation of performance of Independent Director is based on the criteria laid down in the Nomination and Remuneration policy which includes knowledge and experience in the field of textile industry, legal, finance and CSR activities.
Performance evaluation of Independent Directors
Pursuant to the Code of Independent Directors and SEBI (Listing Obligations and Disclosure Requirements) Regulations, 2015, the performance evaluation of Independent Directors is to be done by the entire Board of Directors excluding the Director who is being evaluated. The criterion for the evaluation of performance has been laid down in the Nomination and Remuneration policy. The evaluation of the performance in accordance with the guidelines is being carried out on annual basis. The Company has the following Independent Directors Dr. Kamal Gupta, Shri Dharmendar Nath Davar, Shri Amar Nath Choudhary, Shri Deepak Jain, Shri Priya Shankar Dasgupta and Smt. Archana Capoor.
General Body Meetings
Annual General Meetings
The details of the Last Three Annual General Meetings:
Financial Year Date Time Location Special resolution(s) passed
2014-15 25th September, 2015 11:30 A.M. Kharigram, P. O. Gulabpura – 311 021 District Bhilwara, Rajasthan
2
2015-16 27th September, 2016 11:30 A.M. Kharigram, P. O. Gulabpura – 311 021 District Bhilwara, Rajasthan
2
2016-17 27th September, 2017 11:30 A.M. Kharigram, P. O. Gulabpura – 311 021 District Bhilwara, Rajasthan
4
RSW
M L
imite
d
86
The following Special Resolutions were taken up in the last three Annual General Meetings and were passed with requisite majority.
2014-2015:
• Approval for the creation of mortgage and charges in addition to the existing mortgages, charges and hypothecations created by the Company.
• Approval for the creation of Second Charge subject to the First Charge of the Term Lenders on all the Immovable and Movable properties of the Company.
2015-2016:
• Approval for the creation of mortgage and charges in addition to the existing mortgages, charges and hypothecations created by the Company.
• Approval for the creation of Second Charge subject to the First Charge of the Term Lenders on all the Immovable and Movable properties of the Company.
2016-2017:
• Adoption of new Articles of Association.
• Approval for the creation of mortgage and charges in addition to the existing mortgages, charges and hypothecations created by the Company.
• Approval for the creation of Second Charge subject to the First Charge of the Term Lenders on all the Immovable and Movable properties of the Company.
• Approval of the issue of Redeemable Non-Convertible Debentures on private placement basis for an amount not exceeding H150 crores.
Postal Ballot
During the year under review, no Resolution was required to be passed through Postal Ballot.
Disclosures
a) Related Party Disclosure
As required by the IND AS 24, the details of related party transactions are given in Note No.39 to the Annual Accounts. The transaction with related parties are in the ordinary course of business on an arm’s length basis and do not have any potential conflict with the interests of the Company at large. Transactions with related parties entered
into by the Company in the ordinary course of business were placed before the Audit Committee.
The Related Party policy of the Company is uploaded on the website of the Company link of which is given below:
http://www.rswm.in/wp-content/themes/rswm/template-investors/pdf/various-policies/Related_Party_Transaction_Policy-2018.pdf
b) Disclosure of Accounting Treatment in Preparation of Financial Statements
The Company has followed the guidelines of Accounting Standards/IND AS laid down by the Institute of Chartered Accountants of India (ICAI) in preparation of its Financial Statements.
c) Risk Management
RSWM has a well-defined risk management framework in place. Under this framework, the Management has categorized the risks as High risk, Moderate risk and Low risk which were monitored on a continuous basis and appropriate risk mitigation steps were initiated as and when deemed necessary. The risk mitigation policy also covers the key risks such as availability and prices of cotton/other raw materials, prices of yarn in addition to forex, insurance and other business related risks. RSWM has established procedures to periodically place before the Board the risk assessment and minimization procedures being followed by the Company and steps taken by it to mitigate those risks through a properly defined framework. Risk parameters are periodically reviewed by external experts. Half yearly Risk Library with actions taken is presented to the Board.
d) Details of Non-Compliance by the Company in Previous Years
With regard to the matters related to capital markets, the Company has complied with all requirements of the SEBI (Listing Obligations and Disclosure Requirements) Regulations, 2015, as well as SEBI regulations and guidelines. No penalties/strictures were imposed on the Company by the Stock Exchange or SEBI or any statutory authority during the last three years.
e) Initiatives on Code of Conduct for Regulating Monitoring Reporting Trading Prevention of Insider Trading Practices
In compliance with the SEBI regulation on Code of Conduct for Regulating Monitoring Reporting Trading Prevention of Insider Trading Practices, the Company has instituted a comprehensive code of conduct for its management staff.
Ann
ual R
epor
t 201
7-18
87
Management Reports Corporate Governance Report
The Code lays down guidelines, which advises them on procedures to be followed and disclosures to be made, while dealing with shares of RSWM, and cautions them on consequences of violations.
The Company follows closure of trading window prior to the publication of price sensitive information. The Company has been informing the directors, senior management personnel and other persons covered under the code and advice them not to trade in Company’s securities during the closure of trading window period.
f) Compliance with Regulation 34(3) of SEBI (Listing Obligations and Disclosure Requirements) Regulation, 2015.
The Company is fully compliant with the requirements of SEBI (Listing Obligations and Disclosure Requirements) Regulation, 2015. A certificate from Statutory Auditors to this effect is enclosed in the Annual Report.
g) Discretionary Requirements
The Company has duly fulfilled the following discretionary requirements as prescribed in Schedule II part E of SEBI (Listing Obligations and Disclosure Requirements) Regulations, 2015.
Shri Ravi Jhunjhunwala is the Chairman of the Company and Shri Riju Jhunjhunwala is the Managing Director & CEO of the Company. The Company has complied with the requirement of having separate persons to the post of the Chairman and Managing Director/CEO.
The executive summary along with the internal audit report and action taken report of all units is placed at the end of every quarter before the Audit Committee.
Investment and Planning Committee
The Company has constituted the Investment and Planning Committee. The terms of reference of the Committee is to approve capital expenditure on projects and to recommend to the Board of Directors, capital budgets and other major capital schemes above a stipulated threshold, new business plan and capital outlays. No meeting was held during the year.
Audit Qualifications
The Company’s Financial Statements are free from any qualifications by the Auditors and Company continues to adopt best practices to move towards a regime of unqualified financial statements.
Management Discussion and Analysis
The Management Discussion and Analysis Report forms part of the Annual Report.
Senior Management personnel (Promoters, Directors, Management or relatives etc,) have made disclosure to the Board relating to all material, financial and other transactions stating that they did not have any personal interest that could result in a conflict with the interest of the Company at large. The interested Directors neither participate in the discussion nor vote on such matters.
Whistle Blower Policy
The Company has implemented vigil mechanism, whereby employees, directors and other stakeholders can report matters such as fraud, misconduct, non-compliance, misappropriation of funds, violation of Company’s Code of Conduct etc., to the Nodal Officer appointed for the purpose. The Company has adopted a framework whereby the identity of the complainant is not disclosed. During the year, the Company did not receive any Whistle Blower reference. These policies are available on the website of the Company at http://www.rswm.in/wp-content/themes/rswm/template-investors/pdf/various-policies/RSWM-Whistle-Blower-Policy-2018.pdf
CEO/ CFO Certification
The CEO and CFO certification of the Financial Statements for the year form part of this Annual Report.
Code of Conduct
RSWM’s Board has laid down a Code of Conduct for all Board members and Senior Management of the Company. The Company is committed to conduct its business in accordance with the pertinent laws, rules and regulations and with the highest standards of business ethics. The Code of Conduct is displayed on the website of the Company www.rswm.in. Board Members and designated Senior Management Officials have affirmed compliance with the Code of Conduct for the current year. It is further affirmed that access to the Audit Committee of the Company has not been denied to any personnel. A declaration to this effect forms part of this Annual Report.
Means of Communication
The effective communication of information is considered very essential component of Corporate Governance. The Company interacts with their shareholders through various means of communication i.e. Print Media, Company’s website, annual report etc.
RSW
M L
imite
d
88
Quarterly/ Annual results:
The quarterly and annual audited results are forthwith sent to the Stock Exchanges where the Company’s shares are listed after they are approved by the Board of Directors. The results of the Company are published in accordance with Regulation 47 of SEBI (Listing Obligations and Disclosure Requirements) Regulation, 2015 in at least one prominent national and one regional newspaper. The financial results are also displayed on the Company’s website www.rswm.in.
Website:
The Company’s website www.rswm.in has a separate section “Investors” where the information for the Shareholders is available. Annual Report, Quarterly Results, Shareholding Pattern, Corporate Governance Report etc. are also available on the website in a user friendly manner. The website also displays information in relation to the Company and presentation made to the analysts.
The Company ensures that the relevant provisions of Regulation 46 of SEBI (Listing Obligations and Disclosure Requirements) Regulation, 2015 are complied with. The Company has dedicated investor email-id [email protected]
Shareholders
i. Appointment or Reappointment of Non Independent Directors
Six Non Independent Directors of your Company are liable to retire by rotation. Of these Directors, at least one-third retire every year and if eligible, propose themselves for the re-appointment. This year, Shri Ravi Jhunjhunwala
and Shri Arun Churiwal are retiring by rotation and being eligible, offer themselves for re-appointment in the Annual General Meeting.
Their brief resumes are given below:
Shri Ravi Jhunjhunwala (62)
Shri Ravi Jhunjhunwala is a Non-Executive Promoter Director and Chairman of the Company and LNJ Bhilwara Group. Shri Ravi Jhunjhunwala holds a degree in B.Com (Hons.) and is also an MBA from the Centre D’etudes Indutrielles (CEI) Geneva. Shri Ravi Jhunjhunwala is also Managing Director of HEG Limited and Malana Power Company Limited. His leadership has enabled the group to establish a presence in more the 75 countries across five continents today. He is also active on number of National Management forums and is associated with various chambers of commerce including CII.
Shri Arun Churiwal (67)
Shri Arun Churiwal is a Non-Executive Promoter Director of the Company. He is also Chairman and Managing Director of BSL Limited. Shri Churiwal holds a degree in B.A (Hons.). He joined the Board of the Company as Director on 23rd October, 2003. He is an eminent industrialist having rich experience in textile industry.
ii Appointment of Independent Directors
Pursuant to the provisions of Section 149 read with schedule IV of the Companies Act, 2013 and SEBI (Listing Obligations and Disclosure Requirements) Regulations, 2015, Smt. Archana Capoor was appointed as Independent Director for first term of 5 consecutive years commencing from 13th February, 2018.
Details of Directorship Held in Other Companies
Directors name Name of the company in which Directorship held*
Committee Chairmanship
Committee Membership
Shri Ravi Jhunjhunwala
AD Hydro Power Limited Audit CommitteeBhilwara Energy LimitedBSL Limited Stakeholders’ Relationship CommitteeHEG Limited Stakeholders’ Relationship CommitteeIndia Glycols Limited Audit CommitteeJK Lakshmi Cement Limited Audit CommitteeMalana Power Company LimitedMaral Overseas Limited
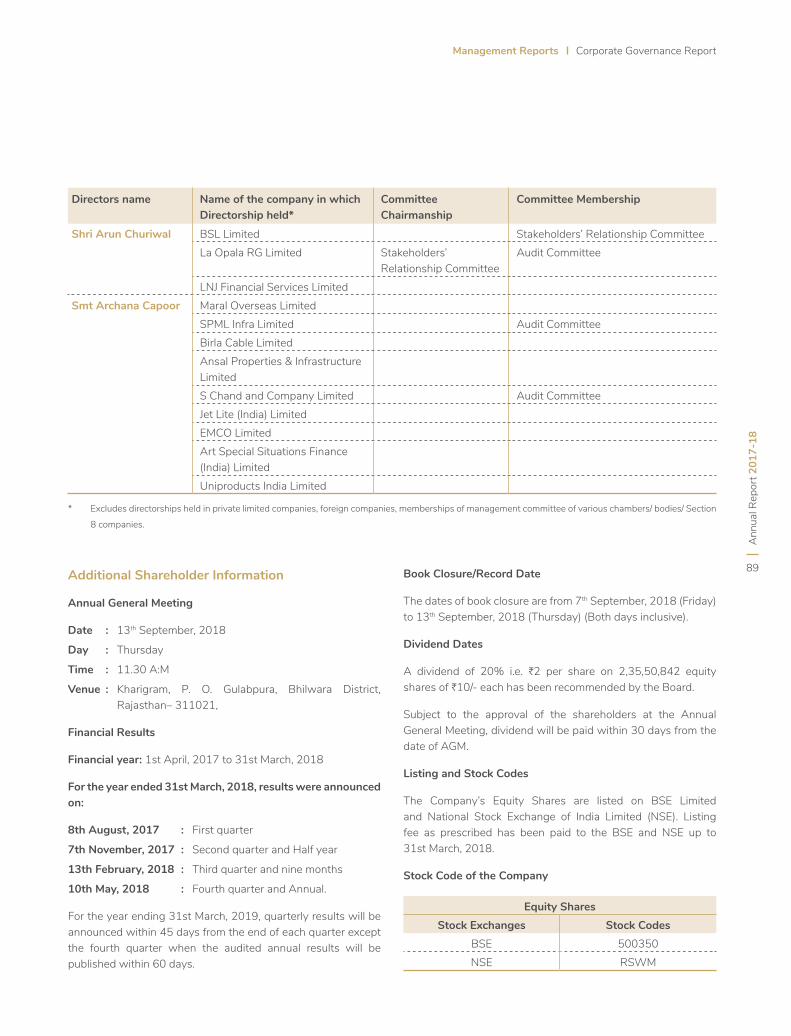
Ann
ual R
epor
t 201
7-18
89
Management Reports Corporate Governance Report
Additional Shareholder Information
Annual General Meeting
Date : 13th September, 2018
Day : Thursday
Time : 11.30 A:M
Venue : Kharigram, P. O. Gulabpura, Bhilwara District, Rajasthan– 311021,
Financial Results
Financial year: 1st April, 2017 to 31st March, 2018
For the year ended 31st March, 2018, results were announced on:
8th August, 2017 : First quarter
7th November, 2017 : Second quarter and Half year
13th February, 2018 : Third quarter and nine months
10th May, 2018 : Fourth quarter and Annual.
For the year ending 31st March, 2019, quarterly results will be announced within 45 days from the end of each quarter except the fourth quarter when the audited annual results will be published within 60 days.
* Excludes directorships held in private limited companies, foreign companies, memberships of management committee of various chambers/ bodies/ Section
8 companies.
Book Closure/Record Date
The dates of book closure are from 7th September, 2018 (Friday) to 13th September, 2018 (Thursday) (Both days inclusive).
Dividend Dates
A dividend of 20% i.e. H2 per share on 2,35,50,842 equity shares of H10/- each has been recommended by the Board.
Subject to the approval of the shareholders at the Annual General Meeting, dividend will be paid within 30 days from the date of AGM.
Listing and Stock Codes
The Company’s Equity Shares are listed on BSE Limited and National Stock Exchange of India Limited (NSE). Listing fee as prescribed has been paid to the BSE and NSE up to 31st March, 2018.
Stock Code of the Company
Equity SharesStock Exchanges Stock Codes
BSE 500350NSE RSWM
Directors name Name of the company in which Directorship held*
Committee Chairmanship
Committee Membership
Shri Arun Churiwal BSL Limited Stakeholders’ Relationship CommitteeLa Opala RG Limited Stakeholders’
Relationship CommitteeAudit Committee
LNJ Financial Services LimitedSmt Archana Capoor Maral Overseas Limited
SPML Infra Limited Audit CommitteeBirla Cable LimitedAnsal Properties & Infrastructure LimitedS Chand and Company Limited Audit CommitteeJet Lite (India) LimitedEMCO LimitedArt Special Situations Finance (India) LimitedUniproducts India Limited
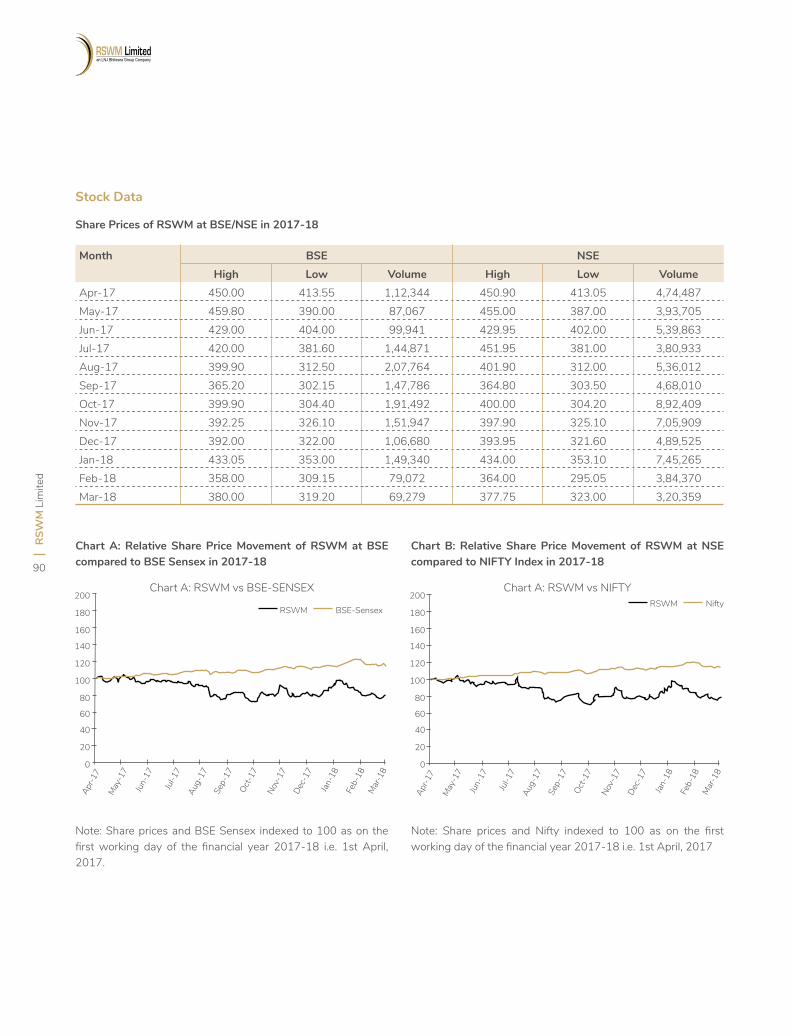
RSW
M L
imite
d
90
Apr-1
7
May
-17
Jun-
17
Jul-1
7Au
g-17
Sep-
17Oct
-17
Nov-
17De
c-17
Jan-
18
Feb-
18M
ar-1
8
Stock Data
Share Prices of RSWM at BSE/NSE in 2017-18
Month BSE NSEHigh Low Volume High Low Volume
Apr-17 450.00 413.55 1,12,344 450.90 413.05 4,74,487 May-17 459.80 390.00 87,067 455.00 387.00 3,93,705 Jun-17 429.00 404.00 99,941 429.95 402.00 5,39,863 Jul-17 420.00 381.60 1,44,871 451.95 381.00 3,80,933 Aug-17 399.90 312.50 2,07,764 401.90 312.00 5,36,012 Sep-17 365.20 302.15 1,47,786 364.80 303.50 4,68,010 Oct-17 399.90 304.40 1,91,492 400.00 304.20 8,92,409 Nov-17 392.25 326.10 1,51,947 397.90 325.10 7,05,909 Dec-17 392.00 322.00 1,06,680 393.95 321.60 4,89,525 Jan-18 433.05 353.00 1,49,340 434.00 353.10 7,45,265 Feb-18 358.00 309.15 79,072 364.00 295.05 3,84,370 Mar-18 380.00 319.20 69,279 377.75 323.00 3,20,359
Note: Share prices and BSE Sensex indexed to 100 as on the first working day of the financial year 2017-18 i.e. 1st April, 2017.
Note: Share prices and Nifty indexed to 100 as on the first working day of the financial year 2017-18 i.e. 1st April, 2017
Chart A: Relative Share Price Movement of RSWM at BSE compared to BSE Sensex in 2017-18
Chart B: Relative Share Price Movement of RSWM at NSE compared to NIFTY Index in 2017-18
Chart A: RSWM vs BSE-SENSEX Chart A: RSWM vs NIFTY200
180
160
140
120
100
80
60
40
20
0
200
180
160
140
120
100
80
60
40
20
0
Apr-1
7
May
-17
Jun-
17
Jul-1
7Au
g-17
Sep-
17Oct
-17
Nov-
17De
c-17
Jan-
18
Feb-
18M
ar-1
8
RSWM BSE-SensexRSWM Nifty
Ann
ual R
epor
t 201
7-18
91
Management Reports Corporate Governance Report
Shareholding Pattern
Shareholding Pattern by Equity Shareholders as on 31st March, 2018
Categories No. of shares PercentagePromoters, Directors, Relatives and Associates 1,19,92,888 50.92Foreign Institutional Investors/Mutual Funds 2,55,625 1.09Public Financial Institutions/State Financial Corporation 3,24,213 1.38Mutual Funds (Indian ) 32,20,514 13.68Nationalized and other banks 47,636 0.20NRIs/ Foreign Companies (Other than Promoters) 8,26,755 3.51Public 68,83,211 29.22Total 2,35,50,842 100.00
Shareholding Pattern by Equity Shareholders as on 31st March, 2018
Categories No. of Shareholders No. of shares held Percentage1-1000 15,299 24,98,882 10.611001-5000 789 16,81,245 7.145001-10000 114 7,81,801 3.3210001 and above 109 1,85,88,914 78.93Total 16,311 2,35,50,842 100.00
Dematerialisation of Shares
As on 31st March, 2018, 2,27,84,879 Equity Shares representing 96.75 % of the total equity capital were held in dematerialized form. Trading in shares of the Company is permitted in dematerialized form only. The Company makes request to shareholders holding shares in physical form on a regular basis to get shares dematerialized in their own benefit.
The ISIN number for RSWM’s equity shares on NSDL and CDSL is INE611A01016.
Registrar and Transfer Agents
The Shareholders may contact M/s MCS Share Transfer Agent Limited for matters related to Share Transfers etc. at the following address:
MCS Share Transfer Agent Limited, F-65, Okhla Industrial Area, Phase I, New Delhi – 110 020 Phone No (s) : 011-41406149-52, Fax No : 011-41709881, E- Mail : [email protected]
Share Transfer System
Matters related to share transfer and transmission are attended by the delegated authorities on a fortnightly basis. Share transfers are registered and returned within 15 days from the date of receipt, if the documents are in order in all respects. As per the requirement of Regulation 40(9) of SEBI (Listing Obligations and Disclosure Requirements) Regulations, 2015, the Company has obtained half-yearly certificates from Practicing Company Secretary for due compliance of share transfer formalities.
Details of Public Funding Obtained in the Last Three Years
RSWM has not obtained any public funding in the last three years.
Outstanding Warrants and their Implications on Equity
The Company has no outstanding warrants/convertible instruments.
RSW
M L
imite
d
92
Commodity price risk or foreign exchange risk and hedging activities
During the financial year ended 31st March, 2018, the Company has appropriately managed the forex risks by means including natural hedging opportunities available in the business.
Plant Locations
1 Kharigram, P.O. Gulabpura – 311 021, Distt. Bhilwara, Rajasthan
2 Mayur Nagar, Lodha, P.O. Banswara – 327 001, Distt. Banswara, Rajasthan
3 LNJ Nagar, Mordi, P.O. Banswara – 327 001, Distt. Banswara, Rajasthan (Denim, Fabric and TPP).
4 Mandpam, Distt. Bhilwara-311025, Rajasthan
5 Kanya Kheri, Distt. Bhilwara- 311025, Rajasthan
6 Rishabhdev, Distt. Udaipur– 313 802, Rajasthan
7 Ringus, Distt. Sikar – 332 404 Rajasthan
8 B. Muduganapalli, Bagalur, Distt. Krishnagiri -635103, Tamilnadu
9 Thirubuvanai-605107, Puducherry
Investor Correspondence
Investor correspondence should be addressed to:
Registrar & Share Transfer Agent:
MCS Share Transfer Agent LimitedF-65, 1st Floor,Okhla Industrial Area Phase I,New Delhi – 110 020 Phone Nos: 011-4140 6149-52 Fax No. : 011-4170 9881 E-mail : [email protected]
Company Secretary
RSWM LimitedBhilwara TowersA-12, Sector 1, NoidaUttar Pradesh - 201301 Phone Nos. : 0120-4390000/4390300Fax Nos. : 0120-4277841E-mail : [email protected]
Registered Office
KharigramP.O. GulabpuraDistrict - Bhilwara Rajasthan – 311 021, India
Other information to the Shareholders
Green initiative
As a responsible Corporate citizen, the Company welcome the Green initiative by sending the communications/documents including Notices for General Meeting and Annual Reports from time to time in electronic mode to those members who have provided their e-mail addresses to their Depository Participants (DP).
Shareholders who have not registered their e-mail addresses are requested to register/update their e-mail addresses in respect of equity shares held by them in demat form with their respective DPs and in case of physical form with the Company.
Internal Complaints Committee (ICC)
As per the Sexual Harassment of Women at Workplace (Prevention, Prohibition and Redressal) Act, 2013 which came into effect from the 9th of December, 2013, the Company has formulated an Internal Complaints Committee which ensures protection of women employees at the work place and redressal of complaints.
The Committee is formed as per the statute. It is headed by a woman employee. The committee comprises of more than half representation of women and it has adequate independent representation of women from the social and legal fields. It lays down the whole procedure of filing complaint, enquiry, redressal of grievance and taking action against those who are found guilty by the Committee in a fairly transparent manner.
Information pursuant to Regulation 39 of the SEBI (Listing Obligations and Disclosure Requirements) Regulations, 2015
The Company transferred 26,538 equity shares in respect of 406 shareholders in the name of “RSWM Limited – Unclaimed Suspense Account” on 9th August, 2012 and these shares were subsequently dematerialized. Thereafter, the Company received claim from 10 shareholders up-till now comprising of 216 shares, which were duly transferred in their respective names. During the year, the Company received claim from 1 shareholder in respect of 43 shares. As on the 31st March, 2018, 26,322 equity shares are still lying in the Unclaimed Suspense Account.
Ann
ual R
epor
t 201
7-18
93
Management Reports Corporate Governance Report
Investors Education and Protection Fund (IEPF)
Pursuant to Section 124(6) and Section 125 of the Companies Act, 2013, and Investor Education and Protection Fund Authority (Accounting, Audit, Transfer and Refund) Rules, 2016, all shares in respect of which dividend has not been paid or claimed for seven consecutive years or more shall be transferred in the name of Investor Education and Protection Fund. Accordingly, the shareholders are requested to immediately claim their unpaid dividends, failing which, the said shares will be transferred to the IEPF. All the shareholders whose dividends for past seven years are either unclaimed or unpaid are being intimated individually.
Accordingly, 52,617 shares were transferred in the name of Investor Education and Protection Fund in respect of the dividend remaining unpaid for seven consecutive years from the Financial Year 2010-11. List of unpaid dividend in respect of whom the shares were transferred to the Investor Education and Protection Fund Account is available on the website of the Company.
Riju JhunjhunwalaPlace: Kharigram Managing DirectorDated: 10th May, 2018 DIN: 00061060
RSW
M L
imite
d
94
Certification by Chief Executive Officer and Chief Financial Officer of the Company
We, Riju Jhunjhunwala, Managing Director & Chief Executive Officer and B.M. Sharma, Chief Financial Officer of RSWM Limited, hereby certify to the Board that:
a. We have reviewed Financial statements and the Cash Flow statement for the year and that to the best of our knowledge and belief :
i. These statements do not contain any materially untrue statement or omit any material fact or contain statements that might be misleading;
ii. These statements together present a true and fair view of the Company’s affairs and are in compliance with existing Accounting Standards, applicable laws and regulations.
b. There are, to the best of our knowledge and belief, no transactions entered into by RSWM Limited during the year which are fraudulent, illegal or violative of the Company’s Code of Conduct.
c. We are responsible for establishing and maintaining internal controls for financial reporting in RSWM Limited and we have evaluated the effectiveness of Internal Control Systems of the Company pertaining to financial reporting. We have disclosed to the Auditors and the Audit Committee, deficiencies in the design or operation of such internal controls, if any, of which we are aware and the steps we have taken or propose to take to rectify these deficiencies.
d. We have indicated to the Auditors and the Audit Committee:
i. significant changes in internal control over financial reporting during the year;
ii. significant changes in accounting policies during the year and that the same have been disclosed in the notes to the financial statements; and
iii. instances of significant fraud of which we have become aware and the involvement therein, if any, of the management or an employee having a significant role in the Company’s internal control system over financial reporting.
e. We affirm that we have not denied any personnel access to the Audit Committee of the Company (in respect of matters involving alleged misconduct).
f. We further declare that all Board Members and designated Senior Management have affirmed compliance with the Code of Conduct for the current year.
Riju Jhunjhunwala B.M. Sharma Managing Director & Chief Executive Officer Chief Financial Officer
Place: NoidaDated: 10th May, 2018
Ann
ual R
epor
t 201
7-18
95
Management Reports Corporate Governance Report
Auditors’ Certificate
To The Members of RSWM Ltd
We have examined the compliance of conditions of Corporate Governance by RSWM Limited (“Company”), for the year ended on March 31, 2018 as stipulated in Part C of Schedule V of the SEBI (Listing Obligations and Disclosure Requirements) Regulations, 2015 of the said Company with Stock Exchange(s).
The compliance of conditions of Corporate Governance is the responsibility of the management. Our examination was limited to procedures and implementation thereof, adopted by the Company for ensuring the compliance of the conditions of the Corporate Governance. It is neither an audit nor an expression of opinion on the financial statements of the Company.
In our opinion and to the best of our information and according to the explanations given to us, we certify that the Company has complied with the conditions of Corporate Governance as stipulated in the above mentioned SEBI (Listing Obligations and Disclosure Requirements) Regulations, 2015.
We further state that such compliance is neither an assurance as to the future viability of the Company nor the efficiency or effectiveness with which the management has conducted the affairs of the Company.
For Lodha & Co. For S. S. Kothari Mehta & CoChartered Accountants Chartered AccountantsFirm Registration No:301051E Firm Registration No: 000756N
N. K. Lodha Yogesh K. GuptaPartner PartnerMembership No: 85155 Membership No: 93214
Place: NoidaDate : May 10, 2018
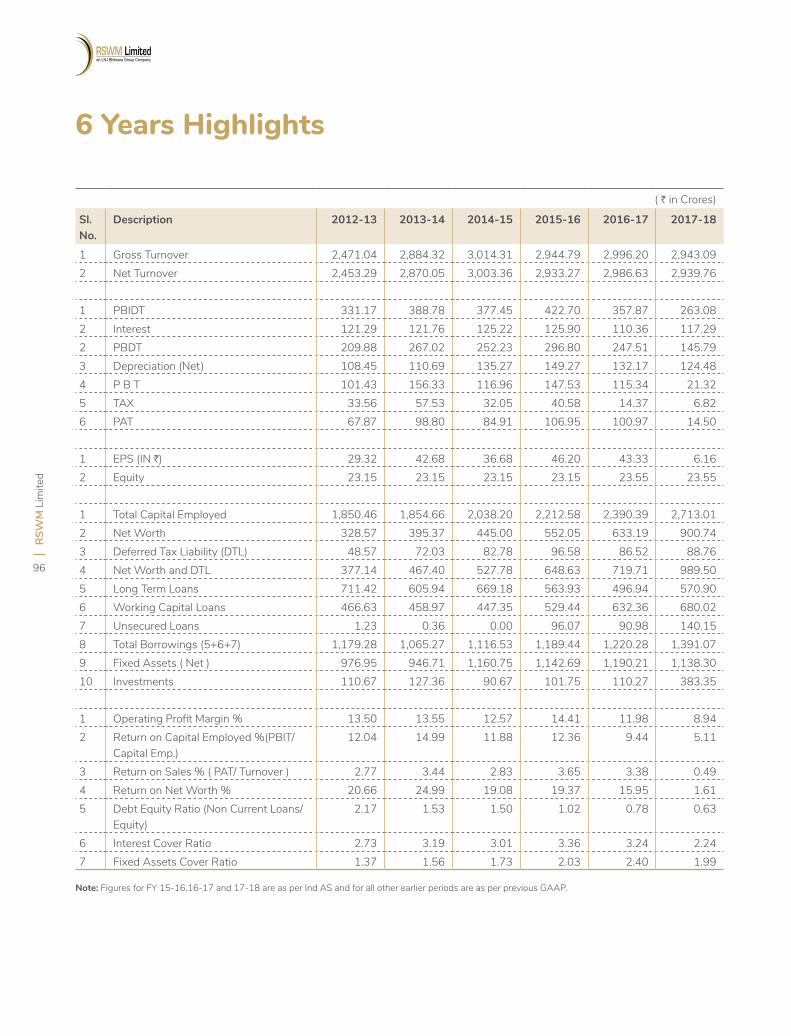
RSW
M L
imite
d
96
6 Years Highlights
( H in Crores)
Sl. No.
Description 2012-13 2013-14 2014-15 2015-16 2016-17 2017-18
1 Gross Turnover 2,471.04 2,884.32 3,014.31 2,944.79 2,996.20 2,943.092 Net Turnover 2,453.29 2,870.05 3,003.36 2,933.27 2,986.63 2,939.76
1 PBIDT 331.17 388.78 377.45 422.70 357.87 263.082 Interest 121.29 121.76 125.22 125.90 110.36 117.292 PBDT 209.88 267.02 252.23 296.80 247.51 145.793 Depreciation (Net) 108.45 110.69 135.27 149.27 132.17 124.484 P B T 101.43 156.33 116.96 147.53 115.34 21.325 TAX 33.56 57.53 32.05 40.58 14.37 6.826 PAT 67.87 98.80 84.91 106.95 100.97 14.50
1 EPS (IN H) 29.32 42.68 36.68 46.20 43.33 6.162 Equity 23.15 23.15 23.15 23.15 23.55 23.55
1 Total Capital Employed 1,850.46 1,854.66 2,038.20 2,212.58 2,390.39 2,713.012 Net Worth 328.57 395.37 445.00 552.05 633.19 900.743 Deferred Tax Liability (DTL) 48.57 72.03 82.78 96.58 86.52 88.764 Net Worth and DTL 377.14 467.40 527.78 648.63 719.71 989.505 Long Term Loans 711.42 605.94 669.18 563.93 496.94 570.906 Working Capital Loans 466.63 458.97 447.35 529.44 632.36 680.027 Unsecured Loans 1.23 0.36 0.00 96.07 90.98 140.158 Total Borrowings (5+6+7) 1,179.28 1,065.27 1,116.53 1,189.44 1,220.28 1,391.079 Fixed Assets ( Net ) 976.95 946.71 1,160.75 1,142.69 1,190.21 1,138.3010 Investments 110.67 127.36 90.67 101.75 110.27 383.35
1 Operating Profit Margin % 13.50 13.55 12.57 14.41 11.98 8.942 Return on Capital Employed %(PBIT/
Capital Emp.) 12.04 14.99 11.88 12.36 9.44 5.11
3 Return on Sales % ( PAT/ Turnover ) 2.77 3.44 2.83 3.65 3.38 0.494 Return on Net Worth % 20.66 24.99 19.08 19.37 15.95 1.615 Debt Equity Ratio (Non Current Loans/
Equity)2.17 1.53 1.50 1.02 0.78 0.63
6 Interest Cover Ratio 2.73 3.19 3.01 3.36 3.24 2.247 Fixed Assets Cover Ratio 1.37 1.56 1.73 2.03 2.40 1.99
Note: Figures for FY 15-16,16-17 and 17-18 are as per Ind AS and for all other earlier periods are as per previous GAAP.

Financial Statements Standalone Financial Statements
Ann
ual R
epor
t 201
7-18
97
Financial Statements
RSW
M L
imite
d
98
Independent Auditors’ Report
To The Members of RSWM Limited
Report on the Standalone Financial Statements
We have audited the accompanying Standalone financial statements of RSWM Limited (“the Company”), which comprise the Balance Sheet as at March 31, 2018, the Statement of Profit and Loss (including Other Comprehensive Income), the Cash Flow Statement and Statement of Changes in Equity for the year then ended, and a summary of the significant accounting policies and other explanatory information.
Management’s Responsibility for the Standalone Financial Statements
The Company’s Board of Directors is responsible for the matters stated in Section 134(5) of the Companies Act, 2013 (“the Act”) with respect to the preparation of these Standalone financial statements that give a true and fair view of the financial position, financial performance including other comprehensive income, cash flows and changes in equity of the Company in accordance with the accounting principles generally accepted in India, including the Indian Accounting Standards (Ind AS) specified under Section 133 of the Act read with relevant rules issued thereunder.
This responsibility also includes maintenance of adequate accounting records in accordance with the provisions of the Act for safeguarding the assets of the Company and for preventing and detecting frauds and other irregularities; selection and application of appropriate accounting policies; making judgements and estimates that are reasonable and prudent; and design, implementation and maintenance of adequate internal financial controls, that were operating effectively for ensuring the accuracy and completeness of the accounting records, relevant to the preparation and presentation of the financial statements that give a true and fair view and are free from material misstatement, whether due to fraud or error.
Auditor’s Responsibility
Our responsibility is to express an opinion on these standalone financial statements based on our audit.
We have taken into account the provisions of the Act, the accounting and auditing standards and matters which are required to be included in the audit report under the provisions of the Act and the Rules made thereunder.
We conducted our audit in accordance with the Standards on Auditing specified under Section 143(10) of the Act. Those Standards require that we comply with ethical requirements and plan and perform the audit to obtain reasonable assurance
about whether the financial statements are free from material misstatement.
An audit involves performing procedures to obtain audit evidence about the amounts and the disclosures in the financial statements. The procedures selected depend on the auditor’s judgement, including the assessment of the risks of material misstatement of the financial statements, whether due to fraud or error. In making those risk assessments, the auditor considers internal financial control relevant to the Company’s preparation of the financial statements that give a true and fair view in order to design audit procedures that are appropriate in the circumstances. An audit also includes evaluating the appropriateness of the accounting policies used and the reasonableness of the accounting estimates made by the Company’s Directors, as well as evaluating the overall presentation of the financial statements.
We believe that the audit evidence we have obtained is sufficient and appropriate to provide a basis for our audit opinion on the standalone financial statements.
Opinion
In our opinion and to the best of our information and knowledge and according to the explanations given to us, the aforesaid standalone financial statements give the information required by the Act in the manner so required and give a true and fair view in conformity with the accounting principles generally accepted in India, of the financial position of the Company as at March 31, 2018, and its profit including other comprehensive income, its cash flows and the changes in equity for the year ended on that date.
Report on Other Legal and Regulatory Requirements
1. As required by the Companies (Auditor’s Report) Order, 2016 (“the Order”) issued by the Government of India in terms of section 143 (11) of the Act, we give in the “Annexure A” a statement on the matters specified in the paragraphs 3 and 4 of the said Order.
2. As required by Section 143 (3) of the Act, we report that:
(a) We have sought and obtained all the information and explanations which to the best of our knowledge and belief were necessary for the purposes of our audit.
(b) In our opinion, proper books of account as required by law have been kept by the Company so far as it appears from our examination of those books.
Financial Statements Standalone Financial Statements
Ann
ual R
epor
t 201
7-18
99
Independent Auditors’ Report (Contd..)
(c) The Balance Sheet, the Statement of Profit and Loss (including other comprehensive income), the Statement of Cash Flow and the Statement of Changes in Equity dealt with by this Report are in agreement with the books of account.
(d) In our opinion, the aforesaid standalone financial statements comply with the Indian Accounting Standards (Ind AS) specified under Section 133 of the Act read with relevant rule issued thereunder.
(e) On the basis of the written representations received from the directors as on March 31, 2018 taken on record by the Board of Directors, none of the directors is disqualified as on March 31, 2018 from being appointed as a director in terms of Section 164 (2) of the Act.
(f) With respect to the adequacy of the internal financial controls over financial reporting of the Company and the operating effectiveness of such controls, refer to our separate Report in “Annexure B”.
(g) With respect to the other matters to be included in the Auditor’s Report in accordance with Rule 11 of the Companies (Audit and Auditors) Rules, 2014, in our opinion and to the best of our information and according to the explanations given to us:
i. The Company has disclosed the impact of pending litigations on its financial position in its financial statements – refer Note no. 45 to the financial statement;
ii. The Company did not have any long-term contracts including derivative contracts for which there were any material foreseeable losses.
iii. There has been no delay in transferring amounts, required to be transferred, to the Investor Education and Protection Fund by the Company during the year ended March 31, 2018.
Other Matters
The financial statements of the Company for the year ended March 31, 2017 have been audited by one of the predecessor joint auditor with S.S. Kothari Mehta & Co. who have expressed an unmodified opinion on the financial statement. Our opinion is not modified in respect of this matter.
For Lodha & Co. For S S Kothari Mehta & Co.Chartered Accountants Chartered AccountantsFRN : 301051E FRN : 000756N
N K Lodha Yogesh K. GuptaPartner PartnerM. No. 085155 M. No. 093214
Place : NoidaDate : May 10, 2018
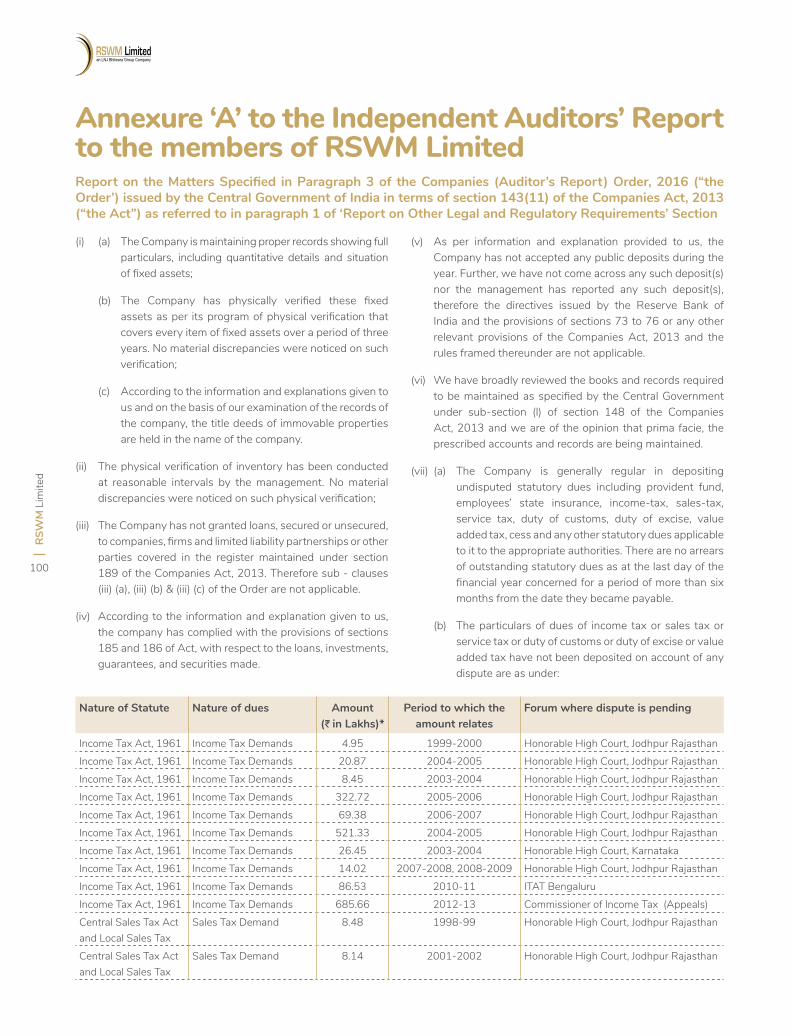
RSW
M L
imite
d
100
Annexure ‘A’ to the Independent Auditors’ Report to the members of RSWM Limited
(i) (a) The Company is maintaining proper records showing full particulars, including quantitative details and situation of fixed assets;
(b) The Company has physically verified these fixed assets as per its program of physical verification that covers every item of fixed assets over a period of three years. No material discrepancies were noticed on such verification;
(c) According to the information and explanations given to us and on the basis of our examination of the records of the company, the title deeds of immovable properties are held in the name of the company.
(ii) The physical verification of inventory has been conducted at reasonable intervals by the management. No material discrepancies were noticed on such physical verification;
(iii) The Company has not granted loans, secured or unsecured, to companies, firms and limited liability partnerships or other parties covered in the register maintained under section 189 of the Companies Act, 2013. Therefore sub - clauses (iii) (a), (iii) (b) & (iii) (c) of the Order are not applicable.
(iv) According to the information and explanation given to us, the company has complied with the provisions of sections 185 and 186 of Act, with respect to the loans, investments, guarantees, and securities made.
(v) As per information and explanation provided to us, the Company has not accepted any public deposits during the year. Further, we have not come across any such deposit(s) nor the management has reported any such deposit(s), therefore the directives issued by the Reserve Bank of India and the provisions of sections 73 to 76 or any other relevant provisions of the Companies Act, 2013 and the rules framed thereunder are not applicable.
(vi) We have broadly reviewed the books and records required to be maintained as specified by the Central Government under sub-section (l) of section 148 of the Companies Act, 2013 and we are of the opinion that prima facie, the prescribed accounts and records are being maintained.
(vii) (a) The Company is generally regular in depositing undisputed statutory dues including provident fund, employees’ state insurance, income-tax, sales-tax, service tax, duty of customs, duty of excise, value added tax, cess and any other statutory dues applicable to it to the appropriate authorities. There are no arrears of outstanding statutory dues as at the last day of the financial year concerned for a period of more than six months from the date they became payable.
(b) The particulars of dues of income tax or sales tax or service tax or duty of customs or duty of excise or value added tax have not been deposited on account of any dispute are as under:
Report on the Matters Specified in Paragraph 3 of the Companies (Auditor’s Report) Order, 2016 (“the Order’) issued by the Central Government of India in terms of section 143(11) of the Companies Act, 2013 (“the Act”) as referred to in paragraph 1 of ‘Report on Other Legal and Regulatory Requirements’ Section
Nature of Statute Nature of dues Amount(J in Lakhs)*
Period to which the amount relates
Forum where dispute is pending
Income Tax Act, 1961 Income Tax Demands 4.95 1999-2000 Honorable High Court, Jodhpur RajasthanIncome Tax Act, 1961 Income Tax Demands 20.87 2004-2005 Honorable High Court, Jodhpur RajasthanIncome Tax Act, 1961 Income Tax Demands 8.45 2003-2004 Honorable High Court, Jodhpur RajasthanIncome Tax Act, 1961 Income Tax Demands 322.72 2005-2006 Honorable High Court, Jodhpur RajasthanIncome Tax Act, 1961 Income Tax Demands 69.38 2006-2007 Honorable High Court, Jodhpur RajasthanIncome Tax Act, 1961 Income Tax Demands 521.33 2004-2005 Honorable High Court, Jodhpur RajasthanIncome Tax Act, 1961 Income Tax Demands 26.45 2003-2004 Honorable High Court, KarnatakaIncome Tax Act, 1961 Income Tax Demands 14.02 2007-2008, 2008-2009 Honorable High Court, Jodhpur RajasthanIncome Tax Act, 1961 Income Tax Demands 86.53 2010-11 ITAT BengaluruIncome Tax Act, 1961 Income Tax Demands 685.66 2012-13 Commissioner of Income Tax (Appeals)Central Sales Tax Act and Local Sales Tax
Sales Tax Demand 8.48 1998-99 Honorable High Court, Jodhpur Rajasthan
Central Sales Tax Act and Local Sales Tax
Sales Tax Demand 8.14 2001-2002 Honorable High Court, Jodhpur Rajasthan
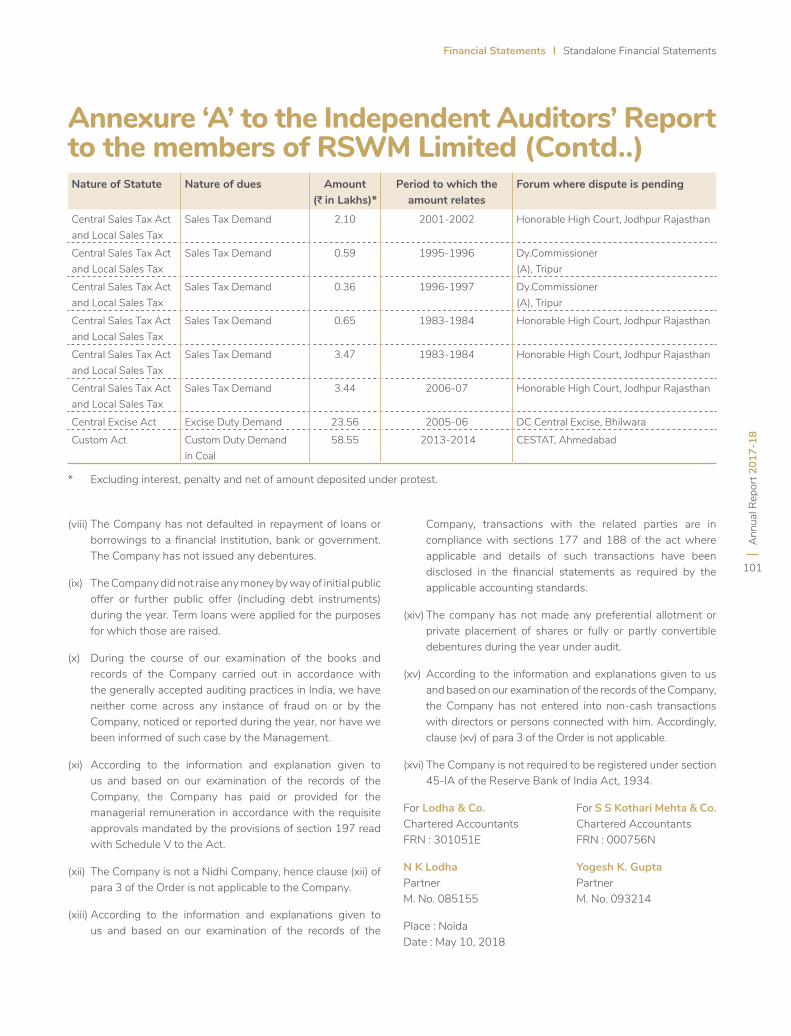
Financial Statements Standalone Financial Statements
Ann
ual R
epor
t 201
7-18
101
Annexure ‘A’ to the Independent Auditors’ Report to the members of RSWM Limited (Contd..) Nature of Statute Nature of dues Amount
(J in Lakhs)*Period to which the
amount relatesForum where dispute is pending
Central Sales Tax Act and Local Sales Tax
Sales Tax Demand 2.10 2001-2002 Honorable High Court, Jodhpur Rajasthan
Central Sales Tax Act and Local Sales Tax
Sales Tax Demand 0.59 1995-1996 Dy.Commissioner (A), Tripur
Central Sales Tax Act and Local Sales Tax
Sales Tax Demand 0.36 1996-1997 Dy.Commissioner (A), Tripur
Central Sales Tax Act and Local Sales Tax
Sales Tax Demand 0.65 1983-1984 Honorable High Court, Jodhpur Rajasthan
Central Sales Tax Act and Local Sales Tax
Sales Tax Demand 3.47 1983-1984 Honorable High Court, Jodhpur Rajasthan
Central Sales Tax Act and Local Sales Tax
Sales Tax Demand 3.44 2006-07 Honorable High Court, Jodhpur Rajasthan
Central Excise Act Excise Duty Demand 23.56 2005-06 DC Central Excise, BhilwaraCustom Act Custom Duty Demand
in Coal58.55 2013-2014 CESTAT, Ahmedabad
* Excluding interest, penalty and net of amount deposited under protest.
(viii) The Company has not defaulted in repayment of loans or borrowings to a financial institution, bank or government. The Company has not issued any debentures.
(ix) The Company did not raise any money by way of initial public offer or further public offer (including debt instruments) during the year. Term loans were applied for the purposes for which those are raised.
(x) During the course of our examination of the books and records of the Company carried out in accordance with the generally accepted auditing practices in India, we have neither come across any instance of fraud on or by the Company, noticed or reported during the year, nor have we been informed of such case by the Management.
(xi) According to the information and explanation given to us and based on our examination of the records of the Company, the Company has paid or provided for the managerial remuneration in accordance with the requisite approvals mandated by the provisions of section 197 read with Schedule V to the Act.
(xii) The Company is not a Nidhi Company, hence clause (xii) of para 3 of the Order is not applicable to the Company.
(xiii) According to the information and explanations given to us and based on our examination of the records of the
Company, transactions with the related parties are in compliance with sections 177 and 188 of the act where applicable and details of such transactions have been disclosed in the financial statements as required by the applicable accounting standards.
(xiv) The company has not made any preferential allotment or private placement of shares or fully or partly convertible debentures during the year under audit.
(xv) According to the information and explanations given to us and based on our examination of the records of the Company, the Company has not entered into non-cash transactions with directors or persons connected with him. Accordingly, clause (xv) of para 3 of the Order is not applicable.
(xvi) The Company is not required to be registered under section 45-IA of the Reserve Bank of India Act, 1934.
For Lodha & Co. For S S Kothari Mehta & Co.Chartered Accountants Chartered AccountantsFRN : 301051E FRN : 000756N
N K Lodha Yogesh K. GuptaPartner PartnerM. No. 085155 M. No. 093214
Place : NoidaDate : May 10, 2018
RSW
M L
imite
d
102
Annexure ‘B’ to the Independent Auditor’s Report to the members of RSWM LimitedReport on the Internal Financial Controls under Clause (i) of Sub-section 3 of Section 143 of the Companies Act, 2013 (“the Act”) as referred to in paragraph 2(f) of ‘Report on Other Legal and Regulatory Requirements’ section
We have audited the internal financial controls over financial reporting of RSWM LIMITED (“the Company”) as of March 31, 2018 in conjunction with our audit of the standalone financial statements of the Company for the year ended on that date.
Management’s Responsibility for Internal Financial Controls
The Company’s management is responsible for establishing and maintaining internal financial controls based on “the internal control over financial reporting criteria established by the Company considering the essential components of internal control stated in the Guidance Note on Audit of Internal Financial Controls over Financial Reporting issued by the Institute of Chartered Accountants of India”. These responsibilities include the design, implementation and maintenance of adequate internal financial controls that were operating effectively for ensuring the orderly and efficient conduct of its business, including adherence to company’s policies, the safeguarding of its assets, the prevention and detection of frauds and errors, the accuracy and completeness of the accounting records, and the timely preparation of reliable financial information, as required under the Companies Act, 2013.
Auditors’ Responsibility
Our responsibility is to express an opinion on the Company’s internal financial controls over financial reporting based on our audit.
We conducted our audit in accordance with the Guidance Note on Audit of Internal Financial Controls Over Financial Reporting (the “Guidance Note”) and the Standards on Auditing prescribed under section 143(10) of the Companies Act, 2013, to the extent applicable to an audit of internal financial controls. Those Standards and the Guidance Note require that we comply with ethical requirements and plan and perform the audit to obtain reasonable assurance about whether adequate internal financial controls over financial reporting was established and maintained and if such controls operated effectively in all material respects.
Our audit involves performing procedures to obtain audit evidence about the adequacy of the internal financial controls system over financial reporting and their operating effectiveness.
Our audit of internal financial controls over financial reporting included obtaining an understanding of internal financial controls over financial reporting, assessing the risk that a material weakness exists, and testing and evaluating the design and operating effectiveness of internal control based on the assessed risk. The procedures selected depend on the auditor’s judgment, including the assessment of the risks of material misstatement of the standalone financial statements, whether due to fraud or error.
We believe that the audit evidence we have obtained is sufficient and appropriate to provide a basis for our audit opinion on the Company’s internal financial controls system over financial reporting.
Meaning of Internal Financial Controls over Financial Reporting
A company’s internal financial control over financial reporting is a process designed to provide reasonable assurance regarding the reliability of financial reporting and the preparation of financial statements for external purposes in accordance with generally accepted accounting principles. A company’s internal financial control over financial reporting includes those policies and procedures that (1) pertain to the maintenance of records that, in reasonable detail, accurately and fairly reflect the transactions and dispositions of the assets of the company; (2) provide reasonable assurance that transactions are recorded as necessary to permit preparation of financial statements in accordance with generally accepted accounting principles, and that receipts and expenditures of the company are being made only in accordance with authorizations of management and directors of the company; and (3) provide reasonable assurance regarding prevention or timely detection of unauthorized acquisition, use, or disposition of the company’s assets that could have a material effect on the financial statements.
Financial Statements Standalone Financial Statements
Ann
ual R
epor
t 201
7-18
103
Annexure ‘B’ to the Independent Auditor’s Report to the members of RSWM Limited (contd..)
Inherent Limitations of Internal Financial Controls over Financial Reporting
Because of the inherent limitations of internal financial controls over financial reporting, including the possibility of collusion or improper management override of controls, material misstatements due to error or fraud may occur and not be detected. Also, projections of any evaluation of the internal financial controls over financial reporting to future periods are subject to the risk that the internal financial control over financial reporting may become inadequate because of changes in conditions, or that the degree of compliance with the policies or procedures may deteriorate.
Opinion
In our opinion, the Company has, in all material respects, an adequate internal financial controls system over financial reporting and such internal financial controls over financial
reporting were operating effectively as at March 31, 2018, based on “the internal control over financial reporting criteria established by the Company considering the essential components of internal control stated in the Guidance Note on Audit of Internal Financial Controls Over Financial Reporting issued by the Institute of Chartered Accountants of India”.
For Lodha & Co. For S S Kothari Mehta & Co.Chartered Accountants Chartered AccountantsFRN : 301051E FRN : 000756N
N K Lodha Yogesh K. GuptaPartner PartnerM. No. 085155 M. No. 093214
Place : NoidaDate : May 10, 2018
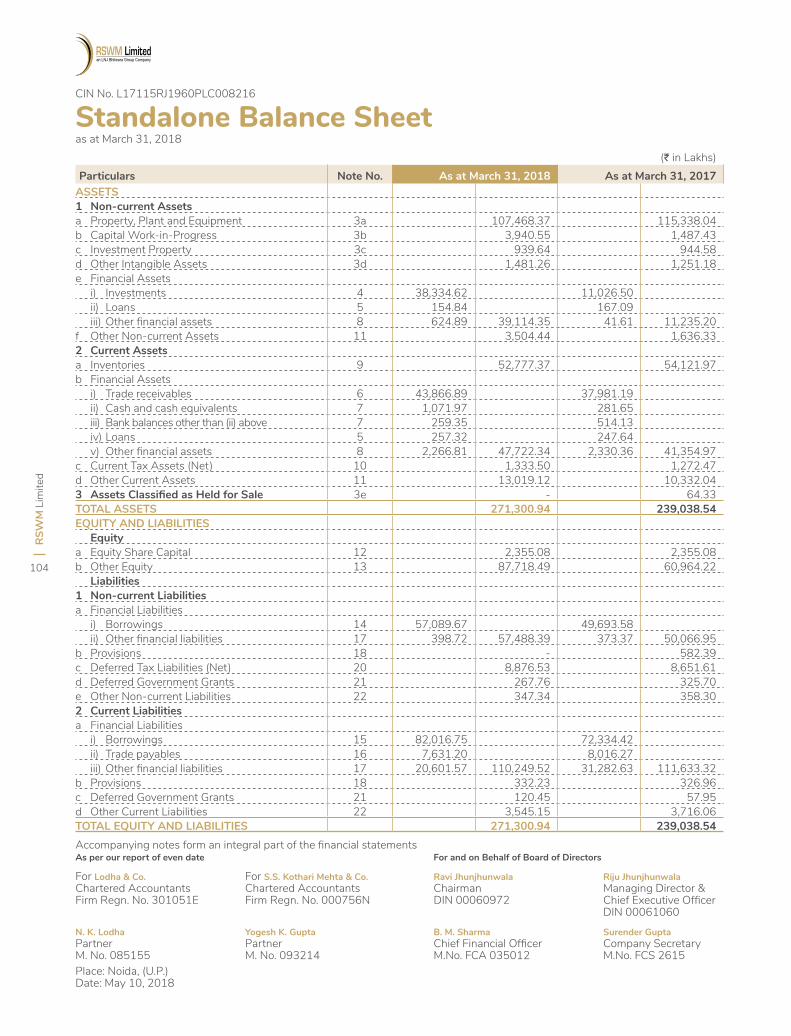
RSW
M L
imite
d
104
(J in Lakhs)Particulars Note No. As at March 31, 2018 As at March 31, 2017
ASSETS1 Non-current Assetsa Property, Plant and Equipment 3a 107,468.37 115,338.04 b Capital Work-in-Progress 3b 3,940.55 1,487.43 c Investment Property 3c 939.64 944.58 d Other Intangible Assets 3d 1,481.26 1,251.18 e Financial Assets i) Investments 4 38,334.62 11,026.50 ii) Loans 5 154.84 167.09 iii) Other financial assets 8 624.89 39,114.35 41.61 11,235.20 f Other Non-current Assets 11 3,504.44 1,636.33 2 Current Assetsa Inventories 9 52,777.37 54,121.97 b Financial Assets i) Trade receivables 6 43,866.89 37,981.19 ii) Cash and cash equivalents 7 1,071.97 281.65 iii) Bank balances other than (ii) above 7 259.35 514.13 iv) Loans 5 257.32 247.64 v) Other financial assets 8 2,266.81 47,722.34 2,330.36 41,354.97 c Current Tax Assets (Net) 10 1,333.50 1,272.47 d Other Current Assets 11 13,019.12 10,332.04 3 Assets Classified as Held for Sale 3e - 64.33 TOTAL ASSETS 271,300.94 239,038.54 EQUITY AND LIABILITIES Equitya Equity Share Capital 12 2,355.08 2,355.08 b Other Equity 13 87,718.49 60,964.22 Liabilities1 Non-current Liabilitiesa Financial Liabilities i) Borrowings 14 57,089.67 49,693.58 ii) Other financial liabilities 17 398.72 57,488.39 373.37 50,066.95 b Provisions 18 - 582.39 c Deferred Tax Liabilities (Net) 20 8,876.53 8,651.61 d Deferred Government Grants 21 267.76 325.70 e Other Non-current Liabilities 22 347.34 358.30 2 Current Liabilitiesa Financial Liabilities i) Borrowings 15 82,016.75 72,334.42 ii) Trade payables 16 7,631.20 8,016.27 iii) Other financial liabilities 17 20,601.57 110,249.52 31,282.63 111,633.32 b Provisions 18 332.23 326.96 c Deferred Government Grants 21 120.45 57.95 d Other Current Liabilities 22 3,545.15 3,716.06 TOTAL EQUITY AND LIABILITIES 271,300.94 239,038.54
Standalone Balance Sheet as at March 31, 2018
Accompanying notes form an integral part of the financial statementsAs per our report of even date For and on Behalf of Board of Directors
For Lodha & Co. For S.S. Kothari Mehta & Co. Ravi Jhunjhunwala Riju JhunjhunwalaChartered Accountants Chartered Accountants Chairman Managing Director &Firm Regn. No. 301051E Firm Regn. No. 000756N DIN 00060972 Chief Executive Officer DIN 00061060
N. K. Lodha Yogesh K. Gupta B. M. Sharma Surender GuptaPartner Partner Chief Financial Officer Company SecretaryM. No. 085155 M. No. 093214 M.No. FCA 035012 M.No. FCS 2615Place: Noida, (U.P.)Date: May 10, 2018
CIN No. L17115RJ1960PLC008216
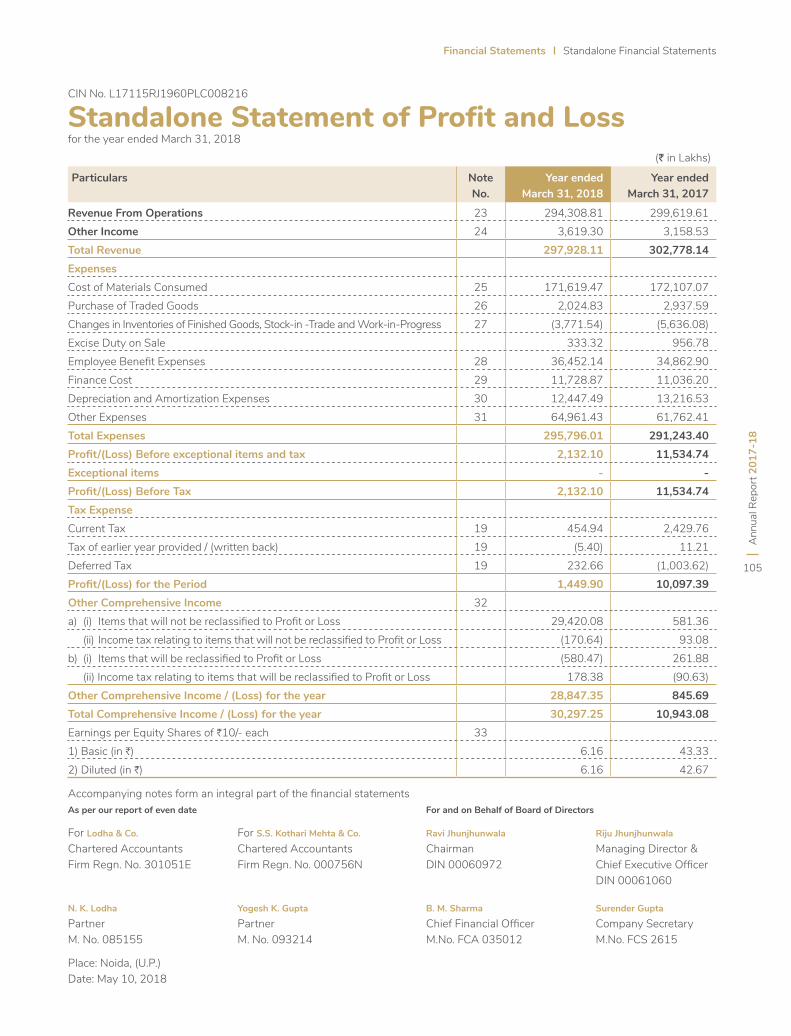
Financial Statements Standalone Financial Statements
Ann
ual R
epor
t 201
7-18
105
Standalone Statement of Profit and Lossfor the year ended March 31, 2018
(J in Lakhs)
Particulars Note No.
Year ended March 31, 2018
Year ended March 31, 2017
Revenue From Operations 23 294,308.81 299,619.61 Other Income 24 3,619.30 3,158.53 Total Revenue 297,928.11 302,778.14 ExpensesCost of Materials Consumed 25 171,619.47 172,107.07 Purchase of Traded Goods 26 2,024.83 2,937.59 Changes in Inventories of Finished Goods, Stock-in -Trade and Work-in-Progress 27 (3,771.54) (5,636.08)Excise Duty on Sale 333.32 956.78 Employee Benefit Expenses 28 36,452.14 34,862.90 Finance Cost 29 11,728.87 11,036.20 Depreciation and Amortization Expenses 30 12,447.49 13,216.53 Other Expenses 31 64,961.43 61,762.41 Total Expenses 295,796.01 291,243.40 Profit/(Loss) Before exceptional items and tax 2,132.10 11,534.74 Exceptional items - - Profit/(Loss) Before Tax 2,132.10 11,534.74 Tax Expense Current Tax 19 454.94 2,429.76 Tax of earlier year provided / (written back) 19 (5.40) 11.21 Deferred Tax 19 232.66 (1,003.62)Profit/(Loss) for the Period 1,449.90 10,097.39 Other Comprehensive Income 32a) (i) Items that will not be reclassified to Profit or Loss 29,420.08 581.36 (ii) Income tax relating to items that will not be reclassified to Profit or Loss (170.64) 93.08 b) (i) Items that will be reclassified to Profit or Loss (580.47) 261.88 (ii) Income tax relating to items that will be reclassified to Profit or Loss 178.38 (90.63)Other Comprehensive Income / (Loss) for the year 28,847.35 845.69 Total Comprehensive Income / (Loss) for the year 30,297.25 10,943.08 Earnings per Equity Shares of H10/- each 331) Basic (in H) 6.16 43.33 2) Diluted (in H) 6.16 42.67
Accompanying notes form an integral part of the financial statementsAs per our report of even date For and on Behalf of Board of Directors
For Lodha & Co. For S.S. Kothari Mehta & Co. Ravi Jhunjhunwala Riju Jhunjhunwala
Chartered Accountants Chartered Accountants Chairman Managing Director &Firm Regn. No. 301051E Firm Regn. No. 000756N DIN 00060972 Chief Executive Officer DIN 00061060
N. K. Lodha Yogesh K. Gupta B. M. Sharma Surender Gupta
Partner Partner Chief Financial Officer Company SecretaryM. No. 085155 M. No. 093214 M.No. FCA 035012 M.No. FCS 2615
Place: Noida, (U.P.)Date: May 10, 2018
CIN No. L17115RJ1960PLC008216
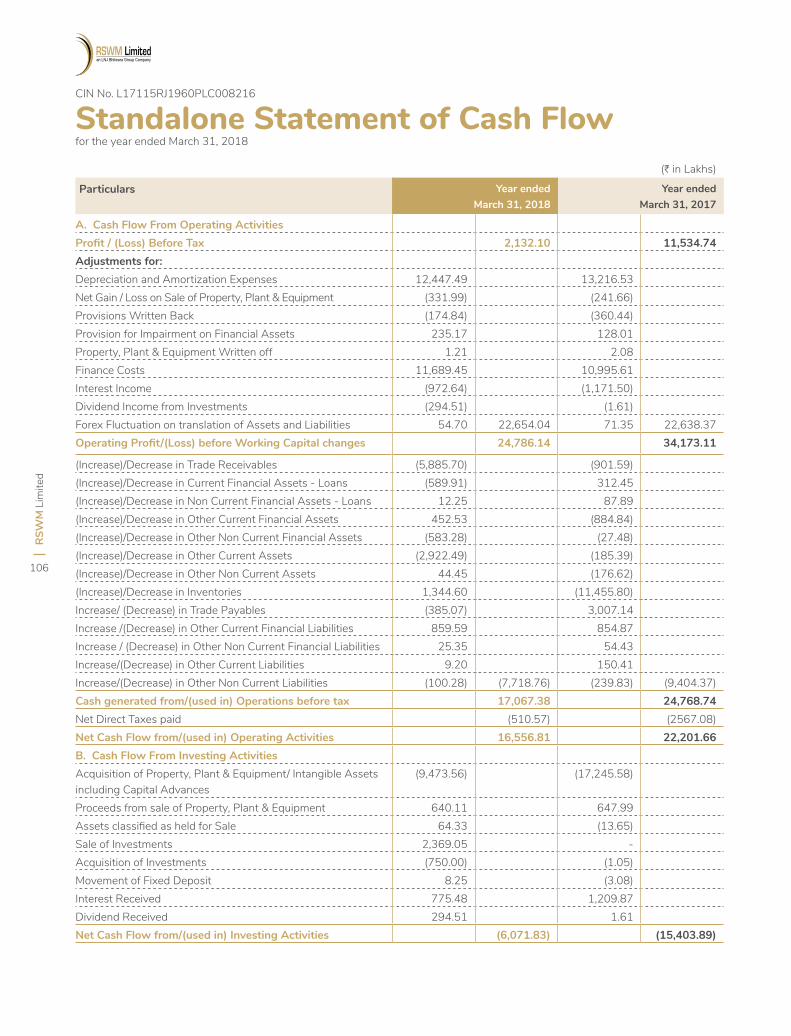
RSW
M L
imite
d
106
Standalone Statement of Cash Flowfor the year ended March 31, 2018
(H in Lakhs)
Particulars Year ended March 31, 2018
Year ended March 31, 2017
A. Cash Flow From Operating ActivitiesProfit / (Loss) Before Tax 2,132.10 11,534.74 Adjustments for:Depreciation and Amortization Expenses 12,447.49 13,216.53 Net Gain / Loss on Sale of Property, Plant & Equipment (331.99) (241.66)Provisions Written Back (174.84) (360.44)Provision for Impairment on Financial Assets 235.17 128.01 Property, Plant & Equipment Written off 1.21 2.08 Finance Costs 11,689.45 10,995.61 Interest Income (972.64) (1,171.50)Dividend Income from Investments (294.51) (1.61)Forex Fluctuation on translation of Assets and Liabilities 54.70 22,654.04 71.35 22,638.37 Operating Profit/(Loss) before Working Capital changes 24,786.14 34,173.11
(Increase)/Decrease in Trade Receivables (5,885.70) (901.59)(Increase)/Decrease in Current Financial Assets - Loans (589.91) 312.45 (Increase)/Decrease in Non Current Financial Assets - Loans 12.25 87.89 (Increase)/Decrease in Other Current Financial Assets 452.53 (884.84)(Increase)/Decrease in Other Non Current Financial Assets (583.28) (27.48)(Increase)/Decrease in Other Current Assets (2,922.49) (185.39)(Increase)/Decrease in Other Non Current Assets 44.45 (176.62)(Increase)/Decrease in Inventories 1,344.60 (11,455.80)Increase/ (Decrease) in Trade Payables (385.07) 3,007.14 Increase /(Decrease) in Other Current Financial Liabilities 859.59 854.87 Increase / (Decrease) in Other Non Current Financial Liabilities 25.35 54.43 Increase/(Decrease) in Other Current Liabilities 9.20 150.41 Increase/(Decrease) in Other Non Current Liabilities (100.28) (7,718.76) (239.83) (9,404.37)Cash generated from/(used in) Operations before tax 17,067.38 24,768.74 Net Direct Taxes paid (510.57) (2567.08)Net Cash Flow from/(used in) Operating Activities 16,556.81 22,201.66 B. Cash Flow From Investing ActivitiesAcquisition of Property, Plant & Equipment/ Intangible Assets including Capital Advances
(9,473.56) (17,245.58)
Proceeds from sale of Property, Plant & Equipment 640.11 647.99 Assets classified as held for Sale 64.33 (13.65)Sale of Investments 2,369.05 - Acquisition of Investments (750.00) (1.05)Movement of Fixed Deposit 8.25 (3.08)Interest Received 775.48 1,209.87 Dividend Received 294.51 1.61 Net Cash Flow from/(used in) Investing Activities (6,071.83) (15,403.89)
CIN No. L17115RJ1960PLC008216
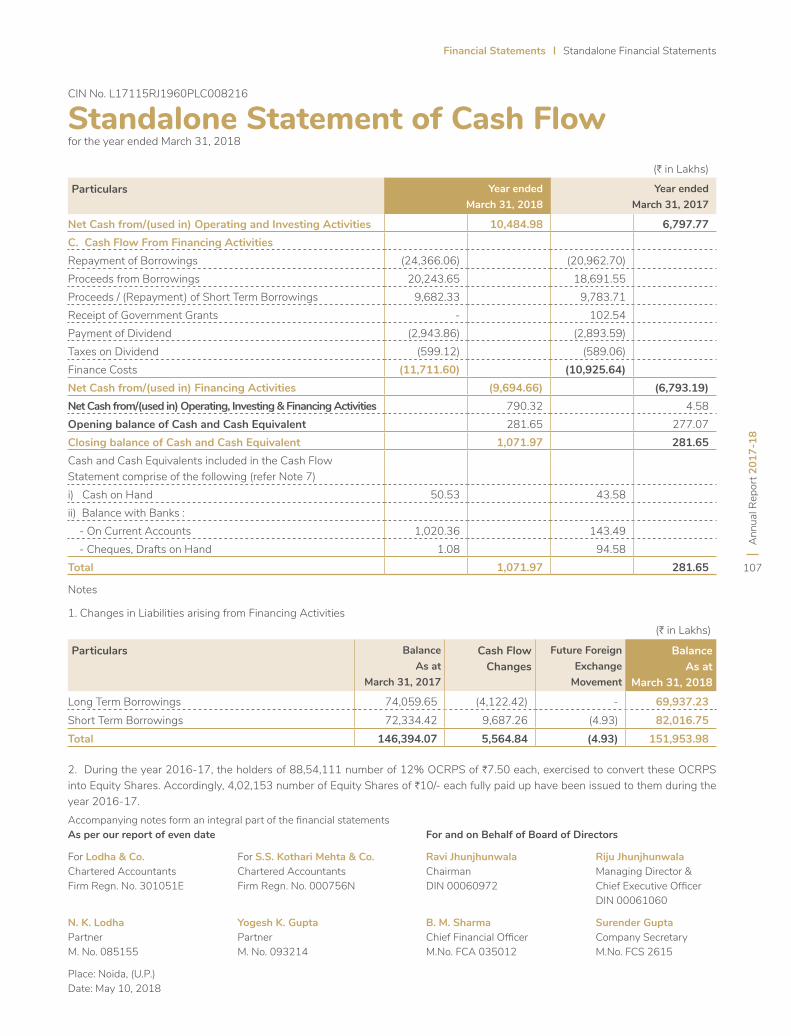
Financial Statements Standalone Financial Statements
Ann
ual R
epor
t 201
7-18
107
Standalone Statement of Cash Flowfor the year ended March 31, 2018
(H in Lakhs)
Particulars Year ended March 31, 2018
Year ended March 31, 2017
Net Cash from/(used in) Operating and Investing Activities 10,484.98 6,797.77 C. Cash Flow From Financing ActivitiesRepayment of Borrowings (24,366.06) (20,962.70)Proceeds from Borrowings 20,243.65 18,691.55 Proceeds / (Repayment) of Short Term Borrowings 9,682.33 9,783.71 Receipt of Government Grants - 102.54 Payment of Dividend (2,943.86) (2,893.59)Taxes on Dividend (599.12) (589.06)Finance Costs (11,711.60) (10,925.64)Net Cash from/(used in) Financing Activities (9,694.66) (6,793.19)Net Cash from/(used in) Operating, Investing & Financing Activities 790.32 4.58 Opening balance of Cash and Cash Equivalent 281.65 277.07 Closing balance of Cash and Cash Equivalent 1,071.97 281.65 Cash and Cash Equivalents included in the Cash Flow Statement comprise of the following (refer Note 7)i) Cash on Hand 50.53 43.58 ii) Balance with Banks : - On Current Accounts 1,020.36 143.49 - Cheques, Drafts on Hand 1.08 94.58 Total 1,071.97 281.65
(H in Lakhs)
Particulars BalanceAs at
March 31, 2017
Cash Flow Changes
Future Foreign Exchange
Movement
BalanceAs at
March 31, 2018
Long Term Borrowings 74,059.65 (4,122.42) - 69,937.23 Short Term Borrowings 72,334.42 9,687.26 (4.93) 82,016.75 Total 146,394.07 5,564.84 (4.93) 151,953.98
Notes
1. Changes in Liabilities arising from Financing Activities
2. During the year 2016-17, the holders of 88,54,111 number of 12% OCRPS of H7.50 each, exercised to convert these OCRPS into Equity Shares. Accordingly, 4,02,153 number of Equity Shares of H10/- each fully paid up have been issued to them during the year 2016-17.Accompanying notes form an integral part of the financial statementsAs per our report of even date For and on Behalf of Board of Directors
For Lodha & Co. For S.S. Kothari Mehta & Co. Ravi Jhunjhunwala Riju JhunjhunwalaChartered Accountants Chartered Accountants Chairman Managing Director &Firm Regn. No. 301051E Firm Regn. No. 000756N DIN 00060972 Chief Executive Officer DIN 00061060
N. K. Lodha Yogesh K. Gupta B. M. Sharma Surender GuptaPartner Partner Chief Financial Officer Company SecretaryM. No. 085155 M. No. 093214 M.No. FCA 035012 M.No. FCS 2615
Place: Noida, (U.P.)Date: May 10, 2018
CIN No. L17115RJ1960PLC008216
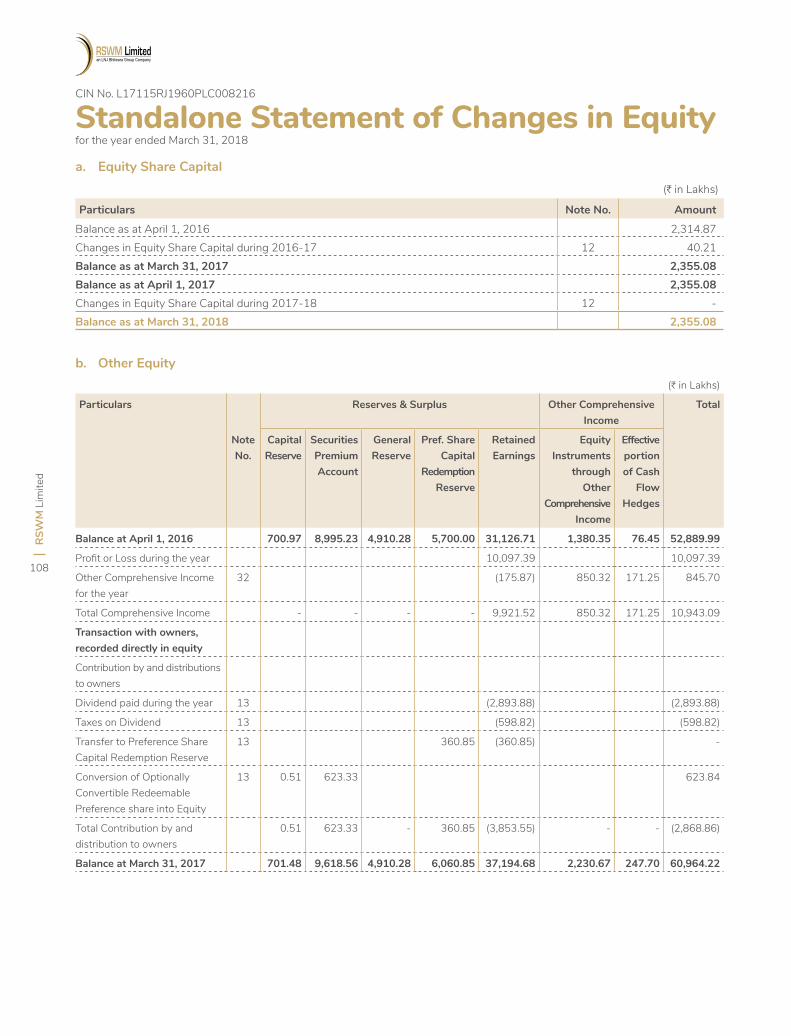
RSW
M L
imite
d
108
(H in Lakhs)
Particulars Note No. Amount
Balance as at April 1, 2016 2,314.87 Changes in Equity Share Capital during 2016-17 12 40.21 Balance as at March 31, 2017 2,355.08 Balance as at April 1, 2017 2,355.08 Changes in Equity Share Capital during 2017-18 12 - Balance as at March 31, 2018 2,355.08
Standalone Statement of Changes in Equity for the year ended March 31, 2018
b. Other Equity
a. Equity Share Capital
(H in Lakhs)
Particulars Reserves & Surplus Other Comprehensive Income
Total
Note No.
Capital Reserve
Securities Premium Account
General Reserve
Pref. Share Capital
Redemption Reserve
Retained Earnings
Equity Instruments
throughOther
ComprehensiveIncome
Effective portion of Cash
Flow Hedges
Balance at April 1, 2016 700.97 8,995.23 4,910.28 5,700.00 31,126.71 1,380.35 76.45 52,889.99
Profit or Loss during the year 10,097.39 10,097.39
Other Comprehensive Income for the year
32 (175.87) 850.32 171.25 845.70
Total Comprehensive Income - - - - 9,921.52 850.32 171.25 10,943.09
Transaction with owners, recorded directly in equity
Contribution by and distributions to owners
Dividend paid during the year 13 (2,893.88) (2,893.88)
Taxes on Dividend 13 (598.82) (598.82)
Transfer to Preference Share Capital Redemption Reserve
13 360.85 (360.85) -
Conversion of Optionally Convertible Redeemable Preference share into Equity
13 0.51 623.33 623.84
Total Contribution by and distribution to owners
0.51 623.33 - 360.85 (3,853.55) - - (2,868.86)
Balance at March 31, 2017 701.48 9,618.56 4,910.28 6,060.85 37,194.68 2,230.67 247.70 60,964.22
CIN No. L17115RJ1960PLC008216
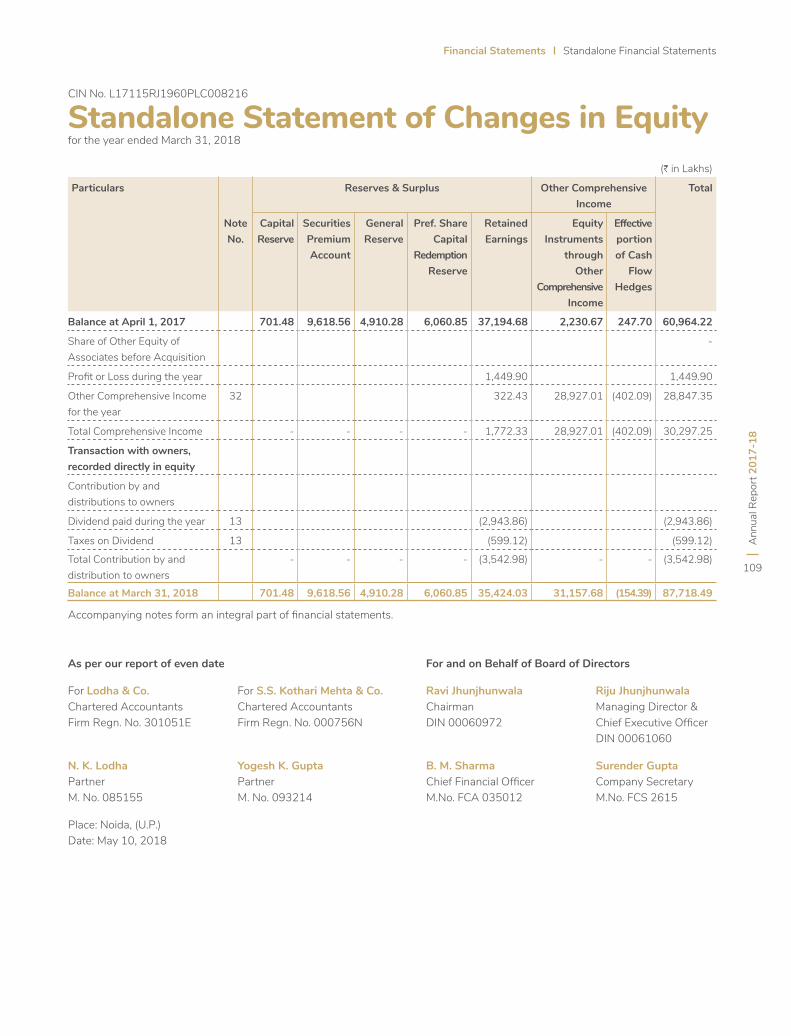
Financial Statements Standalone Financial Statements
Ann
ual R
epor
t 201
7-18
109
Standalone Statement of Changes in Equity for the year ended March 31, 2018
(H in Lakhs)
Particulars Reserves & Surplus Other Comprehensive Income
Total
Note No.
Capital Reserve
Securities Premium Account
General Reserve
Pref. Share Capital
Redemption Reserve
Retained Earnings
Equity Instruments
throughOther
ComprehensiveIncome
Effective portion of Cash
Flow Hedges
Balance at April 1, 2017 701.48 9,618.56 4,910.28 6,060.85 37,194.68 2,230.67 247.70 60,964.22
Share of Other Equity of Associates before Acquisition
-
Profit or Loss during the year 1,449.90 1,449.90
Other Comprehensive Income for the year
32 322.43 28,927.01 (402.09) 28,847.35
Total Comprehensive Income - - - - 1,772.33 28,927.01 (402.09) 30,297.25
Transaction with owners, recorded directly in equity
Contribution by and distributions to owners
Dividend paid during the year 13 (2,943.86) (2,943.86)
Taxes on Dividend 13 (599.12) (599.12)
Total Contribution by and distribution to owners
- - - - (3,542.98) - - (3,542.98)
Balance at March 31, 2018 701.48 9,618.56 4,910.28 6,060.85 35,424.03 31,157.68 (154.39) 87,718.49
As per our report of even date For and on Behalf of Board of Directors
For Lodha & Co. For S.S. Kothari Mehta & Co. Ravi Jhunjhunwala Riju JhunjhunwalaChartered Accountants Chartered Accountants Chairman Managing Director &Firm Regn. No. 301051E Firm Regn. No. 000756N DIN 00060972 Chief Executive Officer DIN 00061060
N. K. Lodha Yogesh K. Gupta B. M. Sharma Surender GuptaPartner Partner Chief Financial Officer Company SecretaryM. No. 085155 M. No. 093214 M.No. FCA 035012 M.No. FCS 2615
Place: Noida, (U.P.)Date: May 10, 2018
CIN No. L17115RJ1960PLC008216
Accompanying notes form an integral part of financial statements.
RSW
M L
imite
d
110
Notes to the Standalone Financial Statement for the year ended March 31, 2018
1. Company Overview and Accounting Policies
1.01 Company Overview
RSWM Limited (the “Company”) is a public limited company incorporated and domiciled in India and has its registered office at Kharigram, Gulabpura, district Bhilwara (Rajasthan, India). The Company has its primary listings on the BSE and NSE in India.
The Company is one of the largest textile manufacturing companies having multiple facilities to produce green fibre, yarn and fabric. The Company is primarily producing the best quality of yarns like synthetic, blended, mélange, cotton, speciality and value added yarns suitable for suitings, shirtings, hosiery, carpet, denim, technical textiles and industrial applications and denim fabric, synthetic fabric for renowned brands.
The financial statements of the Company for the year ended March 31, 2018 are approved for issue by the Company’s Board of Directors on May 10, 2018.
1.02 Basis of Preparation of Financial Statements
The financial statements are prepared in accordance with Indian Accounting Standards (Ind AS), as prescribed under section 133 of the Companies Act, 2013 (‘Act’) (to the extent notified) read with the Rules 3 of the Companies (Indian Accounting Standard) Rules 2015, as amended from time to time and guidelines issued by the Securities and Exchange Board of India (SEBI). The financial statements are prepared on going concern, accrual and historical cost basis except for the following assets and liabilities which have been measured at fair value:
• Defined benefit plans-plan assets measured at fair value.
• Assets classified as held for sale measured at fair value less cost to sell.
• Certain Financial Assets and Liabilities measured at Fair Value (including derivative financial instruments) (Refer Accounting policy 1.10 regarding financial instruments).
Accounting policies have been consistently applied except where a newly issued accounting standard is initially adopted or a revision to an existing accounting standard requires a change in the accounting policy hitherto in use.
The financial statements are presented in H which is also the Company’s functional currency and all values are rounded to the nearest H in Lakhs except where otherwise indicated.
(a) Use of Estimates
The preparation of the financial statements in conformity with Ind AS requires management to make estimates, judgments and assumptions. These estimates, judgments and assumptions affect the application of accounting policies and the reported amounts of assets and liabilities, the disclosures of contingent assets and liabilities at the date of the financial statements and reported amounts of revenues and expenses during the period. Application of accounting policies that require critical accounting estimates involving complex and subjective judgments and the use of assumptions in these financial statements have been disclosed in Note No. 2.
Accounting estimates could change from period to period. Actual results could differ from those estimates. Appropriate changes in estimates are made as management becomes aware of changes in circumstances surrounding the estimates. Changes in estimates are reflected in the financial statements in the period in which changes are made and, if material, their effects are disclosed in the notes to the financial statements.
(b) Classification of Assets and Liabilities as Current and Non-Current
All Assets and Liabilities have been classified as current or non-current. Based on the nature of product and activities of the Company and their realization in cash and cash equivalent, the Company has determined its operating cycle as 12 months for the purpose of current and non-current classification of assets and liabilities.
Deferred tax assets and deferred tax liabilities are classified as non-current assets and liabilities.
1.03 Revenue Recognition
Revenue is recognised to the extent that it is probable that the economic benefits will flow to the Company and the revenue can be reliably measured regardless of when the payment made.
The specific recognition criteria described below must also be met before revenue is recognised.
Sale of goods
Revenue from the sale of goods is recognised, when all the significant risks and rewards of ownership of the goods have passed to the buyer, the Company no longer retains continuing managerial involvement to the degree usually associated with ownership nor has effective control over the goods sold, the amount of revenue and costs associated with the transaction can be measured reliably and no significant uncertainty exists regarding the amount of consideration that will be derived from the sales of goods.
Financial Statements Standalone Financial Statements
Ann
ual R
epor
t 201
7-18
111
Notes to the Standalone Financial Statement for the year ended March 31, 2018
Revenue from the sale of goods is measured at the fair value of the consideration received or receivable, net of returns and allowances, trade discounts and volume rebates/claims etc. Sales includes Excise Duty (up to June 30, 2017) and excludes Value Added Tax/Sales Tax/GST.
Revenue from Services
Revenue from job work charges is recognised as per terms of the contract with customers based on stage of completion when the outcome of the transactions involving rendering of services can be estimated reliably.
Other Operating Income
Incentives on exports and other Government incentives related to operations are recognised in books after due consideration of certainty of utilization/receipt of such incentives. For Government Grant refer Para 1.04.
Interest income
Interest income on debt instruments measured at amortized cost is recorded using the Effective Interest Rate method (EIR).
EIR is the rate that exactly discounts the estimated future cash payments or receipts over the expected life of the financial instrument or a shorter period, where appropriate, to the gross carrying amount of the financial asset or to the amortised cost of a financial liability. While calculating the effective interest rate, the Company estimates the expected cash flows by considering all the contractual terms of the financial instrument (for example, prepayment, extension, call and similar options) but does not consider the expected credit losses. Interest income is included in other income in the statement of profit and loss.
Dividend Income
Dividend income is recognized in the statement of profit and loss when the right to receive payment is established, which is generally when shareholders approve the dividend.
Rental Income
Rental income arising from operating leases on investment properties is accounted for on a straight-line basis except where the rentals are structured to change in line with expected general inflation over the lease terms.
1.04 Government Grants and Government Assistance
Government grants/subsidies are recognised where there is reasonable assurance that the grant will be received and all attached conditions will be complied with. If the grants/subsidies relate to an expense item, they are recognised as income on
a systematic basis over the periods that the related costs, for which they are intended to compensate, are expensed.
The grants, whose primary condition requires the Company to purchase, construct or otherwise acquire long-term assets, are recognised as deferred income and they are recognised as income in equal amounts over the expected useful lives of the related assets. If the grants/subsidies are related to subvention a particular expense, deducted from that expense in the year of recognition of government grants/subsidies.
1.05 Inventory Valuation
Inventories including goods-in-transit are measured at lower of cost and net realizable value. However, raw material (Including packing material), and other items held for use in the production of inventories are not written down below cost if the finished products in which they will be incorporated are expected to be sold at or above cost.
Costs incurred in bringing each product to its present location and condition are accounted for as follows:-
Raw materials (including packing material) stores and spares and loose tools: cost includes cost of purchase and other costs incurred in bringing the inventories to their present location and condition. Cost is determined on weighted average basis.
Finished goods and work in progress: cost includes cost of direct materials and labour and a proportion of manufacturing overheads based on the normal operating capacity, but excluding borrowing costs. Cost is determined on weighted average cost basis.
Traded goods: cost includes cost of purchase and other costs incurred in bringing the inventories to their present location and condition. Cost is determined on weighted average basis.
Waste: is valued at net realisable value.
Net realisable value is the estimated selling price in the ordinary course of business, less estimated costs of completion and the estimated costs necessary to make the sale.
1.06 Property, Plant and Equipment
Recognition and measurement
Property, plant and equipment acquired are stated at original cost net of tax/duty credit availed, less accumulated depreciation and accumulated impairment losses, if any. Such cost includes the cost of replacing part of the plant and equipment and borrowing costs for long-term construction projects if the recognition criteria are met. The cost includes its purchase price, including import duties and non-refundable purchase taxes, after deducting trade discounts and rebates. It includes other
RSW
M L
imite
d
112
costs directly attributable to bringing the Property, Plant and Equipment to the location and condition necessary for it to be capable of operating in the manner intended by management.
The present value of the expected cost for the decommissioning of Property, Plant and Equipment after its use is included in the cost of the respective Property, Plant and Equipment if the recognition criteria for a provision are met.
Capital work-in-progress includes cost of property, plant and equipment under installation/under development as at the balance sheet date. Advances paid towards the acquisition of property, plant and equipment outstanding at each balance sheet date is classified as capital advances under other non-current assets and the cost of Property, Plant and Equipment not available for use before such date are disclosed under ‘Capital work-in-progress’
Subsequent expenditure
Subsequent expenditures relating to property, plant and equipment is capitalized only when it is probable that future economic benefits associated with these will flow to the Company and the costs of the item can be measured reliably. The cost and related accumulated depreciation are eliminated from the financial statements upon sale or retirement of the Property, Plant and Equipment and the resultant gain or losses are recognized in the statement of profit and loss.
Depreciation
Depreciation on Property, Plant and Equipment is calculated on a straight-line basis over the estimated useful life of Property, Plant and Equipment which coincide with Schedule II to the Companies Act, 2013. Estimated useful life of the assets is given below:
Building 5 to 60 yearsPlant and Equipment 3 to 30 yearsFurniture and Fixtures 10 yearsOffice Equipment 3 to 6 yearsVehicles 8 to 10 yearsElectrical Fittings 10 years
The Company has estimated the useful life different from life prescribed in Schedule II in the following cases:-
S. No.
Nature of Property, Plant and Equipment
Effective Useful Lives
1 Property, Plant and Equipment of Textile Division and Water Supply
9 years 2 months
2 Property, Plant and Equipment used in Power Generation
18 years
The Company, based on technical assessment/management estimate, depreciates all items of Property Plant and Equipment over estimated useful lives which may be different from the
useful life prescribed in Schedule II to the Companies Act, 2013. The management believes that these estimated useful lives are realistic and reflect fair approximation of the period over which the Property, Plant and Equipment are likely to be used.
De- recognition
An item of Property, Plant and Equipment and any of their significant part initially recognised, is derecognised upon disposal or when no future economic benefits are expected from its use or disposal. Any gain or loss arising on de-recognition of the asset (calculated as the difference between the net disposal proceeds and the carrying amount of the Property, Plant and Equipment) is included in the income statement when the Property, Plant and Equipment is derecognised. Depreciation on additions to or on disposal of Property, Plant and Equipment is calculated on pro-rata basis i.e. from (up to) the date on which the Property, Plant and Equipment is available for use (disposed off).
The Property, Plant and Equipment’s residual values, useful life and methods of depreciation are reviewed at each financial year end and adjusted prospectively, if appropriate. The useful lives and residual values are determined by the management at the time the Property, Plant and Equipment is acquired and reviewed periodically, including at each financial year end. These lives are based on historical experience with similar Property, Plant and Equipment as well as anticipation of future events.
Leased Assets
Leasehold lands are amortized over the period of lease, Buildings constructed on leasehold land are depreciated based on the useful life of 5 to 60 years, where the lease period of land is beyond the life of the building.
1.07 Investment Properties
Investment Property is property held either to earn rental income or capital appreciation or for both, but not for sale in the ordinary course of business, use in production or supply of goods or services or for administration purposes.
Recognition and measurement
Investment properties are measured initially at cost, including transaction costs. Subsequent to initial recognition, investment properties are stated at cost less accumulated depreciation and accumulated impairment loss, if any.
Depreciation
Depreciation is provided over the estimated useful life of the investment property lives which may be different from the useful life prescribed in Schedule II to the Companies Act, 2013.
Notes to the Standalone Financial Statement for the year ended March 31, 2018
Financial Statements Standalone Financial Statements
Ann
ual R
epor
t 201
7-18
113
De-recognition
Investment properties are derecognized either when they have been disposed of or when they are permanently withdrawn from use and no future economic benefit is expected from their disposal. The difference between the net disposal proceeds and the carrying amount of the asset is recognised in the statement of profit and loss in the period of de-recognition.
Though the Company measures investment property using cost based measurement, the fair value of investment property is disclosed in the notes. Fair values are determined by independent valuer who holds a recognised and relevant professional qualification and has recent experience in the location and category of investment being valued.
1.08 Intangible Assets
Recognition and measurement
An Intangible Assets is recognised when it is probable that the expected future economic benefits that are attributable to the asset will flow to the entity; and the cost of the asset can be measured reliably. All other expenditure is expensed as incurred.
Intangible assets acquired separately are measured on initial recognition at cost. Subsequent to initial recognition, intangible assets are carried at cost less any accumulated amortization and accumulated impairment losses.
The cost of a separately acquired intangible asset comprises of its purchase price, including import duties and non-refundable purchase taxes, after deducting trade discounts and rebates; and any directly attributable cost of preparing the asset for its intended use.
Internally generated intangibles, excluding capitalised development costs, are not capitalised and the related expenditure is reflected in the statement of profit and loss in the period in which the expenditure is incurred.
Goodwill acquired and/or arising upon business combinations initially recognized at cost and at subsequent period at cost less accumulated impairment loss, if any.
Amortization
The useful lives of intangible assets are assessed as either finite or indefinite. The amortisation period and the amortisation method for an intangible asset with a finite useful life are reviewed at least at the end of each reporting period. Changes in the expected useful life or the expected pattern of consumption of future economic benefits embodied in the asset are considered to modify the amortisation period or method, as appropriate, and are treated as changes in accounting estimates.
Intangible assets with finite lives are amortised over the useful economic life and assessed for impairment whenever there is an indication that the intangible asset may be impaired. The amortisation expense on intangible assets with finite lives is recognised in the statement of profit and loss unless such expenditure forms part of carrying value of another asset.
Intangible assets with indefinite useful lives are not amortised, but are tested for impairment annually, either individually or at the cash-generating unit level.
The estimated useful life of the finite intangible assets is given below:
S. no.
Nature of Assets Effective Useful Lives
Amortization method used
1. Intangible Assets acquired
6 years Amortized on a Straight Line Basis over the useful life2. Intangible Assets
being right to use18 years 4 months
An intangible asset is derecognised on disposal or when no future economic benefit is expected from use or disposal. Gains or losses arising from de-recognition of an intangible asset are measured as the difference between the net disposal proceeds and the carrying amount of the asset and are recognised in the statement of profit and loss when the asset is derecognised.
Research and development costs
Research costs are expensed as incurred. Development expenditures on an individual project are recognised as an intangible asset when the Company can demonstrate:
• The technical feasibility of completing the intangible asset so that the asset will be available for use or sale
• Its intention to complete and its ability and intention to use or sell the asset
• How the asset will generate future economic benefits
• The availability of resources to complete the asset
• The ability to measure reliably the expenditure during development
Following initial recognition of the development expenditure as an asset, the asset is carried at cost less any accumulated amortisation and accumulated impairment losses. Amortisation of the asset begins when development is complete and the asset is available for use. It is amortised over the period of expected future benefit. Amortisation expense is recognised in the statement of profit and loss unless such expenditure forms part of carrying value of another asset.
Notes to the Standalone Financial Statement for the year ended March 31, 2018
RSW
M L
imite
d
114
During the period of development, the asset is tested for impairment annually.
1.09 Leases
The determination of whether an arrangement is (or contains) a lease is based on the substance of the arrangement at the inception of the lease. The arrangement is, or contains, a lease if fulfilment of the arrangement is dependent on the use of a specific asset or assets and the arrangement conveys a right to use the asset or assets, even if that right is not explicitly specified in an arrangement.
Where the Company is the lessee
A lease is classified at the inception date as a finance lease or an operating lease. A lease that transfers substantially all the risks and rewards incidental to ownership to the Company is classified as a finance lease.
Finance leases are capitalised at the commencement of the lease at the inception date fair value of the leased property or, if lower, at the present value of the minimum lease payments. Lease payments are apportioned between finance charges and reduction of the lease liability so as to achieve a constant rate of interest on the remaining balance of the liability. Finance charges are recognised in finance costs in the statement of profit and loss, unless they are directly attributable to qualifying assets, in which case they are capitalized in accordance with the Company’s general policy on the borrowing costs.
A leased asset is depreciated over the useful life of the asset. However, if there is no reasonable certainty that the Company will obtain ownership by the end of the lease term, the asset is depreciated over the shorter of the estimated useful life of the asset and the lease term.
Operating lease payments are recognised as an expense in the statement of profit and loss on a straight-line basis over the lease term unless such payments are structured to increase in line with expected general inflation to compensate for the lessor expected inflationary cost increase. Lease Incentives received are recognised as an integral part of the total lease expense over the lease term.
Where the Company is the lessor
Leases in which the Company does not transfer substantially all the risks and rewards of ownership of an asset are classified as operating leases. Rental income from operating lease is recognised on a straight-line basis over the term of the relevant lease. Initial direct costs incurred in negotiating and arranging an operating lease are added to the carrying amount of the leased asset and recognised over the lease term on the same basis as
rental income. Contingent rents are recognised as revenue in the period in which they are earned.
Leases are classified as finance leases when substantially all of the risks and rewards of ownership transfer from the Company to the lessee. Amounts due from lessees under finance leases are recorded as receivables at the Company’s net investment in the leases. Finance lease income is allocated to accounting periods so as to reflect a constant periodic rate of return on the net investment outstanding in respect of the lease.
1.10 Financial Instruments
A financial instrument is any contract that gives rise to a financial asset of one entity and a financial liability or equity instrument of another entity.
Financial assets
Initial recognition and measurement
All financial assets are recognised initially at fair value plus, in the case of financial assets not recorded at fair value through the statement of profit and loss, transaction costs that are attributable to the acquisition of the financial asset. Purchases or sales of financial assets that require delivery of assets within a time frame established by regulation or convention in the market place (regular way trades) are recognised on the trade date, i.e., the date that the Company commits to purchase or sell the asset.
Subsequent measurement
For purposes of subsequent measurement, financial assets are classified in below mentioned categories:
• Financial assets carried at amortised cost-debt
• Financial assets at fair value through other comprehensive income –equity
• Financial assets at fair value through other comprehensive income –debt
• Financial assets at fair value through the statement of profit and loss
(i) Financial assets carried at amortised cost-debt
A financial asset is subsequently measured at amortised cost if it is held within a business model whose objective is to hold the asset in order to collect contractual cash flows and the contractual terms of the financial asset give rise on specified dates to cash flows that are solely payments of principal and interest on the principal amount outstanding.
(ii) Financial assets at fair value through other comprehensive income –equity
Notes to the Standalone Financial Statement for the year ended March 31, 2018
Financial Statements Standalone Financial Statements
Ann
ual R
epor
t 201
7-18
115
The Company measures all its equity investments except for investment in associates at fair value. Where the Company’s management has opted to present fair value gain and losses on equity investments in other comprehensive income, there is no subsequent reclassification of fair value gains and losses to the statement of profit and loss. Dividend income from such investments is recognized in the statement of profit and loss as other income when the Company’s right to receive payments is established.
(iii) Financial assets at fair value through other comprehensive income –debt
A ‘debt instrument’ is classified as at the FVTOCI if both of the following criteria are met:
a) The objective of the business model is achieved both by collecting contractual cash flows and selling the financial assets, and
b) The asset’s contractual cash flows represent SPPI.
Debt instruments included within the FVTOCI category are measured initially as well as at each reporting date at fair value. Fair value movements are recognized in the other comprehensive income (OCI). However, the Company recognizes interest income, impairment losses and reversals and foreign exchange gain or loss in the statement of profit and loss. On de-recognition of the asset, cumulative gain or loss previously recognised in OCI is reclassified from the equity to statement of profit and loss account. Interest earned whilst holding FVTOCI debt instrument is reported as interest income using the EIR method.
(iv) Financial assets at fair value through the statement of profit and loss
A financial asset which is not classified in any of the above categories are subsequently fair valued through the statement of profit and loss.
Trade Receivable
A Receivable is classified as a ‘trade receivable’ if it is in respect to the amount due from customers on account of goods sold or services rendered in the ordinary course of business. Trade receivables are recognised initially at fair value and subsequently measured at amortised cost using the effective interest method, less provision for impairment. For some trade receivables the Company may obtain security in the form of guarantee, security deposit or letter of credit which can be called upon if the counterparty is in default under the terms of the agreement. Subsequent recoveries of amounts previously written off are credited to other Income.
De-recognition
The Company derecognizes a financial asset when the contractual rights to receive the cash flows from the financial asset expire or it transfers the financial asset and the transfer qualifies for de-recognition under Ind AS 109.
Impairment of Financial Assets
The Company recognizes loss allowances using the expected credit loss (ECL) model for the financial assets which are not fair valued through the statement of profit and loss. Loss allowance for trade receivables with no significant financing component is measured at an amount equal to lifetime ECL. For all other financial assets, expected credit losses are measured at an amount equal to the 12-month ECL, unless there has been a significant increase in credit risk from initial recognition in which case those are measured at lifetime ECL. The amount of expected credit losses (or reversal) that is required to adjust the loss allowance at the reporting date to the amount that is required to be recognized is recognized as an impairment gain or loss in the statement of profit and loss.
Financial liabilities
Initial recognition and measurement
All financial liabilities are recognized initially at fair value and, in the case of loans and borrowings and payables, net of directly attributable transaction costs.
The Company’s financial liabilities include trade and other payables, loans and borrowings including bank overdrafts and derivative financial instruments.
Subsequent Measurement
The measurement of financial liabilities depends on their classification, as described below:
(a) Loans and borrowings
After initial recognition, interest-bearing loans and borrowings are subsequently measured at amortized cost using the EIR method. Gains and losses are recognized in the statement of profit and loss when the liabilities are derecognized as well as through the EIR amortization process.
Amortized cost is calculated by taking into account any discount or premium on acquisition and fees or costs that are an integral part of the EIR. The EIR amortization is included as finance costs in the statement of profit and loss.
Notes to the Standalone Financial Statement for the year ended March 31, 2018
RSW
M L
imite
d
116
(b) Trade and other payables.
A payable is classified as ’trade payable’ if it is in respect of the amount due on account of goods purchased or services received in the normal course of business. These amounts represent liabilities for goods and services provided to the Company prior to the end of financial year which are unpaid. Trade and other payables are presented as current liabilities unless payment is not due within 12 months after the reporting period. They are recognised initially at their fair value and subsequently measured at amortised cost using the effective interest method.
(c) Financial guarantee contracts
Financial guarantee contracts issued by the Company are those contracts that require a payment to be made to reimburse the holder for a loss it incurs because the specified debtor fails to make a payment when due in accordance with the terms of a debt instrument. If material, financial guarantee contracts are recognised initially as a liability at fair value, adjusted for transaction costs that are directly attributable to the issuance of the guarantee. Subsequently, the liability is measured at the higher of the amount of loss allowance determined as per impairment requirements of Ind-AS 109 and the amount recognised less cumulative amortization.
De-recognition
A Financial Liability is de-recognized when the obligation under the liability is discharged or cancelled or expires. The difference between the carrying amount of a financial liability that has been extinguished or transferred to another party and the consideration paid, including any non-cash assets transferred or liabilities assumed, is recognised in the statement of profit and loss as other income or finance costs.
Embedded derivative
An embedded derivative is a component of a hybrid (combined) instrument that also includes a non-derivative host contract – with the effect that some of the cash flows of the combined instrument vary in a way similar to a stand- alone derivative. An embedded derivative causes some or all of the cash flows that otherwise would be required by the contract to be modified according to a specified interest rate, financial instrument price, commodity price, foreign exchange rate, index of prices or rates, credit rating or credit index, or other variable, provided in the case of a non-financial variable that the variable is not specific to a party to the contract.
If the hybrid contract contains a host that is a financial asset within the scope Ind-AS 109, the Company does not separate embedded derivatives. Rather, it applies the classification requirements contained in Ind-AS 109 to the entire hybrid contract. Derivatives embedded in all other host contracts are
accounted for as separate derivatives and recorded at fair value if their economic characteristics and risks are not closely related to those of the host contracts and the host contracts are not held for trading or designated at fair value though the statement of profit and loss. These embedded derivatives are measured at fair value with changes in fair value recognized in the statement of profit and loss, unless designated as effective hedging instruments.
Reclassification of financial assets and financial liabilities
The Company determines classification of financial assets and liabilities on initial recognition. After initial recognition, no reclassification is made for financial assets which are equity instruments and financial liabilities. For financial assets which are debt instruments, a reclassification is made only if there is a change in the business model for managing those assets. Changes to the business model are expected to be infrequent. The Company’s senior management determines change in the business model as a result of external or internal changes which are significant to the Company’s operations. Such changes are evident to external parties. A change in the business model occurs when the Company either begins or ceases to perform an activity that is significant to its operations. If the Company reclassifies financial assets, it applies the reclassification prospectively from the reclassification date which is the first day of the immediately next reporting period following the change in business model. The Company does not restate any previously recognised gains, losses (including impairment gains or losses) or interest.
Offsetting of financial instruments
Financial assets and financial liabilities are offset and the net amount is reported in the balance sheet if there is a currently enforceable legal right to offset the recognised amounts and there is an intention to settle on a net basis, to realize the assets and settle the liabilities simultaneously.
1.11 Impairment of Non-Financial Assets
Intangible assets, property, plant and equipment and associate measured at cost and other non-financial assets are evaluated for recoverability whenever events or changes in circumstances indicate that their carrying amounts may not be recoverable. For the purpose of impairment testing, the recoverable amount (i.e. the higher of the fair value less cost to sell and the value-in-use) is determined on an individual asset basis unless the asset does not generate cash flows that are largely independent of those from other assets. In such cases, the recoverable amount is determined for the Cash Generating Unit (CGU) to which the asset belongs. If such assets are considered to be impaired, the impairment to be recognized in the statement of profit and loss is measured by the amount by which the carrying value of the assets exceeds the estimated recoverable amount of the asset.
Notes to the Standalone Financial Statement for the year ended March 31, 2018
Financial Statements Standalone Financial Statements
Ann
ual R
epor
t 201
7-18
117
An impairment loss is reversed in the statement of profit and loss if there has been a change in the estimates used to determine the recoverable amount. The carrying amount of the asset is increased to its revised recoverable amount, provided that this amount does not exceed the carrying amount that would have been determined (net of any accumulated amortization or depreciation) had no impairment loss been recognized for the asset in prior years.
1.12 Foreign Exchange Transactions/Translations
The Company’s financial statements are presented in Indian Rupees which is the Company’s functional currency.
Transactions and balances
Foreign currency transactions are recorded, on initial recognition in the functional currency, by applying to the foreign currency amount the spot exchange rate between the functional currency and the foreign currency at the date of the transaction.
Monetary assets and liabilities denominated in foreign currencies (except financial instruments designated as Hedge Instruments) are translated at the functional currency spot rates of exchange at the reporting date.
Exchange differences arising on settlement or translation of monetary items are recognised in the statement of profit and loss with the exception of the following:
Monetary items that are designated as part of the cash flow hedge instrument are recognised in OCI.
Non-monetary items that are measured in terms of historical cost in a foreign currency are translated using the exchange rates at the dates of the initial transactions. The gain or loss arising on translation of non-monetary items measured at fair value is treated in line with the recognition of the gain or loss on the change in fair value of the item (i.e., translation differences on items whose fair value gain or loss is recognised in OCI or the statement of profit and loss are also recognised in OCI or the statement of profit and loss, respectively).
Derivative Financial Instruments and Hedge Accounting
The Company uses derivative instruments i.e. Forward contracts to hedge its foreign currency risks. The Company designates these forward contracts as cash flow hedges to mitigate the risk of foreign exchange exposure on highly probable forecast cash transactions. The Company has designated forward instruments on spot to spot basis. The Company recognises the forward points in the statement of profit and loss accounts.
When a derivative is designated as a cash flow hedging instrument, the effective portion of changes in the fair value of the derivative is recognized in other comprehensive income
and accumulated in the cash flow hedging reserve. Any ineffective portion of changes in the fair value of the derivative is recognized immediately in the statement of profit and loss. If the hedging instrument no longer meets the criteria for hedge accounting, then hedge accounting is discontinued prospectively. If the hedging instrument expires or is sold, terminated or exercised, the cumulative gain or loss on the hedging instrument recognized in cash flow hedging reserve till the period the hedge was effective remains in cash flow hedging reserve until the forecasted transaction occurs. The cumulative gain or loss previously recognized in the cash flow hedging reserve is transferred in the statement of profit and loss upon the occurrence of the related forecasted transaction. If the forecasted transaction is no longer expected to occur, then the amount accumulated in cash flow hedging reserve is reclassified in the statement of profit and loss.
1.13 Employee Benefits
(a) Short Term Employee Benefit
Short-term employee benefit obligations are measured on undiscounted basis and are expensed as the related service is provided. A liability is recognised for the amount expected to be paid if the Company has a present legal or constructive obligation to pay this amount as a result of past service provided by the employee and the obligation can be estimated reliably.
(b) Defined Contribution Plan
The Company makes defined contribution to Employees Provident Fund Organisation (EPFO), Pension Fund, Superannuation Fund and Employees State Insurance (ESI), which are accounted on accrual basis as expenses in the statement of Profit and Loss in the period during which the related services are rendered by employees.
Prepaid contribution are recognised as an assets to the extent that a cash refund or reduction in future payments is available.
(c) Defined Benefit Plan
The Company’s net obligation in respect of defined benefit plans is calculated separately for each plan by estimating the amount of future benefit that employees have earned in the current and prior periods, discounting that amount and deducting the fair value of any plan assets.
The calculation of defined benefit obligations is performed annually by a qualified actuary using the projected unit credit method. When the calculation results in a potential asset for the Company, the recognised asset is limited to the present value of economic benefits available in the form of any future refunds from the plan or reductions in future contributions to the plan.
Notes to the Standalone Financial Statement for the year ended March 31, 2018
RSW
M L
imite
d
118
In order to calculate the present value of economic benefits, consideration is given to any applicable minimum funding requirements.
Remeasurement of the net defined benefit liability, which comprise actuarial gains and losses, the return on plan assets (excluding interest) and the effect of the asset ceiling (if any, excluding interest), are recognised immediately in Other Comprehensive Income. Net interest expense (income) on the net defined liability (assets) is computed by applying the discount rate, used to measure the net defined liability (asset), to the net defined liability (asset) at the start of the financial year after taking into account any changes as a result of contribution and benefit payments during the year. Net interest expense and other expenses related to defined benefit plans are recognised in the statement of profit and loss.
When the benefits of a plan are changed or when a plan is curtailed, the resulting change in benefit that relates to past service or the gain or loss on curtailment is recognised immediately in the statement of profit and loss. The Company recognises gains and losses on the settlement of a defined benefit plan when the settlement occurs.
In the case of one location, the Company has set up a trust for Contributions to provident fund, a defined benefit plan, in which the Company contributes as specified under the law. The Company is liable for future provident fund benefits to the extent of its annual contribution and any shortfall in fund assets based on government specified minimum rates of return relating to current period service and recognises such contributions and shortfall, if any, as an expense in the year of recognition.
(d) Other long-term employee benefits
The Company’s net obligation in respect of long-term employee benefits is the amount of future benefit that employees have earned in return for their service in the current and prior periods. That benefit is discounted to determine its present value and fair value of any related assets is deducted. The liability for other long term employee benefits are provided based on actuarial valuation as at the Balance Sheet date, based on Projected Unit Credit Method, carried out by an independent actuary. Re-measurements are recognised in the statement of profit and loss in the period in which they arise.
(e) Termination benefits
Termination benefits are recognized as an expense in the period in which they are incurred. The Company recognises a liability and expense for termination benefits at the earlier of the following dates:
(a) When the entity can no longer withdraw the offer of those benefits; and
(b) When the entity recognises costs for a restructuring that is within the scope of Ind AS 37 and involves the payment of termination benefits.
If the benefits are not expected to be settled wholly within twelve months of the reporting date, then they are discounted to present value.
1.14 Taxes on Income
Current income tax
Current income-tax is measured at the amount expected to be paid to the tax authorities in accordance with the Income-tax Act, 1961 enacted in India and tax laws prevailing in the respective tax jurisdictions where the Company operates. The tax rates and tax laws used to compute the amount are those that are enacted or substantively enacted, at the reporting date.
Current income tax relating to items recognised outside the statement of profit and loss is recognised outside the statement of profit and loss (either in other comprehensive income or in equity). Current tax items are recognised in correlation to the underlying transaction either in OCI or directly in equity. Management periodically evaluates positions taken in the tax returns with respect to situations in which applicable tax regulations are subject to interpretation and establishes provisions where appropriate.
Deferred tax
Deferred tax is provided using the liability method on temporary differences between the tax bases of assets and liabilities and their carrying amounts for financial reporting purposes at the reporting date.
Deferred tax liabilities are recognised for all taxable temporary differences, except:
• When the deferred tax liability arises from the initial recognition of goodwill or an asset or liability in a transaction that is not a business combination and, at the time of the transaction, affects neither the accounting profit nor taxable profit or loss.
• In respect of taxable temporary differences associated with investments in associates, when the timing of the reversal of the temporary differences can be controlled and it is probable that the temporary differences will not reverse in the foreseeable future.
Deferred tax assets are recognised for all deductible temporary differences, the carry forward of unused tax credits and any unused
Notes to the Standalone Financial Statement for the year ended March 31, 2018
Financial Statements Standalone Financial Statements
Ann
ual R
epor
t 201
7-18
119
tax losses. Deferred tax assets are recognised to the extent that it is probable that taxable profit will be available against which the deductible temporary differences, and the carry forward of unused tax credits and unused tax losses can be utilised, except:
• When the deferred tax asset relating to the deductible temporary difference arises from the initial recognition of an asset or liability in a transaction that is not a business combination and, at the time of the transaction, affects neither the accounting profit nor taxable profit or loss.
• In respect of deductible temporary differences associated with investments in associates, deferred tax assets are recognised only to the extent that it is probable that the temporary differences will reverse in the foreseeable future and taxable profit will be available against which the temporary differences can be utilised.
The carrying amount of deferred tax assets is reviewed at each reporting date and reduced to the extent that it is no longer probable that sufficient taxable profit will be available to allow all or part of the deferred tax asset to be utilised. Unrecognised deferred tax assets are re-assessed at each reporting date and are recognised to the extent that it has become probable that future taxable profits will allow the deferred tax asset to be recovered.
Deferred tax assets and liabilities are measured at the tax rates that are expected to apply in the year when the asset is realised or the liability is settled, based on tax rates (and tax laws) that have been enacted or substantively enacted at the reporting date.
Deferred tax relating to items recognised outside the statement of profit and loss is recognised outside the statement of profit and loss (either in other comprehensive income or in equity). Deferred tax items are recognised in correlation to the underlying transaction either in OCI or directly in equity.
Deferred tax assets and deferred tax liabilities are offset if a legally enforceable right exists to set off current tax assets against current tax liabilities and the deferred taxes relate to the same taxable entity and the same taxation authority.
Deferred tax assets include Minimum Alternative Tax (MAT) paid in accordance with the tax laws in India, which is likely to give future economic benefits in the form of availability of set off against future income tax liability. Accordingly, MAT is recognised as deferred tax asset in the statement of financial position when the asset can be measured reliably and it is probable that the future economic benefit associated with the asset will be realised.
1.15 Provisions, Contingent Liabilities and Contingent Assets
Provisions are recognised when the Company has a present obligation (legal or constructive) as a result of a past event, it
is probable that an outflow of resources embodying economic benefits will be required to settle the obligation and a reliable estimate can be made of the amount of the obligation. When the Company expects some or all of a provision to be reimbursed, for example, under an insurance contract, the reimbursement is recognised as a separate asset, but only when the reimbursement is virtually certain. The expense relating to a provision is presented in the statement of profit and loss net of any reimbursement.
If the effect of the time value of money is material, provisions are discounted using a current pre-tax rate that reflects, when appropriate, the risks specific to the liability. When discounting is used, the increase in the provision due to the passage of time is recognised as a finance cost.
Contingent Liability is disclosed after careful evaluation of facts, uncertainties and possibility of reimbursement, unless the possibility of an outflow of resources embodying economic benefits is remote. Contingent liabilities are not recognised but are disclosed in notes.
Contingent assets are not recognised. However, when the realisation of income is virtually certain, then the related asset is no longer a contingent asset, but it is recognised as an asset.
1.16 Segment Reporting
The Chief Operational Decision Maker monitors the operating results of its business Segments separately for the purpose of making decisions about resource allocation and performance assessment. Segment performance is evaluated based on profit or loss and is measured consistently with the profit or loss in the financial statements.
The Operating Segments have been identified on the basis of the nature of products/services.
a) Segment revenue includes sales and other income directly identifiable with/allocable to the segment including inter-segment revenue.
b) Expenses that are directly identifiable with/allocable to segments are considered for determining the segment results. Expenses which relate to the Company as a whole and not allocable to segments are included under un-allocable expenditure.
c) Income which relates to the Company as a whole and not allocable to segments is included in un-allocable income.
d) Segment result includes margin on inter-segment sales which are reduced in arriving at the profit before tax of the Company.
e) Segment assets and liabilities include those directly identifiable with the respective segments. Un-allocable assets
Notes to the Standalone Financial Statement for the year ended March 31, 2018
RSW
M L
imite
d
120
and liabilities represent the assets and liabilities that relate to the Company as a whole and not allocable to any segment.
Inter-Segment transfer pricing
Segment revenue resulting from transactions with other business segments is accounted on the basis of transfer price agreed between the segments. Such transfer prices are either determined to yield a desired margin or agreed on a negotiated basis and are on an arm’s length basis in a manner similar to transactions with third parties.
These transfers are eliminated in consolidation.
1.17 Earning Per Share
Basic earnings per equity share is computed by dividing the net profit attributable to the equity holders of the Company by the weighted average number of equity shares outstanding during the period. Diluted earnings per equity share is computed by dividing the net profit attributable to the equity holders of the Company by the weighted average number of equity shares considered for deriving basic earnings per equity share and also the weighted average number of equity shares that could have been issued upon conversion of all dilutive potential equity shares. The dilutive potential equity shares are adjusted for the proceeds receivable had the equity shares been actually issued at fair value (i.e. the average market value of the outstanding equity shares). Dilutive potential equity shares are deemed converted as of the beginning of the period, unless issued at a later date. Dilutive potential equity shares are determined independently for each period presented. The number of equity shares and potentially dilutive equity shares are adjusted retrospectively for all periods presented for any share splits and bonus shares issues including for changes effected prior to the approval of the financial statements by the Board of Directors.
1.18 Cash Flow Statement
Cash flows are reported using the indirect method, whereby profit for the period is adjusted for the effects of transactions of a non-cash nature, any deferrals or accruals of past or future operating cash receipts or payments and item of income or expenses associated with investing or financing cash flows. The cash flows from operating, investing and financing activities of the Company are segregated.
1.19 Borrowing Costs
Borrowing costs directly attributable to the acquisition, construction or production of an asset that necessarily takes a
substantial period of time to get ready for its intended use or sale are capitalised as part of the cost of the asset. All other borrowing costs are expensed in the period in which they occur. Borrowing costs consist of interest and other costs that an entity incurs in connection with the borrowing of funds. Borrowing cost also includes exchange differences to the extent regarded as an adjustment to the borrowing costs.
1.20 Fair Value Measurement
The Company measures financial instruments, such as, derivatives at fair value at each balance sheet date.
Fair value is the price that would be received to sell an asset or paid to transfer a liability in an orderly transaction between market participants at the measurement date. The fair value measurement is based on the presumption that the transaction to sell the asset or transfer the liability takes place either:
• In the principal market for the asset or liability, or
• In the absence of a principal market, in the most advantageous market for the asset or liability and the Company has access to the principal or the most advantageous market.
The fair value of an asset or a liability is measured using the assumptions that market participants would use when pricing the asset or liability, assuming that market participants act in their economic best interest.
A fair value measurement of a non-financial asset takes into account a market participant’s ability to generate economic benefits by using the asset in its highest and best use or by selling it to another market participant that would use the asset in its highest and best use.
The Company uses valuation techniques that are appropriate in the circumstances and for which sufficient data are available to measure fair value, maximising the use of relevant observable inputs and minimising the use of unobservable inputs.
All assets and liabilities for which fair value is measured or disclosed in the financial statements are categorised within the fair value hierarchy, described as follows, based on the lowest level input that is significant to the fair value measurement as a whole:
Level 1 - Quoted (unadjusted) market prices in active markets for identical assets or liabilities.
Level 2 - Valuation techniques for which the lowest level input that is significant to the fair value measurement is directly or indirectly observable.
Level 3 - Valuation techniques for which the lowest level input that is significant to the fair value measurement is unobservable.
Notes to the Standalone Financial Statement for the year ended March 31, 2018
Financial Statements Standalone Financial Statements
Ann
ual R
epor
t 201
7-18
121
For assets and liabilities that are recognised in the financial statements on a recurring basis, the Company determines whether transfers have occurred between levels in the hierarchy by re-assessing categorisation (based on the lowest level input that is significant to the fair value measurement as a whole) at the end of each reporting period.
For the purpose of fair value disclosures, the Company has determined classes of assets and liabilities on the basis of the nature, characteristics and the risks of the asset or liability and the level of the fair value hierarchy as explained above. This note summarises accounting policy for fair value. Other fair value related disclosures are given in the relevant notes.
1.21 Cash and Cash Equivalents
Cash and cash equivalents in the balance sheet comprise cash at banks and on hand, short-term deposits and other short-term highly liquid investments with an original maturity of three months or less that are readily convertible to a known amount of cash and are subject to an insignificant risk of changes in value and are held for the purpose of meeting short-term cash commitments.
For the purposes of the presentation of cash flow statement, cash and cash equivalents include cash on hand, in banks and demand deposits with banks, net of outstanding bank overdrafts that are repayable on demand, book overdraft as they being considered as integral part of the Company’s cash management system.
1.22 Non-Current Assets Held for Sale
The Company classifies non-current assets and disposal groups as held for sale if their carrying amounts will be recovered principally through a sale/distribution rather than through continuing use and the sale is considered highly probable. Management is committed to the sale within one year from the date of classification.
The Company treats sale/distribution of the asset or disposal group to be highly probable when:
• The appropriate level of management is committed to a plan to sell the asset (or disposal group),
• An active programme to locate a buyer and complete the plan has been initiated (if applicable),
• The asset (or disposal group) is being actively marketed for sale at a price that is reasonable in relation to its current fair value.
• The sale is expected to qualify for recognition as a completed sale within one year from the date of classification, and
• Actions required to complete the plan indicated that it is unlikely that significant changes to the plan will be made or that the plan will be withdrawn.
Non-current asset held for sale/for distribution to owners and disposal groups are measured at the lower of their carrying amount and the fair value less costs to sell/distribute. Assets and liabilities classified as held for sale/distribution are presented separately in the balance sheet.
Property, plant and equipment and intangible assets once classified as held for sale/distribution to owners are neither depreciated nor amortized.
1.23 Investments in Associates
An associate is an entity over which the Company has significant influence. Significant influence is the power to participate in the financial and operating policy decisions of the investee but is not control or joint control over those policies. The investment in associates are carried at cost less impairments. The cost comprises price paid to acquire investment and directly attributable cost.
2. Use of Critical Judgments, Estimates and Assumptions
The preparation of the Company’s financial statements requires management to make judgments, estimates and assumptions that affect the reported amounts of revenues, expenses, assets and liabilities, the accompanying disclosures, and the disclosure of contingent liabilities.
The key assumptions concerning the future and other key sources of estimation uncertainty at the reporting date, that have a significant risk of causing a material adjustment to carrying amounts of assets and liabilities within the next financial years are described below. The Company based its assumptions and estimates or parameters available when the financial statements were prepared. Existing circumstances and assumptions about future developments, however, may change due to market changes or circumstances arising that are beyond the control of the Company. Such changes are reflected in the assumptions when they occur.
(a) Property, Plant and Equipment and Intangible assets
Internal technical or user team assesses the remaining useful life of the Property, Plant and Equipment and Intangible assets. Management believes that assigned useful lives are reasonable.
(b) Embedded Lease
In assessing the applicability to arrangement entered into by the Company, the management has exercised the judgment to evaluate the right to use the asset or assets on substance of the transaction including legally enforced arrangement and other significant terms of the contract to conclude whether the arrangement meets the criteria under Appendix C of the Ind AS 17.
Notes to the Standalone Financial Statement for the year ended March 31, 2018
RSW
M L
imite
d
122
(c) Impairment of non-financial assets
In assessing value in use, the estimated future cash flows are discounted to their present value using a pre-tax discount rate that reflects current market assessments of the time value of money and the risks specific to the asset.
In determining fair value less costs of disposal, recent market transactions are taken into account. If no such transactions can be identified, an appropriate valuation model is used. These calculations are corroborated by valuation multiples, quoted share prices for publicly traded companies or other available fair value indicators.
(d) Impairment of financial assets
The impairment provisions for financial assets are based on assumptions about risk of default and expected loss rates. The Company uses judgement in making assumption and selecting the inputs to the impairment calculation, based on Company’s past history, existing market conditions as well as forward estimate at the end of each reporting period.
(e) Investment in associates
As per Ind AS 28, an entity is considered as an associate when the investing Company has significant influence over the entity. The existence of significant influence by an investor is determined based on factors such as, representation on the board of directors or equivalent governing body of investee, participation in policy-making processes, including participation in decisions about dividends or other distributions, material transactions between the entity and it’s investee, interchange of managerial personnel or provision of essential technical information. The Company holds 17.78% (which is less than 20 %) of the equity shares of Bhilwara Energy Limited (BEL). As the amount invested in BEL is significant, the board of directors regularly reviews the progress of the BEL and suggestion/comments/concerns of the board of Company are conveyed to the board of directors of BEL by common directors. In order to monitor the progress of BEL, the board of directors has decided to nominate at least one director on the board of BEL. In Light of above, the board of directors have concluded that, the Company has a significant influence on BEL. Other than BEL, the Company holds 26% of equity shares in LNJ Power Ventures Ltd and 40.66% of equity shares in LNJ Skills and Rozgar Pvt. Ltd and therefore both of these companies have also been termed as associates of the Company.
(f) Assets Held for sale
Management’s Judgment is required for identifying the assets which are classified as held for sale if their carrying amount will be recovered principally through a sale transaction rather than through continuing use. This condition is regarded as met only when the asset is available for immediate sale in its present condition subject only to terms that are usual and customary for sales of such asset and its sale is highly probable which could lead to significant judgment. Management is committed to the sale, which should be expected to qualify for recognition as a completed sale within one year from the date of classification.
(g) Income taxes
Management’s judgment is required for the calculation of provision for income taxes and deferred tax assets and liabilities. The Company reviews at each balance sheet date the carrying amount of deferred tax assets. The factors used in estimates may differ from actual outcome which could lead to significant adjustment to the amounts reported in the financial statements.
(h) Contingencies
Management’s judgment is required for estimating the possible outflow of resources, if any, in respect of contingencies/claim/litigations against the Company as it is not possible to predict the outcome of pending matters with accuracy.
(i) Defined Benefit Plans
The cost of the defined benefit plans and other post-employment benefits and the present value of such obligations are determined using actuarial valuations. An actuarial valuation involves making various assumptions that may differ from actual developments in future. These Include the determination of the discount rate, future salary increases, mortality rates and attrition rate. Due to the complexities involved in the valuation and its long-term nature, a defined benefit obligation is highly sensitive to changes in these assumptions. All assumptions are reviewed at each reporting date.
( j) Insurance claims
Insurance claims are recognized when the Company has reasonable certainty of recovery. Subsequently any change in recoverability is provided for.
Notes to the Standalone Financial Statement for the year ended March 31, 2018
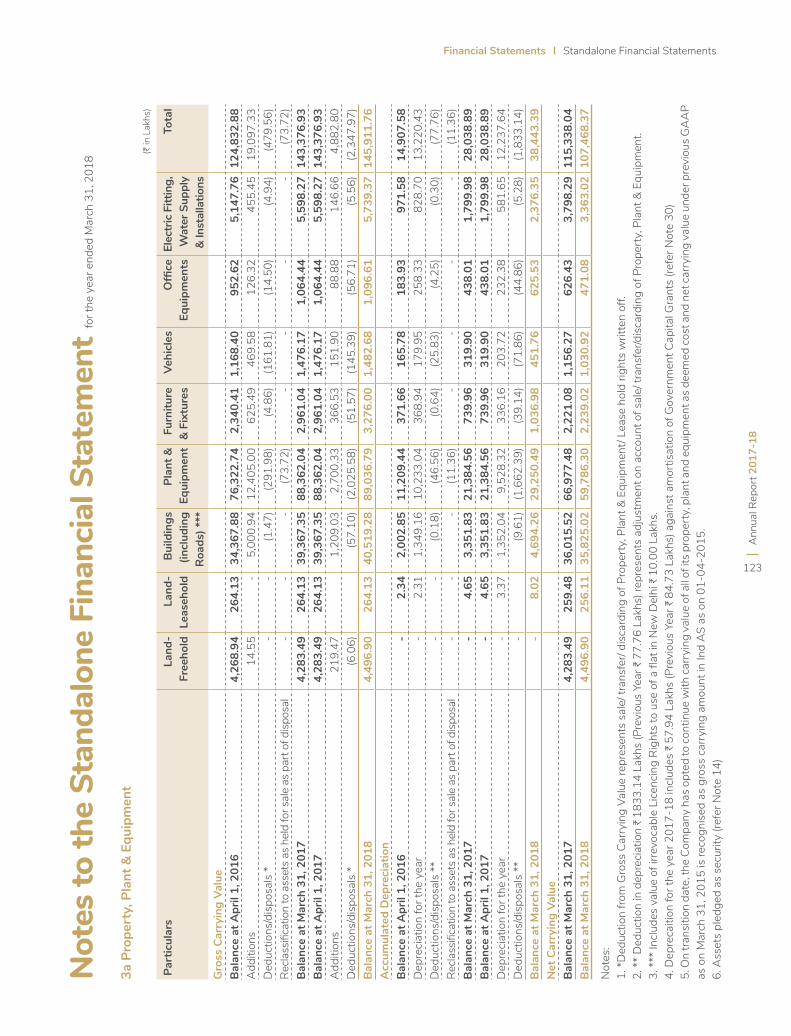
Financial Statements Standalone Financial Statements
Ann
ual R
epor
t 201
7-18
123
Not
es to
the
Stan
dalo
ne F
inan
cial
Sta
tem
ent f
or th
e ye
ar e
nded
Mar
ch 3
1, 2
018
3a P
rope
rty,
Pla
nt &
Equ
ipm
ent
(H in
Lak
hs)
Part
icul
ars
Land
-Fr
eeho
ldLa
nd-
Leas
ehol
dB
uild
ings
(in
clud
ing
Roa
ds) *
**
Plan
t &
Equi
pmen
tFu
rnitu
re
& F
ixtu
res
Vehi
cles
Offi
ce
Equi
pmen
tsEl
ectr
ic F
ittin
g,
Wat
er S
uppl
y &
Inst
alla
tions
Tota
l
Gro
ss C
arry
ing
Valu
e B
alan
ce a
t Apr
il 1,
201
6 4
,268
.94
264
.13
34,
367.
88
76,
322.
74
2,3
40.4
1 1
,168
.40
952
.62
5,1
47.7
6 12
4,83
2.88
A
dditi
ons
14.
55
- 5
,000
.94
12,
405.
00
625
.49
469
.58
126
.32
455
.45
19,
097.
33
Ded
uctio
ns/d
ispo
sals
* -
- (1
.47)
(291
.98)
(4.8
6) (1
61.8
1) (1
4.50
) (4
.94)
(479
.56)
Recla
ssifi
catio
n to
ass
ets
as h
eld
for s
ale
as p
art o
f disp
osal
- -
- (7
3.72
) -
- -
- (7
3.72
)B
alan
ce a
t Mar
ch 3
1, 2
017
4,2
83.4
9 2
64.1
3 3
9,36
7.35
8
8,36
2.04
2
,961
.04
1,4
76.1
7 1
,064
.44
5,5
98.2
7 14
3,37
6.93
B
alan
ce a
t Apr
il 1,
201
7 4
,283
.49
264
.13
39,
367.
35
88,
362.
04
2,9
61.0
4 1
,476
.17
1,0
64.4
4 5
,598
.27
143,
376.
93
Add
ition
s 2
19.4
7 1
,209
.03
2,7
00.3
3 3
66.5
3 1
51.9
0 8
8.88
1
46.6
6 4
,882
.80
Ded
uctio
ns/d
ispo
sals
* (6
.06)
(57.
10)
(2,0
25.5
8) (5
1.57
) (1
45.3
9) (5
6.71
) (5
.56)
(2,3
47.9
7)B
alan
ce a
t Mar
ch 3
1, 2
018
4,4
96.9
0 2
64.1
3 4
0,51
9.28
8
9,03
6.79
3
,276
.00
1,4
82.6
8 1
,096
.61
5,7
39.3
7 14
5,91
1.76
A
ccum
ulat
ed D
epre
ciat
ion
Bal
ance
at A
pril
1, 2
016
-
2.3
4 2
,002
.85
11,
209.
44
371
.66
165
.78
183
.93
971
.58
14,
907.
58
Dep
reci
atio
n fo
r the
yea
r -
2.3
1 1
,349
.16
10,
233.
04
368
.94
179
.95
258
.33
828
.70
13,
220.
43
Ded
uctio
ns/d
ispo
sals
**
- -
(0.1
8) (4
6.56
) (0
.64)
(25.
83)
(4.2
5) (0
.30)
(77.
76)
Recla
ssifi
catio
n to
ass
ets
as h
eld
for s
ale
as p
art o
f disp
osal
- -
- (1
1.36
) -
- -
- (1
1.36
)B
alan
ce a
t Mar
ch 3
1, 2
017
-
4.6
5 3
,351
.83
21,
384.
56
739
.96
319
.90
438
.01
1,7
99.9
8 2
8,03
8.89
B
alan
ce a
t Apr
il 1,
201
7 -
4
.65
3,3
51.8
3 2
1,38
4.56
7
39.9
6 3
19.9
0 4
38.0
1 1
,799
.98
28,
038.
89
Dep
reci
atio
n fo
r the
yea
r -
3.3
7 1
,352
.04
9,5
28.3
2 3
36.1
6 2
03.7
2 2
32.3
8 5
81.6
5 1
2,23
7.64
D
educ
tions
/dis
posa
ls *
* -
(9.6
1) (1
,662
.39)
(39.
14)
(71.
86)
(44.
86)
(5.2
8) (1
,833
.14)
Bal
ance
at M
arch
31,
201
8 -
8
.02
4,6
94.2
6 2
9,25
0.49
1
,036
.98
451
.76
625
.53
2,3
76.3
5 3
8,44
3.39
N
et C
arry
ing
Valu
eB
alan
ce a
t Mar
ch 3
1, 2
017
4,2
83.4
9 2
59.4
8 3
6,01
5.52
6
6,97
7.48
2
,221
.08
1,1
56.2
7 6
26.4
3 3
,798
.29
115,
338.
04
Bal
ance
at M
arch
31,
201
8 4
,496
.90
256
.11
35,
825.
02
59,
786.
30
2,2
39.0
2 1
,030
.92
471
.08
3,3
63.0
2 10
7,46
8.37
Not
es:
1. *
Ded
uctio
n fro
m G
ross
Car
ryin
g Va
lue
repr
esen
ts s
ale/
tran
sfer
/ dis
card
ing
of P
rope
rty,
Pla
nt &
Equ
ipm
ent/
Leas
e ho
ld ri
ghts
writ
ten
off.
2. *
* D
educ
tion
in d
epre
ciat
ion
H 1
833.
14 L
akhs
(Pre
viou
s Ye
ar H
77.
76 L
akhs
) rep
rese
nts
adju
stm
ent o
n ac
coun
t of s
ale/
tran
sfer
/dis
card
ing
of P
rope
rty,
Pla
nt &
Equ
ipm
ent.
3. *
** In
clud
es v
alue
of i
rrevo
cabl
e Li
cenc
ing
Rig
hts
to u
se o
f a fl
at in
New
Del
hi H
10.
00 L
akhs
.4.
Dep
reca
ition
for t
he y
ear 2
017-
18 in
clud
es H
57.
94 L
akhs
(Pre
viou
s Ye
ar H
84.
73 L
akhs
) aga
inst
am
ortis
atio
n of
Gov
ernm
ent C
apita
l Gra
nts
(refe
r Not
e 30
)5.
On
trans
ition
dat
e, th
e Co
mpa
ny h
as o
pted
to c
ontin
ue w
ith c
arry
ing
valu
e of
all o
f its
pro
pert
y, p
lant
and
equ
ipm
ent a
s de
emed
cos
t and
net
car
ryin
g va
lue
unde
r pre
viou
s G
AA
P as
on
Mar
ch 3
1, 2
015
is re
cogn
ised
as
gros
s ca
rryi
ng a
mou
nt in
Ind
AS
as o
n 01
-04-
2015
.6.
Ass
ets
pled
ged
as s
ecur
ity (r
efer
Not
e 14
)
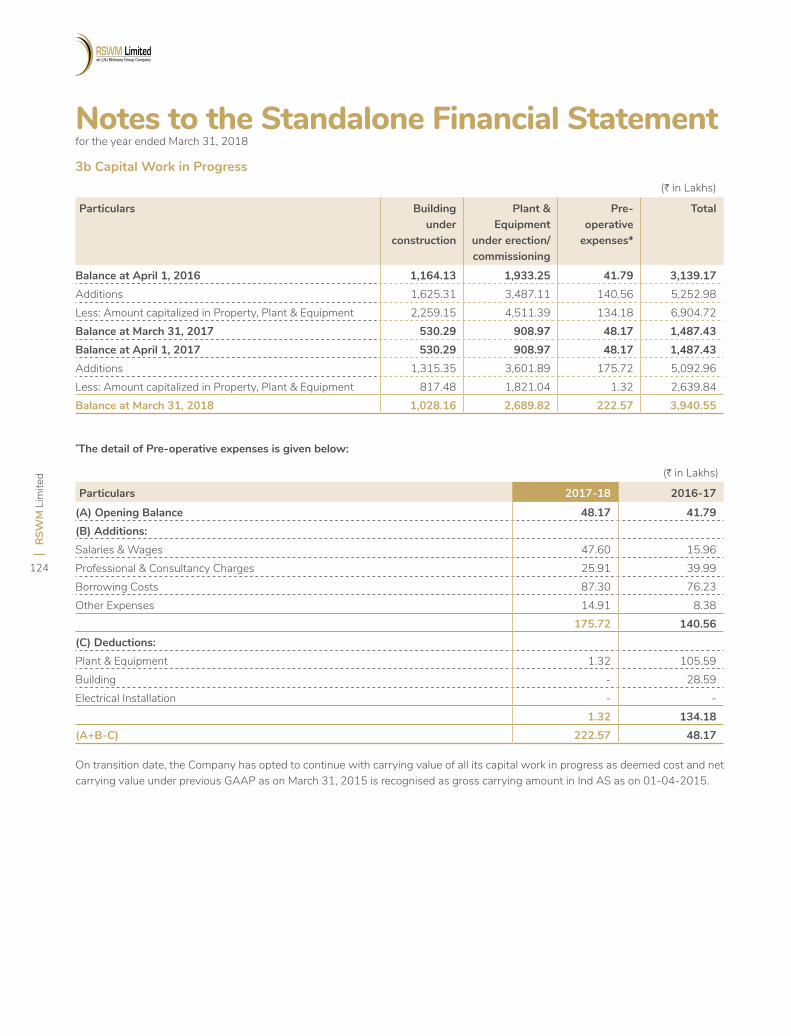
RSW
M L
imite
d
124
Notes to the Standalone Financial Statement for the year ended March 31, 2018
3b Capital Work in Progress
*The detail of Pre-operative expenses is given below:
(H in Lakhs)
Particulars Building under
construction
Plant & Equipment
under erection/ commissioning
Pre-operative
expenses*
Total
Balance at April 1, 2016 1,164.13 1,933.25 41.79 3,139.17 Additions 1,625.31 3,487.11 140.56 5,252.98 Less: Amount capitalized in Property, Plant & Equipment 2,259.15 4,511.39 134.18 6,904.72 Balance at March 31, 2017 530.29 908.97 48.17 1,487.43 Balance at April 1, 2017 530.29 908.97 48.17 1,487.43 Additions 1,315.35 3,601.89 175.72 5,092.96 Less: Amount capitalized in Property, Plant & Equipment 817.48 1,821.04 1.32 2,639.84 Balance at March 31, 2018 1,028.16 2,689.82 222.57 3,940.55
(H in Lakhs)
Particulars 2017-18 2016-17
(A) Opening Balance 48.17 41.79 (B) Additions:Salaries & Wages 47.60 15.96 Professional & Consultancy Charges 25.91 39.99 Borrowing Costs 87.30 76.23 Other Expenses 14.91 8.38
175.72 140.56 (C) Deductions:Plant & Equipment 1.32 105.59 Building - 28.59 Electrical Installation - -
1.32 134.18 (A+B-C) 222.57 48.17
On transition date, the Company has opted to continue with carrying value of all its capital work in progress as deemed cost and net carrying value under previous GAAP as on March 31, 2015 is recognised as gross carrying amount in Ind AS as on 01-04-2015.
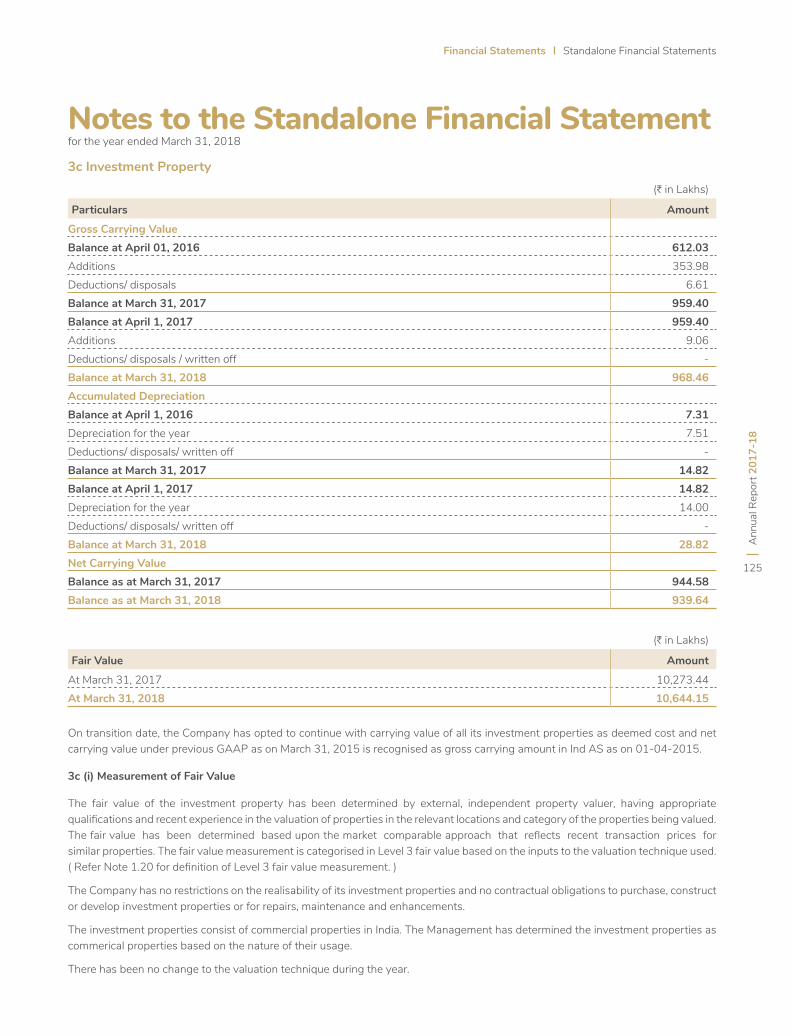
Financial Statements Standalone Financial Statements
Ann
ual R
epor
t 201
7-18
125
Notes to the Standalone Financial Statement for the year ended March 31, 2018
3c Investment Property(H in Lakhs)
Particulars Amount
Gross Carrying ValueBalance at April 01, 2016 612.03 Additions 353.98 Deductions/ disposals 6.61 Balance at March 31, 2017 959.40 Balance at April 1, 2017 959.40 Additions 9.06 Deductions/ disposals / written off - Balance at March 31, 2018 968.46 Accumulated DepreciationBalance at April 1, 2016 7.31 Depreciation for the year 7.51 Deductions/ disposals/ written off - Balance at March 31, 2017 14.82 Balance at April 1, 2017 14.82Depreciation for the year 14.00 Deductions/ disposals/ written off - Balance at March 31, 2018 28.82 Net Carrying ValueBalance as at March 31, 2017 944.58 Balance as at March 31, 2018 939.64
(H in Lakhs)
Fair Value Amount
At March 31, 2017 10,273.44 At March 31, 2018 10,644.15
On transition date, the Company has opted to continue with carrying value of all its investment properties as deemed cost and net carrying value under previous GAAP as on March 31, 2015 is recognised as gross carrying amount in Ind AS as on 01-04-2015.
3c (i) Measurement of Fair Value
The fair value of the investment property has been determined by external, independent property valuer, having appropriate qualifications and recent experience in the valuation of properties in the relevant locations and category of the properties being valued.The fair value has been determined based upon the market comparable approach that reflects recent transaction prices for similar properties. The fair value measurement is categorised in Level 3 fair value based on the inputs to the valuation technique used. ( Refer Note 1.20 for definition of Level 3 fair value measurement. )
The Company has no restrictions on the realisability of its investment properties and no contractual obligations to purchase, construct or develop investment properties or for repairs, maintenance and enhancements.
The investment properties consist of commercial properties in India. The Management has determined the investment properties as commerical properties based on the nature of their usage.
There has been no change to the valuation technique during the year.
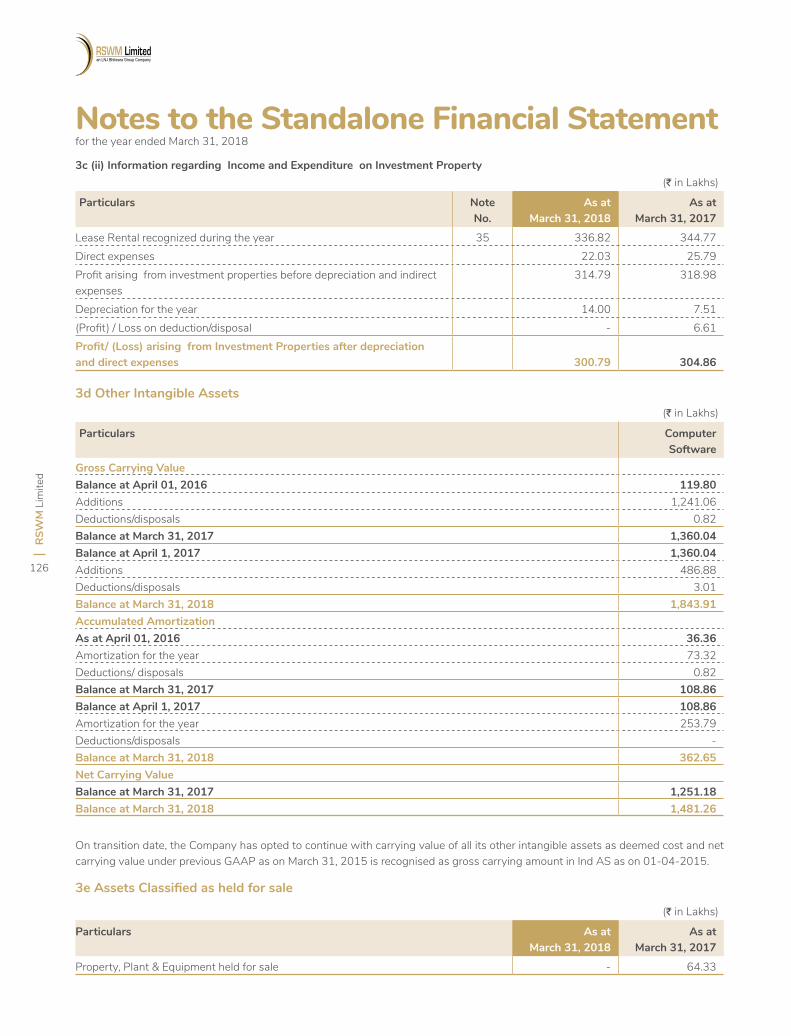
RSW
M L
imite
d
126
Notes to the Standalone Financial Statement for the year ended March 31, 2018
3c (ii) Information regarding Income and Expenditure on Investment Property
3d Other Intangible Assets
On transition date, the Company has opted to continue with carrying value of all its other intangible assets as deemed cost and net carrying value under previous GAAP as on March 31, 2015 is recognised as gross carrying amount in Ind AS as on 01-04-2015.
3e Assets Classified as held for sale
(J in Lakhs)
Particulars Note No.
As at March 31, 2018
As at March 31, 2017
Lease Rental recognized during the year 35 336.82 344.77Direct expenses 22.03 25.79 Profit arising from investment properties before depreciation and indirect expenses
314.79 318.98
Depreciation for the year 14.00 7.51 (Profit) / Loss on deduction/disposal - 6.61 Profit/ (Loss) arising from Investment Properties after depreciation and direct expenses 300.79 304.86
(J in Lakhs)
Particulars Computer Software
Gross Carrying ValueBalance at April 01, 2016 119.80 Additions 1,241.06 Deductions/disposals 0.82 Balance at March 31, 2017 1,360.04 Balance at April 1, 2017 1,360.04 Additions 486.88 Deductions/disposals 3.01 Balance at March 31, 2018 1,843.91 Accumulated AmortizationAs at April 01, 2016 36.36 Amortization for the year 73.32 Deductions/ disposals 0.82 Balance at March 31, 2017 108.86 Balance at April 1, 2017 108.86 Amortization for the year 253.79 Deductions/disposals - Balance at March 31, 2018 362.65 Net Carrying ValueBalance at March 31, 2017 1,251.18 Balance at March 31, 2018 1,481.26
(J in Lakhs)
Particulars As at March 31, 2018
As at March 31, 2017
Property, Plant & Equipment held for sale - 64.33
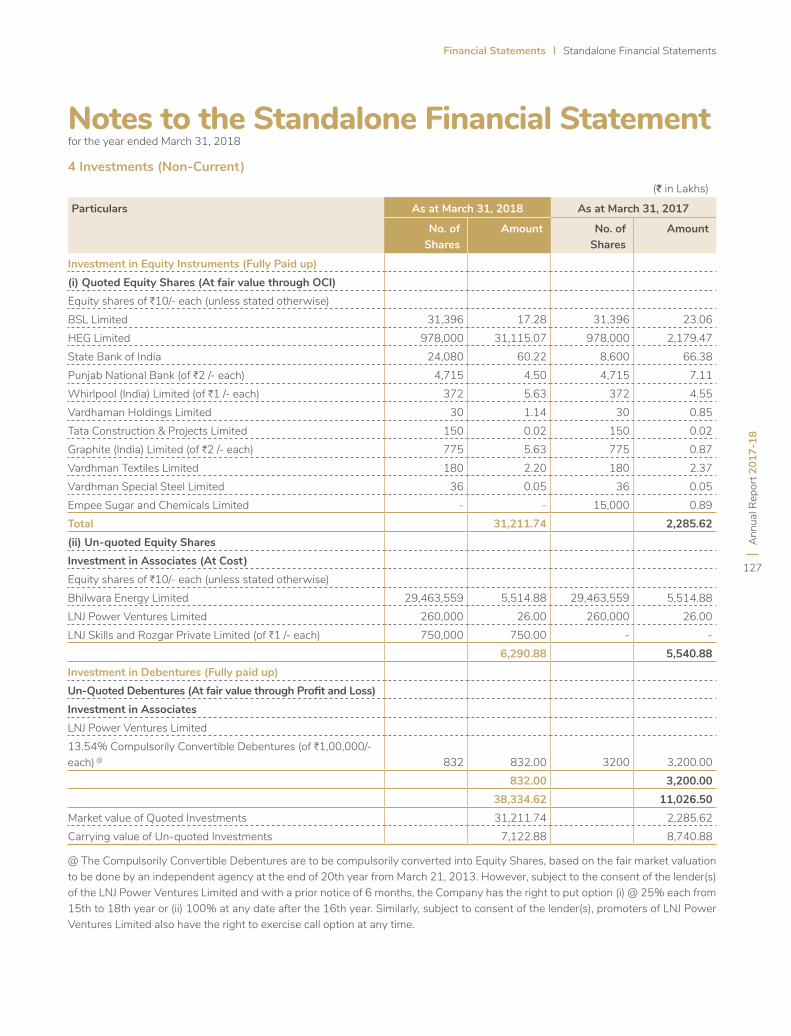
Financial Statements Standalone Financial Statements
Ann
ual R
epor
t 201
7-18
127
Notes to the Standalone Financial Statement for the year ended March 31, 2018
4 Investments (Non-Current)(J in Lakhs)
Particulars As at March 31, 2018 As at March 31, 2017
No. of Shares
Amount No. of Shares
Amount
Investment in Equity Instruments (Fully Paid up)(i) Quoted Equity Shares (At fair value through OCI)Equity shares of H10/- each (unless stated otherwise)BSL Limited 31,396 17.28 31,396 23.06 HEG Limited 978,000 31,115.07 978,000 2,179.47 State Bank of India 24,080 60.22 8,600 66.38 Punjab National Bank (of H2 /- each) 4,715 4.50 4,715 7.11 Whirlpool (India) Limited (of H1 /- each) 372 5.63 372 4.55 Vardhaman Holdings Limited 30 1.14 30 0.85 Tata Construction & Projects Limited 150 0.02 150 0.02 Graphite (India) Limited (of H2 /- each) 775 5.63 775 0.87 Vardhman Textiles Limited 180 2.20 180 2.37 Vardhman Special Steel Limited 36 0.05 36 0.05 Empee Sugar and Chemicals Limited - - 15,000 0.89 Total 31,211.74 2,285.62 (ii) Un-quoted Equity SharesInvestment in Associates (At Cost)Equity shares of H10/- each (unless stated otherwise)Bhilwara Energy Limited 29,463,559 5,514.88 29,463,559 5,514.88 LNJ Power Ventures Limited 260,000 26.00 260,000 26.00 LNJ Skills and Rozgar Private Limited (of H1 /- each) 750,000 750.00 - -
6,290.88 5,540.88 Investment in Debentures (Fully paid up)Un-Quoted Debentures (At fair value through Profit and Loss)Investment in AssociatesLNJ Power Ventures Limited13.54% Compulsorily Convertible Debentures (of H1,00,000/- each) @ 832 832.00 3200 3,200.00
832.00 3,200.00 38,334.62 11,026.50
Market value of Quoted Investments 31,211.74 2,285.62 Carrying value of Un-quoted Investments 7,122.88 8,740.88
@ The Compulsorily Convertible Debentures are to be compulsorily converted into Equity Shares, based on the fair market valuation to be done by an independent agency at the end of 20th year from March 21, 2013. However, subject to the consent of the lender(s) of the LNJ Power Ventures Limited and with a prior notice of 6 months, the Company has the right to put option (i) @ 25% each from 15th to 18th year or (ii) 100% at any date after the 16th year. Similarly, subject to consent of the lender(s), promoters of LNJ Power Ventures Limited also have the right to exercise call option at any time.
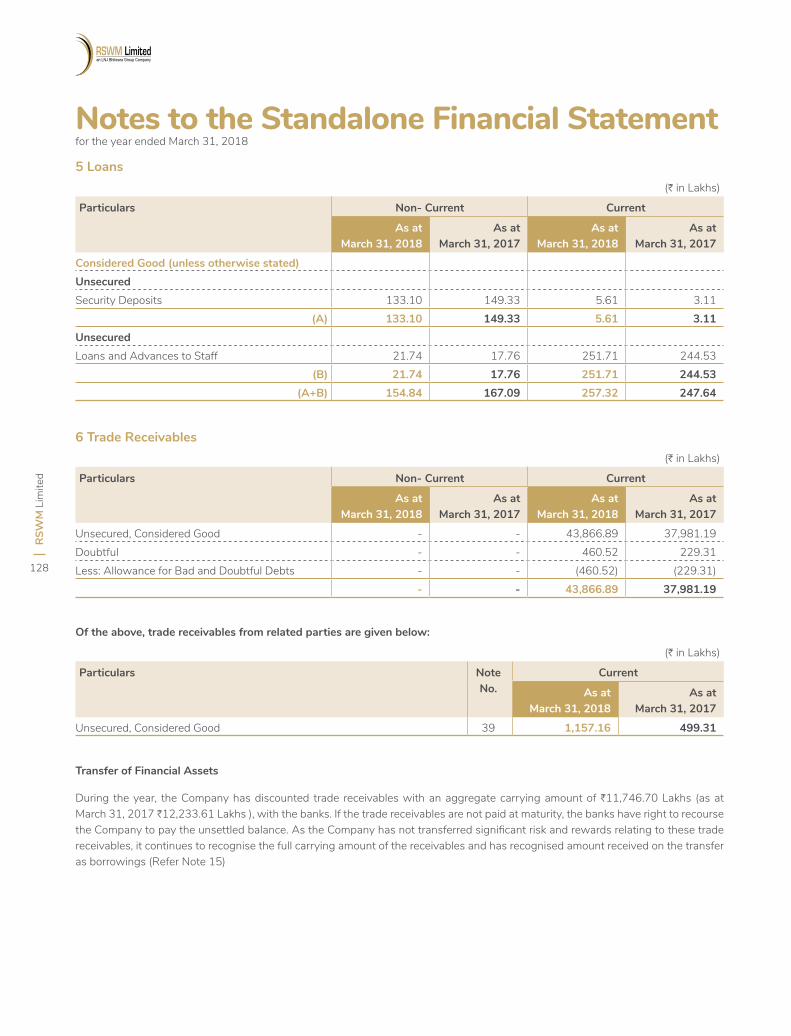
RSW
M L
imite
d
128
Notes to the Standalone Financial Statement for the year ended March 31, 2018
(H in Lakhs)
Particulars Non- Current Current
As at March 31, 2018
As at March 31, 2017
As at March 31, 2018
As at March 31, 2017
Considered Good (unless otherwise stated)UnsecuredSecurity Deposits 133.10 149.33 5.61 3.11
(A) 133.10 149.33 5.61 3.11 UnsecuredLoans and Advances to Staff 21.74 17.76 251.71 244.53
(B) 21.74 17.76 251.71 244.53 (A+B) 154.84 167.09 257.32 247.64
(H in Lakhs)
Particulars Non- Current Current
As at March 31, 2018
As at March 31, 2017
As at March 31, 2018
As at March 31, 2017
Unsecured, Considered Good - - 43,866.89 37,981.19 Doubtful - - 460.52 229.31 Less: Allowance for Bad and Doubtful Debts - - (460.52) (229.31)
- - 43,866.89 37,981.19
(H in Lakhs)
Particulars Note No.
Current
As atMarch 31, 2018
As atMarch 31, 2017
Unsecured, Considered Good 39 1,157.16 499.31
5 Loans
6 Trade Receivables
Of the above, trade receivables from related parties are given below:
Transfer of Financial Assets
During the year, the Company has discounted trade receivables with an aggregate carrying amount of H11,746.70 Lakhs (as at March 31, 2017 H12,233.61 Lakhs ), with the banks. If the trade receivables are not paid at maturity, the banks have right to recourse the Company to pay the unsettled balance. As the Company has not transferred significant risk and rewards relating to these trade receivables, it continues to recognise the full carrying amount of the receivables and has recognised amount received on the transfer as borrowings (Refer Note 15)
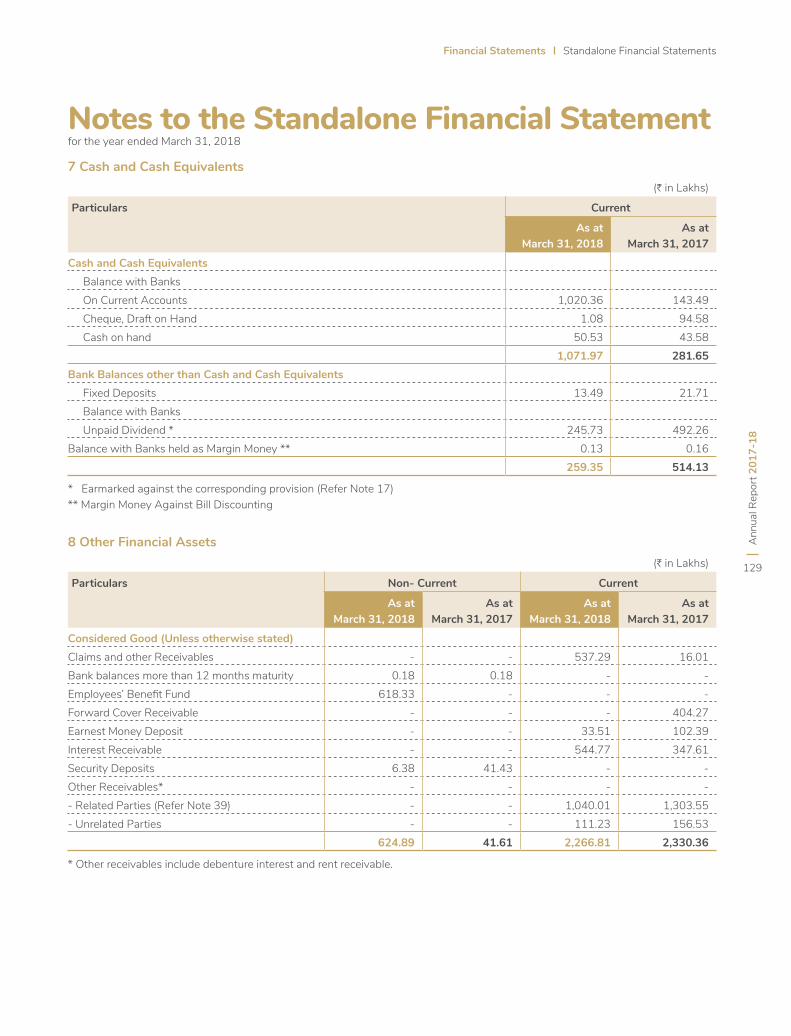
Financial Statements Standalone Financial Statements
Ann
ual R
epor
t 201
7-18
129
Notes to the Standalone Financial Statement for the year ended March 31, 2018
(H in Lakhs)
Particulars Current
As at March 31, 2018
As at March 31, 2017
Cash and Cash Equivalents Balance with Banks On Current Accounts 1,020.36 143.49 Cheque, Draft on Hand 1.08 94.58 Cash on hand 50.53 43.58
1,071.97 281.65 Bank Balances other than Cash and Cash Equivalents Fixed Deposits 13.49 21.71 Balance with Banks Unpaid Dividend * 245.73 492.26 Balance with Banks held as Margin Money ** 0.13 0.16
259.35 514.13
7 Cash and Cash Equivalents
8 Other Financial Assets
* Earmarked against the corresponding provision (Refer Note 17)** Margin Money Against Bill Discounting
(H in Lakhs)
Particulars Non- Current Current
As at March 31, 2018
As at March 31, 2017
As at March 31, 2018
As at March 31, 2017
Considered Good (Unless otherwise stated)Claims and other Receivables - - 537.29 16.01 Bank balances more than 12 months maturity 0.18 0.18 - -Employees’ Benefit Fund 618.33 - - -Forward Cover Receivable - - - 404.27 Earnest Money Deposit - - 33.51 102.39 Interest Receivable - - 544.77 347.61 Security Deposits 6.38 41.43 - -Other Receivables* - - - -- Related Parties (Refer Note 39) - - 1,040.01 1,303.55 - Unrelated Parties - - 111.23 156.53
624.89 41.61 2,266.81 2,330.36
* Other receivables include debenture interest and rent receivable.
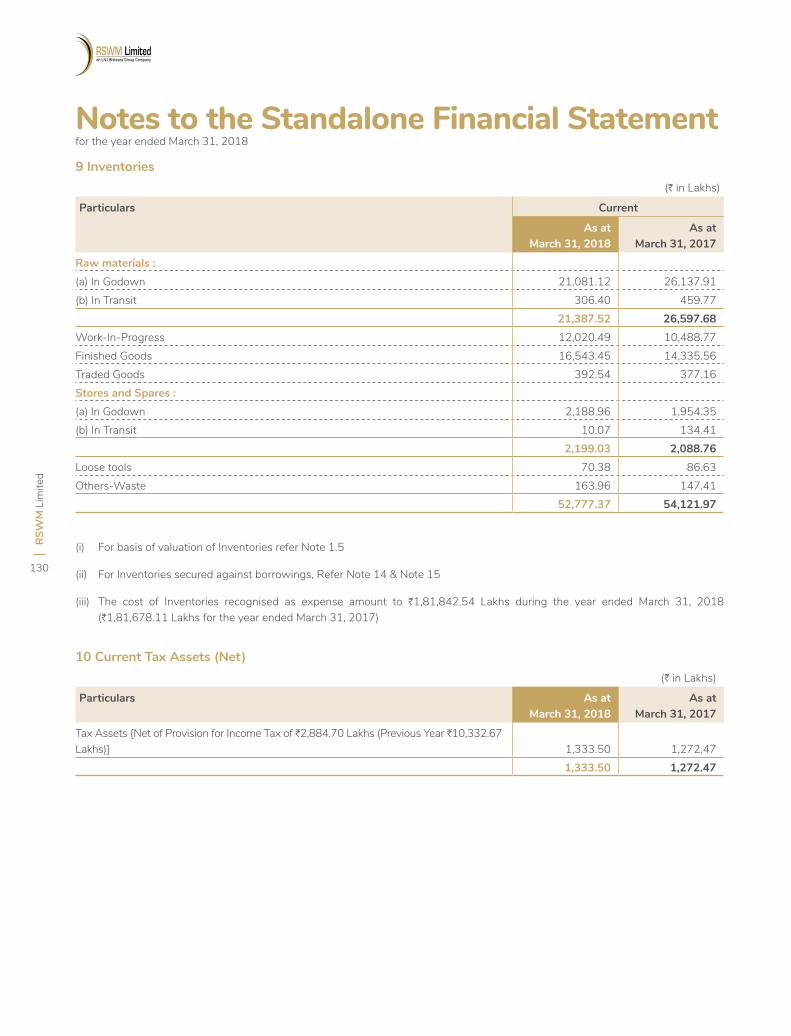
RSW
M L
imite
d
130
Notes to the Standalone Financial Statement for the year ended March 31, 2018
9 Inventories
10 Current Tax Assets (Net)
(H in Lakhs)
Particulars Current
As atMarch 31, 2018
As atMarch 31, 2017
Raw materials :(a) In Godown 21,081.12 26,137.91 (b) In Transit 306.40 459.77
21,387.52 26,597.68 Work-In-Progress 12,020.49 10,488.77 Finished Goods 16,543.45 14,335.56 Traded Goods 392.54 377.16 Stores and Spares :(a) In Godown 2,188.96 1,954.35 (b) In Transit 10.07 134.41
2,199.03 2,088.76 Loose tools 70.38 86.63 Others-Waste 163.96 147.41
52,777.37 54,121.97
(i) For basis of valuation of Inventories refer Note 1.5
(ii) For Inventories secured against borrowings, Refer Note 14 & Note 15
(iii) The cost of Inventories recognised as expense amount to H1,81,842.54 Lakhs during the year ended March 31, 2018 (H1,81,678.11 Lakhs for the year ended March 31, 2017)
(H in Lakhs)
Particulars As atMarch 31, 2018
As atMarch 31, 2017
Tax Assets {Net of Provision for Income Tax of H2,884.70 Lakhs (Previous Year H10,332.67 Lakhs)} 1,333.50 1,272.47
1,333.50 1,272.47
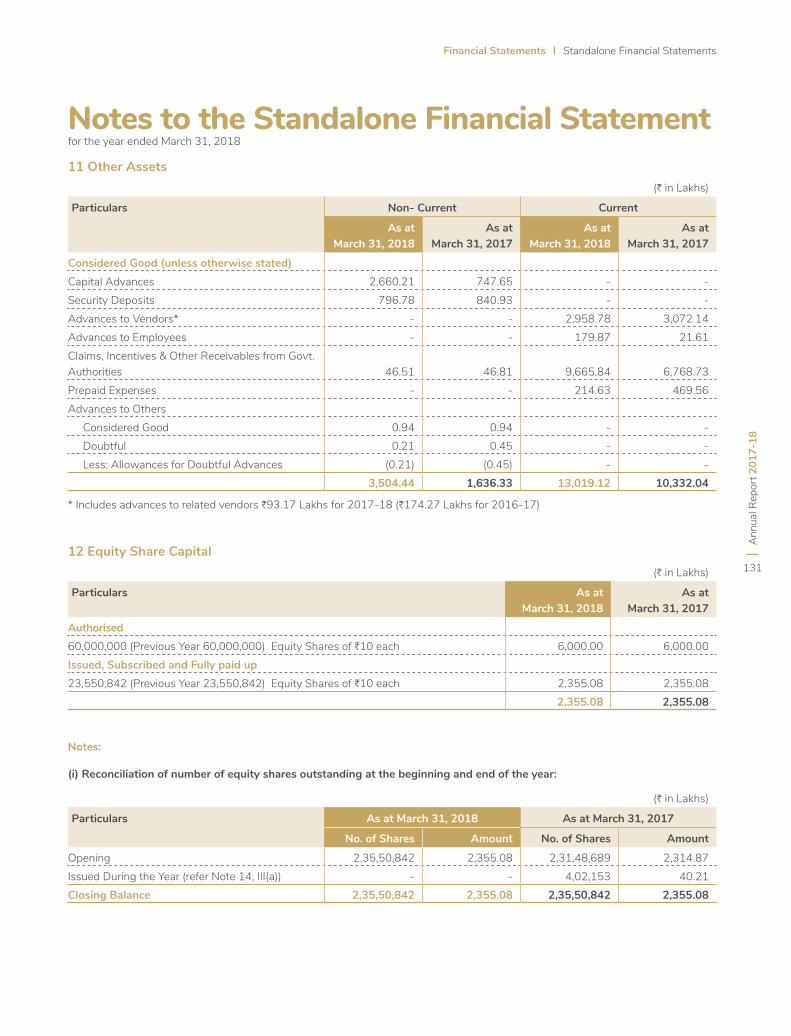
Financial Statements Standalone Financial Statements
Ann
ual R
epor
t 201
7-18
131
Notes to the Standalone Financial Statement for the year ended March 31, 2018
11 Other Assets
12 Equity Share Capital(H in Lakhs)
Particulars As atMarch 31, 2018
As atMarch 31, 2017
Authorised60,000,000 (Previous Year 60,000,000) Equity Shares of H10 each 6,000.00 6,000.00 Issued, Subscribed and Fully paid up23,550,842 (Previous Year 23,550,842) Equity Shares of H10 each 2,355.08 2,355.08
2,355.08 2,355.08
(H in Lakhs)
Particulars Non- Current Current
As at March 31, 2018
As at March 31, 2017
As at March 31, 2018
As at March 31, 2017
Considered Good (unless otherwise stated)Capital Advances 2,660.21 747.65 - -Security Deposits 796.78 840.93 - -Advances to Vendors* - - 2,958.78 3,072.14 Advances to Employees - - 179.87 21.61 Claims, Incentives & Other Receivables from Govt. Authorities 46.51 46.81 9,665.84 6,768.73 Prepaid Expenses - - 214.63 469.56 Advances to Others Considered Good 0.94 0.94 - - Doubtful 0.21 0.45 - - Less: Allowances for Doubtful Advances (0.21) (0.45) - -
3,504.44 1,636.33 13,019.12 10,332.04
(H in Lakhs)
Particulars As at March 31, 2018 As at March 31, 2017
No. of Shares Amount No. of Shares Amount
Opening 2,35,50,842 2,355.08 2,31,48,689 2,314.87 Issued During the Year (refer Note 14, III(a)) - - 4,02,153 40.21 Closing Balance 2,35,50,842 2,355.08 2,35,50,842 2,355.08
* Includes advances to related vendors H93.17 Lakhs for 2017-18 (H174.27 Lakhs for 2016-17)
Notes:
(i) Reconciliation of number of equity shares outstanding at the beginning and end of the year:
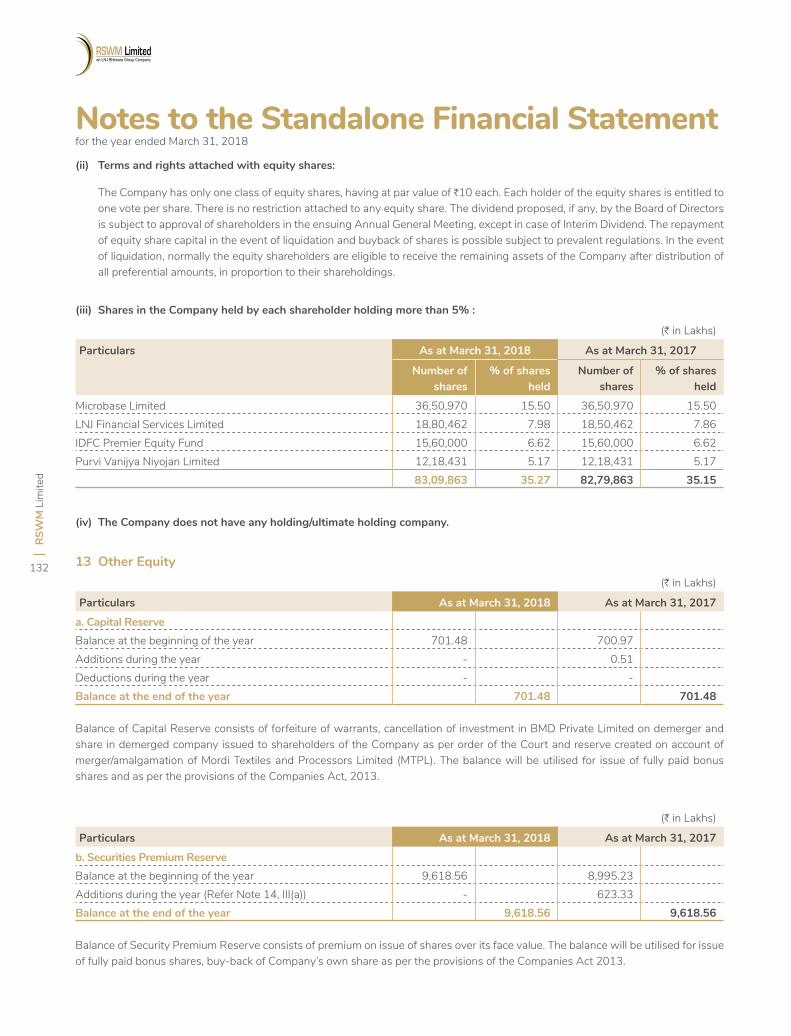
RSW
M L
imite
d
132
Notes to the Standalone Financial Statement for the year ended March 31, 2018
(ii) Terms and rights attached with equity shares:
The Company has only one class of equity shares, having at par value of H10 each. Each holder of the equity shares is entitled to one vote per share. There is no restriction attached to any equity share. The dividend proposed, if any, by the Board of Directors is subject to approval of shareholders in the ensuing Annual General Meeting, except in case of Interim Dividend. The repayment of equity share capital in the event of liquidation and buyback of shares is possible subject to prevalent regulations. In the event of liquidation, normally the equity shareholders are eligible to receive the remaining assets of the Company after distribution of all preferential amounts, in proportion to their shareholdings.
(iii) Shares in the Company held by each shareholder holding more than 5% :
(iv) The Company does not have any holding/ultimate holding company.
(H in Lakhs)
Particulars As at March 31, 2018 As at March 31, 2017
Number of shares
% of shares held
Number of shares
% of shares held
Microbase Limited 36,50,970 15.50 36,50,970 15.50 LNJ Financial Services Limited 18,80,462 7.98 18,50,462 7.86 IDFC Premier Equity Fund 15,60,000 6.62 15,60,000 6.62 Purvi Vanijya Niyojan Limited 12,18,431 5.17 12,18,431 5.17
83,09,863 35.27 82,79,863 35.15
13 Other Equity(H in Lakhs)
Particulars As at March 31, 2018 As at March 31, 2017
a. Capital ReserveBalance at the beginning of the year 701.48 700.97 Additions during the year - 0.51Deductions during the year - -Balance at the end of the year 701.48 701.48
(H in Lakhs)
Particulars As at March 31, 2018 As at March 31, 2017
b. Securities Premium ReserveBalance at the beginning of the year 9,618.56 8,995.23 Additions during the year (Refer Note 14, III(a)) - 623.33 Balance at the end of the year 9,618.56 9,618.56
Balance of Capital Reserve consists of forfeiture of warrants, cancellation of investment in BMD Private Limited on demerger and share in demerged company issued to shareholders of the Company as per order of the Court and reserve created on account of merger/amalgamation of Mordi Textiles and Processors Limited (MTPL). The balance will be utilised for issue of fully paid bonus shares and as per the provisions of the Companies Act, 2013.
Balance of Security Premium Reserve consists of premium on issue of shares over its face value. The balance will be utilised for issue of fully paid bonus shares, buy-back of Company’s own share as per the provisions of the Companies Act 2013.
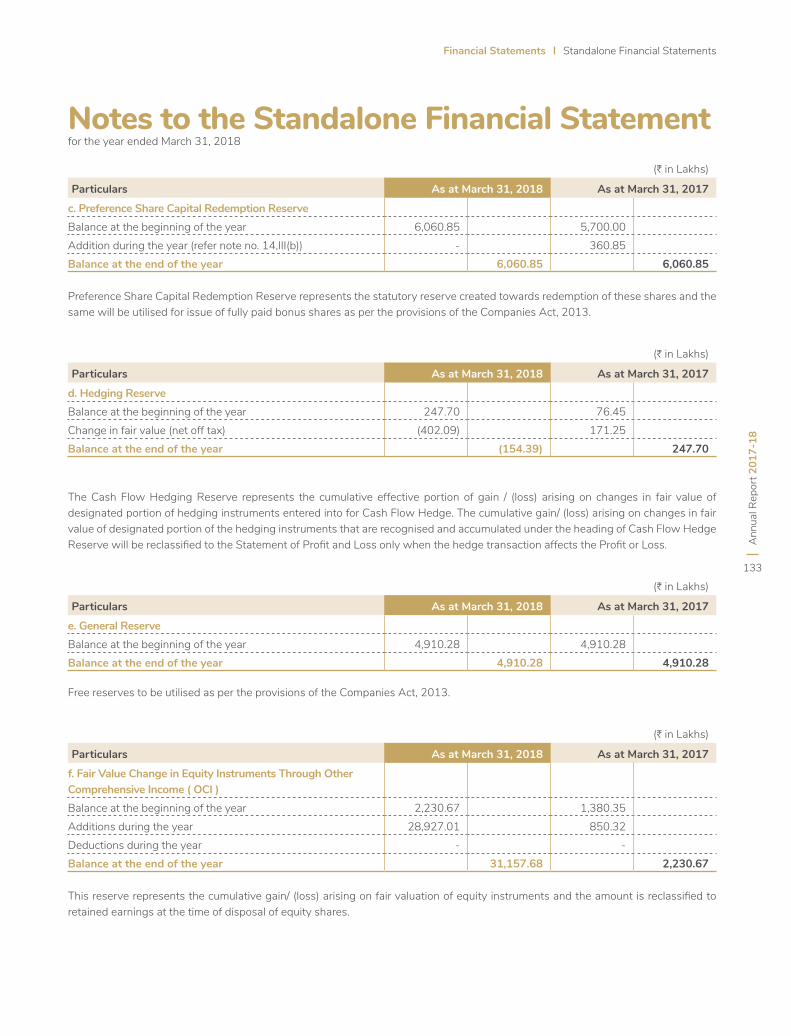
Financial Statements Standalone Financial Statements
Ann
ual R
epor
t 201
7-18
133
Notes to the Standalone Financial Statement for the year ended March 31, 2018
(H in Lakhs)
Particulars As at March 31, 2018 As at March 31, 2017
c. Preference Share Capital Redemption ReserveBalance at the beginning of the year 6,060.85 5,700.00 Addition during the year (refer note no. 14,III(b)) - 360.85 Balance at the end of the year 6,060.85 6,060.85
(H in Lakhs)
Particulars As at March 31, 2018 As at March 31, 2017
d. Hedging ReserveBalance at the beginning of the year 247.70 76.45 Change in fair value (net off tax) (402.09) 171.25 Balance at the end of the year (154.39) 247.70
(H in Lakhs)
Particulars As at March 31, 2018 As at March 31, 2017
e. General ReserveBalance at the beginning of the year 4,910.28 4,910.28 Balance at the end of the year 4,910.28 4,910.28
(H in Lakhs)
Particulars As at March 31, 2018 As at March 31, 2017
f. Fair Value Change in Equity Instruments Through Other Comprehensive Income ( OCI )Balance at the beginning of the year 2,230.67 1,380.35 Additions during the year 28,927.01 850.32 Deductions during the year - -Balance at the end of the year 31,157.68 2,230.67
Preference Share Capital Redemption Reserve represents the statutory reserve created towards redemption of these shares and the same will be utilised for issue of fully paid bonus shares as per the provisions of the Companies Act, 2013.
The Cash Flow Hedging Reserve represents the cumulative effective portion of gain / (loss) arising on changes in fair value of designated portion of hedging instruments entered into for Cash Flow Hedge. The cumulative gain/ (loss) arising on changes in fair value of designated portion of the hedging instruments that are recognised and accumulated under the heading of Cash Flow Hedge Reserve will be reclassified to the Statement of Profit and Loss only when the hedge transaction affects the Profit or Loss.
Free reserves to be utilised as per the provisions of the Companies Act, 2013.
This reserve represents the cumulative gain/ (loss) arising on fair valuation of equity instruments and the amount is reclassified to retained earnings at the time of disposal of equity shares.
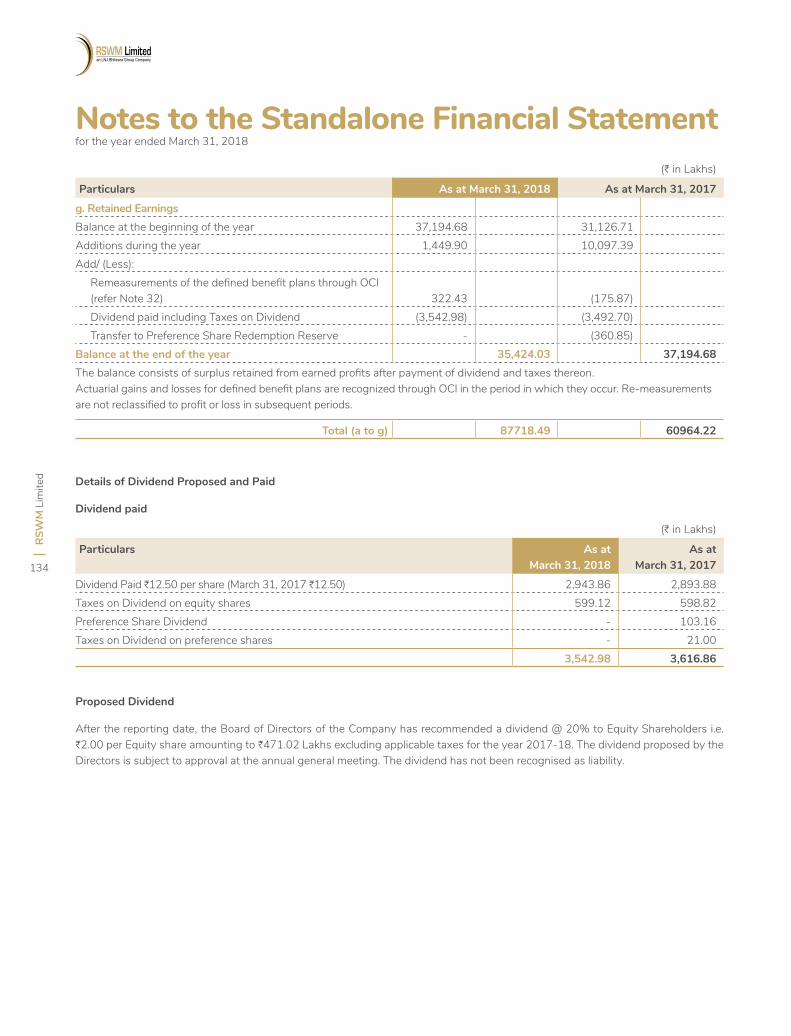
RSW
M L
imite
d
134
Notes to the Standalone Financial Statement for the year ended March 31, 2018
(H in Lakhs)
Particulars As at March 31, 2018 As at March 31, 2017
g. Retained EarningsBalance at the beginning of the year 37,194.68 31,126.71 Additions during the year 1,449.90 10,097.39 Add/ (Less): Remeasurements of the defined benefit plans through OCI
(refer Note 32) 322.43 (175.87) Dividend paid including Taxes on Dividend (3,542.98) (3,492.70) Transfer to Preference Share Redemption Reserve - (360.85)Balance at the end of the year 35,424.03 37,194.68 The balance consists of surplus retained from earned profits after payment of dividend and taxes thereon. Actuarial gains and losses for defined benefit plans are recognized through OCI in the period in which they occur. Re-measurements are not reclassified to profit or loss in subsequent periods.
Total (a to g) 87718.49 60964.22
Details of Dividend Proposed and Paid
Dividend paid
(H in Lakhs)
Particulars As atMarch 31, 2018
As atMarch 31, 2017
Dividend Paid H12.50 per share (March 31, 2017 H12.50) 2,943.86 2,893.88 Taxes on Dividend on equity shares 599.12 598.82 Preference Share Dividend - 103.16 Taxes on Dividend on preference shares - 21.00
3,542.98 3,616.86
Proposed Dividend
After the reporting date, the Board of Directors of the Company has recommended a dividend @ 20% to Equity Shareholders i.e. H2.00 per Equity share amounting to H471.02 Lakhs excluding applicable taxes for the year 2017-18. The dividend proposed by the Directors is subject to approval at the annual general meeting. The dividend has not been recognised as liability.
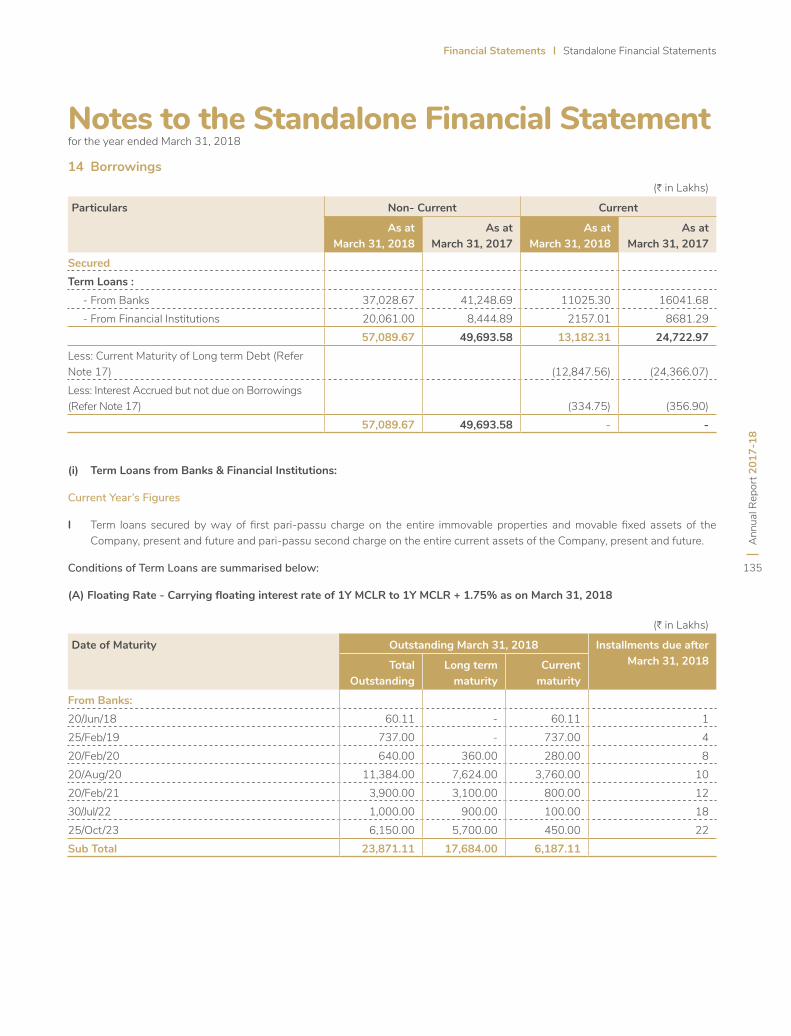
Financial Statements Standalone Financial Statements
Ann
ual R
epor
t 201
7-18
135
Notes to the Standalone Financial Statement for the year ended March 31, 2018
14 Borrowings(H in Lakhs)
Particulars Non- Current Current
As at March 31, 2018
As at March 31, 2017
As at March 31, 2018
As at March 31, 2017
SecuredTerm Loans : - From Banks 37,028.67 41,248.69 11025.30 16041.68 - From Financial Institutions 20,061.00 8,444.89 2157.01 8681.29
57,089.67 49,693.58 13,182.31 24,722.97 Less: Current Maturity of Long term Debt (Refer Note 17) (12,847.56) (24,366.07)Less: Interest Accrued but not due on Borrowings (Refer Note 17) (334.75) (356.90)
57,089.67 49,693.58 - -
(H in Lakhs)
Date of Maturity Outstanding March 31, 2018 Installments due after March 31, 2018Total
OutstandingLong term
maturityCurrent
maturity
From Banks:20/Jun/18 60.11 - 60.11 125/Feb/19 737.00 - 737.00 420/Feb/20 640.00 360.00 280.00 820/Aug/20 11,384.00 7,624.00 3,760.00 1020/Feb/21 3,900.00 3,100.00 800.00 1230/Jul/22 1,000.00 900.00 100.00 1825/Oct/23 6,150.00 5,700.00 450.00 22Sub Total 23,871.11 17,684.00 6,187.11
(i) Term Loans from Banks & Financial Institutions:
Current Year’s Figures
I Term loans secured by way of first pari-passu charge on the entire immovable properties and movable fixed assets of the Company, present and future and pari-passu second charge on the entire current assets of the Company, present and future.
Conditions of Term Loans are summarised below:
(A) Floating Rate - Carrying floating interest rate of 1Y MCLR to 1Y MCLR + 1.75% as on March 31, 2018
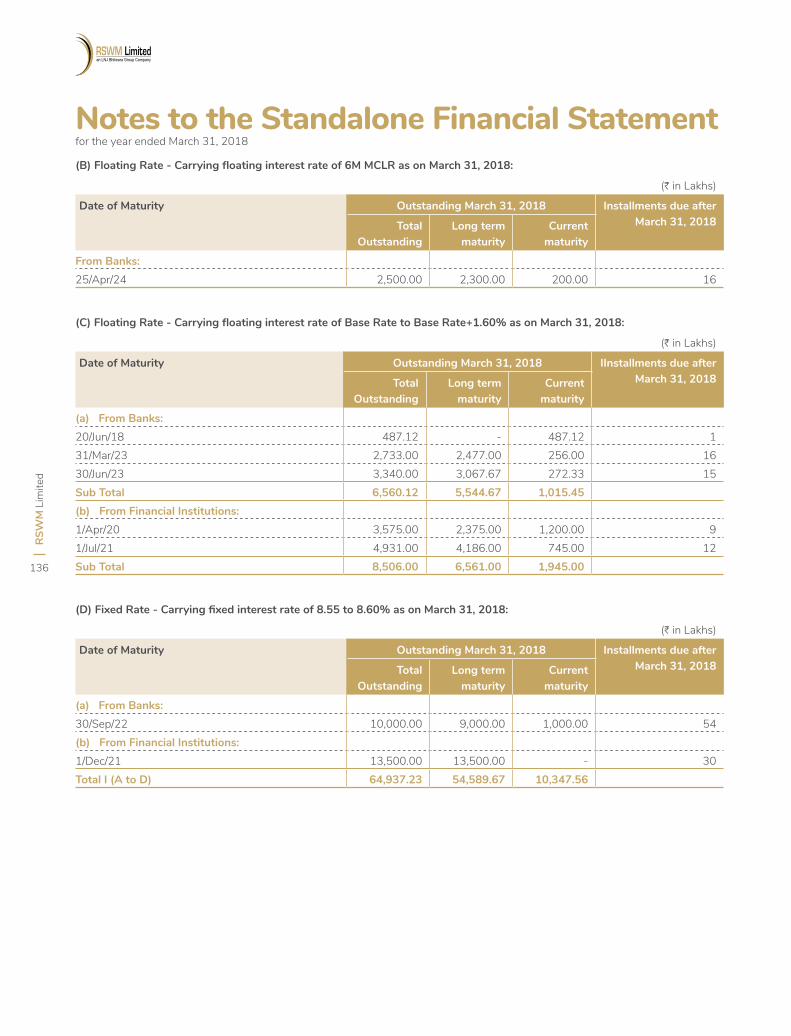
RSW
M L
imite
d
136
Notes to the Standalone Financial Statement for the year ended March 31, 2018
(H in Lakhs)
Date of Maturity Outstanding March 31, 2018 Installments due after March 31, 2018Total
OutstandingLong term
maturityCurrent
maturity
From Banks:25/Apr/24 2,500.00 2,300.00 200.00 16
(H in Lakhs)
Date of Maturity Outstanding March 31, 2018 IInstallments due after March 31, 2018Total
OutstandingLong term
maturityCurrent
maturity
(a) From Banks:20/Jun/18 487.12 - 487.12 131/Mar/23 2,733.00 2,477.00 256.00 1630/Jun/23 3,340.00 3,067.67 272.33 15Sub Total 6,560.12 5,544.67 1,015.45 (b) From Financial Institutions:1/Apr/20 3,575.00 2,375.00 1,200.00 91/Jul/21 4,931.00 4,186.00 745.00 12Sub Total 8,506.00 6,561.00 1,945.00
(H in Lakhs)
Date of Maturity Outstanding March 31, 2018 Installments due after March 31, 2018Total
OutstandingLong term
maturityCurrent
maturity
(a) From Banks:30/Sep/22 10,000.00 9,000.00 1,000.00 54(b) From Financial Institutions:1/Dec/21 13,500.00 13,500.00 - 30Total I (A to D) 64,937.23 54,589.67 10,347.56
(B) Floating Rate - Carrying floating interest rate of 6M MCLR as on March 31, 2018:
(C) Floating Rate - Carrying floating interest rate of Base Rate to Base Rate+1.60% as on March 31, 2018:
(D) Fixed Rate - Carrying fixed interest rate of 8.55 to 8.60% as on March 31, 2018:
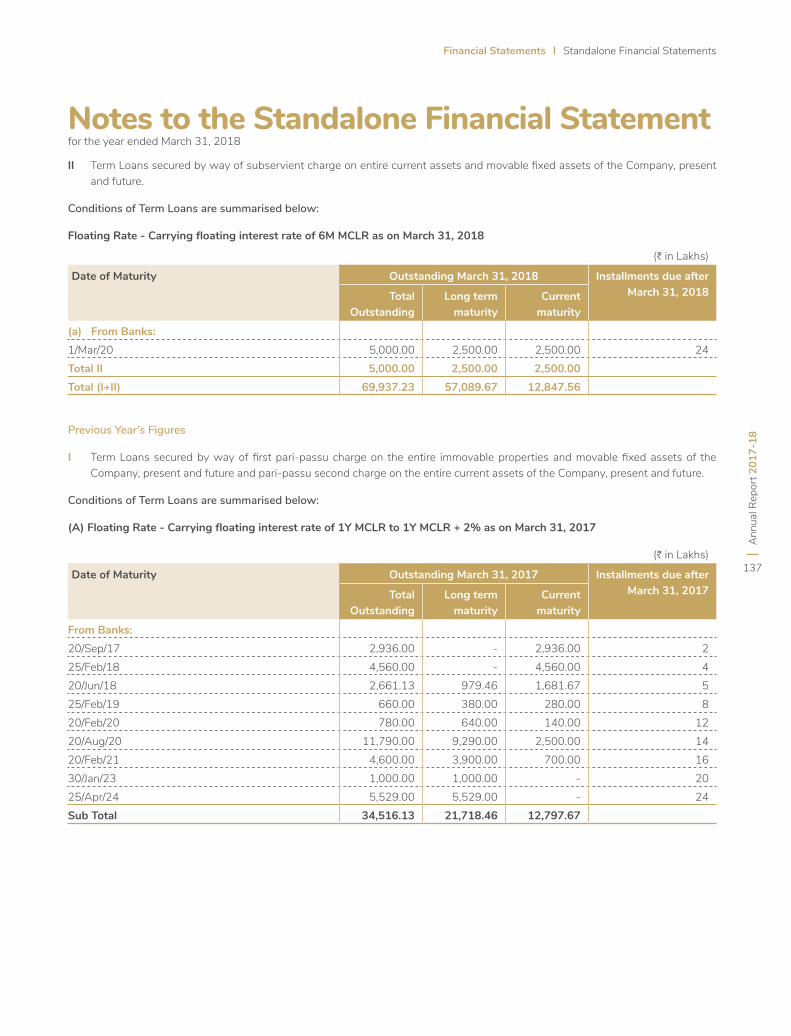
Financial Statements Standalone Financial Statements
Ann
ual R
epor
t 201
7-18
137
Notes to the Standalone Financial Statement for the year ended March 31, 2018
(H in Lakhs)
Date of Maturity Outstanding March 31, 2018 Installments due after March 31, 2018Total
OutstandingLong term
maturityCurrent
maturity
(a) From Banks:1/Mar/20 5,000.00 2,500.00 2,500.00 24Total II 5,000.00 2,500.00 2,500.00 Total (I+II) 69,937.23 57,089.67 12,847.56
(H in Lakhs)
Date of Maturity Outstanding March 31, 2017 Installments due after March 31, 2017Total
OutstandingLong term
maturityCurrent
maturity
From Banks:20/Sep/17 2,936.00 - 2,936.00 225/Feb/18 4,560.00 - 4,560.00 420/Jun/18 2,661.13 979.46 1,681.67 525/Feb/19 660.00 380.00 280.00 820/Feb/20 780.00 640.00 140.00 1220/Aug/20 11,790.00 9,290.00 2,500.00 1420/Feb/21 4,600.00 3,900.00 700.00 1630/Jan/23 1,000.00 1,000.00 - 2025/Apr/24 5,529.00 5,529.00 - 24Sub Total 34,516.13 21,718.46 12,797.67
II Term Loans secured by way of subservient charge on entire current assets and movable fixed assets of the Company, present and future.
Conditions of Term Loans are summarised below:
Floating Rate - Carrying floating interest rate of 6M MCLR as on March 31, 2018
Previous Year’s Figures
I Term Loans secured by way of first pari-passu charge on the entire immovable properties and movable fixed assets of the Company, present and future and pari-passu second charge on the entire current assets of the Company, present and future.
Conditions of Term Loans are summarised below:
(A) Floating Rate - Carrying floating interest rate of 1Y MCLR to 1Y MCLR + 2% as on March 31, 2017
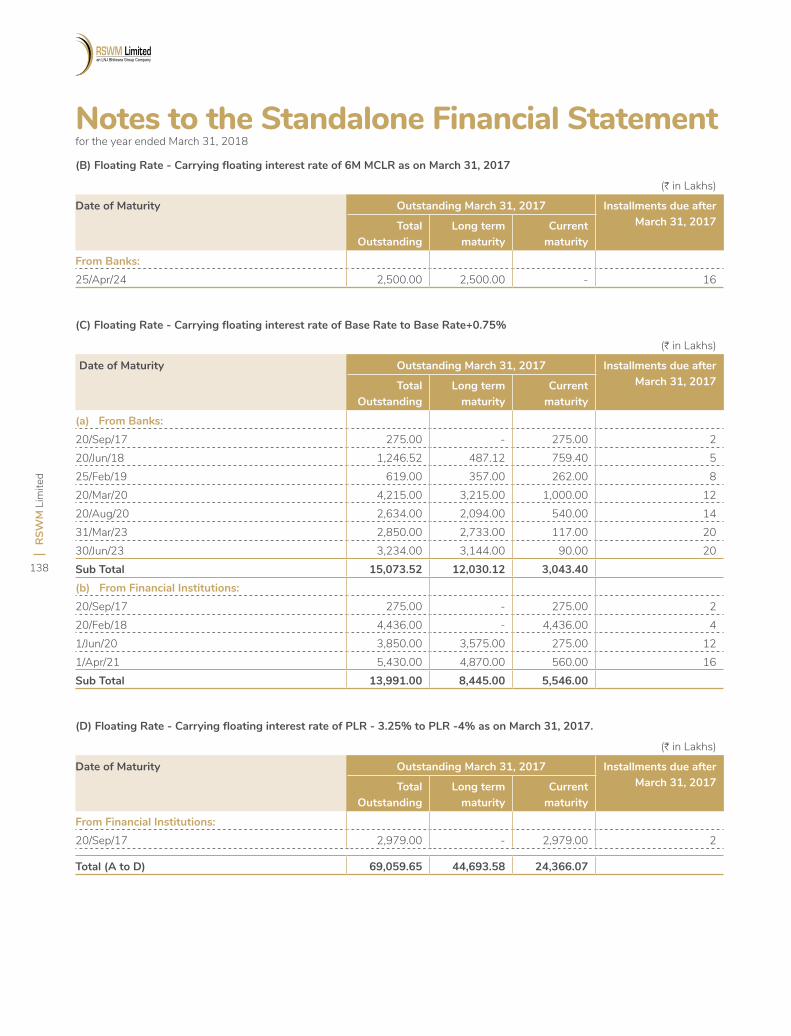
RSW
M L
imite
d
138
Notes to the Standalone Financial Statement for the year ended March 31, 2018
(B) Floating Rate - Carrying floating interest rate of 6M MCLR as on March 31, 2017
(C) Floating Rate - Carrying floating interest rate of Base Rate to Base Rate+0.75%
(D) Floating Rate - Carrying floating interest rate of PLR - 3.25% to PLR -4% as on March 31, 2017.
(H in Lakhs)
Date of Maturity Outstanding March 31, 2017 Installments due after March 31, 2017Total
OutstandingLong term
maturityCurrent
maturity
From Banks:25/Apr/24 2,500.00 2,500.00 - 16
(H in Lakhs)
Date of Maturity Outstanding March 31, 2017 Installments due after March 31, 2017Total
OutstandingLong term
maturityCurrent
maturity
(a) From Banks:20/Sep/17 275.00 - 275.00 220/Jun/18 1,246.52 487.12 759.40 525/Feb/19 619.00 357.00 262.00 820/Mar/20 4,215.00 3,215.00 1,000.00 1220/Aug/20 2,634.00 2,094.00 540.00 1431/Mar/23 2,850.00 2,733.00 117.00 2030/Jun/23 3,234.00 3,144.00 90.00 20Sub Total 15,073.52 12,030.12 3,043.40 (b) From Financial Institutions:20/Sep/17 275.00 - 275.00 220/Feb/18 4,436.00 - 4,436.00 41/Jun/20 3,850.00 3,575.00 275.00 121/Apr/21 5,430.00 4,870.00 560.00 16Sub Total 13,991.00 8,445.00 5,546.00
(H in Lakhs)
Date of Maturity Outstanding March 31, 2017 Installments due after March 31, 2017Total
OutstandingLong term
maturityCurrent
maturity
From Financial Institutions:20/Sep/17 2,979.00 - 2,979.00 2
Total (A to D) 69,059.65 44,693.58 24,366.07
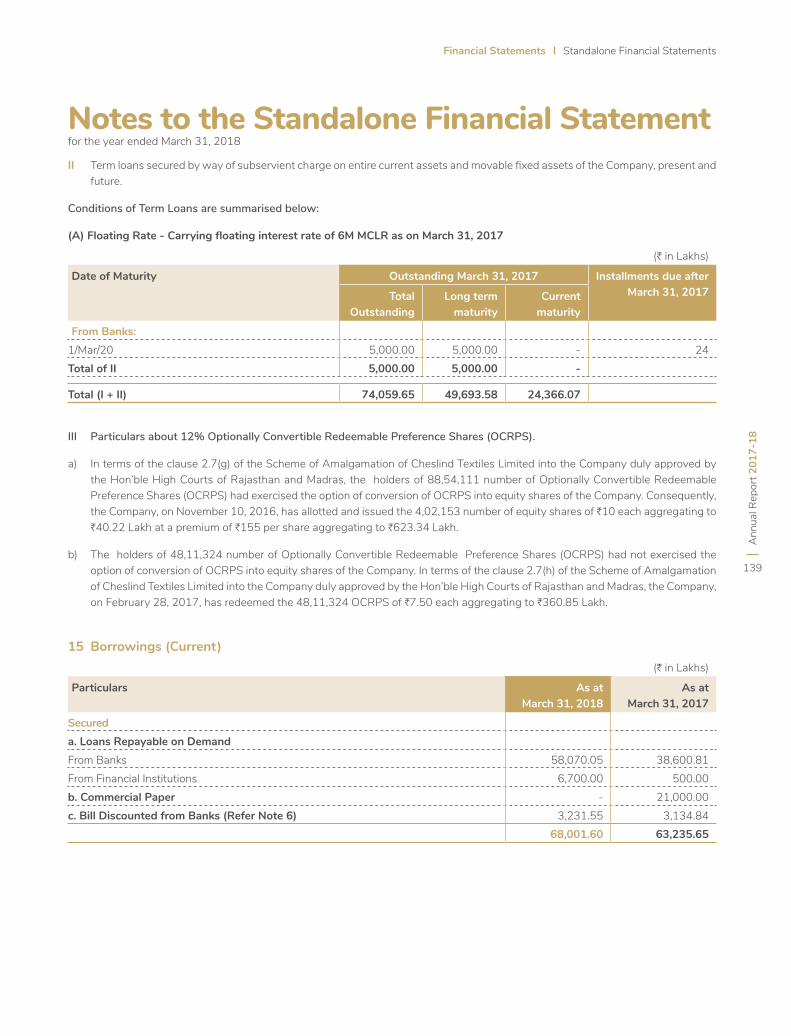
Financial Statements Standalone Financial Statements
Ann
ual R
epor
t 201
7-18
139
Notes to the Standalone Financial Statement for the year ended March 31, 2018
II Term loans secured by way of subservient charge on entire current assets and movable fixed assets of the Company, present and future.
Conditions of Term Loans are summarised below:
(A) Floating Rate - Carrying floating interest rate of 6M MCLR as on March 31, 2017
III Particulars about 12% Optionally Convertible Redeemable Preference Shares (OCRPS).
a) In terms of the clause 2.7(g) of the Scheme of Amalgamation of Cheslind Textiles Limited into the Company duly approved by the Hon’ble High Courts of Rajasthan and Madras, the holders of 88,54,111 number of Optionally Convertible Redeemable Preference Shares (OCRPS) had exercised the option of conversion of OCRPS into equity shares of the Company. Consequently, the Company, on November 10, 2016, has allotted and issued the 4,02,153 number of equity shares of H10 each aggregating to H40.22 Lakh at a premium of H155 per share aggregating to H623.34 Lakh.
b) The holders of 48,11,324 number of Optionally Convertible Redeemable Preference Shares (OCRPS) had not exercised the option of conversion of OCRPS into equity shares of the Company. In terms of the clause 2.7(h) of the Scheme of Amalgamation of Cheslind Textiles Limited into the Company duly approved by the Hon’ble High Courts of Rajasthan and Madras, the Company, on February 28, 2017, has redeemed the 48,11,324 OCRPS of H7.50 each aggregating to H360.85 Lakh.
(H in Lakhs)
Date of Maturity Outstanding March 31, 2017 Installments due after March 31, 2017Total
OutstandingLong term
maturityCurrent
maturity
From Banks:1/Mar/20 5,000.00 5,000.00 - 24Total of II 5,000.00 5,000.00 -
Total (I + II) 74,059.65 49,693.58 24,366.07
15 Borrowings (Current)(H in Lakhs)
Particulars As atMarch 31, 2018
As atMarch 31, 2017
Secureda. Loans Repayable on Demand From Banks 58,070.05 38,600.81 From Financial Institutions 6,700.00 500.00 b. Commercial Paper - 21,000.00 c. Bill Discounted from Banks (Refer Note 6) 3,231.55 3,134.84
68,001.60 63,235.65
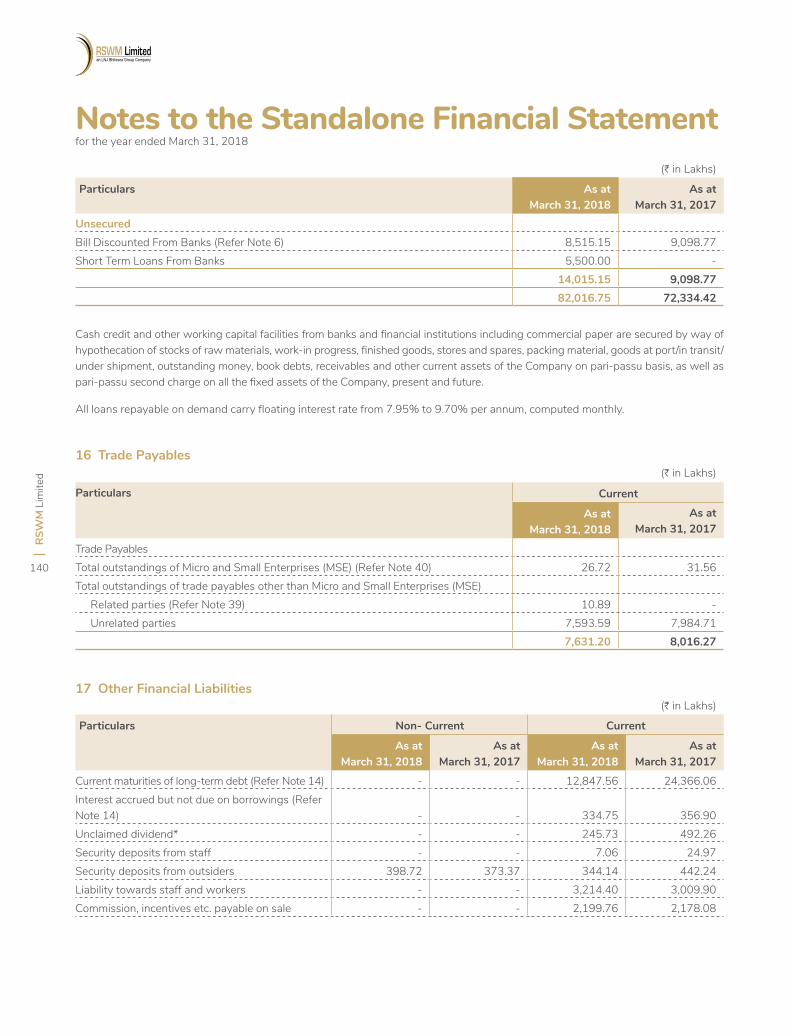
RSW
M L
imite
d
140
Notes to the Standalone Financial Statement for the year ended March 31, 2018
(H in Lakhs)
Particulars As atMarch 31, 2018
As atMarch 31, 2017
UnsecuredBill Discounted From Banks (Refer Note 6) 8,515.15 9,098.77 Short Term Loans From Banks 5,500.00 -
14,015.15 9,098.77 82,016.75 72,334.42
Cash credit and other working capital facilities from banks and financial institutions including commercial paper are secured by way of hypothecation of stocks of raw materials, work-in progress, finished goods, stores and spares, packing material, goods at port/in transit/under shipment, outstanding money, book debts, receivables and other current assets of the Company on pari-passu basis, as well as pari-passu second charge on all the fixed assets of the Company, present and future.
All loans repayable on demand carry floating interest rate from 7.95% to 9.70% per annum, computed monthly.
16 Trade Payables(H in Lakhs)
Particulars Current
As atMarch 31, 2018
As atMarch 31, 2017
Trade PayablesTotal outstandings of Micro and Small Enterprises (MSE) (Refer Note 40) 26.72 31.56 Total outstandings of trade payables other than Micro and Small Enterprises (MSE) Related parties (Refer Note 39) 10.89 - Unrelated parties 7,593.59 7,984.71
7,631.20 8,016.27
17 Other Financial Liabilities(H in Lakhs)
Particulars Non- Current Current
As at March 31, 2018
As at March 31, 2017
As at March 31, 2018
As at March 31, 2017
Current maturities of long-term debt (Refer Note 14) - - 12,847.56 24,366.06 Interest accrued but not due on borrowings (Refer Note 14) - - 334.75 356.90 Unclaimed dividend* - - 245.73 492.26 Security deposits from staff - - 7.06 24.97 Security deposits from outsiders 398.72 373.37 344.14 442.24 Liability towards staff and workers - - 3,214.40 3,009.90 Commission, incentives etc. payable on sale - - 2,199.76 2,178.08
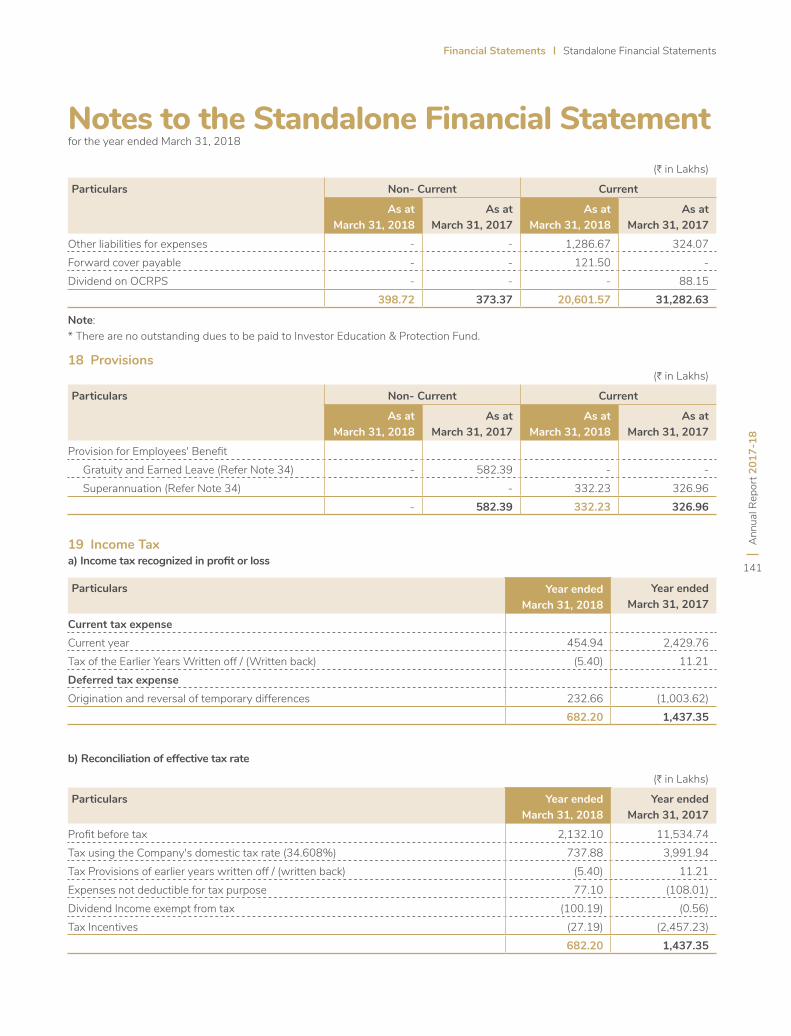
Financial Statements Standalone Financial Statements
Ann
ual R
epor
t 201
7-18
141
Notes to the Standalone Financial Statement for the year ended March 31, 2018
(H in Lakhs)
Particulars Non- Current Current
As at March 31, 2018
As at March 31, 2017
As at March 31, 2018
As at March 31, 2017
Other liabilities for expenses - - 1,286.67 324.07 Forward cover payable - - 121.50 - Dividend on OCRPS - - - 88.15
398.72 373.37 20,601.57 31,282.63
(H in Lakhs)
Particulars Non- Current Current
As at March 31, 2018
As at March 31, 2017
As at March 31, 2018
As at March 31, 2017
Provision for Employees' Benefit Gratuity and Earned Leave (Refer Note 34) - 582.39 - - Superannuation (Refer Note 34) - 332.23 326.96
- 582.39 332.23 326.96
Note:* There are no outstanding dues to be paid to Investor Education & Protection Fund.
18 Provisions
19 Income Tax
b) Reconciliation of effective tax rate
a) Income tax recognized in profit or loss
Particulars Year endedMarch 31, 2018
Year endedMarch 31, 2017
Current tax expenseCurrent year 454.94 2,429.76 Tax of the Earlier Years Written off / (Written back) (5.40) 11.21 Deferred tax expenseOrigination and reversal of temporary differences 232.66 (1,003.62)
682.20 1,437.35
(H in Lakhs)
Particulars Year endedMarch 31, 2018
Year endedMarch 31, 2017
Profit before tax 2,132.10 11,534.74 Tax using the Company's domestic tax rate (34.608%) 737.88 3,991.94 Tax Provisions of earlier years written off / (written back) (5.40) 11.21 Expenses not deductible for tax purpose 77.10 (108.01)Dividend Income exempt from tax (100.19) (0.56)Tax Incentives (27.19) (2,457.23)
682.20 1,437.35
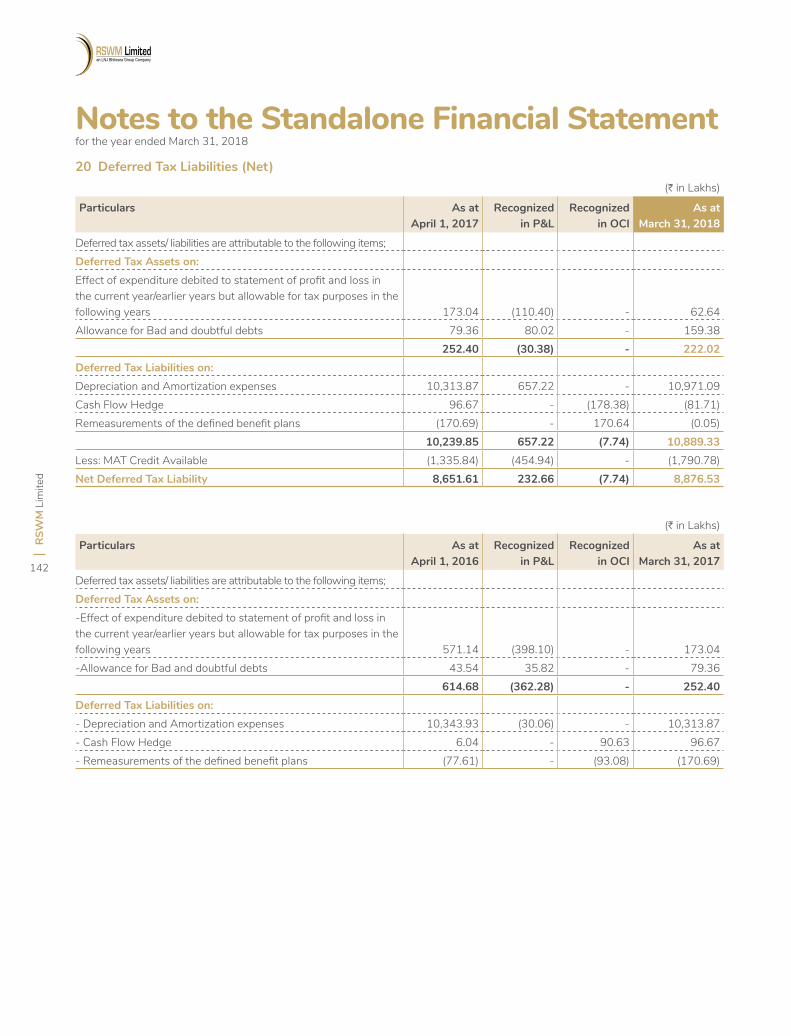
RSW
M L
imite
d
142
Notes to the Standalone Financial Statement for the year ended March 31, 2018
20 Deferred Tax Liabilities (Net)(H in Lakhs)
Particulars As atApril 1, 2017
Recognized in P&L
Recognized in OCI
As at March 31, 2018
Deferred tax assets/ liabilities are attributable to the following items;Deferred Tax Assets on:Effect of expenditure debited to statement of profit and loss in the current year/earlier years but allowable for tax purposes in the following years 173.04 (110.40) - 62.64 Allowance for Bad and doubtful debts 79.36 80.02 - 159.38
252.40 (30.38) - 222.02 Deferred Tax Liabilities on:Depreciation and Amortization expenses 10,313.87 657.22 - 10,971.09 Cash Flow Hedge 96.67 - (178.38) (81.71)Remeasurements of the defined benefit plans (170.69) - 170.64 (0.05)
10,239.85 657.22 (7.74) 10,889.33 Less: MAT Credit Available (1,335.84) (454.94) - (1,790.78)Net Deferred Tax Liability 8,651.61 232.66 (7.74) 8,876.53
(H in Lakhs)
Particulars As atApril 1, 2016
Recognized in P&L
Recognized in OCI
As at March 31, 2017
Deferred tax assets/ liabilities are attributable to the following items;Deferred Tax Assets on:-Effect of expenditure debited to statement of profit and loss in the current year/earlier years but allowable for tax purposes in the following years 571.14 (398.10) - 173.04 -Allowance for Bad and doubtful debts 43.54 35.82 - 79.36
614.68 (362.28) - 252.40 Deferred Tax Liabilities on:- Depreciation and Amortization expenses 10,343.93 (30.06) - 10,313.87 - Cash Flow Hedge 6.04 - 90.63 96.67 - Remeasurements of the defined benefit plans (77.61) - (93.08) (170.69)
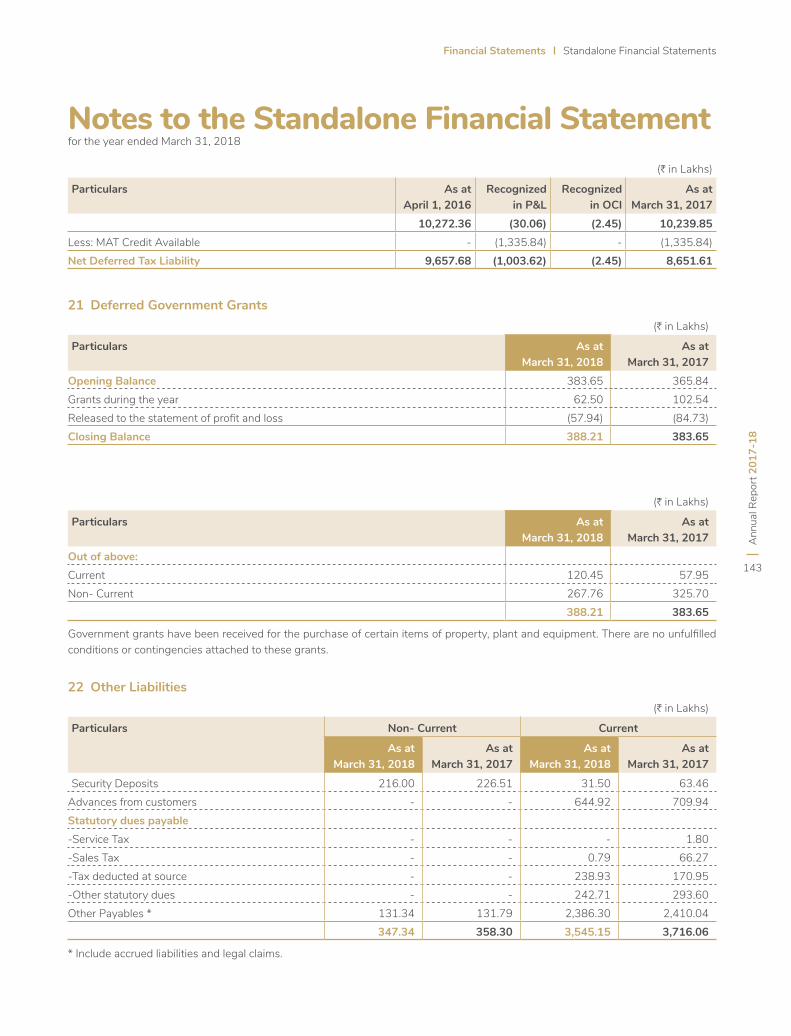
Financial Statements Standalone Financial Statements
Ann
ual R
epor
t 201
7-18
143
Notes to the Standalone Financial Statement for the year ended March 31, 2018
(H in Lakhs)
Particulars As atApril 1, 2016
Recognized in P&L
Recognized in OCI
As at March 31, 2017
10,272.36 (30.06) (2.45) 10,239.85 Less: MAT Credit Available - (1,335.84) - (1,335.84)Net Deferred Tax Liability 9,657.68 (1,003.62) (2.45) 8,651.61
21 Deferred Government Grants
22 Other Liabilities
(H in Lakhs)
Particulars As atMarch 31, 2018
As atMarch 31, 2017
Opening Balance 383.65 365.84 Grants during the year 62.50 102.54 Released to the statement of profit and loss (57.94) (84.73)Closing Balance 388.21 383.65
(H in Lakhs)
Particulars As atMarch 31, 2018
As atMarch 31, 2017
Out of above:Current 120.45 57.95 Non- Current 267.76 325.70
388.21 383.65
Government grants have been received for the purchase of certain items of property, plant and equipment. There are no unfulfilled conditions or contingencies attached to these grants.
(H in Lakhs)
Particulars Non- Current Current
As at March 31, 2018
As at March 31, 2017
As at March 31, 2018
As at March 31, 2017
Security Deposits 216.00 226.51 31.50 63.46 Advances from customers - - 644.92 709.94 Statutory dues payable-Service Tax - - - 1.80 -Sales Tax - - 0.79 66.27 -Tax deducted at source - - 238.93 170.95 -Other statutory dues - - 242.71 293.60 Other Payables * 131.34 131.79 2,386.30 2,410.04
347.34 358.30 3,545.15 3,716.06
* Include accrued liabilities and legal claims.
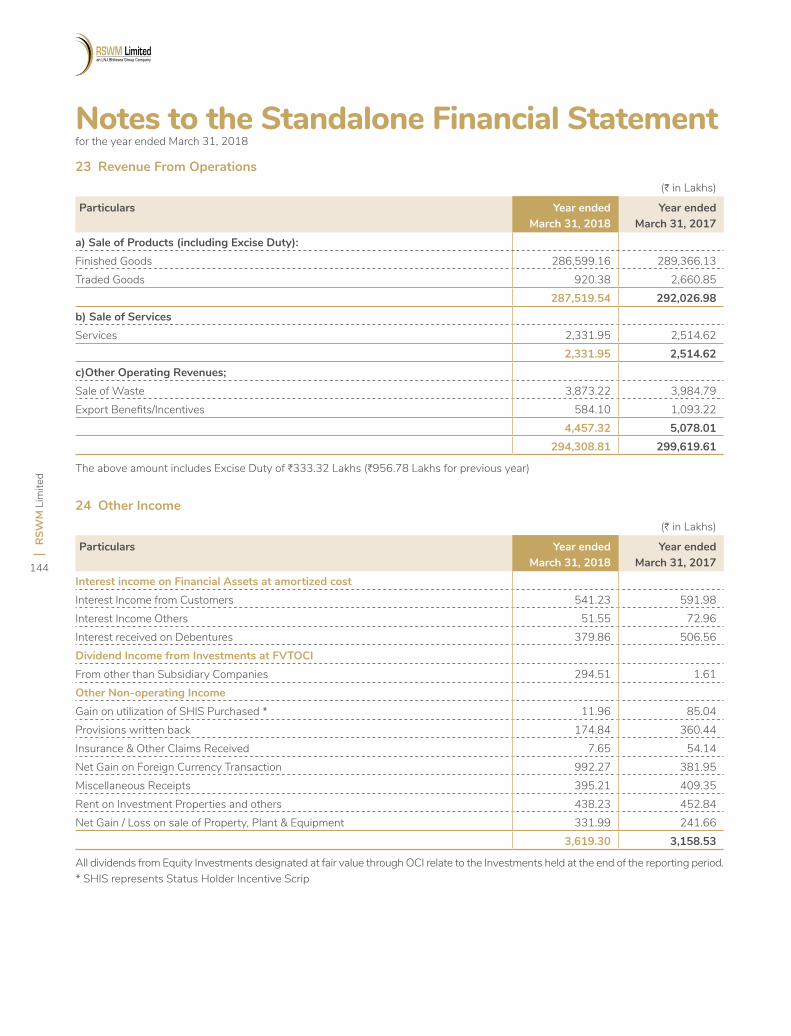
RSW
M L
imite
d
144
Notes to the Standalone Financial Statement for the year ended March 31, 2018
23 Revenue From Operations
24 Other Income
(H in Lakhs)
Particulars Year endedMarch 31, 2018
Year endedMarch 31, 2017
a) Sale of Products (including Excise Duty):Finished Goods 286,599.16 289,366.13 Traded Goods 920.38 2,660.85
287,519.54 292,026.98 b) Sale of ServicesServices 2,331.95 2,514.62
2,331.95 2,514.62 c)Other Operating Revenues;Sale of Waste 3,873.22 3,984.79 Export Benefits/Incentives 584.10 1,093.22
4,457.32 5,078.01 294,308.81 299,619.61
(H in Lakhs)
Particulars Year endedMarch 31, 2018
Year endedMarch 31, 2017
Interest income on Financial Assets at amortized costInterest Income from Customers 541.23 591.98 Interest Income Others 51.55 72.96 Interest received on Debentures 379.86 506.56 Dividend Income from Investments at FVTOCIFrom other than Subsidiary Companies 294.51 1.61 Other Non-operating IncomeGain on utilization of SHIS Purchased * 11.96 85.04 Provisions written back 174.84 360.44 Insurance & Other Claims Received 7.65 54.14 Net Gain on Foreign Currency Transaction 992.27 381.95 Miscellaneous Receipts 395.21 409.35 Rent on Investment Properties and others 438.23 452.84 Net Gain / Loss on sale of Property, Plant & Equipment 331.99 241.66
3,619.30 3,158.53
The above amount includes Excise Duty of H333.32 Lakhs (H956.78 Lakhs for previous year)
All dividends from Equity Investments designated at fair value through OCI relate to the Investments held at the end of the reporting period.* SHIS represents Status Holder Incentive Scrip
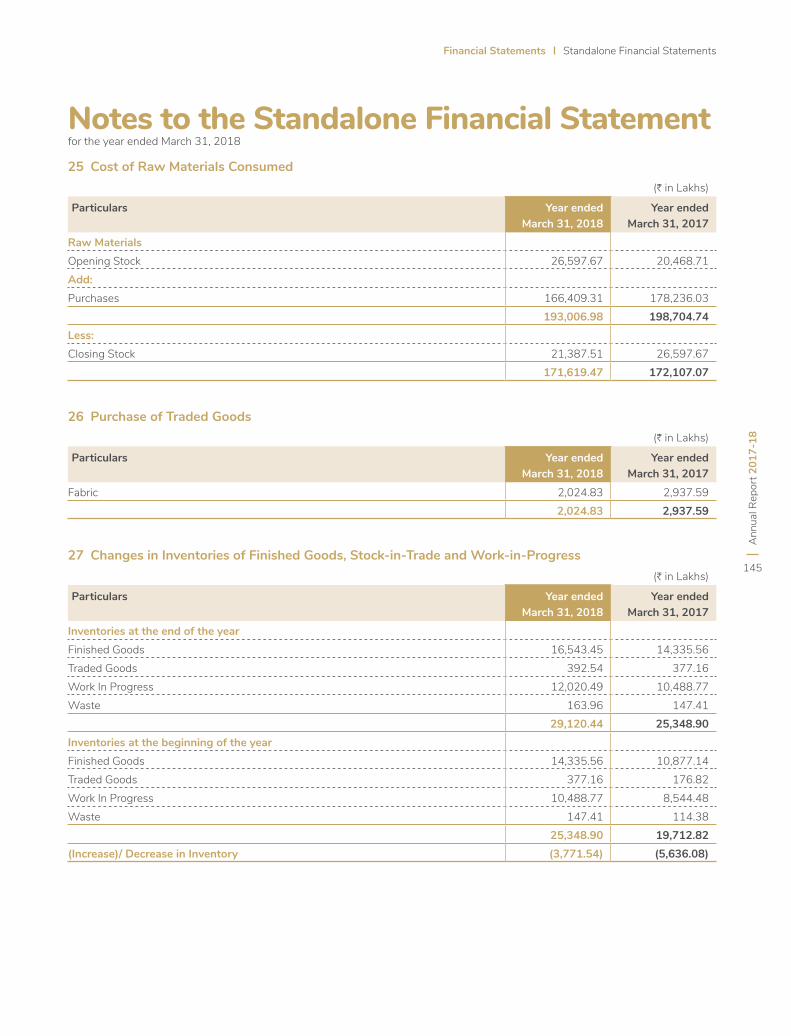
Financial Statements Standalone Financial Statements
Ann
ual R
epor
t 201
7-18
145
Notes to the Standalone Financial Statement for the year ended March 31, 2018
25 Cost of Raw Materials Consumed
26 Purchase of Traded Goods
27 Changes in Inventories of Finished Goods, Stock-in-Trade and Work-in-Progress
(H in Lakhs)
Particulars Year endedMarch 31, 2018
Year endedMarch 31, 2017
Raw MaterialsOpening Stock 26,597.67 20,468.71 Add:Purchases 166,409.31 178,236.03
193,006.98 198,704.74 Less:Closing Stock 21,387.51 26,597.67
171,619.47 172,107.07
(H in Lakhs)
Particulars Year endedMarch 31, 2018
Year endedMarch 31, 2017
Fabric 2,024.83 2,937.59 2,024.83 2,937.59
(H in Lakhs)
Particulars Year endedMarch 31, 2018
Year endedMarch 31, 2017
Inventories at the end of the yearFinished Goods 16,543.45 14,335.56 Traded Goods 392.54 377.16 Work In Progress 12,020.49 10,488.77 Waste 163.96 147.41
29,120.44 25,348.90 Inventories at the beginning of the yearFinished Goods 14,335.56 10,877.14 Traded Goods 377.16 176.82 Work In Progress 10,488.77 8,544.48 Waste 147.41 114.38
25,348.90 19,712.82 (Increase)/ Decrease in Inventory (3,771.54) (5,636.08)
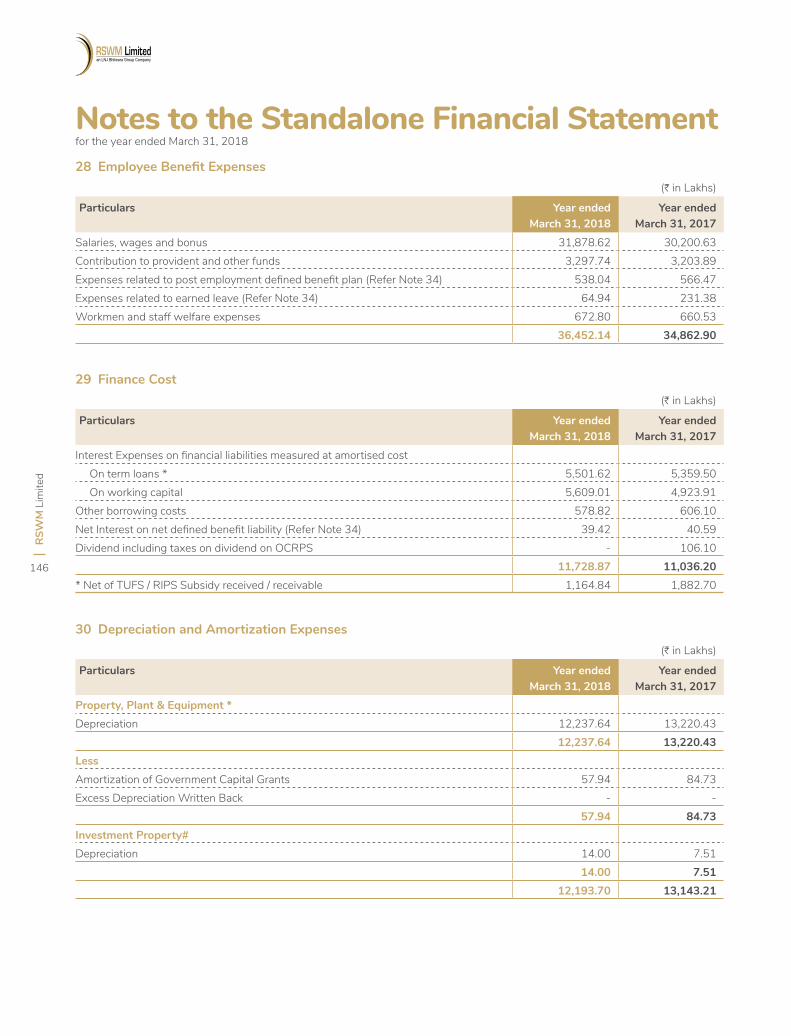
RSW
M L
imite
d
146
Notes to the Standalone Financial Statement for the year ended March 31, 2018
28 Employee Benefit Expenses
29 Finance Cost
30 Depreciation and Amortization Expenses
(H in Lakhs)
Particulars Year endedMarch 31, 2018
Year endedMarch 31, 2017
Salaries, wages and bonus 31,878.62 30,200.63 Contribution to provident and other funds 3,297.74 3,203.89 Expenses related to post employment defined benefit plan (Refer Note 34) 538.04 566.47 Expenses related to earned leave (Refer Note 34) 64.94 231.38 Workmen and staff welfare expenses 672.80 660.53
36,452.14 34,862.90
(H in Lakhs)
Particulars Year endedMarch 31, 2018
Year endedMarch 31, 2017
Interest Expenses on financial liabilities measured at amortised cost On term loans * 5,501.62 5,359.50 On working capital 5,609.01 4,923.91 Other borrowing costs 578.82 606.10 Net Interest on net defined benefit liability (Refer Note 34) 39.42 40.59 Dividend including taxes on dividend on OCRPS - 106.10
11,728.87 11,036.20 * Net of TUFS / RIPS Subsidy received / receivable 1,164.84 1,882.70
(H in Lakhs)
Particulars Year endedMarch 31, 2018
Year endedMarch 31, 2017
Property, Plant & Equipment *Depreciation 12,237.64 13,220.43
12,237.64 13,220.43 LessAmortization of Government Capital Grants 57.94 84.73 Excess Depreciation Written Back - -
57.94 84.73 Investment Property#Depreciation 14.00 7.51
14.00 7.51 12,193.70 13,143.21
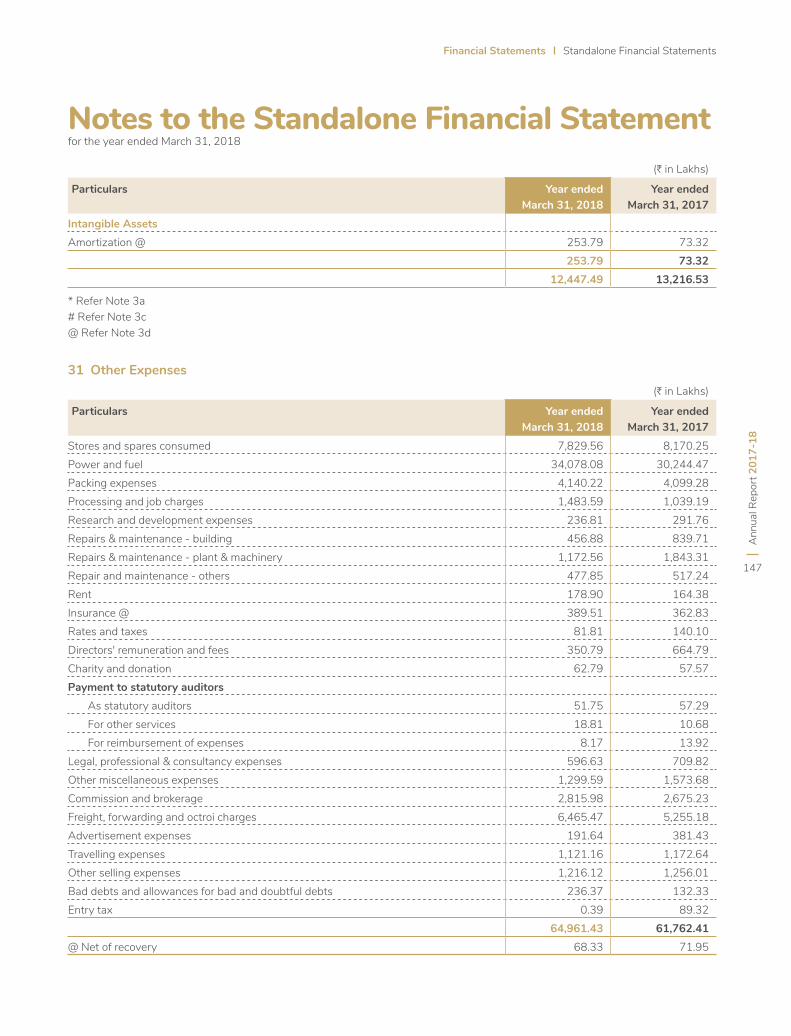
Financial Statements Standalone Financial Statements
Ann
ual R
epor
t 201
7-18
147
Notes to the Standalone Financial Statement for the year ended March 31, 2018
31 Other Expenses
(H in Lakhs)
Particulars Year endedMarch 31, 2018
Year endedMarch 31, 2017
Intangible AssetsAmortization @ 253.79 73.32
253.79 73.32 12,447.49 13,216.53
(H in Lakhs)
Particulars Year endedMarch 31, 2018
Year endedMarch 31, 2017
Stores and spares consumed 7,829.56 8,170.25 Power and fuel 34,078.08 30,244.47 Packing expenses 4,140.22 4,099.28 Processing and job charges 1,483.59 1,039.19 Research and development expenses 236.81 291.76 Repairs & maintenance - building 456.88 839.71 Repairs & maintenance - plant & machinery 1,172.56 1,843.31 Repair and maintenance - others 477.85 517.24 Rent 178.90 164.38 Insurance @ 389.51 362.83 Rates and taxes 81.81 140.10 Directors' remuneration and fees 350.79 664.79 Charity and donation 62.79 57.57 Payment to statutory auditors As statutory auditors 51.75 57.29 For other services 18.81 10.68 For reimbursement of expenses 8.17 13.92 Legal, professional & consultancy expenses 596.63 709.82 Other miscellaneous expenses 1,299.59 1,573.68 Commission and brokerage 2,815.98 2,675.23 Freight, forwarding and octroi charges 6,465.47 5,255.18 Advertisement expenses 191.64 381.43 Travelling expenses 1,121.16 1,172.64 Other selling expenses 1,216.12 1,256.01 Bad debts and allowances for bad and doubtful debts 236.37 132.33 Entry tax 0.39 89.32
64,961.43 61,762.41 @ Net of recovery 68.33 71.95
* Refer Note 3a# Refer Note 3c@ Refer Note 3d
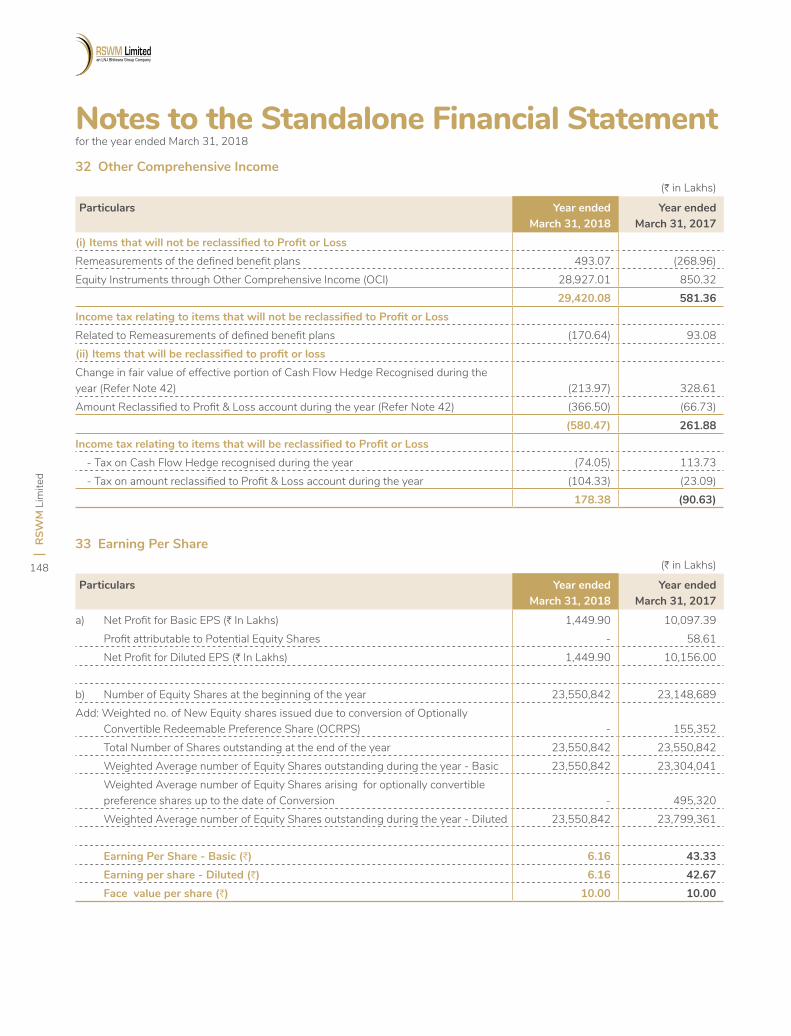
RSW
M L
imite
d
148
Notes to the Standalone Financial Statement for the year ended March 31, 2018
32 Other Comprehensive Income
33 Earning Per Share
(H in Lakhs)
Particulars Year endedMarch 31, 2018
Year endedMarch 31, 2017
(i) Items that will not be reclassified to Profit or LossRemeasurements of the defined benefit plans 493.07 (268.96)Equity Instruments through Other Comprehensive Income (OCI) 28,927.01 850.32
29,420.08 581.36 Income tax relating to items that will not be reclassified to Profit or LossRelated to Remeasurements of defined benefit plans (170.64) 93.08 (ii) Items that will be reclassified to profit or lossChange in fair value of effective portion of Cash Flow Hedge Recognised during the year (Refer Note 42) (213.97) 328.61 Amount Reclassified to Profit & Loss account during the year (Refer Note 42) (366.50) (66.73)
(580.47) 261.88 Income tax relating to items that will be reclassified to Profit or Loss - Tax on Cash Flow Hedge recognised during the year (74.05) 113.73 - Tax on amount reclassified to Profit & Loss account during the year (104.33) (23.09)
178.38 (90.63)
(H in Lakhs)
Particulars Year endedMarch 31, 2018
Year endedMarch 31, 2017
a) Net Profit for Basic EPS (H In Lakhs) 1,449.90 10,097.39 Profit attributable to Potential Equity Shares - 58.61 Net Profit for Diluted EPS (H In Lakhs) 1,449.90 10,156.00 b) Number of Equity Shares at the beginning of the year 23,550,842 23,148,689 Add: Weighted no. of New Equity shares issued due to conversion of Optionally
Convertible Redeemable Preference Share (OCRPS) - 155,352 Total Number of Shares outstanding at the end of the year 23,550,842 23,550,842 Weighted Average number of Equity Shares outstanding during the year - Basic 23,550,842 23,304,041 Weighted Average number of Equity Shares arising for optionally convertible
preference shares up to the date of Conversion - 495,320 Weighted Average number of Equity Shares outstanding during the year - Diluted 23,550,842 23,799,361 Earning Per Share - Basic (H) 6.16 43.33 Earning per share - Diluted (H) 6.16 42.67 Face value per share (H) 10.00 10.00
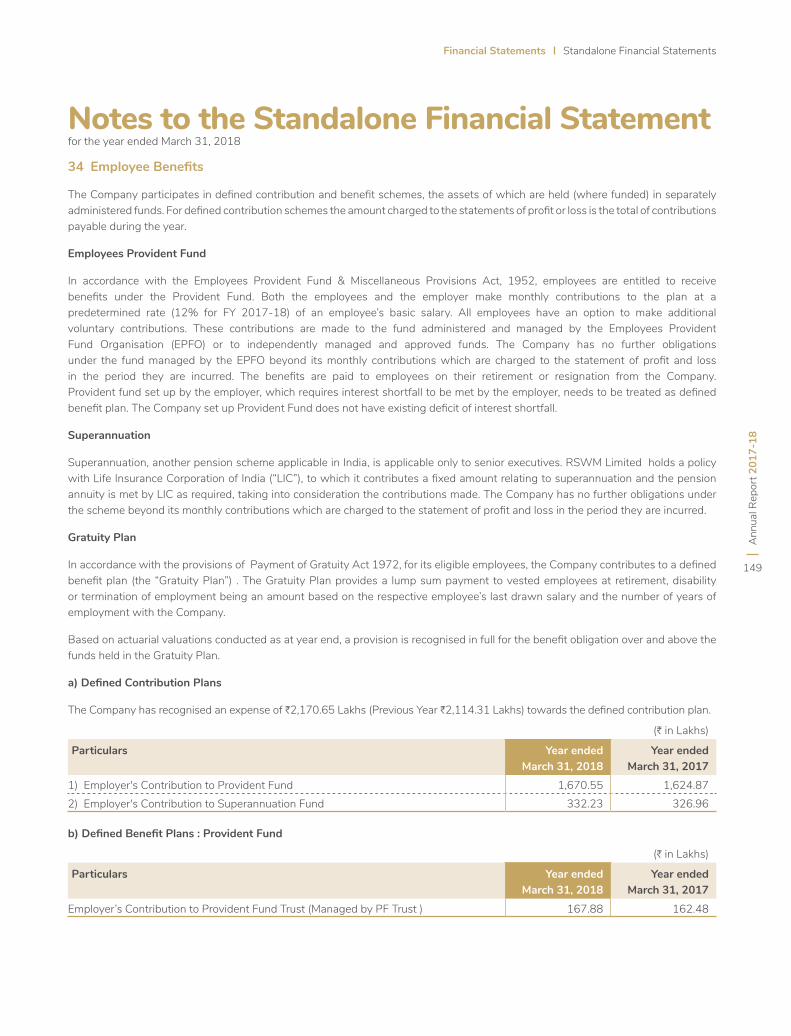
Financial Statements Standalone Financial Statements
Ann
ual R
epor
t 201
7-18
149
Notes to the Standalone Financial Statement for the year ended March 31, 2018
34 Employee Benefits
The Company participates in defined contribution and benefit schemes, the assets of which are held (where funded) in separately administered funds. For defined contribution schemes the amount charged to the statements of profit or loss is the total of contributions payable during the year.
Employees Provident Fund
In accordance with the Employees Provident Fund & Miscellaneous Provisions Act, 1952, employees are entitled to receive benefits under the Provident Fund. Both the employees and the employer make monthly contributions to the plan at a predetermined rate (12% for FY 2017-18) of an employee’s basic salary. All employees have an option to make additional voluntary contributions. These contributions are made to the fund administered and managed by the Employees Provident Fund Organisation (EPFO) or to independently managed and approved funds. The Company has no further obligations under the fund managed by the EPFO beyond its monthly contributions which are charged to the statement of profit and loss in the period they are incurred. The benefits are paid to employees on their retirement or resignation from the Company. Provident fund set up by the employer, which requires interest shortfall to be met by the employer, needs to be treated as defined benefit plan. The Company set up Provident Fund does not have existing deficit of interest shortfall.
Superannuation
Superannuation, another pension scheme applicable in India, is applicable only to senior executives. RSWM Limited holds a policy with Life Insurance Corporation of India (“LIC”), to which it contributes a fixed amount relating to superannuation and the pension annuity is met by LIC as required, taking into consideration the contributions made. The Company has no further obligations under the scheme beyond its monthly contributions which are charged to the statement of profit and loss in the period they are incurred.
Gratuity Plan
In accordance with the provisions of Payment of Gratuity Act 1972, for its eligible employees, the Company contributes to a defined benefit plan (the “Gratuity Plan”) . The Gratuity Plan provides a lump sum payment to vested employees at retirement, disability or termination of employment being an amount based on the respective employee’s last drawn salary and the number of years of employment with the Company.
Based on actuarial valuations conducted as at year end, a provision is recognised in full for the benefit obligation over and above the funds held in the Gratuity Plan.
a) Defined Contribution Plans
The Company has recognised an expense of H2,170.65 Lakhs (Previous Year H2,114.31 Lakhs) towards the defined contribution plan.
(H in Lakhs)
Particulars Year endedMarch 31, 2018
Year endedMarch 31, 2017
1) Employer's Contribution to Provident Fund 1,670.55 1,624.87 2) Employer's Contribution to Superannuation Fund 332.23 326.96
(H in Lakhs)
Particulars Year endedMarch 31, 2018
Year endedMarch 31, 2017
Employer’s Contribution to Provident Fund Trust (Managed by PF Trust ) 167.88 162.48
b) Defined Benefit Plans : Provident Fund
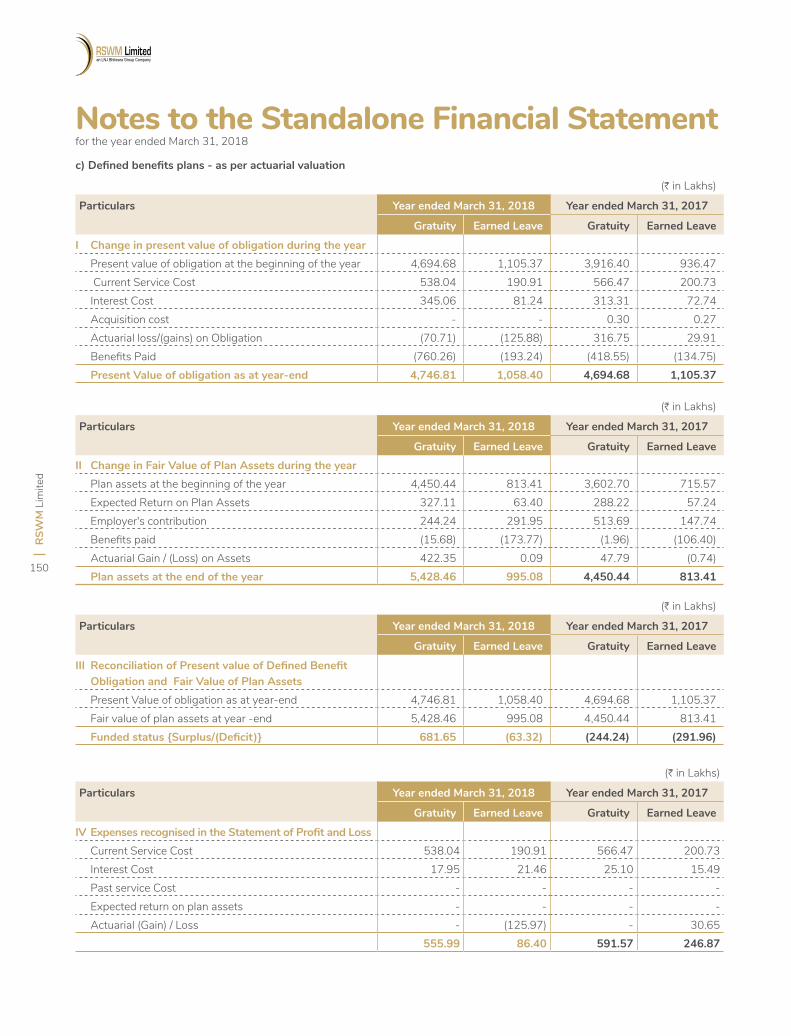
RSW
M L
imite
d
150
Notes to the Standalone Financial Statement for the year ended March 31, 2018
c) Defined benefits plans - as per actuarial valuation
(H in Lakhs)
Particulars Year ended March 31, 2018 Year ended March 31, 2017
Gratuity Earned Leave Gratuity Earned Leave
I Change in present value of obligation during the year Present value of obligation at the beginning of the year 4,694.68 1,105.37 3,916.40 936.47 Current Service Cost 538.04 190.91 566.47 200.73 Interest Cost 345.06 81.24 313.31 72.74 Acquisition cost - - 0.30 0.27 Actuarial loss/(gains) on Obligation (70.71) (125.88) 316.75 29.91 Benefits Paid (760.26) (193.24) (418.55) (134.75) Present Value of obligation as at year-end 4,746.81 1,058.40 4,694.68 1,105.37
(H in Lakhs)
Particulars Year ended March 31, 2018 Year ended March 31, 2017
Gratuity Earned Leave Gratuity Earned Leave
III Reconciliation of Present value of Defined Benefit Obligation and Fair Value of Plan Assets
Present Value of obligation as at year-end 4,746.81 1,058.40 4,694.68 1,105.37 Fair value of plan assets at year -end 5,428.46 995.08 4,450.44 813.41 Funded status {Surplus/(Deficit)} 681.65 (63.32) (244.24) (291.96)
(H in Lakhs)
Particulars Year ended March 31, 2018 Year ended March 31, 2017
Gratuity Earned Leave Gratuity Earned Leave
IV Expenses recognised in the Statement of Profit and Loss Current Service Cost 538.04 190.91 566.47 200.73 Interest Cost 17.95 21.46 25.10 15.49 Past service Cost - - - - Expected return on plan assets - - - - Actuarial (Gain) / Loss - (125.97) - 30.65
555.99 86.40 591.57 246.87
(H in Lakhs)
Particulars Year ended March 31, 2018 Year ended March 31, 2017
Gratuity Earned Leave Gratuity Earned LeaveII Change in Fair Value of Plan Assets during the year Plan assets at the beginning of the year 4,450.44 813.41 3,602.70 715.57 Expected Return on Plan Assets 327.11 63.40 288.22 57.24 Employer's contribution 244.24 291.95 513.69 147.74 Benefits paid (15.68) (173.77) (1.96) (106.40) Actuarial Gain / (Loss) on Assets 422.35 0.09 47.79 (0.74) Plan assets at the end of the year 5,428.46 995.08 4,450.44 813.41
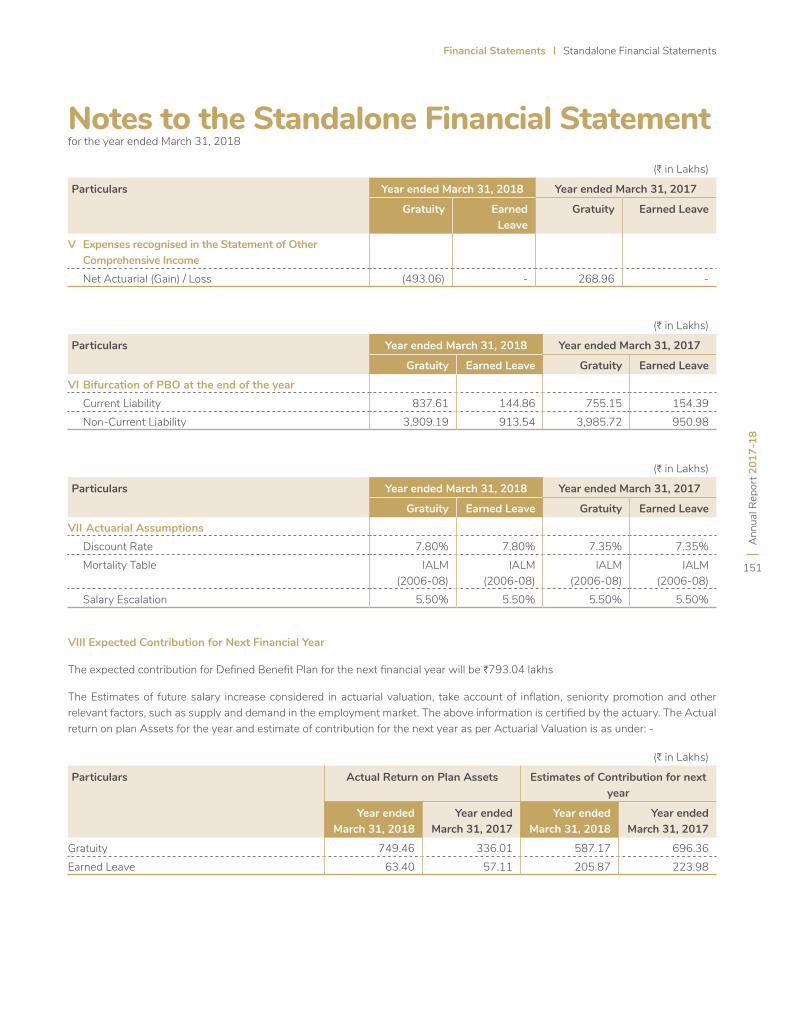
Financial Statements Standalone Financial Statements
Ann
ual R
epor
t 201
7-18
151
Notes to the Standalone Financial Statement for the year ended March 31, 2018
(H in Lakhs)
Particulars Year ended March 31, 2018 Year ended March 31, 2017
Gratuity Earned Leave
Gratuity Earned Leave
V Expenses recognised in the Statement of Other Comprehensive Income
Net Actuarial (Gain) / Loss (493.06) - 268.96 -
(H in Lakhs)
Particulars Year ended March 31, 2018 Year ended March 31, 2017
Gratuity Earned Leave Gratuity Earned Leave
VI Bifurcation of PBO at the end of the year Current Liability 837.61 144.86 755.15 154.39 Non-Current Liability 3,909.19 913.54 3,985.72 950.98
(H in Lakhs)
Particulars Year ended March 31, 2018 Year ended March 31, 2017
Gratuity Earned Leave Gratuity Earned Leave
VII Actuarial Assumptions Discount Rate 7.80% 7.80% 7.35% 7.35% Mortality Table IALM
(2006-08) IALM
(2006-08) IALM
(2006-08) IALM
(2006-08) Salary Escalation 5.50% 5.50% 5.50% 5.50%
VIII Expected Contribution for Next Financial Year
The expected contribution for Defined Benefit Plan for the next financial year will be H793.04 lakhs
The Estimates of future salary increase considered in actuarial valuation, take account of inflation, seniority promotion and other relevant factors, such as supply and demand in the employment market. The above information is certified by the actuary. The Actual return on plan Assets for the year and estimate of contribution for the next year as per Actuarial Valuation is as under: -
(H in Lakhs)
Particulars Actual Return on Plan Assets Estimates of Contribution for next year
Year ended March 31, 2018
Year ended March 31, 2017
Year ended March 31, 2018
Year ended March 31, 2017
Gratuity 749.46 336.01 587.17 696.36 Earned Leave 63.40 57.11 205.87 223.98
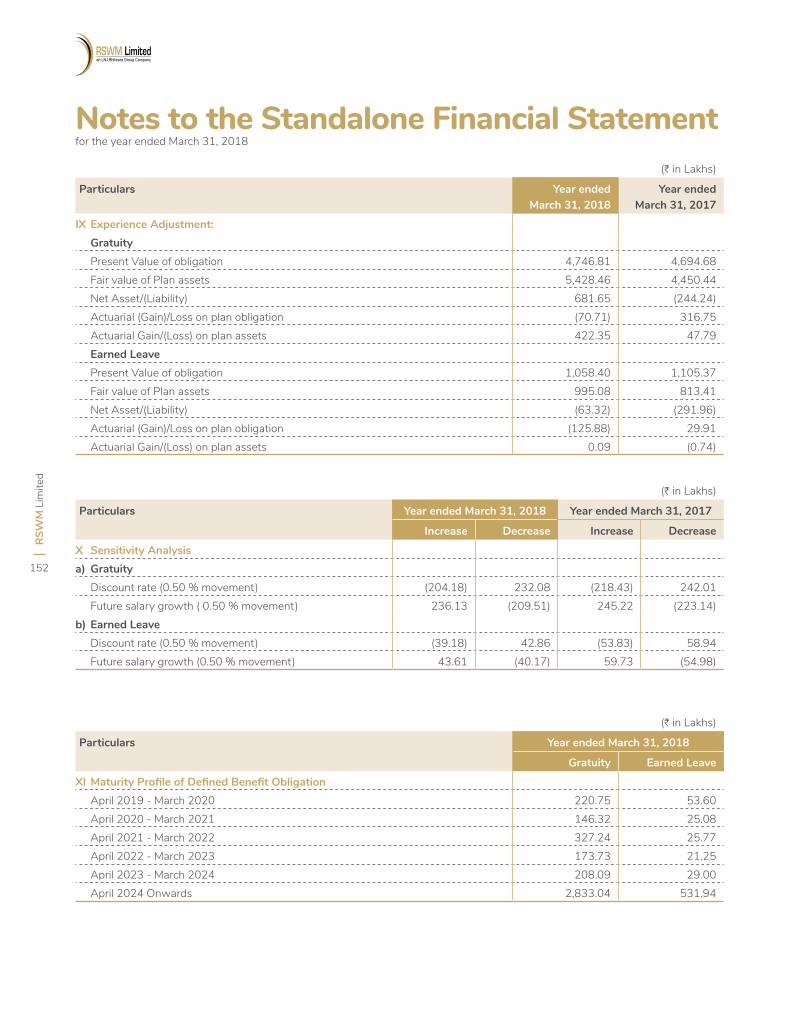
RSW
M L
imite
d
152
Notes to the Standalone Financial Statement for the year ended March 31, 2018
(H in Lakhs)
Particulars Year endedMarch 31, 2018
Year endedMarch 31, 2017
IX Experience Adjustment: Gratuity Present Value of obligation 4,746.81 4,694.68 Fair value of Plan assets 5,428.46 4,450.44 Net Asset/(Liability) 681.65 (244.24) Actuarial (Gain)/Loss on plan obligation (70.71) 316.75 Actuarial Gain/(Loss) on plan assets 422.35 47.79 Earned Leave Present Value of obligation 1,058.40 1,105.37 Fair value of Plan assets 995.08 813.41 Net Asset/(Liability) (63.32) (291.96) Actuarial (Gain)/Loss on plan obligation (125.88) 29.91 Actuarial Gain/(Loss) on plan assets 0.09 (0.74)
(H in Lakhs)
Particulars Year ended March 31, 2018 Year ended March 31, 2017
Increase Decrease Increase Decrease
X Sensitivity Analysisa) Gratuity Discount rate (0.50 % movement) (204.18) 232.08 (218.43) 242.01 Future salary growth ( 0.50 % movement) 236.13 (209.51) 245.22 (223.14)b) Earned Leave Discount rate (0.50 % movement) (39.18) 42.86 (53.83) 58.94 Future salary growth (0.50 % movement) 43.61 (40.17) 59.73 (54.98)
(H in Lakhs)
Particulars Year ended March 31, 2018
Gratuity Earned Leave
XI Maturity Profile of Defined Benefit Obligation April 2019 - March 2020 220.75 53.60 April 2020 - March 2021 146.32 25.08 April 2021 - March 2022 327.24 25.77 April 2022 - March 2023 173.73 21.25 April 2023 - March 2024 208.09 29.00 April 2024 Onwards 2,833.04 531.94
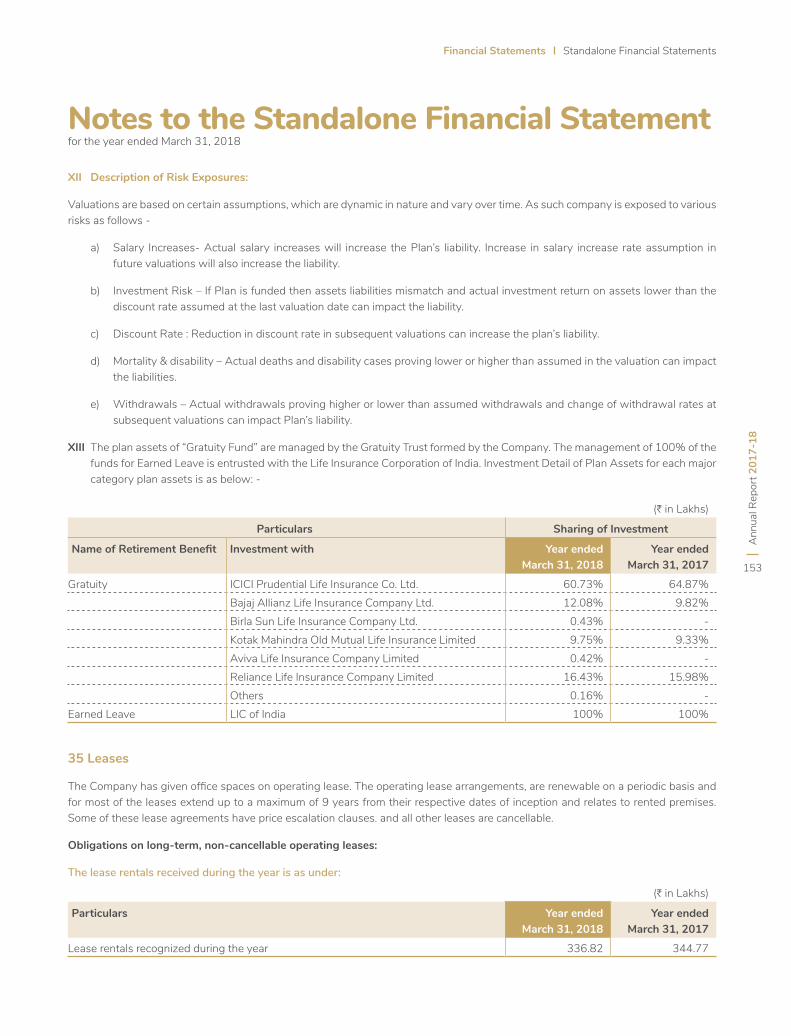
Financial Statements Standalone Financial Statements
Ann
ual R
epor
t 201
7-18
153
Notes to the Standalone Financial Statement for the year ended March 31, 2018
(H in Lakhs)
Particulars Sharing of Investment
Name of Retirement Benefit Investment with Year endedMarch 31, 2018
Year endedMarch 31, 2017
Gratuity ICICI Prudential Life Insurance Co. Ltd. 60.73% 64.87%Bajaj Allianz Life Insurance Company Ltd. 12.08% 9.82%Birla Sun Life Insurance Company Ltd. 0.43% -Kotak Mahindra Old Mutual Life Insurance Limited 9.75% 9.33%Aviva Life Insurance Company Limited 0.42% -Reliance Life Insurance Company Limited 16.43% 15.98%Others 0.16% -
Earned Leave LIC of India 100% 100%
XII Description of Risk Exposures:
Valuations are based on certain assumptions, which are dynamic in nature and vary over time. As such company is exposed to various risks as follows -
a) Salary Increases- Actual salary increases will increase the Plan’s liability. Increase in salary increase rate assumption in future valuations will also increase the liability.
b) Investment Risk – If Plan is funded then assets liabilities mismatch and actual investment return on assets lower than the discount rate assumed at the last valuation date can impact the liability.
c) Discount Rate : Reduction in discount rate in subsequent valuations can increase the plan’s liability.
d) Mortality & disability – Actual deaths and disability cases proving lower or higher than assumed in the valuation can impact the liabilities.
e) Withdrawals – Actual withdrawals proving higher or lower than assumed withdrawals and change of withdrawal rates at subsequent valuations can impact Plan’s liability.
XIII The plan assets of “Gratuity Fund” are managed by the Gratuity Trust formed by the Company. The management of 100% of the funds for Earned Leave is entrusted with the Life Insurance Corporation of India. Investment Detail of Plan Assets for each major category plan assets is as below: -
35 Leases
The Company has given office spaces on operating lease. The operating lease arrangements, are renewable on a periodic basis and for most of the leases extend up to a maximum of 9 years from their respective dates of inception and relates to rented premises. Some of these lease agreements have price escalation clauses. and all other leases are cancellable.
Obligations on long-term, non-cancellable operating leases:
The lease rentals received during the year is as under:
(H in Lakhs)
Particulars Year endedMarch 31, 2018
Year endedMarch 31, 2017
Lease rentals recognized during the year 336.82 344.77
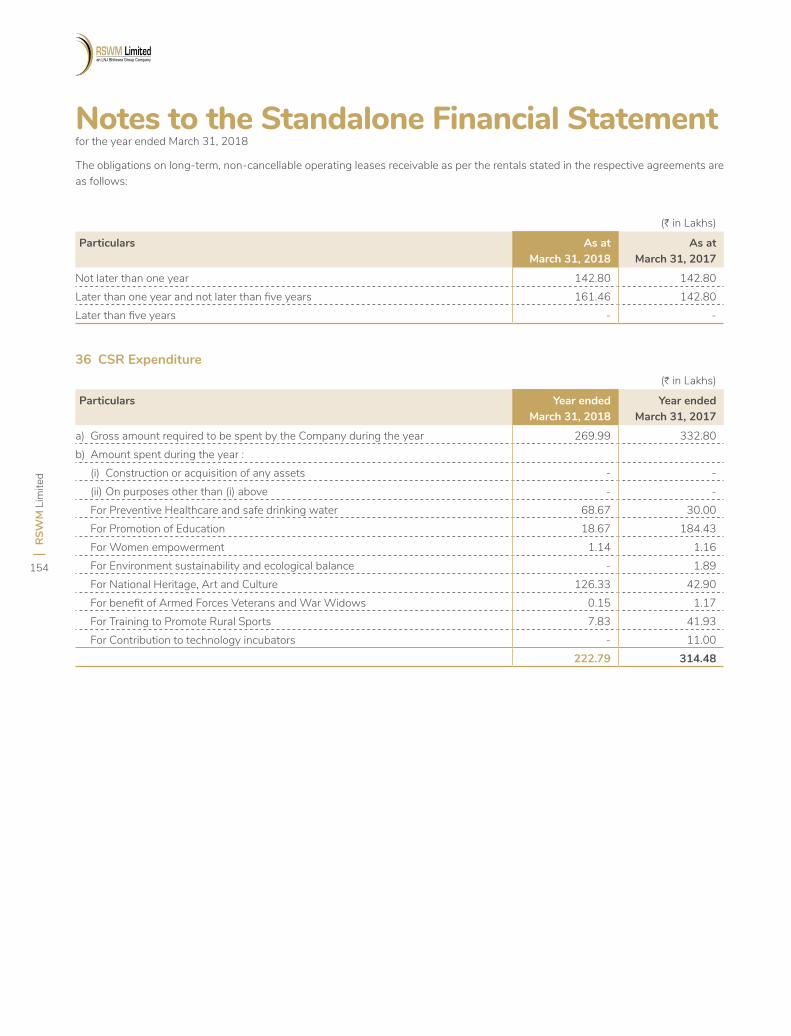
RSW
M L
imite
d
154
Notes to the Standalone Financial Statement for the year ended March 31, 2018
The obligations on long-term, non-cancellable operating leases receivable as per the rentals stated in the respective agreements are as follows:
(H in Lakhs)
Particulars As atMarch 31, 2018
As atMarch 31, 2017
Not later than one year 142.80 142.80 Later than one year and not later than five years 161.46 142.80 Later than five years - -
(H in Lakhs)
Particulars Year endedMarch 31, 2018
Year endedMarch 31, 2017
a) Gross amount required to be spent by the Company during the year 269.99 332.80 b) Amount spent during the year : (i) Construction or acquisition of any assets - - (ii) On purposes other than (i) above - - For Preventive Healthcare and safe drinking water 68.67 30.00 For Promotion of Education 18.67 184.43 For Women empowerment 1.14 1.16 For Environment sustainability and ecological balance - 1.89 For National Heritage, Art and Culture 126.33 42.90 For benefit of Armed Forces Veterans and War Widows 0.15 1.17 For Training to Promote Rural Sports 7.83 41.93 For Contribution to technology incubators - 11.00
222.79 314.48
36 CSR Expenditure
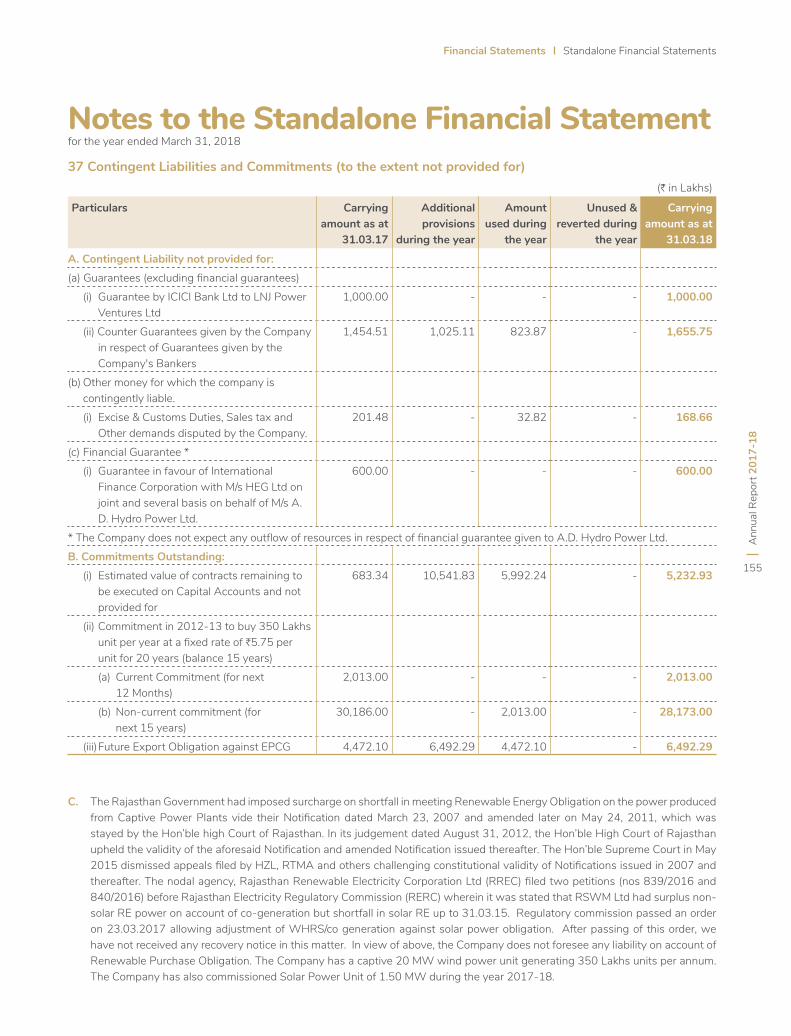
Financial Statements Standalone Financial Statements
Ann
ual R
epor
t 201
7-18
155
Notes to the Standalone Financial Statement for the year ended March 31, 2018
37 Contingent Liabilities and Commitments (to the extent not provided for)(H in Lakhs)
Particulars Carrying amount as at
31.03.17
Additional provisions
during the year
Amount used during
the year
Unused & reverted during
the year
Carrying amount as at
31.03.18
A. Contingent Liability not provided for:(a) Guarantees (excluding financial guarantees) (i) Guarantee by ICICI Bank Ltd to LNJ Power
Ventures Ltd 1,000.00 - - - 1,000.00
(ii) Counter Guarantees given by the Company in respect of Guarantees given by the Company's Bankers
1,454.51 1,025.11 823.87 - 1,655.75
(b) Other money for which the company is contingently liable.
(i) Excise & Customs Duties, Sales tax and Other demands disputed by the Company.
201.48 - 32.82 - 168.66
(c) Financial Guarantee * (i) Guarantee in favour of International
Finance Corporation with M/s HEG Ltd on joint and several basis on behalf of M/s A. D. Hydro Power Ltd.
600.00 - - - 600.00
* The Company does not expect any outflow of resources in respect of financial guarantee given to A.D. Hydro Power Ltd.B. Commitments Outstanding: (i) Estimated value of contracts remaining to
be executed on Capital Accounts and not provided for
683.34 10,541.83 5,992.24 - 5,232.93
(ii) Commitment in 2012-13 to buy 350 Lakhs unit per year at a fixed rate of H5.75 per unit for 20 years (balance 15 years)
(a) Current Commitment (for next 12 Months)
2,013.00 - - - 2,013.00
(b) Non-current commitment (for next 15 years)
30,186.00 - 2,013.00 - 28,173.00
(iii) Future Export Obligation against EPCG 4,472.10 6,492.29 4,472.10 - 6,492.29
C. The Rajasthan Government had imposed surcharge on shortfall in meeting Renewable Energy Obligation on the power produced from Captive Power Plants vide their Notification dated March 23, 2007 and amended later on May 24, 2011, which was stayed by the Hon’ble high Court of Rajasthan. In its judgement dated August 31, 2012, the Hon’ble High Court of Rajasthan upheld the validity of the aforesaid Notification and amended Notification issued thereafter. The Hon’ble Supreme Court in May 2015 dismissed appeals filed by HZL, RTMA and others challenging constitutional validity of Notifications issued in 2007 and thereafter. The nodal agency, Rajasthan Renewable Electricity Corporation Ltd (RREC) filed two petitions (nos 839/2016 and 840/2016) before Rajasthan Electricity Regulatory Commission (RERC) wherein it was stated that RSWM Ltd had surplus non-solar RE power on account of co-generation but shortfall in solar RE up to 31.03.15. Regulatory commission passed an order on 23.03.2017 allowing adjustment of WHRS/co generation against solar power obligation. After passing of this order, we have not received any recovery notice in this matter. In view of above, the Company does not foresee any liability on account of Renewable Purchase Obligation. The Company has a captive 20 MW wind power unit generating 350 Lakhs units per annum. The Company has also commissioned Solar Power Unit of 1.50 MW during the year 2017-18.
RSW
M L
imite
d
156
D. TNEB limited the electricity supply to all their HT consumers based on their previous three years consumption and introduced cross subsidy surcharge for the unutilized portion of “units quota” so fixed, whenever power was purchased by a consumer from 3rd party or from Energy Exchange. On being legally challenged, Supreme Court by its order dated 20.07.2015 directed that the status quo has to be maintained i.e. no cross subsidy charges to be collected. Therefore, management does not foresee any possible liability in this regards.
E. The Company has reviewed all its pending litigations and proceedings and has adequately provided for where provisions are required and disclosed as contingent liabilities where applicable, in its financial statements. The Company also believes that the above issues, when finally settled are not likely to have any significant impact on the financial position of the Company. The Company does not expect any third party reimbursements in respect of above contingent liabilities. (see note no. 45 on litigation).
Notes to the Standalone Financial Statement for the year ended March 31, 2018
38. Segment Information
For management purposes, the Company is organised into business units based on its products and services and has following reportable segments:
Yarn
Fabric
No operating segments have been aggregated to form the above reportable operating segments.
Identification of Segments
The Board of Directors of the Company has been identified as Chief Operating Decision Maker who monitors the operating results of its business segments separately for the purpose of making decisions about resource allocation and performance assessment. Segment performance is evaluated based on profit or loss and is measured consistently with the profit or loss in the financial statements.
Accounting policy in respect of segments is in conformity with the accounting policy of the company as a whole.
Inter-segment Transfer
Segment revenue resulting from transactions with other business segments is accounted for on the basis of transfer price agreed between the segments. Transfer prices between operating segments are on an arm’s length basis in a manner similar to transactions with third parties. These transfers are eliminated in consolidation.
Segment Revenue and Results
The Revenue and Expenditure in relation to the respective segments have been identified and allocated to the extent possible. Other revenue and expenditure non allocable to specific segments are being disclosed separately as unallocated and adjusted directly against the total income of the Company.
Segment Assets and Liabilities
Segment assets include all operating assets used by the operating segment and mainly consisting of property, plant & equipment, trade receivables, cash and cash equivalents and inventory etc. Segment liabilities primarily include trade payables and other liabilities. Common assets and liabilities which can not be allocated to specific segments are shown as a part of unallocable assets/liabilities.
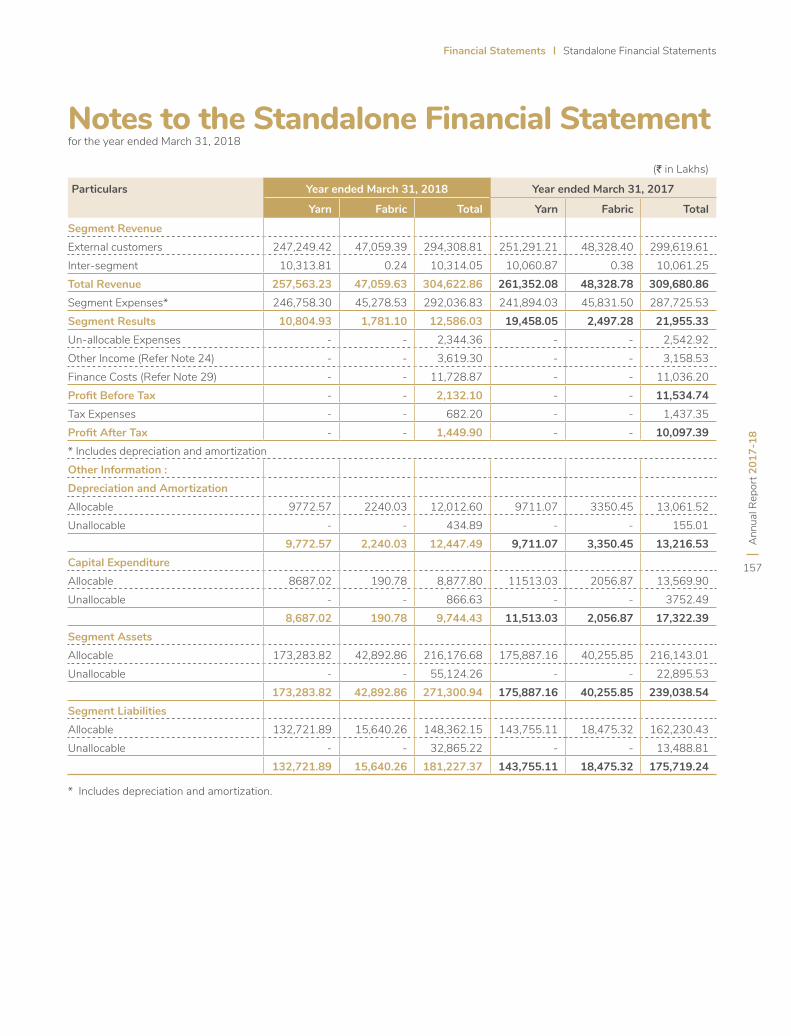
Financial Statements Standalone Financial Statements
Ann
ual R
epor
t 201
7-18
157
Notes to the Standalone Financial Statement for the year ended March 31, 2018
(J in Lakhs)
Particulars Year ended March 31, 2018 Year ended March 31, 2017
Yarn Fabric Total Yarn Fabric Total
Segment RevenueExternal customers 247,249.42 47,059.39 294,308.81 251,291.21 48,328.40 299,619.61 Inter-segment 10,313.81 0.24 10,314.05 10,060.87 0.38 10,061.25 Total Revenue 257,563.23 47,059.63 304,622.86 261,352.08 48,328.78 309,680.86 Segment Expenses* 246,758.30 45,278.53 292,036.83 241,894.03 45,831.50 287,725.53 Segment Results 10,804.93 1,781.10 12,586.03 19,458.05 2,497.28 21,955.33 Un-allocable Expenses - - 2,344.36 - - 2,542.92 Other Income (Refer Note 24) - - 3,619.30 - - 3,158.53 Finance Costs (Refer Note 29) - - 11,728.87 - - 11,036.20 Profit Before Tax - - 2,132.10 - - 11,534.74 Tax Expenses - - 682.20 - - 1,437.35 Profit After Tax - - 1,449.90 - - 10,097.39 * Includes depreciation and amortizationOther Information :Depreciation and AmortizationAllocable 9772.57 2240.03 12,012.60 9711.07 3350.45 13,061.52 Unallocable - - 434.89 - - 155.01
9,772.57 2,240.03 12,447.49 9,711.07 3,350.45 13,216.53 Capital Expenditure Allocable 8687.02 190.78 8,877.80 11513.03 2056.87 13,569.90 Unallocable - - 866.63 - - 3752.49
8,687.02 190.78 9,744.43 11,513.03 2,056.87 17,322.39 Segment AssetsAllocable 173,283.82 42,892.86 216,176.68 175,887.16 40,255.85 216,143.01 Unallocable - - 55,124.26 - - 22,895.53
173,283.82 42,892.86 271,300.94 175,887.16 40,255.85 239,038.54 Segment LiabilitiesAllocable 132,721.89 15,640.26 148,362.15 143,755.11 18,475.32 162,230.43 Unallocable - - 32,865.22 - - 13,488.81
132,721.89 15,640.26 181,227.37 143,755.11 18,475.32 175,719.24
* Includes depreciation and amortization.
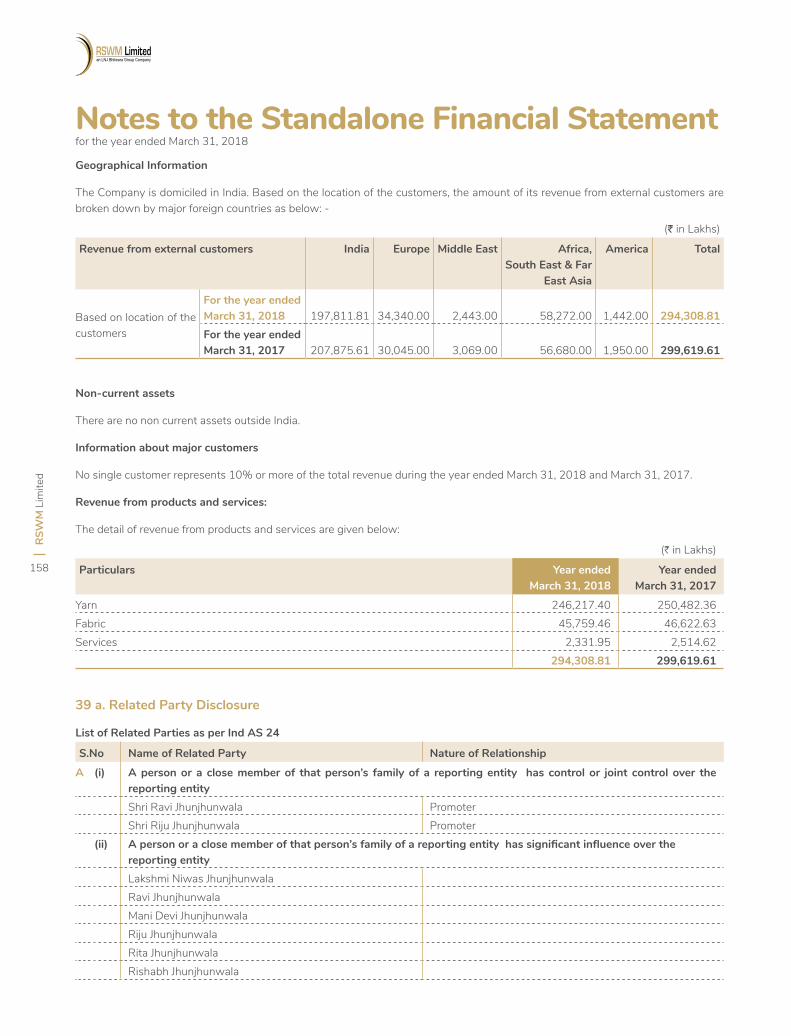
RSW
M L
imite
d
158
Notes to the Standalone Financial Statement for the year ended March 31, 2018
Non-current assets
There are no non current assets outside India.
Information about major customers
No single customer represents 10% or more of the total revenue during the year ended March 31, 2018 and March 31, 2017.
Revenue from products and services:
The detail of revenue from products and services are given below:
(H in Lakhs)
Particulars Year endedMarch 31, 2018
Year endedMarch 31, 2017
Yarn 246,217.40 250,482.36 Fabric 45,759.46 46,622.63 Services 2,331.95 2,514.62
294,308.81 299,619.61
39 a. Related Party Disclosure
List of Related Parties as per Ind AS 24
Geographical Information
The Company is domiciled in India. Based on the location of the customers, the amount of its revenue from external customers are broken down by major foreign countries as below: -
(J in Lakhs)
Revenue from external customers India Europe Middle East Africa, South East & Far
East Asia
America Total
Based on location of the customers
For the year ended March 31, 2018 197,811.81 34,340.00 2,443.00 58,272.00 1,442.00 294,308.81 For the year ended March 31, 2017 207,875.61 30,045.00 3,069.00 56,680.00 1,950.00 299,619.61
S.No Name of Related Party Nature of Relationship
A (i) A person or a close member of that person’s family of a reporting entity has control or joint control over the reporting entityShri Ravi Jhunjhunwala PromoterShri Riju Jhunjhunwala Promoter
(ii) A person or a close member of that person’s family of a reporting entity has significant influence over the reporting entityLakshmi Niwas JhunjhunwalaRavi JhunjhunwalaMani Devi JhunjhunwalaRiju JhunjhunwalaRita JhunjhunwalaRishabh Jhunjhunwala
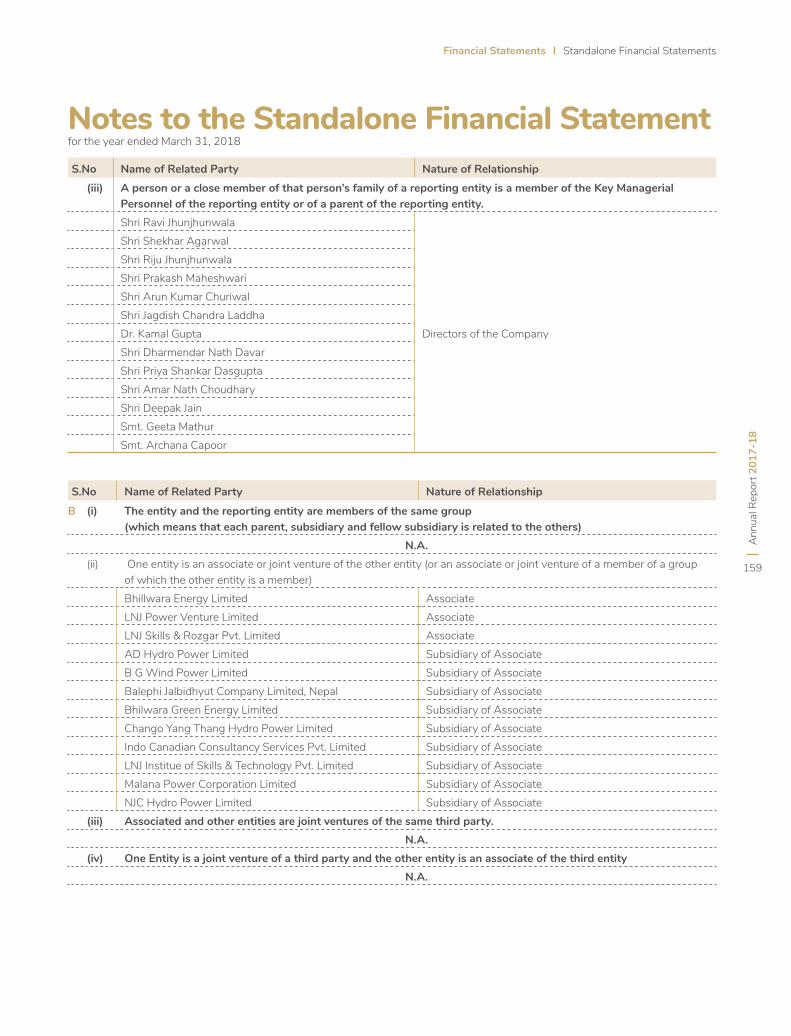
Financial Statements Standalone Financial Statements
Ann
ual R
epor
t 201
7-18
159
Notes to the Standalone Financial Statement for the year ended March 31, 2018
S.No Name of Related Party Nature of Relationship(iii) A person or a close member of that person’s family of a reporting entity is a member of the Key Managerial
Personnel of the reporting entity or of a parent of the reporting entity.Shri Ravi Jhunjhunwala
Directors of the Company
Shri Shekhar AgarwalShri Riju JhunjhunwalaShri Prakash MaheshwariShri Arun Kumar ChuriwalShri Jagdish Chandra LaddhaDr. Kamal GuptaShri Dharmendar Nath DavarShri Priya Shankar DasguptaShri Amar Nath ChoudharyShri Deepak JainSmt. Geeta MathurSmt. Archana Capoor
S.No Name of Related Party Nature of Relationship
B (i) The entity and the reporting entity are members of the same group(which means that each parent, subsidiary and fellow subsidiary is related to the others)
N.A.(ii) One entity is an associate or joint venture of the other entity (or an associate or joint venture of a member of a group
of which the other entity is a member)Bhillwara Energy Limited AssociateLNJ Power Venture Limited AssociateLNJ Skills & Rozgar Pvt. Limited AssociateAD Hydro Power Limited Subsidiary of AssociateB G Wind Power Limited Subsidiary of AssociateBalephi Jalbidhyut Company Limited, Nepal Subsidiary of AssociateBhilwara Green Energy Limited Subsidiary of AssociateChango Yang Thang Hydro Power Limited Subsidiary of AssociateIndo Canadian Consultancy Services Pvt. Limited Subsidiary of AssociateLNJ Institue of Skills & Technology Pvt. Limited Subsidiary of AssociateMalana Power Corporation Limited Subsidiary of AssociateNJC Hydro Power Limited Subsidiary of Associate
(iii) Associated and other entities are joint ventures of the same third party.N.A.
(iv) One Entity is a joint venture of a third party and the other entity is an associate of the third entityN.A.
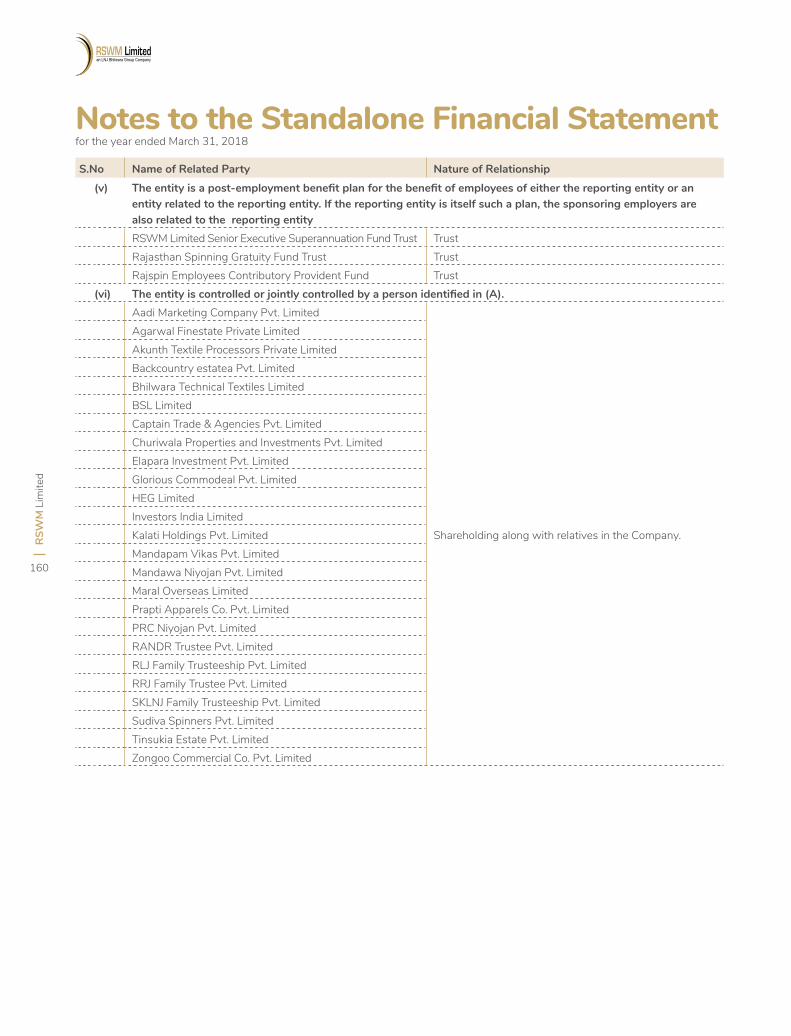
RSW
M L
imite
d
160
Notes to the Standalone Financial Statement for the year ended March 31, 2018
S.No Name of Related Party Nature of Relationship(v) The entity is a post-employment benefit plan for the benefit of employees of either the reporting entity or an
entity related to the reporting entity. If the reporting entity is itself such a plan, the sponsoring employers are also related to the reporting entityRSWM Limited Senior Executive Superannuation Fund Trust TrustRajasthan Spinning Gratuity Fund Trust TrustRajspin Employees Contributory Provident Fund Trust
(vi) The entity is controlled or jointly controlled by a person identified in (A).Aadi Marketing Company Pvt. Limited
Shareholding along with relatives in the Company.
Agarwal Finestate Private LimitedAkunth Textile Processors Private LimitedBackcountry estatea Pvt. LimitedBhilwara Technical Textiles LimitedBSL LimitedCaptain Trade & Agencies Pvt. LimitedChuriwala Properties and Investments Pvt. LimitedElapara Investment Pvt. LimitedGlorious Commodeal Pvt. LimitedHEG LimitedInvestors India Limited Kalati Holdings Pvt. LimitedMandapam Vikas Pvt. LimitedMandawa Niyojan Pvt. LimitedMaral Overseas LimitedPrapti Apparels Co. Pvt. LimitedPRC Niyojan Pvt. LimitedRANDR Trustee Pvt. LimitedRLJ Family Trusteeship Pvt. LimitedRRJ Family Trustee Pvt. LimitedSKLNJ Family Trusteeship Pvt. LimitedSudiva Spinners Pvt. LimitedTinsukia Estate Pvt. LimitedZongoo Commercial Co. Pvt. Limited
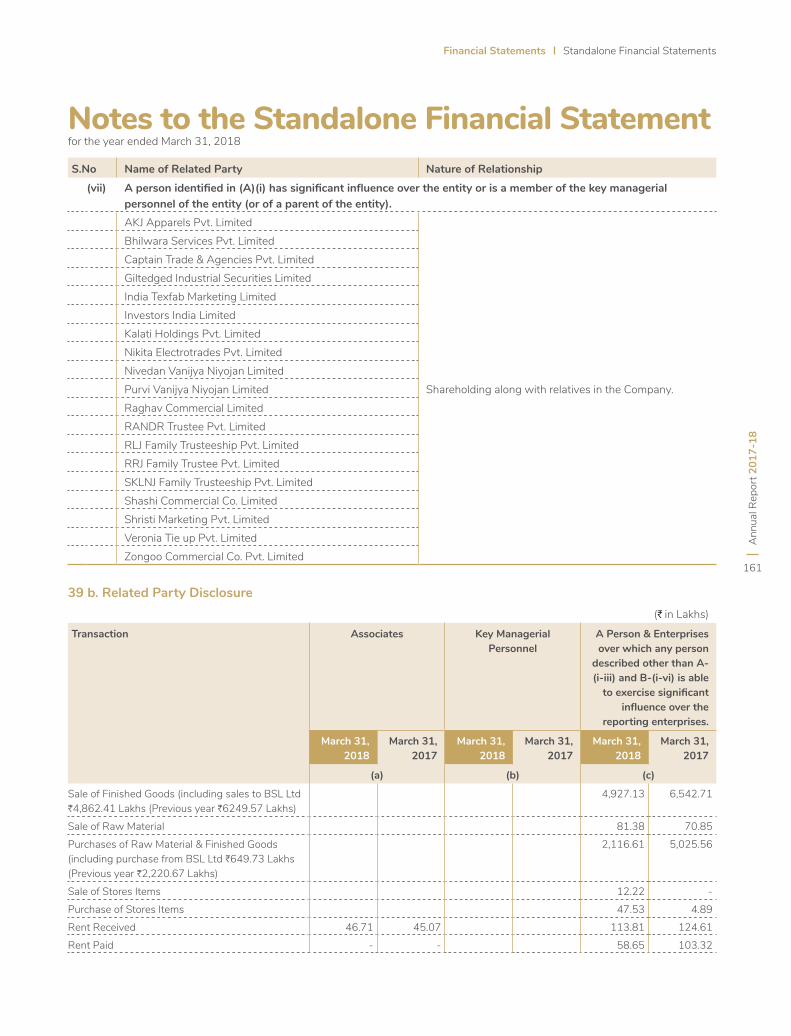
Financial Statements Standalone Financial Statements
Ann
ual R
epor
t 201
7-18
161
Notes to the Standalone Financial Statement for the year ended March 31, 2018
39 b. Related Party Disclosure
S.No Name of Related Party Nature of Relationship(vii) A person identified in (A)(i) has significant influence over the entity or is a member of the key managerial
personnel of the entity (or of a parent of the entity).AKJ Apparels Pvt. Limited
Shareholding along with relatives in the Company.
Bhilwara Services Pvt. LimitedCaptain Trade & Agencies Pvt. LimitedGiltedged Industrial Securities LimitedIndia Texfab Marketing LimitedInvestors India LimitedKalati Holdings Pvt. LimitedNikita Electrotrades Pvt. LimitedNivedan Vanijya Niyojan LimitedPurvi Vanijya Niyojan LimitedRaghav Commercial LimitedRANDR Trustee Pvt. LimitedRLJ Family Trusteeship Pvt. LimitedRRJ Family Trustee Pvt. LimitedSKLNJ Family Trusteeship Pvt. LimitedShashi Commercial Co. LimitedShristi Marketing Pvt. LimitedVeronia Tie up Pvt. LimitedZongoo Commercial Co. Pvt. Limited
(H in Lakhs)
Transaction Associates Key Managerial Personnel
A Person & Enterprises over which any person
described other than A- (i-iii) and B-(i-vi) is able
to exercise significant influence over the
reporting enterprises.
March 31, 2018
March 31, 2017
March 31, 2018
March 31, 2017
March 31, 2018
March 31, 2017
(a) (b) (c)
Sale of Finished Goods (including sales to BSL Ltd H4,862.41 Lakhs (Previous year H6249.57 Lakhs)
4,927.13 6,542.71
Sale of Raw Material 81.38 70.85 Purchases of Raw Material & Finished Goods (including purchase from BSL Ltd H649.73 Lakhs (Previous year H2,220.67 Lakhs)
2,116.61 5,025.56
Sale of Stores Items 12.22 - Purchase of Stores Items 47.53 4.89 Rent Received 46.71 45.07 113.81 124.61 Rent Paid - - 58.65 103.32
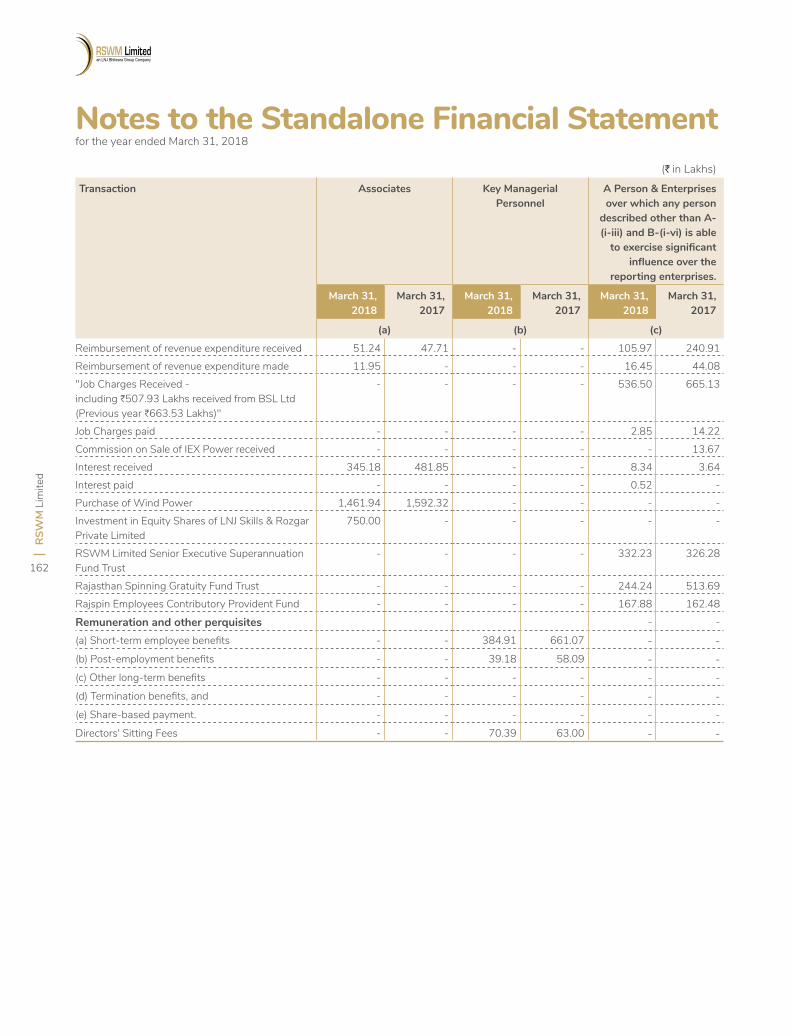
RSW
M L
imite
d
162
(H in Lakhs)
Transaction Associates Key Managerial Personnel
A Person & Enterprises over which any person
described other than A- (i-iii) and B-(i-vi) is able
to exercise significant influence over the
reporting enterprises.
March 31, 2018
March 31, 2017
March 31, 2018
March 31, 2017
March 31, 2018
March 31, 2017
(a) (b) (c)
Reimbursement of revenue expenditure received 51.24 47.71 - - 105.97 240.91 Reimbursement of revenue expenditure made 11.95 - - - 16.45 44.08 "Job Charges Received - including H507.93 Lakhs received from BSL Ltd (Previous year H663.53 Lakhs)"
- - - - 536.50 665.13
Job Charges paid - - - - 2.85 14.22 Commission on Sale of IEX Power received - - - - - 13.67 Interest received 345.18 481.85 - - 8.34 3.64 Interest paid - - - - 0.52 - Purchase of Wind Power 1,461.94 1,592.32 - - - - Investment in Equity Shares of LNJ Skills & Rozgar Private Limited
750.00 - - - - -
RSWM Limited Senior Executive Superannuation Fund Trust
- - - - 332.23 326.28
Rajasthan Spinning Gratuity Fund Trust - - - - 244.24 513.69 Rajspin Employees Contributory Provident Fund - - - - 167.88 162.48
Remuneration and other perquisites - -
(a) Short-term employee benefits - - 384.91 661.07 - -(b) Post-employment benefits - - 39.18 58.09 - -(c) Other long-term benefits - - - - - -(d) Termination benefits, and - - - - - -(e) Share-based payment. - - - - - -Directors' Sitting Fees - - 70.39 63.00 - -
Notes to the Standalone Financial Statement for the year ended March 31, 2018
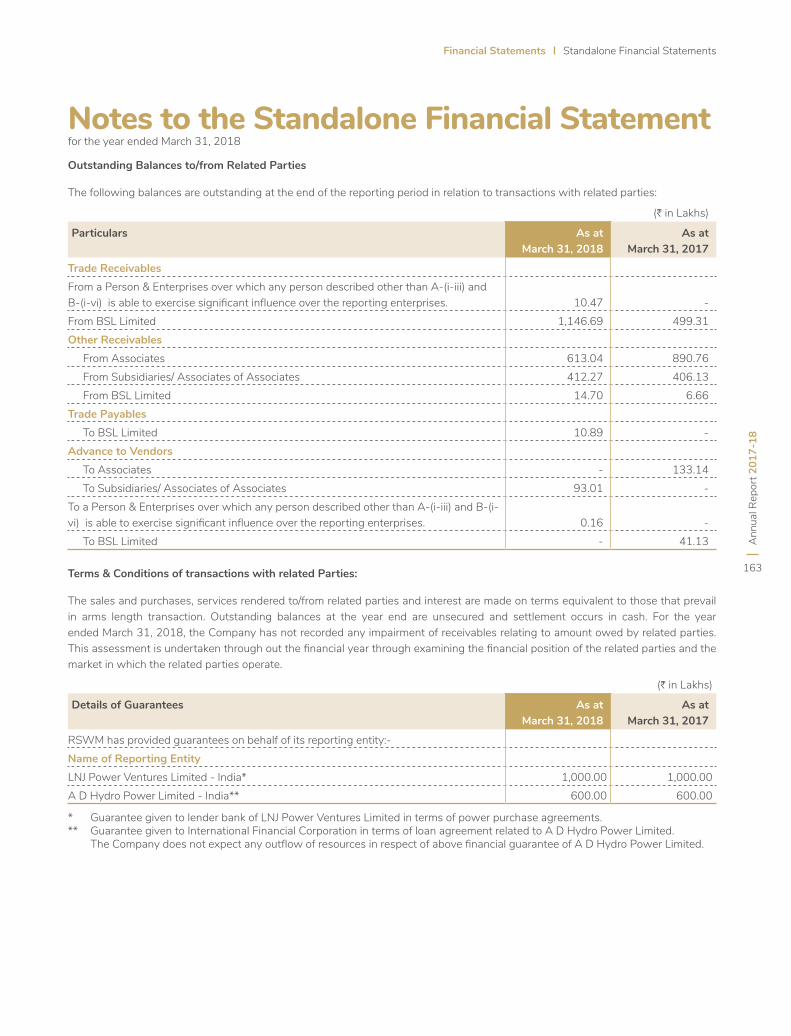
Financial Statements Standalone Financial Statements
Ann
ual R
epor
t 201
7-18
163
Notes to the Standalone Financial Statement for the year ended March 31, 2018
Outstanding Balances to/from Related Parties
The following balances are outstanding at the end of the reporting period in relation to transactions with related parties:
(H in Lakhs)
Particulars As atMarch 31, 2018
As atMarch 31, 2017
Trade ReceivablesFrom a Person & Enterprises over which any person described other than A-(i-iii) and B-(i-vi) is able to exercise significant influence over the reporting enterprises. 10.47 - From BSL Limited 1,146.69 499.31 Other Receivables From Associates 613.04 890.76 From Subsidiaries/ Associates of Associates 412.27 406.13 From BSL Limited 14.70 6.66 Trade Payables To BSL Limited 10.89 - Advance to Vendors To Associates - 133.14 To Subsidiaries/ Associates of Associates 93.01 -To a Person & Enterprises over which any person described other than A-(i-iii) and B-(i-vi) is able to exercise significant influence over the reporting enterprises. 0.16 - To BSL Limited - 41.13
Terms & Conditions of transactions with related Parties:
The sales and purchases, services rendered to/from related parties and interest are made on terms equivalent to those that prevail in arms length transaction. Outstanding balances at the year end are unsecured and settlement occurs in cash. For the year ended March 31, 2018, the Company has not recorded any impairment of receivables relating to amount owed by related parties. This assessment is undertaken through out the financial year through examining the financial position of the related parties and the market in which the related parties operate.
(H in Lakhs)
Details of Guarantees As atMarch 31, 2018
As atMarch 31, 2017
RSWM has provided guarantees on behalf of its reporting entity:-Name of Reporting EntityLNJ Power Ventures Limited - India* 1,000.00 1,000.00 A D Hydro Power Limited - India** 600.00 600.00
* Guarantee given to lender bank of LNJ Power Ventures Limited in terms of power purchase agreements.** Guarantee given to International Financial Corporation in terms of loan agreement related to A D Hydro Power Limited. The Company does not expect any outflow of resources in respect of above financial guarantee of A D Hydro Power Limited.
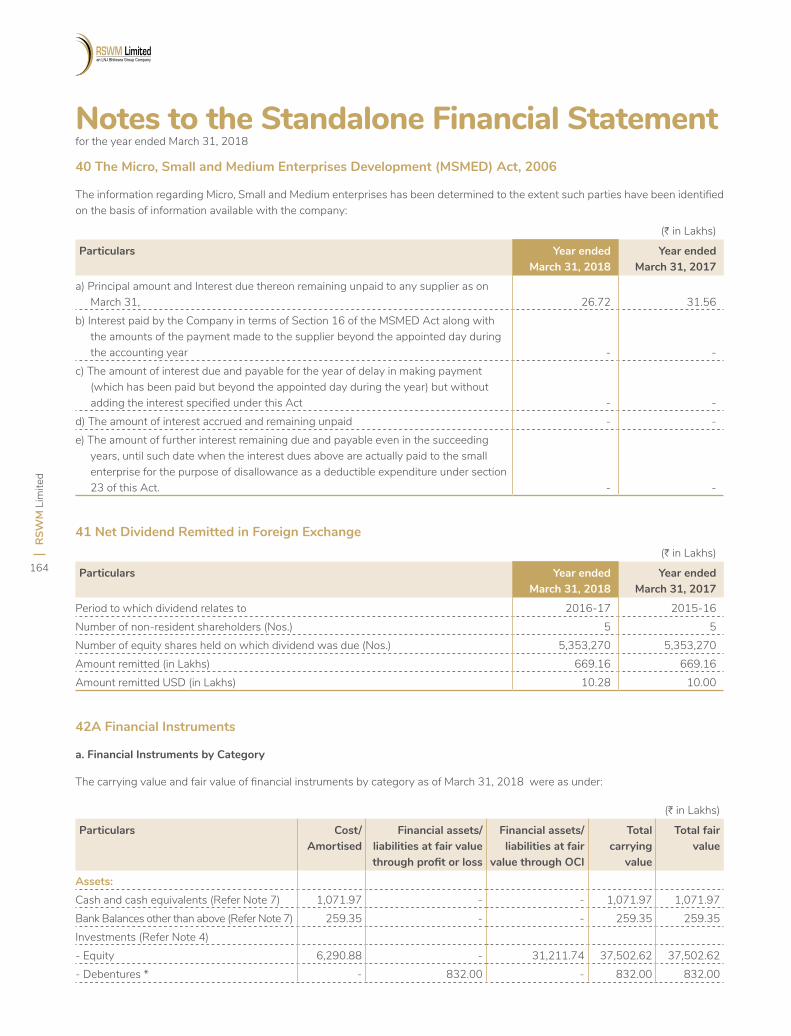
RSW
M L
imite
d
164
Notes to the Standalone Financial Statement for the year ended March 31, 2018
40 The Micro, Small and Medium Enterprises Development (MSMED) Act, 2006
The information regarding Micro, Small and Medium enterprises has been determined to the extent such parties have been identified on the basis of information available with the company:
41 Net Dividend Remitted in Foreign Exchange
42A Financial Instruments
a. Financial Instruments by Category
The carrying value and fair value of financial instruments by category as of March 31, 2018 were as under:
(H in Lakhs)
Particulars Year endedMarch 31, 2018
Year endedMarch 31, 2017
a) Principal amount and Interest due thereon remaining unpaid to any supplier as on March 31, 26.72 31.56
b) Interest paid by the Company in terms of Section 16 of the MSMED Act along with the amounts of the payment made to the supplier beyond the appointed day during the accounting year - -
c) The amount of interest due and payable for the year of delay in making payment (which has been paid but beyond the appointed day during the year) but without adding the interest specified under this Act - -
d) The amount of interest accrued and remaining unpaid - - e) The amount of further interest remaining due and payable even in the succeeding
years, until such date when the interest dues above are actually paid to the small enterprise for the purpose of disallowance as a deductible expenditure under section 23 of this Act. - -
(H in Lakhs)
Particulars Year endedMarch 31, 2018
Year endedMarch 31, 2017
Period to which dividend relates to 2016-17 2015-16Number of non-resident shareholders (Nos.) 5 5Number of equity shares held on which dividend was due (Nos.) 5,353,270 5,353,270 Amount remitted (in Lakhs) 669.16 669.16 Amount remitted USD (in Lakhs) 10.28 10.00
(H in Lakhs)
Particulars Cost/Amortised
Financial assets/ liabilities at fair value through profit or loss
Financial assets/liabilities at fair
value through OCI
Total carrying
value
Total fair value
Assets:Cash and cash equivalents (Refer Note 7) 1,071.97 - - 1,071.97 1,071.97 Bank Balances other than above (Refer Note 7) 259.35 - - 259.35 259.35 Investments (Refer Note 4)- Equity 6,290.88 - 31,211.74 37,502.62 37,502.62- Debentures * - 832.00 - 832.00 832.00
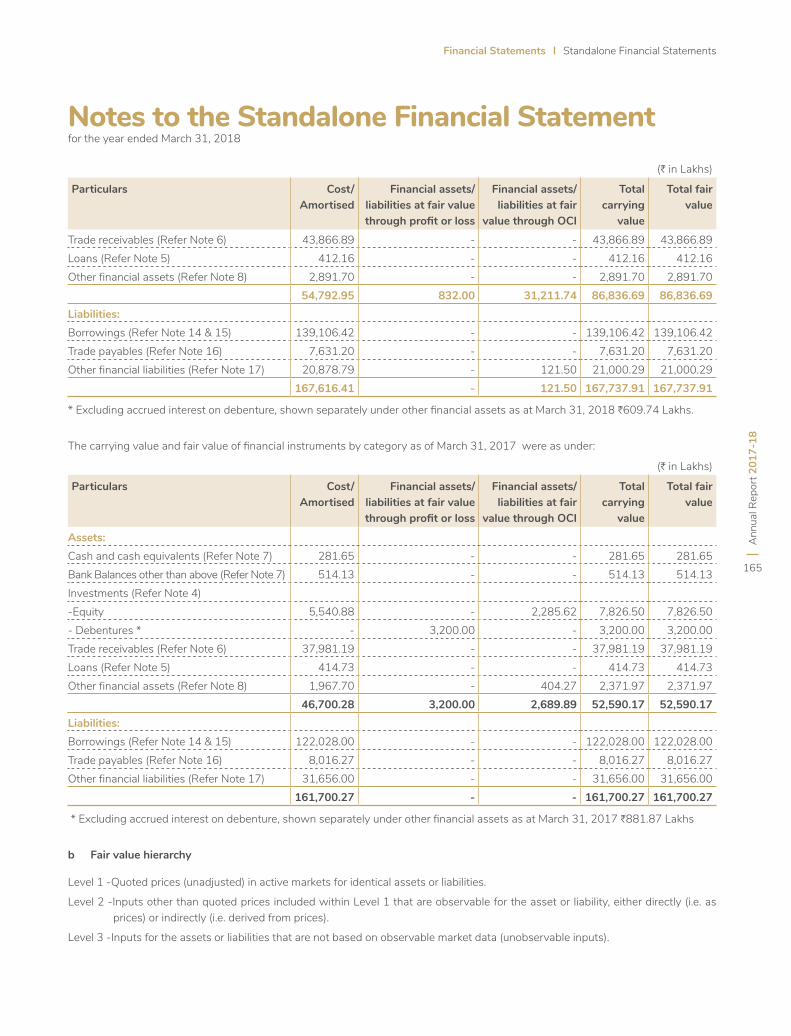
Financial Statements Standalone Financial Statements
Ann
ual R
epor
t 201
7-18
165
Notes to the Standalone Financial Statementfor the year ended March 31, 2018
(H in Lakhs)
Particulars Cost/Amortised
Financial assets/ liabilities at fair value through profit or loss
Financial assets/liabilities at fair
value through OCI
Total carrying
value
Total fair value
Trade receivables (Refer Note 6) 43,866.89 - - 43,866.89 43,866.89 Loans (Refer Note 5) 412.16 - - 412.16 412.16 Other financial assets (Refer Note 8) 2,891.70 - - 2,891.70 2,891.70
54,792.95 832.00 31,211.74 86,836.69 86,836.69Liabilities:Borrowings (Refer Note 14 & 15) 139,106.42 - - 139,106.42 139,106.42 Trade payables (Refer Note 16) 7,631.20 - - 7,631.20 7,631.20 Other financial liabilities (Refer Note 17) 20,878.79 - 121.50 21,000.29 21,000.29
167,616.41 - 121.50 167,737.91 167,737.91
(H in Lakhs)
Particulars Cost/Amortised
Financial assets/ liabilities at fair value through profit or loss
Financial assets/liabilities at fair
value through OCI
Total carrying
value
Total fair value
Assets:Cash and cash equivalents (Refer Note 7) 281.65 - - 281.65 281.65 Bank Balances other than above (Refer Note 7) 514.13 - - 514.13 514.13 Investments (Refer Note 4)-Equity 5,540.88 - 2,285.62 7,826.50 7,826.50- Debentures * - 3,200.00 - 3,200.00 3,200.00 Trade receivables (Refer Note 6) 37,981.19 - - 37,981.19 37,981.19 Loans (Refer Note 5) 414.73 - - 414.73 414.73 Other financial assets (Refer Note 8) 1,967.70 - 404.27 2,371.97 2,371.97
46,700.28 3,200.00 2,689.89 52,590.17 52,590.17Liabilities:Borrowings (Refer Note 14 & 15) 122,028.00 - - 122,028.00 122,028.00 Trade payables (Refer Note 16) 8,016.27 - - 8,016.27 8,016.27 Other financial liabilities (Refer Note 17) 31,656.00 - - 31,656.00 31,656.00
161,700.27 - - 161,700.27 161,700.27
* Excluding accrued interest on debenture, shown separately under other financial assets as at March 31, 2018 H609.74 Lakhs.
The carrying value and fair value of financial instruments by category as of March 31, 2017 were as under:
* Excluding accrued interest on debenture, shown separately under other financial assets as at March 31, 2017 H881.87 Lakhs
b Fair value hierarchy
Level 1 -Quoted prices (unadjusted) in active markets for identical assets or liabilities.
Level 2 -Inputs other than quoted prices included within Level 1 that are observable for the asset or liability, either directly (i.e. as prices) or indirectly (i.e. derived from prices).
Level 3 -Inputs for the assets or liabilities that are not based on observable market data (unobservable inputs).

RSW
M L
imite
d
166
Notes to the Standalone Financial Statement for the year ended March 31, 2018
(H in Lakhs)
Particulars As atMarch 31, 2018
Fair value measurement at end of the reporting period/year using
Level 1 Level 2 Level 3
AssetsInvestments in equity instruments (Refer Note 4) 31,211.74 31,211.74 - -Investment in Debentures (Refer Note 4) 832.00 - - 832.00 LiabilitiesDerivative financial instruments - foreign currency forward(Refer Note 17 ) 121.50 - 121.50 -
(H in Lakhs)
Particulars As atMarch 31, 2017
Fair value measurement at end of the reporting period/year using
Level 1 Level 2 Level 3
AssetsInvestments in equity instruments (Refer Note 4) 2,285.62 2,285.62 - -Investment in Debentures (Refer Note 4) 3,200.00 - - 3,200.00 Derivative financial instruments - foreign currency forward(Refer Note 8 ) 404.27 - 404.27 -
The following table presents fair value hierarchy of assets and liabilities measured at fair value on a recurring basis as of March 31, 2017:
Valuation Technique used to determine Fair Value
The Company maintains policies and procedures to value financial assets or financial liabilities using the best and most relevant data available. The fair values of the financial assets and liabilities are included at the amount that would be received to sell an asset or paid to transfer a liability in an orderly transaction between market participants at the measurement date. The following methods and assumptions were used to estimate the fair values:
1) Fair value of cash and deposits, trade receivables, trade payables, and other current financial assets and liabilities measured at amortized cost is approximate to their carrying amounts largely due to the short-term maturities of these instruments. The fair value of other non-current financial assets and liabilities (security deposit taken/given and advance to employees) carried at amortized cost is approximately equal to fair value. Hence carrying value and fair value is taken same.
2) Long-term variable-rate borrowings measured at amortized cost are evaluated by the Company based on parameters such as interest rates, specific country risk factors, credit risk and other risk characteristics. Fair value of variable interest rate borrowings approximates their carrying values. Risk of other factors for the company is considered to be insignificant in valuation.
3) The fair values of the forward contract is determined using the forward exchange rate at the balance sheet date based on quotes from banks and financial institutions. Management has evaluated the credit and non-performance risks associated with its derivative counterparties and believe them to be insignificant and not warranting a credit adjustment.
4) The fair values of the Quoted Equity shares have been done on quoted price of stock exchange as on reporting date.
5) Investment in the Unquoted Debenture have been valued considering the market coupon rate of similar financial instruments.
The following table presents fair value hierarchy of assets and liabilities measured at fair value on a recurring basis as of March 31, 2018:
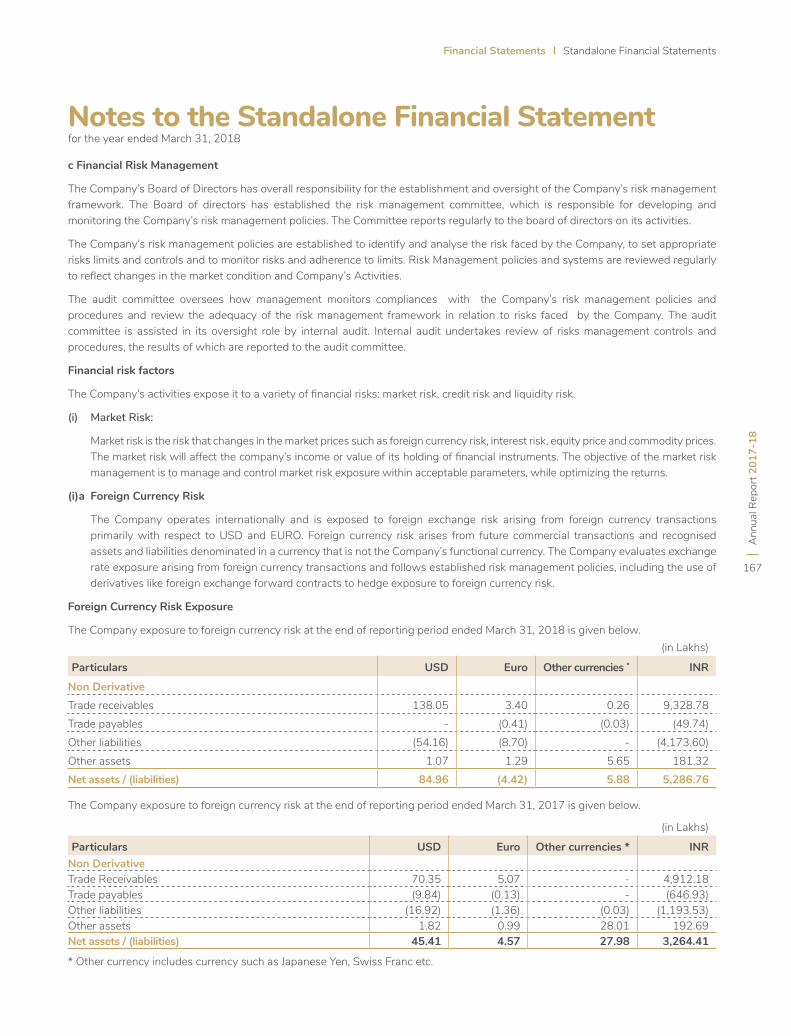
Financial Statements Standalone Financial Statements
Ann
ual R
epor
t 201
7-18
167
Notes to the Standalone Financial Statementfor the year ended March 31, 2018
c Financial Risk Management
The Company’s Board of Directors has overall responsibility for the establishment and oversight of the Company’s risk management framework. The Board of directors has established the risk management committee, which is responsible for developing and monitoring the Company’s risk management policies. The Committee reports regularly to the board of directors on its activities.
The Company’s risk management policies are established to identify and analyse the risk faced by the Company, to set appropriate risks limits and controls and to monitor risks and adherence to limits. Risk Management policies and systems are reviewed regularly to reflect changes in the market condition and Company’s Activities.
The audit committee oversees how management monitors compliances with the Company’s risk management policies and procedures and review the adequacy of the risk management framework in relation to risks faced by the Company. The audit committee is assisted in its oversight role by internal audit. Internal audit undertakes review of risks management controls and procedures, the results of which are reported to the audit committee.
Financial risk factors
The Company’s activities expose it to a variety of financial risks: market risk, credit risk and liquidity risk.
(i) Market Risk:
Market risk is the risk that changes in the market prices such as foreign currency risk, interest risk, equity price and commodity prices. The market risk will affect the company’s income or value of its holding of financial instruments. The objective of the market risk management is to manage and control market risk exposure within acceptable parameters, while optimizing the returns.
(i)a Foreign Currency Risk
The Company operates internationally and is exposed to foreign exchange risk arising from foreign currency transactions primarily with respect to USD and EURO. Foreign currency risk arises from future commercial transactions and recognised assets and liabilities denominated in a currency that is not the Company’s functional currency. The Company evaluates exchange rate exposure arising from foreign currency transactions and follows established risk management policies, including the use of derivatives like foreign exchange forward contracts to hedge exposure to foreign currency risk.
Foreign Currency Risk Exposure
The Company exposure to foreign currency risk at the end of reporting period ended March 31, 2018 is given below.(in Lakhs)
Particulars USD Euro Other currencies * INR
Non DerivativeTrade receivables 138.05 3.40 0.26 9,328.78 Trade payables - (0.41) (0.03) (49.74)Other liabilities (54.16) (8.70) - (4,173.60)Other assets 1.07 1.29 5.65 181.32Net assets / (liabilities) 84.96 (4.42) 5.88 5,286.76
(in Lakhs)
Particulars USD Euro Other currencies * INRNon DerivativeTrade Receivables 70.35 5.07 - 4,912.18 Trade payables (9.84) (0.13) - (646.93)Other liabilities (16.92) (1.36) (0.03) (1,193.53)Other assets 1.82 0.99 28.01 192.69Net assets / (liabilities) 45.41 4.57 27.98 3,264.41
The Company exposure to foreign currency risk at the end of reporting period ended March 31, 2017 is given below.
* Other currency includes currency such as Japanese Yen, Swiss Franc etc.
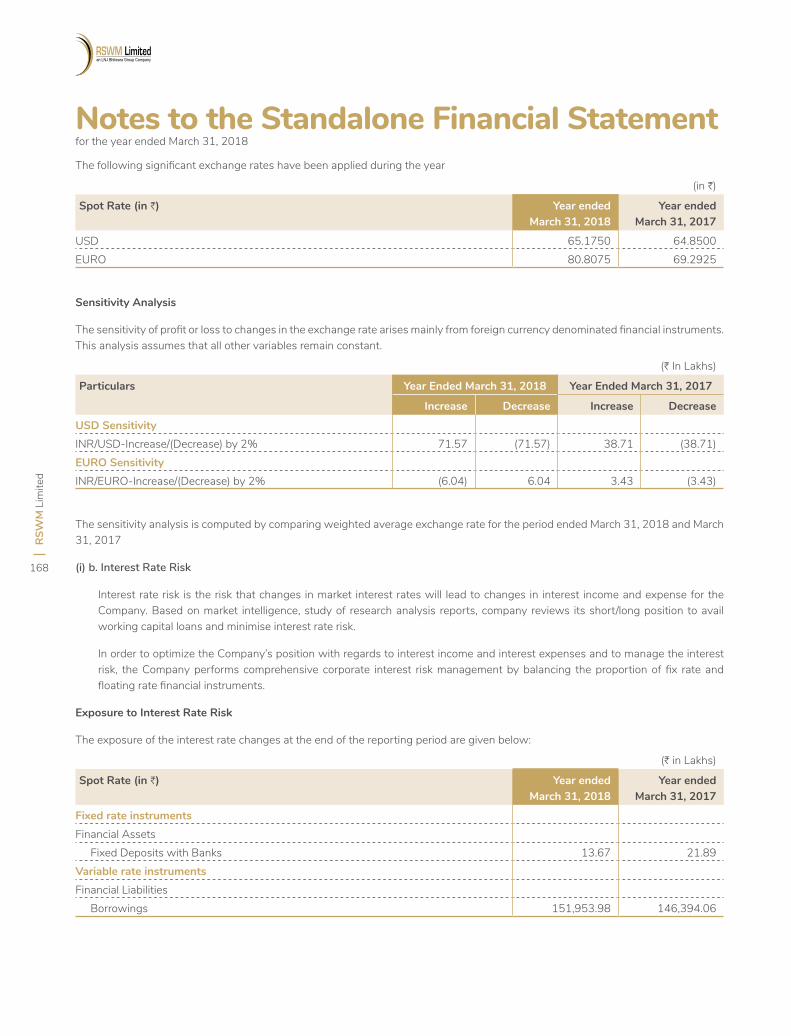
RSW
M L
imite
d
168
Notes to the Standalone Financial Statement for the year ended March 31, 2018
The following significant exchange rates have been applied during the year
(in H)
Spot Rate (in H) Year endedMarch 31, 2018
Year endedMarch 31, 2017
USD 65.1750 64.8500 EURO 80.8075 69.2925
(H in Lakhs)
Spot Rate (in H) Year endedMarch 31, 2018
Year endedMarch 31, 2017
Fixed rate instrumentsFinancial Assets Fixed Deposits with Banks 13.67 21.89 Variable rate instrumentsFinancial Liabilities Borrowings 151,953.98 146,394.06
Sensitivity Analysis
The sensitivity of profit or loss to changes in the exchange rate arises mainly from foreign currency denominated financial instruments. This analysis assumes that all other variables remain constant.
(H In Lakhs)
Particulars Year Ended March 31, 2018 Year Ended March 31, 2017
Increase Decrease Increase Decrease
USD Sensitivity INR/USD-Increase/(Decrease) by 2% 71.57 (71.57) 38.71 (38.71)EURO Sensitivity INR/EURO-Increase/(Decrease) by 2% (6.04) 6.04 3.43 (3.43)
The sensitivity analysis is computed by comparing weighted average exchange rate for the period ended March 31, 2018 and March 31, 2017
(i) b. Interest Rate Risk
Interest rate risk is the risk that changes in market interest rates will lead to changes in interest income and expense for the Company. Based on market intelligence, study of research analysis reports, company reviews its short/long position to avail working capital loans and minimise interest rate risk.
In order to optimize the Company’s position with regards to interest income and interest expenses and to manage the interest risk, the Company performs comprehensive corporate interest risk management by balancing the proportion of fix rate and floating rate financial instruments.
Exposure to Interest Rate Risk
The exposure of the interest rate changes at the end of the reporting period are given below:
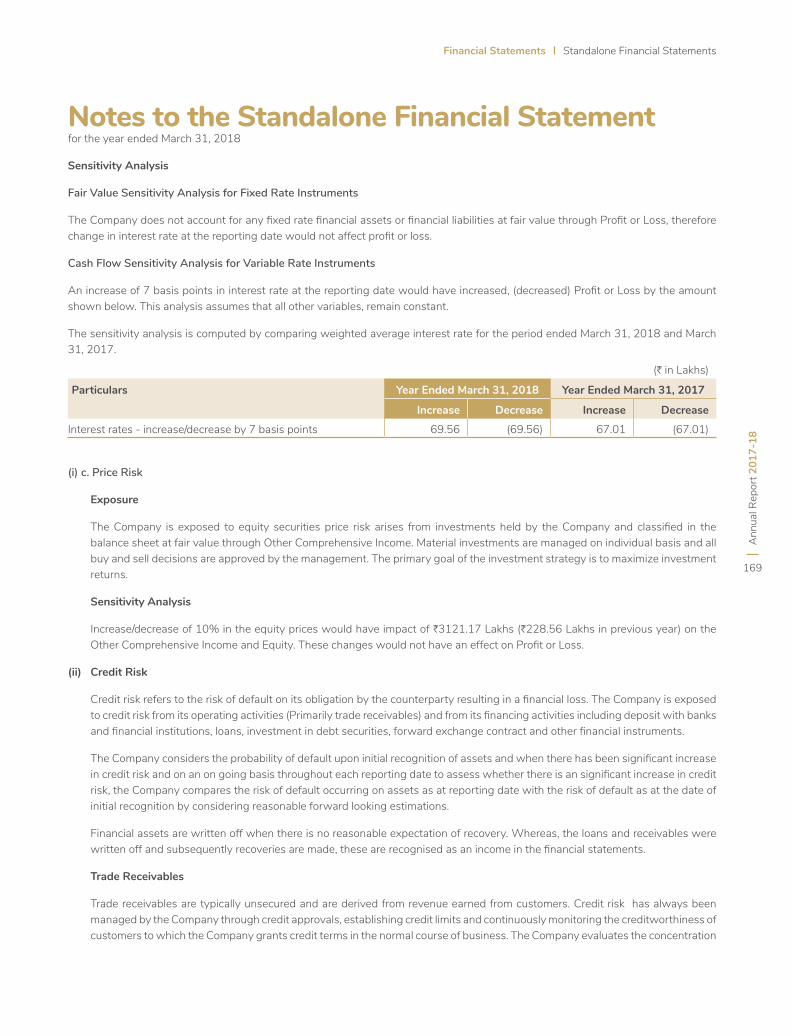
Financial Statements Standalone Financial Statements
Ann
ual R
epor
t 201
7-18
169
Notes to the Standalone Financial Statementfor the year ended March 31, 2018
(H in Lakhs)
Particulars Year Ended March 31, 2018 Year Ended March 31, 2017
Increase Decrease Increase Decrease
Interest rates - increase/decrease by 7 basis points 69.56 (69.56) 67.01 (67.01)
Sensitivity Analysis
Fair Value Sensitivity Analysis for Fixed Rate Instruments
The Company does not account for any fixed rate financial assets or financial liabilities at fair value through Profit or Loss, therefore change in interest rate at the reporting date would not affect profit or loss.
Cash Flow Sensitivity Analysis for Variable Rate Instruments
An increase of 7 basis points in interest rate at the reporting date would have increased, (decreased) Profit or Loss by the amount shown below. This analysis assumes that all other variables, remain constant.
The sensitivity analysis is computed by comparing weighted average interest rate for the period ended March 31, 2018 and March 31, 2017.
(i) c. Price Risk
Exposure
The Company is exposed to equity securities price risk arises from investments held by the Company and classified in the balance sheet at fair value through Other Comprehensive Income. Material investments are managed on individual basis and all buy and sell decisions are approved by the management. The primary goal of the investment strategy is to maximize investment returns.
Sensitivity Analysis
Increase/decrease of 10% in the equity prices would have impact of H3121.17 Lakhs (H228.56 Lakhs in previous year) on the Other Comprehensive Income and Equity. These changes would not have an effect on Profit or Loss.
(ii) Credit Risk
Credit risk refers to the risk of default on its obligation by the counterparty resulting in a financial loss. The Company is exposed to credit risk from its operating activities (Primarily trade receivables) and from its financing activities including deposit with banks and financial institutions, loans, investment in debt securities, forward exchange contract and other financial instruments.
The Company considers the probability of default upon initial recognition of assets and when there has been significant increase in credit risk and on an on going basis throughout each reporting date to assess whether there is an significant increase in credit risk, the Company compares the risk of default occurring on assets as at reporting date with the risk of default as at the date of initial recognition by considering reasonable forward looking estimations.
Financial assets are written off when there is no reasonable expectation of recovery. Whereas, the loans and receivables were written off and subsequently recoveries are made, these are recognised as an income in the financial statements.
Trade Receivables
Trade receivables are typically unsecured and are derived from revenue earned from customers. Credit risk has always been managed by the Company through credit approvals, establishing credit limits and continuously monitoring the creditworthiness of customers to which the Company grants credit terms in the normal course of business. The Company evaluates the concentration
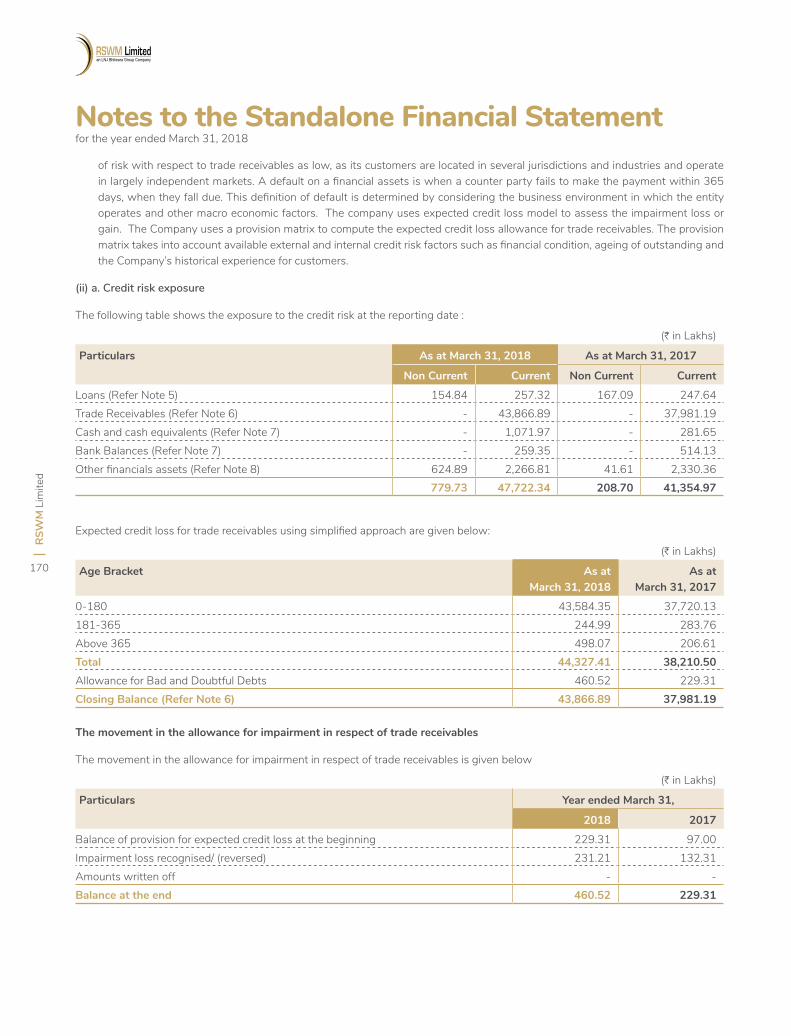
RSW
M L
imite
d
170
of risk with respect to trade receivables as low, as its customers are located in several jurisdictions and industries and operate in largely independent markets. A default on a financial assets is when a counter party fails to make the payment within 365 days, when they fall due. This definition of default is determined by considering the business environment in which the entity operates and other macro economic factors. The company uses expected credit loss model to assess the impairment loss or gain. The Company uses a provision matrix to compute the expected credit loss allowance for trade receivables. The provision matrix takes into account available external and internal credit risk factors such as financial condition, ageing of outstanding and the Company’s historical experience for customers.
(ii) a. Credit risk exposure
The following table shows the exposure to the credit risk at the reporting date :
Notes to the Standalone Financial Statement for the year ended March 31, 2018
(H in Lakhs)
Particulars As at March 31, 2018 As at March 31, 2017
Non Current Current Non Current Current
Loans (Refer Note 5) 154.84 257.32 167.09 247.64 Trade Receivables (Refer Note 6) - 43,866.89 - 37,981.19 Cash and cash equivalents (Refer Note 7) - 1,071.97 - 281.65 Bank Balances (Refer Note 7) - 259.35 - 514.13 Other financials assets (Refer Note 8) 624.89 2,266.81 41.61 2,330.36
779.73 47,722.34 208.70 41,354.97
(H in Lakhs)
Particulars Year ended March 31,
2018 2017
Balance of provision for expected credit loss at the beginning 229.31 97.00 Impairment loss recognised/ (reversed) 231.21 132.31 Amounts written off - - Balance at the end 460.52 229.31
Expected credit loss for trade receivables using simplified approach are given below:
(H in Lakhs)
Age Bracket As atMarch 31, 2018
As atMarch 31, 2017
0-180 43,584.35 37,720.13 181-365 244.99 283.76 Above 365 498.07 206.61 Total 44,327.41 38,210.50 Allowance for Bad and Doubtful Debts 460.52 229.31 Closing Balance (Refer Note 6) 43,866.89 37,981.19
The movement in the allowance for impairment in respect of trade receivables
The movement in the allowance for impairment in respect of trade receivables is given below
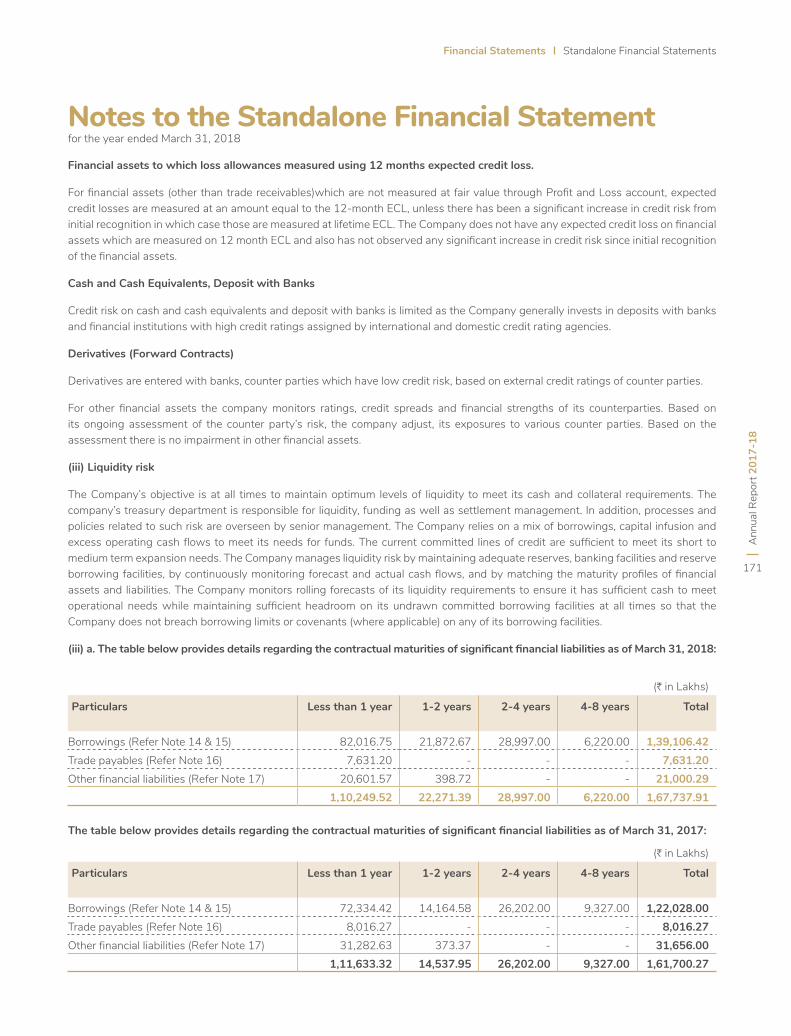
Financial Statements Standalone Financial Statements
Ann
ual R
epor
t 201
7-18
171
Notes to the Standalone Financial Statementfor the year ended March 31, 2018
Financial assets to which loss allowances measured using 12 months expected credit loss.
For financial assets (other than trade receivables)which are not measured at fair value through Profit and Loss account, expected credit losses are measured at an amount equal to the 12-month ECL, unless there has been a significant increase in credit risk from initial recognition in which case those are measured at lifetime ECL. The Company does not have any expected credit loss on financial assets which are measured on 12 month ECL and also has not observed any significant increase in credit risk since initial recognition of the financial assets.
Cash and Cash Equivalents, Deposit with Banks
Credit risk on cash and cash equivalents and deposit with banks is limited as the Company generally invests in deposits with banks and financial institutions with high credit ratings assigned by international and domestic credit rating agencies.
Derivatives (Forward Contracts)
Derivatives are entered with banks, counter parties which have low credit risk, based on external credit ratings of counter parties.
For other financial assets the company monitors ratings, credit spreads and financial strengths of its counterparties. Based on its ongoing assessment of the counter party’s risk, the company adjust, its exposures to various counter parties. Based on the assessment there is no impairment in other financial assets.
(iii) Liquidity risk
The Company’s objective is at all times to maintain optimum levels of liquidity to meet its cash and collateral requirements. The company’s treasury department is responsible for liquidity, funding as well as settlement management. In addition, processes and policies related to such risk are overseen by senior management. The Company relies on a mix of borrowings, capital infusion and excess operating cash flows to meet its needs for funds. The current committed lines of credit are sufficient to meet its short to medium term expansion needs. The Company manages liquidity risk by maintaining adequate reserves, banking facilities and reserve borrowing facilities, by continuously monitoring forecast and actual cash flows, and by matching the maturity profiles of financial assets and liabilities. The Company monitors rolling forecasts of its liquidity requirements to ensure it has sufficient cash to meet operational needs while maintaining sufficient headroom on its undrawn committed borrowing facilities at all times so that the Company does not breach borrowing limits or covenants (where applicable) on any of its borrowing facilities.
(iii) a. The table below provides details regarding the contractual maturities of significant financial liabilities as of March 31, 2018:
(H in Lakhs)
Particulars Less than 1 year 1-2 years 2-4 years 4-8 years Total
Borrowings (Refer Note 14 & 15) 82,016.75 21,872.67 28,997.00 6,220.00 1,39,106.42Trade payables (Refer Note 16) 7,631.20 - - - 7,631.20Other financial liabilities (Refer Note 17) 20,601.57 398.72 - - 21,000.29
1,10,249.52 22,271.39 28,997.00 6,220.00 1,67,737.91
(H in Lakhs)
Particulars Less than 1 year 1-2 years 2-4 years 4-8 years Total
Borrowings (Refer Note 14 & 15) 72,334.42 14,164.58 26,202.00 9,327.00 1,22,028.00Trade payables (Refer Note 16) 8,016.27 - - - 8,016.27Other financial liabilities (Refer Note 17) 31,282.63 373.37 - - 31,656.00
1,11,633.32 14,537.95 26,202.00 9,327.00 1,61,700.27
The table below provides details regarding the contractual maturities of significant financial liabilities as of March 31, 2017:
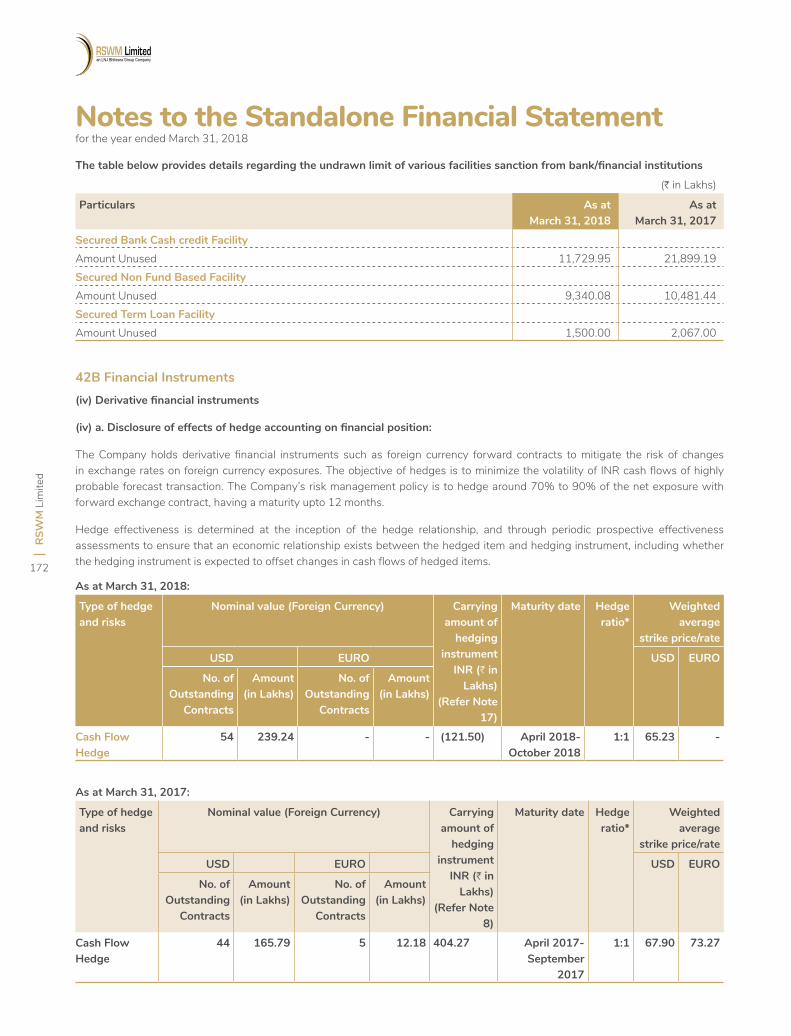
RSW
M L
imite
d
172
Notes to the Standalone Financial Statement for the year ended March 31, 2018
(H in Lakhs)
Particulars As atMarch 31, 2018
As atMarch 31, 2017
Secured Bank Cash credit FacilityAmount Unused 11,729.95 21,899.19Secured Non Fund Based FacilityAmount Unused 9,340.08 10,481.44Secured Term Loan FacilityAmount Unused 1,500.00 2,067.00
The table below provides details regarding the undrawn limit of various facilities sanction from bank/financial institutions
42B Financial Instruments(iv) Derivative financial instruments
(iv) a. Disclosure of effects of hedge accounting on financial position:
The Company holds derivative financial instruments such as foreign currency forward contracts to mitigate the risk of changes in exchange rates on foreign currency exposures. The objective of hedges is to minimize the volatility of INR cash flows of highly probable forecast transaction. The Company’s risk management policy is to hedge around 70% to 90% of the net exposure with forward exchange contract, having a maturity upto 12 months.
Hedge effectiveness is determined at the inception of the hedge relationship, and through periodic prospective effectiveness assessments to ensure that an economic relationship exists between the hedged item and hedging instrument, including whether the hedging instrument is expected to offset changes in cash flows of hedged items.
As at March 31, 2018:
Type of hedge and risks
Nominal value (Foreign Currency) Carrying amount of
hedging instrument
INR (H in Lakhs)
(Refer Note 17)
Maturity date Hedge ratio*
Weighted average
strike price/rate
USD EURO USD EURO
No. of Outstanding
Contracts
Amount (in Lakhs)
No. of Outstanding
Contracts
Amount (in Lakhs)
Cash Flow Hedge
54 239.24 - - (121.50) April 2018- October 2018
1:1 65.23 -
As at March 31, 2017:
Type of hedge and risks
Nominal value (Foreign Currency) Carrying amount of
hedging instrument
INR (H in Lakhs)
(Refer Note 8)
Maturity date Hedge ratio*
Weighted average
strike price/rate
USD EURO USD EURO
No. of Outstanding
Contracts
Amount (in Lakhs)
No. of Outstanding
Contracts
Amount (in Lakhs)
Cash Flow Hedge
44 165.79 5 12.18 404.27 April 2017- September
2017
1:1 67.90 73.27
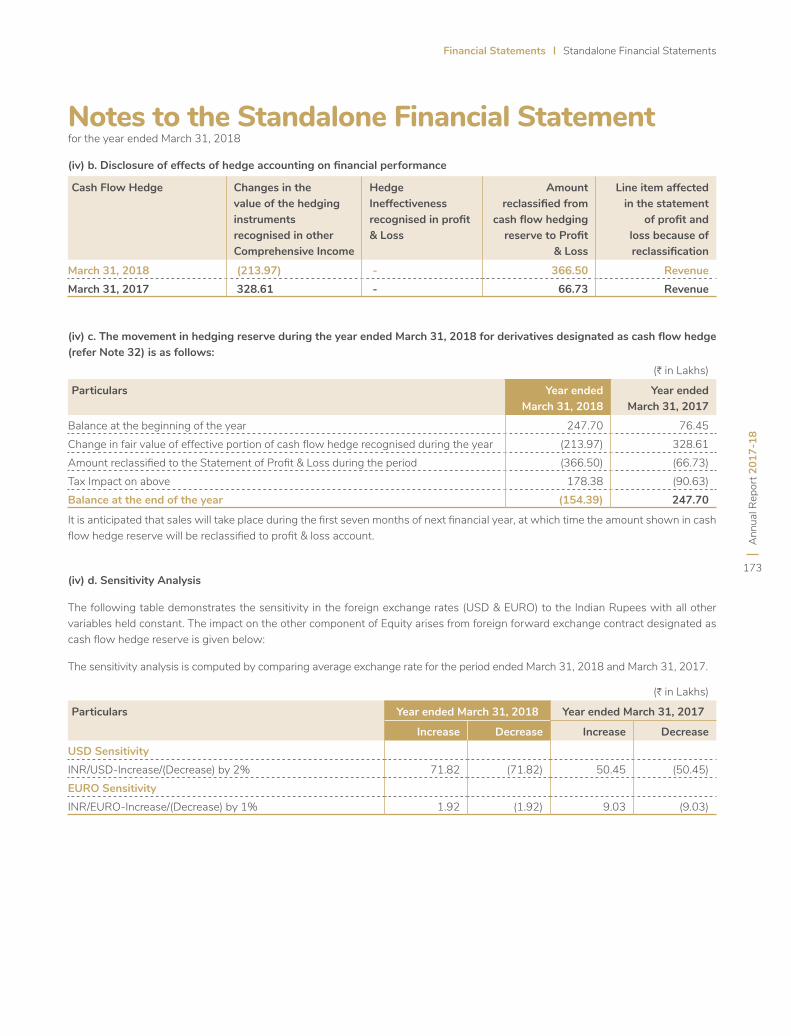
Financial Statements Standalone Financial Statements
Ann
ual R
epor
t 201
7-18
173
Notes to the Standalone Financial Statementfor the year ended March 31, 2018
(H in Lakhs)
Particulars Year endedMarch 31, 2018
Year ended March 31, 2017
Balance at the beginning of the year 247.70 76.45 Change in fair value of effective portion of cash flow hedge recognised during the year (213.97) 328.61 Amount reclassified to the Statement of Profit & Loss during the period (366.50) (66.73)Tax Impact on above 178.38 (90.63)Balance at the end of the year (154.39) 247.70
(iv) b. Disclosure of effects of hedge accounting on financial performance
(iv) c. The movement in hedging reserve during the year ended March 31, 2018 for derivatives designated as cash flow hedge (refer Note 32) is as follows:
Cash Flow Hedge Changes in the value of the hedging instruments recognised in other Comprehensive Income
Hedge Ineffectiveness recognised in profit & Loss
Amount reclassified from
cash flow hedging reserve to Profit
& Loss
Line item affected in the statement
of profit and loss because of reclassification
March 31, 2018 (213.97) - 366.50 RevenueMarch 31, 2017 328.61 - 66.73 Revenue
(H in Lakhs)
Particulars Year ended March 31, 2018 Year ended March 31, 2017
Increase Decrease Increase Decrease
USD Sensitivity INR/USD-Increase/(Decrease) by 2% 71.82 (71.82) 50.45 (50.45)EURO Sensitivity INR/EURO-Increase/(Decrease) by 1% 1.92 (1.92) 9.03 (9.03)
It is anticipated that sales will take place during the first seven months of next financial year, at which time the amount shown in cash flow hedge reserve will be reclassified to profit & loss account.
(iv) d. Sensitivity Analysis
The following table demonstrates the sensitivity in the foreign exchange rates (USD & EURO) to the Indian Rupees with all other variables held constant. The impact on the other component of Equity arises from foreign forward exchange contract designated as cash flow hedge reserve is given below:
The sensitivity analysis is computed by comparing average exchange rate for the period ended March 31, 2018 and March 31, 2017.
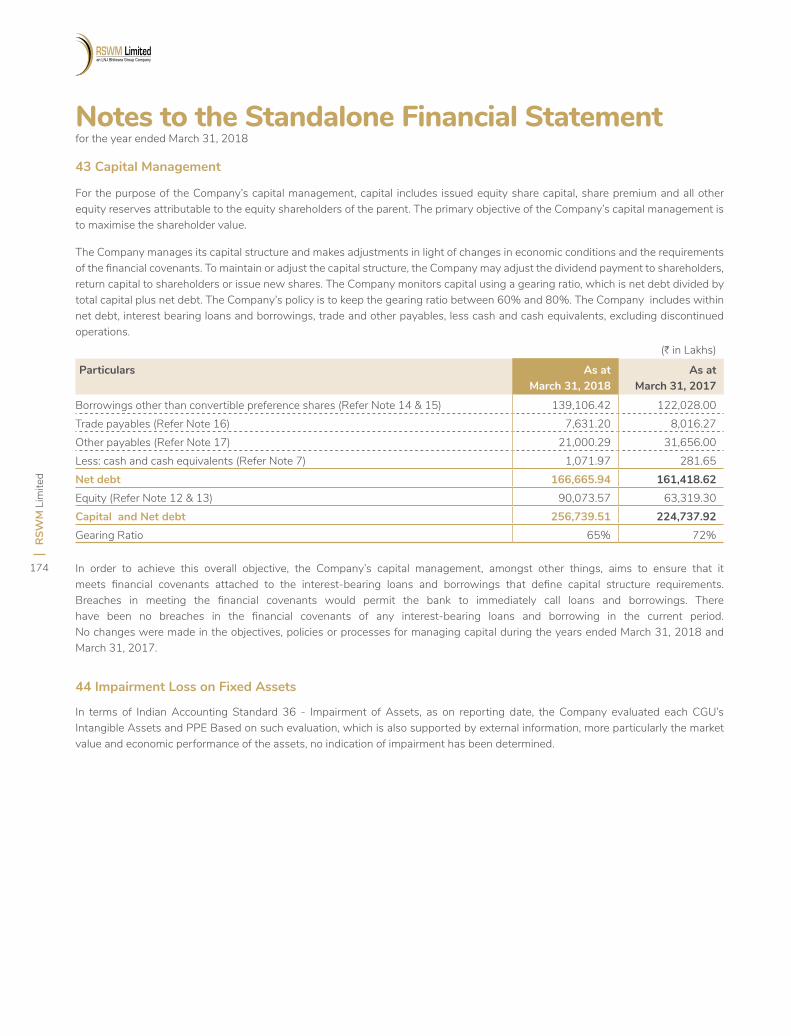
RSW
M L
imite
d
174
Notes to the Standalone Financial Statement for the year ended March 31, 2018
43 Capital Management
44 Impairment Loss on Fixed Assets
For the purpose of the Company’s capital management, capital includes issued equity share capital, share premium and all other equity reserves attributable to the equity shareholders of the parent. The primary objective of the Company’s capital management is to maximise the shareholder value.
The Company manages its capital structure and makes adjustments in light of changes in economic conditions and the requirements of the financial covenants. To maintain or adjust the capital structure, the Company may adjust the dividend payment to shareholders, return capital to shareholders or issue new shares. The Company monitors capital using a gearing ratio, which is net debt divided by total capital plus net debt. The Company’s policy is to keep the gearing ratio between 60% and 80%. The Company includes within net debt, interest bearing loans and borrowings, trade and other payables, less cash and cash equivalents, excluding discontinued operations.
(H in Lakhs)
Particulars As atMarch 31, 2018
As atMarch 31, 2017
Borrowings other than convertible preference shares (Refer Note 14 & 15) 139,106.42 122,028.00 Trade payables (Refer Note 16) 7,631.20 8,016.27 Other payables (Refer Note 17) 21,000.29 31,656.00 Less: cash and cash equivalents (Refer Note 7) 1,071.97 281.65 Net debt 166,665.94 161,418.62 Equity (Refer Note 12 & 13) 90,073.57 63,319.30 Capital and Net debt 256,739.51 224,737.92 Gearing Ratio 65% 72%
In order to achieve this overall objective, the Company’s capital management, amongst other things, aims to ensure that it meets financial covenants attached to the interest-bearing loans and borrowings that define capital structure requirements. Breaches in meeting the financial covenants would permit the bank to immediately call loans and borrowings. There have been no breaches in the financial covenants of any interest-bearing loans and borrowing in the current period. No changes were made in the objectives, policies or processes for managing capital during the years ended March 31, 2018 and March 31, 2017.
In terms of Indian Accounting Standard 36 - Impairment of Assets, as on reporting date, the Company evaluated each CGU’s Intangible Assets and PPE Based on such evaluation, which is also supported by external information, more particularly the market value and economic performance of the assets, no indication of impairment has been determined.
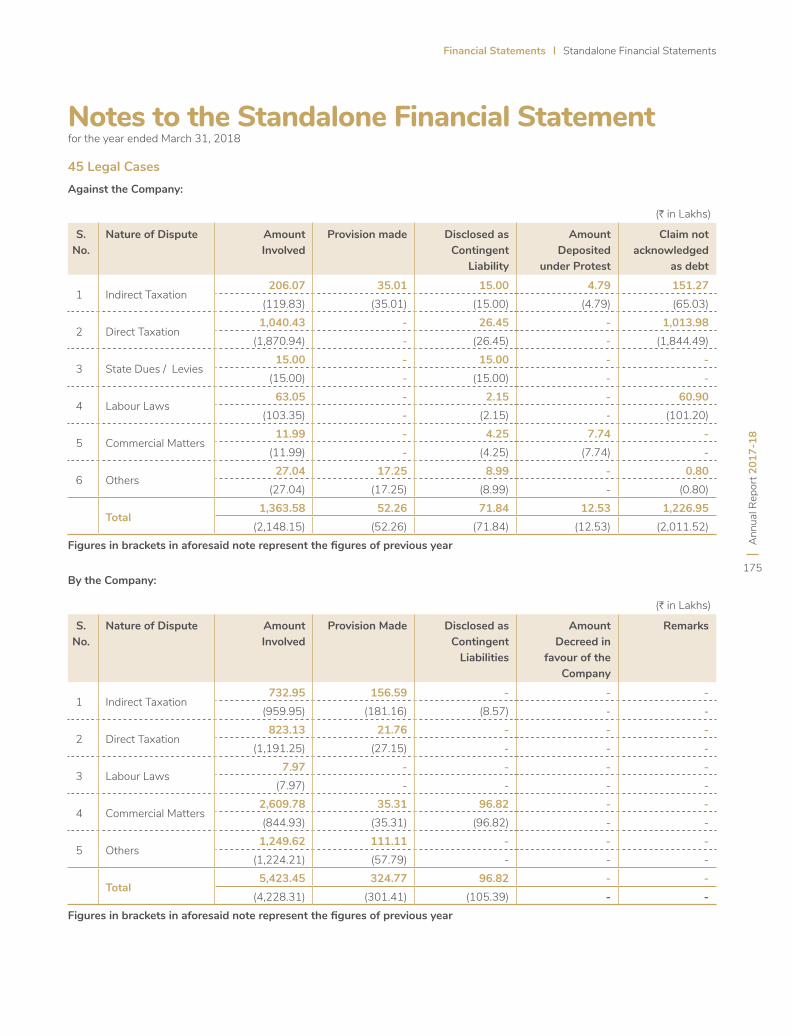
Financial Statements Standalone Financial Statements
Ann
ual R
epor
t 201
7-18
175
Notes to the Standalone Financial Statementfor the year ended March 31, 2018
45 Legal CasesAgainst the Company:
By the Company:
(H in Lakhs)
S. No.
Nature of Dispute Amount Involved
Provision made Disclosed as Contingent
Liability
Amount Deposited
under Protest
Claim not acknowledged
as debt
1 Indirect Taxation206.07 35.01 15.00 4.79 151.27
(119.83) (35.01) (15.00) (4.79) (65.03)
2 Direct Taxation1,040.43 - 26.45 - 1,013.98
(1,870.94) - (26.45) - (1,844.49)
3 State Dues / Levies15.00 - 15.00 - -
(15.00) - (15.00) - -
4 Labour Laws63.05 - 2.15 - 60.90
(103.35) - (2.15) - (101.20)
5 Commercial Matters11.99 - 4.25 7.74 -
(11.99) - (4.25) (7.74) -
6 Others27.04 17.25 8.99 - 0.80
(27.04) (17.25) (8.99) - (0.80)
Total1,363.58 52.26 71.84 12.53 1,226.95
(2,148.15) (52.26) (71.84) (12.53) (2,011.52)Figures in brackets in aforesaid note represent the figures of previous year
(H in Lakhs)
S. No.
Nature of Dispute Amount Involved
Provision Made Disclosed as Contingent
Liabilities
Amount Decreed in
favour of the Company
Remarks
1 Indirect Taxation732.95 156.59 - - -
(959.95) (181.16) (8.57) - -
2 Direct Taxation823.13 21.76 - - -
(1,191.25) (27.15) - - -
3 Labour Laws7.97 - - - -
(7.97) - - - -
4 Commercial Matters2,609.78 35.31 96.82 - - (844.93) (35.31) (96.82) - -
5 Others1,249.62 111.11 - - -
(1,224.21) (57.79) - - -
Total5,423.45 324.77 96.82 - -
(4,228.31) (301.41) (105.39) - - Figures in brackets in aforesaid note represent the figures of previous year
RSW
M L
imite
d
176
Notes to the Standalone Financial Statement for the year ended March 31, 2018
46 Recent Accounting Pronouncements
Standards issued but not yet effected
In March 2018, the Ministry of Corporate Affairs issued the Companies (Indian Accounting Standards) Amendments Rules, 2018, notifying amendments to Ind AS 21, ‘Foreign Currency Transactions’ and Ind AS 115, ‘Revenue from Contract with Customers.’ The amendments are applicable to the Company from April 1, 2018.
Appendix B to Ind AS 21, Foreign Currency Transactions and Advance Consideration:
On March 28, 2018, Ministry of Corporate Affairs (“MCA”) has notified the Companies (Indian Accounting Standards) Amendment Rules, 2018 containing Appendix B to Ind AS 21, Foreign currency transactions and advance consideration which clarifies the date of the transaction for the purpose of determining the exchange rate to use on initial recognition of the related asset, expense or income, when an entity has received or paid advance consideration in a foreign currency. The amendment will come into force from April 1, 2018. The Company has evaluated the effect of this on the financial statements and the impact is not material.
Ind AS 115- Revenue from Contract with Customers:
On March 28, 2018, Ministry of Corporate Affairs (“MCA”) has notified the Ind AS 115, Revenue from Contract with Customers. The core principle of the new standard is that an entity should recognize revenue to depict the transfer of promised goods or services to customers at an amount that reflects the consideration to which the entity expects to be entitled in exchange for those goods or services. Further the new standard requires enhanced disclosures about the nature, amount, timing and uncertainty of revenue and cash flows arising from the entity’s contracts with customers. The effective date for adoption of Ind AS 115 is financial periods beginning on or after April 1, 2018. The Company will adopt the standard from April 1, 2018. The effect on adoption of Ind AS 115 is expected to be insignificant.
As per our report of even date For and on Behalf of Board of Directors
For Lodha & Co. For S.S. Kothari Mehta & Co. Ravi Jhunjhunwala Riju JhunjhunwalaChartered Accountants Chartered Accountants Chairman Managing Director &Firm Regn. No. 301051E Firm Regn. No. 000756N DIN 00060972 Chief Executive Officer DIN 00061060
N. K. Lodha Yogesh K. Gupta B. M. Sharma Surender GuptaPartner Partner Chief Financial Officer Company SecretaryM. No. 085155 M. No. 093214 M.No. FCA 035012 M.No. FCS 2615
Place: Noida, (U.P.)Date: May 10, 2018
Ann
ual R
epor
t 201
7-18
177
Financial Statements Consolidated Financial Statements
Independent Auditors’ Report
To The Members of RSWM LIMITED
Report on the Consolidated Financial Statements
We have audited the accompanying consolidated financial statements of RSWM LIMITED (hereinafter referred to as “the Investor Company”) and its associates, comprising the Consolidated Balance Sheet as at March 31, 2018, the Consolidated Statement of Profit and Loss (including other Comprehensive Income), the Consolidated Statement of Cash Flow and Consolidated Statement of Changes in Equity for the year then ended and a summary of the significant accounting policies and other explanatory information (hereinafter referred to as “the consolidated financial statements”).
Management’s Responsibility for the Consolidated Financial Statements
The Investor Company’s Board of Directors is responsible for the preparation of these consolidated financial statements in terms of the requirements of the Companies Act, 2013 (hereinafter referred to as “the Act”) that give a true and fair view of the consolidated state of affairs (financial position), consolidated profit or loss (financial performance including other comprehensive income), consolidated cash flows and consolidated statement of changes in equity of the Investor Company and its Associates in accordance with the accounting principles generally accepted in India, including the Indian Accounting Standards specified under Section 133 of the Act, read with relevant rules issued thereunder.
The respective Board of Directors of the Investor Company and of its Associates are responsible for maintenance of adequate accounting records in accordance with the provisions of the Act for safeguarding the assets of the Investor Company and its Associates and for preventing and detecting frauds and other irregularities; the selection and application of appropriate accounting policies; making judgments and estimates that are reasonable and prudent; and the design, implementation and maintenance of adequate internal financial controls, that were operating effectively for ensuring the accuracy and completeness of the accounting records, relevant to the preparation and presentation of the consolidated financial statements that give a true and fair view and are free from material misstatement, whether due to fraud or error, which have been used for the purpose of preparation of the consolidated financial statements by the Directors of the Investor Company, as aforesaid.
Auditor’s Responsibility
Our responsibility is to express an opinion on these consolidated financial statements based on our audit. While conducting the audit. we have taken into account the provisions of the Act, the accounting and auditing standards and matters which are required to be included in the audit report under the provisions of the Act and the Rules made thereunder.
We conducted our audit of the consolidated financial statements in accordance with the Standards on Auditing specified under Section 143(10) of the Act. Those Standards require that we comply with ethical requirements and plan and perform the audit to obtain reasonable assurance about whether the consolidated financial statements are free from material misstatement.
An audit involves performing procedures to obtain audit evidence about the amounts and the disclosures in the consolidated financial statements. The procedures selected depend on the auditor’s judgment, including the assessment of the risks of material misstatement of the consolidated financial statements, whether due to fraud or error. In making those risk assessments, the auditor considers internal financial control relevant to the Investors Company’s preparation of the consolidated financial statements that give a true and fair view in order to design audit procedures that are appropriate in the circumstances. An audit also includes evaluating the appropriateness of the accounting policies used and the reasonableness of the accounting estimates made by the Investor Company’s Board of Directors, as well as evaluating the overall presentation of the consolidated financial statements.
We believe that the audit evidence obtained by us, the audit evidence obtained by the other auditor in terms of their reports and unaudited financial information and financial statements certified by the management as referred to in Other Matters paragraph below, is sufficient and appropriate to provide a basis for our audit opinion on the consolidated financial statements.
Opinion
In our opinion and to the best of our information and according to the explanations given to us, based on consideration of the report of the other auditor on the financial statement of an associate and unaudited financial information/financial statements certified by the management as referred to in Other Matters
RSW
M L
imite
d
178
Independent Auditors’ Report (Contd..)
paragraph, the aforesaid consolidated financial statements give the information required by the Act in the manner so required and give a true and fair view in conformity with the accounting principles generally accepted in India, of the consolidated state of affairs (financial position) of the Investor Company and its Associates as at March 31, 2018 and their consolidated profit (financial performance including other comprehensive income), their consolidated cash flows and the consolidated statement of changes in the equity for the year then ended.
Relating to Subsidiary of an Associate
In case of Chango Yangthang Hydro Power Limited (CYHPL), a subsidiary of an associate Bhilwara Energy Limited (BEL), as stated in Note No. 47 ii)b) of the consolidated financial statements, the Board of Directors of CYHPL has decided to surrender the Chango Yangthang HEP (180 MW) project to Directorate of Energy, Government of Himachal Pradesh due to delay and uncertainty in project execution/long delay in Government approvals and licenses lapse. Further, CYHPL has written off capital work in progress amounting to H27.13 Crores during the year. As CYHPL was incorporated as Special Purpose Vehicle (SPV) hence these events/conditions indicate that there exists material uncertainty that may cast significant doubt on its ability to continue as a going concern. This matter was reported under heading “Material uncertainty relating to Going Concern” in the auditor’s report on consolidated financial statements of an associate (BEL). Our opinion is not modified in respect of above matter.
Emphasis of Matter
Attention is drawn to:
a) In case of CYHPL, a subsidiary of an Associate (BEL), as stated in Note No 47 ii)b) of the consolidated financial statements regarding pending refund of upfront premium of H3,789.45 Lakhs and security deposit of H180 Lakhs with interest from the Directorate of Energy, Government of Himachal Pradesh, where the management of CYHPL is confident of recovering the upfront premium and security deposit.
b) In case of NJC Hydro Power Limited, a subsidiary of an Associate (BEL), as stated in Note No 47 ii)c) of the consolidated financial statements regarding the viability of the Nyamjang Chhu Hydro Electric Power Project is dependent on the outcome of approval to be granted by National Green Tribunal and Ministry of Environment & Forest and Climate Change.
This Emphasis of matter was reported in the auditor’s report on consolidated financial statements of an associate. Our opinion is not modified in respect of above matters.
Other Matters
(a) The consolidated financial statements include the Investor Company’s share of net profit of H774.28 Lakhs and other comprehensive income of H2.86 Lakhs for the year ended March 31, 2018 as considered in the consolidated financial statements, in respect of an associate Bhilwara Energy Limited, whose financial statements have not been audited by us. These financial statements have been audited by other auditors, whose reports have been furnished to us by the Management and our opinion on the consolidated financial statements, in so far as it relates to the amounts and disclosures included in respect of an associate and our report in terms of sub-section (3) of Section 143 of the Act, in so far as it relates to the aforesaid associate is based solely on the report of the other auditors.
(b) We have relied on the management certified financial statements (un-audited) whose consolidated financial statements include the net Loss of H(125.96) Lakhs and other comprehensive income NIL for the year ended March 31, 2018 as considered in the consolidated financial statements, in respect of two associates (LNJ Power Ventures Limited and LNJ Skills & Rozgar Private Limited), whose financial statements have not been audited by us. These financial statement are unaudited and have been furnished to us by the management and our opinion on the consolidated financial statements, in so far as it relates to the amounts and disclosures included in respect of these associates, and our report in terms of sub-section (3) of Section 143 of the Act in so far as it relates to the aforesaid associates, is based solely on the unaudited financial statements/financial information certified by the management.
(c) The consolidated financial statements of the Company for the year ended 31st March, 2017 have been audited by one of the predecessor joint auditor with S.S. Kothari Mehta & Co. who have expressed an unmodified opinion on the consolidated financial statements.
Our above opinion on the consolidated financial statements and our report on Other Legal and Regulatory Requirements below, is not modified in respect of the above matters with respect to our reliance on financial statements/financial information certified by the Managements and the reports of the other auditors.
Ann
ual R
epor
t 201
7-18
179
Financial Statements Consolidated Financial Statements
Independent Auditors’ Report (Contd..)
Report on Other Legal and Regulatory Requirements
As required by Section143(3) of the Act, based on our audit and on the consideration of unaudited financial statement/financial information certified by the management and the reports of the other auditors, as noted in the Other Matters paragraph, we report, to the extent applicable, that:
(a) We have sought and obtained all the information and explanations which to the best of our knowledge and belief were necessary for the purposes of our audit of the aforesaid consolidated financial statements.
(b) In our opinion, proper books of account as required by law relating to preparation of the aforesaid consolidated financial statements have been kept so far as it appears from our examination of those books and the certificate received from the management as referred to in Other Matters paragraph.
(c) The consolidated balance sheet, the consolidated statement of profit and loss (including other comprehensive income), the consolidated statement of cash flow and consolidated statement of changes in equity dealt with by this Report, are in agreement with the relevant books of account maintained for the purpose of preparation of the consolidated financial statements.
(d) In our opinion, the aforesaid consolidated financial statements comply with the Accounting Standards specified under Section 133 of the Act read with relevant rules made thereunder.
(e) On the basis of the written representations received from the directors of the Investor Company as on March 31, 2018 taken on record by the Board of Directors of the Investor Company and the certificate received from the management of its associate companies and the statutory report of the other statutory auditor of associate Company, none of the directors of the Investor Company and its associate companies is disqualified as on March 31, 2018 from being appointed as a director in terms of Section 164 (2) of the Act.
(f) With respect to the adequacy of the internal financial controls over financial reporting of the Investor Company and its associate companies and the operating effectiveness of such controls, refer to our separate report in Annexure ‘A’.
(g) With respect to the other matters to be included in the Auditor’s Report in accordance with Rule 11 of the Companies (Audit and Auditor’s) Rules, 2014, in our opinion and to the best of our information and according to the explanations given to us:
i. The consolidated financial statements disclose the impact of pending litigations on the consolidated financial position of the Investor Company and its Associates– Refer Note No 45 to the consolidated financial statements.
ii. The Investor Company and its Associates did not have any material foreseeable losses on long-term contracts including derivative contracts.
iii. There has been no delay in transferring amounts, required to be transferred, to the Investor Education and Protection Fund by the Investor Company and its associate companies during the year ended March, 31 2018.
For Lodha & Co For S S Kothari Mehta & Co.Chartered Accountants Chartered AccountantsFRN : 301051E FRN : 000756N
N K Lodha Yogesh K. GuptaPartner PartnerM. No. 085155 M. No. 093214
Place : Noida Date : May 10, 2018
RSW
M L
imite
d
180
Annexure ‘A’ to the Independent Auditors’ Report to the Members of RSWM Limited (Investor Company) on its Consolidated Financial StatementsReport on the Internal Financial Controls under clause (i) of sub-section 3 of Section 143 of the Companies Act, 2013 (“the Act”) as referred to in paragraph 1(f) of ‘Report on Other Legal and Regulatory Requirements’ section of our report referred above
In conjunction with our audit of the consolidated financial statements of the Investor Company and its associates as of and for the year ended March 31, 2018, we have audited the internal financial controls over financial reporting of RSWM Limited (hereinafter referred to as “the Investor Company”) and its associates as of that date.
Management’s Responsibility for Internal Financial Controls
The respective Board of Directors of the Investor Company and its associate companies, are responsible for establishing and maintaining internal financial controls based on the internal control over financial reporting criteria established by the Company considering the essential components of internal control stated in the Guidance Note on Audit of Internal Financial Controls Over Financial Reporting issued by the Institute of Chartered Accountants of India (ICAI). These responsibilities include the design, implementation and maintenance of adequate internal financial controls that were operating effectively for ensuring the orderly and efficient conduct of its business, including adherence to the respective company’s policies, the safeguarding of its assets, the prevention and detection of frauds and errors, the accuracy and completeness of the accounting records, and the timely preparation of reliable financial information, as required under the Companies Act, 2013.
Auditor’s Responsibility
Our responsibility is to express an opinion on the Company’s internal financial controls over financial reporting based on our audit. We conducted our audit in accordance with the Guidance Note on Audit of Internal Financial Controls Over Financial Reporting (the “Guidance Note”) issued by the ICAI and the Standards on Auditing prescribed under section 143(10) of the Companies Act, 2013, to the extent applicable to an audit of internal financial controls. Those Standards and the Guidance Note require that we comply with ethical requirements and plan and perform the audit to obtain reasonable assurance about whether adequate internal financial controls over financial reporting was established and maintained and if such controls operated effectively in all material respects.
Our audit involves performing procedures to obtain audit evidence about the adequacy of the internal financial controls system over financial reporting and their operating effectiveness. Our audit of internal financial controls over financial reporting included obtaining an understanding of internal financial controls over financial reporting, assessing the risk that a material weakness exists, and testing and evaluating the design and operating effectiveness of internal control based on the assessed risk. The procedures selected depend on the auditor’s judgment, including the assessment of the risks of material misstatement of the financial statements, whether due to fraud or error.
We believe that the audit evidence, we have obtained and certificate received from management as referred to in Other Matters paragraph below is sufficient and appropriate to provide a basis for our audit opinion on the internal financial controls system over financial reporting of the Investor Company and its associates.
Meaning of Internal Financial Controls Over Financial Reporting
A company’s internal financial control over financial reporting is a process designed to provide reasonable assurance regarding the reliability of financial reporting and the preparation of financial statements for external purposes in accordance with generally accepted accounting principles. A company’s internal financial control over financial reporting includes those policies and procedures that (1) pertain to the maintenance of records that, in reasonable detail, accurately and fairly reflect the transactions and dispositions of the assets of the company; (2) provide reasonable assurance that transactions are recorded as necessary to permit preparation of financial statements in accordance with generally accepted accounting principles, and that receipts and expenditures of the company are being made only in accordance with authorizations of management and directors of the company; and (3) provide reasonable assurance regarding prevention or timely detection of unauthorized acquisition, use, or disposition of the company’s assets that could have a material effect on the financial statements.
Ann
ual R
epor
t 201
7-18
181
Financial Statements Consolidated Financial Statements
Annexure ‘A’ to the Independent Auditors’ Report to the Members of RSWM Limited (Investor Company) on its Consolidated Financial Statements (contd..)Inherent Limitations of Internal Financial Controls Over Financial Reporting
Because of the inherent limitations of internal financial controls over financial reporting, including the possibility of collusion or improper management override of controls, material misstatements due to error or fraud may occur and not be detected. Also, projections of any evaluation of the internal financial controls over financial reporting to future periods are subject to the risk that the internal financial control over financial reporting may become inadequate because of changes in conditions, or that the degree of compliance with the policies or procedures may deteriorate.
Opinion
In our opinion, to the best of our information and according to the explanations given to us and based on the consideration of management certificate and reports of other auditors, as referred to in Other Matters paragraph, the Investor Company and its associate companies, have, in all material respects, an adequate internal financial controls system over financial reporting and such internal financial controls over financial reporting were operating effectively as at March 31, 2018, based on the internal control over financial reporting criteria established by the Investor Company and its associates, considering the essential
components of internal control stated in the Guidance Note on Audit of Internal Financial Controls Over Financial Reporting issued by the Institute of Chartered Accountants of India.
Other Matters
Our aforesaid reports under Section 143(3)(i) of the Act on the adequacy and operating effectiveness of the internal financial controls over financial reporting in so far as it relates to an associate companies LNJ Power Ventures Limited and Bhilwara Energy Limited, is based on the management certificate and reports of other auditors respectively. As certified by the management of LNJ Skills & Rozgar Private Limited, internal financial controls over financial reporting is not applicable on it.
For Lodha & Co. For S S Kothari Mehta & Co.Chartered Accountants Chartered AccountantsFRN : 301051E FRN : 000756N
N K Lodha Yogesh K. GuptaPartner PartnerM. No. 085155 M. No. 093214
Place : Noida Date : May 10, 2018
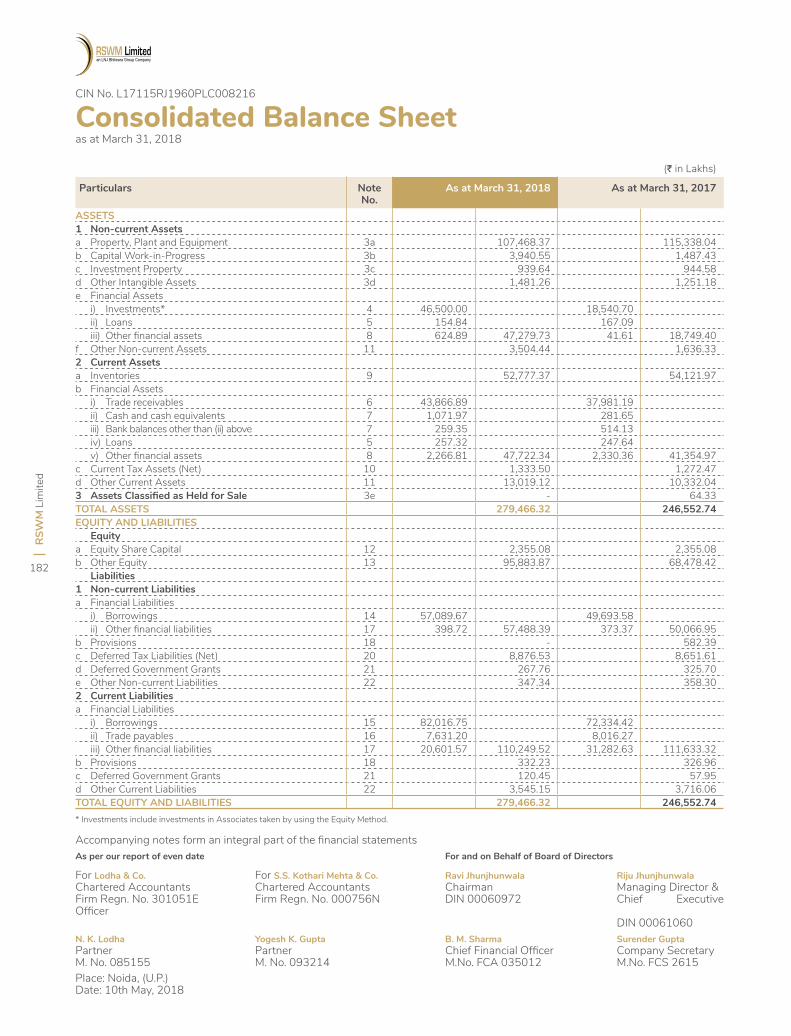
RSW
M L
imite
d
182
(J in Lakhs)
Particulars Note No.
As at March 31, 2018 As at March 31, 2017
ASSETS1 Non-current Assetsa Property, Plant and Equipment 3a 107,468.37 115,338.04 b Capital Work-in-Progress 3b 3,940.55 1,487.43 c Investment Property 3c 939.64 944.58 d Other Intangible Assets 3d 1,481.26 1,251.18 e Financial Assets i) Investments* 4 46,500.00 18,540.70 ii) Loans 5 154.84 167.09 iii) Other financial assets 8 624.89 47,279.73 41.61 18,749.40 f Other Non-current Assets 11 3,504.44 1,636.33 2 Current Assetsa Inventories 9 52,777.37 54,121.97 b Financial Assets i) Trade receivables 6 43,866.89 37,981.19 ii) Cash and cash equivalents 7 1,071.97 281.65 iii) Bank balances other than (ii) above 7 259.35 514.13 iv) Loans 5 257.32 247.64 v) Other financial assets 8 2,266.81 47,722.34 2,330.36 41,354.97 c Current Tax Assets (Net) 10 1,333.50 1,272.47 d Other Current Assets 11 13,019.12 10,332.04 3 AssetsClassifiedasHeldforSale 3e - 64.33 TOTAL ASSETS 279,466.32 246,552.74 EQUITY AND LIABILITIES Equitya Equity Share Capital 12 2,355.08 2,355.08 b Other Equity 13 95,883.87 68,478.42 Liabilities1 Non-current Liabilitiesa Financial Liabilities i) Borrowings 14 57,089.67 49,693.58 ii) Other financial liabilities 17 398.72 57,488.39 373.37 50,066.95 b Provisions 18 - 582.39 c Deferred Tax Liabilities (Net) 20 8,876.53 8,651.61 d Deferred Government Grants 21 267.76 325.70 e Other Non-current Liabilities 22 347.34 358.30 2 Current Liabilitiesa Financial Liabilities i) Borrowings 15 82,016.75 72,334.42 ii) Trade payables 16 7,631.20 8,016.27 iii) Other financial liabilities 17 20,601.57 110,249.52 31,282.63 111,633.32 b Provisions 18 332.23 326.96 c Deferred Government Grants 21 120.45 57.95 d Other Current Liabilities 22 3,545.15 3,716.06 TOTAL EQUITY AND LIABILITIES 279,466.32 246,552.74
Consolidated Balance Sheet as at March 31, 2018
Accompanying notes form an integral part of the financial statementsAs per our report of even date For and on Behalf of Board of Directors
For Lodha & Co. For S.S. Kothari Mehta & Co. Ravi Jhunjhunwala Riju JhunjhunwalaChartered Accountants Chartered Accountants Chairman Managing Director &Firm Regn. No. 301051E Firm Regn. No. 000756N DIN 00060972 Chief Executive Officer DIN 00061060N. K. Lodha Yogesh K. Gupta B. M. Sharma Surender GuptaPartner Partner Chief Financial Officer Company SecretaryM. No. 085155 M. No. 093214 M.No. FCA 035012 M.No. FCS 2615Place: Noida, (U.P.)Date: 10th May, 2018
* Investments include investments in Associates taken by using the Equity Method.
CIN No. L17115RJ1960PLC008216
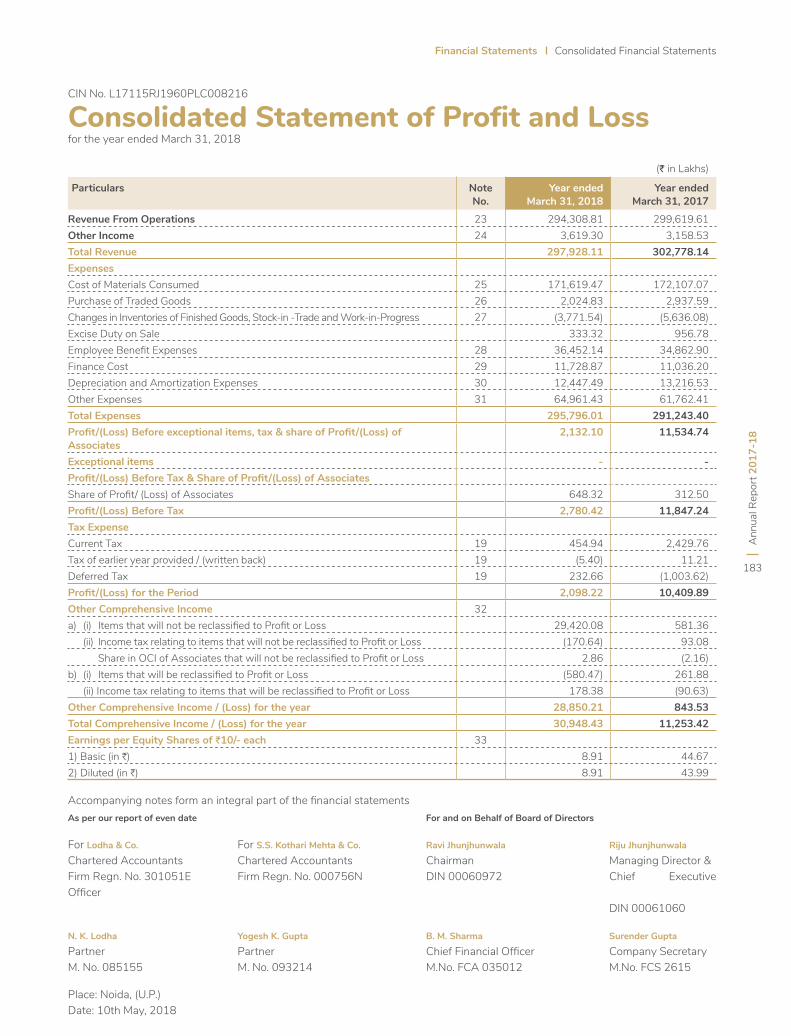
Ann
ual R
epor
t 201
7-18
183
Financial Statements Consolidated Financial Statements
Accompanying notes form an integral part of the financial statementsAs per our report of even date For and on Behalf of Board of Directors
For Lodha & Co. For S.S. Kothari Mehta & Co. Ravi Jhunjhunwala Riju Jhunjhunwala
Chartered Accountants Chartered Accountants Chairman Managing Director &Firm Regn. No. 301051E Firm Regn. No. 000756N DIN 00060972 Chief Executive Officer DIN 00061060
N. K. Lodha Yogesh K. Gupta B. M. Sharma Surender Gupta
Partner Partner Chief Financial Officer Company SecretaryM. No. 085155 M. No. 093214 M.No. FCA 035012 M.No. FCS 2615
Place: Noida, (U.P.)Date: 10th May, 2018
Consolidated Statement of Profit and Lossfor the year ended March 31, 2018
(J in Lakhs)
Particulars Note No.
Year ended March 31, 2018
Year ended March 31, 2017
Revenue From Operations 23 294,308.81 299,619.61 Other Income 24 3,619.30 3,158.53 Total Revenue 297,928.11 302,778.14 ExpensesCost of Materials Consumed 25 171,619.47 172,107.07 Purchase of Traded Goods 26 2,024.83 2,937.59 Changes in Inventories of Finished Goods, Stock-in -Trade and Work-in-Progress 27 (3,771.54) (5,636.08)Excise Duty on Sale 333.32 956.78 Employee Benefit Expenses 28 36,452.14 34,862.90 Finance Cost 29 11,728.87 11,036.20 Depreciation and Amortization Expenses 30 12,447.49 13,216.53 Other Expenses 31 64,961.43 61,762.41 Total Expenses 295,796.01 291,243.40 Profit/(Loss)Beforeexceptionalitems,tax&shareofProfit/(Loss)ofAssociates
2,132.10 11,534.74
Exceptional items - - Profit/(Loss)BeforeTax&ShareofProfit/(Loss)ofAssociatesShare of Profit/ (Loss) of Associates 648.32 312.50 Profit/(Loss)BeforeTax 2,780.42 11,847.24 Tax Expense Current Tax 19 454.94 2,429.76 Tax of earlier year provided / (written back) 19 (5.40) 11.21 Deferred Tax 19 232.66 (1,003.62)Profit/(Loss)forthePeriod 2,098.22 10,409.89 Other Comprehensive Income 32a) (i) Items that will not be reclassified to Profit or Loss 29,420.08 581.36 (ii) Income tax relating to items that will not be reclassified to Profit or Loss (170.64) 93.08 Share in OCI of Associates that will not be reclassified to Profit or Loss 2.86 (2.16)b) (i) Items that will be reclassified to Profit or Loss (580.47) 261.88 (ii) Income tax relating to items that will be reclassified to Profit or Loss 178.38 (90.63)OtherComprehensiveIncome/(Loss)fortheyear 28,850.21 843.53 TotalComprehensiveIncome/(Loss)fortheyear 30,948.43 11,253.42 Earnings per Equity Shares of J10/-each 331) Basic (in H) 8.91 44.67 2) Diluted (in H) 8.91 43.99
CIN No. L17115RJ1960PLC008216
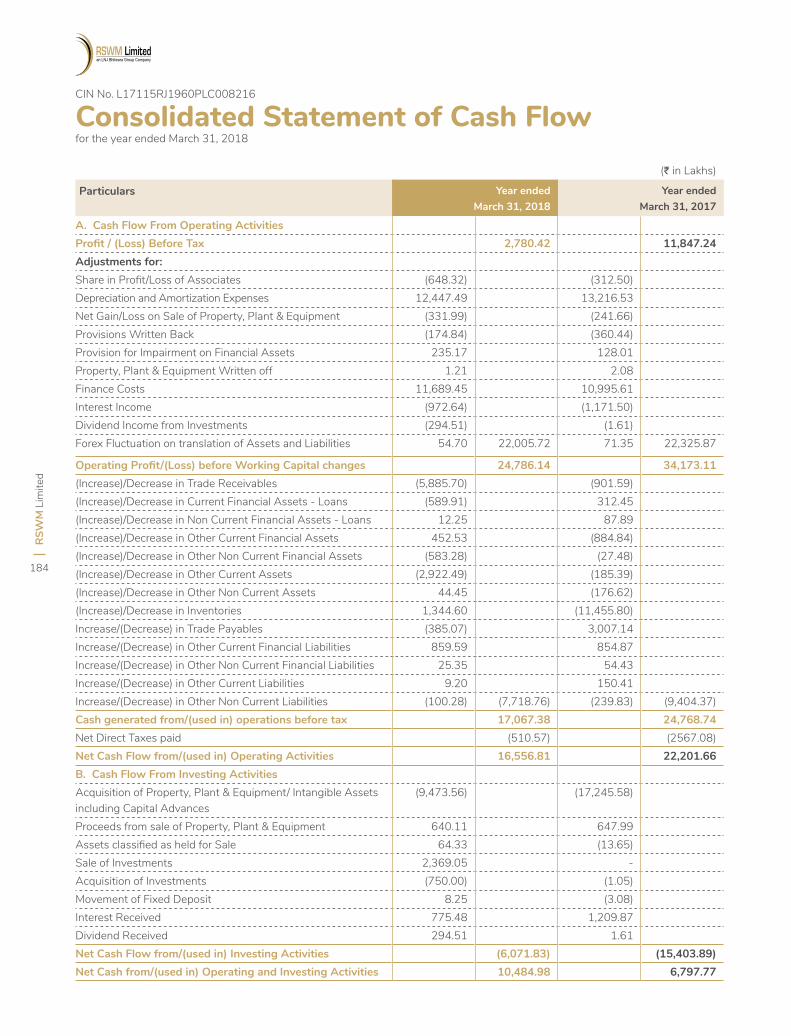
RSW
M L
imite
d
184
Consolidated Statement of Cash Flow for the year ended March 31, 2018
(J in Lakhs)
Particulars Year ended March 31, 2018
Year ended March 31, 2017
A. Cash Flow From Operating ActivitiesProfit/(Loss)BeforeTax 2,780.42 11,847.24 Adjustments for:Share in Profit/Loss of Associates (648.32) (312.50)Depreciation and Amortization Expenses 12,447.49 13,216.53 Net Gain/Loss on Sale of Property, Plant & Equipment (331.99) (241.66)Provisions Written Back (174.84) (360.44)Provision for Impairment on Financial Assets 235.17 128.01 Property, Plant & Equipment Written off 1.21 2.08 Finance Costs 11,689.45 10,995.61 Interest Income (972.64) (1,171.50)Dividend Income from Investments (294.51) (1.61)Forex Fluctuation on translation of Assets and Liabilities 54.70 22,005.72 71.35 22,325.87
OperatingProfit/(Loss)beforeWorkingCapitalchanges 24,786.14 34,173.11 (Increase)/Decrease in Trade Receivables (5,885.70) (901.59)(Increase)/Decrease in Current Financial Assets - Loans (589.91) 312.45 (Increase)/Decrease in Non Current Financial Assets - Loans 12.25 87.89 (Increase)/Decrease in Other Current Financial Assets 452.53 (884.84)(Increase)/Decrease in Other Non Current Financial Assets (583.28) (27.48)(Increase)/Decrease in Other Current Assets (2,922.49) (185.39)(Increase)/Decrease in Other Non Current Assets 44.45 (176.62)(Increase)/Decrease in Inventories 1,344.60 (11,455.80)Increase/(Decrease) in Trade Payables (385.07) 3,007.14 Increase/(Decrease) in Other Current Financial Liabilities 859.59 854.87 Increase/(Decrease) in Other Non Current Financial Liabilities 25.35 54.43 Increase/(Decrease) in Other Current Liabilities 9.20 150.41 Increase/(Decrease) in Other Non Current Liabilities (100.28) (7,718.76) (239.83) (9,404.37)Cashgeneratedfrom/(usedin)operationsbeforetax 17,067.38 24,768.74 Net Direct Taxes paid (510.57) (2567.08)NetCashFlowfrom/(usedin)OperatingActivities 16,556.81 22,201.66 B. Cash Flow From Investing ActivitiesAcquisition of Property, Plant & Equipment/ Intangible Assets including Capital Advances
(9,473.56) (17,245.58)
Proceeds from sale of Property, Plant & Equipment 640.11 647.99 Assets classified as held for Sale 64.33 (13.65)Sale of Investments 2,369.05 - Acquisition of Investments (750.00) (1.05)Movement of Fixed Deposit 8.25 (3.08)Interest Received 775.48 1,209.87 Dividend Received 294.51 1.61 NetCashFlowfrom/(usedin)InvestingActivities (6,071.83) (15,403.89)NetCashfrom/(usedin)OperatingandInvestingActivities 10,484.98 6,797.77
CIN No. L17115RJ1960PLC008216
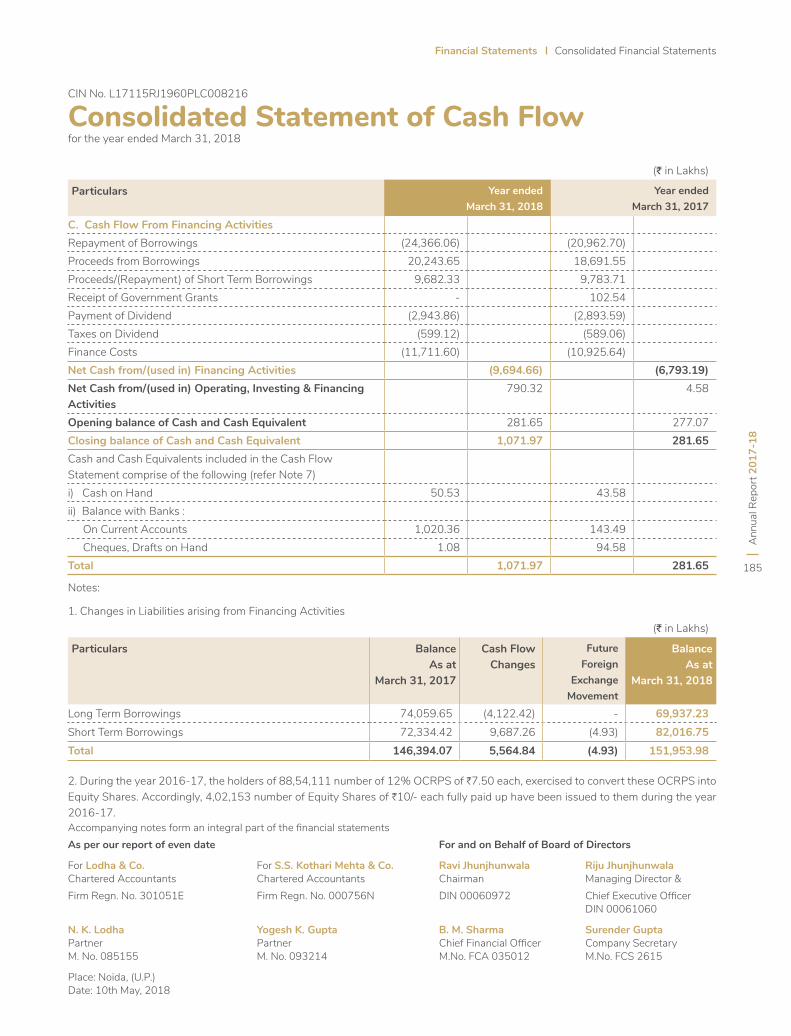
Ann
ual R
epor
t 201
7-18
185
Financial Statements Consolidated Financial Statements
Consolidated Statement of Cash Flow for the year ended March 31, 2018
(J in Lakhs)
Particulars Year ended March 31, 2018
Year ended March 31, 2017
C. Cash Flow From Financing ActivitiesRepayment of Borrowings (24,366.06) (20,962.70)Proceeds from Borrowings 20,243.65 18,691.55 Proceeds/(Repayment) of Short Term Borrowings 9,682.33 9,783.71 Receipt of Government Grants - 102.54 Payment of Dividend (2,943.86) (2,893.59)Taxes on Dividend (599.12) (589.06)Finance Costs (11,711.60) (10,925.64)NetCashfrom/(usedin)FinancingActivities (9,694.66) (6,793.19)NetCashfrom/(usedin)Operating,Investing&FinancingActivities
790.32 4.58
Opening balance of Cash and Cash Equivalent 281.65 277.07 Closing balance of Cash and Cash Equivalent 1,071.97 281.65 Cash and Cash Equivalents included in the Cash Flow Statement comprise of the following (refer Note 7)i) Cash on Hand 50.53 43.58 ii) Balance with Banks : On Current Accounts 1,020.36 143.49 Cheques, Drafts on Hand 1.08 94.58 Total 1,071.97 281.65
(J in Lakhs)
Particulars BalanceAs at
March 31, 2017
Cash Flow Changes
Future Foreign
Exchange Movement
BalanceAs at
March 31, 2018
Long Term Borrowings 74,059.65 (4,122.42) - 69,937.23 Short Term Borrowings 72,334.42 9,687.26 (4.93) 82,016.75 Total 146,394.07 5,564.84 (4.93) 151,953.98
Notes:
1. Changes in Liabilities arising from Financing Activities
2. During the year 2016-17, the holders of 88,54,111 number of 12% OCRPS of H7.50 each, exercised to convert these OCRPS into Equity Shares. Accordingly, 4,02,153 number of Equity Shares of H10/- each fully paid up have been issued to them during the year 2016-17.Accompanying notes form an integral part of the financial statementsAs per our report of even date For and on Behalf of Board of Directors
For Lodha & Co. For S.S. Kothari Mehta & Co. Ravi Jhunjhunwala Riju JhunjhunwalaChartered Accountants Chartered Accountants Chairman Managing Director &Firm Regn. No. 301051E Firm Regn. No. 000756N DIN 00060972 Chief Executive Officer DIN 00061060
N. K. Lodha Yogesh K. Gupta B. M. Sharma Surender GuptaPartner Partner Chief Financial Officer Company SecretaryM. No. 085155 M. No. 093214 M.No. FCA 035012 M.No. FCS 2615
Place: Noida, (U.P.)Date: 10th May, 2018
CIN No. L17115RJ1960PLC008216
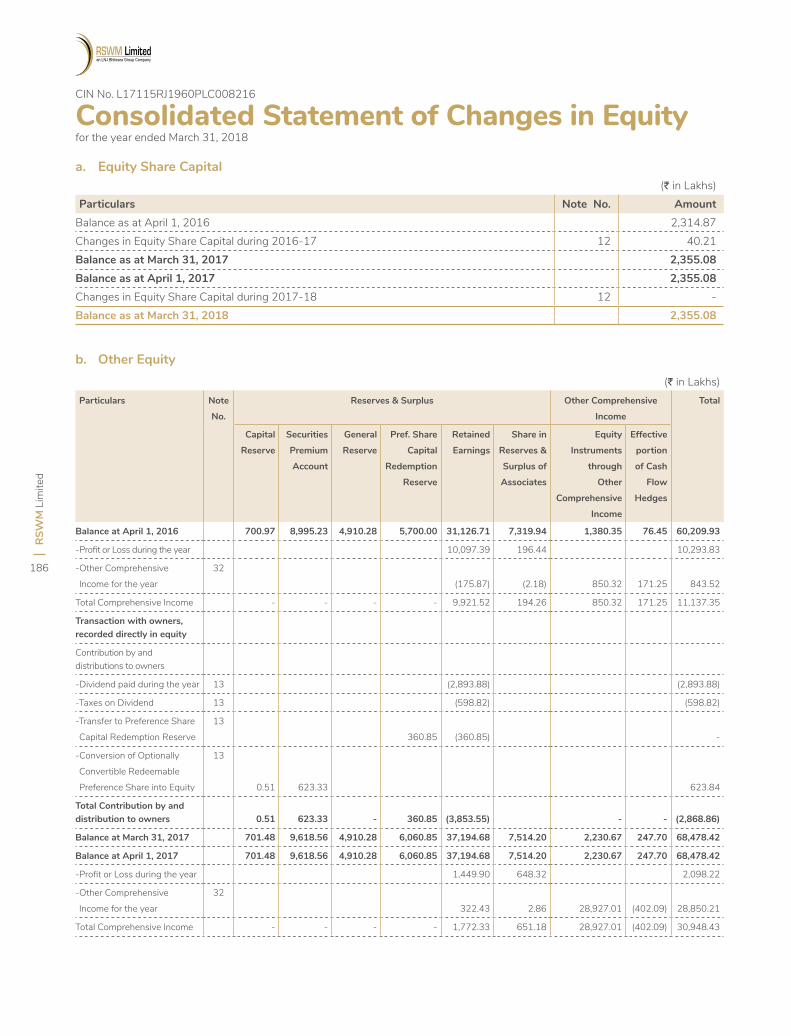
RSW
M L
imite
d
186
(J in Lakhs)Particulars Note No. Amount
Balance as at April 1, 2016 2,314.87 Changes in Equity Share Capital during 2016-17 12 40.21 Balance as at March 31, 2017 2,355.08 Balance as at April 1, 2017 2,355.08 Changes in Equity Share Capital during 2017-18 12 - Balance as at March 31, 2018 2,355.08
Consolidated Statement of Changes in Equity for the year ended March 31, 2018
b. Other Equity
a. Equity Share Capital
(J in Lakhs)Particulars Note
No.
Reserves & Surplus Other Comprehensive
Income
Total
Capital
Reserve
Securities
Premium
Account
General
Reserve
Pref. Share
Capital
Redemption
Reserve
Retained
Earnings
Share in
Reserves &
Surplus of
Associates
Equity
Instruments
through
Other
Comprehensive
Income
Effective
portion
of Cash
Flow
Hedges
Balance at April 1, 2016 700.97 8,995.23 4,910.28 5,700.00 31,126.71 7,319.94 1,380.35 76.45 60,209.93
-Profit or Loss during the year 10,097.39 196.44 10,293.83
-Other Comprehensive
Income for the year
32
(175.87) (2.18) 850.32 171.25 843.52
Total Comprehensive Income - - - - 9,921.52 194.26 850.32 171.25 11,137.35
Transaction with owners, recorded directly in equity
Contribution by and distributions to owners
-Dividend paid during the year 13 (2,893.88) (2,893.88)
-Taxes on Dividend 13 (598.82) (598.82)
-Transfer to Preference Share
Capital Redemption Reserve
13
360.85 (360.85) -
-Conversion of Optionally
Convertible Redeemable
Preference Share into Equity
13
0.51 623.33 623.84
Total Contribution by and distribution to owners 0.51 623.33 - 360.85 (3,853.55) - - (2,868.86)
Balance at March 31, 2017 701.48 9,618.56 4,910.28 6,060.85 37,194.68 7,514.20 2,230.67 247.70 68,478.42
Balance at April 1, 2017 701.48 9,618.56 4,910.28 6,060.85 37,194.68 7,514.20 2,230.67 247.70 68,478.42
-Profit or Loss during the year 1,449.90 648.32 2,098.22
-Other Comprehensive
Income for the year
32
322.43 2.86 28,927.01 (402.09) 28,850.21
Total Comprehensive Income - - - - 1,772.33 651.18 28,927.01 (402.09) 30,948.43
CIN No. L17115RJ1960PLC008216
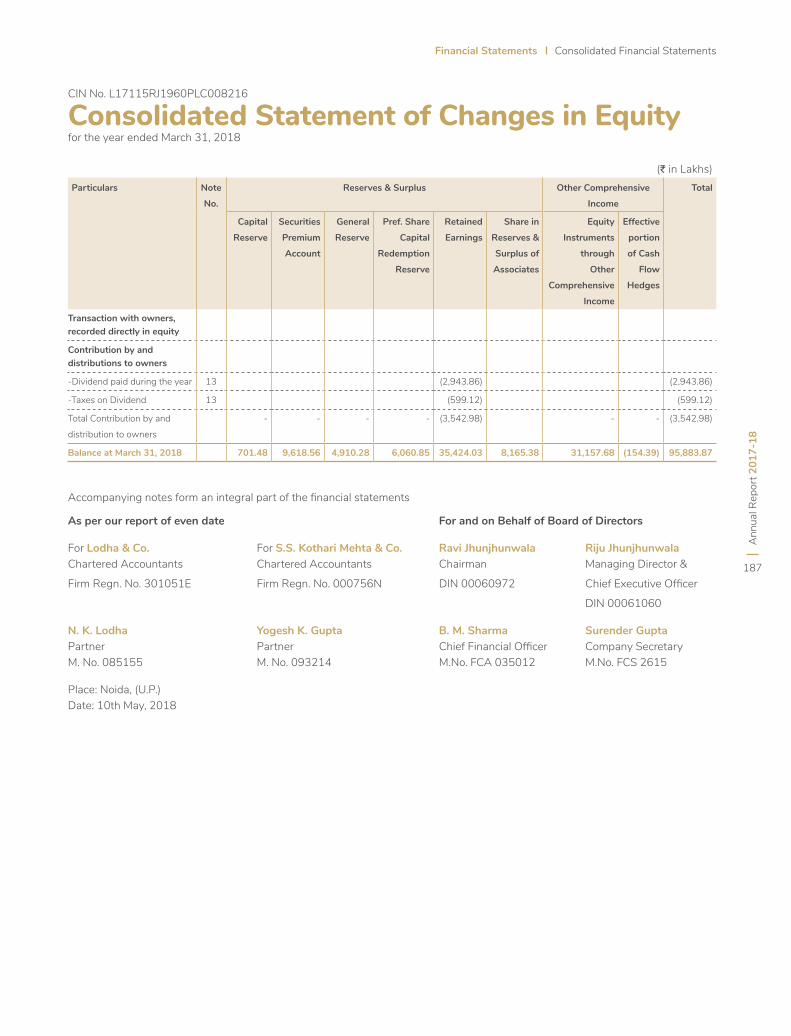
Ann
ual R
epor
t 201
7-18
187
Financial Statements Consolidated Financial Statements
Consolidated Statement of Changes in Equity for the year ended March 31, 2018
(J in Lakhs)Particulars Note
No.
Reserves & Surplus Other Comprehensive
Income
Total
Capital
Reserve
Securities
Premium
Account
General
Reserve
Pref. Share
Capital
Redemption
Reserve
Retained
Earnings
Share in
Reserves &
Surplus of
Associates
Equity
Instruments
through
Other
Comprehensive
Income
Effective
portion
of Cash
Flow
Hedges
Transaction with owners, recorded directly in equity
Contribution by and distributions to owners
-Dividend paid during the year 13 (2,943.86) (2,943.86)
-Taxes on Dividend 13 (599.12) (599.12)
Total Contribution by and
distribution to owners
- - - - (3,542.98) - - (3,542.98)
Balance at March 31, 2018 701.48 9,618.56 4,910.28 6,060.85 35,424.03 8,165.38 31,157.68 (154.39) 95,883.87
Accompanying notes form an integral part of the financial statements
As per our report of even date For and on Behalf of Board of Directors
For Lodha & Co. For S.S. Kothari Mehta & Co. Ravi Jhunjhunwala Riju JhunjhunwalaChartered Accountants Chartered Accountants Chairman Managing Director &
Firm Regn. No. 301051E Firm Regn. No. 000756N DIN 00060972 Chief Executive Officer
DIN 00061060
N. K. Lodha Yogesh K. Gupta B. M. Sharma Surender GuptaPartner Partner Chief Financial Officer Company SecretaryM. No. 085155 M. No. 093214 M.No. FCA 035012 M.No. FCS 2615
Place: Noida, (U.P.)Date: 10th May, 2018
CIN No. L17115RJ1960PLC008216
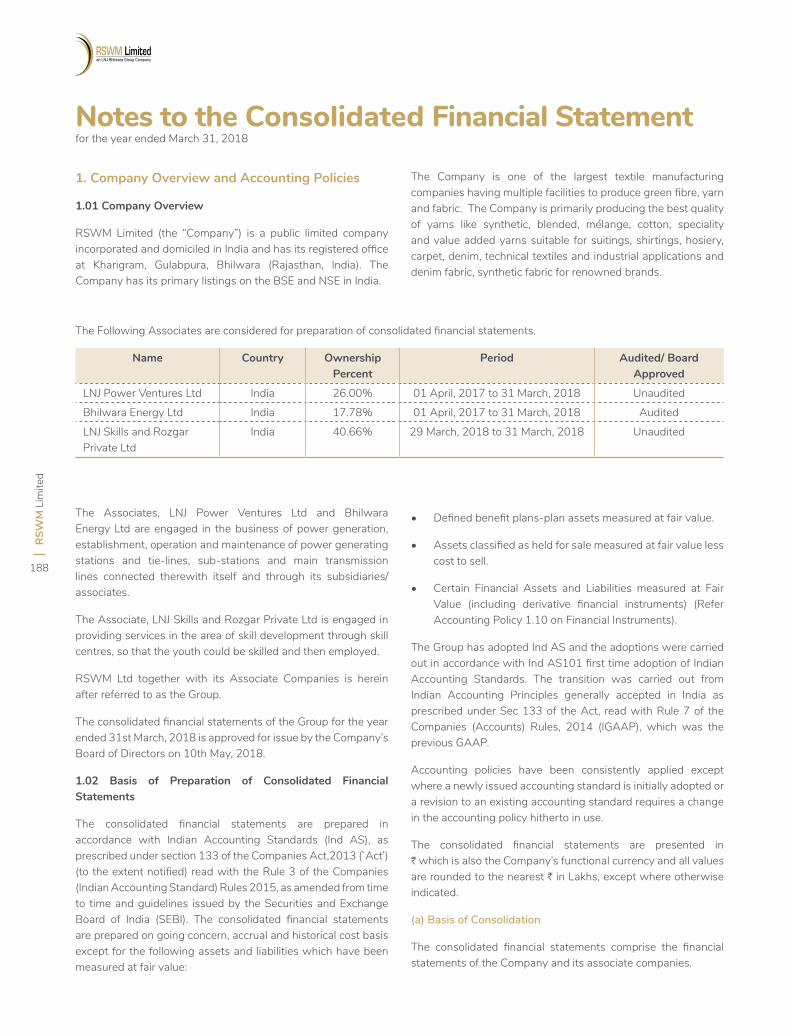
RSW
M L
imite
d
188
Notes to the Consolidated Financial Statement for the year ended March 31, 2018
1. Company Overview and Accounting Policies
1.01 Company Overview
RSWM Limited (the “Company”) is a public limited company incorporated and domiciled in India and has its registered office at Kharigram, Gulabpura, Bhilwara (Rajasthan, India). The Company has its primary listings on the BSE and NSE in India.
The Company is one of the largest textile manufacturing companies having multiple facilities to produce green fibre, yarn and fabric. The Company is primarily producing the best quality of yarns like synthetic, blended, mélange, cotton, speciality and value added yarns suitable for suitings, shirtings, hosiery, carpet, denim, technical textiles and industrial applications and denim fabric, synthetic fabric for renowned brands.
The Following Associates are considered for preparation of consolidated financial statements.
Name Country Ownership Percent
Period Audited/BoardApproved
LNJ Power Ventures Ltd India 26.00% 01 April, 2017 to 31 March, 2018 Unaudited
Bhilwara Energy Ltd India 17.78% 01 April, 2017 to 31 March, 2018 Audited
LNJ Skills and Rozgar Private Ltd
India 40.66% 29 March, 2018 to 31 March, 2018 Unaudited
The Associates, LNJ Power Ventures Ltd and Bhilwara Energy Ltd are engaged in the business of power generation, establishment, operation and maintenance of power generating stations and tie-lines, sub-stations and main transmission lines connected therewith itself and through its subsidiaries/associates.
The Associate, LNJ Skills and Rozgar Private Ltd is engaged in providing services in the area of skill development through skill centres, so that the youth could be skilled and then employed.
RSWM Ltd together with its Associate Companies is herein after referred to as the Group.
The consolidated financial statements of the Group for the year ended 31st March, 2018 is approved for issue by the Company’s Board of Directors on 10th May, 2018.
1.02 Basis of Preparation of Consolidated Financial Statements
The consolidated financial statements are prepared in accordance with Indian Accounting Standards (Ind AS), as prescribed under section 133 of the Companies Act,2013 (`Act’) (to the extent notified) read with the Rule 3 of the Companies (Indian Accounting Standard) Rules 2015, as amended from time to time and guidelines issued by the Securities and Exchange Board of India (SEBI). The consolidated financial statements are prepared on going concern, accrual and historical cost basis except for the following assets and liabilities which have been measured at fair value:
• Defined benefit plans-plan assets measured at fair value.
• Assets classified as held for sale measured at fair value less cost to sell.
• Certain Financial Assets and Liabilities measured at Fair Value (including derivative financial instruments) (Refer Accounting Policy 1.10 on Financial Instruments).
The Group has adopted Ind AS and the adoptions were carried out in accordance with Ind AS101 first time adoption of Indian Accounting Standards. The transition was carried out from Indian Accounting Principles generally accepted in India as prescribed under Sec 133 of the Act, read with Rule 7 of the Companies (Accounts) Rules, 2014 (IGAAP), which was the previous GAAP.
Accounting policies have been consistently applied except where a newly issued accounting standard is initially adopted or a revision to an existing accounting standard requires a change in the accounting policy hitherto in use.
The consolidated financial statements are presented in H which is also the Company’s functional currency and all values are rounded to the nearest H in Lakhs, except where otherwise indicated.
(a) Basis of Consolidation
The consolidated financial statements comprise the financial statements of the Company and its associate companies.
Ann
ual R
epor
t 201
7-18
189
Financial Statements Consolidated Financial Statements
Notes to the Consolidated Financial Statement for the year ended March 31, 2018
Associates are entities over which the Company has significant influence or holding substantial number of shares with voting rights. Significant influence is the power to participate in the financial and operating decisions of the investee but is not in control or joint control over those policies. Investments in associates are accounted for using the equity method of accounting.
Equity Method
Under the equity method of accounting, the investments are initially recognised at cost and adjusted thereafter to recognize the group’s share of the post-acquisition profits or losses of the investee in profit and loss, and the group’s share of other comprehensive income of the investee in other comprehensive income. Dividends received or receivable from associates and joint ventures are recognised as a reduction in the carrying amount of the investment. When the group’s share of losses in an equity-accounted investment equals or exceeds its interest in the entity, including any other unsecured long-term receivables, the group does not recognize further losses, unless it has incurred obligations or made payments on behalf of the other entity. Unrealized gains on transactions between the group and its associates and joint ventures are eliminated to the extent of the group’s interest in these entities. Unrealized losses are also eliminated unless the transaction provides evidence of an impairment of the asset transferred. Accounting policies of equity accounted investees have been changed where necessary to ensure consistency with the policies adopted by the group. The carrying amount of equity accounted investments is tested for impairment in accordance with the policy.
(b) Use of Estimates
The preparation of the consolidated financial statements in conformity with Ind AS requires management to make estimates,
judgments and assumptions. These estimates, judgments and assumptions affect the application of accounting policies and the reported amounts of assets and liabilities, the disclosures of contingent assets and liabilities at the date of the consolidated financial statements and reported amounts of revenues and expenses during the period. Application of accounting policies that require critical accounting estimates involving complex and subjective judgments and the use of assumptions in these financial statements have been disclosed in Note 2 annexed to the standalone financial statements.
Accounting estimates could change from period to period. Actual results could differ from those estimates. Appropriate changes in estimates are made as management becomes aware of changes in circumstances surrounding the estimates. Changes in estimates are reflected in the consolidated financial statements in the period in which changes are made and, if material, their effects are disclosed in the notes to the financial statements.
(c) Classification of Assets and Liabilities as Current and Non-Current
All Assets and Liabilities have been classified as current or non-current. Based on the nature of product & activities of the Group and their realization in cash and cash equivalent, the Group has determined its operating cycle as 12 months for the purpose of current and non-current classification of assets and liabilities
Deferred tax assets and deferred tax liabilities are classified as non-current assets and liabilities.
(d) For significant accounting policies, please refer Note no. 1.03 to 1.23 annexed to the standalone financial statements.
(For Note No. 2, Please refer Standalone Financial Statements)
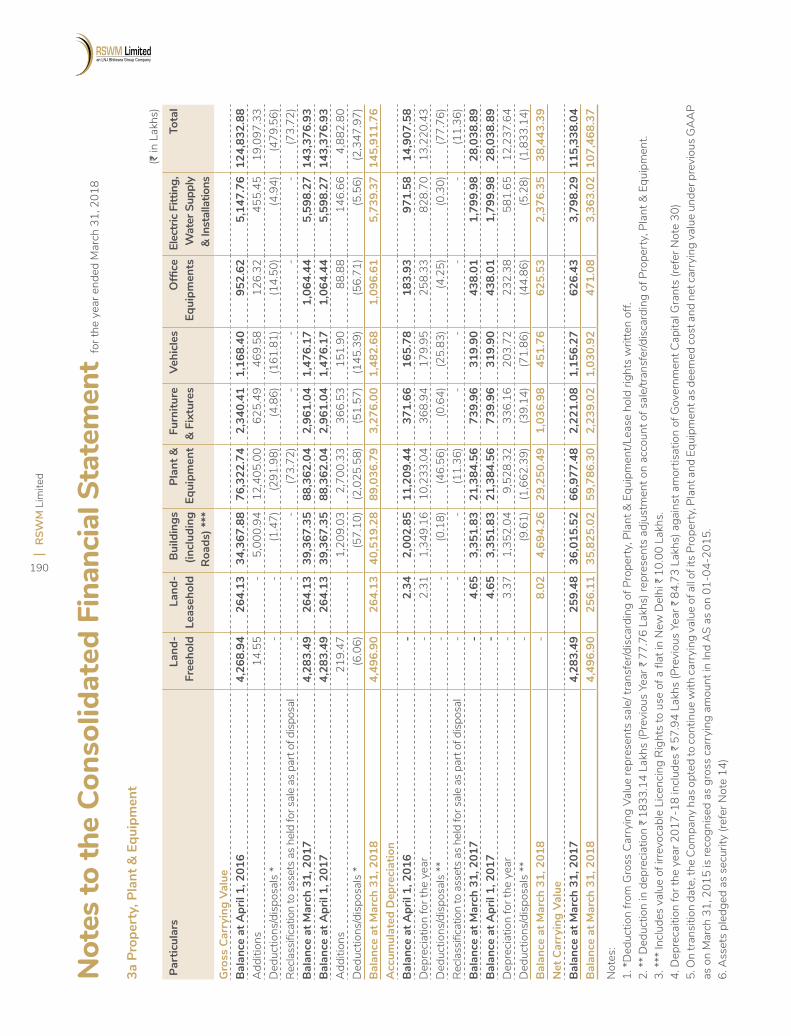
RSW
M L
imite
d
190
Not
es to
the
Cons
olid
ated
Fin
anci
al S
tate
men
t for
the
year
end
ed M
arch
31,
201
8
3a P
rope
rty,
Pla
nt &
Equ
ipm
ent
(J in
Lak
hs)
Part
icul
ars
Land
-Fr
eeho
ldLa
nd-
Leas
ehol
dB
uild
ings
(in
clud
ing
Roa
ds) *
**
Plan
t &
Equi
pmen
tFu
rnitu
re
& F
ixtu
res
Vehi
cles
Office
Equi
pmen
tsEl
ectr
ic F
ittin
g,
Wat
er S
uppl
y &
Inst
alla
tions
Tota
l
Gro
ss C
arry
ing
Valu
e B
alan
ce a
t Apr
il 1,
201
6 4
,268
.94
264
.13
34,
367.
88
76,
322.
74
2,3
40.4
1 1
,168
.40
952
.62
5,1
47.7
6 12
4,83
2.88
A
dditi
ons
14.
55
- 5
,000
.94
12,
405.
00
625
.49
469
.58
126
.32
455
.45
19,
097.
33
Ded
uctio
ns/d
ispo
sals
* -
- (1
.47)
(291
.98)
(4.8
6) (1
61.8
1) (1
4.50
) (4
.94)
(479
.56)
Recla
ssifi
catio
n to
ass
ets
as h
eld
for s
ale
as p
art o
f disp
osal
- -
- (7
3.72
) -
- -
- (7
3.72
)B
alan
ce a
t Mar
ch 3
1, 2
017
4,2
83.4
9 2
64.1
3 3
9,36
7.35
8
8,36
2.04
2
,961
.04
1,4
76.1
7 1
,064
.44
5,5
98.2
7 14
3,37
6.93
B
alan
ce a
t Apr
il 1,
201
7 4
,283
.49
264
.13
39,
367.
35
88,
362.
04
2,9
61.0
4 1
,476
.17
1,0
64.4
4 5
,598
.27
143,
376.
93
Add
ition
s 2
19.4
7 1
,209
.03
2,7
00.3
3 3
66.5
3 1
51.9
0 8
8.88
1
46.6
6 4
,882
.80
Ded
uctio
ns/d
ispo
sals
* (6
.06)
(57.
10)
(2,0
25.5
8) (5
1.57
) (1
45.3
9) (5
6.71
) (5
.56)
(2,3
47.9
7)B
alan
ce a
t Mar
ch 3
1, 2
018
4,4
96.9
0 2
64.1
3 4
0,51
9.28
8
9,03
6.79
3
,276
.00
1,4
82.6
8 1
,096
.61
5,7
39.3
7 14
5,91
1.76
A
ccum
ulat
ed D
epre
ciat
ion
Bal
ance
at A
pril
1, 2
016
-
2.3
4 2
,002
.85
11,
209.
44
371
.66
165
.78
183
.93
971
.58
14,
907.
58
Dep
reci
atio
n fo
r the
yea
r -
2.3
1 1
,349
.16
10,
233.
04
368
.94
179
.95
258
.33
828
.70
13,
220.
43
Ded
uctio
ns/d
ispo
sals
**
- -
(0.1
8) (4
6.56
) (0
.64)
(25.
83)
(4.2
5) (0
.30)
(77.
76)
Recla
ssifi
catio
n to
ass
ets
as h
eld
for s
ale
as p
art o
f disp
osal
- -
- (1
1.36
) -
- -
- (1
1.36
)B
alan
ce a
t Mar
ch 3
1, 2
017
-
4.6
5 3
,351
.83
21,
384.
56
739
.96
319
.90
438
.01
1,7
99.9
8 2
8,03
8.89
B
alan
ce a
t Apr
il 1,
201
7 -
4
.65
3,3
51.8
3 2
1,38
4.56
7
39.9
6 3
19.9
0 4
38.0
1 1
,799
.98
28,
038.
89
Dep
reci
atio
n fo
r the
yea
r -
3.3
7 1
,352
.04
9,5
28.3
2 3
36.1
6 2
03.7
2 2
32.3
8 5
81.6
5 1
2,23
7.64
D
educ
tions
/dis
posa
ls *
* -
(9.6
1) (1
,662
.39)
(39.
14)
(71.
86)
(44.
86)
(5.2
8) (1
,833
.14)
Bal
ance
at M
arch
31,
201
8 -
8
.02
4,6
94.2
6 2
9,25
0.49
1
,036
.98
451
.76
625
.53
2,3
76.3
5 3
8,44
3.39
N
et C
arry
ing
Valu
eB
alan
ce a
t Mar
ch 3
1, 2
017
4,2
83.4
9 2
59.4
8 3
6,01
5.52
6
6,97
7.48
2
,221
.08
1,1
56.2
7 6
26.4
3 3
,798
.29
115,
338.
04
Bal
ance
at M
arch
31,
201
8 4
,496
.90
256
.11
35,
825.
02
59,
786.
30
2,2
39.0
2 1
,030
.92
471
.08
3,3
63.0
2 10
7,46
8.37
Not
es:
1. *
Ded
uctio
n fro
m G
ross
Car
ryin
g Va
lue
repr
esen
ts s
ale/
tran
sfer
/dis
card
ing
of P
rope
rty,
Pla
nt &
Equ
ipm
ent/L
ease
hol
d rig
hts
writ
ten
off.
2. *
* D
educ
tion
in d
epre
ciat
ion
H 1
833.
14 L
akhs
(Pre
viou
s Ye
ar H
77.
76 L
akhs
) rep
rese
nts
adju
stm
ent o
n ac
coun
t of s
ale/
trans
fer/d
isca
rdin
g of
Pro
pert
y, P
lant
& E
quip
men
t.3.
***
Incl
udes
val
ue o
f irre
voca
ble
Lice
ncin
g R
ight
s to
use
of a
flat
in N
ew D
elhi
H 1
0.00
Lak
hs.
4. D
epre
caiti
on fo
r the
yea
r 201
7-18
incl
udes
H 5
7.94
Lak
hs (P
revi
ous
Year
H 8
4.73
Lak
hs) a
gain
st a
mor
tisat
ion
of G
over
nmen
t Cap
ital G
rant
s (re
fer N
ote
30)
5. O
n tra
nsiti
on d
ate,
the
Com
pany
has
opt
ed to
con
tinue
with
car
ryin
g va
lue
of a
ll of i
ts P
rope
rty,
Pla
nt a
nd E
quip
men
t as
deem
ed c
ost a
nd n
et c
arry
ing
valu
e un
der p
revi
ous
GA
AP
as o
n M
arch
31,
201
5 is
reco
gnis
ed a
s gr
oss
carr
ying
am
ount
in In
d A
S as
on
01-0
4-20
15.
6. A
sset
s pl
edge
d as
sec
urity
(ref
er N
ote
14)
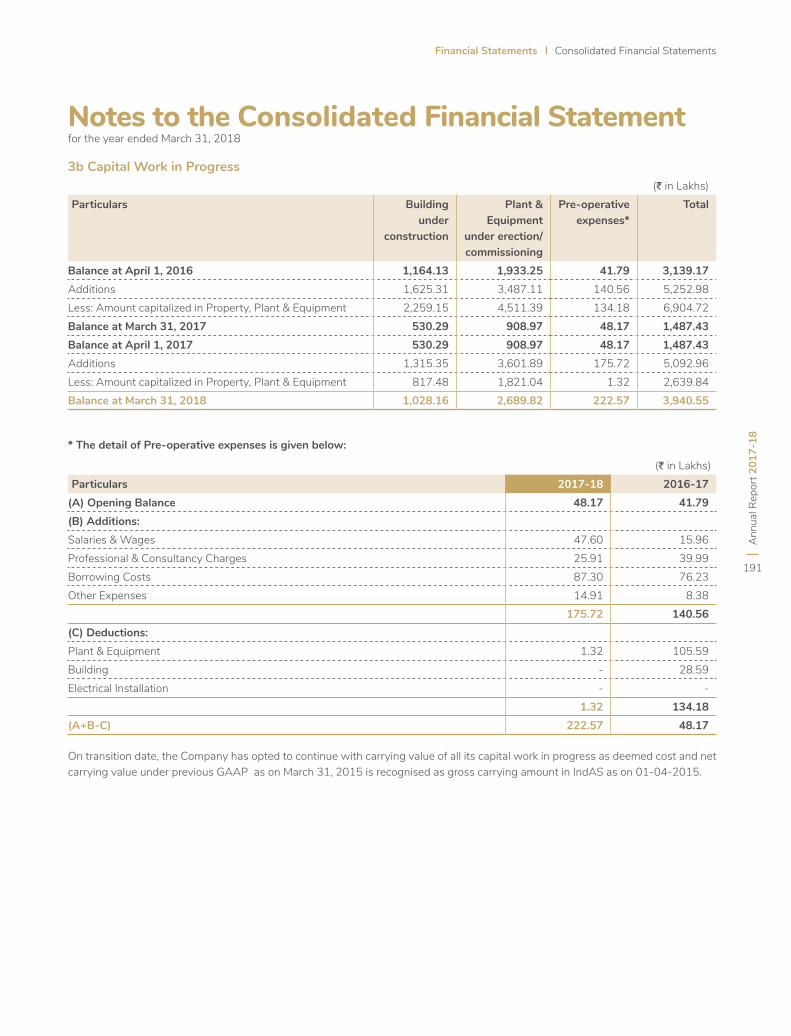
Ann
ual R
epor
t 201
7-18
191
Financial Statements Consolidated Financial Statements
Notes to the Consolidated Financial Statement for the year ended March 31, 2018
3bCapitalWorkinProgress
* The detail of Pre-operative expenses is given below:
(J in Lakhs)Particulars Building
under construction
Plant & Equipment
undererection/ commissioning
Pre-operative expenses*
Total
Balance at April 1, 2016 1,164.13 1,933.25 41.79 3,139.17 Additions 1,625.31 3,487.11 140.56 5,252.98 Less: Amount capitalized in Property, Plant & Equipment 2,259.15 4,511.39 134.18 6,904.72 Balance at March 31, 2017 530.29 908.97 48.17 1,487.43 Balance at April 1, 2017 530.29 908.97 48.17 1,487.43 Additions 1,315.35 3,601.89 175.72 5,092.96 Less: Amount capitalized in Property, Plant & Equipment 817.48 1,821.04 1.32 2,639.84 Balance at March 31, 2018 1,028.16 2,689.82 222.57 3,940.55
(J in Lakhs)Particulars 2017-18 2016-17
(A) Opening Balance 48.17 41.79 (B) Additions:Salaries & Wages 47.60 15.96 Professional & Consultancy Charges 25.91 39.99 Borrowing Costs 87.30 76.23 Other Expenses 14.91 8.38
175.72 140.56 (C) Deductions:Plant & Equipment 1.32 105.59 Building - 28.59 Electrical Installation - -
1.32 134.18 (A+B-C) 222.57 48.17
On transition date, the Company has opted to continue with carrying value of all its capital work in progress as deemed cost and net carrying value under previous GAAP as on March 31, 2015 is recognised as gross carrying amount in IndAS as on 01-04-2015.
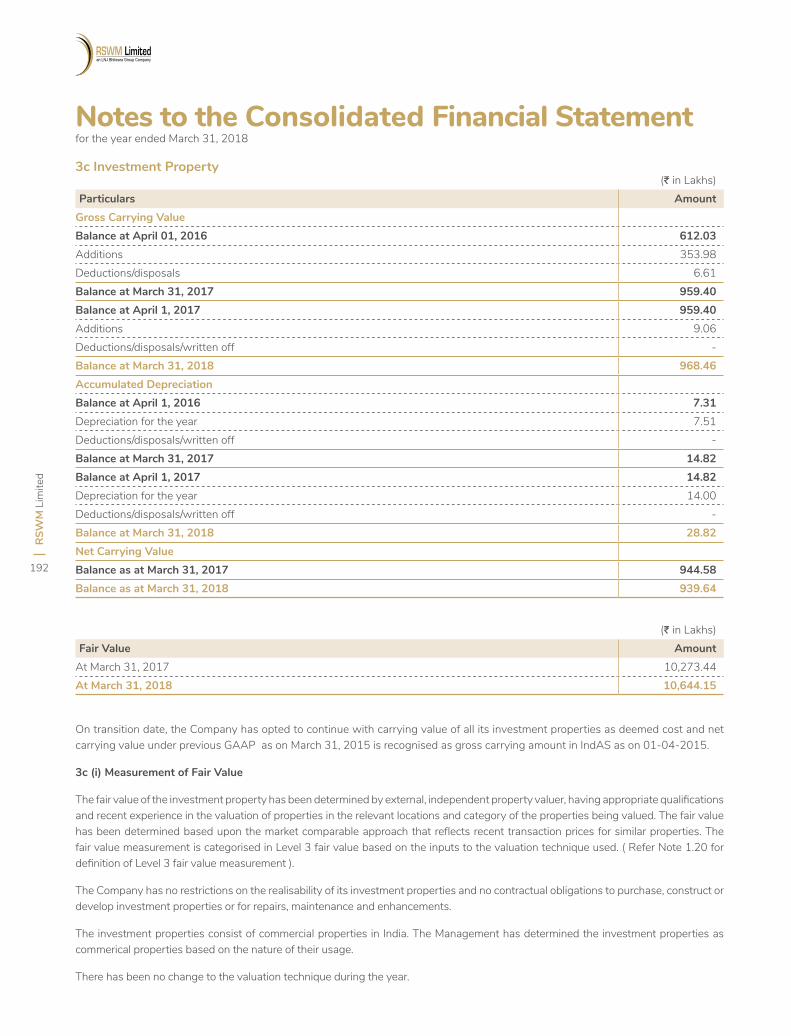
RSW
M L
imite
d
192
(J in Lakhs)Particulars Amount
Gross Carrying ValueBalance at April 01, 2016 612.03 Additions 353.98 Deductions/disposals 6.61 Balance at March 31, 2017 959.40 Balance at April 1, 2017 959.40 Additions 9.06 Deductions/disposals/written off - Balance at March 31, 2018 968.46 Accumulated DepreciationBalance at April 1, 2016 7.31 Depreciation for the year 7.51 Deductions/disposals/written off - Balance at March 31, 2017 14.82 Balance at April 1, 2017 14.82Depreciation for the year 14.00 Deductions/disposals/written off - Balance at March 31, 2018 28.82 Net Carrying ValueBalance as at March 31, 2017 944.58 Balance as at March 31, 2018 939.64
Notes to the Consolidated Financial Statement for the year ended March 31, 2018
3c Investment Property
(J in Lakhs)Fair Value Amount
At March 31, 2017 10,273.44 At March 31, 2018 10,644.15
On transition date, the Company has opted to continue with carrying value of all its investment properties as deemed cost and net carrying value under previous GAAP as on March 31, 2015 is recognised as gross carrying amount in IndAS as on 01-04-2015.
3c (i) Measurement of Fair Value
The fair value of the investment property has been determined by external, independent property valuer, having appropriate qualifications and recent experience in the valuation of properties in the relevant locations and category of the properties being valued. The fair value has been determined based upon the market comparable approach that reflects recent transaction prices for similar properties. The fair value measurement is categorised in Level 3 fair value based on the inputs to the valuation technique used. ( Refer Note 1.20 for definition of Level 3 fair value measurement ).
The Company has no restrictions on the realisability of its investment properties and no contractual obligations to purchase, construct or develop investment properties or for repairs, maintenance and enhancements.
The investment properties consist of commercial properties in India. The Management has determined the investment properties as commerical properties based on the nature of their usage.
There has been no change to the valuation technique during the year.
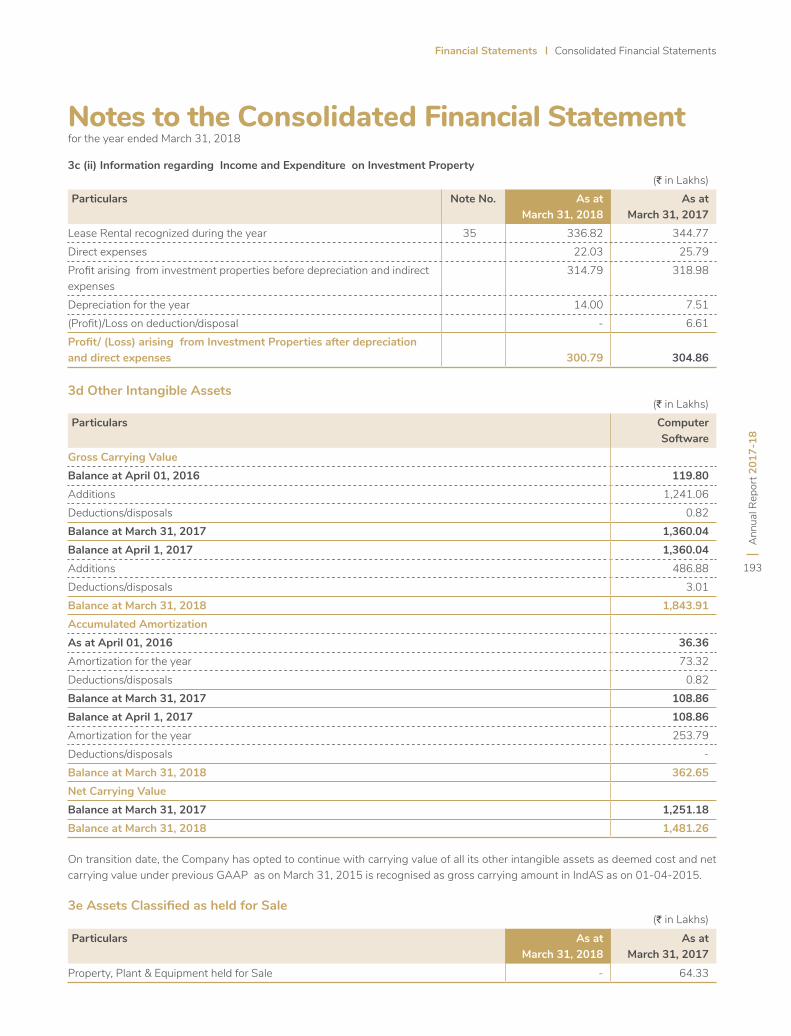
Ann
ual R
epor
t 201
7-18
193
Financial Statements Consolidated Financial Statements
(J in Lakhs)Particulars Computer
SoftwareGross Carrying ValueBalance at April 01, 2016 119.80 Additions 1,241.06 Deductions/disposals 0.82 Balance at March 31, 2017 1,360.04 Balance at April 1, 2017 1,360.04 Additions 486.88 Deductions/disposals 3.01 Balance at March 31, 2018 1,843.91 Accumulated AmortizationAs at April 01, 2016 36.36 Amortization for the year 73.32 Deductions/disposals 0.82 Balance at March 31, 2017 108.86 Balance at April 1, 2017 108.86 Amortization for the year 253.79 Deductions/disposals - Balance at March 31, 2018 362.65 Net Carrying ValueBalance at March 31, 2017 1,251.18 Balance at March 31, 2018 1,481.26
Notes to the Consolidated Financial Statement for the year ended March 31, 2018
3c (ii) Information regarding Income and Expenditure on Investment Property
3d Other Intangible Assets
On transition date, the Company has opted to continue with carrying value of all its other intangible assets as deemed cost and net carrying value under previous GAAP as on March 31, 2015 is recognised as gross carrying amount in IndAS as on 01-04-2015.
3eAssetsClassifiedasheldforSale
(J in Lakhs)Particulars Note No. As at
March 31, 2018As at
March 31, 2017Lease Rental recognized during the year 35 336.82 344.77Direct expenses 22.03 25.79 Profit arising from investment properties before depreciation and indirect expenses
314.79 318.98
Depreciation for the year 14.00 7.51 (Profit)/Loss on deduction/disposal - 6.61 Profit/(Loss)arisingfromInvestmentPropertiesafterdepreciationand direct expenses 300.79 304.86
(J in Lakhs)Particulars As at
March 31, 2018As at
March 31, 2017Property, Plant & Equipment held for Sale - 64.33
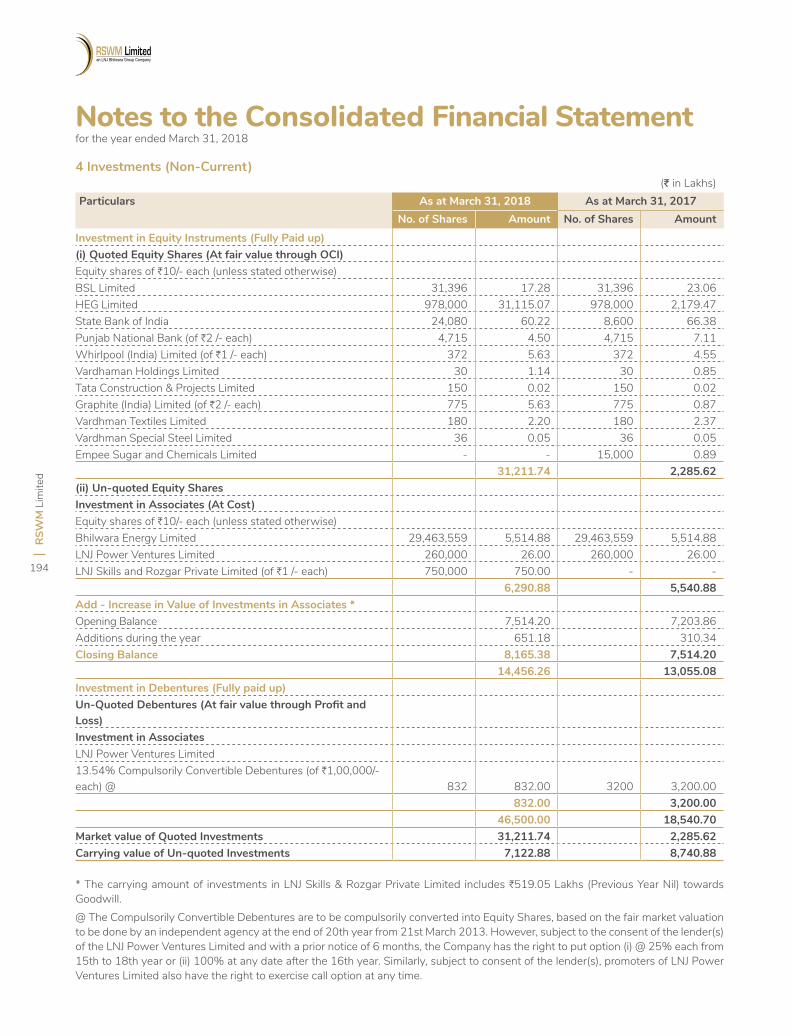
RSW
M L
imite
d
194
Notes to the Consolidated Financial Statement for the year ended March 31, 2018
4 Investments (Non-Current)(J in Lakhs)
Particulars As at March 31, 2018 As at March 31, 2017No. of Shares Amount No. of Shares Amount
Investment in Equity Instruments (Fully Paid up)(i) Quoted Equity Shares (At fair value through OCI)Equity shares of H10/- each (unless stated otherwise)BSL Limited 31,396 17.28 31,396 23.06 HEG Limited 978,000 31,115.07 978,000 2,179.47 State Bank of India 24,080 60.22 8,600 66.38 Punjab National Bank (of H2 /- each) 4,715 4.50 4,715 7.11 Whirlpool (India) Limited (of H1 /- each) 372 5.63 372 4.55 Vardhaman Holdings Limited 30 1.14 30 0.85 Tata Construction & Projects Limited 150 0.02 150 0.02 Graphite (India) Limited (of H2 /- each) 775 5.63 775 0.87 Vardhman Textiles Limited 180 2.20 180 2.37 Vardhman Special Steel Limited 36 0.05 36 0.05 Empee Sugar and Chemicals Limited - - 15,000 0.89
31,211.74 2,285.62 (ii) Un-quoted Equity SharesInvestment in Associates (At Cost)Equity shares of H10/- each (unless stated otherwise)Bhilwara Energy Limited 29,463,559 5,514.88 29,463,559 5,514.88 LNJ Power Ventures Limited 260,000 26.00 260,000 26.00 LNJ Skills and Rozgar Private Limited (of H1 /- each) 750,000 750.00 - -
6,290.88 5,540.88 Add - Increase in Value of Investments in Associates *Opening Balance 7,514.20 7,203.86 Additions during the year 651.18 310.34 Closing Balance 8,165.38 7,514.20
14,456.26 13,055.08 Investment in Debentures (Fully paid up)Un-QuotedDebentures(AtfairvaluethroughProfitandLoss)Investment in AssociatesLNJ Power Ventures Limited13.54% Compulsorily Convertible Debentures (of H1,00,000/- each) @ 832 832.00 3200 3,200.00
832.00 3,200.00 46,500.00 18,540.70
MarketvalueofQuotedInvestments 31,211.74 2,285.62 Carrying value of Un-quoted Investments 7,122.88 8,740.88
* The carrying amount of investments in LNJ Skills & Rozgar Private Limited includes H519.05 Lakhs (Previous Year Nil) towards Goodwill. @ The Compulsorily Convertible Debentures are to be compulsorily converted into Equity Shares, based on the fair market valuation to be done by an independent agency at the end of 20th year from 21st March 2013. However, subject to the consent of the lender(s) of the LNJ Power Ventures Limited and with a prior notice of 6 months, the Company has the right to put option (i) @ 25% each from 15th to 18th year or (ii) 100% at any date after the 16th year. Similarly, subject to consent of the lender(s), promoters of LNJ Power Ventures Limited also have the right to exercise call option at any time.
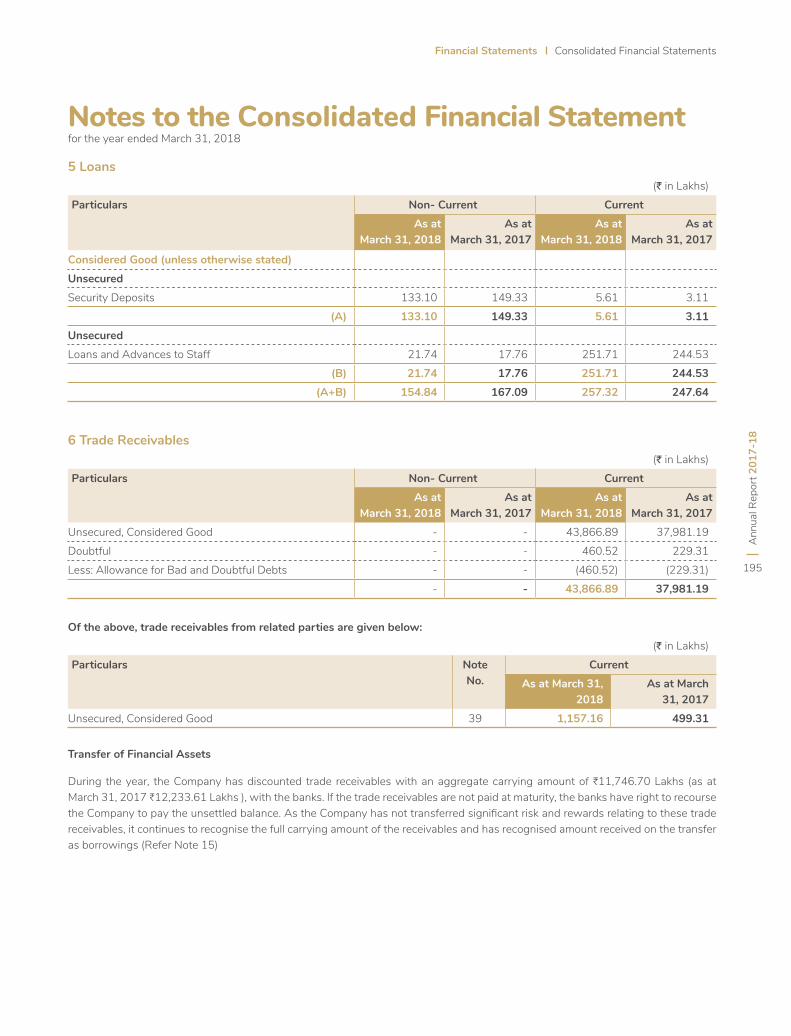
Ann
ual R
epor
t 201
7-18
195
Financial Statements Consolidated Financial Statements
Notes to the Consolidated Financial Statement for the year ended March 31, 2018
(J in Lakhs)Particulars Non- Current Current
As at March 31, 2018
As at March 31, 2017
As at March 31, 2018
As at March 31, 2017
Considered Good (unless otherwise stated)UnsecuredSecurity Deposits 133.10 149.33 5.61 3.11
(A) 133.10 149.33 5.61 3.11 UnsecuredLoans and Advances to Staff 21.74 17.76 251.71 244.53
(B) 21.74 17.76 251.71 244.53 (A+B) 154.84 167.09 257.32 247.64
(J in Lakhs)Particulars Non- Current Current
As at March 31, 2018
As at March 31, 2017
As at March 31, 2018
As at March 31, 2017
Unsecured, Considered Good - - 43,866.89 37,981.19 Doubtful - - 460.52 229.31 Less: Allowance for Bad and Doubtful Debts - - (460.52) (229.31)
- - 43,866.89 37,981.19
(J in Lakhs)Particulars Note
No.Current
As at March 31, 2018
As at March 31, 2017
Unsecured, Considered Good 39 1,157.16 499.31
5 Loans
6 Trade Receivables
Of the above, trade receivables from related parties are given below:
Transfer of Financial Assets
During the year, the Company has discounted trade receivables with an aggregate carrying amount of H11,746.70 Lakhs (as at March 31, 2017 H12,233.61 Lakhs ), with the banks. If the trade receivables are not paid at maturity, the banks have right to recourse the Company to pay the unsettled balance. As the Company has not transferred significant risk and rewards relating to these trade receivables, it continues to recognise the full carrying amount of the receivables and has recognised amount received on the transfer as borrowings (Refer Note 15)
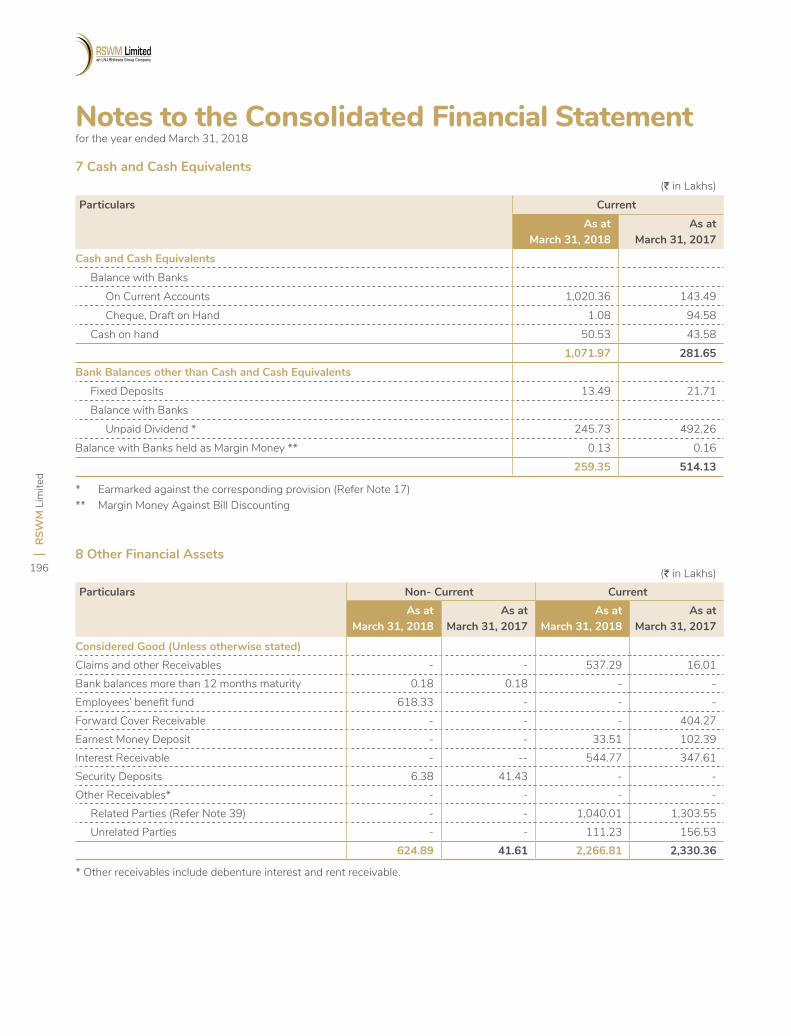
RSW
M L
imite
d
196
(J in Lakhs)Particulars Current
As at March 31, 2018
As at March 31, 2017
Cash and Cash Equivalents Balance with Banks On Current Accounts 1,020.36 143.49 Cheque, Draft on Hand 1.08 94.58 Cash on hand 50.53 43.58
1,071.97 281.65 BankBalancesotherthanCashandCashEquivalents Fixed Deposits 13.49 21.71 Balance with Banks Unpaid Dividend * 245.73 492.26 Balance with Banks held as Margin Money ** 0.13 0.16
259.35 514.13
7 Cash and Cash Equivalents
8 Other Financial Assets
* Earmarked against the corresponding provision (Refer Note 17)** Margin Money Against Bill Discounting
(J in Lakhs)Particulars Non- Current Current
As at March 31, 2018
As at March 31, 2017
As at March 31, 2018
As at March 31, 2017
Considered Good (Unless otherwise stated)Claims and other Receivables - - 537.29 16.01 Bank balances more than 12 months maturity 0.18 0.18 - -Employees’ benefit fund 618.33 - - -Forward Cover Receivable - - - 404.27 Earnest Money Deposit - - 33.51 102.39 Interest Receivable - -- 544.77 347.61 Security Deposits 6.38 41.43 - -Other Receivables* - - - - Related Parties (Refer Note 39) - - 1,040.01 1,303.55 Unrelated Parties - - 111.23 156.53
624.89 41.61 2,266.81 2,330.36
* Other receivables include debenture interest and rent receivable.
Notes to the Consolidated Financial Statement for the year ended March 31, 2018
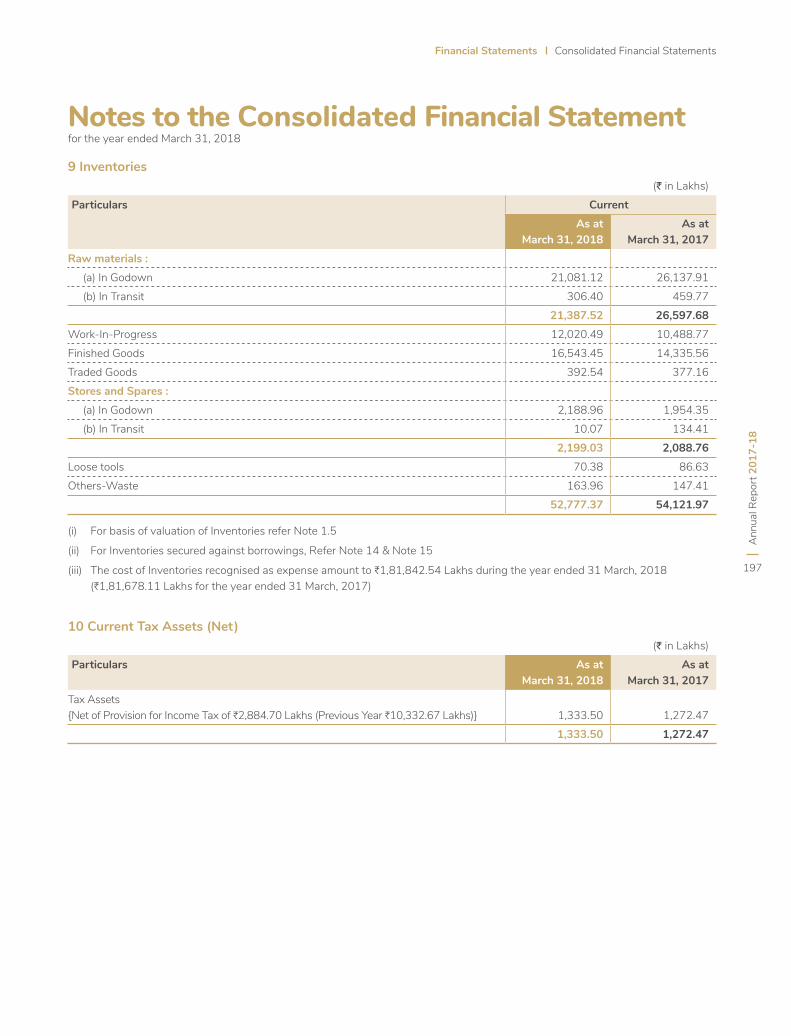
Ann
ual R
epor
t 201
7-18
197
Financial Statements Consolidated Financial Statements
9 Inventories
10 Current Tax Assets (Net)
(J in Lakhs)Particulars Current
As atMarch 31, 2018
As atMarch 31, 2017
Raw materials : (a) In Godown 21,081.12 26,137.91 (b) In Transit 306.40 459.77
21,387.52 26,597.68 Work-In-Progress 12,020.49 10,488.77 Finished Goods 16,543.45 14,335.56 Traded Goods 392.54 377.16 Stores and Spares : (a) In Godown 2,188.96 1,954.35 (b) In Transit 10.07 134.41
2,199.03 2,088.76 Loose tools 70.38 86.63 Others-Waste 163.96 147.41
52,777.37 54,121.97
(i) For basis of valuation of Inventories refer Note 1.5
(ii) For Inventories secured against borrowings, Refer Note 14 & Note 15
(iii) The cost of Inventories recognised as expense amount to H1,81,842.54 Lakhs during the year ended 31 March, 2018 (H1,81,678.11 Lakhs for the year ended 31 March, 2017)
(J in Lakhs)Particulars As at
March 31, 2018As at
March 31, 2017Tax Assets {Net of Provision for Income Tax of H2,884.70 Lakhs (Previous Year H10,332.67 Lakhs)} 1,333.50 1,272.47
1,333.50 1,272.47
Notes to the Consolidated Financial Statement for the year ended March 31, 2018
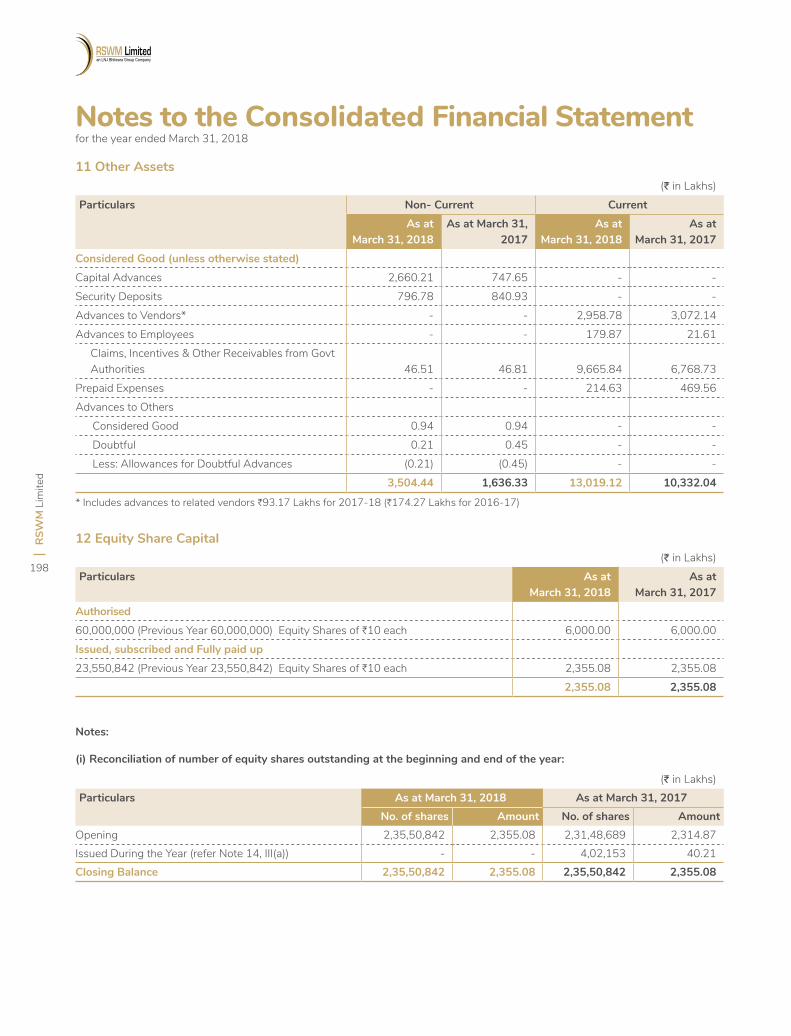
RSW
M L
imite
d
198
11 Other Assets
12 Equity Share Capital(J in Lakhs)
Particulars As atMarch 31, 2018
As atMarch 31, 2017
Authorised60,000,000 (Previous Year 60,000,000) Equity Shares of H10 each 6,000.00 6,000.00 Issued, subscribed and Fully paid up23,550,842 (Previous Year 23,550,842) Equity Shares of H10 each 2,355.08 2,355.08
2,355.08 2,355.08
(J in Lakhs)Particulars Non- Current Current
As at March 31, 2018
As at March 31, 2017
As at March 31, 2018
As at March 31, 2017
Considered Good (unless otherwise stated)Capital Advances 2,660.21 747.65 - -Security Deposits 796.78 840.93 - -Advances to Vendors* - - 2,958.78 3,072.14 Advances to Employees - - 179.87 21.61 Claims, Incentives & Other Receivables from Govt
Authorities 46.51 46.81 9,665.84 6,768.73 Prepaid Expenses - - 214.63 469.56 Advances to Others Considered Good 0.94 0.94 - - Doubtful 0.21 0.45 - - Less: Allowances for Doubtful Advances (0.21) (0.45) - -
3,504.44 1,636.33 13,019.12 10,332.04
(J in Lakhs)Particulars As at March 31, 2018 As at March 31, 2017
No. of shares Amount No. of shares AmountOpening 2,35,50,842 2,355.08 2,31,48,689 2,314.87 Issued During the Year (refer Note 14, III(a)) - - 4,02,153 40.21 Closing Balance 2,35,50,842 2,355.08 2,35,50,842 2,355.08
* Includes advances to related vendors H93.17 Lakhs for 2017-18 (H174.27 Lakhs for 2016-17)
Notes:
(i) Reconciliation of number of equity shares outstanding at the beginning and end of the year:
Notes to the Consolidated Financial Statement for the year ended March 31, 2018
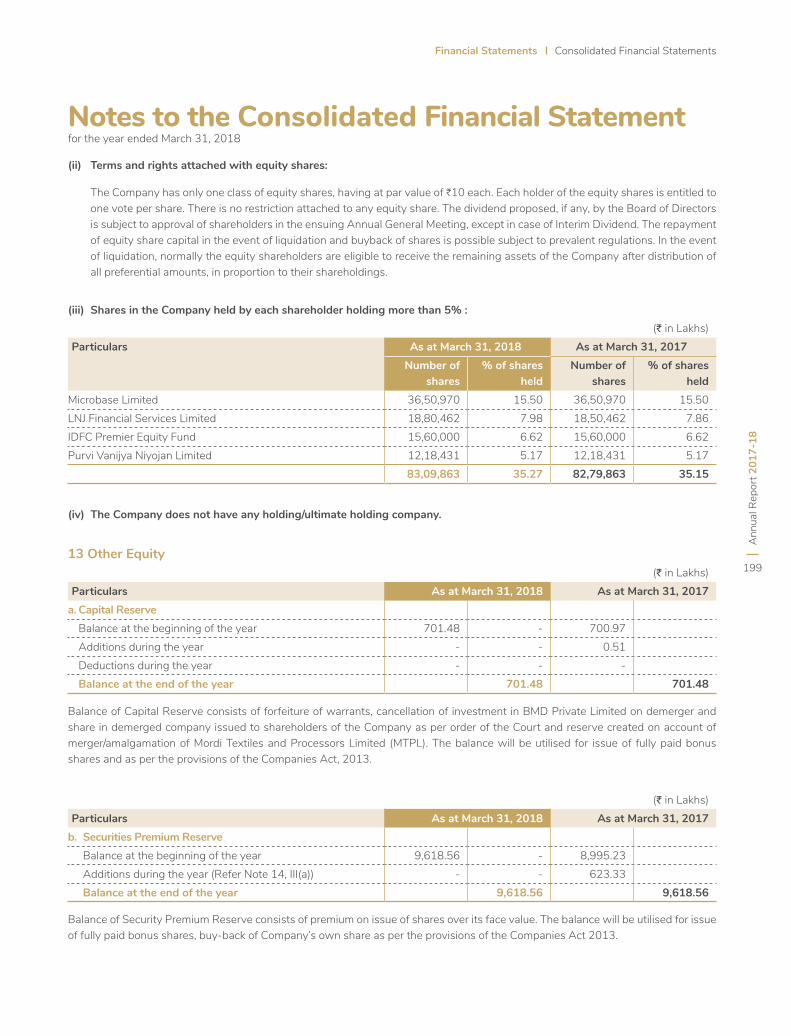
Ann
ual R
epor
t 201
7-18
199
Financial Statements Consolidated Financial Statements
(ii) Terms and rights attached with equity shares:
The Company has only one class of equity shares, having at par value of H10 each. Each holder of the equity shares is entitled to one vote per share. There is no restriction attached to any equity share. The dividend proposed, if any, by the Board of Directors is subject to approval of shareholders in the ensuing Annual General Meeting, except in case of Interim Dividend. The repayment of equity share capital in the event of liquidation and buyback of shares is possible subject to prevalent regulations. In the event of liquidation, normally the equity shareholders are eligible to receive the remaining assets of the Company after distribution of all preferential amounts, in proportion to their shareholdings.
(iii) Shares in the Company held by each shareholder holding more than 5% :
(iv) TheCompanydoesnothaveanyholding/ultimateholdingcompany.
(J in Lakhs)Particulars As at March 31, 2018 As at March 31, 2017
Number of shares
% of shares held
Number of shares
% of shares held
Microbase Limited 36,50,970 15.50 36,50,970 15.50 LNJ Financial Services Limited 18,80,462 7.98 18,50,462 7.86 IDFC Premier Equity Fund 15,60,000 6.62 15,60,000 6.62 Purvi Vanijya Niyojan Limited 12,18,431 5.17 12,18,431 5.17
83,09,863 35.27 82,79,863 35.15
13 Other Equity(J in Lakhs)
Particulars As at March 31, 2018 As at March 31, 2017a. Capital Reserve Balance at the beginning of the year 701.48 - 700.97 Additions during the year - - 0.51 Deductions during the year - - - Balance at the end of the year 701.48 701.48
(J in Lakhs)Particulars As at March 31, 2018 As at March 31, 2017
b. Securities Premium Reserve Balance at the beginning of the year 9,618.56 - 8,995.23 Additions during the year (Refer Note 14, III(a)) - - 623.33 Balance at the end of the year 9,618.56 9,618.56
Balance of Capital Reserve consists of forfeiture of warrants, cancellation of investment in BMD Private Limited on demerger and share in demerged company issued to shareholders of the Company as per order of the Court and reserve created on account of merger/amalgamation of Mordi Textiles and Processors Limited (MTPL). The balance will be utilised for issue of fully paid bonus shares and as per the provisions of the Companies Act, 2013.
Balance of Security Premium Reserve consists of premium on issue of shares over its face value. The balance will be utilised for issue of fully paid bonus shares, buy-back of Company’s own share as per the provisions of the Companies Act 2013.
Notes to the Consolidated Financial Statement for the year ended March 31, 2018
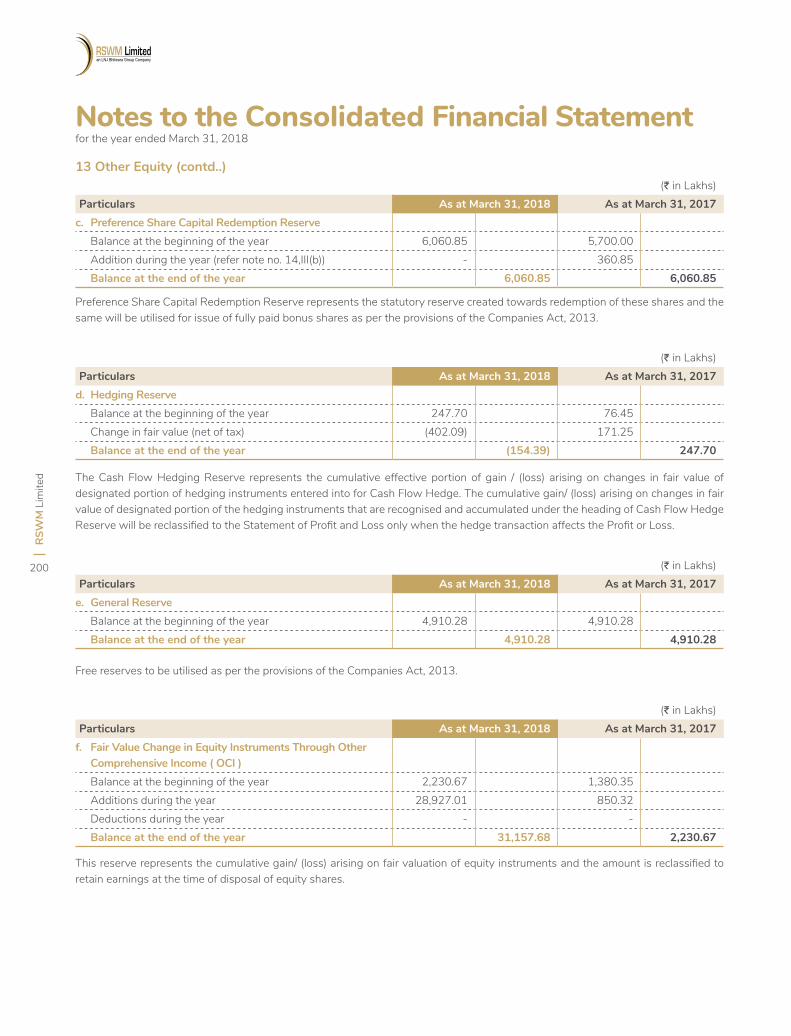
RSW
M L
imite
d
200
13 Other Equity (contd..)(J in Lakhs)
Particulars As at March 31, 2018 As at March 31, 2017c. Preference Share Capital Redemption Reserve Balance at the beginning of the year 6,060.85 5,700.00 Addition during the year (refer note no. 14,III(b)) - 360.85 Balance at the end of the year 6,060.85 6,060.85
(J in Lakhs)Particulars As at March 31, 2018 As at March 31, 2017d. HedgingReserve Balance at the beginning of the year 247.70 76.45 Change in fair value (net of tax) (402.09) 171.25 Balance at the end of the year (154.39) 247.70
(J in Lakhs)Particulars As at March 31, 2018 As at March 31, 2017
e. General Reserve Balance at the beginning of the year 4,910.28 4,910.28 Balance at the end of the year 4,910.28 4,910.28
(J in Lakhs)Particulars As at March 31, 2018 As at March 31, 2017
f. Fair Value Change in Equity Instruments Through Other Comprehensive Income ( OCI )
Balance at the beginning of the year 2,230.67 1,380.35 Additions during the year 28,927.01 850.32 Deductions during the year - - Balance at the end of the year 31,157.68 2,230.67
Preference Share Capital Redemption Reserve represents the statutory reserve created towards redemption of these shares and the same will be utilised for issue of fully paid bonus shares as per the provisions of the Companies Act, 2013.
The Cash Flow Hedging Reserve represents the cumulative effective portion of gain / (loss) arising on changes in fair value of designated portion of hedging instruments entered into for Cash Flow Hedge. The cumulative gain/ (loss) arising on changes in fair value of designated portion of the hedging instruments that are recognised and accumulated under the heading of Cash Flow Hedge Reserve will be reclassified to the Statement of Profit and Loss only when the hedge transaction affects the Profit or Loss.
Free reserves to be utilised as per the provisions of the Companies Act, 2013.
This reserve represents the cumulative gain/ (loss) arising on fair valuation of equity instruments and the amount is reclassified to retain earnings at the time of disposal of equity shares.
Notes to the Consolidated Financial Statement for the year ended March 31, 2018
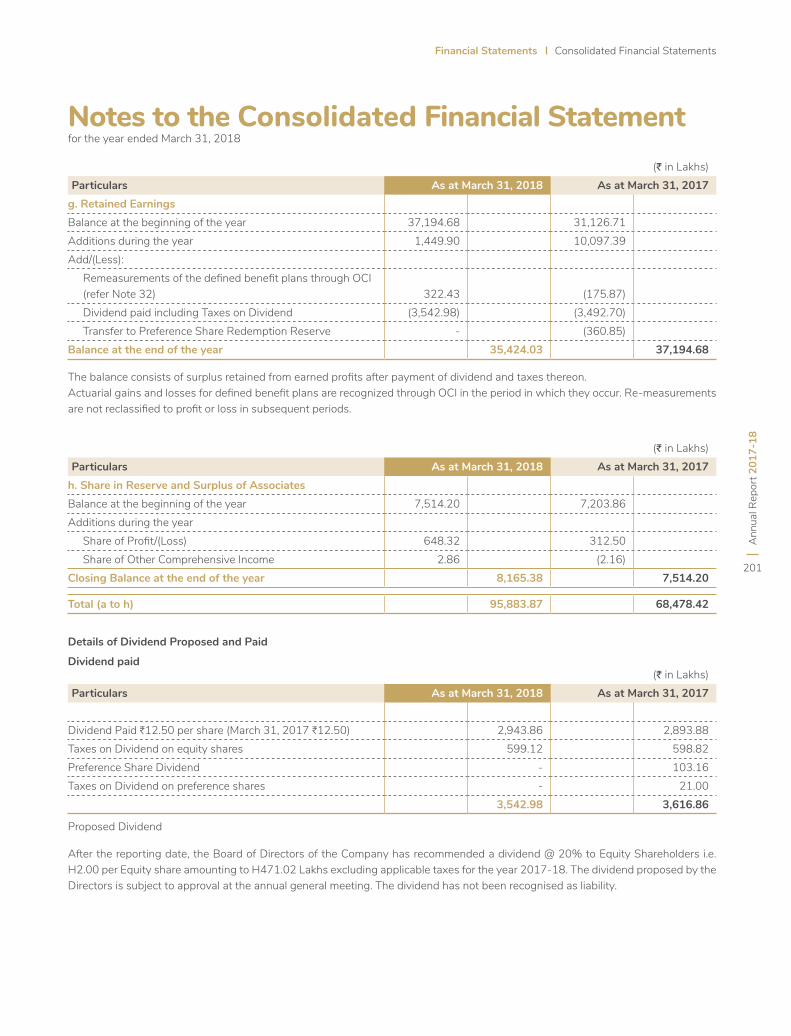
Ann
ual R
epor
t 201
7-18
201
Financial Statements Consolidated Financial Statements
(J in Lakhs)Particulars As at March 31, 2018 As at March 31, 2017
g. Retained EarningsBalance at the beginning of the year 37,194.68 31,126.71 Additions during the year 1,449.90 10,097.39 Add/(Less): Remeasurements of the defined benefit plans through OCI
(refer Note 32) 322.43 (175.87) Dividend paid including Taxes on Dividend (3,542.98) (3,492.70) Transfer to Preference Share Redemption Reserve - (360.85)Balance at the end of the year 35,424.03 37,194.68
(J in Lakhs)Particulars As at March 31, 2018 As at March 31, 2017
h. Share in Reserve and Surplus of AssociatesBalance at the beginning of the year 7,514.20 7,203.86 Additions during the year Share of Profit/(Loss) 648.32 312.50 Share of Other Comprehensive Income 2.86 (2.16)Closing Balance at the end of the year 8,165.38 7,514.20
Total (a to h) 95,883.87 68,478.42
(J in Lakhs)Particulars As at March 31, 2018 As at March 31, 2017
Dividend Paid H12.50 per share (March 31, 2017 H12.50) 2,943.86 2,893.88 Taxes on Dividend on equity shares 599.12 598.82 Preference Share Dividend - 103.16 Taxes on Dividend on preference shares - 21.00
3,542.98 3,616.86
The balance consists of surplus retained from earned profits after payment of dividend and taxes thereon. Actuarial gains and losses for defined benefit plans are recognized through OCI in the period in which they occur. Re-measurements are not reclassified to profit or loss in subsequent periods.
Details of Dividend Proposed and Paid
Dividend paid
Proposed Dividend
After the reporting date, the Board of Directors of the Company has recommended a dividend @ 20% to Equity Shareholders i.e. H2.00 per Equity share amounting to H471.02 Lakhs excluding applicable taxes for the year 2017-18. The dividend proposed by the Directors is subject to approval at the annual general meeting. The dividend has not been recognised as liability.
Notes to the Consolidated Financial Statement for the year ended March 31, 2018
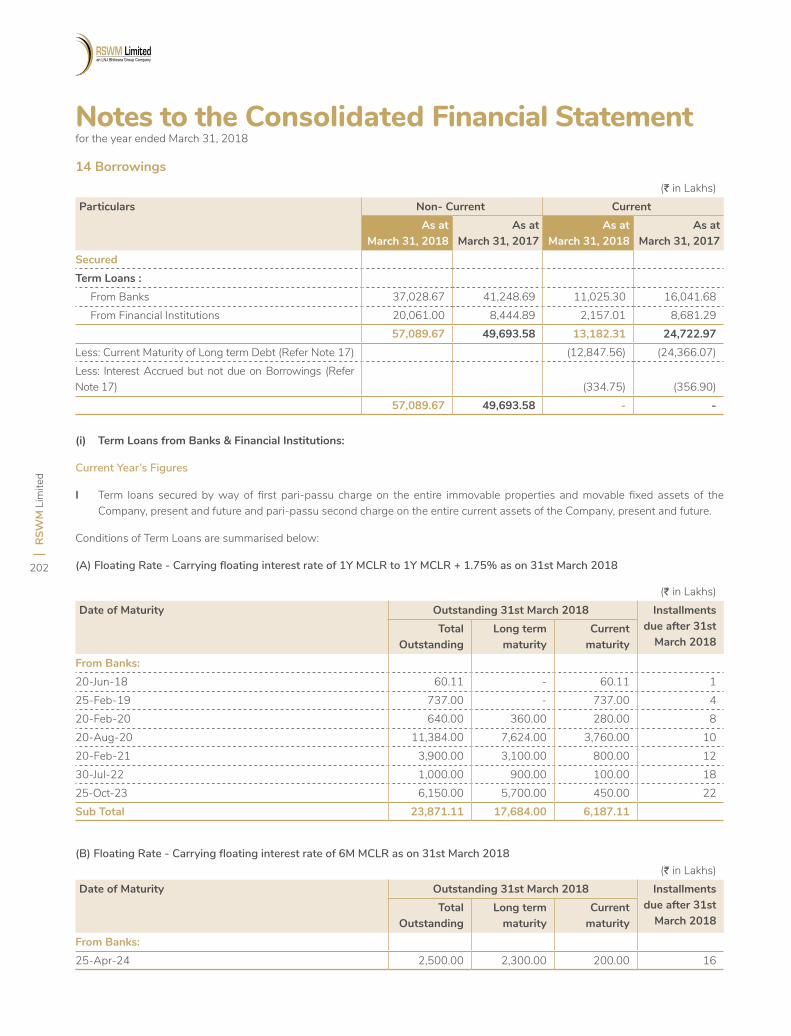
RSW
M L
imite
d
202
(J in Lakhs)Particulars Non- Current Current
As at March 31, 2018
As at March 31, 2017
As at March 31, 2018
As at March 31, 2017
SecuredTerm Loans : From Banks 37,028.67 41,248.69 11,025.30 16,041.68 From Financial Institutions 20,061.00 8,444.89 2,157.01 8,681.29
57,089.67 49,693.58 13,182.31 24,722.97 Less: Current Maturity of Long term Debt (Refer Note 17) (12,847.56) (24,366.07)Less: Interest Accrued but not due on Borrowings (Refer Note 17) (334.75) (356.90)
57,089.67 49,693.58 - -
(J in Lakhs)Date of Maturity Outstanding 31st March 2018 Installments
due after 31st March 2018
Total Outstanding
Long term maturity
Current maturity
FromBanks:20-Jun-18 60.11 - 60.11 125-Feb-19 737.00 - 737.00 420-Feb-20 640.00 360.00 280.00 820-Aug-20 11,384.00 7,624.00 3,760.00 1020-Feb-21 3,900.00 3,100.00 800.00 1230-Jul-22 1,000.00 900.00 100.00 1825-Oct-23 6,150.00 5,700.00 450.00 22Sub Total 23,871.11 17,684.00 6,187.11
(J in Lakhs)Date of Maturity Outstanding 31st March 2018 Installments
due after 31st March 2018
Total Outstanding
Long term maturity
Current maturity
FromBanks:25-Apr-24 2,500.00 2,300.00 200.00 16
14 Borrowings
(i) TermLoansfromBanks&FinancialInstitutions:
Current Year’s Figures
I Term loans secured by way of first pari-passu charge on the entire immovable properties and movable fixed assets of the Company, present and future and pari-passu second charge on the entire current assets of the Company, present and future.
Conditions of Term Loans are summarised below:
(A) Floating Rate - Carrying floating interest rate of 1Y MCLR to 1Y MCLR + 1.75% as on 31st March 2018
(B) Floating Rate - Carrying floating interest rate of 6M MCLR as on 31st March 2018
Notes to the Consolidated Financial Statement for the year ended March 31, 2018
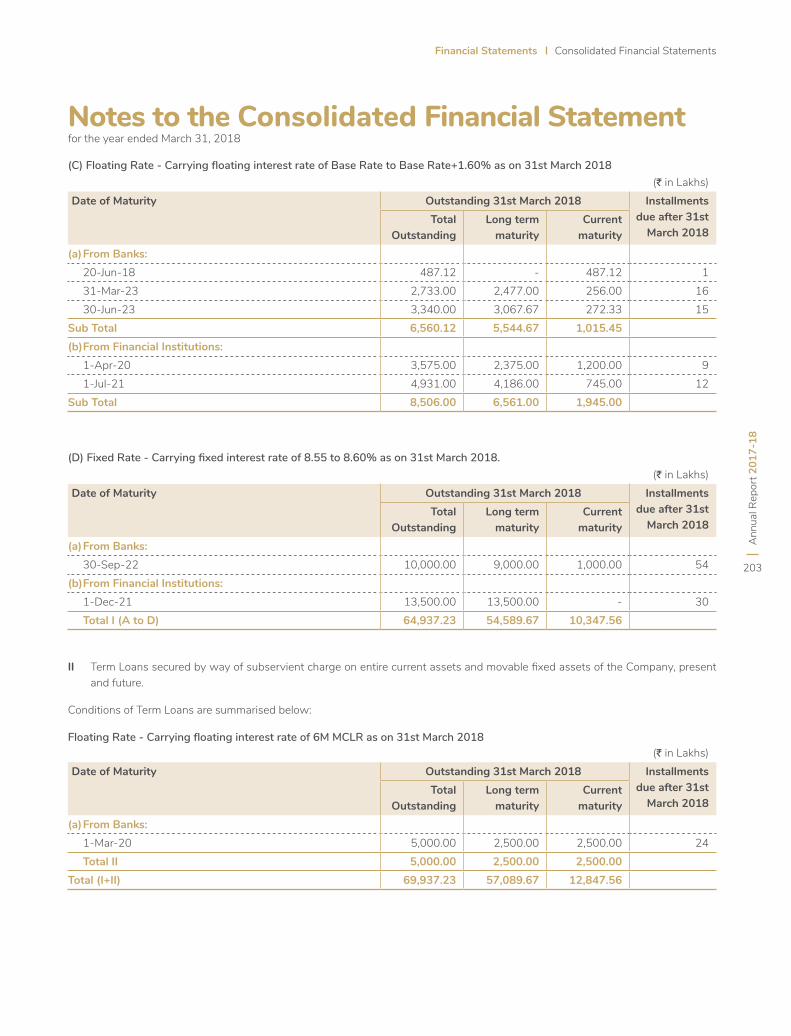
Ann
ual R
epor
t 201
7-18
203
Financial Statements Consolidated Financial Statements
(J in Lakhs)Date of Maturity Outstanding 31st March 2018 Installments
due after 31st March 2018
Total Outstanding
Long term maturity
Current maturity
(a)FromBanks: 20-Jun-18 487.12 - 487.12 1 31-Mar-23 2,733.00 2,477.00 256.00 16 30-Jun-23 3,340.00 3,067.67 272.33 15Sub Total 6,560.12 5,544.67 1,015.45 (b) From Financial Institutions: 1-Apr-20 3,575.00 2,375.00 1,200.00 9 1-Jul-21 4,931.00 4,186.00 745.00 12Sub Total 8,506.00 6,561.00 1,945.00
(J in Lakhs)Date of Maturity Outstanding 31st March 2018 Installments
due after 31st March 2018
Total Outstanding
Long term maturity
Current maturity
(a)FromBanks: 30-Sep-22 10,000.00 9,000.00 1,000.00 54(b) From Financial Institutions: 1-Dec-21 13,500.00 13,500.00 - 30 Total I (A to D) 64,937.23 54,589.67 10,347.56
(J in Lakhs)Date of Maturity Outstanding 31st March 2018 Installments
due after 31st March 2018
Total Outstanding
Long term maturity
Current maturity
(a)FromBanks: 1-Mar-20 5,000.00 2,500.00 2,500.00 24 Total II 5,000.00 2,500.00 2,500.00 Total (I+II) 69,937.23 57,089.67 12,847.56
(C) Floating Rate - Carrying floating interest rate of Base Rate to Base Rate+1.60% as on 31st March 2018
(D) Fixed Rate - Carrying fixed interest rate of 8.55 to 8.60% as on 31st March 2018.
II Term Loans secured by way of subservient charge on entire current assets and movable fixed assets of the Company, present and future.
Conditions of Term Loans are summarised below:
Floating Rate - Carrying floating interest rate of 6M MCLR as on 31st March 2018
Notes to the Consolidated Financial Statement for the year ended March 31, 2018
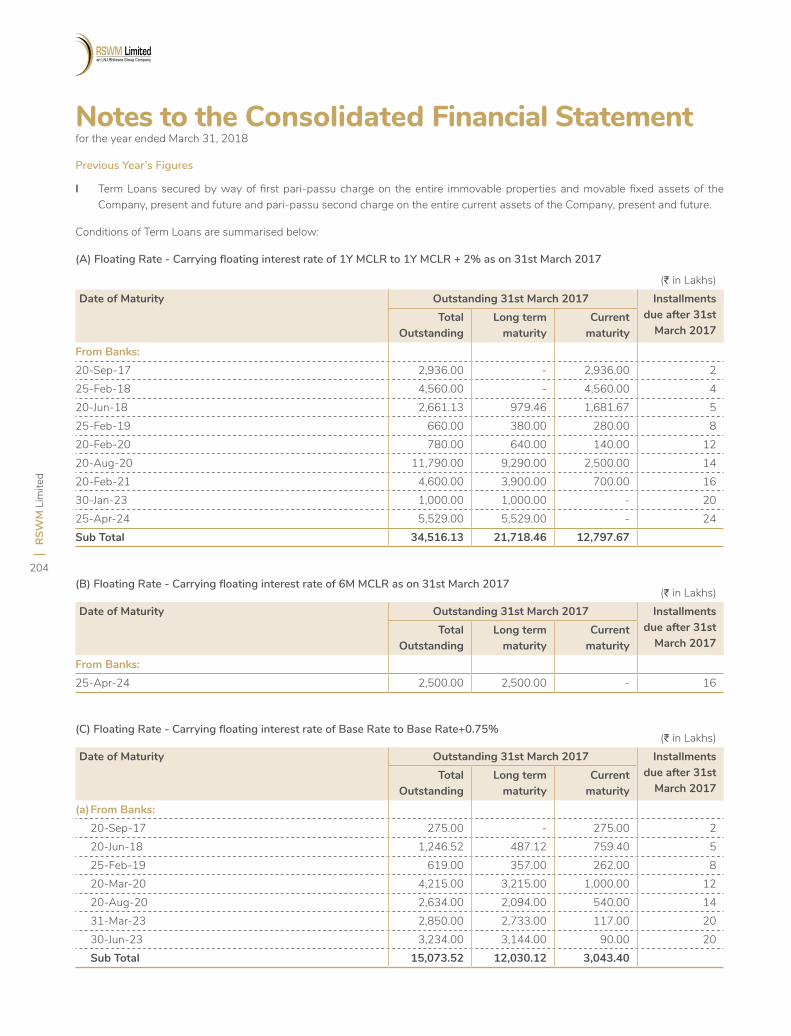
RSW
M L
imite
d
204
(J in Lakhs)Date of Maturity Outstanding 31st March 2017 Installments
due after 31st March 2017
Total Outstanding
Long term maturity
Current maturity
FromBanks:20-Sep-17 2,936.00 - 2,936.00 225-Feb-18 4,560.00 - 4,560.00 420-Jun-18 2,661.13 979.46 1,681.67 525-Feb-19 660.00 380.00 280.00 820-Feb-20 780.00 640.00 140.00 1220-Aug-20 11,790.00 9,290.00 2,500.00 1420-Feb-21 4,600.00 3,900.00 700.00 1630-Jan-23 1,000.00 1,000.00 - 2025-Apr-24 5,529.00 5,529.00 - 24Sub Total 34,516.13 21,718.46 12,797.67
(J in Lakhs)Date of Maturity Outstanding 31st March 2017 Installments
due after 31st March 2017
Total Outstanding
Long term maturity
Current maturity
(a)FromBanks: 20-Sep-17 275.00 - 275.00 2 20-Jun-18 1,246.52 487.12 759.40 5 25-Feb-19 619.00 357.00 262.00 8 20-Mar-20 4,215.00 3,215.00 1,000.00 12 20-Aug-20 2,634.00 2,094.00 540.00 14 31-Mar-23 2,850.00 2,733.00 117.00 20 30-Jun-23 3,234.00 3,144.00 90.00 20 Sub Total 15,073.52 12,030.12 3,043.40
Previous Year’s Figures
I Term Loans secured by way of first pari-passu charge on the entire immovable properties and movable fixed assets of the Company, present and future and pari-passu second charge on the entire current assets of the Company, present and future.
Conditions of Term Loans are summarised below:
(A) Floating Rate - Carrying floating interest rate of 1Y MCLR to 1Y MCLR + 2% as on 31st March 2017
(J in Lakhs)Date of Maturity Outstanding 31st March 2017 Installments
due after 31st March 2017
Total Outstanding
Long term maturity
Current maturity
FromBanks:25-Apr-24 2,500.00 2,500.00 - 16
(B) Floating Rate - Carrying floating interest rate of 6M MCLR as on 31st March 2017
(C) Floating Rate - Carrying floating interest rate of Base Rate to Base Rate+0.75%
Notes to the Consolidated Financial Statement for the year ended March 31, 2018
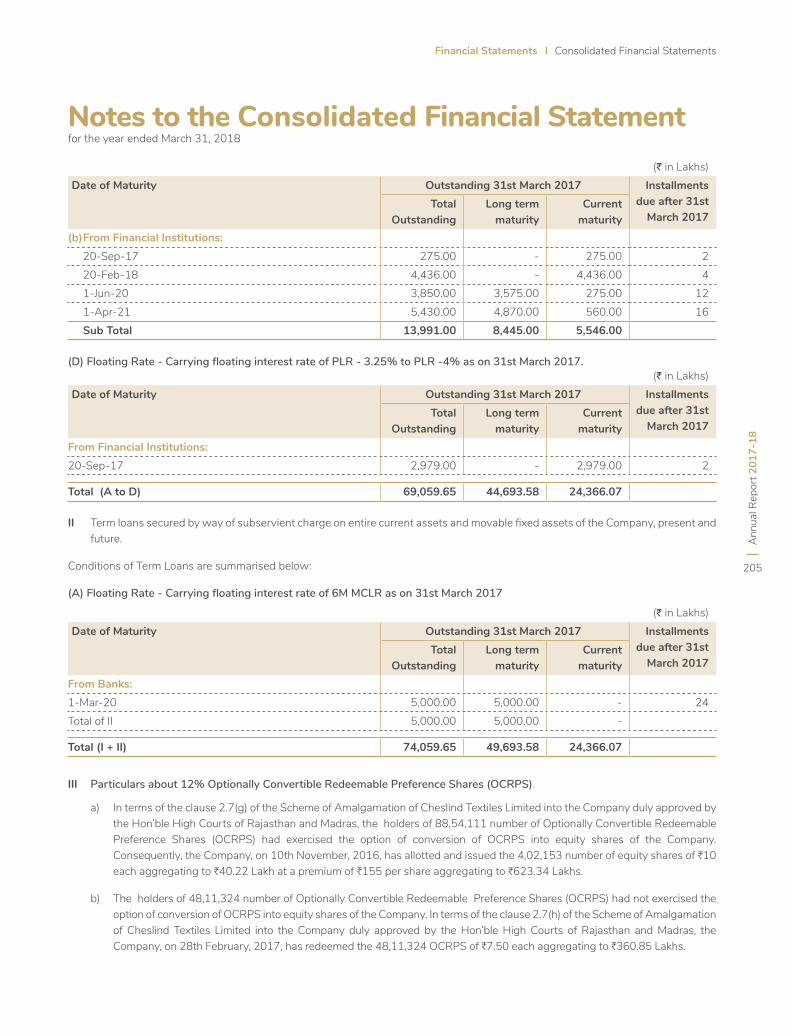
Ann
ual R
epor
t 201
7-18
205
Financial Statements Consolidated Financial Statements
(D) Floating Rate - Carrying floating interest rate of PLR - 3.25% to PLR -4% as on 31st March 2017.
(J in Lakhs)Date of Maturity Outstanding 31st March 2017 Installments
due after 31st March 2017
Total Outstanding
Long term maturity
Current maturity
(b) From Financial Institutions: 20-Sep-17 275.00 - 275.00 2 20-Feb-18 4,436.00 - 4,436.00 4 1-Jun-20 3,850.00 3,575.00 275.00 12 1-Apr-21 5,430.00 4,870.00 560.00 16 Sub Total 13,991.00 8,445.00 5,546.00
(J in Lakhs)Date of Maturity Outstanding 31st March 2017 Installments
due after 31st March 2017
Total Outstanding
Long term maturity
Current maturity
FromBanks:1-Mar-20 5,000.00 5,000.00 - 24Total of II 5,000.00 5,000.00 -
Total (I + II) 74,059.65 49,693.58 24,366.07
(J in Lakhs)Date of Maturity Outstanding 31st March 2017 Installments
due after 31st March 2017
Total Outstanding
Long term maturity
Current maturity
From Financial Institutions:20-Sep-17 2,979.00 - 2,979.00 2
Total (A to D) 69,059.65 44,693.58 24,366.07
II Term loans secured by way of subservient charge on entire current assets and movable fixed assets of the Company, present and future.
Conditions of Term Loans are summarised below:
(A) Floating Rate - Carrying floating interest rate of 6M MCLR as on 31st March 2017
III Particulars about 12% Optionally Convertible Redeemable Preference Shares (OCRPS).
a) In terms of the clause 2.7(g) of the Scheme of Amalgamation of Cheslind Textiles Limited into the Company duly approved by the Hon’ble High Courts of Rajasthan and Madras, the holders of 88,54,111 number of Optionally Convertible Redeemable Preference Shares (OCRPS) had exercised the option of conversion of OCRPS into equity shares of the Company. Consequently, the Company, on 10th November, 2016, has allotted and issued the 4,02,153 number of equity shares of H10 each aggregating to H40.22 Lakh at a premium of H155 per share aggregating to H623.34 Lakhs.
b) The holders of 48,11,324 number of Optionally Convertible Redeemable Preference Shares (OCRPS) had not exercised the option of conversion of OCRPS into equity shares of the Company. In terms of the clause 2.7(h) of the Scheme of Amalgamation of Cheslind Textiles Limited into the Company duly approved by the Hon’ble High Courts of Rajasthan and Madras, the Company, on 28th February, 2017, has redeemed the 48,11,324 OCRPS of H7.50 each aggregating to H360.85 Lakhs.
Notes to the Consolidated Financial Statement for the year ended March 31, 2018
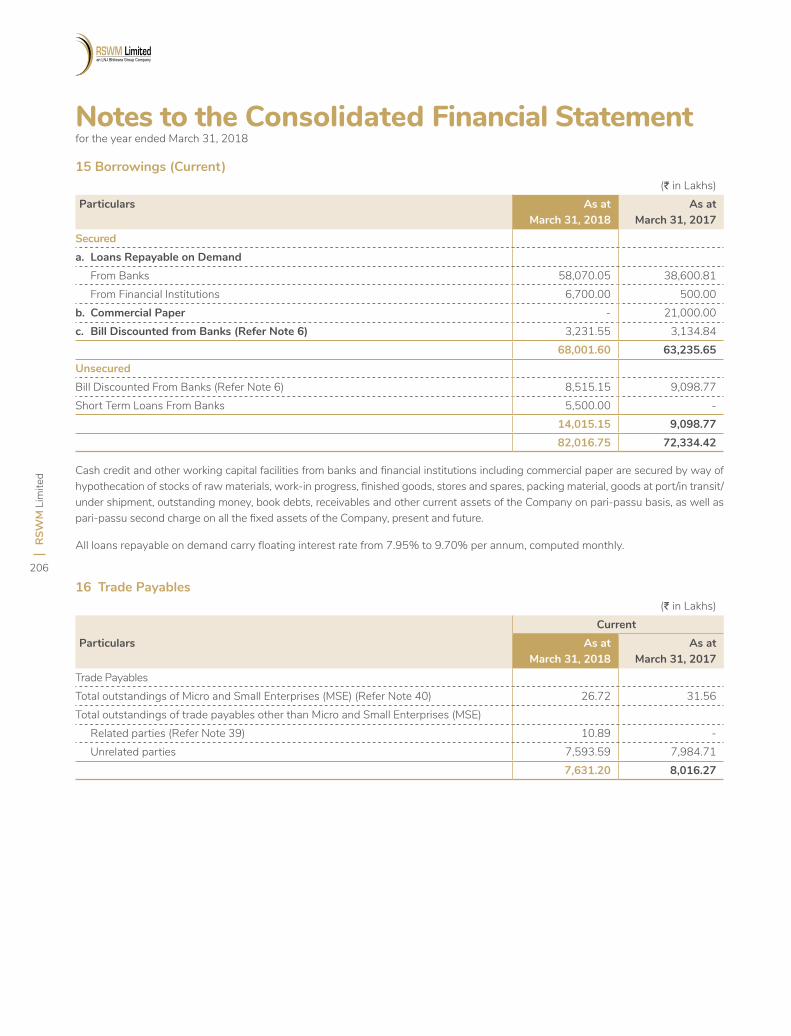
RSW
M L
imite
d
206
15 Borrowings (Current)(J in Lakhs)
Particulars As atMarch 31, 2018
As atMarch 31, 2017
Secureda. Loans Repayable on Demand From Banks 58,070.05 38,600.81 From Financial Institutions 6,700.00 500.00 b. Commercial Paper - 21,000.00 c. BillDiscountedfromBanks(ReferNote6) 3,231.55 3,134.84
68,001.60 63,235.65 UnsecuredBill Discounted From Banks (Refer Note 6) 8,515.15 9,098.77 Short Term Loans From Banks 5,500.00 -
14,015.15 9,098.77 82,016.75 72,334.42
Cash credit and other working capital facilities from banks and financial institutions including commercial paper are secured by way of hypothecation of stocks of raw materials, work-in progress, finished goods, stores and spares, packing material, goods at port/in transit/under shipment, outstanding money, book debts, receivables and other current assets of the Company on pari-passu basis, as well as pari-passu second charge on all the fixed assets of the Company, present and future.
All loans repayable on demand carry floating interest rate from 7.95% to 9.70% per annum, computed monthly.
16 Trade Payables(J in Lakhs)
CurrentParticulars As at
March 31, 2018As at
March 31, 2017Trade PayablesTotal outstandings of Micro and Small Enterprises (MSE) (Refer Note 40) 26.72 31.56 Total outstandings of trade payables other than Micro and Small Enterprises (MSE) Related parties (Refer Note 39) 10.89 - Unrelated parties 7,593.59 7,984.71
7,631.20 8,016.27
Notes to the Consolidated Financial Statement for the year ended March 31, 2018
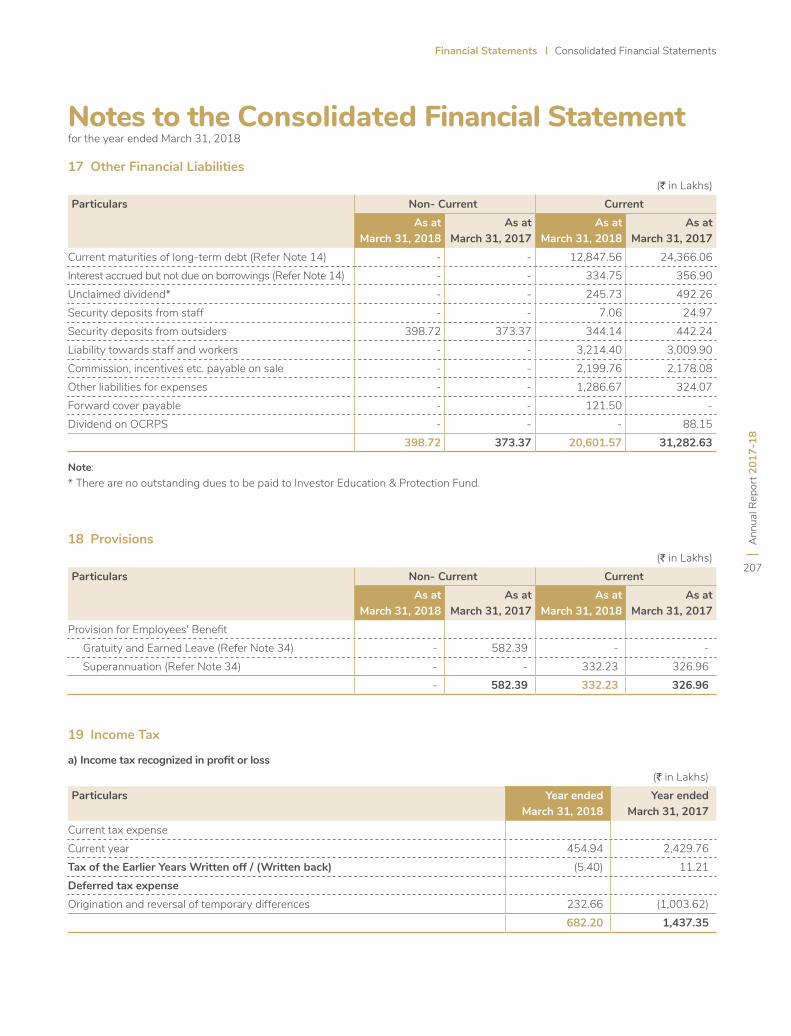
Ann
ual R
epor
t 201
7-18
207
Financial Statements Consolidated Financial Statements
17 Other Financial Liabilities(J in Lakhs)
Particulars Non- Current CurrentAs at
March 31, 2018As at
March 31, 2017As at
March 31, 2018As at
March 31, 2017Current maturities of long-term debt (Refer Note 14) - - 12,847.56 24,366.06 Interest accrued but not due on borrowings (Refer Note 14) - - 334.75 356.90 Unclaimed dividend* - - 245.73 492.26 Security deposits from staff - - 7.06 24.97 Security deposits from outsiders 398.72 373.37 344.14 442.24 Liability towards staff and workers - - 3,214.40 3,009.90 Commission, incentives etc. payable on sale - - 2,199.76 2,178.08 Other liabilities for expenses - - 1,286.67 324.07 Forward cover payable - - 121.50 - Dividend on OCRPS - - - 88.15
398.72 373.37 20,601.57 31,282.63
Note:* There are no outstanding dues to be paid to Investor Education & Protection Fund.
(J in Lakhs)Particulars Non- Current Current
As at March 31, 2018
As at March 31, 2017
As at March 31, 2018
As at March 31, 2017
Provision for Employees' Benefit Gratuity and Earned Leave (Refer Note 34) - 582.39 - - Superannuation (Refer Note 34) - - 332.23 326.96
- 582.39 332.23 326.96
18 Provisions
19 Income Tax
a)Incometaxrecognizedinprofitorloss(J in Lakhs)
Particulars Year endedMarch 31, 2018
Year endedMarch 31, 2017
Current tax expenseCurrent year 454.94 2,429.76 TaxoftheEarlierYearsWrittenoff/(Writtenback) (5.40) 11.21 Deferred tax expenseOrigination and reversal of temporary differences 232.66 (1,003.62)
682.20 1,437.35
Notes to the Consolidated Financial Statement for the year ended March 31, 2018
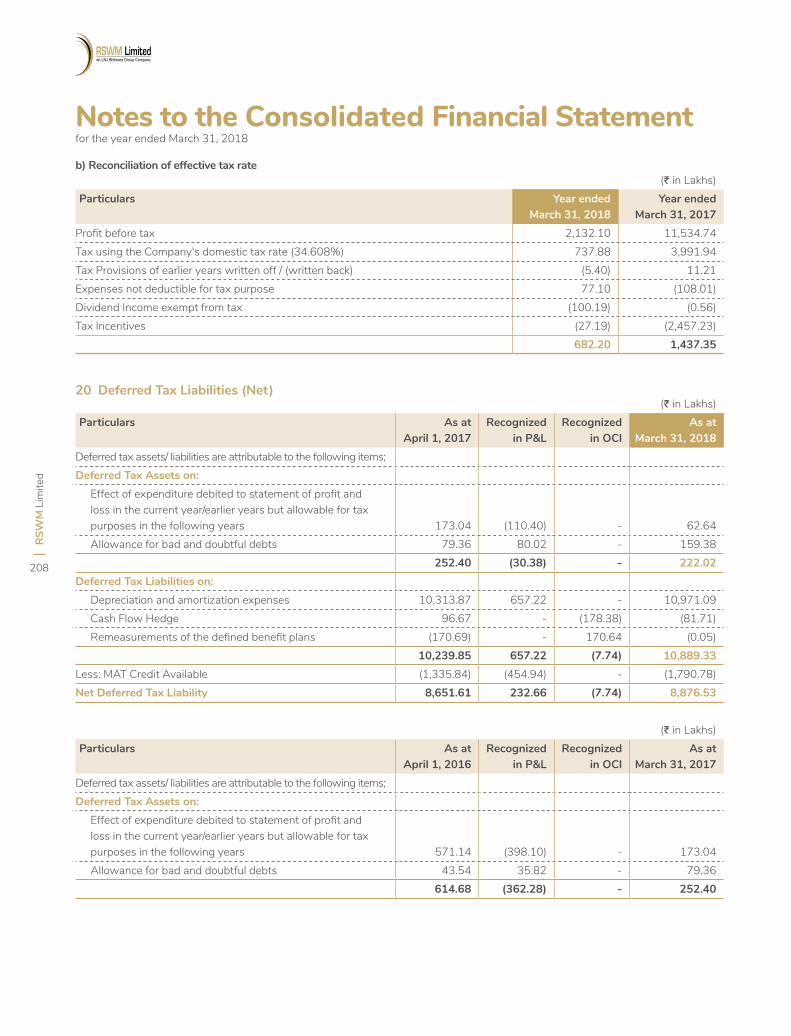
RSW
M L
imite
d
208
b) Reconciliation of effective tax rate(J in Lakhs)
Particulars Year endedMarch 31, 2018
Year endedMarch 31, 2017
Profit before tax 2,132.10 11,534.74 Tax using the Company's domestic tax rate (34.608%) 737.88 3,991.94 Tax Provisions of earlier years written off / (written back) (5.40) 11.21 Expenses not deductible for tax purpose 77.10 (108.01)Dividend Income exempt from tax (100.19) (0.56)Tax Incentives (27.19) (2,457.23)
682.20 1,437.35
20 Deferred Tax Liabilities (Net)(J in Lakhs)
Particulars As atApril 1, 2017
Recognized in P&L
Recognized in OCI
As at March 31, 2018
Deferred tax assets/ liabilities are attributable to the following items;Deferred Tax Assets on: Effect of expenditure debited to statement of profit and
loss in the current year/earlier years but allowable for tax purposes in the following years 173.04 (110.40) - 62.64
Allowance for bad and doubtful debts 79.36 80.02 - 159.38 252.40 (30.38) - 222.02
Deferred Tax Liabilities on: Depreciation and amortization expenses 10,313.87 657.22 - 10,971.09 Cash Flow Hedge 96.67 - (178.38) (81.71) Remeasurements of the defined benefit plans (170.69) - 170.64 (0.05)
10,239.85 657.22 (7.74) 10,889.33 Less: MAT Credit Available (1,335.84) (454.94) - (1,790.78)Net Deferred Tax Liability 8,651.61 232.66 (7.74) 8,876.53
(J in Lakhs)Particulars As at
April 1, 2016Recognized
in P&LRecognized
in OCIAs at
March 31, 2017Deferred tax assets/ liabilities are attributable to the following items;Deferred Tax Assets on: Effect of expenditure debited to statement of profit and
loss in the current year/earlier years but allowable for tax purposes in the following years 571.14 (398.10) - 173.04
Allowance for bad and doubtful debts 43.54 35.82 - 79.36 614.68 (362.28) - 252.40
Notes to the Consolidated Financial Statement for the year ended March 31, 2018
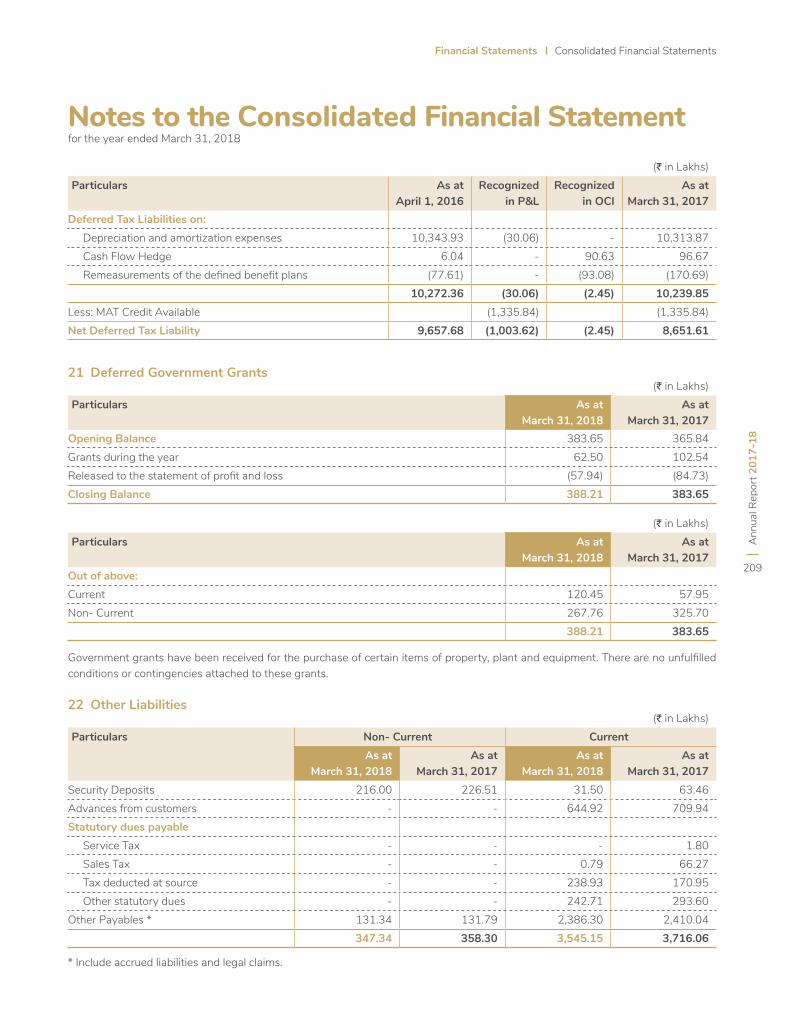
Ann
ual R
epor
t 201
7-18
209
Financial Statements Consolidated Financial Statements
(J in Lakhs)Particulars As at
April 1, 2016Recognized
in P&LRecognized
in OCIAs at
March 31, 2017Deferred Tax Liabilities on: Depreciation and amortization expenses 10,343.93 (30.06) - 10,313.87 Cash Flow Hedge 6.04 - 90.63 96.67 Remeasurements of the defined benefit plans (77.61) - (93.08) (170.69)
10,272.36 (30.06) (2.45) 10,239.85 Less: MAT Credit Available (1,335.84) (1,335.84)Net Deferred Tax Liability 9,657.68 (1,003.62) (2.45) 8,651.61
21 Deferred Government Grants(J in Lakhs)
Particulars As atMarch 31, 2018
As atMarch 31, 2017
Opening Balance 383.65 365.84 Grants during the year 62.50 102.54 Released to the statement of profit and loss (57.94) (84.73)Closing Balance 388.21 383.65
(J in Lakhs)Particulars As at
March 31, 2018As at
March 31, 2017Out of above:Current 120.45 57.95 Non- Current 267.76 325.70
388.21 383.65
Government grants have been received for the purchase of certain items of property, plant and equipment. There are no unfulfilled conditions or contingencies attached to these grants.
22 Other Liabilities(J in Lakhs)
Particulars Non- Current CurrentAs at
March 31, 2018As at
March 31, 2017As at
March 31, 2018As at
March 31, 2017Security Deposits 216.00 226.51 31.50 63.46 Advances from customers - - 644.92 709.94 Statutory dues payable Service Tax - - - 1.80 Sales Tax - - 0.79 66.27 Tax deducted at source - - 238.93 170.95 Other statutory dues - - 242.71 293.60 Other Payables * 131.34 131.79 2,386.30 2,410.04
347.34 358.30 3,545.15 3,716.06
* Include accrued liabilities and legal claims.
Notes to the Consolidated Financial Statement for the year ended March 31, 2018
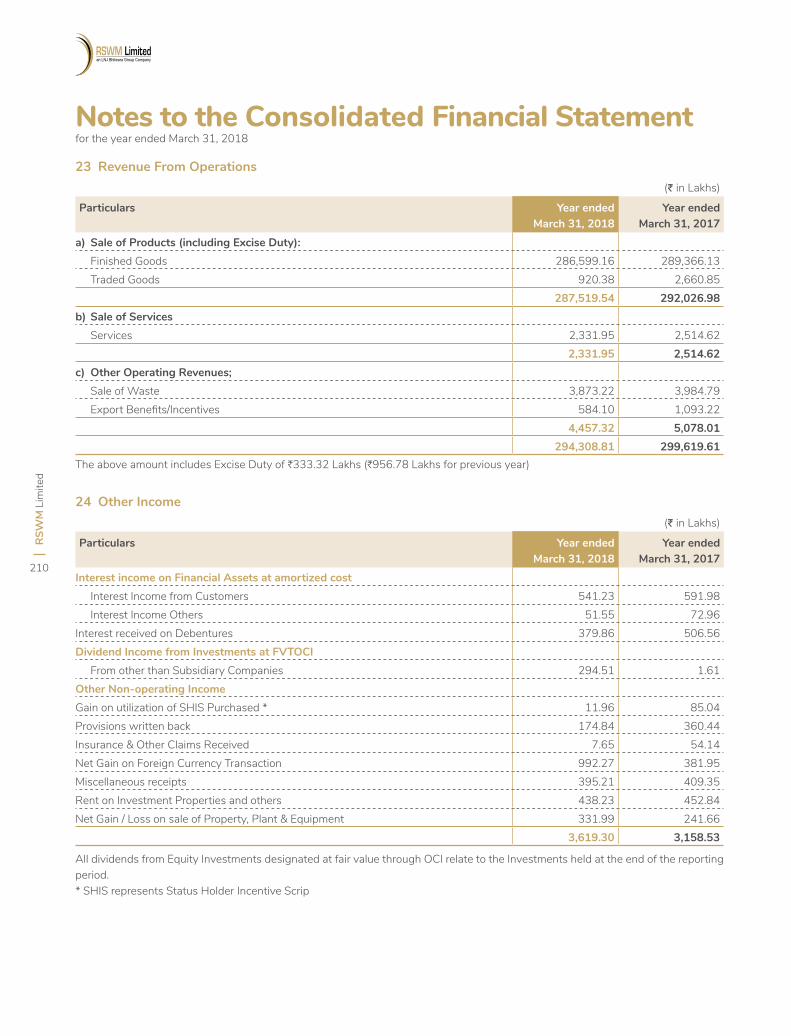
RSW
M L
imite
d
210
23 Revenue From Operations
24 Other Income
(J in Lakhs)
Particulars Year endedMarch 31, 2018
Year endedMarch 31, 2017
a) Sale of Products (including Excise Duty): Finished Goods 286,599.16 289,366.13 Traded Goods 920.38 2,660.85
287,519.54 292,026.98 b) Sale of Services Services 2,331.95 2,514.62
2,331.95 2,514.62 c) Other Operating Revenues; Sale of Waste 3,873.22 3,984.79 Export Benefits/Incentives 584.10 1,093.22
4,457.32 5,078.01 294,308.81 299,619.61
(J in Lakhs)
Particulars Year endedMarch 31, 2018
Year endedMarch 31, 2017
Interest income on Financial Assets at amortized cost Interest Income from Customers 541.23 591.98 Interest Income Others 51.55 72.96 Interest received on Debentures 379.86 506.56 Dividend Income from Investments at FVTOCI From other than Subsidiary Companies 294.51 1.61 Other Non-operating IncomeGain on utilization of SHIS Purchased * 11.96 85.04 Provisions written back 174.84 360.44 Insurance & Other Claims Received 7.65 54.14 Net Gain on Foreign Currency Transaction 992.27 381.95 Miscellaneous receipts 395.21 409.35 Rent on Investment Properties and others 438.23 452.84 Net Gain / Loss on sale of Property, Plant & Equipment 331.99 241.66
3,619.30 3,158.53
The above amount includes Excise Duty of H333.32 Lakhs (H956.78 Lakhs for previous year)
All dividends from Equity Investments designated at fair value through OCI relate to the Investments held at the end of the reporting period.* SHIS represents Status Holder Incentive Scrip
Notes to the Consolidated Financial Statement for the year ended March 31, 2018
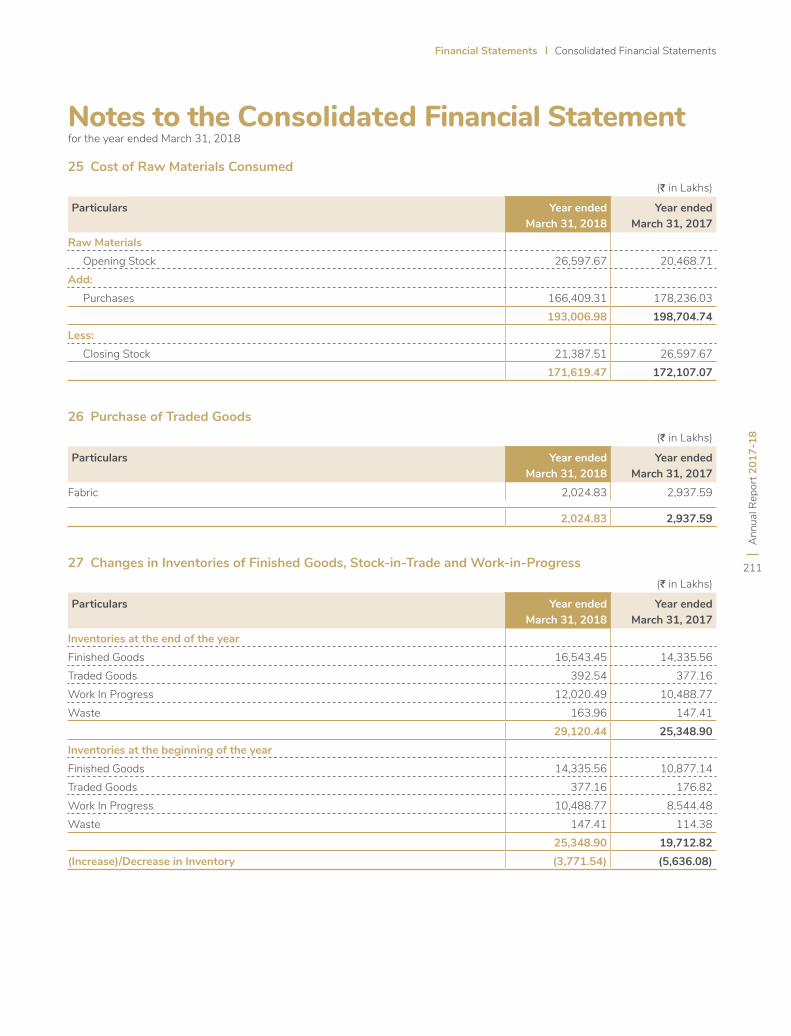
Ann
ual R
epor
t 201
7-18
211
Financial Statements Consolidated Financial Statements
25 Cost of Raw Materials Consumed
26 Purchase of Traded Goods
27 ChangesinInventoriesofFinishedGoods,Stock-in-TradeandWork-in-Progress
(J in Lakhs)
Particulars Year endedMarch 31, 2018
Year endedMarch 31, 2017
Raw Materials Opening Stock 26,597.67 20,468.71 Add: Purchases 166,409.31 178,236.03
193,006.98 198,704.74 Less: Closing Stock 21,387.51 26,597.67
171,619.47 172,107.07
(J in Lakhs)
Particulars Year endedMarch 31, 2018
Year endedMarch 31, 2017
Fabric 2,024.83 2,937.59
2,024.83 2,937.59
(J in Lakhs)
Particulars Year endedMarch 31, 2018
Year endedMarch 31, 2017
Inventories at the end of the yearFinished Goods 16,543.45 14,335.56 Traded Goods 392.54 377.16 Work In Progress 12,020.49 10,488.77 Waste 163.96 147.41
29,120.44 25,348.90 Inventories at the beginning of the yearFinished Goods 14,335.56 10,877.14 Traded Goods 377.16 176.82 Work In Progress 10,488.77 8,544.48 Waste 147.41 114.38
25,348.90 19,712.82 (Increase)/DecreaseinInventory (3,771.54) (5,636.08)
Notes to the Consolidated Financial Statement for the year ended March 31, 2018
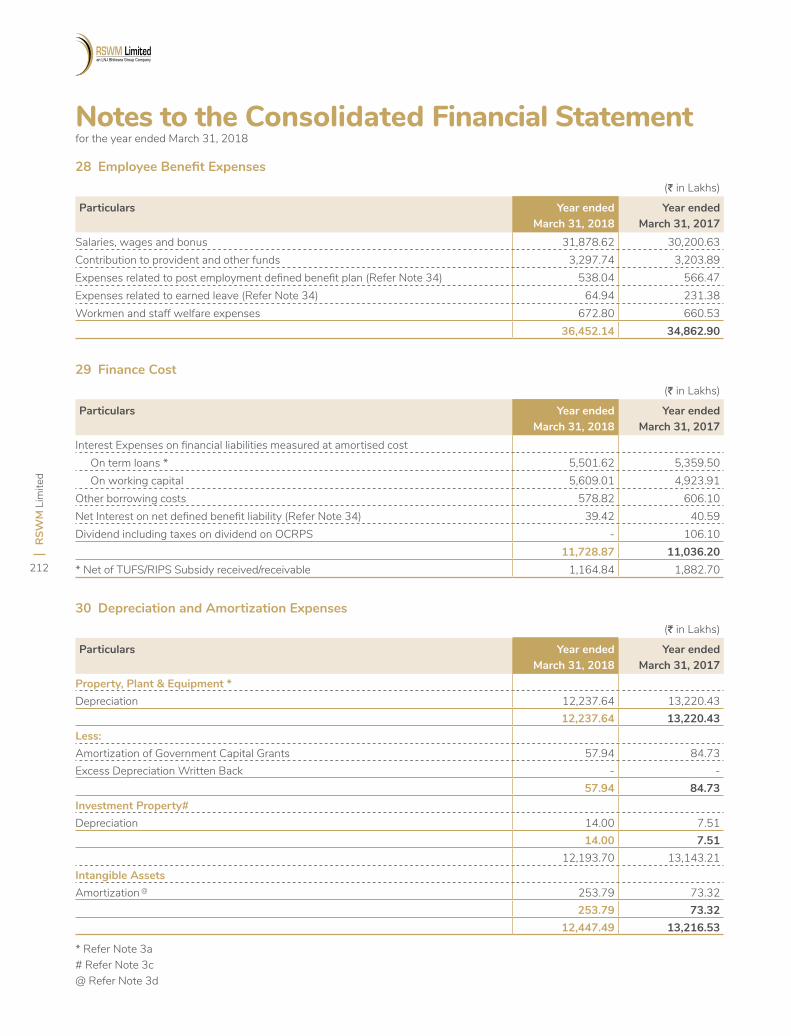
RSW
M L
imite
d
212
28 EmployeeBenefitExpenses
29 Finance Cost
30 Depreciation and Amortization Expenses
(J in Lakhs)
Particulars Year endedMarch 31, 2018
Year endedMarch 31, 2017
Salaries, wages and bonus 31,878.62 30,200.63 Contribution to provident and other funds 3,297.74 3,203.89 Expenses related to post employment defined benefit plan (Refer Note 34) 538.04 566.47 Expenses related to earned leave (Refer Note 34) 64.94 231.38 Workmen and staff welfare expenses 672.80 660.53
36,452.14 34,862.90
(J in Lakhs)
Particulars Year endedMarch 31, 2018
Year endedMarch 31, 2017
Interest Expenses on financial liabilities measured at amortised cost On term loans * 5,501.62 5,359.50 On working capital 5,609.01 4,923.91 Other borrowing costs 578.82 606.10 Net Interest on net defined benefit liability (Refer Note 34) 39.42 40.59 Dividend including taxes on dividend on OCRPS - 106.10
11,728.87 11,036.20 * Net of TUFS/RIPS Subsidy received/receivable 1,164.84 1,882.70
(J in Lakhs)
Particulars Year endedMarch 31, 2018
Year endedMarch 31, 2017
Property, Plant & Equipment *Depreciation 12,237.64 13,220.43
12,237.64 13,220.43 Less:Amortization of Government Capital Grants 57.94 84.73 Excess Depreciation Written Back - -
57.94 84.73 Investment Property#Depreciation 14.00 7.51
14.00 7.51 12,193.70 13,143.21
Intangible AssetsAmortization @ 253.79 73.32
253.79 73.32 12,447.49 13,216.53
* Refer Note 3a# Refer Note 3c@ Refer Note 3d
Notes to the Consolidated Financial Statement for the year ended March 31, 2018
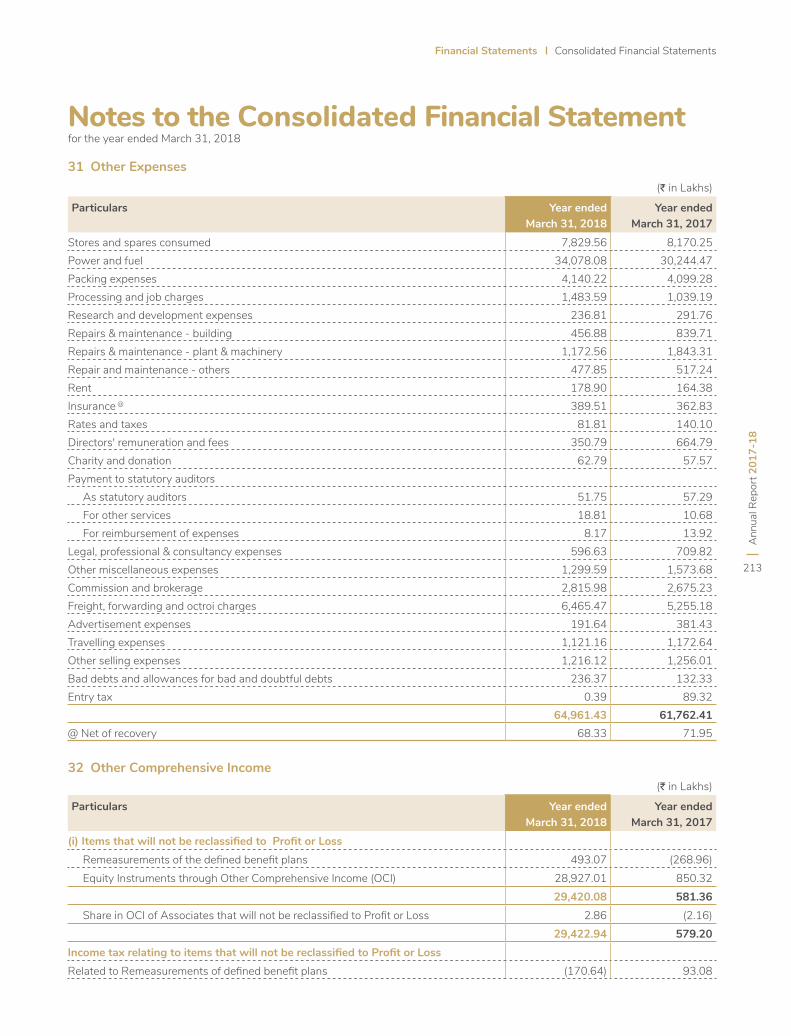
Ann
ual R
epor
t 201
7-18
213
Financial Statements Consolidated Financial Statements
31 Other Expenses
32 Other Comprehensive Income
(J in Lakhs)
Particulars Year endedMarch 31, 2018
Year endedMarch 31, 2017
Stores and spares consumed 7,829.56 8,170.25 Power and fuel 34,078.08 30,244.47 Packing expenses 4,140.22 4,099.28 Processing and job charges 1,483.59 1,039.19 Research and development expenses 236.81 291.76 Repairs & maintenance - building 456.88 839.71 Repairs & maintenance - plant & machinery 1,172.56 1,843.31 Repair and maintenance - others 477.85 517.24 Rent 178.90 164.38 Insurance @ 389.51 362.83 Rates and taxes 81.81 140.10 Directors' remuneration and fees 350.79 664.79 Charity and donation 62.79 57.57 Payment to statutory auditors As statutory auditors 51.75 57.29 For other services 18.81 10.68 For reimbursement of expenses 8.17 13.92 Legal, professional & consultancy expenses 596.63 709.82 Other miscellaneous expenses 1,299.59 1,573.68 Commission and brokerage 2,815.98 2,675.23 Freight, forwarding and octroi charges 6,465.47 5,255.18 Advertisement expenses 191.64 381.43 Travelling expenses 1,121.16 1,172.64 Other selling expenses 1,216.12 1,256.01 Bad debts and allowances for bad and doubtful debts 236.37 132.33 Entry tax 0.39 89.32
64,961.43 61,762.41 @ Net of recovery 68.33 71.95
(J in Lakhs)
Particulars Year endedMarch 31, 2018
Year endedMarch 31, 2017
(i)ItemsthatwillnotbereclassifiedtoProfitorLoss Remeasurements of the defined benefit plans 493.07 (268.96) Equity Instruments through Other Comprehensive Income (OCI) 28,927.01 850.32
29,420.08 581.36 Share in OCI of Associates that will not be reclassified to Profit or Loss 2.86 (2.16)
29,422.94 579.20 IncometaxrelatingtoitemsthatwillnotbereclassifiedtoProfitorLossRelated to Remeasurements of defined benefit plans (170.64) 93.08
Notes to the Consolidated Financial Statement for the year ended March 31, 2018
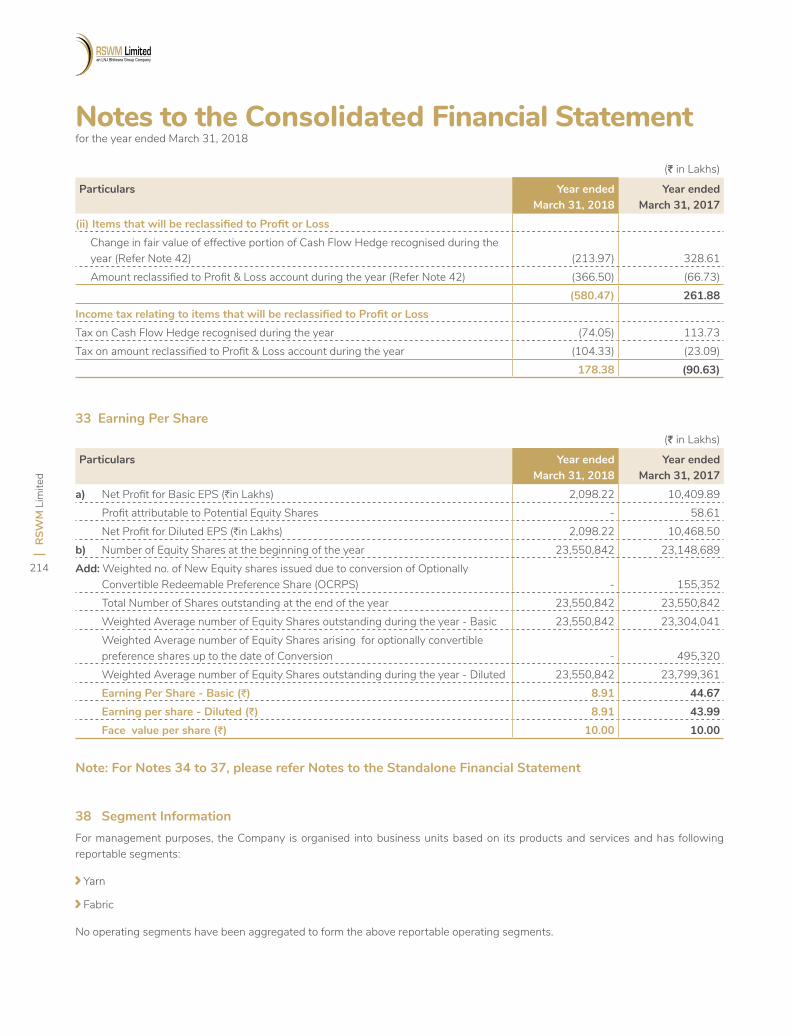
RSW
M L
imite
d
214
(J in Lakhs)
Particulars Year endedMarch 31, 2018
Year endedMarch 31, 2017
(ii)ItemsthatwillbereclassifiedtoProfitorLoss Change in fair value of effective portion of Cash Flow Hedge recognised during the
year (Refer Note 42) (213.97) 328.61 Amount reclassified to Profit & Loss account during the year (Refer Note 42) (366.50) (66.73)
(580.47) 261.88 IncometaxrelatingtoitemsthatwillbereclassifiedtoProfitorLossTax on Cash Flow Hedge recognised during the year (74.05) 113.73 Tax on amount reclassified to Profit & Loss account during the year (104.33) (23.09)
178.38 (90.63)
33 Earning Per Share
38 Segment Information
(J in Lakhs)
Particulars Year endedMarch 31, 2018
Year endedMarch 31, 2017
a) Net Profit for Basic EPS (Hin Lakhs) 2,098.22 10,409.89 Profit attributable to Potential Equity Shares - 58.61 Net Profit for Diluted EPS (Hin Lakhs) 2,098.22 10,468.50 b) Number of Equity Shares at the beginning of the year 23,550,842 23,148,689 Add: Weighted no. of New Equity shares issued due to conversion of Optionally
Convertible Redeemable Preference Share (OCRPS) - 155,352 Total Number of Shares outstanding at the end of the year 23,550,842 23,550,842 Weighted Average number of Equity Shares outstanding during the year - Basic 23,550,842 23,304,041 Weighted Average number of Equity Shares arising for optionally convertible
preference shares up to the date of Conversion - 495,320 Weighted Average number of Equity Shares outstanding during the year - Diluted 23,550,842 23,799,361 Earning Per Share - Basic (J) 8.91 44.67 Earning per share - Diluted (J) 8.91 43.99 Face value per share (J) 10.00 10.00
Note: For Notes 34 to 37, please refer Notes to the Standalone Financial Statement
For management purposes, the Company is organised into business units based on its products and services and has following reportable segments:
Yarn
Fabric
No operating segments have been aggregated to form the above reportable operating segments.
Notes to the Consolidated Financial Statement for the year ended March 31, 2018
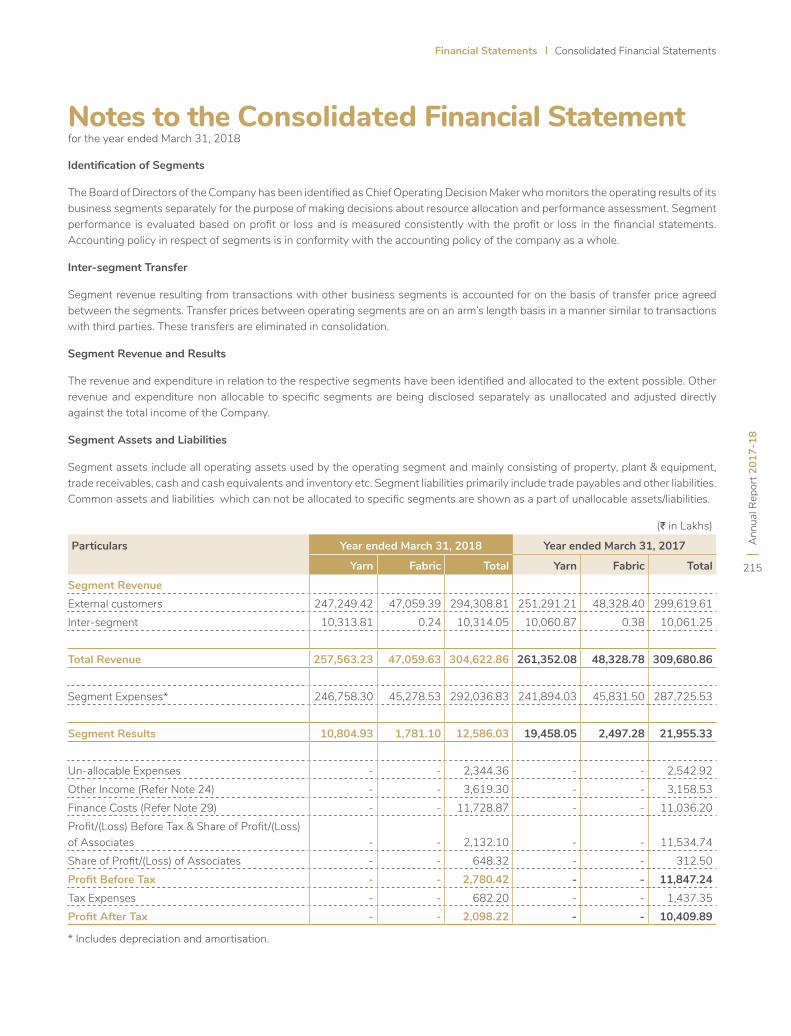
Ann
ual R
epor
t 201
7-18
215
Financial Statements Consolidated Financial Statements
IdentificationofSegments
The Board of Directors of the Company has been identified as Chief Operating Decision Maker who monitors the operating results of its business segments separately for the purpose of making decisions about resource allocation and performance assessment. Segment performance is evaluated based on profit or loss and is measured consistently with the profit or loss in the financial statements. Accounting policy in respect of segments is in conformity with the accounting policy of the company as a whole.
Inter-segment Transfer
Segment revenue resulting from transactions with other business segments is accounted for on the basis of transfer price agreed between the segments. Transfer prices between operating segments are on an arm’s length basis in a manner similar to transactions with third parties. These transfers are eliminated in consolidation.
Segment Revenue and Results
The revenue and expenditure in relation to the respective segments have been identified and allocated to the extent possible. Other revenue and expenditure non allocable to specific segments are being disclosed separately as unallocated and adjusted directly against the total income of the Company.
Segment Assets and Liabilities
Segment assets include all operating assets used by the operating segment and mainly consisting of property, plant & equipment, trade receivables, cash and cash equivalents and inventory etc. Segment liabilities primarily include trade payables and other liabilities. Common assets and liabilities which can not be allocated to specific segments are shown as a part of unallocable assets/liabilities.
(J in Lakhs)
Particulars Year ended March 31, 2018 Year ended March 31, 2017
Yarn Fabric Total Yarn Fabric Total
Segment RevenueExternal customers 247,249.42 47,059.39 294,308.81 251,291.21 48,328.40 299,619.61 Inter-segment 10,313.81 0.24 10,314.05 10,060.87 0.38 10,061.25
Total Revenue 257,563.23 47,059.63 304,622.86 261,352.08 48,328.78 309,680.86
Segment Expenses* 246,758.30 45,278.53 292,036.83 241,894.03 45,831.50 287,725.53
Segment Results 10,804.93 1,781.10 12,586.03 19,458.05 2,497.28 21,955.33
Un-allocable Expenses - - 2,344.36 - - 2,542.92 Other Income (Refer Note 24) - - 3,619.30 - - 3,158.53 Finance Costs (Refer Note 29) - - 11,728.87 - - 11,036.20 Profit/(Loss) Before Tax & Share of Profit/(Loss) of Associates - - 2,132.10 - - 11,534.74 Share of Profit/(Loss) of Associates - - 648.32 - - 312.50 ProfitBeforeTax - - 2,780.42 - - 11,847.24 Tax Expenses - - 682.20 - - 1,437.35 ProfitAfterTax - - 2,098.22 - - 10,409.89
Notes to the Consolidated Financial Statement for the year ended March 31, 2018
* Includes depreciation and amortisation.
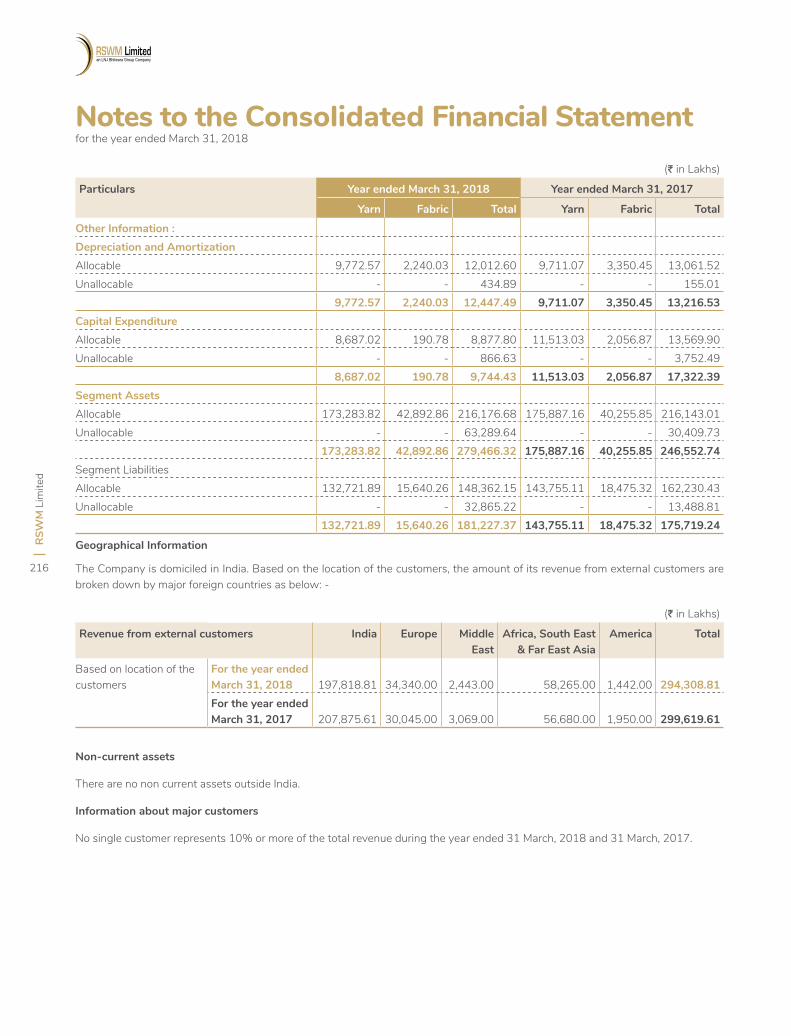
RSW
M L
imite
d
216
(J in Lakhs)
Particulars Year ended March 31, 2018 Year ended March 31, 2017
Yarn Fabric Total Yarn Fabric Total
Other Information :Depreciation and AmortizationAllocable 9,772.57 2,240.03 12,012.60 9,711.07 3,350.45 13,061.52 Unallocable - - 434.89 - - 155.01
9,772.57 2,240.03 12,447.49 9,711.07 3,350.45 13,216.53 Capital Expenditure Allocable 8,687.02 190.78 8,877.80 11,513.03 2,056.87 13,569.90 Unallocable - - 866.63 - - 3,752.49
8,687.02 190.78 9,744.43 11,513.03 2,056.87 17,322.39 Segment AssetsAllocable 173,283.82 42,892.86 216,176.68 175,887.16 40,255.85 216,143.01 Unallocable - - 63,289.64 - - 30,409.73
173,283.82 42,892.86 279,466.32 175,887.16 40,255.85 246,552.74 Segment LiabilitiesAllocable 132,721.89 15,640.26 148,362.15 143,755.11 18,475.32 162,230.43 Unallocable - - 32,865.22 - - 13,488.81
132,721.89 15,640.26 181,227.37 143,755.11 18,475.32 175,719.24
(J in Lakhs)
Revenue from external customers India Europe Middle East
Africa, South East & Far East Asia
America Total
Based on location of the customers
For the year ended March 31, 2018
197,818.81
34,340.00 2,443.00 58,265.00 1,442.00
294,308.81
For the year ended March 31, 2017
207,875.61
30,045.00 3,069.00 56,680.00 1,950.00
299,619.61
Geographical Information
The Company is domiciled in India. Based on the location of the customers, the amount of its revenue from external customers are broken down by major foreign countries as below: -
Non-current assets
There are no non current assets outside India.
Information about major customers
No single customer represents 10% or more of the total revenue during the year ended 31 March, 2018 and 31 March, 2017.
Notes to the Consolidated Financial Statement for the year ended March 31, 2018
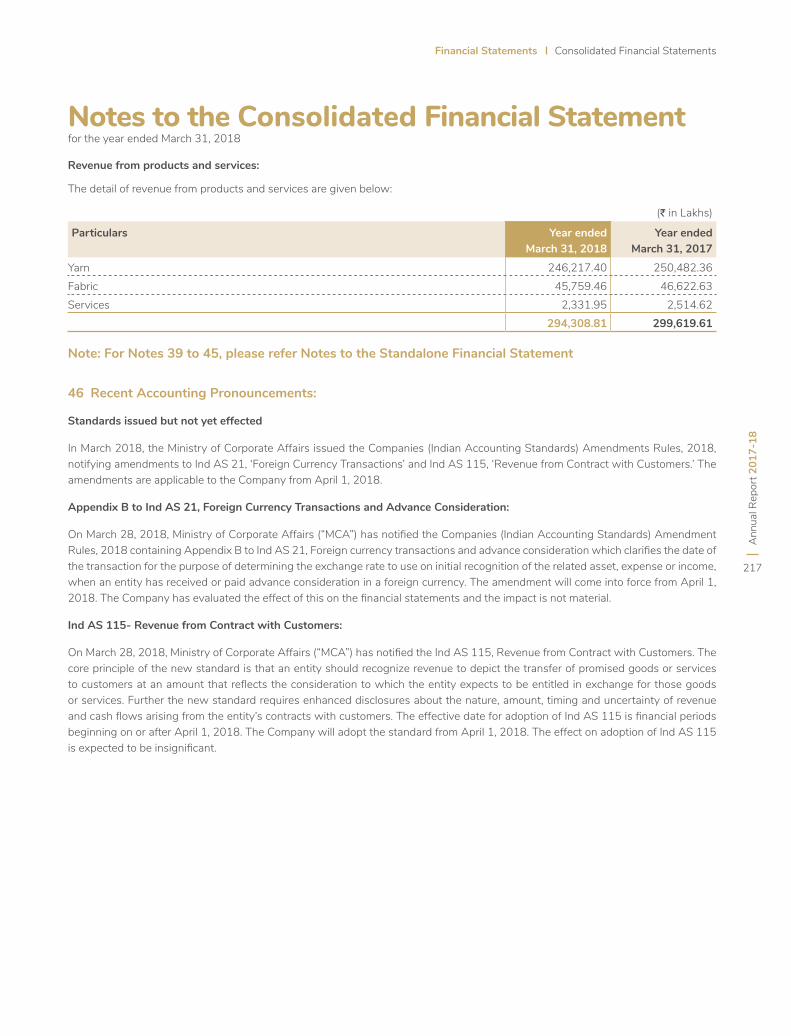
Ann
ual R
epor
t 201
7-18
217
Financial Statements Consolidated Financial Statements
(J in Lakhs)
Particulars Year endedMarch 31, 2018
Year endedMarch 31, 2017
Yarn 246,217.40 250,482.36 Fabric 45,759.46 46,622.63 Services 2,331.95 2,514.62
294,308.81 299,619.61
Revenue from products and services:
The detail of revenue from products and services are given below:
Note: For Notes 39 to 45, please refer Notes to the Standalone Financial Statement
46 Recent Accounting Pronouncements:
Standards issued but not yet effected
In March 2018, the Ministry of Corporate Affairs issued the Companies (Indian Accounting Standards) Amendments Rules, 2018, notifying amendments to Ind AS 21, ‘Foreign Currency Transactions’ and Ind AS 115, ‘Revenue from Contract with Customers.’ The amendments are applicable to the Company from April 1, 2018.
Appendix B to Ind AS 21, Foreign Currency Transactions and Advance Consideration:
On March 28, 2018, Ministry of Corporate Affairs (“MCA”) has notified the Companies (Indian Accounting Standards) Amendment Rules, 2018 containing Appendix B to Ind AS 21, Foreign currency transactions and advance consideration which clarifies the date of the transaction for the purpose of determining the exchange rate to use on initial recognition of the related asset, expense or income, when an entity has received or paid advance consideration in a foreign currency. The amendment will come into force from April 1, 2018. The Company has evaluated the effect of this on the financial statements and the impact is not material.
Ind AS 115- Revenue from Contract with Customers:
On March 28, 2018, Ministry of Corporate Affairs (“MCA”) has notified the Ind AS 115, Revenue from Contract with Customers. The core principle of the new standard is that an entity should recognize revenue to depict the transfer of promised goods or services to customers at an amount that reflects the consideration to which the entity expects to be entitled in exchange for those goods or services. Further the new standard requires enhanced disclosures about the nature, amount, timing and uncertainty of revenue and cash flows arising from the entity’s contracts with customers. The effective date for adoption of Ind AS 115 is financial periods beginning on or after April 1, 2018. The Company will adopt the standard from April 1, 2018. The effect on adoption of Ind AS 115 is expected to be insignificant.
Notes to the Consolidated Financial Statement for the year ended March 31, 2018
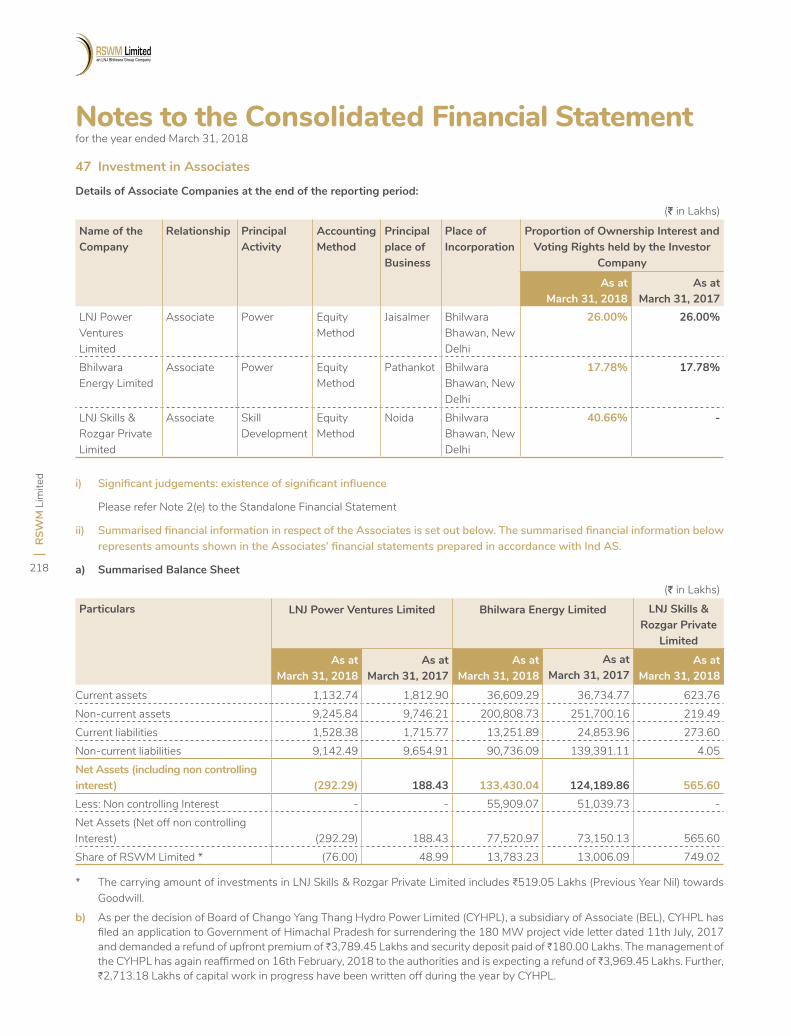
RSW
M L
imite
d
218
47 Investment in Associates
Details of Associate Companies at the end of the reporting period:
(J in Lakhs)
Name of the Company
Relationship Principal Activity
Accounting Method
Principal place of Business
Place of Incorporation
Proportion of Ownership Interest and Voting Rights held by the Investor
Company
As at March 31, 2018
As at March 31, 2017
LNJ Power Ventures Limited
Associate Power Equity Method
Jaisalmer Bhilwara Bhawan, New Delhi
26.00% 26.00%
Bhilwara Energy Limited
Associate Power Equity Method
Pathankot Bhilwara Bhawan, New Delhi
17.78% 17.78%
LNJ Skills & Rozgar Private Limited
Associate Skill Development
Equity Method
Noida Bhilwara Bhawan, New Delhi
40.66% -
i) Significant judgements: existence of significant influence
Please refer Note 2(e) to the Standalone Financial Statement
ii) Summarised financial information in respect of the Associates is set out below. The summarised financial information below represents amounts shown in the Associates’ financial statements prepared in accordance with Ind AS.
a) Summarised Balance Sheet
(J in Lakhs)
Particulars LNJ Power Ventures Limited Bhilwara Energy Limited LNJSkills&Rozgar Private
Limited
As at March 31, 2018
As at March 31, 2017
As at March 31, 2018
As at March 31, 2017
As at March 31, 2018
Current assets 1,132.74 1,812.90 36,609.29 36,734.77 623.76 Non-current assets 9,245.84 9,746.21 200,808.73 251,700.16 219.49 Current liabilities 1,528.38 1,715.77 13,251.89 24,853.96 273.60 Non-current liabilities 9,142.49 9,654.91 90,736.09 139,391.11 4.05 Net Assets (including non controlling interest) (292.29) 188.43 133,430.04 124,189.86 565.60 Less: Non controlling Interest - - 55,909.07 51,039.73 - Net Assets (Net off non controlling Interest) (292.29) 188.43 77,520.97 73,150.13 565.60 Share of RSWM Limited * (76.00) 48.99 13,783.23 13,006.09 749.02
* The carrying amount of investments in LNJ Skills & Rozgar Private Limited includes H519.05 Lakhs (Previous Year Nil) towards Goodwill.
b) As per the decision of Board of Chango Yang Thang Hydro Power Limited (CYHPL), a subsidiary of Associate (BEL), CYHPL has filed an application to Government of Himachal Pradesh for surrendering the 180 MW project vide letter dated 11th July, 2017 and demanded a refund of upfront premium of H3,789.45 Lakhs and security deposit paid of H180.00 Lakhs. The management of the CYHPL has again reaffirmed on 16th February, 2018 to the authorities and is expecting a refund of H3,969.45 Lakhs. Further, H2,713.18 Lakhs of capital work in progress have been written off during the year by CYHPL.
Notes to the Consolidated Financial Statement for the year ended March 31, 2018
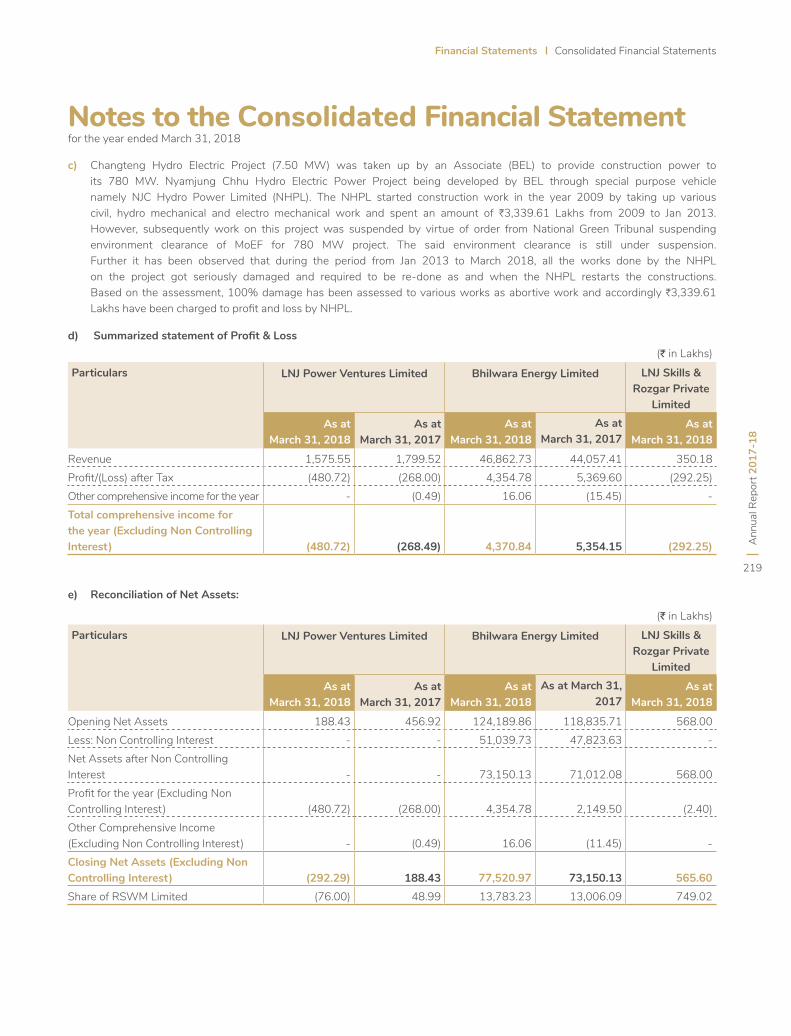
Ann
ual R
epor
t 201
7-18
219
Financial Statements Consolidated Financial Statements
(J in Lakhs)
Particulars LNJ Power Ventures Limited Bhilwara Energy Limited LNJSkills&Rozgar Private
Limited
As at March 31, 2018
As at March 31, 2017
As at March 31, 2018
As at March 31, 2017
As at March 31, 2018
Opening Net Assets 188.43 456.92 124,189.86 118,835.71 568.00 Less: Non Controlling Interest - - 51,039.73 47,823.63 - Net Assets after Non Controlling Interest - - 73,150.13 71,012.08 568.00 Profit for the year (Excluding Non Controlling Interest) (480.72) (268.00) 4,354.78 2,149.50 (2.40)Other Comprehensive Income (Excluding Non Controlling Interest) - (0.49) 16.06 (11.45) - Closing Net Assets (Excluding Non Controlling Interest) (292.29) 188.43 77,520.97 73,150.13 565.60 Share of RSWM Limited (76.00) 48.99 13,783.23 13,006.09 749.02
(J in Lakhs)
Particulars LNJ Power Ventures Limited Bhilwara Energy Limited LNJSkills&Rozgar Private
Limited
As at March 31, 2018
As at March 31, 2017
As at March 31, 2018
As at March 31, 2017
As at March 31, 2018
Revenue 1,575.55 1,799.52 46,862.73 44,057.41 350.18 Profit/(Loss) after Tax (480.72) (268.00) 4,354.78 5,369.60 (292.25)Other comprehensive income for the year - (0.49) 16.06 (15.45) - Total comprehensive income for the year (Excluding Non Controlling Interest) (480.72) (268.49) 4,370.84 5,354.15 (292.25)
c) Changteng Hydro Electric Project (7.50 MW) was taken up by an Associate (BEL) to provide construction power to its 780 MW. Nyamjung Chhu Hydro Electric Power Project being developed by BEL through special purpose vehicle namely NJC Hydro Power Limited (NHPL). The NHPL started construction work in the year 2009 by taking up various civil, hydro mechanical and electro mechanical work and spent an amount of H3,339.61 Lakhs from 2009 to Jan 2013. However, subsequently work on this project was suspended by virtue of order from National Green Tribunal suspending environment clearance of MoEF for 780 MW project. The said environment clearance is still under suspension. Further it has been observed that during the period from Jan 2013 to March 2018, all the works done by the NHPL on the project got seriously damaged and required to be re-done as and when the NHPL restarts the constructions. Based on the assessment, 100% damage has been assessed to various works as abortive work and accordingly H3,339.61 Lakhs have been charged to profit and loss by NHPL.
d) SummarizedstatementofProfit&Loss
e) Reconciliation of Net Assets:
Notes to the Consolidated Financial Statement for the year ended March 31, 2018
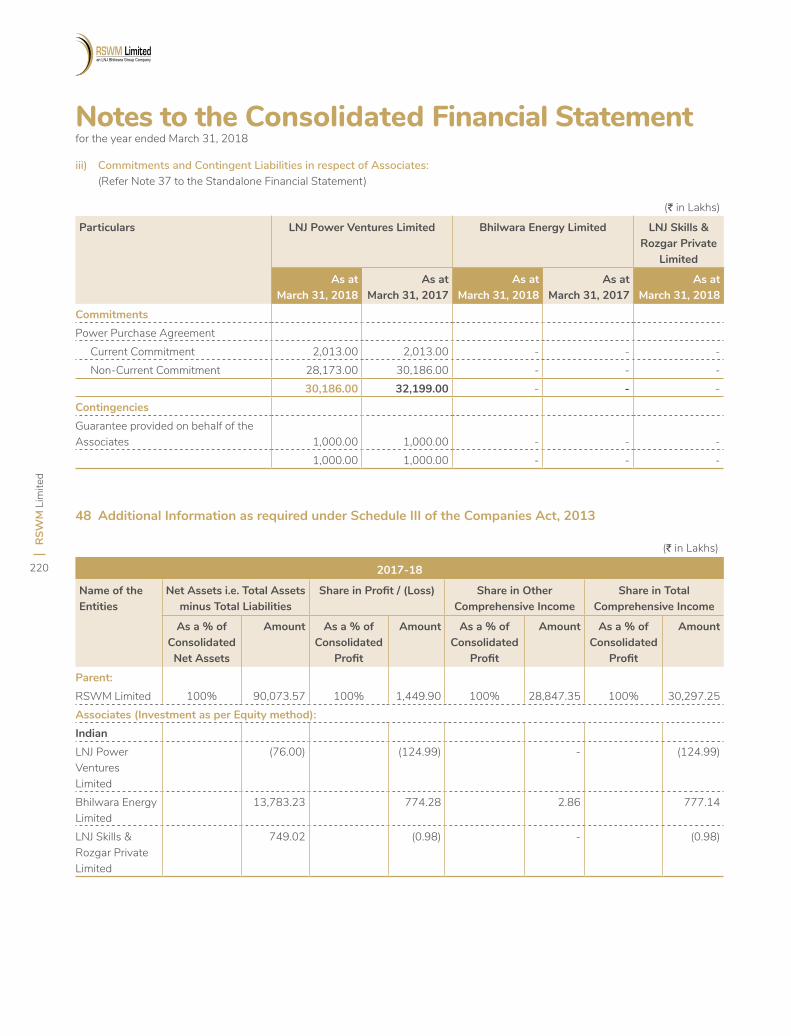
RSW
M L
imite
d
220
48 Additional Information as required under Schedule III of the Companies Act, 2013
iii) Commitments and Contingent Liabilities in respect of Associates:(Refer Note 37 to the Standalone Financial Statement)
(J in Lakhs)
Particulars LNJ Power Ventures Limited Bhilwara Energy Limited LNJSkills&Rozgar Private
Limited
As at March 31, 2018
As at March 31, 2017
As at March 31, 2018
As at March 31, 2017
As at March 31, 2018
CommitmentsPower Purchase Agreement Current Commitment 2,013.00 2,013.00 - - - Non-Current Commitment 28,173.00 30,186.00 - - -
30,186.00 32,199.00 - - - ContingenciesGuarantee provided on behalf of the Associates 1,000.00 1,000.00 - - -
1,000.00 1,000.00 - - -
(J in Lakhs)
2017-18
Name of the Entities
Net Assets i.e. Total Assets minus Total Liabilities
ShareinProfit/(Loss) Share in Other Comprehensive Income
Share in Total Comprehensive Income
As a % of Consolidated Net Assets
Amount As a % of Consolidated
Profit
Amount As a % of Consolidated
Profit
Amount As a % of Consolidated
Profit
Amount
Parent:RSWM Limited 100% 90,073.57 100% 1,449.90 100% 28,847.35 100% 30,297.25 Associates (Investment as per Equity method):IndianLNJ Power Ventures Limited
(76.00) (124.99) - (124.99)
Bhilwara Energy Limited
13,783.23 774.28 2.86 777.14
LNJ Skills & Rozgar Private Limited
749.02 (0.98) - (0.98)
Notes to the Consolidated Financial Statement for the year ended March 31, 2018
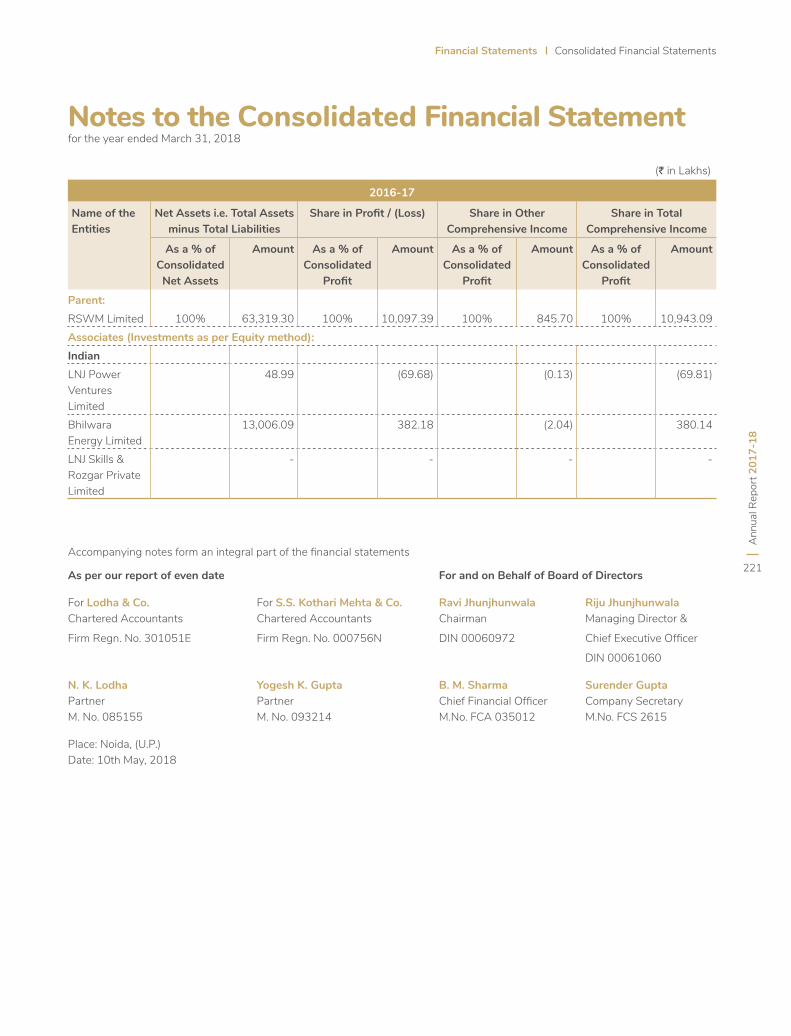
Ann
ual R
epor
t 201
7-18
221
Financial Statements Consolidated Financial Statements
(J in Lakhs)
2016-17
Name of the Entities
Net Assets i.e. Total Assets minus Total Liabilities
ShareinProfit/(Loss) Share in Other Comprehensive Income
Share in Total Comprehensive Income
As a % of Consolidated Net Assets
Amount As a % of Consolidated
Profit
Amount As a % of Consolidated
Profit
Amount As a % of Consolidated
Profit
Amount
Parent:RSWM Limited 100% 63,319.30 100% 10,097.39 100% 845.70 100% 10,943.09 Associates (Investments as per Equity method):IndianLNJ Power Ventures Limited
48.99 (69.68) (0.13) (69.81)
Bhilwara Energy Limited
13,006.09 382.18 (2.04) 380.14
LNJ Skills & Rozgar Private Limited
- - - -
Notes to the Consolidated Financial Statement for the year ended March 31, 2018
Accompanying notes form an integral part of the financial statements
As per our report of even date For and on Behalf of Board of Directors
For Lodha & Co. For S.S. Kothari Mehta & Co. Ravi Jhunjhunwala Riju JhunjhunwalaChartered Accountants Chartered Accountants Chairman Managing Director &
Firm Regn. No. 301051E Firm Regn. No. 000756N DIN 00060972 Chief Executive Officer
DIN 00061060
N. K. Lodha Yogesh K. Gupta B. M. Sharma Surender GuptaPartner Partner Chief Financial Officer Company SecretaryM. No. 085155 M. No. 093214 M.No. FCA 035012 M.No. FCS 2615
Place: Noida, (U.P.)Date: 10th May, 2018

Notes:

Notes:

Notes:


Registered Office
Kharigram, P.O. Gulabpura - 311 021
Dist. Bhilwara (Rajasthan), India
Website: www.rswm.in/www.lnjbhilwara.com
CIN: L17115RJ1960PLC008216
a K&
A cr
eatio
n |
ww
w.ka
lolw
ala.
co.in