Embed Size (px)
Citation preview
WF116290 00000 01
RTA Employees Defined Contribution
Plan & Trust
Period Ending September 30, 2014
FOR INSTITUTIONAL USE ONLY − NOT FOR USE WITH INDIVIDUAL INVESTORS
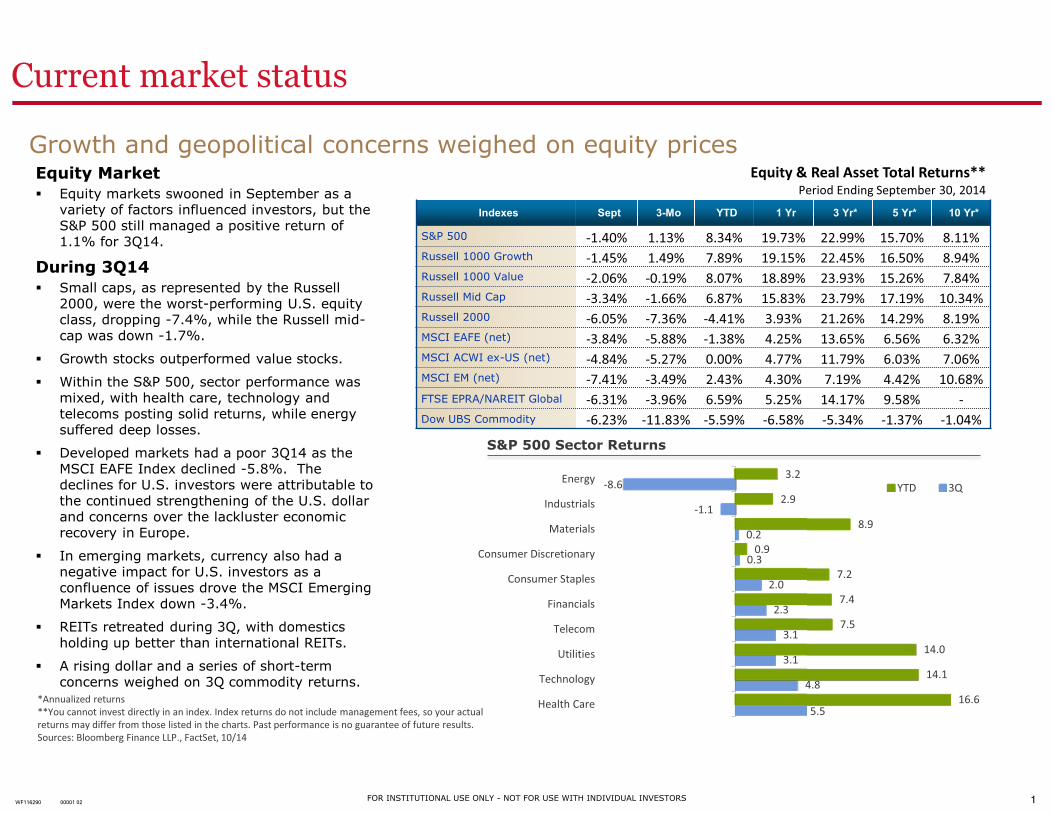
Equity MarketEquity markets swooned in September as avariety of factors influenced investors, but theS&P 500 still managed a positive return of1.1% for 3Q14.
During 3Q14Small caps, as represented by the Russell2000, were the worst-performing U.S. equityclass, dropping -7.4%, while the Russell mid-cap was down -1.7%.
Growth stocks outperformed value stocks.
Within the S&P 500, sector performance wasmixed, with health care, technology andtelecoms posting solid returns, while energysuffered deep losses.
Developed markets had a poor 3Q14 as theMSCI EAFE Index declined -5.8%. Thedeclines for U.S. investors were attributable tothe continued strengthening of the U.S. dollarand concerns over the lackluster economicrecovery in Europe.
In emerging markets, currency also had anegative impact for U.S. investors as aconfluence of issues drove the MSCI EmergingMarkets Index down -3.4%.
REITs retreated during 3Q, with domesticsholding up better than international REITs.
A rising dollar and a series of short-termconcerns weighed on 3Q commodity returns.
Growth and geopolitical concerns weighed on equity prices
5.5
4.8
3.1
3.1
2.3
2.0
0.3
0.2
-1.1
-8.6
16.6
14.1
14.0
7.5
7.4
7.2
0.9
8.9
2.9
3.2
Health Care
Technology
Utilities
Telecom
Financials
Consumer Staples
Consumer Discretionary
Materials
Industrials
EnergyYTD 3Q
S&P 500 Sector Returns
*Annualized returns**You cannot invest directly in an index. Index returns do not include management fees, so your actualreturns may differ from those listed in the charts. Past performance is no guarantee of future results.Sources: Bloomberg Finance LLP., FactSet, 10/14
Indexes Sept 3-Mo YTD 1 Yr 3 Yr* 5 Yr* 10 Yr*
S&P 500 -1.40% 1.13% 8.34% 19.73% 22.99% 15.70% 8.11%Russell 1000 Growth -1.45% 1.49% 7.89% 19.15% 22.45% 16.50% 8.94%Russell 1000 Value -2.06% -0.19% 8.07% 18.89% 23.93% 15.26% 7.84%Russell Mid Cap -3.34% -1.66% 6.87% 15.83% 23.79% 17.19% 10.34%Russell 2000 -6.05% -7.36% -4.41% 3.93% 21.26% 14.29% 8.19%MSCI EAFE (net) -3.84% -5.88% -1.38% 4.25% 13.65% 6.56% 6.32%MSCI ACWI ex-US (net) -4.84% -5.27% 0.00% 4.77% 11.79% 6.03% 7.06%MSCI EM (net) -7.41% -3.49% 2.43% 4.30% 7.19% 4.42% 10.68%FTSE EPRA/NAREIT Global -6.31% -3.96% 6.59% 5.25% 14.17% 9.58% -Dow UBS Commodity -6.23% -11.83% -5.59% -6.58% -5.34% -1.37% -1.04%
Equity & Real Asset Total Returns**Period Ending September 30, 2014
Current market status
1FOR INSTITUTIONAL USE ONLY − NOT FOR USE WITH INDIVIDUAL INVESTORSWF116290 00001 02
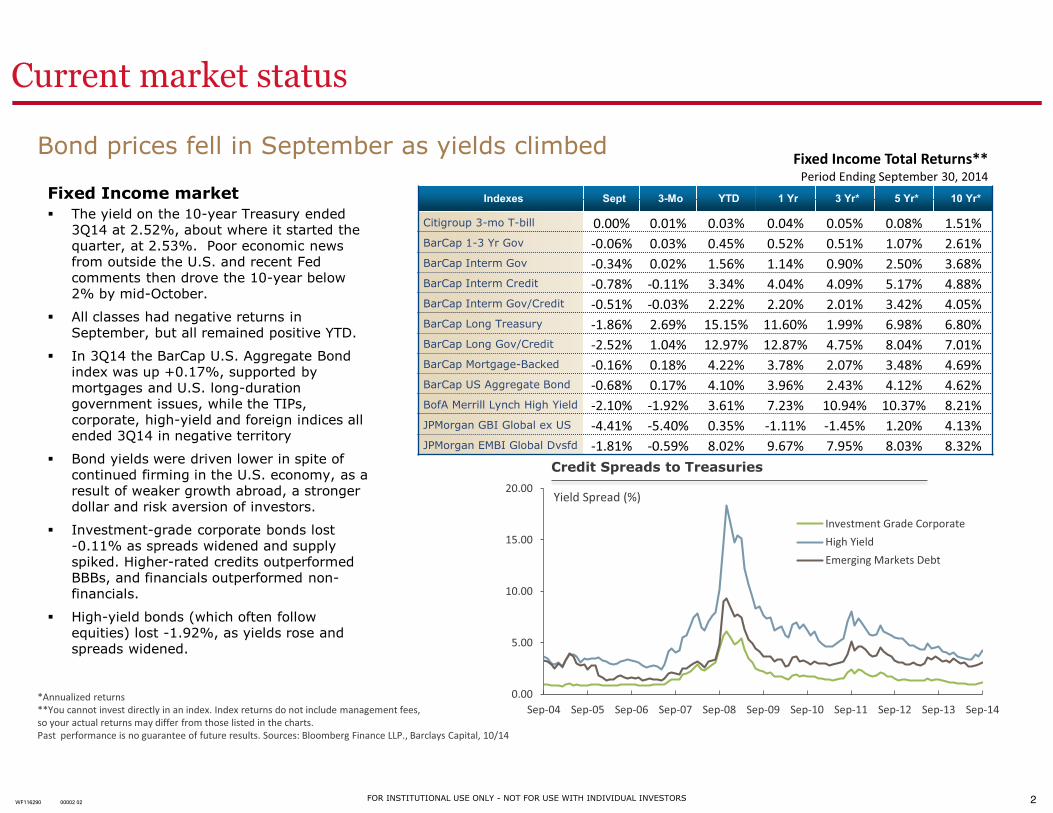
Fixed Income marketThe yield on the 10-year Treasury ended3Q14 at 2.52%, about where it started thequarter, at 2.53%. Poor economic newsfrom outside the U.S. and recent Fedcomments then drove the 10-year below2% by mid-October.
All classes had negative returns inSeptember, but all remained positive YTD.
In 3Q14 the BarCap U.S. Aggregate Bondindex was up +0.17%, supported bymortgages and U.S. long-durationgovernment issues, while the TIPs,corporate, high-yield and foreign indices allended 3Q14 in negative territory
Bond yields were driven lower in spite ofcontinued firming in the U.S. economy, as aresult of weaker growth abroad, a strongerdollar and risk aversion of investors.
Investment-grade corporate bonds lost-0.11% as spreads widened and supplyspiked. Higher-rated credits outperformedBBBs, and financials outperformed non-financials.
High-yield bonds (which often followequities) lost -1.92%, as yields rose andspreads widened.
Bond prices fell in September as yields climbed
Yield Spread (%)
0.00
5.00
10.00
15.00
20.00
Sep-04 Sep-05 Sep-06 Sep-07 Sep-08 Sep-09 Sep-10 Sep-11 Sep-12 Sep-13 Sep-14
Investment Grade CorporateHigh YieldEmerging Markets Debt
Credit Spreads to Treasuries
*Annualized returns**You cannot invest directly in an index. Index returns do not include management fees,so your actual returns may differ from those listed in the charts.Past performance is no guarantee of future results. Sources: Bloomberg Finance LLP., Barclays Capital, 10/14
Indexes Sept 3-Mo YTD 1 Yr 3 Yr* 5 Yr* 10 Yr*
Citigroup 3-mo T-bill 0.00% 0.01% 0.03% 0.04% 0.05% 0.08% 1.51%BarCap 1-3 Yr Gov -0.06% 0.03% 0.45% 0.52% 0.51% 1.07% 2.61%BarCap Interm Gov -0.34% 0.02% 1.56% 1.14% 0.90% 2.50% 3.68%BarCap Interm Credit -0.78% -0.11% 3.34% 4.04% 4.09% 5.17% 4.88%BarCap Interm Gov/Credit -0.51% -0.03% 2.22% 2.20% 2.01% 3.42% 4.05%BarCap Long Treasury -1.86% 2.69% 15.15% 11.60% 1.99% 6.98% 6.80%BarCap Long Gov/Credit -2.52% 1.04% 12.97% 12.87% 4.75% 8.04% 7.01%BarCap Mortgage-Backed -0.16% 0.18% 4.22% 3.78% 2.07% 3.48% 4.69%BarCap US Aggregate Bond -0.68% 0.17% 4.10% 3.96% 2.43% 4.12% 4.62%BofA Merrill Lynch High Yield -2.10% -1.92% 3.61% 7.23% 10.94% 10.37% 8.21%JPMorgan GBI Global ex US -4.41% -5.40% 0.35% -1.11% -1.45% 1.20% 4.13%JPMorgan EMBI Global Dvsfd -1.81% -0.59% 8.02% 9.67% 7.95% 8.03% 8.32%
Fixed Income Total Returns**Period Ending September 30, 2014
Current market status
2FOR INSTITUTIONAL USE ONLY − NOT FOR USE WITH INDIVIDUAL INVESTORSWF116290 00002 02
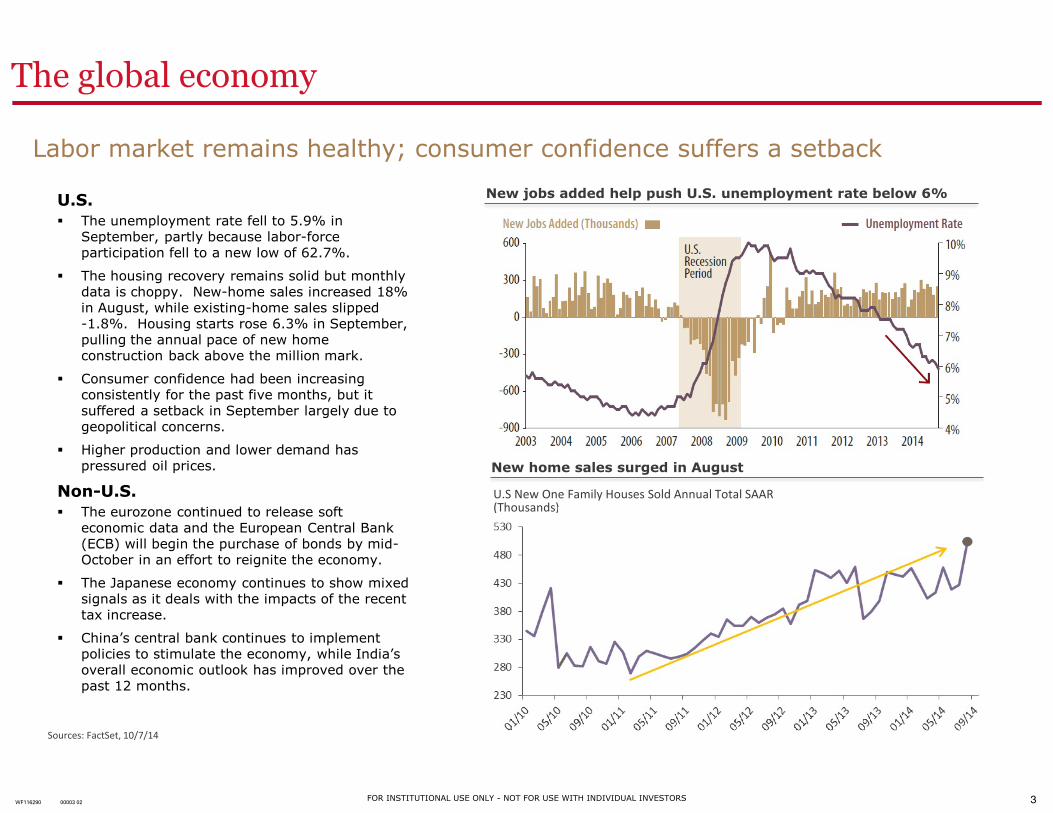
U.S.The unemployment rate fell to 5.9% inSeptember, partly because labor-forceparticipation fell to a new low of 62.7%.
The housing recovery remains solid but monthlydata is choppy. New-home sales increased 18%in August, while existing-home sales slipped-1.8%. Housing starts rose 6.3% in September,pulling the annual pace of new homeconstruction back above the million mark.
Consumer confidence had been increasingconsistently for the past five months, but itsuffered a setback in September largely due togeopolitical concerns.
Higher production and lower demand haspressured oil prices.
Non-U.S.The eurozone continued to release softeconomic data and the European Central Bank(ECB) will begin the purchase of bonds by mid-October in an effort to reignite the economy.
The Japanese economy continues to show mixedsignals as it deals with the impacts of the recenttax increase.
China’s central bank continues to implementpolicies to stimulate the economy, while India’soverall economic outlook has improved over thepast 12 months.
Labor market remains healthy; consumer confidence suffers a setback
Sources: FactSet, 10/7/14
New home sales surged in Augustg g
U.S New One Family Houses Sold Annual Total SAAR(Thousands)(Thousands)
New jobs added help push U.S. unemployment rate below 6%
The global economy
3FOR INSTITUTIONAL USE ONLY − NOT FOR USE WITH INDIVIDUAL INVESTORSWF116290 00003 02
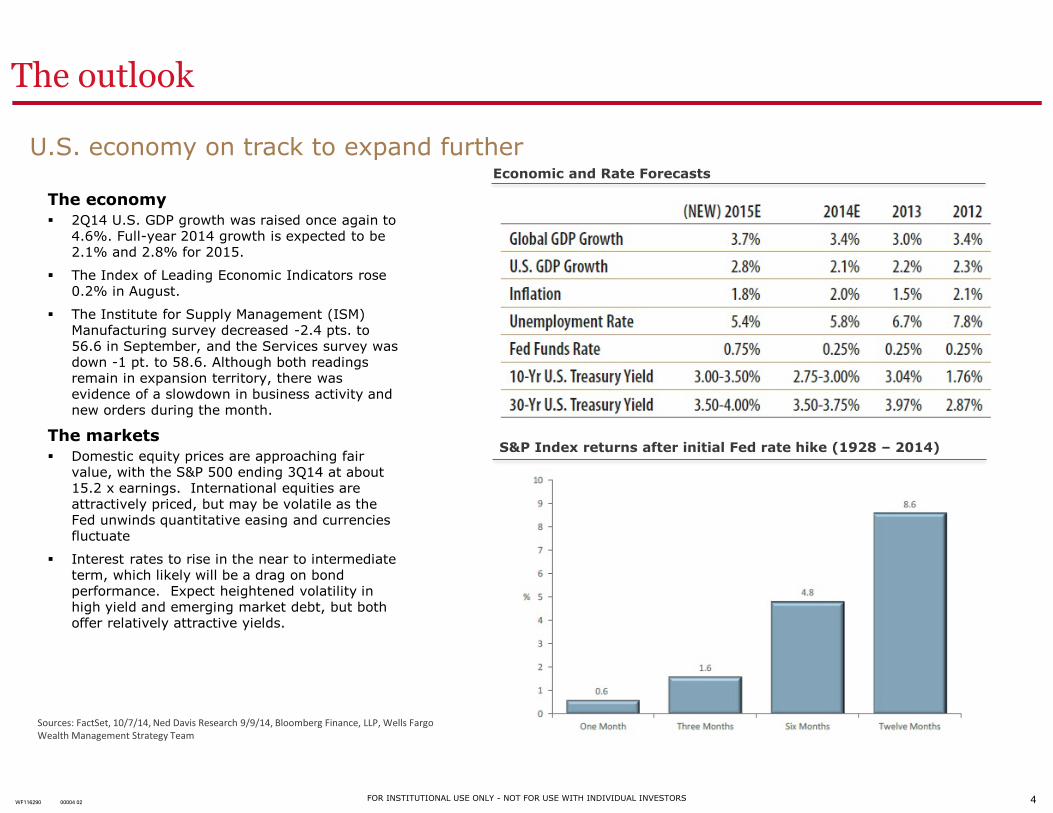
The economy2Q14 U.S. GDP growth was raised once again to4.6%. Full-year 2014 growth is expected to be2.1% and 2.8% for 2015.
The Index of Leading Economic Indicators rose0.2% in August.
The Institute for Supply Management (ISM)Manufacturing survey decreased -2.4 pts. to56.6 in September, and the Services survey wasdown -1 pt. to 58.6. Although both readingsremain in expansion territory, there wasevidence of a slowdown in business activity andnew orders during the month.
The marketsDomestic equity prices are approaching fairvalue, with the S&P 500 ending 3Q14 at about15.2 x earnings. International equities areattractively priced, but may be volatile as theFed unwinds quantitative easing and currenciesfluctuate
Interest rates to rise in the near to intermediateterm, which likely will be a drag on bondperformance. Expect heightened volatility inhigh yield and emerging market debt, but bothoffer relatively attractive yields.
U.S. economy on track to expand furtherEconomic and Rate Forecasts
S&P Index returns after initial Fed rate hike (1928 – 2014)
Sources: FactSet, 10/7/14, Ned Davis Research 9/9/14, Bloomberg Finance, LLP, Wells FargoWealth Management Strategy Team
The outlook
4FOR INSTITUTIONAL USE ONLY − NOT FOR USE WITH INDIVIDUAL INVESTORSWF116290 00004 02
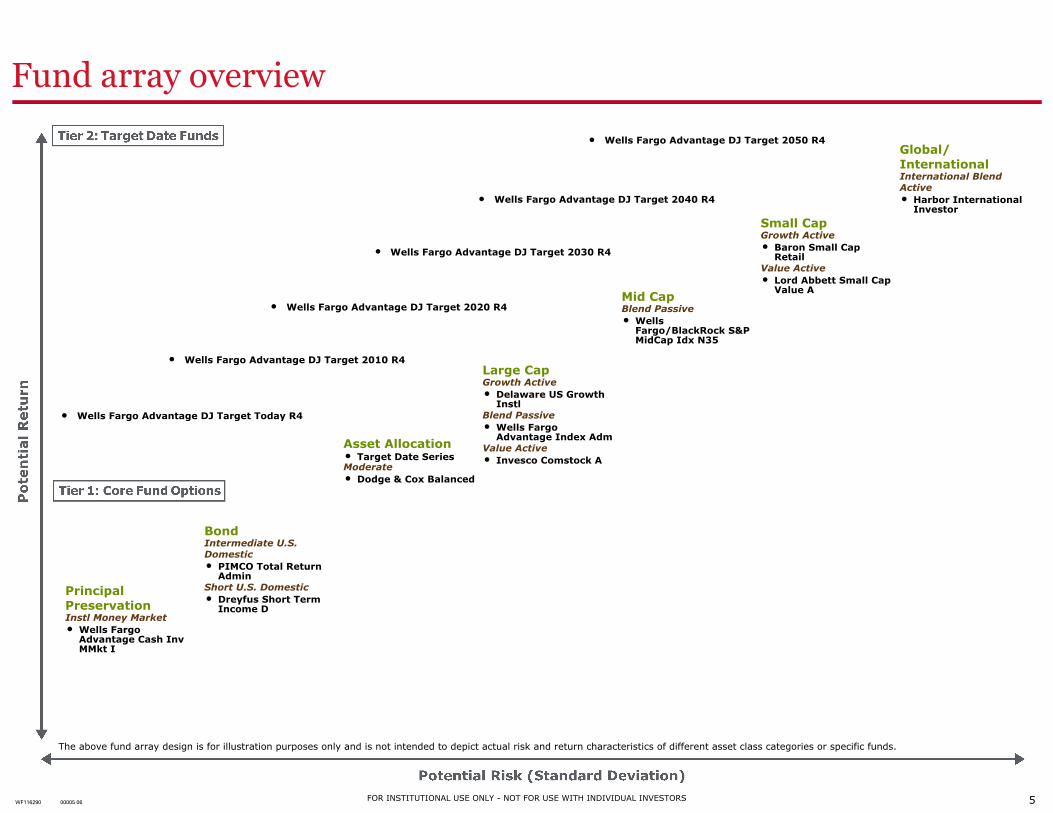
The above fund array design is for illustration purposes only and is not intended to depict actual risk and return characteristics of different asset class categories or specific funds.
Fund array overview
¬ Wells Fargo Advantage DJ Target 2050 R4
¬ Wells Fargo Advantage DJ Target 2040 R4
¬ Wells Fargo Advantage DJ Target 2030 R4
¬ Wells Fargo Advantage DJ Target 2020 R4
¬ Wells Fargo Advantage DJ Target 2010 R4
¬ Wells Fargo Advantage DJ Target Today R4
Global/InternationalInternational BlendActive¬ Harbor International
Investor
Small CapGrowth Active¬ Baron Small Cap
RetailValue Active¬ Lord Abbett Small Cap
Value AMid CapBlend Passive¬ Wells
Fargo/BlackRock S&PMidCap Idx N35
Large CapGrowth Active¬ Delaware US Growth
InstlBlend Passive¬ Wells Fargo
Advantage Index AdmValue Active¬ Invesco Comstock A
Asset Allocation¬ Target Date SeriesModerate¬ Dodge & Cox Balanced
BondIntermediate U.S.Domestic¬ PIMCO Total Return
AdminShort U.S. Domestic¬ Dreyfus Short Term
Income D
PrincipalPreservationInstl Money Market¬ Wells Fargo
Advantage Cash InvMMkt I
5FOR INSTITUTIONAL USE ONLY − NOT FOR USE WITH INDIVIDUAL INVESTORSWF116290 00005 06
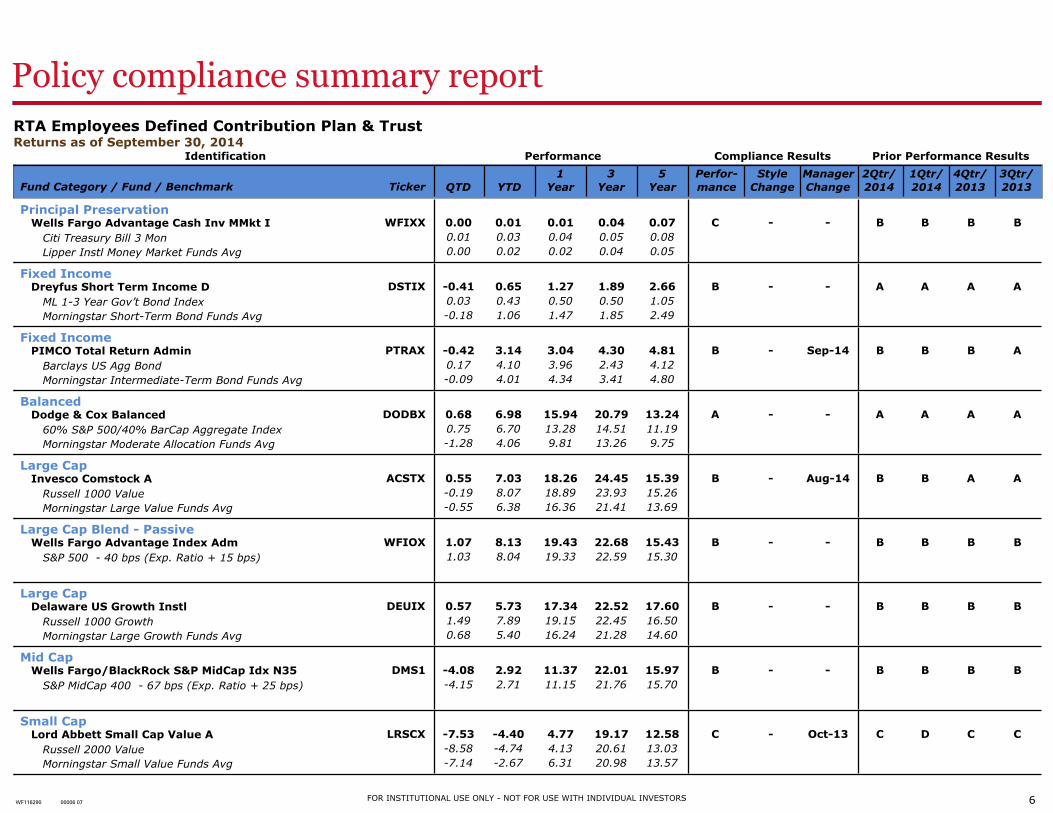
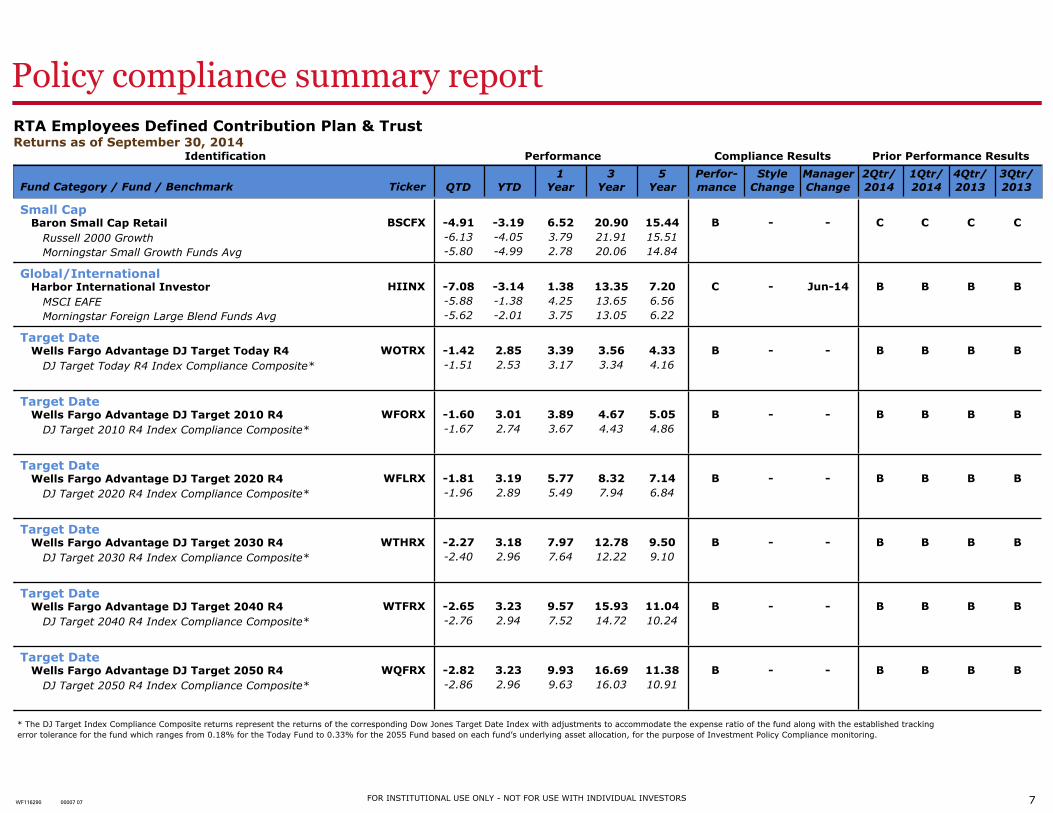
Policy compliance summary report
RTA Employees Defined Contribution Plan & TrustReturns as of September 30, 2014
Identification Performance Compliance Results Prior Performance Results
1 3 5 Perfor− Style Manager 2Qtr/ 1Qtr/ 4Qtr/ 3Qtr/Fund Category / Fund / Benchmark Ticker QTD YTD Year Year Year mance Change Change 2014 2014 2013 2013
Principal PreservationWFIXX 0.00 0.01 0.01 0.04 0.07 C − − B B B BWells Fargo Advantage Cash Inv MMkt I
0.01 0.03 0.04 0.05 0.08Citi Treasury Bill 3 Mon0.00 0.02 0.02 0.04 0.05Lipper Instl Money Market Funds Avg
Fixed IncomeDSTIX −0.41 0.65 1.27 1.89 2.66 B − − A A A ADreyfus Short Term Income D
0.03 0.43 0.50 0.50 1.05ML 1−3 Year Gov’t Bond Index−0.18 1.06 1.47 1.85 2.49Morningstar Short−Term Bond Funds Avg
Fixed IncomePTRAX −0.42 3.14 3.04 4.30 4.81 B − Sep−14 B B B APIMCO Total Return Admin
0.17 4.10 3.96 2.43 4.12Barclays US Agg Bond−0.09 4.01 4.34 3.41 4.80Morningstar Intermediate−Term Bond Funds Avg
BalancedDODBX 0.68 6.98 15.94 20.79 13.24 A − − A A A ADodge & Cox Balanced
0.75 6.70 13.28 14.51 11.1960% S&P 500/40% BarCap Aggregate Index−1.28 4.06 9.81 13.26 9.75Morningstar Moderate Allocation Funds Avg
Large CapACSTX 0.55 7.03 18.26 24.45 15.39 B − Aug−14 B B A AInvesco Comstock A
−0.19 8.07 18.89 23.93 15.26Russell 1000 Value−0.55 6.38 16.36 21.41 13.69Morningstar Large Value Funds Avg
Large Cap Blend − PassiveWFIOX 1.07 8.13 19.43 22.68 15.43 B − − B B B BWells Fargo Advantage Index Adm
1.03 8.04 19.33 22.59 15.30S&P 500 − 40 bps (Exp. Ratio + 15 bps)
Large CapDEUIX 0.57 5.73 17.34 22.52 17.60 B − − B B B BDelaware US Growth Instl
1.49 7.89 19.15 22.45 16.50Russell 1000 Growth0.68 5.40 16.24 21.28 14.60Morningstar Large Growth Funds Avg
Mid CapDMS1 −4.08 2.92 11.37 22.01 15.97 B − − B B B BWells Fargo/BlackRock S&P MidCap Idx N35
−4.15 2.71 11.15 21.76 15.70S&P MidCap 400 − 67 bps (Exp. Ratio + 25 bps)
Small CapLRSCX −7.53 −4.40 4.77 19.17 12.58 C − Oct−13 C D C CLord Abbett Small Cap Value A
−8.58 −4.74 4.13 20.61 13.03Russell 2000 Value−7.14 −2.67 6.31 20.98 13.57Morningstar Small Value Funds Avg
6FOR INSTITUTIONAL USE ONLY − NOT FOR USE WITH INDIVIDUAL INVESTORSWF116290 00006 07
Policy compliance summary report
RTA Employees Defined Contribution Plan & TrustReturns as of September 30, 2014
Identification Performance Compliance Results Prior Performance Results
1 3 5 Perfor− Style Manager 2Qtr/ 1Qtr/ 4Qtr/ 3Qtr/Fund Category / Fund / Benchmark Ticker QTD YTD Year Year Year mance Change Change 2014 2014 2013 2013
Small CapBSCFX −4.91 −3.19 6.52 20.90 15.44 B − − C C C CBaron Small Cap Retail
−6.13 −4.05 3.79 21.91 15.51Russell 2000 Growth−5.80 −4.99 2.78 20.06 14.84Morningstar Small Growth Funds Avg
Global/InternationalHIINX −7.08 −3.14 1.38 13.35 7.20 C − Jun−14 B B B BHarbor International Investor
−5.88 −1.38 4.25 13.65 6.56MSCI EAFE−5.62 −2.01 3.75 13.05 6.22Morningstar Foreign Large Blend Funds Avg
Target DateWOTRX −1.42 2.85 3.39 3.56 4.33 B − − B B B BWells Fargo Advantage DJ Target Today R4
−1.51 2.53 3.17 3.34 4.16DJ Target Today R4 Index Compliance Composite*
Target DateWFORX −1.60 3.01 3.89 4.67 5.05 B − − B B B BWells Fargo Advantage DJ Target 2010 R4
−1.67 2.74 3.67 4.43 4.86DJ Target 2010 R4 Index Compliance Composite*
Target DateWFLRX −1.81 3.19 5.77 8.32 7.14 B − − B B B BWells Fargo Advantage DJ Target 2020 R4
−1.96 2.89 5.49 7.94 6.84DJ Target 2020 R4 Index Compliance Composite*
Target DateWTHRX −2.27 3.18 7.97 12.78 9.50 B − − B B B BWells Fargo Advantage DJ Target 2030 R4
−2.40 2.96 7.64 12.22 9.10DJ Target 2030 R4 Index Compliance Composite*
Target DateWTFRX −2.65 3.23 9.57 15.93 11.04 B − − B B B BWells Fargo Advantage DJ Target 2040 R4
−2.76 2.94 7.52 14.72 10.24DJ Target 2040 R4 Index Compliance Composite*
Target DateWQFRX −2.82 3.23 9.93 16.69 11.38 B − − B B B BWells Fargo Advantage DJ Target 2050 R4
−2.86 2.96 9.63 16.03 10.91DJ Target 2050 R4 Index Compliance Composite*
* The DJ Target Index Compliance Composite returns represent the returns of the corresponding Dow Jones Target Date Index with adjustments to accommodate the expense ratio of the fund along with the established trackingerror tolerance for the fund which ranges from 0.18% for the Today Fund to 0.33% for the 2055 Fund based on each fund’s underlying asset allocation, for the purpose of Investment Policy Compliance monitoring.
7FOR INSTITUTIONAL USE ONLY − NOT FOR USE WITH INDIVIDUAL INVESTORSWF116290 00007 07
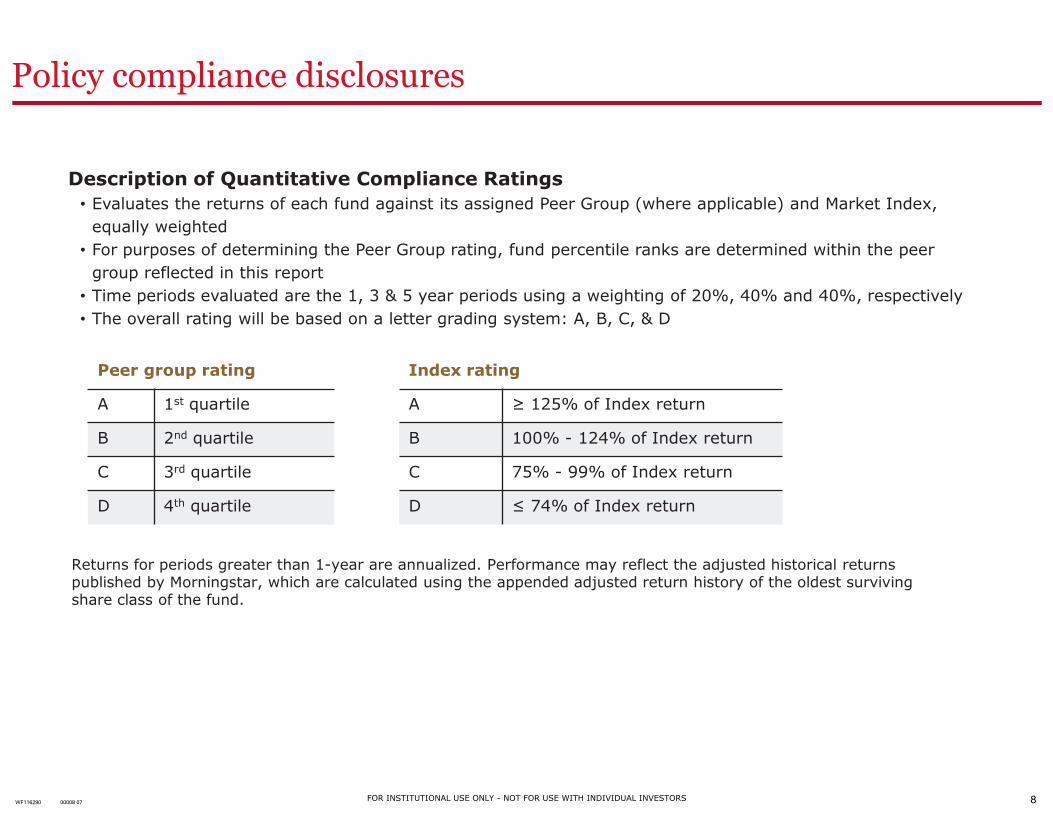
Description of Quantitative Compliance Ratings• Evaluates the returns of each fund against its assigned Peer Group (where applicable) and Market Index,
equally weighted• For purposes of determining the Peer Group rating, fund percentile ranks are determined within the peer
group reflected in this report• Time periods evaluated are the 1, 3 & 5 year periods using a weighting of 20%, 40% and 40%, respectively• The overall rating will be based on a letter grading system: A, B, C, & D
Peer group rating
A 1st quartile
B 2nd quartile
C 3rd quartile
D 4th quartile
Index rating
A ≥ 125% of Index return
B 100% - 124% of Index return
C 75% - 99% of Index return
D ≤ 74% of Index return
Returns for periods greater than 1-year are annualized. Performance may reflect the adjusted historical returnspublished by Morningstar, which are calculated using the appended adjusted return history of the oldest survivingshare class of the fund.
Policy compliance disclosures
8FOR INSTITUTIONAL USE ONLY − NOT FOR USE WITH INDIVIDUAL INVESTORSWF116290 00008 07
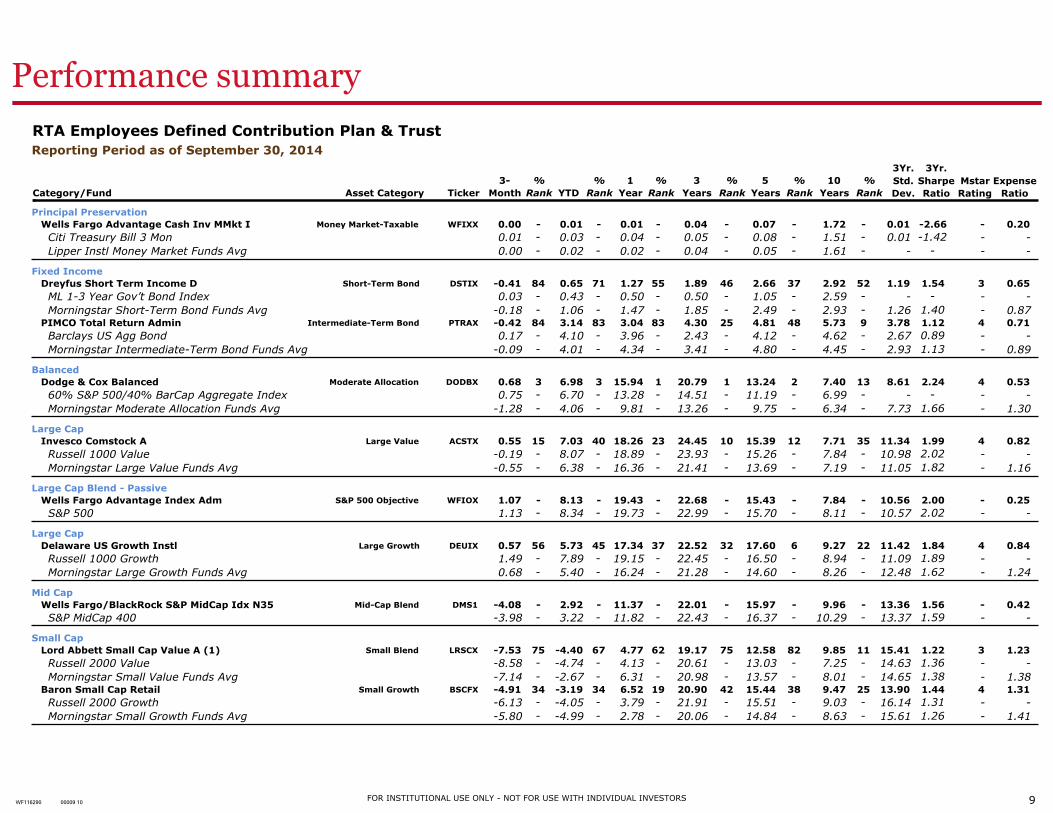
Performance summary
RTA Employees Defined Contribution Plan & TrustReporting Period as of September 30, 2014
3Yr. 3Yr.3− % % 1 % 3 % 5 % 10 % Std. Sharpe Mstar Expense
Category/Fund Asset Category Ticker Month Rank YTD Rank Year Rank Years Rank Years Rank Years Rank Dev. Ratio Rating Ratio
Principal PreservationWells Fargo Advantage Cash Inv MMkt I 0.00 − 0.01 − 0.01 − 0.04 − 0.07 − 1.72 − 0.01 −2.66 − 0.20Money Market−Taxable WFIXX
− − − − − − −1.42Citi Treasury Bill 3 Mon 0.01 0.03 0.04 0.05 0.08 1.51 0.01 − −− − − − − − −Lipper Instl Money Market Funds Avg 0.00 0.02 0.02 0.04 0.05 1.61 − − −
Fixed IncomeDreyfus Short Term Income D −0.41 84 0.65 71 1.27 55 1.89 46 2.66 37 2.92 52 1.19 1.54 3 0.65Short−Term Bond DSTIX
− − − − − − −ML 1−3 Year Gov’t Bond Index 0.03 0.43 0.50 0.50 1.05 2.59 − − −− − − − − − 1.40Morningstar Short−Term Bond Funds Avg −0.18 1.06 1.47 1.85 2.49 2.93 1.26 − 0.87
PIMCO Total Return Admin −0.42 84 3.14 83 3.04 83 4.30 25 4.81 48 5.73 9 3.78 1.12 4 0.71Intermediate−Term Bond PTRAX
− − − − − − 0.89Barclays US Agg Bond 0.17 4.10 3.96 2.43 4.12 4.62 2.67 − −− − − − − − 1.13Morningstar Intermediate−Term Bond Funds Avg −0.09 4.01 4.34 3.41 4.80 4.45 2.93 − 0.89
BalancedDodge & Cox Balanced 0.68 3 6.98 3 15.94 1 20.79 1 13.24 2 7.40 13 8.61 2.24 4 0.53Moderate Allocation DODBX
− − − − − − −60% S&P 500/40% BarCap Aggregate Index 0.75 6.70 13.28 14.51 11.19 6.99 − − −− − − − − − 1.66Morningstar Moderate Allocation Funds Avg −1.28 4.06 9.81 13.26 9.75 6.34 7.73 − 1.30
Large CapInvesco Comstock A 0.55 15 7.03 40 18.26 23 24.45 10 15.39 12 7.71 35 11.34 1.99 4 0.82Large Value ACSTX
− − − − − − 2.02Russell 1000 Value −0.19 8.07 18.89 23.93 15.26 7.84 10.98 − −− − − − − − 1.82Morningstar Large Value Funds Avg −0.55 6.38 16.36 21.41 13.69 7.19 11.05 − 1.16
Large Cap Blend − PassiveWells Fargo Advantage Index Adm 1.07 − 8.13 − 19.43 − 22.68 − 15.43 − 7.84 − 10.56 2.00 − 0.25S&P 500 Objective WFIOX
− − − − − − 2.02S&P 500 1.13 8.34 19.73 22.99 15.70 8.11 10.57 − −
Large CapDelaware US Growth Instl 0.57 56 5.73 45 17.34 37 22.52 32 17.60 6 9.27 22 11.42 1.84 4 0.84Large Growth DEUIX
− − − − − − 1.89Russell 1000 Growth 1.49 7.89 19.15 22.45 16.50 8.94 11.09 − −− − − − − − 1.62Morningstar Large Growth Funds Avg 0.68 5.40 16.24 21.28 14.60 8.26 12.48 − 1.24
Mid CapWells Fargo/BlackRock S&P MidCap Idx N35 −4.08 − 2.92 − 11.37 − 22.01 − 15.97 − 9.96 − 13.36 1.56 − 0.42Mid−Cap Blend DMS1
− − − − − − 1.59S&P MidCap 400 −3.98 3.22 11.82 22.43 16.37 10.29 13.37 − −
Small CapLord Abbett Small Cap Value A (1) −7.53 75 −4.40 67 4.77 62 19.17 75 12.58 82 9.85 11 15.41 1.22 3 1.23Small Blend LRSCX
− − − − − − 1.36Russell 2000 Value −8.58 −4.74 4.13 20.61 13.03 7.25 14.63 − −− − − − − − 1.38Morningstar Small Value Funds Avg −7.14 −2.67 6.31 20.98 13.57 8.01 14.65 − 1.38
Baron Small Cap Retail −4.91 34 −3.19 34 6.52 19 20.90 42 15.44 38 9.47 25 13.90 1.44 4 1.31Small Growth BSCFX
− − − − − − 1.31Russell 2000 Growth −6.13 −4.05 3.79 21.91 15.51 9.03 16.14 − −− − − − − − 1.26Morningstar Small Growth Funds Avg −5.80 −4.99 2.78 20.06 14.84 8.63 15.61 − 1.41
9FOR INSTITUTIONAL USE ONLY − NOT FOR USE WITH INDIVIDUAL INVESTORSWF116290 00009 10
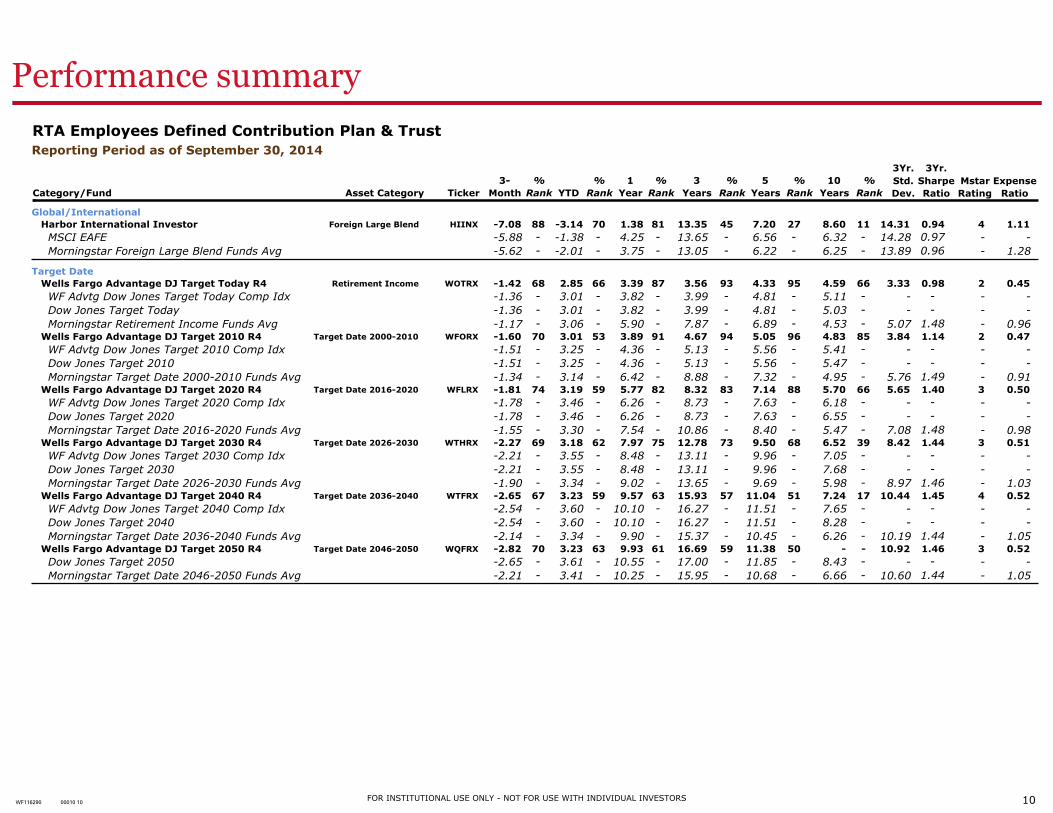
Performance summary
RTA Employees Defined Contribution Plan & TrustReporting Period as of September 30, 2014
3Yr. 3Yr.3− % % 1 % 3 % 5 % 10 % Std. Sharpe Mstar Expense
Category/Fund Asset Category Ticker Month Rank YTD Rank Year Rank Years Rank Years Rank Years Rank Dev. Ratio Rating Ratio
Global/InternationalHarbor International Investor −7.08 88 −3.14 70 1.38 81 13.35 45 7.20 27 8.60 11 14.31 0.94 4 1.11Foreign Large Blend HIINX
− − − − − − 0.97MSCI EAFE −5.88 −1.38 4.25 13.65 6.56 6.32 14.28 − −− − − − − − 0.96Morningstar Foreign Large Blend Funds Avg −5.62 −2.01 3.75 13.05 6.22 6.25 13.89 − 1.28
Target DateWells Fargo Advantage DJ Target Today R4 −1.42 68 2.85 66 3.39 87 3.56 93 4.33 95 4.59 66 3.33 0.98 2 0.45Retirement Income WOTRX
− − − − − − −WF Advtg Dow Jones Target Today Comp Idx −1.36 3.01 3.82 3.99 4.81 5.11 − − −− − − − − − −Dow Jones Target Today −1.36 3.01 3.82 3.99 4.81 5.03 − − −− − − − − − 1.48Morningstar Retirement Income Funds Avg −1.17 3.06 5.90 7.87 6.89 4.53 5.07 − 0.96
Wells Fargo Advantage DJ Target 2010 R4 −1.60 70 3.01 53 3.89 91 4.67 94 5.05 96 4.83 85 3.84 1.14 2 0.47Target Date 2000−2010 WFORX
− − − − − − −WF Advtg Dow Jones Target 2010 Comp Idx −1.51 3.25 4.36 5.13 5.56 5.41 − − −− − − − − − −Dow Jones Target 2010 −1.51 3.25 4.36 5.13 5.56 5.47 − − −− − − − − − 1.49Morningstar Target Date 2000−2010 Funds Avg −1.34 3.14 6.42 8.88 7.32 4.95 5.76 − 0.91
Wells Fargo Advantage DJ Target 2020 R4 −1.81 74 3.19 59 5.77 82 8.32 83 7.14 88 5.70 66 5.65 1.40 3 0.50Target Date 2016−2020 WFLRX
− − − − − − −WF Advtg Dow Jones Target 2020 Comp Idx −1.78 3.46 6.26 8.73 7.63 6.18 − − −− − − − − − −Dow Jones Target 2020 −1.78 3.46 6.26 8.73 7.63 6.55 − − −− − − − − − 1.48Morningstar Target Date 2016−2020 Funds Avg −1.55 3.30 7.54 10.86 8.40 5.47 7.08 − 0.98
Wells Fargo Advantage DJ Target 2030 R4 −2.27 69 3.18 62 7.97 75 12.78 73 9.50 68 6.52 39 8.42 1.44 3 0.51Target Date 2026−2030 WTHRX
− − − − − − −WF Advtg Dow Jones Target 2030 Comp Idx −2.21 3.55 8.48 13.11 9.96 7.05 − − −− − − − − − −Dow Jones Target 2030 −2.21 3.55 8.48 13.11 9.96 7.68 − − −− − − − − − 1.46Morningstar Target Date 2026−2030 Funds Avg −1.90 3.34 9.02 13.65 9.69 5.98 8.97 − 1.03
Wells Fargo Advantage DJ Target 2040 R4 −2.65 67 3.23 59 9.57 63 15.93 57 11.04 51 7.24 17 10.44 1.45 4 0.52Target Date 2036−2040 WTFRX
− − − − − − −WF Advtg Dow Jones Target 2040 Comp Idx −2.54 3.60 10.10 16.27 11.51 7.65 − − −− − − − − − −Dow Jones Target 2040 −2.54 3.60 10.10 16.27 11.51 8.28 − − −− − − − − − 1.44Morningstar Target Date 2036−2040 Funds Avg −2.14 3.34 9.90 15.37 10.45 6.26 10.19 − 1.05
Wells Fargo Advantage DJ Target 2050 R4 −2.82 70 3.23 63 9.93 61 16.69 59 11.38 50 − − 10.92 1.46 3 0.52Target Date 2046−2050 WQFRX
− − − − − − −Dow Jones Target 2050 −2.65 3.61 10.55 17.00 11.85 8.43 − − −− − − − − − 1.44Morningstar Target Date 2046−2050 Funds Avg −2.21 3.41 10.25 15.95 10.68 6.66 10.60 − 1.05
10FOR INSTITUTIONAL USE ONLY − NOT FOR USE WITH INDIVIDUAL INVESTORSWF116290 00010 10
Performance summary
RTA Employees Defined Contribution Plan & TrustImportant Information
Wells Fargo Funds with names containing the designation of "G", "F" or "N" are Wells Fargo Collective Investment Funds available to qualified investors only. Expense Ratios reported for the Wells Fargo CollectiveInvestment Funds represent the investment management fee for each fund and exclude audit and other administrative expenses. Please see each collective fund’s Disclosure document for additional information.
Fund ranking percentages represent each fund’s percentile rank relative to its assigned asset class category within the peer group specified. Certain funds (i.e. money market mutual funds, Wells Fargo Collective InvestmentFunds and asset allocation funds) will not display percentile rankings.
Returns for periods greater than 1−year are annualized.
Performance shown for certain share classes of funds may reflect the adjusted historical returns published by Morningstar, which are calculated using the appended adjusted return history of the oldest surviving share classof the fund. Predecessor fund information can be found in the Fund’s prospectus, statement of additional information, or annual report.
Morningstar rates investments from one to five stars based on how well they’ve performed (after adjusting for risk and accounting for all relevant sales charges) in comparison to similar investments. Within eachMorningstar Category, the top 10% of investments receive five stars, the next 22.5% four stars, the middle 35% three stars, the next 22.5% two stars, and the bottom 10% receive one star. Investments are rated for up tothree time periods − 3, 5, and 10 years, and these ratings are combined to produce an overall rating. Investments with less than three years of history are not rated. Ratings are objective, based entirely on amathematical evaluation of past performance. They’re a useful tool for identifying investments worthy of further research, but shouldn’t be considered buy or sell recommendations.
(1) This fund has been placed in a category for the purposes of this summary that does not directly match the category assigned by Morningstar. Note that the percentile ranking displayed for this fund in the "% Rank"column represents this fund’s relative ranking within the asset class category as assigned by Morningstar.
11FOR INSTITUTIONAL USE ONLY − NOT FOR USE WITH INDIVIDUAL INVESTORSWF116290 00011 10
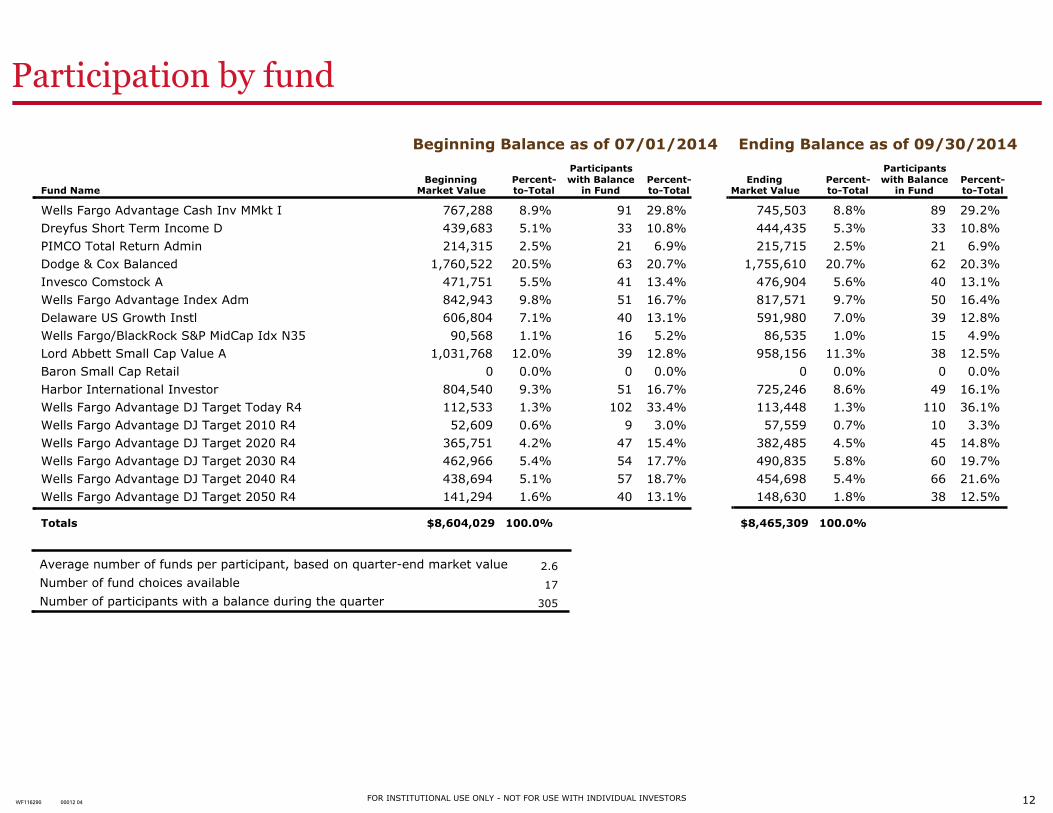
Participation by fund
Beginning Balance as of 07/01/2014 Ending Balance as of 09/30/2014
Participants ParticipantsBeginning Percent− with Balance Percent− Ending Percent− with Balance Percent−
Fund Name Market Value to−Total in Fund to−Total Market Value to−Total in Fund to−Total
Wells Fargo Advantage Cash Inv MMkt I 767,288 8.9% 91 29.8% 745,503 8.8% 89 29.2%Dreyfus Short Term Income D 439,683 5.1% 33 10.8% 444,435 5.3% 33 10.8%PIMCO Total Return Admin 214,315 2.5% 21 6.9% 215,715 2.5% 21 6.9%Dodge & Cox Balanced 1,760,522 20.5% 63 20.7% 1,755,610 20.7% 62 20.3%Invesco Comstock A 471,751 5.5% 41 13.4% 476,904 5.6% 40 13.1%Wells Fargo Advantage Index Adm 842,943 9.8% 51 16.7% 817,571 9.7% 50 16.4%Delaware US Growth Instl 606,804 7.1% 40 13.1% 591,980 7.0% 39 12.8%Wells Fargo/BlackRock S&P MidCap Idx N35 90,568 1.1% 16 5.2% 86,535 1.0% 15 4.9%Lord Abbett Small Cap Value A 1,031,768 12.0% 39 12.8% 958,156 11.3% 38 12.5%Baron Small Cap Retail 0 0.0% 0 0.0% 0 0.0% 0 0.0%Harbor International Investor 804,540 9.3% 51 16.7% 725,246 8.6% 49 16.1%Wells Fargo Advantage DJ Target Today R4 112,533 1.3% 102 33.4% 113,448 1.3% 110 36.1%Wells Fargo Advantage DJ Target 2010 R4 52,609 0.6% 9 3.0% 57,559 0.7% 10 3.3%Wells Fargo Advantage DJ Target 2020 R4 365,751 4.2% 47 15.4% 382,485 4.5% 45 14.8%Wells Fargo Advantage DJ Target 2030 R4 462,966 5.4% 54 17.7% 490,835 5.8% 60 19.7%Wells Fargo Advantage DJ Target 2040 R4 438,694 5.1% 57 18.7% 454,698 5.4% 66 21.6%Wells Fargo Advantage DJ Target 2050 R4 141,294 1.6% 40 13.1% 148,630 1.8% 38 12.5%
Totals $8,604,029 100.0% $8,465,309 100.0%
Average number of funds per participant, based on quarter−end market value 2.6
Number of fund choices available 17
Number of participants with a balance during the quarter 305
12FOR INSTITUTIONAL USE ONLY − NOT FOR USE WITH INDIVIDUAL INVESTORSWF116290 00012 04
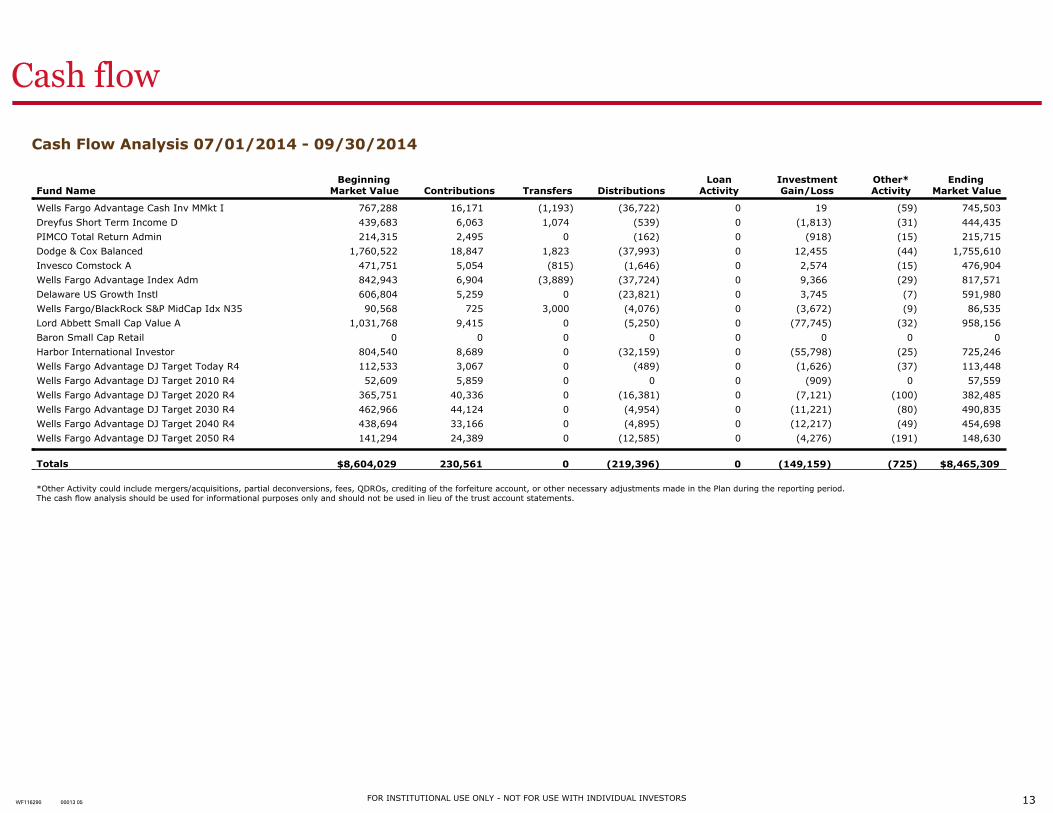
Cash flow
Cash Flow Analysis 07/01/2014 − 09/30/2014
Beginning Loan Investment Other* EndingFund Name Market Value Contributions Transfers Distributions Activity Gain/Loss Activity Market Value
Wells Fargo Advantage Cash Inv MMkt I 767,288 16,171 (1,193) (36,722) 0 19 (59) 745,503
Dreyfus Short Term Income D 439,683 6,063 1,074 (539) 0 (1,813) (31) 444,435
PIMCO Total Return Admin 214,315 2,495 0 (162) 0 (918) (15) 215,715
Dodge & Cox Balanced 1,760,522 18,847 1,823 (37,993) 0 12,455 (44) 1,755,610
Invesco Comstock A 471,751 5,054 (815) (1,646) 0 2,574 (15) 476,904
Wells Fargo Advantage Index Adm 842,943 6,904 (3,889) (37,724) 0 9,366 (29) 817,571
Delaware US Growth Instl 606,804 5,259 0 (23,821) 0 3,745 (7) 591,980
Wells Fargo/BlackRock S&P MidCap Idx N35 90,568 725 3,000 (4,076) 0 (3,672) (9) 86,535
Lord Abbett Small Cap Value A 1,031,768 9,415 0 (5,250) 0 (77,745) (32) 958,156
Baron Small Cap Retail 0 0 0 0 0 0 0 0
Harbor International Investor 804,540 8,689 0 (32,159) 0 (55,798) (25) 725,246
Wells Fargo Advantage DJ Target Today R4 112,533 3,067 0 (489) 0 (1,626) (37) 113,448
Wells Fargo Advantage DJ Target 2010 R4 52,609 5,859 0 0 0 (909) 0 57,559
Wells Fargo Advantage DJ Target 2020 R4 365,751 40,336 0 (16,381) 0 (7,121) (100) 382,485
Wells Fargo Advantage DJ Target 2030 R4 462,966 44,124 0 (4,954) 0 (11,221) (80) 490,835
Wells Fargo Advantage DJ Target 2040 R4 438,694 33,166 0 (4,895) 0 (12,217) (49) 454,698
Wells Fargo Advantage DJ Target 2050 R4 141,294 24,389 0 (12,585) 0 (4,276) (191) 148,630
Totals $8,604,029 230,561 0 (219,396) 0 (149,159) (725) $8,465,309
*Other Activity could include mergers/acquisitions, partial deconversions, fees, QDROs, crediting of the forfeiture account, or other necessary adjustments made in the Plan during the reporting period.The cash flow analysis should be used for informational purposes only and should not be used in lieu of the trust account statements.
13FOR INSTITUTIONAL USE ONLY − NOT FOR USE WITH INDIVIDUAL INVESTORSWF116290 00013 05
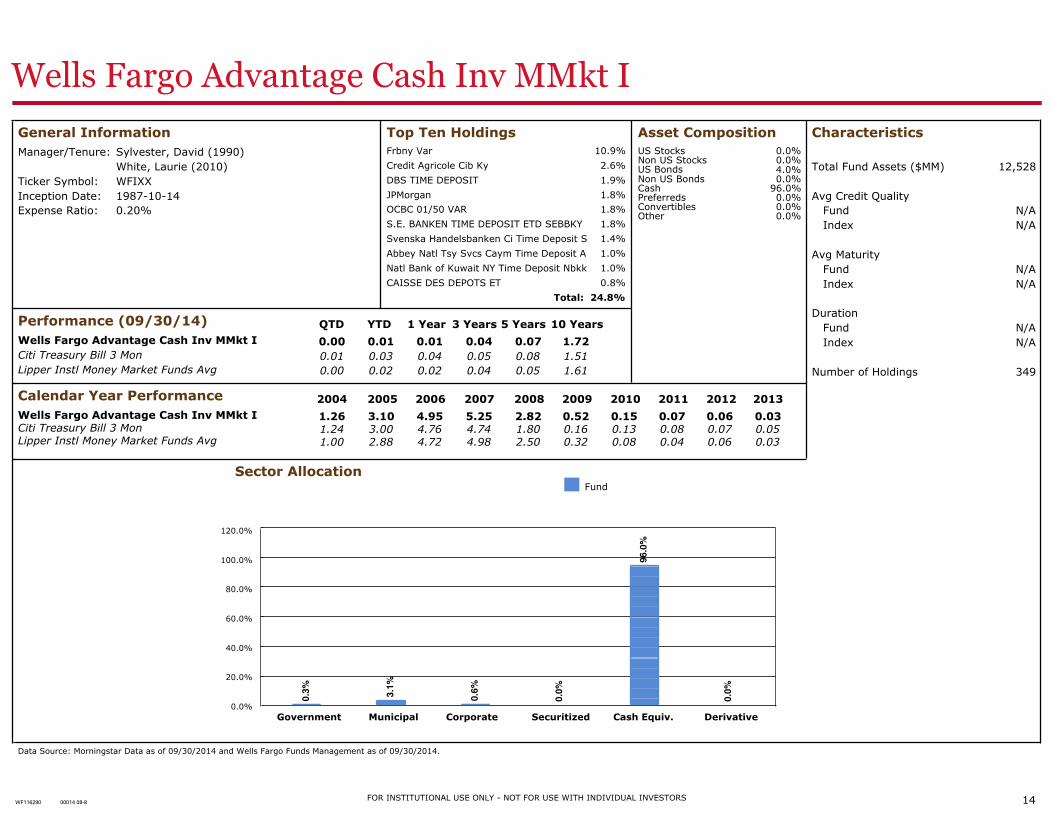
Wells Fargo Advantage Cash Inv MMkt I
General InformationManager/Tenure: Sylvester, David (1990)
White, Laurie (2010)Ticker Symbol: WFIXXInception Date: 1987−10−14Expense Ratio: 0.20%
Top Ten HoldingsFrbny Var 10.9%
Credit Agricole Cib Ky 2.6%
DBS TIME DEPOSIT 1.9%
JPMorgan 1.8%
OCBC 01/50 VAR 1.8%
S.E. BANKEN TIME DEPOSIT ETD SEBBKY 1.8%
Svenska Handelsbanken Ci Time Deposit S 1.4%
Abbey Natl Tsy Svcs Caym Time Deposit A 1.0%
Natl Bank of Kuwait NY Time Deposit Nbkk 1.0%
CAISSE DES DEPOTS ET 0.8%
Total: 24.8%
Asset CompositionUS Stocks 0.0%Non US Stocks 0.0%US Bonds 4.0%Non US Bonds 0.0%Cash 96.0%Preferreds 0.0%Convertibles 0.0%Other 0.0%
Performance (09/30/14) QTD YTD 1 Year 3 Years 5 Years 10 YearsWells Fargo Advantage Cash Inv MMkt I 0.00 0.01 0.01 0.04 0.07 1.72Citi Treasury Bill 3 Mon 0.01 0.03 0.04 0.05 0.08 1.51Lipper Instl Money Market Funds Avg 0.00 0.02 0.02 0.04 0.05 1.61
Calendar Year Performance 2004 2005 2006 2007 2008 2009 2010 2011 2012 2013Wells Fargo Advantage Cash Inv MMkt I 1.26 3.10 4.95 5.25 2.82 0.52 0.15 0.07 0.06 0.03Citi Treasury Bill 3 Mon 1.24 3.00 4.76 4.74 1.80 0.16 0.13 0.08 0.07 0.05Lipper Instl Money Market Funds Avg 1.00 2.88 4.72 4.98 2.50 0.32 0.08 0.04 0.06 0.03
Characteristics
Total Fund Assets ($MM) 12,528
Avg Credit QualityFund N/AIndex N/A
Avg MaturityFund N/AIndex N/A
DurationFund N/AIndex N/A
Number of Holdings 349
Sector AllocationFund
120.0%
100.0%
80.0%
0.3% 3.1%
0.6%
0.0%
96.0
%
0.0%
60.0%
40.0%
20.0%
0.0%Government Municipal Corporate Securitized Cash Equiv. Derivative
Data Source: Morningstar Data as of 09/30/2014 and Wells Fargo Funds Management as of 09/30/2014.
FOR INSTITUTIONAL USE ONLY − NOT FOR USE WITH INDIVIDUAL INVESTORS 14WF116290 00014 08−8
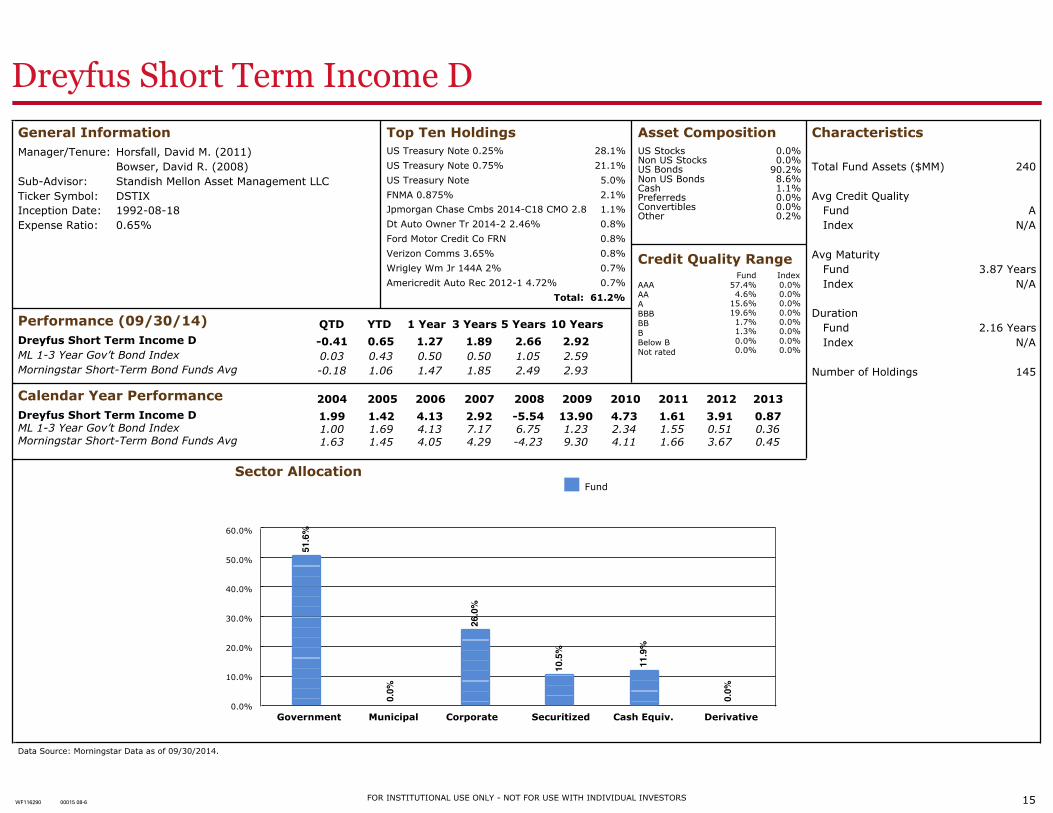
Dreyfus Short Term Income D
General InformationManager/Tenure: Horsfall, David M. (2011)
Bowser, David R. (2008)Sub−Advisor: Standish Mellon Asset Management LLCTicker Symbol: DSTIXInception Date: 1992−08−18Expense Ratio: 0.65%
Top Ten HoldingsUS Treasury Note 0.25% 28.1%
US Treasury Note 0.75% 21.1%
US Treasury Note 5.0%
FNMA 0.875% 2.1%
Jpmorgan Chase Cmbs 2014−C18 CMO 2.8 1.1%
Dt Auto Owner Tr 2014−2 2.46% 0.8%
Ford Motor Credit Co FRN 0.8%
Verizon Comms 3.65% 0.8%
Wrigley Wm Jr 144A 2% 0.7%
Americredit Auto Rec 2012−1 4.72% 0.7%
Total: 61.2%
Asset CompositionUS Stocks 0.0%Non US Stocks 0.0%US Bonds 90.2%Non US Bonds 8.6%Cash 1.1%Preferreds 0.0%Convertibles 0.0%Other 0.2%
Credit Quality RangeFund Index
AAA 57.4% 0.0%4.6% 0.0%AA
15.6% 0.0%A19.6% 0.0%BBB1.7% 0.0%BB1.3% 0.0%B0.0% 0.0%Below B0.0% 0.0%Not rated
Performance (09/30/14) QTD YTD 1 Year 3 Years 5 Years 10 YearsDreyfus Short Term Income D −0.41 0.65 1.27 1.89 2.66 2.92ML 1−3 Year Gov’t Bond Index 0.03 0.43 0.50 0.50 1.05 2.59Morningstar Short−Term Bond Funds Avg −0.18 1.06 1.47 1.85 2.49 2.93
Calendar Year Performance 2004 2005 2006 2007 2008 2009 2010 2011 2012 2013Dreyfus Short Term Income D 1.99 1.42 4.13 2.92 −5.54 13.90 4.73 1.61 3.91 0.87ML 1−3 Year Gov’t Bond Index 1.00 1.69 4.13 7.17 6.75 1.23 2.34 1.55 0.51 0.36Morningstar Short−Term Bond Funds Avg 1.63 1.45 4.05 4.29 −4.23 9.30 4.11 1.66 3.67 0.45
Characteristics
Total Fund Assets ($MM) 240
Avg Credit QualityFund AIndex N/A
Avg MaturityFund 3.87 YearsIndex N/A
DurationFund 2.16 YearsIndex N/A
Number of Holdings 145
Sector AllocationFund
60.0%
50.0%
40.0%
51.6
%
0.0%
26.0
%
10.5
%
11.9
%
0.0%
30.0%
20.0%
10.0%
0.0%Government Municipal Corporate Securitized Cash Equiv. Derivative
Data Source: Morningstar Data as of 09/30/2014.
FOR INSTITUTIONAL USE ONLY − NOT FOR USE WITH INDIVIDUAL INVESTORS 15WF116290 00015 08−6
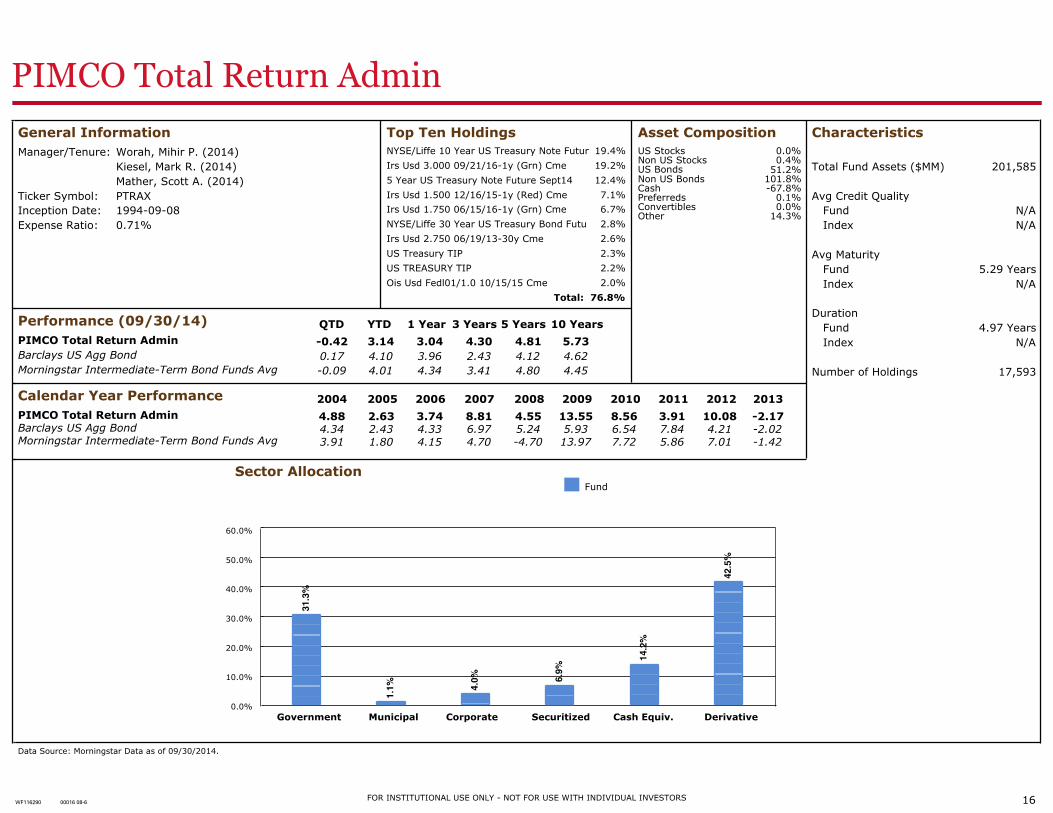
PIMCO Total Return Admin
General InformationManager/Tenure: Worah, Mihir P. (2014)
Kiesel, Mark R. (2014)Mather, Scott A. (2014)
Ticker Symbol: PTRAXInception Date: 1994−09−08Expense Ratio: 0.71%
Top Ten HoldingsNYSE/Liffe 10 Year US Treasury Note Futur 19.4%
Irs Usd 3.000 09/21/16−1y (Grn) Cme 19.2%
5 Year US Treasury Note Future Sept14 12.4%
Irs Usd 1.500 12/16/15−1y (Red) Cme 7.1%
Irs Usd 1.750 06/15/16−1y (Grn) Cme 6.7%
NYSE/Liffe 30 Year US Treasury Bond Futu 2.8%
Irs Usd 2.750 06/19/13−30y Cme 2.6%
US Treasury TIP 2.3%
US TREASURY TIP 2.2%
Ois Usd Fedl01/1.0 10/15/15 Cme 2.0%
Total: 76.8%
Asset CompositionUS Stocks 0.0%Non US Stocks 0.4%US Bonds 51.2%Non US Bonds 101.8%Cash −67.8%Preferreds 0.1%Convertibles 0.0%Other 14.3%
Performance (09/30/14) QTD YTD 1 Year 3 Years 5 Years 10 YearsPIMCO Total Return Admin −0.42 3.14 3.04 4.30 4.81 5.73Barclays US Agg Bond 0.17 4.10 3.96 2.43 4.12 4.62Morningstar Intermediate−Term Bond Funds Avg −0.09 4.01 4.34 3.41 4.80 4.45
Calendar Year Performance 2004 2005 2006 2007 2008 2009 2010 2011 2012 2013PIMCO Total Return Admin 4.88 2.63 3.74 8.81 4.55 13.55 8.56 3.91 10.08 −2.17Barclays US Agg Bond 4.34 2.43 4.33 6.97 5.24 5.93 6.54 7.84 4.21 −2.02Morningstar Intermediate−Term Bond Funds Avg 3.91 1.80 4.15 4.70 −4.70 13.97 7.72 5.86 7.01 −1.42
Characteristics
Total Fund Assets ($MM) 201,585
Avg Credit QualityFund N/AIndex N/A
Avg MaturityFund 5.29 YearsIndex N/A
DurationFund 4.97 YearsIndex N/A
Number of Holdings 17,593
Sector AllocationFund
60.0%
50.0%
40.0%
31.3
%
1.1%
4.0% 6.
9%
14.2
%
42.5
%
30.0%
20.0%
10.0%
0.0%Government Municipal Corporate Securitized Cash Equiv. Derivative
Data Source: Morningstar Data as of 09/30/2014.
FOR INSTITUTIONAL USE ONLY − NOT FOR USE WITH INDIVIDUAL INVESTORS 16WF116290 00016 08−6
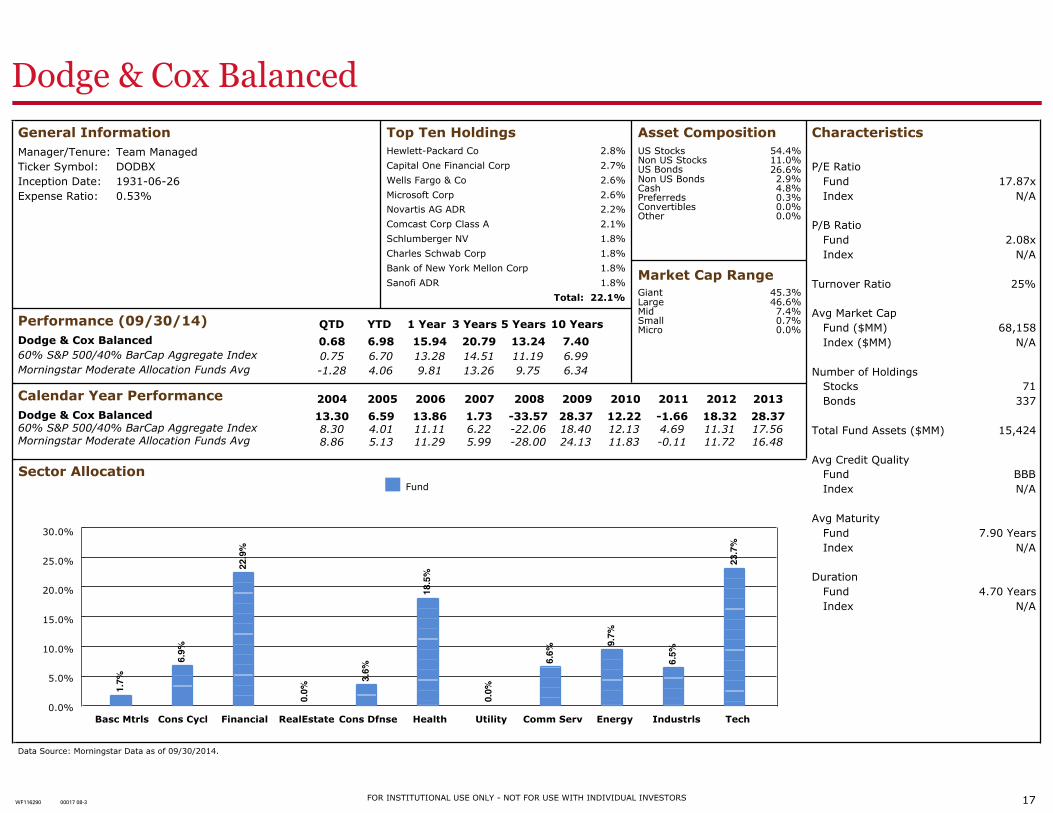
Dodge & Cox Balanced
General InformationManager/Tenure: Team ManagedTicker Symbol: DODBXInception Date: 1931−06−26Expense Ratio: 0.53%
Top Ten HoldingsHewlett−Packard Co 2.8%
Capital One Financial Corp 2.7%
Wells Fargo & Co 2.6%
Microsoft Corp 2.6%
Novartis AG ADR 2.2%
Comcast Corp Class A 2.1%
Schlumberger NV 1.8%
Charles Schwab Corp 1.8%
Bank of New York Mellon Corp 1.8%
Sanofi ADR 1.8%
Total: 22.1%
Asset CompositionUS Stocks 54.4%Non US Stocks 11.0%US Bonds 26.6%Non US Bonds 2.9%Cash 4.8%Preferreds 0.3%Convertibles 0.0%Other 0.0%
Market Cap RangeGiant 45.3%Large 46.6%Mid 7.4%Small 0.7%Micro 0.0%
Performance (09/30/14) QTD YTD 1 Year 3 Years 5 Years 10 YearsDodge & Cox Balanced 0.68 6.98 15.94 20.79 13.24 7.4060% S&P 500/40% BarCap Aggregate Index 0.75 6.70 13.28 14.51 11.19 6.99Morningstar Moderate Allocation Funds Avg −1.28 4.06 9.81 13.26 9.75 6.34
Calendar Year Performance 2004 2005 2006 2007 2008 2009 2010 2011 2012 2013Dodge & Cox Balanced 13.30 6.59 13.86 1.73 −33.57 28.37 12.22 −1.66 18.32 28.3760% S&P 500/40% BarCap Aggregate Index 8.30 4.01 11.11 6.22 −22.06 18.40 12.13 4.69 11.31 17.56Morningstar Moderate Allocation Funds Avg 8.86 5.13 11.29 5.99 −28.00 24.13 11.83 −0.11 11.72 16.48
Characteristics
P/E RatioFund 17.87xIndex N/A
P/B RatioFund 2.08xIndex N/A
Turnover Ratio 25%
Avg Market CapFund ($MM) 68,158Index ($MM) N/A
Number of HoldingsStocks 71Bonds 337
Total Fund Assets ($MM) 15,424
Avg Credit QualityFund BBBIndex N/A
Avg MaturityFund 7.90 YearsIndex N/A
DurationFund 4.70 YearsIndex N/A
Sector AllocationFund
30.0%
25.0%
20.0%
1.7%
6.9%
22.9
%
0.0%
3.6%
18.5
%
0.0%
6.6%
9.7%
6.5%
2 3.7
%
15.0%
10.0%
5.0%
0.0%Basc Mtrls Cons Cycl Financial RealEstate Cons Dfnse Health Utility Comm Serv Energy Industrls Tech
Data Source: Morningstar Data as of 09/30/2014.
FOR INSTITUTIONAL USE ONLY − NOT FOR USE WITH INDIVIDUAL INVESTORS 17WF116290 00017 08−3
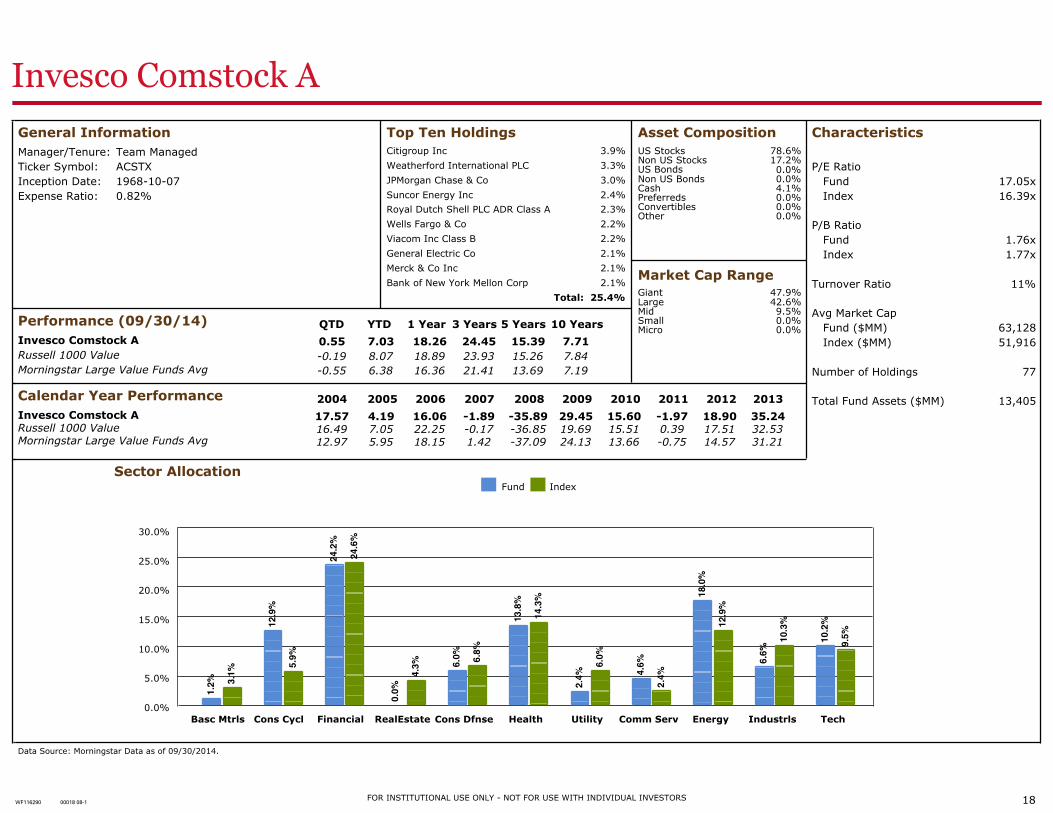
Invesco Comstock A
General InformationManager/Tenure: Team ManagedTicker Symbol: ACSTXInception Date: 1968−10−07Expense Ratio: 0.82%
Top Ten HoldingsCitigroup Inc 3.9%
Weatherford International PLC 3.3%
JPMorgan Chase & Co 3.0%
Suncor Energy Inc 2.4%
Royal Dutch Shell PLC ADR Class A 2.3%
Wells Fargo & Co 2.2%
Viacom Inc Class B 2.2%
General Electric Co 2.1%
Merck & Co Inc 2.1%
Bank of New York Mellon Corp 2.1%
Total: 25.4%
Asset CompositionUS Stocks 78.6%Non US Stocks 17.2%US Bonds 0.0%Non US Bonds 0.0%Cash 4.1%Preferreds 0.0%Convertibles 0.0%Other 0.0%
Market Cap RangeGiant 47.9%Large 42.6%Mid 9.5%Small 0.0%Micro 0.0%
Performance (09/30/14) QTD YTD 1 Year 3 Years 5 Years 10 YearsInvesco Comstock A 0.55 7.03 18.26 24.45 15.39 7.71Russell 1000 Value −0.19 8.07 18.89 23.93 15.26 7.84Morningstar Large Value Funds Avg −0.55 6.38 16.36 21.41 13.69 7.19
Calendar Year Performance 2004 2005 2006 2007 2008 2009 2010 2011 2012 2013Invesco Comstock A 17.57 4.19 16.06 −1.89 −35.89 29.45 15.60 −1.97 18.90 35.24Russell 1000 Value 16.49 7.05 22.25 −0.17 −36.85 19.69 15.51 0.39 17.51 32.53Morningstar Large Value Funds Avg 12.97 5.95 18.15 1.42 −37.09 24.13 13.66 −0.75 14.57 31.21
Characteristics
P/E RatioFund 17.05xIndex 16.39x
P/B RatioFund 1.76xIndex 1.77x
Turnover Ratio 11%
Avg Market CapFund ($MM) 63,128Index ($MM) 51,916
Number of Holdings 77
Total Fund Assets ($MM) 13,405
Sector AllocationFund Index
30.0%
25.0%
20.0%
1.2%
3.1%
12.9
%
5.9%
24.2
%
24.6
%
0.0%
4.3%
6.0%
6.8%
13.8
%
14.3
%
2.4%
6 .0%
4.6%
2 .4%
1 8.0
%
1 2.9
%
6.6%
10.3
%
1 0.2
%
9.5%
15.0%
10.0%
5.0%
0.0%Basc Mtrls Cons Cycl Financial RealEstate Cons Dfnse Health Utility Comm Serv Energy Industrls Tech
Data Source: Morningstar Data as of 09/30/2014.
FOR INSTITUTIONAL USE ONLY − NOT FOR USE WITH INDIVIDUAL INVESTORS 18WF116290 00018 08−1
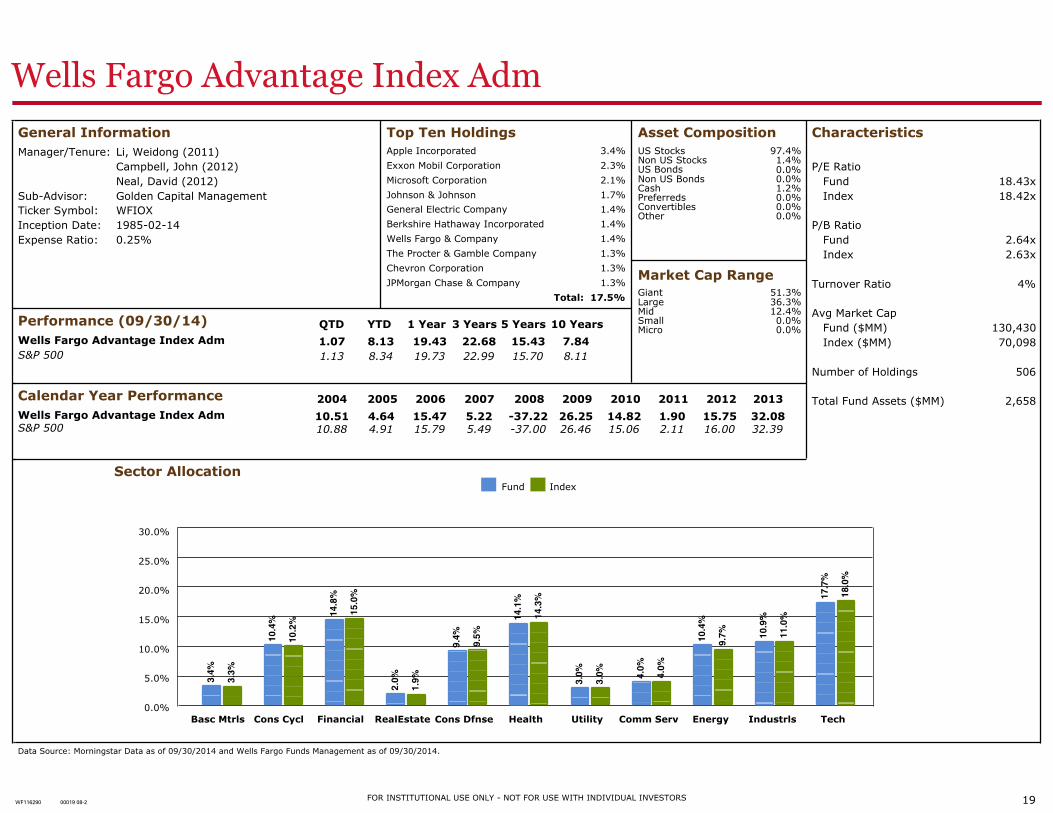
Wells Fargo Advantage Index Adm
General InformationManager/Tenure: Li, Weidong (2011)
Campbell, John (2012)Neal, David (2012)
Sub−Advisor: Golden Capital ManagementTicker Symbol: WFIOXInception Date: 1985−02−14Expense Ratio: 0.25%
Top Ten HoldingsApple Incorporated 3.4%
Exxon Mobil Corporation 2.3%
Microsoft Corporation 2.1%
Johnson & Johnson 1.7%
General Electric Company 1.4%
Berkshire Hathaway Incorporated 1.4%
Wells Fargo & Company 1.4%
The Procter & Gamble Company 1.3%
Chevron Corporation 1.3%
JPMorgan Chase & Company 1.3%
Total: 17.5%
Asset CompositionUS Stocks 97.4%Non US Stocks 1.4%US Bonds 0.0%Non US Bonds 0.0%Cash 1.2%Preferreds 0.0%Convertibles 0.0%Other 0.0%
Market Cap RangeGiant 51.3%Large 36.3%Mid 12.4%Small 0.0%Micro 0.0%
Performance (09/30/14) QTD YTD 1 Year 3 Years 5 Years 10 YearsWells Fargo Advantage Index Adm 1.07 8.13 19.43 22.68 15.43 7.84S&P 500 1.13 8.34 19.73 22.99 15.70 8.11
Calendar Year Performance 2004 2005 2006 2007 2008 2009 2010 2011 2012 2013Wells Fargo Advantage Index Adm 10.51 4.64 15.47 5.22 −37.22 26.25 14.82 1.90 15.75 32.08S&P 500 10.88 4.91 15.79 5.49 −37.00 26.46 15.06 2.11 16.00 32.39
Characteristics
P/E RatioFund 18.43xIndex 18.42x
P/B RatioFund 2.64xIndex 2.63x
Turnover Ratio 4%
Avg Market CapFund ($MM) 130,430Index ($MM) 70,098
Number of Holdings 506
Total Fund Assets ($MM) 2,658
Sector AllocationFund Index
30.0%
25.0%
20.0%
3.4%
3.3%
10.4
%
10.2
%
14.8
%
15.0
%
2.0%
1.9%
9.4%
9.5%
14.1
%
14.3
%
3.0%
3 .0% 4.
0%
4 .0%
1 0.4
%
9 .7% 10
.9%
11.0
%
1 7.7
%
18.0
%
15.0%
10.0%
5.0%
0.0%Basc Mtrls Cons Cycl Financial RealEstate Cons Dfnse Health Utility Comm Serv Energy Industrls Tech
Data Source: Morningstar Data as of 09/30/2014 and Wells Fargo Funds Management as of 09/30/2014.
FOR INSTITUTIONAL USE ONLY − NOT FOR USE WITH INDIVIDUAL INVESTORS 19WF116290 00019 08−2
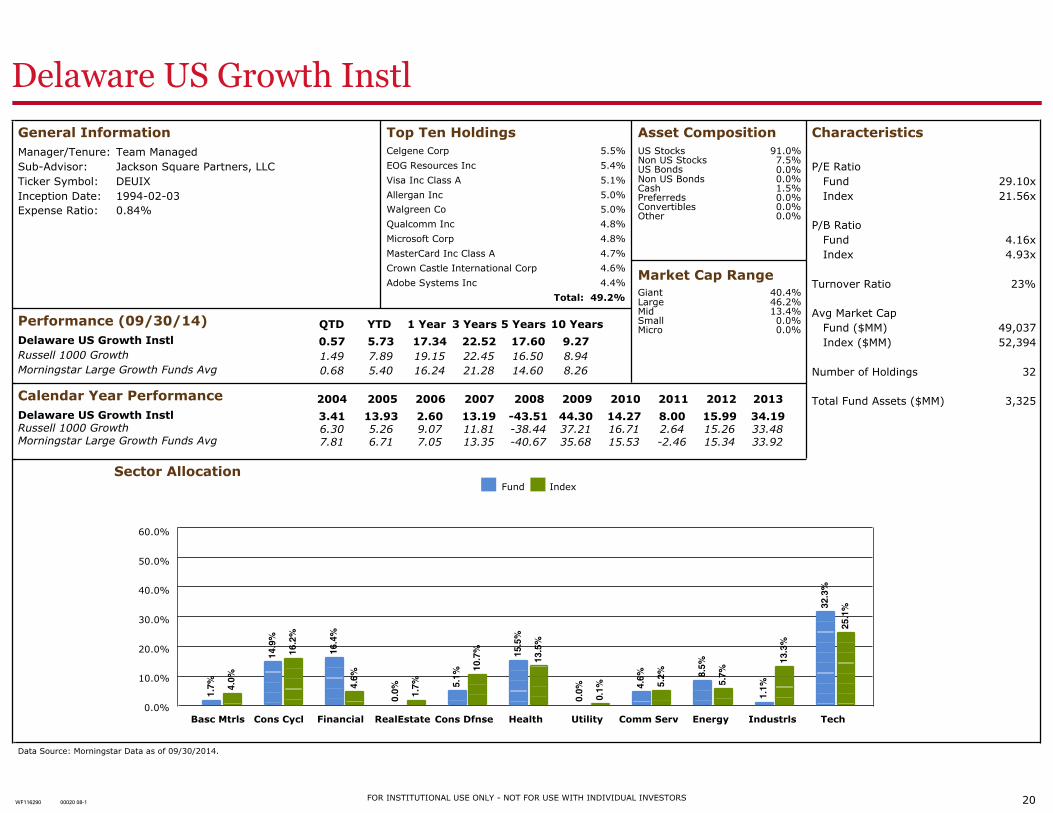
Delaware US Growth Instl
General InformationManager/Tenure: Team ManagedSub−Advisor: Jackson Square Partners, LLCTicker Symbol: DEUIXInception Date: 1994−02−03Expense Ratio: 0.84%
Top Ten HoldingsCelgene Corp 5.5%
EOG Resources Inc 5.4%
Visa Inc Class A 5.1%
Allergan Inc 5.0%
Walgreen Co 5.0%
Qualcomm Inc 4.8%
Microsoft Corp 4.8%
MasterCard Inc Class A 4.7%
Crown Castle International Corp 4.6%
Adobe Systems Inc 4.4%
Total: 49.2%
Asset CompositionUS Stocks 91.0%Non US Stocks 7.5%US Bonds 0.0%Non US Bonds 0.0%Cash 1.5%Preferreds 0.0%Convertibles 0.0%Other 0.0%
Market Cap RangeGiant 40.4%Large 46.2%Mid 13.4%Small 0.0%Micro 0.0%
Performance (09/30/14) QTD YTD 1 Year 3 Years 5 Years 10 YearsDelaware US Growth Instl 0.57 5.73 17.34 22.52 17.60 9.27Russell 1000 Growth 1.49 7.89 19.15 22.45 16.50 8.94Morningstar Large Growth Funds Avg 0.68 5.40 16.24 21.28 14.60 8.26
Calendar Year Performance 2004 2005 2006 2007 2008 2009 2010 2011 2012 2013Delaware US Growth Instl 3.41 13.93 2.60 13.19 −43.51 44.30 14.27 8.00 15.99 34.19Russell 1000 Growth 6.30 5.26 9.07 11.81 −38.44 37.21 16.71 2.64 15.26 33.48Morningstar Large Growth Funds Avg 7.81 6.71 7.05 13.35 −40.67 35.68 15.53 −2.46 15.34 33.92
Characteristics
P/E RatioFund 29.10xIndex 21.56x
P/B RatioFund 4.16xIndex 4.93x
Turnover Ratio 23%
Avg Market CapFund ($MM) 49,037Index ($MM) 52,394
Number of Holdings 32
Total Fund Assets ($MM) 3,325
Sector AllocationFund Index
60.0%
50.0%
40.0%
1.7%
4.0%
14.9
%
16.2
%
16.4
%
4.6%
0.0% 1.7%
5.1%
10.7
%
15.5
%
13.5
%
0.0%
0 .1%
4.6%
5 .2%
8 .5%
5 .7%
1.1%
13.3
%
3 2.3
%
25.1
%
30.0%
20.0%
10.0%
0.0%Basc Mtrls Cons Cycl Financial RealEstate Cons Dfnse Health Utility Comm Serv Energy Industrls Tech
Data Source: Morningstar Data as of 09/30/2014.
FOR INSTITUTIONAL USE ONLY − NOT FOR USE WITH INDIVIDUAL INVESTORS 20WF116290 00020 08−1
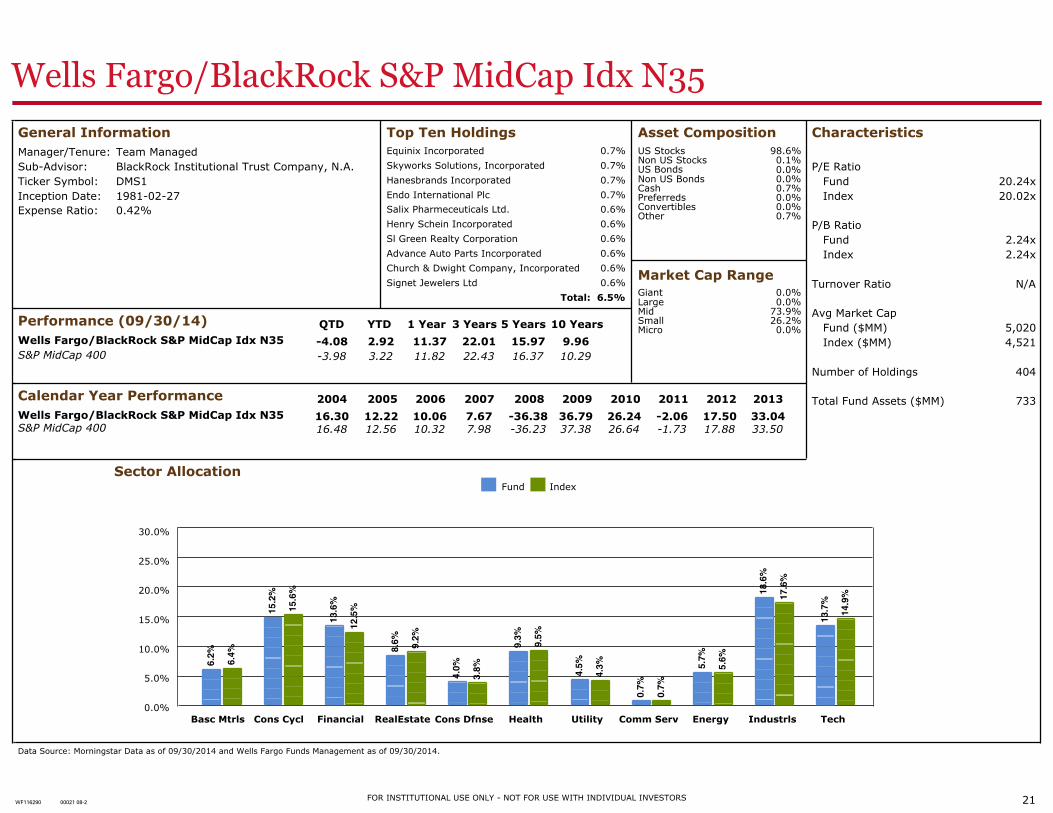
Wells Fargo/BlackRock S&P MidCap Idx N35
General InformationManager/Tenure: Team ManagedSub−Advisor: BlackRock Institutional Trust Company, N.A.Ticker Symbol: DMS1Inception Date: 1981−02−27Expense Ratio: 0.42%
Top Ten HoldingsEquinix Incorporated 0.7%
Skyworks Solutions, Incorporated 0.7%
Hanesbrands Incorporated 0.7%
Endo International Plc 0.7%
Salix Pharmeceuticals Ltd. 0.6%
Henry Schein Incorporated 0.6%
Sl Green Realty Corporation 0.6%
Advance Auto Parts Incorporated 0.6%
Church & Dwight Company, Incorporated 0.6%
Signet Jewelers Ltd 0.6%
Total: 6.5%
Asset CompositionUS Stocks 98.6%Non US Stocks 0.1%US Bonds 0.0%Non US Bonds 0.0%Cash 0.7%Preferreds 0.0%Convertibles 0.0%Other 0.7%
Market Cap RangeGiant 0.0%Large 0.0%Mid 73.9%Small 26.2%Micro 0.0%
Performance (09/30/14) QTD YTD 1 Year 3 Years 5 Years 10 YearsWells Fargo/BlackRock S&P MidCap Idx N35 −4.08 2.92 11.37 22.01 15.97 9.96S&P MidCap 400 −3.98 3.22 11.82 22.43 16.37 10.29
Calendar Year Performance 2004 2005 2006 2007 2008 2009 2010 2011 2012 2013Wells Fargo/BlackRock S&P MidCap Idx N35 16.30 12.22 10.06 7.67 −36.38 36.79 26.24 −2.06 17.50 33.04S&P MidCap 400 16.48 12.56 10.32 7.98 −36.23 37.38 26.64 −1.73 17.88 33.50
Characteristics
P/E RatioFund 20.24xIndex 20.02x
P/B RatioFund 2.24xIndex 2.24x
Turnover Ratio N/A
Avg Market CapFund ($MM) 5,020Index ($MM) 4,521
Number of Holdings 404
Total Fund Assets ($MM) 733
Sector AllocationFund Index
30.0%
25.0%
20.0%
6.2%
6.4%
15.2
%
15.6
%
13.6
%
12.5
%
8.6% 9.2%
4.0%
3.8%
9.3%
9.5%
4.5%
4 .3%
0.7%
0 .7%
5 .
7%
5 .6%
18.6
%
17.6
%
1 3.7
%
14.9
%
15.0%
10.0%
5.0%
0.0%Basc Mtrls Cons Cycl Financial RealEstate Cons Dfnse Health Utility Comm Serv Energy Industrls Tech
Data Source: Morningstar Data as of 09/30/2014 and Wells Fargo Funds Management as of 09/30/2014.
FOR INSTITUTIONAL USE ONLY − NOT FOR USE WITH INDIVIDUAL INVESTORS 21WF116290 00021 08−2
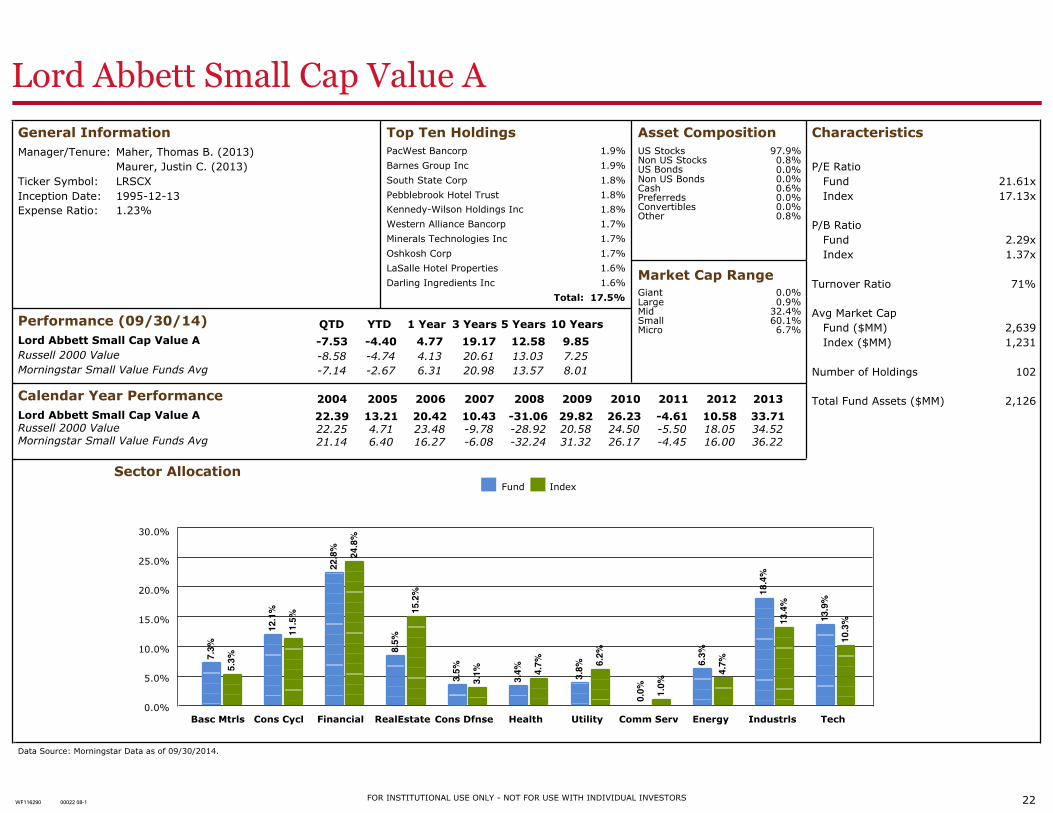
Lord Abbett Small Cap Value A
General InformationManager/Tenure: Maher, Thomas B. (2013)
Maurer, Justin C. (2013)Ticker Symbol: LRSCXInception Date: 1995−12−13Expense Ratio: 1.23%
Top Ten HoldingsPacWest Bancorp 1.9%
Barnes Group Inc 1.9%
South State Corp 1.8%
Pebblebrook Hotel Trust 1.8%
Kennedy−Wilson Holdings Inc 1.8%
Western Alliance Bancorp 1.7%
Minerals Technologies Inc 1.7%
Oshkosh Corp 1.7%
LaSalle Hotel Properties 1.6%
Darling Ingredients Inc 1.6%
Total: 17.5%
Asset CompositionUS Stocks 97.9%Non US Stocks 0.8%US Bonds 0.0%Non US Bonds 0.0%Cash 0.6%Preferreds 0.0%Convertibles 0.0%Other 0.8%
Market Cap RangeGiant 0.0%Large 0.9%Mid 32.4%Small 60.1%Micro 6.7%
Performance (09/30/14) QTD YTD 1 Year 3 Years 5 Years 10 YearsLord Abbett Small Cap Value A −7.53 −4.40 4.77 19.17 12.58 9.85Russell 2000 Value −8.58 −4.74 4.13 20.61 13.03 7.25Morningstar Small Value Funds Avg −7.14 −2.67 6.31 20.98 13.57 8.01
Calendar Year Performance 2004 2005 2006 2007 2008 2009 2010 2011 2012 2013Lord Abbett Small Cap Value A 22.39 13.21 20.42 10.43 −31.06 29.82 26.23 −4.61 10.58 33.71Russell 2000 Value 22.25 4.71 23.48 −9.78 −28.92 20.58 24.50 −5.50 18.05 34.52Morningstar Small Value Funds Avg 21.14 6.40 16.27 −6.08 −32.24 31.32 26.17 −4.45 16.00 36.22
Characteristics
P/E RatioFund 21.61xIndex 17.13x
P/B RatioFund 2.29xIndex 1.37x
Turnover Ratio 71%
Avg Market CapFund ($MM) 2,639Index ($MM) 1,231
Number of Holdings 102
Total Fund Assets ($MM) 2,126
Sector AllocationFund Index
30.0%
25.0%
20.0%
7.3%
5.3%
12.1
%
11.5
%
22.8
%
24.8
%
8.5%
15.2
%
3.5%
3.1%
3.4% 4.
7%
3.8%
6 .2%
0.0% 1 .
0%
6 .3%
4 .7%
18.4
%
13.4
%
1 3.9
%
10.3
%15.0%
10.0%
5.0%
0.0%Basc Mtrls Cons Cycl Financial RealEstate Cons Dfnse Health Utility Comm Serv Energy Industrls Tech
Data Source: Morningstar Data as of 09/30/2014.
FOR INSTITUTIONAL USE ONLY − NOT FOR USE WITH INDIVIDUAL INVESTORS 22WF116290 00022 08−1
Baron Small Cap Retail
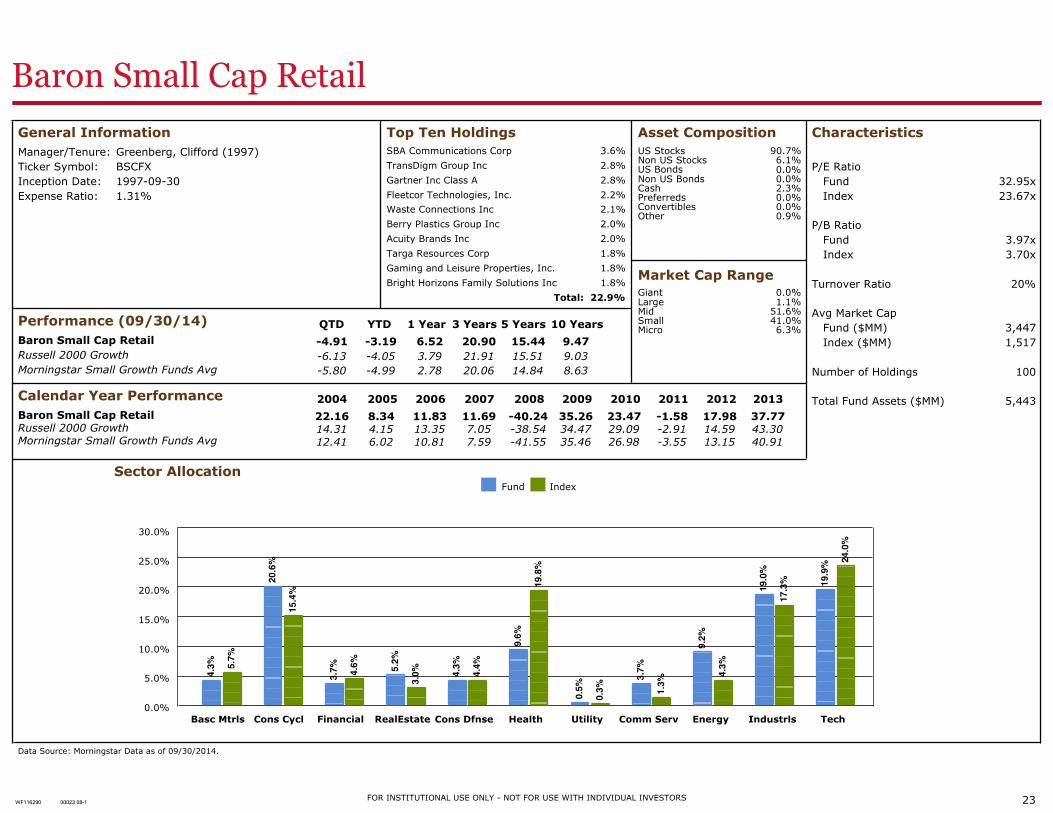
General InformationManager/Tenure: Greenberg, Clifford (1997)Ticker Symbol: BSCFXInception Date: 1997−09−30Expense Ratio: 1.31%
Top Ten HoldingsSBA Communications Corp 3.6%
TransDigm Group Inc 2.8%
Gartner Inc Class A 2.8%
Fleetcor Technologies, Inc. 2.2%
Waste Connections Inc 2.1%
Berry Plastics Group Inc 2.0%
Acuity Brands Inc 2.0%
Targa Resources Corp 1.8%
Gaming and Leisure Properties, Inc. 1.8%
Bright Horizons Family Solutions Inc 1.8%
Total: 22.9%
Asset CompositionUS Stocks 90.7%Non US Stocks 6.1%US Bonds 0.0%Non US Bonds 0.0%Cash 2.3%Preferreds 0.0%Convertibles 0.0%Other 0.9%
Market Cap RangeGiant 0.0%Large 1.1%Mid 51.6%Small 41.0%Micro 6.3%
Performance (09/30/14) QTD YTD 1 Year 3 Years 5 Years 10 YearsBaron Small Cap Retail −4.91 −3.19 6.52 20.90 15.44 9.47Russell 2000 Growth −6.13 −4.05 3.79 21.91 15.51 9.03Morningstar Small Growth Funds Avg −5.80 −4.99 2.78 20.06 14.84 8.63
Calendar Year Performance 2004 2005 2006 2007 2008 2009 2010 2011 2012 2013Baron Small Cap Retail 22.16 8.34 11.83 11.69 −40.24 35.26 23.47 −1.58 17.98 37.77Russell 2000 Growth 14.31 4.15 13.35 7.05 −38.54 34.47 29.09 −2.91 14.59 43.30Morningstar Small Growth Funds Avg 12.41 6.02 10.81 7.59 −41.55 35.46 26.98 −3.55 13.15 40.91
Characteristics
P/E RatioFund 32.95xIndex 23.67x
P/B RatioFund 3.97xIndex 3.70x
Turnover Ratio 20%
Avg Market CapFund ($MM) 3,447Index ($MM) 1,517
Number of Holdings 100
Total Fund Assets ($MM) 5,443
Sector AllocationFund Index
30.0%
25.0%
20.0%
4.3%
5.7%
20.6
%
15.4
%
3.7%
4.6% 5.2%
3.0% 4.
3%
4.4%
9.
6%
19.8
%
0.5%
0 .3%
3.7%
1 .3%
9 .2%
4 .3%
19.0
%
17.3
%
1 9.9
%
24.0
%
15.0%
10.0%
5.0%
0.0%Basc Mtrls Cons Cycl Financial RealEstate Cons Dfnse Health Utility Comm Serv Energy Industrls Tech
Data Source: Morningstar Data as of 09/30/2014.
FOR INSTITUTIONAL USE ONLY − NOT FOR USE WITH INDIVIDUAL INVESTORS 23WF116290 00023 08−1
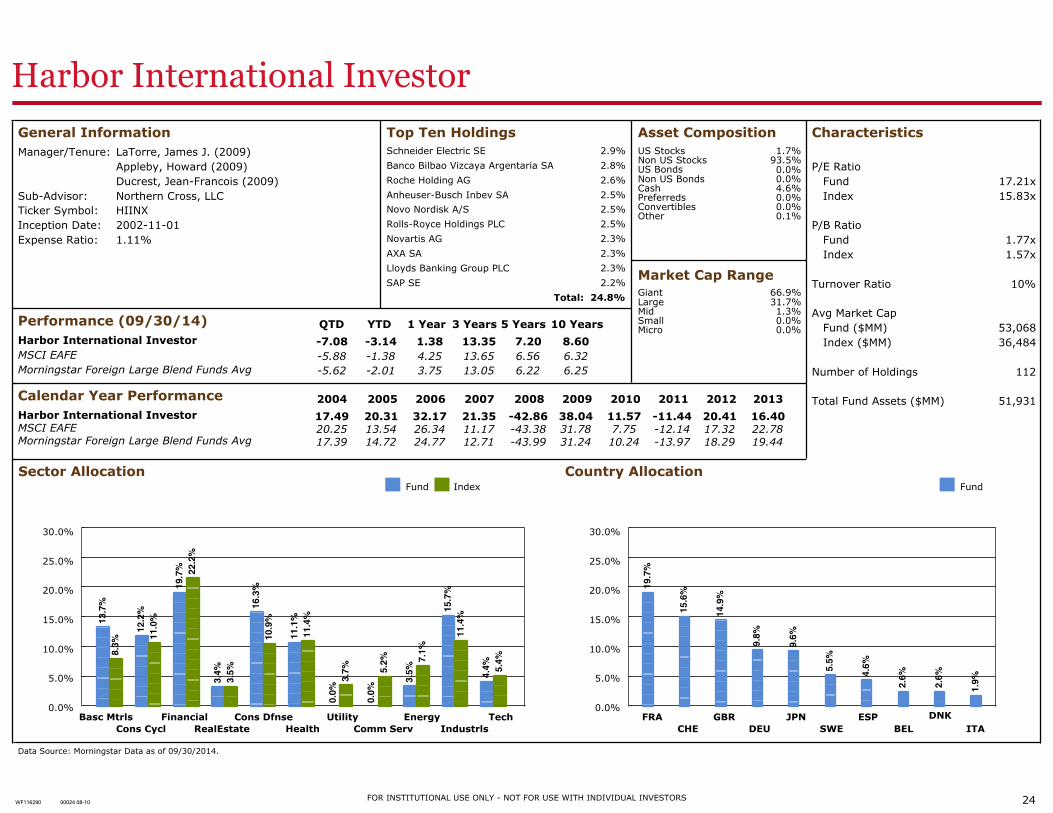
Harbor International Investor
General InformationManager/Tenure: LaTorre, James J. (2009)
Appleby, Howard (2009)Ducrest, Jean−Francois (2009)
Sub−Advisor: Northern Cross, LLCTicker Symbol: HIINXInception Date: 2002−11−01Expense Ratio: 1.11%
Top Ten HoldingsSchneider Electric SE 2.9%
Banco Bilbao Vizcaya Argentaria SA 2.8%
Roche Holding AG 2.6%
Anheuser−Busch Inbev SA 2.5%
Novo Nordisk A/S 2.5%
Rolls−Royce Holdings PLC 2.5%
Novartis AG 2.3%
AXA SA 2.3%
Lloyds Banking Group PLC 2.3%
SAP SE 2.2%
Total: 24.8%
Asset CompositionUS Stocks 1.7%Non US Stocks 93.5%US Bonds 0.0%Non US Bonds 0.0%Cash 4.6%Preferreds 0.0%Convertibles 0.0%Other 0.1%
Market Cap RangeGiant 66.9%Large 31.7%Mid 1.3%Small 0.0%Micro 0.0%
Performance (09/30/14) QTD YTD 1 Year 3 Years 5 Years 10 YearsHarbor International Investor −7.08 −3.14 1.38 13.35 7.20 8.60MSCI EAFE −5.88 −1.38 4.25 13.65 6.56 6.32Morningstar Foreign Large Blend Funds Avg −5.62 −2.01 3.75 13.05 6.22 6.25
Calendar Year Performance 2004 2005 2006 2007 2008 2009 2010 2011 2012 2013Harbor International Investor 17.49 20.31 32.17 21.35 −42.86 38.04 11.57 −11.44 20.41 16.40MSCI EAFE 20.25 13.54 26.34 11.17 −43.38 31.78 7.75 −12.14 17.32 22.78Morningstar Foreign Large Blend Funds Avg 17.39 14.72 24.77 12.71 −43.99 31.24 10.24 −13.97 18.29 19.44
Characteristics
P/E RatioFund 17.21xIndex 15.83x
P/B RatioFund 1.77xIndex 1.57x
Turnover Ratio 10%
Avg Market CapFund ($MM) 53,068Index ($MM) 36,484
Number of Holdings 112
Total Fund Assets ($MM) 51,931
Sector AllocationFund Index
30.0%
25.0%
20.0%
13.7
%
8.
3%
12.2
%
11
.0%
19.7
% 22.2
%
3.4%
3.5%
16.3
%10
.9%
11.1
%11
.4%
0.0%
3.7%
0.0%
5.
2%
3.5%
7.1%
15.7
%11
.4%
4.4%
5.4%
15.0%
10.0%
5.0%
0.0%Basc Mtrls Financial Cons Dfnse Utility Energy Tech
Cons Cycl RealEstate Health Comm Serv Industrls
Country AllocationFund
30.0%
25.0%
20.0% 19.7
%
15.6
%
14.9
%
9 .8%
9 .6%
5.5%
4 .6%
2 .6%
2.6%
1 .9%
15.0%
10.0%
5.0%
0.0%DNKFRA GBR JPN ESP
CHE DEU SWE BEL ITA
Data Source: Morningstar Data as of 09/30/2014.
FOR INSTITUTIONAL USE ONLY − NOT FOR USE WITH INDIVIDUAL INVESTORS 24WF116290 00024 08−10
ððð
75.5%
9.9%14.7%
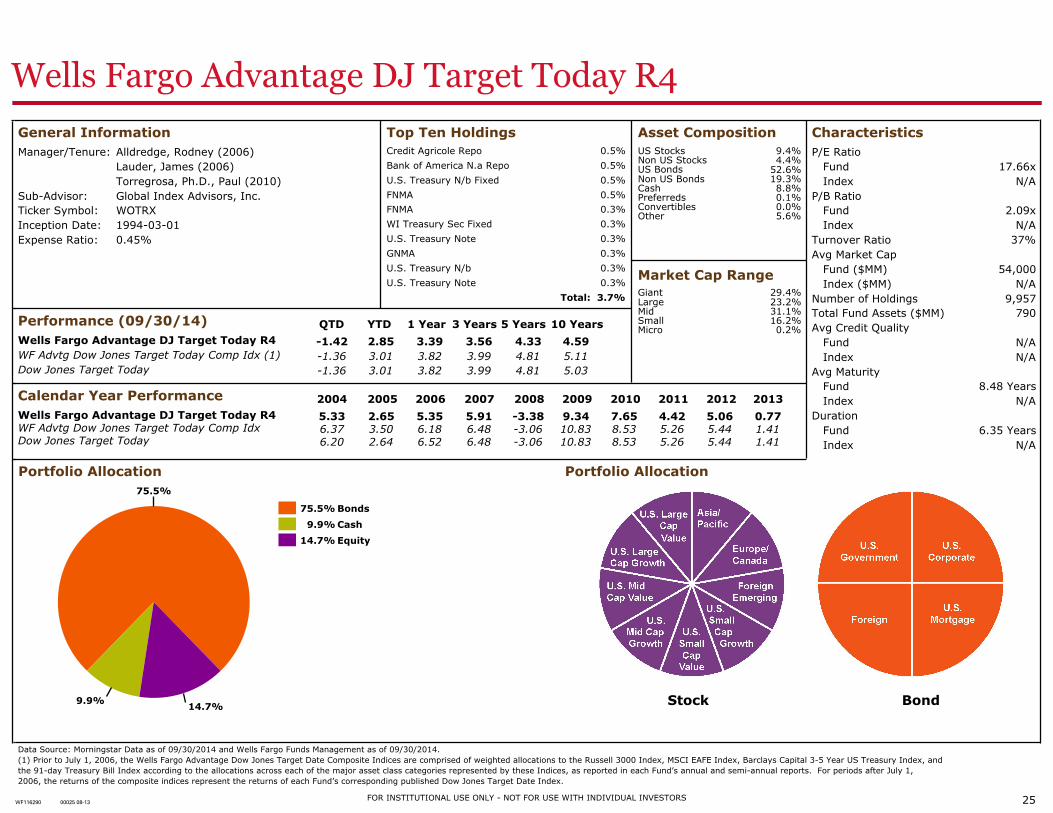
Wells Fargo Advantage DJ Target Today R4
General InformationManager/Tenure: Alldredge, Rodney (2006)
Lauder, James (2006)Torregrosa, Ph.D., Paul (2010)
Sub−Advisor: Global Index Advisors, Inc.Ticker Symbol: WOTRXInception Date: 1994−03−01Expense Ratio: 0.45%
Top Ten HoldingsCredit Agricole Repo 0.5%
Bank of America N.a Repo 0.5%
U.S. Treasury N/b Fixed 0.5%
FNMA 0.5%
FNMA 0.3%
WI Treasury Sec Fixed 0.3%
U.S. Treasury Note 0.3%
GNMA 0.3%
U.S. Treasury N/b 0.3%
U.S. Treasury Note 0.3%
Total: 3.7%
Asset CompositionUS Stocks 9.4%Non US Stocks 4.4%US Bonds 52.6%Non US Bonds 19.3%Cash 8.8%Preferreds 0.1%Convertibles 0.0%Other 5.6%
Market Cap RangeGiant 29.4%Large 23.2%Mid 31.1%Small 16.2%Micro 0.2%
Performance (09/30/14) QTD YTD 1 Year 3 Years 5 Years 10 YearsWells Fargo Advantage DJ Target Today R4 −1.42 2.85 3.39 3.56 4.33 4.59WF Advtg Dow Jones Target Today Comp Idx (1) −1.36 3.01 3.82 3.99 4.81 5.11Dow Jones Target Today −1.36 3.01 3.82 3.99 4.81 5.03
Calendar Year Performance 2004 2005 2006 2007 2008 2009 2010 2011 2012 2013Wells Fargo Advantage DJ Target Today R4 5.33 2.65 5.35 5.91 −3.38 9.34 7.65 4.42 5.06 0.77WF Advtg Dow Jones Target Today Comp Idx 6.37 3.50 6.18 6.48 −3.06 10.83 8.53 5.26 5.44 1.41Dow Jones Target Today 6.20 2.64 6.52 6.48 −3.06 10.83 8.53 5.26 5.44 1.41
CharacteristicsP/E Ratio
Fund 17.66xIndex N/A
P/B RatioFund 2.09xIndex N/A
Turnover Ratio 37%Avg Market Cap
Fund ($MM) 54,000Index ($MM) N/A
Number of Holdings 9,957Total Fund Assets ($MM) 790Avg Credit Quality
Fund N/AIndex N/A
Avg MaturityFund 8.48 YearsIndex N/A
DurationFund 6.35 YearsIndex N/A
Portfolio Allocation
75.5% Bonds
9.9% Cash
14.7% Equity
Portfolio Allocation
Stock Bond
Data Source: Morningstar Data as of 09/30/2014 and Wells Fargo Funds Management as of 09/30/2014.(1) Prior to July 1, 2006, the Wells Fargo Advantage Dow Jones Target Date Composite Indices are comprised of weighted allocations to the Russell 3000 Index, MSCI EAFE Index, Barclays Capital 3−5 Year US Treasury Index, andthe 91−day Treasury Bill Index according to the allocations across each of the major asset class categories represented by these Indices, as reported in each Fund’s annual and semi−annual reports. For periods after July 1,2006, the returns of the composite indices represent the returns of each Fund’s corresponding published Dow Jones Target Date Index.
FOR INSTITUTIONAL USE ONLY − NOT FOR USE WITH INDIVIDUAL INVESTORS 25WF116290 00025 08−13
ððð
78.0%
4.1%
17.9%
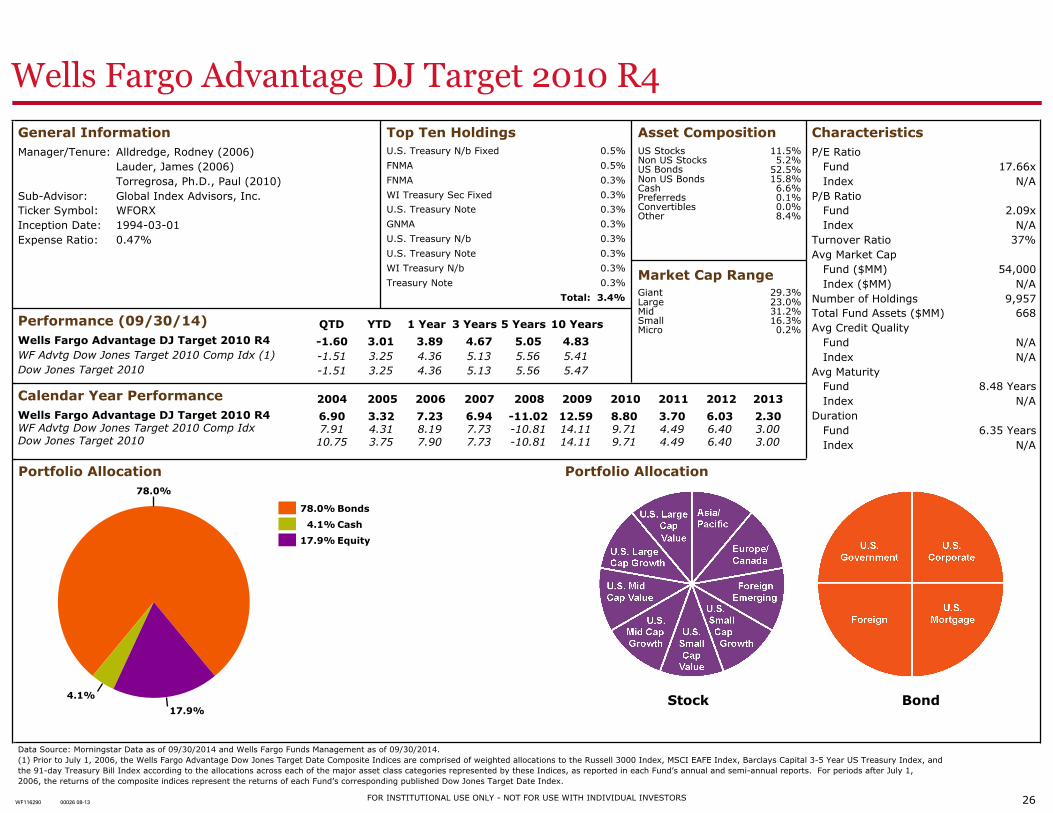
Wells Fargo Advantage DJ Target 2010 R4
General InformationManager/Tenure: Alldredge, Rodney (2006)
Lauder, James (2006)Torregrosa, Ph.D., Paul (2010)
Sub−Advisor: Global Index Advisors, Inc.Ticker Symbol: WFORXInception Date: 1994−03−01Expense Ratio: 0.47%
Top Ten HoldingsU.S. Treasury N/b Fixed 0.5%
FNMA 0.5%
FNMA 0.3%
WI Treasury Sec Fixed 0.3%
U.S. Treasury Note 0.3%
GNMA 0.3%
U.S. Treasury N/b 0.3%
U.S. Treasury Note 0.3%
WI Treasury N/b 0.3%
Treasury Note 0.3%
Total: 3.4%
Asset CompositionUS Stocks 11.5%Non US Stocks 5.2%US Bonds 52.5%Non US Bonds 15.8%Cash 6.6%Preferreds 0.1%Convertibles 0.0%Other 8.4%
Market Cap RangeGiant 29.3%Large 23.0%Mid 31.2%Small 16.3%Micro 0.2%
Performance (09/30/14) QTD YTD 1 Year 3 Years 5 Years 10 YearsWells Fargo Advantage DJ Target 2010 R4 −1.60 3.01 3.89 4.67 5.05 4.83WF Advtg Dow Jones Target 2010 Comp Idx (1) −1.51 3.25 4.36 5.13 5.56 5.41Dow Jones Target 2010 −1.51 3.25 4.36 5.13 5.56 5.47
Calendar Year Performance 2004 2005 2006 2007 2008 2009 2010 2011 2012 2013Wells Fargo Advantage DJ Target 2010 R4 6.90 3.32 7.23 6.94 −11.02 12.59 8.80 3.70 6.03 2.30WF Advtg Dow Jones Target 2010 Comp Idx 7.91 4.31 8.19 7.73 −10.81 14.11 9.71 4.49 6.40 3.00Dow Jones Target 2010 10.75 3.75 7.90 7.73 −10.81 14.11 9.71 4.49 6.40 3.00
CharacteristicsP/E Ratio
Fund 17.66xIndex N/A
P/B RatioFund 2.09xIndex N/A
Turnover Ratio 37%Avg Market Cap
Fund ($MM) 54,000Index ($MM) N/A
Number of Holdings 9,957Total Fund Assets ($MM) 668Avg Credit Quality
Fund N/AIndex N/A
Avg MaturityFund 8.48 YearsIndex N/A
DurationFund 6.35 YearsIndex N/A
Portfolio Allocation
78.0% Bonds
4.1% Cash
17.9% Equity
Portfolio Allocation
Stock Bond
Data Source: Morningstar Data as of 09/30/2014 and Wells Fargo Funds Management as of 09/30/2014.(1) Prior to July 1, 2006, the Wells Fargo Advantage Dow Jones Target Date Composite Indices are comprised of weighted allocations to the Russell 3000 Index, MSCI EAFE Index, Barclays Capital 3−5 Year US Treasury Index, andthe 91−day Treasury Bill Index according to the allocations across each of the major asset class categories represented by these Indices, as reported in each Fund’s annual and semi−annual reports. For periods after July 1,2006, the returns of the composite indices represent the returns of each Fund’s corresponding published Dow Jones Target Date Index.
FOR INSTITUTIONAL USE ONLY − NOT FOR USE WITH INDIVIDUAL INVESTORS 26WF116290 00026 08−13
ððð
60.1%
4.1%
35.8%
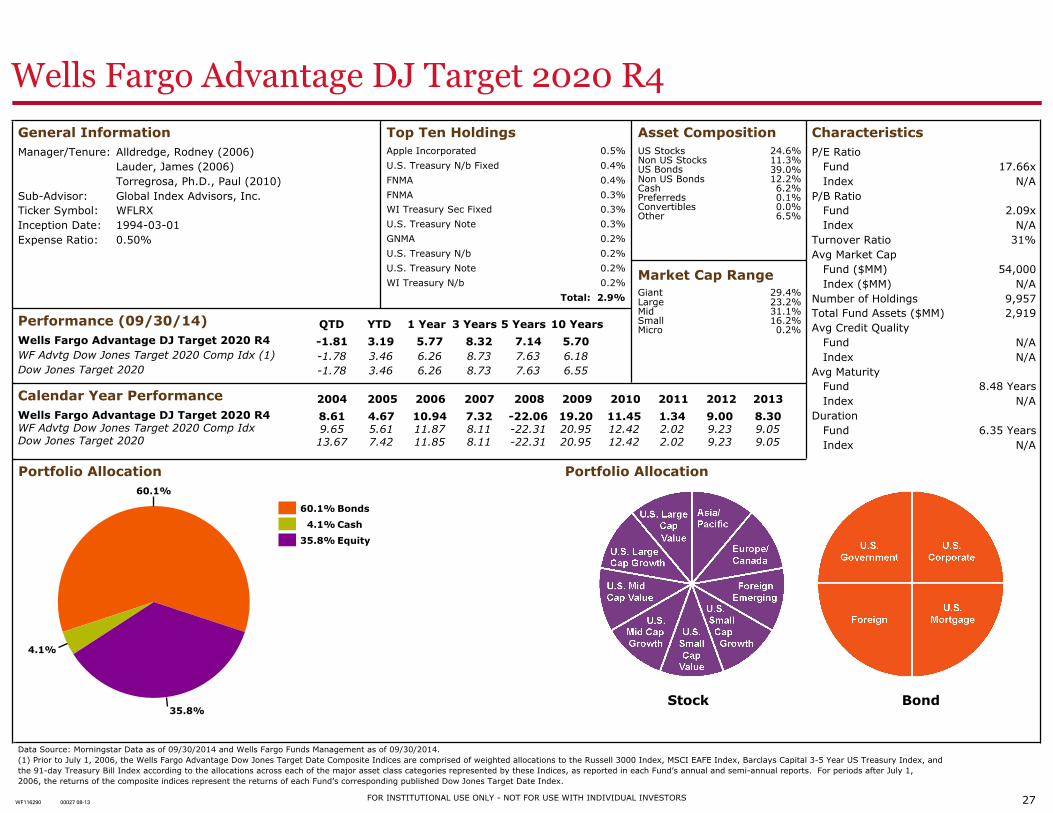
Wells Fargo Advantage DJ Target 2020 R4
General InformationManager/Tenure: Alldredge, Rodney (2006)
Lauder, James (2006)Torregrosa, Ph.D., Paul (2010)
Sub−Advisor: Global Index Advisors, Inc.Ticker Symbol: WFLRXInception Date: 1994−03−01Expense Ratio: 0.50%
Top Ten HoldingsApple Incorporated 0.5%
U.S. Treasury N/b Fixed 0.4%
FNMA 0.4%
FNMA 0.3%
WI Treasury Sec Fixed 0.3%
U.S. Treasury Note 0.3%
GNMA 0.2%
U.S. Treasury N/b 0.2%
U.S. Treasury Note 0.2%
WI Treasury N/b 0.2%
Total: 2.9%
Asset CompositionUS Stocks 24.6%Non US Stocks 11.3%US Bonds 39.0%Non US Bonds 12.2%Cash 6.2%Preferreds 0.1%Convertibles 0.0%Other 6.5%
Market Cap RangeGiant 29.4%Large 23.2%Mid 31.1%Small 16.2%Micro 0.2%
Performance (09/30/14) QTD YTD 1 Year 3 Years 5 Years 10 YearsWells Fargo Advantage DJ Target 2020 R4 −1.81 3.19 5.77 8.32 7.14 5.70WF Advtg Dow Jones Target 2020 Comp Idx (1) −1.78 3.46 6.26 8.73 7.63 6.18Dow Jones Target 2020 −1.78 3.46 6.26 8.73 7.63 6.55
Calendar Year Performance 2004 2005 2006 2007 2008 2009 2010 2011 2012 2013Wells Fargo Advantage DJ Target 2020 R4 8.61 4.67 10.94 7.32 −22.06 19.20 11.45 1.34 9.00 8.30WF Advtg Dow Jones Target 2020 Comp Idx 9.65 5.61 11.87 8.11 −22.31 20.95 12.42 2.02 9.23 9.05Dow Jones Target 2020 13.67 7.42 11.85 8.11 −22.31 20.95 12.42 2.02 9.23 9.05
CharacteristicsP/E Ratio
Fund 17.66xIndex N/A
P/B RatioFund 2.09xIndex N/A
Turnover Ratio 31%Avg Market Cap
Fund ($MM) 54,000Index ($MM) N/A
Number of Holdings 9,957Total Fund Assets ($MM) 2,919Avg Credit Quality
Fund N/AIndex N/A
Avg MaturityFund 8.48 YearsIndex N/A
DurationFund 6.35 YearsIndex N/A
Portfolio Allocation
60.1% Bonds
4.1% Cash
35.8% Equity
Portfolio Allocation
Stock Bond
Data Source: Morningstar Data as of 09/30/2014 and Wells Fargo Funds Management as of 09/30/2014.(1) Prior to July 1, 2006, the Wells Fargo Advantage Dow Jones Target Date Composite Indices are comprised of weighted allocations to the Russell 3000 Index, MSCI EAFE Index, Barclays Capital 3−5 Year US Treasury Index, andthe 91−day Treasury Bill Index according to the allocations across each of the major asset class categories represented by these Indices, as reported in each Fund’s annual and semi−annual reports. For periods after July 1,2006, the returns of the composite indices represent the returns of each Fund’s corresponding published Dow Jones Target Date Index.
FOR INSTITUTIONAL USE ONLY − NOT FOR USE WITH INDIVIDUAL INVESTORS 27WF116290 00027 08−13
ððð
33.6%
4.1%
62.3%
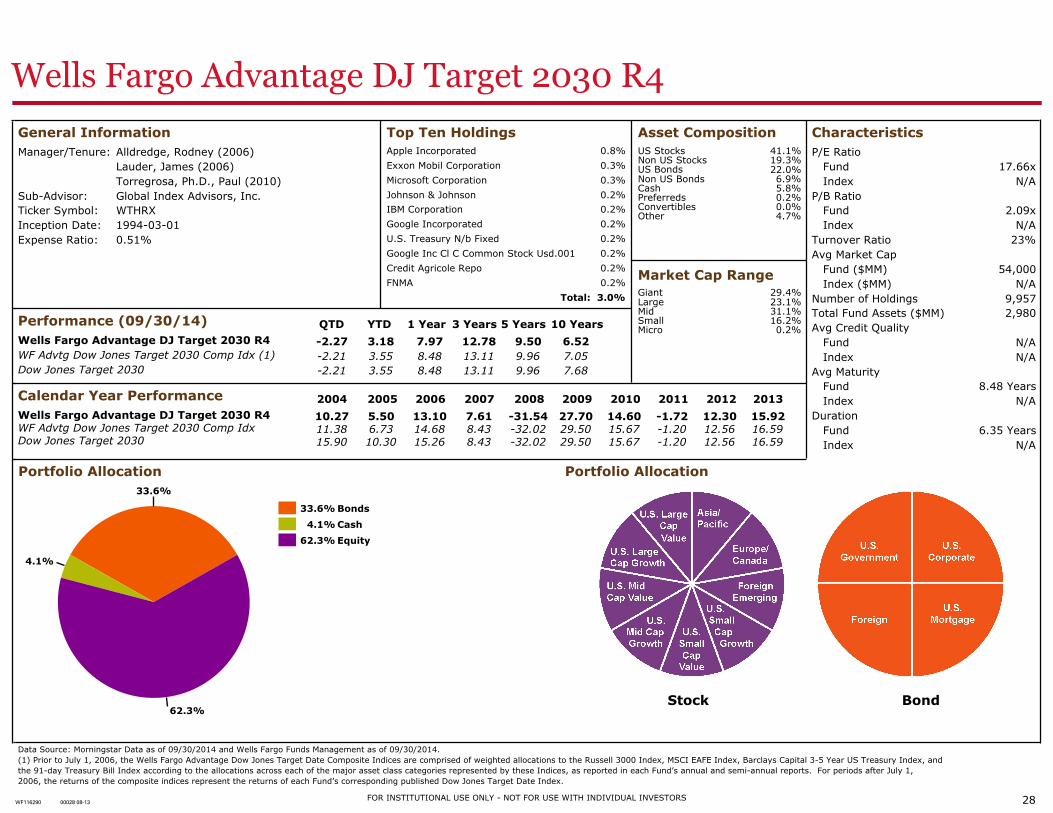
Wells Fargo Advantage DJ Target 2030 R4
General InformationManager/Tenure: Alldredge, Rodney (2006)
Lauder, James (2006)Torregrosa, Ph.D., Paul (2010)
Sub−Advisor: Global Index Advisors, Inc.Ticker Symbol: WTHRXInception Date: 1994−03−01Expense Ratio: 0.51%
Top Ten HoldingsApple Incorporated 0.8%
Exxon Mobil Corporation 0.3%
Microsoft Corporation 0.3%
Johnson & Johnson 0.2%
IBM Corporation 0.2%
Google Incorporated 0.2%
U.S. Treasury N/b Fixed 0.2%
Google Inc Cl C Common Stock Usd.001 0.2%
Credit Agricole Repo 0.2%
FNMA 0.2%
Total: 3.0%
Asset CompositionUS Stocks 41.1%Non US Stocks 19.3%US Bonds 22.0%Non US Bonds 6.9%Cash 5.8%Preferreds 0.2%Convertibles 0.0%Other 4.7%
Market Cap RangeGiant 29.4%Large 23.1%Mid 31.1%Small 16.2%Micro 0.2%
Performance (09/30/14) QTD YTD 1 Year 3 Years 5 Years 10 YearsWells Fargo Advantage DJ Target 2030 R4 −2.27 3.18 7.97 12.78 9.50 6.52WF Advtg Dow Jones Target 2030 Comp Idx (1) −2.21 3.55 8.48 13.11 9.96 7.05Dow Jones Target 2030 −2.21 3.55 8.48 13.11 9.96 7.68
Calendar Year Performance 2004 2005 2006 2007 2008 2009 2010 2011 2012 2013Wells Fargo Advantage DJ Target 2030 R4 10.27 5.50 13.10 7.61 −31.54 27.70 14.60 −1.72 12.30 15.92WF Advtg Dow Jones Target 2030 Comp Idx 11.38 6.73 14.68 8.43 −32.02 29.50 15.67 −1.20 12.56 16.59Dow Jones Target 2030 15.90 10.30 15.26 8.43 −32.02 29.50 15.67 −1.20 12.56 16.59
CharacteristicsP/E Ratio
Fund 17.66xIndex N/A
P/B RatioFund 2.09xIndex N/A
Turnover Ratio 23%Avg Market Cap
Fund ($MM) 54,000Index ($MM) N/A
Number of Holdings 9,957Total Fund Assets ($MM) 2,980Avg Credit Quality
Fund N/AIndex N/A
Avg MaturityFund 8.48 YearsIndex N/A
DurationFund 6.35 YearsIndex N/A
Portfolio Allocation
33.6% Bonds
4.1% Cash
62.3% Equity
Portfolio Allocation
Stock Bond
Data Source: Morningstar Data as of 09/30/2014 and Wells Fargo Funds Management as of 09/30/2014.(1) Prior to July 1, 2006, the Wells Fargo Advantage Dow Jones Target Date Composite Indices are comprised of weighted allocations to the Russell 3000 Index, MSCI EAFE Index, Barclays Capital 3−5 Year US Treasury Index, andthe 91−day Treasury Bill Index according to the allocations across each of the major asset class categories represented by these Indices, as reported in each Fund’s annual and semi−annual reports. For periods after July 1,2006, the returns of the composite indices represent the returns of each Fund’s corresponding published Dow Jones Target Date Index.
FOR INSTITUTIONAL USE ONLY − NOT FOR USE WITH INDIVIDUAL INVESTORS 28WF116290 00028 08−13
ððð
12.9%
4.2%
83.0%
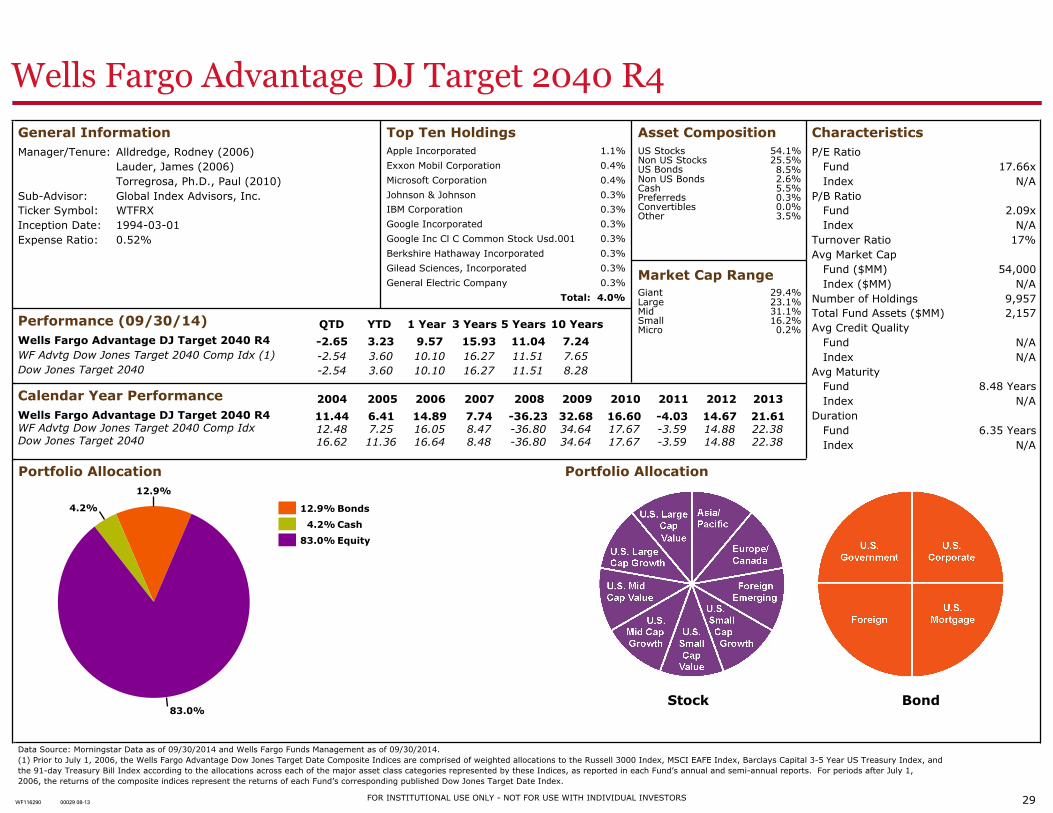
Wells Fargo Advantage DJ Target 2040 R4
General InformationManager/Tenure: Alldredge, Rodney (2006)
Lauder, James (2006)Torregrosa, Ph.D., Paul (2010)
Sub−Advisor: Global Index Advisors, Inc.Ticker Symbol: WTFRXInception Date: 1994−03−01Expense Ratio: 0.52%
Top Ten HoldingsApple Incorporated 1.1%
Exxon Mobil Corporation 0.4%
Microsoft Corporation 0.4%
Johnson & Johnson 0.3%
IBM Corporation 0.3%
Google Incorporated 0.3%
Google Inc Cl C Common Stock Usd.001 0.3%
Berkshire Hathaway Incorporated 0.3%
Gilead Sciences, Incorporated 0.3%
General Electric Company 0.3%
Total: 4.0%
Asset CompositionUS Stocks 54.1%Non US Stocks 25.5%US Bonds 8.5%Non US Bonds 2.6%Cash 5.5%Preferreds 0.3%Convertibles 0.0%Other 3.5%
Market Cap RangeGiant 29.4%Large 23.1%Mid 31.1%Small 16.2%Micro 0.2%
Performance (09/30/14) QTD YTD 1 Year 3 Years 5 Years 10 YearsWells Fargo Advantage DJ Target 2040 R4 −2.65 3.23 9.57 15.93 11.04 7.24WF Advtg Dow Jones Target 2040 Comp Idx (1) −2.54 3.60 10.10 16.27 11.51 7.65Dow Jones Target 2040 −2.54 3.60 10.10 16.27 11.51 8.28
Calendar Year Performance 2004 2005 2006 2007 2008 2009 2010 2011 2012 2013Wells Fargo Advantage DJ Target 2040 R4 11.44 6.41 14.89 7.74 −36.23 32.68 16.60 −4.03 14.67 21.61WF Advtg Dow Jones Target 2040 Comp Idx 12.48 7.25 16.05 8.47 −36.80 34.64 17.67 −3.59 14.88 22.38Dow Jones Target 2040 16.62 11.36 16.64 8.48 −36.80 34.64 17.67 −3.59 14.88 22.38
CharacteristicsP/E Ratio
Fund 17.66xIndex N/A
P/B RatioFund 2.09xIndex N/A
Turnover Ratio 17%Avg Market Cap
Fund ($MM) 54,000Index ($MM) N/A
Number of Holdings 9,957Total Fund Assets ($MM) 2,157Avg Credit Quality
Fund N/AIndex N/A
Avg MaturityFund 8.48 YearsIndex N/A
DurationFund 6.35 YearsIndex N/A
Portfolio Allocation
12.9% Bonds
4.2% Cash
83.0% Equity
Portfolio Allocation
Stock Bond
Data Source: Morningstar Data as of 09/30/2014 and Wells Fargo Funds Management as of 09/30/2014.(1) Prior to July 1, 2006, the Wells Fargo Advantage Dow Jones Target Date Composite Indices are comprised of weighted allocations to the Russell 3000 Index, MSCI EAFE Index, Barclays Capital 3−5 Year US Treasury Index, andthe 91−day Treasury Bill Index according to the allocations across each of the major asset class categories represented by these Indices, as reported in each Fund’s annual and semi−annual reports. For periods after July 1,2006, the returns of the composite indices represent the returns of each Fund’s corresponding published Dow Jones Target Date Index.
FOR INSTITUTIONAL USE ONLY − NOT FOR USE WITH INDIVIDUAL INVESTORS 29WF116290 00029 08−13
ððð
6.3%4.2%
89.6%
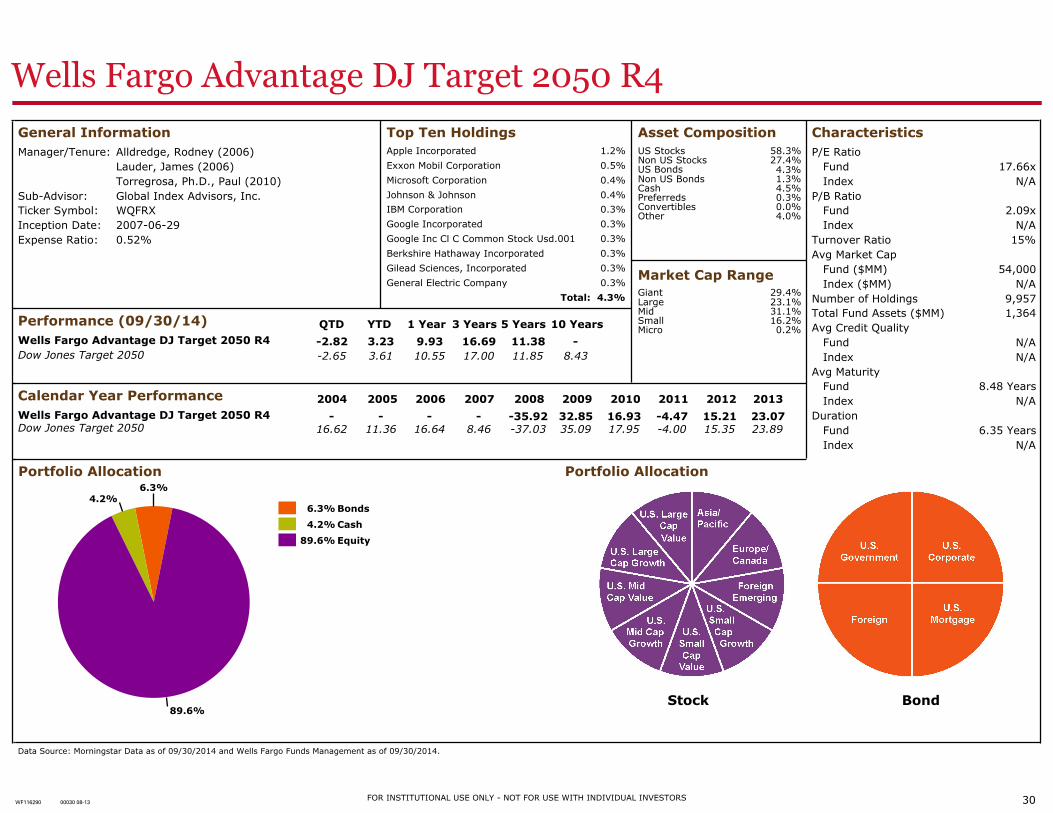
Wells Fargo Advantage DJ Target 2050 R4
General InformationManager/Tenure: Alldredge, Rodney (2006)
Lauder, James (2006)Torregrosa, Ph.D., Paul (2010)
Sub−Advisor: Global Index Advisors, Inc.Ticker Symbol: WQFRXInception Date: 2007−06−29Expense Ratio: 0.52%
Top Ten HoldingsApple Incorporated 1.2%
Exxon Mobil Corporation 0.5%
Microsoft Corporation 0.4%
Johnson & Johnson 0.4%
IBM Corporation 0.3%
Google Incorporated 0.3%
Google Inc Cl C Common Stock Usd.001 0.3%
Berkshire Hathaway Incorporated 0.3%
Gilead Sciences, Incorporated 0.3%
General Electric Company 0.3%
Total: 4.3%
Asset CompositionUS Stocks 58.3%Non US Stocks 27.4%US Bonds 4.3%Non US Bonds 1.3%Cash 4.5%Preferreds 0.3%Convertibles 0.0%Other 4.0%
Market Cap RangeGiant 29.4%Large 23.1%Mid 31.1%Small 16.2%Micro 0.2%
Performance (09/30/14) QTD YTD 1 Year 3 Years 5 Years 10 YearsWells Fargo Advantage DJ Target 2050 R4 −2.82 3.23 9.93 16.69 11.38 −Dow Jones Target 2050 −2.65 3.61 10.55 17.00 11.85 8.43
Calendar Year Performance 2004 2005 2006 2007 2008 2009 2010 2011 2012 2013Wells Fargo Advantage DJ Target 2050 R4 − − − − −35.92 32.85 16.93 −4.47 15.21 23.07Dow Jones Target 2050 16.62 11.36 16.64 8.46 −37.03 35.09 17.95 −4.00 15.35 23.89
CharacteristicsP/E Ratio
Fund 17.66xIndex N/A
P/B RatioFund 2.09xIndex N/A
Turnover Ratio 15%Avg Market Cap
Fund ($MM) 54,000Index ($MM) N/A
Number of Holdings 9,957Total Fund Assets ($MM) 1,364Avg Credit Quality
Fund N/AIndex N/A
Avg MaturityFund 8.48 YearsIndex N/A
DurationFund 6.35 YearsIndex N/A
Portfolio Allocation
6.3% Bonds
4.2% Cash
89.6% Equity
Portfolio Allocation
Stock Bond
Data Source: Morningstar Data as of 09/30/2014 and Wells Fargo Funds Management as of 09/30/2014.
FOR INSTITUTIONAL USE ONLY − NOT FOR USE WITH INDIVIDUAL INVESTORS 30WF116290 00030 08−13
This analysis was prepared utilizing secondary data obtained from sources believed to be reliable, including Morningstar, Inc., Encorr,Inc., Lipper, Inc., Hueler Analytics, Zephyr Associates, Inc., and individual investment managers. Wells Fargo makes no representationor warranty regarding the accuracy of this data. This is not an offer to sell shares of any of the above-referenced funds. That can onlybe done through the applicable Prospectus. Past performance is no indication of future results; obtain and review fund prospectusesbefore making investment decisions.
© 1996-2014. Morningstar, Inc. All Rights Reserved. The information contained herein: (1) is proprietary to Morningstar and /or itscontent providers; (2) may not be copied or distributed; and (3) is not warranted to be accurate, complete or timely. NeitherMorningstar nor its content providers are responsible for any damages or losses arising from any use of this information. Pastperformance is no guarantee of future results.
Copyright © 2014 Reuters. All rights reserved. Any copying, republication or redistribution of Information, including by caching,framing or similar means, is expressly prohibited without the prior written consent of Lipper. Lipper shall not be liable for any errors ordelays in the content, or for any actions taken in reliance thereon.
Effective June 26, 2006, the Funds are sub-advised by Global Index Advisors, Inc. ("GIA") and will be managed to track theperformance of the Dow Jones Target Date Indexes before fees and expenses. Prior to this date, the funds were known as the WellsFargo Advantage Outlook Funds and were managed in a primarily passive approach which differed from the Dow Jones Target DateIndexes. Each Fund’s name has been changed to correspond to the name of the Dow Jones Target Date Index that it will seek toreplicate.
The economic update views expressed are those of Wells Fargo Institutional Asset Advisors and are based upon information believed tobe reliable. Wells Fargo makes no representation or warranty to the accuracy of the information. The views are subject to change atany time in response to changing circumstances in the market and are not intended to predict or guarantee the future performance ofany individual security, market sector or the markets in general.
Reproduction or distribution of this report without the express written consent of Wells Fargo is prohibited.
Disclosures
31FOR INSTITUTIONAL USE ONLY − NOT FOR USE WITH INDIVIDUAL INVESTORSWF116290 00031 91