Embed Size (px)
Citation preview

NHS Consultant-led Referral to Treatment (RTT) Waiting Times Statistics for England 2013 Annual Report

2
NHS Consultant-led Referral
to Treatment (RTT) Waiting
Times Statistics for England 2013 Annual Report
First published: February 2014
Prepared by NHS England Analytical Service (Operations)
Insert heading depending on line length; please delete other cover options once you have chosen one. 20pt

3
Contents
Summary ......................................................................................................... 4 1. Introduction .............................................................................................. 5 2. Key terms .................................................................................................. 5 3. England RTT waiting times ..................................................................... 8
3.1. Operational waiting time standards ..................................................... 8 3.2. Average waiting times ....................................................................... 11 3.3. Activity and waiting lists ..................................................................... 12
4. Specialty RTT waiting times .................................................................. 16 5. Regional RTT waiting times .................................................................. 20 6. Annex ...................................................................................................... 21
6.1. Methodology ...................................................................................... 21 6.2. Glossary ............................................................................................ 24 6.3. Feedback Welcomed ......................................................................... 26 6.4. Additional Information ........................................................................ 26

4
Summary
• More than 90% of RTT patients started treatment within 18 weeks of referral in 2013. The operational standards for admitted, non-admitted and incomplete pathways were met nationally in all 12 months of the 2013 calendar year.
• Since April 2013, there has been a slight reduction in the percentage of patients who started admitted and non-admitted treatment within 18 weeks at England level compared with the same months in 2012, however the overall trend remains broadly stable, and has been since January 2009.
• During 2013, the percentage of incomplete pathways within 18 weeks has been broadly stable, following an overall increase during 2011 and 2012. Since August 2013, there has been a slight reduction in the percentage of incomplete pathways within 18 weeks compared to the same months in 2012 but it is too early to determine whether there is a downward trend.
• In 2013, half of patients waited less than nine weeks to start admitted treatment and half of those patients waiting for treatment at the end of the month had been waiting less than six weeks. Since April 2013, half of patients waited less than five weeks to start non-admitted treatment.
• The number of RTT patients who started admitted consultant-led treatment in 2013 has been similar to previous years’ levels of activity. An average of just over 300,000 RTT patients started admitted treatment each month. Since April 2013, the removal of consultant-led sexual health services from RTT waiting times data has contributed to a reduction in the number of RTT patients who started non-admitted consultant-led treatment each month. Since April 2013, an average of just under 850,000 patients started non-admitted treatment each month.
• From April 2012, the number of RTT patients waiting to start treatment has been at a higher level each month than the same month in the previous year. During 2013, the number of RTT patients waiting at the end of each month has been on average around 250,000 higher than the same months in 2012.
5
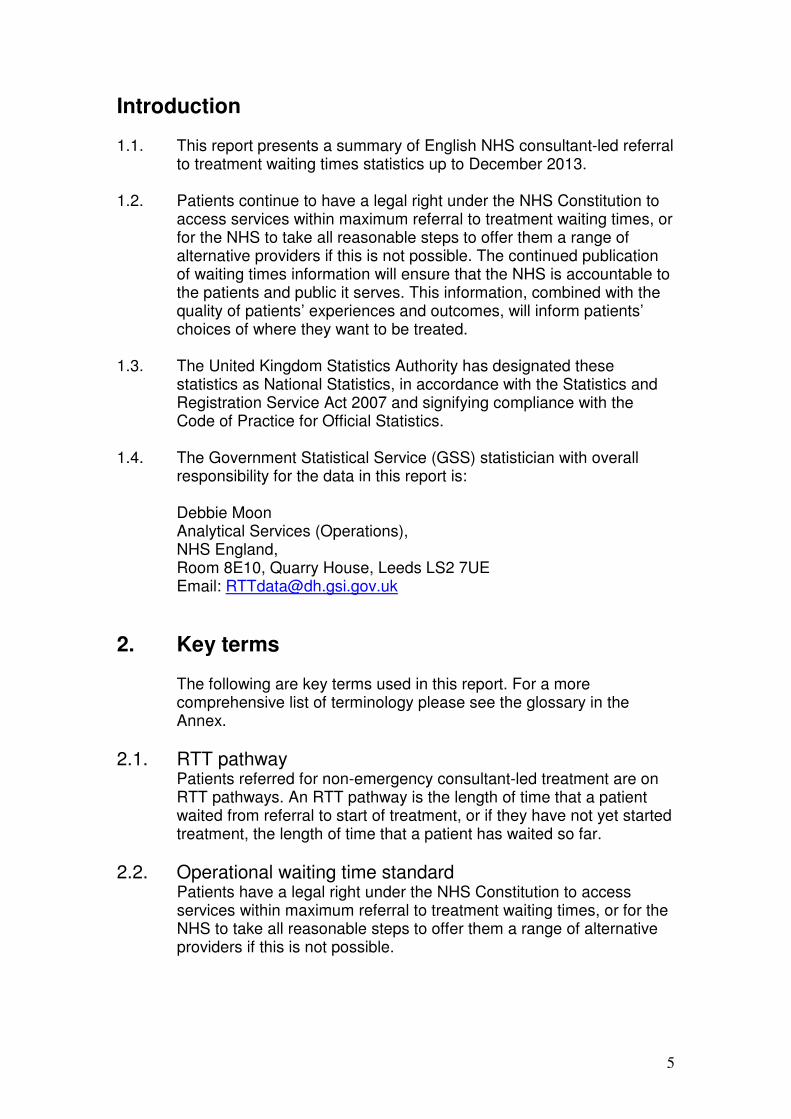
Introduction 1.1. This report presents a summary of English NHS consultant-led referral
to treatment waiting times statistics up to December 2013. 1.2. Patients continue to have a legal right under the NHS Constitution to
access services within maximum referral to treatment waiting times, or for the NHS to take all reasonable steps to offer them a range of alternative providers if this is not possible. The continued publication of waiting times information will ensure that the NHS is accountable to the patients and public it serves. This information, combined with the quality of patients’ experiences and outcomes, will inform patients’ choices of where they want to be treated.
1.3. The United Kingdom Statistics Authority has designated these
statistics as National Statistics, in accordance with the Statistics and Registration Service Act 2007 and signifying compliance with the Code of Practice for Official Statistics.
1.4. The Government Statistical Service (GSS) statistician with overall
responsibility for the data in this report is:
Debbie Moon Analytical Services (Operations), NHS England, Room 8E10, Quarry House, Leeds LS2 7UE Email: [email protected]
2. Key terms
The following are key terms used in this report. For a more comprehensive list of terminology please see the glossary in the Annex.
2.1. RTT pathway Patients referred for non-emergency consultant-led treatment are on RTT pathways. An RTT pathway is the length of time that a patient waited from referral to start of treatment, or if they have not yet started treatment, the length of time that a patient has waited so far.
2.2. Operational waiting time standard Patients have a legal right under the NHS Constitution to access services within maximum referral to treatment waiting times, or for the NHS to take all reasonable steps to offer them a range of alternative providers if this is not possible.

6
The waiting time operational standards for 2013/14 are set out in Everyone Counts: Planning for Patients 2013/141. The waiting time standards set the proportion of RTT pathways that must be within 18 weeks. These proportions leave an operational tolerance to allow for patients for whom starting treatment within 18 weeks would be inconvenient or clinically inappropriate. These circumstances can be categorised as:
• Patient choice – patients choose not to accept earliest offered appointments along their pathway or choose to delay treatments for personal or social reasons
• Co-operation – patients who do not attend appointments along their pathways
• Clinical exceptions – where it is not clinically appropriate to start a patient’s treatment within 18 weeks
NHS England has also introduced a zero tolerance of any referral to treatment waits of more than 52 weeks in 2013/14, with contractual penalties for each such wait.
2.3. Admitted pathways The admitted waiting time standard is 90% and applies to admitted adjusted RTT pathways. This standard came into effect in 2008. Admitted pathways are the waiting times for patients whose treatment started during the month and involved admission to hospital. These are also often referred to as inpatient waiting times, but include the complete time waited from referral until start of inpatient treatment. Adjustments are allowed to admitted pathways for clock pauses. An RTT clock may be paused only where a decision to admit for treatment has been made, and the patient has declined at least two reasonable appointment offers for admission. The RTT clock is paused for the duration of the time between the earliest reasonable offer and the date from which the patient makes themselves available for admission for treatment.
2.4. Non-admitted pathways The non-admitted waiting time standard is 95%. This standard came into effect in 2008. Non-admitted pathways are the waiting times for patients whose treatment started during the month and did not involve admission to hospital. These are also often referred to as outpatient waiting times, but they include the time waited for patients whose RTT waiting time clock either stopped for treatment or other reasons, such as a patient declining treatment.
2.5. Incomplete pathways The incomplete waiting time standard is 92%. The Department of Health introduced this new operational standard from April 2012 onwards. Incomplete pathways are the waiting times for patients
1 http://www.england.nhs.uk/wp-content/uploads/2012/12/everyonecounts-planning.pdf

7
waiting to start treatment at the end of the month. These are also often referred to as waiting list waiting times and the volume of incomplete RTT pathways as the size of the RTT waiting list.

8
3. England RTT waiting times
3.1. Operational waiting time standards 3.1.1. More than 90% of RTT patients started treatment within 18 weeks of
referral in 2013. All three operational waiting time standards were met in all 12 months of the 2013 calendar year.
3.1.2. Since April 2013, there has been a slight reduction in the percentage of patients who started admitted and non-admitted treatment within 18 weeks at England level compared with the same months in 2012, however the overall trend remains broadly stable, and has been since January 2009 (Table 1 and Chart 1).
3.1.3. Following a dip in performance against the admitted standard at
England level in early 2011 – when the percentage of patients who started admitted treatment within 18 weeks dropped below 90% –performance against the admitted standard gradually increased during 2011 and 2012. During 2013, it ranged between 91.0% (in November 2013) and 92.6% (in January 2013).
3.1.4. Performance against the non-admitted standard has been consistently
above 95% since July 2008. During 2013, it ranged between 96.5% (in November 2013) and 97.6% (in March 2013).
Table 1: Annual percentage of completed RTT pathways within 18 weeks, England
Admitted (adjusted) pathways
% within 18 weeks
Non-admitted pathways
% within 18 weeks
20081 86.6% 93.1%
2009 93.2% 97.6%
2010 92.5% 97.9%
2011 90.5% 97.3%
2012 92.2% 97.5%
2013 91.8% 97.1%
1Adjusted admitted data is available from March 2008. The 2008 figure is a combination of unadjusted
data (for January and February 2008) and adjusted data for the rest of the year.

9
Chart 1: Percentage of completed RTT pathways within 18 weeks, England
3.1.5. During 2013, the percentage of incomplete pathways within 18 weeks
has been broadly stable, ranging between 93.6% (at the end of December 2013) and 94.8% (at the end of May 2013). Since August 2013, there has been a slight reduction in the percentage of incomplete pathways within 18 weeks compared to the same months in 2012 but it is too early to determine whether there is a downward trend (Table 2 and Chart 2).
Chart 2: Percentage of incomplete RTT pathways within 18 weeks, England

10
3.1.6. Prior to 2013, the percentage of incomplete pathways within 18 weeks at England level increased during 2011 and 2012, following the announcement in November 2011 and introduction from April 2012 of the 92% incomplete standard. Before the announcement of the standard, the percentage of incomplete pathways fluctuated around 90%. A gradual decrease during 2010 contributed to the larger seasonal dip in the admitted percentage within 18 weeks in early 2011 as a larger proportion of the longer wait patients started treatment.
Table 2: Percentage of incomplete RTT pathways within 18 weeks, England
Incomplete pathways
% within 18 weeks
Dec-07 56.4%
Dec-08 85.2%
Dec-09 90.0%
Dec-10 88.6%
Dec-11 91.4%
Dec-12 94.5%
Dec-13 93.6%
3.1.7. NHS England introduced a zero tolerance of any referral to treatment waits of more than 52 weeks in 2013/14. The number of incomplete pathways greater than 52 weeks has fallen from over 400,000 in 2007 to just over 300 at the end of December 2013 (Table 3). It is likely that some of this reduction is due to some trusts identifying incomplete pathways of more than 52 weeks that were data errors through validation work.
Table 3: Number of incomplete pathways greater than 52 weeks, England
Incomplete pathways
52 week waits
Dec-07 434,180
Dec-08 79,418
Dec-09 20,792
Dec-10 14,671
Dec-11 6,071
Dec-121 1,085
Dec-131 317
1See annex for details of missing data for some trusts.

11
3.2. Average waiting times 3.2.1. The median waiting time is the middle value when all patients are
ordered by length of wait. For completed admitted and non-admitted pathways, 50% of patients started treatment within the median waiting time and for incomplete pathways, 50% of patients were waiting within the median waiting time (Chart 3).
3.2.2. The median time waited for admitted patients and the incomplete pathway (patients waiting at month end) median waiting time have been slightly higher during 2013 than the same months in 2012, however the overall trend remains broadly stable since 2008, following the seasonal pattern seen in previous years.
3.2.3. The median time waited for non-admitted patients increased from 3.9
weeks in March 2013 to 5.1 weeks in April 2013. This step change was out of line with the seasonal pattern seen in previous years and much of the increase is likely to be a result of the transfer of responsibility for commissioning consultant-led sexual health services to local authorities from April 20132.
3.2.4. In 2013, half of patients waited less than nine weeks to start admitted
treatment and half of those patients waiting for treatment at the end of the month had been waiting less than six weeks. Since April 2013, half of patients waited less than five weeks to start non-admitted treatment.
Chart 3: Average (median) RTT waiting times, England
2 From April 2013, reported consultant-led RTT waiting times no longer include waiting times for consultant-led sexual
health services as they are no longer commissioned by the NHS. Consultant-led sexual health pathways included in the RTT waiting times prior to April 2013 were predominantly within a week long and involved non-admitted treatment.

12
3.2.5. The incomplete pathway median waiting time tends to peak in the
middle of winter, around December and January. This is followed by an increase in the median time waited for admitted and non-admitted pathways. The delayed peaks for completed pathways demonstrate the relationship between incomplete pathway waiting times and admitted and non-admitted pathway ‘time waited’ waiting times.
3.2.6. Incomplete pathways are the waiting times for patients waiting to start
treatment. When these patients start treatment, the time that they waited is captured in the admitted and non-admitted waiting times. Therefore, if there is an increase in the waiting times of patients who have not started treatment, in subsequent months this will be followed by an increase in the ‘time waited’ admitted and non-admitted waiting times once these patients start treatment.
3.2.7. The seasonal pattern of peaks in the median waiting times
corresponds with winter. The winter peak is associated with a combination of poor weather conditions changing the balance between elective and non-elective care and the impact of Christmas holidays.
3.3. Activity and waiting lists 3.3.1. The numbers of completed admitted and non-admitted pathways are
often referred to as RTT activity because these are the numbers of patients who started treatment. RTT activity is broadly stable and follows a clear seasonal pattern (Chart 4).
3.3.2. The number of RTT patients who started admitted consultant-led treatment in 2013 has been similar to previous years’ levels of activity. An average of just over 300,000 RTT patients started admitted treatment each month.
3.3.3. The removal of consultant-led sexual health services from RTT waiting times data from April 2013 (see 3.2.3) has contributed to a reduction in the number of RTT patients who started non-admitted consultant-led treatment. Since April 2013, an average of just under 850,000 patients started non-admitted treatment each month.

13
Chart 4: Number of RTT patients who started treatment in each month, England
3.3.4. The number of working days in a month influences the amount of RTT
activity – the presence of bank holidays and the number of weekends in a calendar month both affect the number of working days. When the impact of working days is taken into account, a smoother activity trend is visible (Charts 4, 5 and 6). An average of 14,500 RTT patients started admitted treatment per working day in 2013 and since April 2013, an average of just under 40,000 patients started non-admitted treatment per working day.
Chart 5: Number of RTT patients starting admitted treatment per working day
year on year, England

14
Chart 6: Number of RTT patients starting non-admitted treatment per working day year on year, England
3.3.5. The numbers of incomplete pathways are often referred to as the RTT
waiting list because these are the patients recorded as waiting to start treatment at the end of the month.
3.3.6. The RTT waiting list fell from just over 4 million patients waiting at the
end of August 2007 to around 2.5 million patients at the end of October 2008 (Chart 7). Between October 2008 and August 2012, the numbers of RTT patients waiting was broadly stable around 2.5 million patients, but subject to a clear seasonal trend.
Chart 7: Number of RTT patients waiting at the end of the month, England
15
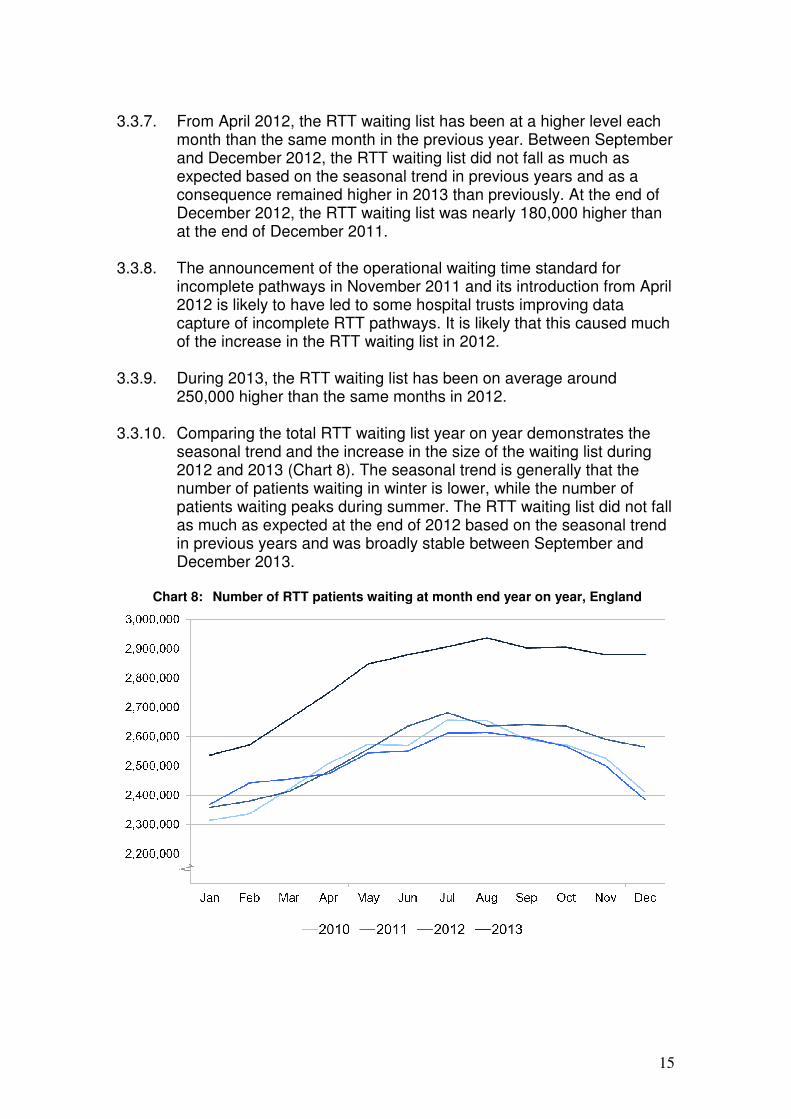
3.3.7. From April 2012, the RTT waiting list has been at a higher level each
month than the same month in the previous year. Between September and December 2012, the RTT waiting list did not fall as much as expected based on the seasonal trend in previous years and as a consequence remained higher in 2013 than previously. At the end of December 2012, the RTT waiting list was nearly 180,000 higher than at the end of December 2011.
3.3.8. The announcement of the operational waiting time standard for incomplete pathways in November 2011 and its introduction from April 2012 is likely to have led to some hospital trusts improving data capture of incomplete RTT pathways. It is likely that this caused much of the increase in the RTT waiting list in 2012.
3.3.9. During 2013, the RTT waiting list has been on average around 250,000 higher than the same months in 2012.
3.3.10. Comparing the total RTT waiting list year on year demonstrates the
seasonal trend and the increase in the size of the waiting list during 2012 and 2013 (Chart 8). The seasonal trend is generally that the number of patients waiting in winter is lower, while the number of patients waiting peaks during summer. The RTT waiting list did not fall as much as expected at the end of 2012 based on the seasonal trend in previous years and was broadly stable between September and December 2013.
Chart 8: Number of RTT patients waiting at month end year on year, England

16
4. Specialty RTT waiting times 4.1. There is some variation at specialty-level in the percentage of RTT
patients starting treatment within 18 weeks. 4.2. RTT waiting times data is collected against 18 treatment functions, which
cover the main treatment areas. RTT waiting times data for types of treatments that are not covered by these 18 treatment functions are collected under “Other”. The treatment functions are based on consultant specialties.
4.3. Annually in 2013, four specialties were below the admitted waiting time
standard of 90% – trauma & orthopaedics, ENT (ear, nose and throat), neurosurgery and cardiothoracic surgery – and two specialties were below the non-admitted waiting time standard of 95% – oral surgery and neurosurgery (Table 4).
4.4. At the end of 2013, five specialties were below the incomplete waiting
time standard of 92% – general surgery, trauma & orthopaedics, neurosurgery, plastic surgery and cardiothoracic surgery (Table 4).
Table 4: Annual percentage of completed RTT pathways within 18 weeks and
December 2013 percentage of incomplete pathways within 18 weeks, by treatment function, England
2013 Dec-131
Admitted (adjusted) pathways
Non-admitted pathways
Incomplete pathways
General Surgery 90.7% 96.6% 91.8%
Urology 92.0% 96.4% 92.8%
Trauma & Orthopaedics 88.2% 96.1% 91.3%
ENT 89.9% 97.1% 93.6%
Ophthalmology 92.7% 97.5% 94.5%
Oral Surgery 90.8% 94.8% 93.1%
Neurosurgery 86.9% 94.0% 89.1%
Plastic Surgery 91.6% 96.8% 89.5%
Cardiothoracic Surgery 87.5% 97.9% 90.6%
General Medicine 98.6% 98.2% 96.1%
Gastroenterology 98.8% 96.2% 94.7%
Cardiology 94.2% 97.4% 94.7%
Dermatology 95.8% 97.8% 95.7%
Thoracic Medicine 98.5% 97.3% 94.7%
Neurology 98.5% 96.0% 94.1%
Rheumatology 98.9% 97.9% 96.4%
Geriatric Medicine 99.1% 99.1% 96.7%
Gynaecology 94.0% 98.3% 95.6%
Other 92.8% 97.5% 94.1%
England 91.8% 97.1% 93.6%
1Incomplete pathways are a snapshot of the patients waiting at the end of a month; therefore, it is
inappropriate to sum the incomplete pathways across a year. The equivalent annual figure for incomplete pathways is the waiting times of the patients waiting at the end of the year.

17
4.5. Trauma & orthopaedics, general surgery and ophthalmology are the specialties with the largest volumes of admitted RTT activity – numbers of patients who started admitted treatment (Table 5). These specialties also cover a range of performance against the waiting time standards, with a higher than average percentage of completed pathways within 18 weeks in ophthalmology and lower than average in trauma & orthopaedics and general surgery, so these specialties will be used to illustrate specialty-level variation across time.
Table 5: Number of patients who started treatment and number waiting, by treatment function, England
Number of patients
who started admitted treatment in 2013
Number of patients who started non-admitted
treatment in 2013
Number of patients waiting at the end of 2013
General Surgery 475,064 706,573 250,350
Urology 242,726 353,919 152,332
Trauma & Orthopaedics 687,006 1,013,466 395,792
ENT 204,567 771,803 190,888
Ophthalmology 496,616 1,011,948 305,496
Oral Surgery 199,779 367,712 134,780
Neurosurgery 30,724 54,628 25,292
Plastic Surgery 138,395 109,611 48,967
Cardiothoracic Surgery 23,727 11,226 7,758
General Medicine 45,163 225,610 48,318
Gastroenterology 153,383 292,696 116,370
Cardiology 113,134 472,386 131,018
Dermatology 83,692 697,431 145,111
Thoracic Medicine 20,578 224,471 54,247
Neurology 12,431 280,349 83,455
Rheumatology 20,732 242,243 53,363
Geriatric Medicine 2,523 119,231 18,725
Gynaecology 296,118 741,463 172,488
Other 434,766 2,564,619 545,407
England 3,681,124 10,261,385 2,880,157
4.6. For patients waiting to start treatment in these three specialties we see
broadly similar trends as for England (all specialties) waiting times. The percentage of incomplete pathways within 18 weeks for general surgery and ophthalmology was broadly stable during 2013, with some signs of a reduction in performance against the standard in the last quarter of 2013. The percentage of incomplete pathways within 18 weeks for trauma & orthopaedics increased in the first quarter of 2013 then held steady until a reduction in the last quarter of 2013, in line with the seasonal pattern in previous years (Chart 9).

18
Chart 9: Percentage of incomplete RTT pathways within 18 weeks, by three treatment functions, England
4.7. General Surgery and trauma & orthopaedics show a similar trend to
England (all specialties) for the percentage of admitted pathways within 18 weeks (Chart 10). The percentage of admitted ophthalmology pathways within 18 weeks reduced during 2013.
Chart 10: Percentage of admitted RTT pathways within 18 weeks, by three treatment functions, England

19
4.8. There is less variation in performance against the non-admitted waiting times standard across these three specialties (Chart 11). Performance for trauma & orthopaedics and ophthalmology pathways fell slightly during 2013, in line with the England (all specialties) trend, while performance for general surgery held stable.
Chart 11: Percentage of non-admitted RTT pathways within 18 weeks, by three treatment functions, England

20
5. Regional RTT waiting times 5.1. Since April 2013, there are four NHS England regions in England. There
is some variation in the waiting times for services commissioned by Clinical Commissioning Groups within these NHS England regions (Table 6).
5.2. Annual 2013 RTT waiting times across the four NHS England regions
range from: 90.7% to 92.2% of patients treated between April and December 2013 started admitted treatment within 18 weeks; 97.0% to 97.3% of patients treated between April and December 2013 started non-admitted treatment within 18 weeks; and 92.2% to 94.4% of patients waiting at the end of 2013 were waiting within 18 weeks.
Table 6: Annual percentage of completed RTT pathways within 18 weeks and
December 2013 percentage of incomplete pathways within 18 weeks, by NHS England region
April to December 20131 Dec-132
Admitted (adjusted) pathways
Non-admitted pathways
Incomplete pathways
North of England 92.1% 97.3% 94.1%
Midlands and East of England 91.5% 97.2% 94.4%
London 90.7% 97.0% 92.2%
South of England 92.2% 97.2% 93.1%
England 91.7% 97.0% 93.6%
1NHS England regions came into existence in April 2013.
2Incomplete pathways are a snapshot of the patients waiting at the end of a month; therefore, it is
inappropriate to sum the incomplete pathways across a year. The equivalent annual figure for incomplete pathways is the waiting times of the patients waiting at the end of the year.
5.3. As expected, given that the NHS England regions cover populations of
varying sizes, the amount of RTT activity carried out between April and December 2013 and the size of the RTT waiting list at the end of 2013 differs for each region (Table 7).
Table 7: Number of patients who started treatment in April to December 2013 and
number waiting at the end of December 2013, by NHS England region
Number of patients who started admitted treatment in April-Dec
2013
Number of patients who started non-admitted treatment in April-Dec
2013
Number of patients waiting at the end
of 2013
North of England 770,575 2,347,305 810,602
Midlands and East of England 756,748 1,987,467 775,876
London 324,855 1,132,607 400,713
South of England 704,164 1,665,978 692,853
England2 2,770,480 7,593,305 2,880,157
2The total numbers of patients who started treatment and were waiting by NHS England region does not add up to the
England total due to RTT pathways that are commissioned by NHS England, including specialised services, offender healthcare and some services for members of the armed forces.

21
6. Annex
6.1. Methodology Data collection 6.1.1. NHS England compiles monthly Referral to Treatment (RTT) data on
the length of time from GP referral through to consultant-led treatment. There are two main central returns:
• Unadjusted. This return has been collected since January 2007 and was first published for March 2007. The return covers admitted patients (since January 2007), non-admitted patients (since August 2007) and patients on incomplete pathways (since August 2007).
• Adjusted. This return has been collected and published since March 2008. The return covers admitted patients on an adjusted basis (i.e. including legitimate pauses of patients’ waiting time clocks).
6.1.2. Data is submitted monthly to NHS England by all providers of NHS-
funded, consultant-led services, via Unify2. Unify2 is the online tool used by NHS England for the collection and sharing of NHS performance data. NHS commissioners review and sign off the data and NHS England performs central validation checks to ensure good data quality.
6.1.3. Further papers and guidance describing the RTT clock rules and
measurement of consultant-led RTT waiting times can be found on the NHS England website here: http://www.england.nhs.uk/statistics/statistical-work-areas/rtt-waiting-times/rtt-guidance/
Data availability 6.1.4. RTT waiting times data are published to a pre-announced timetable,
roughly 6-7 weeks after the end of the reference month. Publication occurs on a Thursday and is always on or after the 31st working day after the end of the reporting month. NHS England is seeking comments and views from data producers and users on a proposed change to the timetable for the monthly collection and publication of consultant-led RTT waiting times, in particular on options for bringing the publication date forward a week. More details are available at: https://www.engage.england.nhs.uk/survey/e37cf46f. The deadline for comments is 3rd March 2014.
6.1.5. Monthly RTT data is published on the NHS England website here:
http://www.england.nhs.uk/statistics/statistical-work-areas/rtt-waiting-times/
6.1.6. The annual statistical report is published once a year in February, alongside the release of December RTT waiting times data.

22
Data coverage 6.1.7. The consultant-led RTT data returns have ROCR (Review of Central
Returns) and Monitor approval and therefore data submission is mandatory for all NHS trusts that provide services that fall within the scope of consultant-led RTT waiting times measurement.
6.1.8. Independent Sector providers are encouraged to engage in the RTT
data collection process by monitoring RTT times for NHS patients being seen/treated within their trust and by submitting this information on Unify2 in the same way as NHS provider organisations. When Independent Sector providers do not have the technical capability to submit data to Unify2, NHS commissioners can submit on their behalf.
6.1.9. Occasionally a provider organisation is unable to submit RTT data in
time for monthly publication, for example, due to technical issues such as the impact of introducing a new computing system. Provider organisations are encouraged to report data retrospectively for the missing month(s) as part of the regular revisions process (see 6.1.12). The following data from acute provider organisations are currently missing for the period January 2012 to December 2013:
Month Missing data
Jan-12 • Imperial College Healthcare NHS Trust did not submit any (admitted, non-admitted or
incomplete) RTT pathway data.
Feb-12 • Imperial College Healthcare NHS Trust did not submit any (admitted, non-admitted or
incomplete) RTT pathway data.
Mar-12 • Imperial College Healthcare NHS Trust did not submit any (admitted, non-admitted or
incomplete) RTT pathway data.
Apr-12 • Imperial College Healthcare NHS Trust did not submit any (admitted, non-admitted or
incomplete) RTT pathway data.
May-12 • Imperial College Healthcare NHS Trust did not submit any (admitted, non-admitted or
incomplete) RTT pathway data.
Jun-12 • The Rotherham NHS Foundation Trust did not submit incomplete RTT pathway data.
Jul-12 −
Aug-12 • North Bristol NHS Trust did not submit incomplete RTT pathway data.
Sep-12 • North Bristol NHS Trust did not submit incomplete RTT pathway data.
Oct-12 • North Bristol NHS Trust did not submit incomplete RTT pathway data.
• Bradford Teaching Hospitals NHS Foundation Trust did not submit incomplete RTT pathway data.
Nov-12 • North Bristol NHS Trust did not submit incomplete RTT pathway data.
• Bradford Teaching Hospitals NHS Foundation Trust did not submit incomplete RTT pathway data.
Dec-12 • North Bristol NHS Trust did not submit incomplete RTT pathway data.
• Bradford Teaching Hospitals NHS Foundation Trust did not submit incomplete RTT pathway data.
Jan-13 • North Bristol NHS Trust did not submit incomplete RTT pathway data.
• Bradford Teaching Hospitals NHS Foundation Trust did not submit incomplete RTT pathway data.
Feb-13 • North Bristol NHS Trust did not submit incomplete RTT pathway data.
• Bradford Teaching Hospitals NHS Foundation Trust did not submit incomplete RTT pathway data.
Mar-13 • Bradford Teaching Hospitals NHS Foundation Trust did not submit incomplete RTT
pathway data.
Apr-13 −

23
May-13 −
Jun-13 −
Jul-13 −
Aug-13 −
Sep-13 • The Whittington Hospital NHS Trust did not submit any (admitted, non-admitted or
incomplete) RTT pathway data.
Oct-13
• The Whittington Hospital NHS Trust did not submit any (admitted, non-admitted or incomplete) RTT pathway data.
• Barnet and Chase Farm Hospitals NHS Trust did not submit any (admitted, non-admitted or incomplete) RTT pathway data.
Nov-13
• The Whittington Hospital NHS Trust did not submit any (admitted, non-admitted or incomplete) RTT pathway data.
• Barnet and Chase Farm Hospitals NHS Trust did not submit any (admitted, non-admitted or incomplete) RTT pathway data.
Dec-13
• The Whittington Hospital NHS Trust did not submit any (admitted, non-admitted or incomplete) RTT pathway data.
• Barnet and Chase Farm Hospitals NHS Trust did not submit any (admitted, non-admitted or incomplete) RTT pathway data.
• Barking, Havering & Redbridge NHS Trust did not submit any (admitted, non-admitted or incomplete) RTT pathway data.
6.1.10. The impact of missing data from a few provider organisations varies
depending on the measure being considered. For the key waiting times measures – percentage within 18 weeks and median waiting time – the impact is minimal at England level. However, there is potential for a greater impact at lower geographical levels.
6.1.11. The biggest impact will be on measures of volumes, such as the number of patients who started treatment and the size of the RTT waiting list. Caution should be exercised when comparing volumes of incomplete pathways across different time periods, especially at regional level. However, coverage and data quality of the consultant-led RTT waiting times statistics remains high and the RTT data are considered robust and fit for purpose.
Data revisions 6.1.12. Revisions to published figures are released on a six-monthly basis
and in accordance with the NHS England Analytical Service (Operations) team’s revision policy. The revisions policy can be found here:
http://www.england.nhs.uk/statistics/wp-content/uploads/sites/2/2012/04/Unify2-revisions-policy.pdf
6.1.13. The most recent set of revisions were published on 16th January 2014. The RTT waiting times data contained in this report was current at the time of publication.
6.1.14. NHS England may receive and publish revisions to RTT data contained in the 2013 annual statistical report, as part of the next 6-monthly revisions round. However, this annual report will not be updated and re-released to take into account any future changes.
Data comparability
24
6.1.15. Scotland also collects and publishes RTT waiting times data and has a 18 weeks ‘time waited’ standard of 90%. Care needs to be taken when comparing English and Scottish RTT waiting times data as differences exist in the measurement rules, for example, some consultant-led services are not included in RTT measurement in Scotland. RTT data for Scotland can be found here: http://www.isdscotland.org/Health-Topics/Waiting-Times/18-Weeks-RTT/
6.1.16. Wales also collects and publishes RTT waiting times data and has a 26 week ‘waiting time’ standard of 95% and a 36 week ‘time waited’ standard of 100%. Care needs to be taken when comparing English and Welsh RTT waiting times data as differences exist in the measurement rules, for example, there are differences in the circumstances where RTT clock restarts are allowed between Wales and England. RTT data for Wales can be found here: http://wales.gov.uk/statistics-and-research/referral-to-treatment-times/?lang=en
6.1.17. Northern Ireland does not measure RTT waiting times. They collect
and publish stage of treatment inpatient and outpatient waiting times. These data can be found here: http://www.dhsspsni.gov.uk/index/stats_research/hospital-stats/waiting_times_main/stats-waiting-times.htm
6.2. Glossary Adjusted Adjustments are made to admitted pathways for clock pauses, where a patient had declined reasonable offers of admission and chosen to wait longer. Admitted pathways The waiting times (time waited) for patients whose treatment started during the month and involved admission to hospital. Clock Pause A period of time for which a patient's RTT waiting time clock is put on hold ("paused"). Clocks may only be paused for non-clinical reasons and only where a provider has made at least two reasonable offers for admission for treatment but a patient chooses to wait longer. The clock is paused for the duration of the time between the earliest reasonable offer and the date from which the patient makes themselves available again for admission for treatment. Clock Start The date on which a patient's RTT pathway starts, when a patient is referred for consultant-led treatment and the referral is received by the provider.

25
Clock Stop The date on which a patient's RTT pathway ends. The following activities end the Referral to Treatment (RTT) pathway and lead to the RTT clock being stopped:
• first treatment - the start of the first treatment that is intended to manage a patient's disease, condition or injury
• start of active monitoring initiated by the patient
• start of active monitoring initiated by the care professional
• decision not to treat - decision not to treat made or no further contact required
• patient declined offered treatment
• patient died before treatment Commissioner A commissioner is normally a Clinical Commissioning Group (CCG). CCGs commission services from providers of NHS care. Incomplete pathways The waiting times for patients waiting to start treatment at the end of the month. These patients will be at various stages of their pathway, for example, waiting for diagnostics, an appointment with a consultant, or for admission for a procedure. Median The median is the preferred measure of the average waiting time as it is less susceptible to extreme values than the mean. The median waiting times is the middle value when all patients are ordered by length of wait. This is the mid-point of the RTT waiting times distribution. For completed pathways, 50% of patients started treatment within the median waiting time, and for incomplete pathways 50% of patients were waiting within the median waiting time. Non-admitted pathways The waiting times (time waited) for patients whose treatment started during the month and did not involve admission to hospital. Provider An organisation that provides NHS treatment or care, for example, an NHS Acute Trust, Mental Health Trust, Community provider, or an Independent Sector organisation. RTT Pathway/RTT period The length of time between a patient's RTT clock start and the clock stop for a particular treatment. Alternatively, if the patient has not yet started treatment, it is the length of time from the clock start to the end of the reference month. NHS England region England is split into four NHS England regions. NHS England regions support the commissioning of health services in their area.

26
Treatment Function RTT waiting times are measured within 19 treatment functions (including “Other”), which were chosen to capture the main treatment areas. Treatment functions are based on specialties.
6.3. Feedback Welcomed We welcome feedback on the content and presentation of RTT statistics within this report and those published on the NHS England website. If anyone has any comments on this report, or any other issues regarding RTT data and statistics, then please email [email protected]
6.4. Additional Information Full details of RTT data for individual organisations is available at: http://www.england.nhs.uk/statistics/statistical-work-areas/rtt-waiting-times/ For press enquiries please e-mail the NHS England media team at [email protected] or call 07768 901293. The Government Statistical Service (GSS) statistician with overall responsibility for the data in this report is: Debbie Moon Analytical Services (Operations), NHS England, Room 8E10, Quarry House, Leeds LS2 7UE Email: [email protected]