Embed Size (px)
Citation preview

Rubber Bands from China
Investigation Nos. 701-TA-598 and 731-TA-1408 (Final)
Publication 4863 February 2019
U.S. International Trade Commission
Washington, DC 20436

U.S. International Trade Commission
COMMISSIONERS
David S. Johanson, Chairman Irving A. Williamson
Meredith M. Broadbent Rhonda K. Schmidtlein
Jason E. Kearns
Catherine Defilippo Director of Operations
Staff assigned
Christopher W. Robinson, Investigator Raymond Cantrell, Industry Analyst
Cindy Cohen, Economist Samuel Varela-Molina, Accountant
Shova KC, Statistician Karen Driscoll, Attorney
Elizabeth Haines, Supervisory Investigator
Address all communications to Secretary to the Commission
United States International Trade Commission Washington, DC 20436

U.S. International Trade Commission
Washington, DC 20436 www.usitc.gov
Rubber Bands from China
Investigation Nos. 701-TA-598 and 731-TA-1408 (Final)
Publication 4863 February 2019

CONTENTS Page
i
Determination(s) ............................................................................................................................. 1 Views of the Commission ............................................................................................................... 3 Part I: Introduction .............................................................................................................. I-1
Background ................................................................................................................................ I-1
Statutory criteria and organization of the report ..................................................................... I-2
Statutory criteria ................................................................................................................... I-2
Organization of report ........................................................................................................... I-3
Market summary ....................................................................................................................... I-3
Summary data and data sources ............................................................................................... I-4
Previous and related investigations .......................................................................................... I-5
Section 301 Investigations ..................................................................................................... I-5
Nature and extent of subsidies and sales at LTFV .................................................................... I-6
Subsidies ................................................................................................................................ I-6
Sales at LTFV .......................................................................................................................... I-7
The subject merchandise .......................................................................................................... I-8
Commerce’s scope ................................................................................................................ I-8
Tariff treatment ..................................................................................................................... I-9
The product ............................................................................................................................... I-9
Manufacturing processes .................................................................................................... I-13
Domestic like product issues ................................................................................................... I-15
Part II: Conditions of competition in the U.S. market........................................................... II-1 U.S. market characteristics....................................................................................................... II-1
U.S. purchasers ......................................................................................................................... II-1
Channels of distribution ........................................................................................................... II-1
Geographic distribution ........................................................................................................... II-1
Supply and demand considerations ......................................................................................... II-2
U.S. supply ............................................................................................................................ II-2

CONTENTS Page
ii
U.S. demand ......................................................................................................................... II-5
Substitutability issues ............................................................................................................... II-6
Lead times ............................................................................................................................ II-6
Knowledge of country sources ............................................................................................. II-7
Factors affecting purchasing decisions................................................................................. II-7
Comparisons of domestic products, subject imports, and nonsubject imports ................ II-11
Comparison of U.S.-produced and imported rubber bands .............................................. II-12
Elasticity estimates ................................................................................................................. II-14
U.S. supply elasticity ........................................................................................................... II-14
U.S. demand elasticity ........................................................................................................ II-15
Substitution elasticity ......................................................................................................... II-15
Part III: U.S. producer’s production, shipments, and employment ...................................... III-1 U.S. producers ......................................................................................................................... III-1
U.S. production, capacity, and capacity utilization ................................................................. III-2
Alternative products ............................................................................................................ III-3
U.S. producers’ U.S. shipments and exports ........................................................................... III-4
Shipments by product type ................................................................................................. III-4
U.S. producer’s inventories ..................................................................................................... III-4
U.S. producer’s imports and purchases .................................................................................. III-5
U.S. employment, wages, and productivity ............................................................................ III-5
Part IV: U.S. imports, apparent U.S. consumption, and market shares ............................... IV-1 U.S. importers.......................................................................................................................... IV-1
U.S. imports ............................................................................................................................. IV-2
Critical circumstances .............................................................................................................. IV-4
Negligibility .............................................................................................................................. IV-5
Cumulation considerations ..................................................................................................... IV-6
Fungibility ............................................................................................................................ IV-6
Geographical markets ......................................................................................................... IV-9
Presence in the market ....................................................................................................... IV-9

CONTENTS Page
iii
Apparent U.S. consumption .................................................................................................. IV-10
U.S. market shares ................................................................................................................ IV-10
Part V: Pricing data ............................................................................................................. V-1 Factors affecting prices ............................................................................................................ V-1
Raw material costs ............................................................................................................... V-1
U.S. inland transportation costs ........................................................................................... V-2
Rubber content ..................................................................................................................... V-2
Pricing practices ....................................................................................................................... V-3
Pricing methods .................................................................................................................... V-3
Sales terms and discounts .................................................................................................... V-5
Price leadership .................................................................................................................... V-5
Price data .................................................................................................................................. V-5
Import purchase costs .......................................................................................................... V-8
Price and import purchase cost trends ................................................................................ V-8
Price comparisons ................................................................................................................ V-9
Lost sales and lost revenue ...................................................................................................... V-9
Part VI: Financial experience of U.S. producers .................................................................. VI-1 Background .............................................................................................................................. VI-1
Net sales .............................................................................................................................. VI-1
Selling general and administrative expenses and operating profit .................................... VI-3
All other expenses and net income ..................................................................................... VI-3
Variance analysis ................................................................................................................. VI-3
Capital expenditures and research and development expenses ............................................ VI-4
Assets and return on assets .................................................................................................... VI-4
Capital and investment ........................................................................................................... VI-5
Part VII: Threat considerations and information on nonsubject countries .......................... VII-1
The industry in China .............................................................................................................. VII-3
The industry in Thailand ......................................................................................................... VII-7
CONTENTS Page
iv
Operations on rubber bands .............................................................................................. VII-7
Exports ................................................................................................................................ VII-8
U.S. inventories of imported merchandise .......................................................................... VII-10
U.S. importers’ outstanding orders ...................................................................................... VII-11
Antidumping or countervailing duty orders in third-country markets ................................ VII-11
Appendixes
A. Federal Register notices ................................................................................................. A-1
B. List of hearing witnesses ................................................................................................ B-1
C. Summary data ................................................................................................................ C-1
D. Data on nonsubject foreign industry .............................................................................. D-1
Note.—Information that would reveal confidential operations of individual concerns may not be published. Such information is identified by brackets or by parallel lines in confidential reports and is deleted and replaced with asterisks in public reports.

UNITED STATES INTERNATIONAL TRADE COMMISSION
Investigation Nos. 701-TA-598 and 731-TA-1408 (Final) Rubber Bands from China
DETERMINATIONS
On the basis of the record1 developed in the subject investigations, the United States International Trade Commission (“Commission”) determines, pursuant to the Tariff Act of 1930 (“the Act”), that an industry in the United States is materially injured by reason of imports of rubber bands from China, provided for in subheading 4016.99.352 of the Harmonized Tariff Schedule of the United States, that have been found by the U.S. Department of Commerce (“Commerce”) to be sold in the United States at less than fair value (“LTFV”), and to be subsidized by the government of China.3
BACKGROUND
The Commission, pursuant to sections 705(b) and 735(b) of the Act (19 U.S.C. 1671d(b) and 19 U.S.C. 1673d(b)), instituted these investigations effective January 30, 2018, following receipt of a petition filed with the Commission and Commerce by Alliance Rubber Co., Hot Springs, Arkansas. The final phase of the investigations was scheduled by the Commission following notification of preliminary determinations by Commerce that imports of rubber bands from China were subsidized within the meaning of section 703(b) of the Act (19 U.S.C. 1671b(b)) and sold at LTFV within the meaning of 733(b) of the Act (19 U.S.C. 1673b(b)). Notice of the scheduling of the final phase of the Commission’s investigations and of a public hearing to be held in connection therewith was given by posting copies of the notice in the Office of the Secretary, U.S. International Trade Commission, Washington, DC, and by publishing the notice in the Federal Register on September 17, 2018 (83 FR 46969).4 The hearing was held in Washington, DC, on November 13, 2018, and all persons who requested the opportunity were permitted to appear in person or by counsel.
1 The record is defined in sec. 207.2(f) of the Commission’s Rules of Practice and Procedure (19 CFR 207.2(f)).
2 Merchandise covered by the scope of these investigations may also enter under HTSUS subheading 4016.99.6050.
3 The Commission also finds that imports subject to Commerce's affirmative critical circumstances determinations are not likely to undermine seriously the remedial effect of the countervailing and antidumping duty orders on rubber bands from China.
4 Due to the lapse in appropriations and ensuing cessation of Commission operations, all import injury investigations conducted under authority of Title VII of the Tariff Act of 1930 accordingly have been tolled pursuant to 19 U.S.C. §§ 1671d(b)(2), 1673d(b)(2).
1


3
Views of the Commission
Based on the record in the final phase of these investigations, we determine that an industry in the United States is materially injured by reason of imports of rubber bands from China found by the U.S. Department of Commerce (“Commerce”) to be sold in the United States at less than fair value (“LTFV”) and subsidized by the government of China. We also find that critical circumstances do not exist with respect to imports of rubber bands from China that are subject to Commerce’s affirmative critical circumstances determinations.
I. Background
Alliance Rubber Co. (“Alliance”), a U.S. producer of rubber bands, filed antidumping and countervailing duty petitions concerning rubber bands from China and Thailand on January 30, 2018.1 Alliance’s representatives appeared at the hearing accompanied by counsel and submitted prehearing and posthearing briefs and final comments. Two respondents participated in the final phase of these investigations. Respondent U. Yong Industry, Co., Ltd. (“U. Yong”), an exporter and producer of subject merchandise from Thailand, submitted a prehearing brief, and Timothy Nelson, a principal of Encore Packages, LLC (“Encore”), a U.S. importer of subject merchandise, appeared at the hearing and provided testimony. Although Commerce initially aligned the antidumping duty and countervailing duty investigations on rubber bands from China and Thailand,2 the investigation schedules became staggered when Commerce subsequently postponed its final antidumping and countervailing duty determinations regarding rubber bands from Thailand3 but not China.4 This has
1 Alliance also filed petitions on imports of rubber bands from Sri Lanka, but in its preliminary investigations the Commission found these imports to be negligible and terminated the antidumping and countervailing duty investigations on rubber bands from Sri Lanka. Rubber Bands from China, Sri Lanka, and Thailand, 83 Fed. Reg. 12594 (March 22, 2018). Rubber Bands from China, Sri Lanka, and Thailand, Inv. Nos. 701-TA-598-600 and 731-TA-1408-1410, USITC Pub. 4770 (March 2018) (“Preliminary Determinations”) at 9-12. Confidential Version, EDIS No. 640109 (March 27, 2018) at 13-17.
2 Rubber Bands From the People’s Republic of China: Preliminary Affirmative Countervailing Duty Determination and Alignment of Final Determination With Final Antidumping Determination, 83 Fed. Reg. 31729 (July 9, 2018). Commerce made a preliminary negative countervailing duty determination with respect to rubber bands from Thailand. Rubber Bands From Thailand: Preliminary Negative Countervailing Duty Determination and Alignment of Final Determination With Final Antidumping Duty Determination, 83 Fed. Reg. 31728 (July 9, 2018).
3 Rubber Bands From Thailand: Preliminary Affirmative Determination of Sales at Less Than Fair Value, Postponement of Final Determination, and Extension of Provisional Measures, 83 Fed. Reg. 45220 (Sept. 6, 2018). In its preliminary antidumping duty determinations with respect to rubber bands from Thailand, Commerce found that the dumping margins for imports of rubber bands from Thai exporter/producer Liang Hah Heng International Rubber Co., Ltd. (“LHH”) were de minimis. 83 Fed. Reg. at 45221. Imports of rubber bands from exporter LHH and their associated importer pricing data are referenced as “Thailand-LHH” data in these Views. Thailand-LHH imports remain subject merchandise as Commerce has not yet issued its final antidumping and countervailing duty determinations. We include (Continued...)
4
necessitated earlier final Commission determinations in the final antidumping and countervailing duty investigations regarding rubber bands from China.5 6 U.S. industry data are based on the questionnaire response from Alliance, which accounted for at least 90 percent of domestic production of rubber bands in 2017.7 U.S. import data are based on *** data that have been adjusted to remove data from firms certifying that they did not import rubber bands.8 Data from importer questionnaire responses are based on responses from importers accounting for an estimated *** percent of subject imports from China and an estimated *** percent of subject imports from Thailand preliminarily found to be dumped in 2017.9 Data concerning the subject industry in Thailand are based on the questionnaire responses of four firms that accounted for an estimated *** percent of subject imports from Thailand preliminarily found to be dumped and *** percent of all U.S. imports of rubber bands from Thailand in 2017.10 The Commission did not receive any usable questionnaire responses from any rubber band producer in China.11
II. Domestic Like Product
A. In General
In determining whether an industry in the United States is materially injured or threatened with material injury by reason of imports of subject merchandise, the Commission first defines the “domestic like product” and the “industry.”12 Section 771(4)(A) of the Tariff Act of 1930, as amended (“the Tariff Act”), defines the relevant domestic industry as the “producers as a whole of a domestic like product, or those producers whose collective output
(…Continued) these imports in our analysis of related parties, but not cumulation as they are statutorily exempt from cumulation, as explained further below. 19 U.S.C. §1677(G)(ii)(I).
4 Less-Than-Fair-Value Investigation of Rubber Bands From the People’s Republic of China: Preliminary Affirmative Determination of Sales at Less Than Fair Value and Preliminary Affirmative Determination of Critical Circumstances, 83 Fed. Reg. 45213 (Sept. 6, 2018).
5 See 19 U.S.C. § 1677(7)(G)(iii). Commerce is currently scheduled to issue its final antidumping and countervailing duty determinations regarding rubber bands from Thailand on February 28, 2019. Pursuant to the statutory provision on staggered investigations, the record for each of these investigations will be the same except that, the final Commerce antidumping or countervailing duty determinations regarding rubber bands from Thailand and the parties’ final comments will be added to the record of the investigations concerning rubber bands from Thailand.
6 Due to the lapse in appropriations and ensuing cessation of Commission operations, all import injury investigations conducted under authority of Title VII of the Tariff Act of 1930 accordingly have been tolled pursuant to 19 U.S.C. §§ 1671d(b)(2), 1673d(b)(2).
7 Confidential Report (“CR”) at I-6; Public Report (“PR”) at I-4. 8 CR at I-6 & n.11, PR at I-4 & n.11. 9 CR at I-6, PR at I-4. 10 CR at I-7, PR at I-4. 11 CR at I-7, PR at I-4. 12 19 U.S.C. § 1677(4)(A).

5
of a domestic like product constitutes a major proportion of the total domestic production of the product.”13 In turn, the Tariff Act defines “domestic like product” as “a product which is like, or in the absence of like, most similar in characteristics and uses with, the article subject to an investigation.”14
The decision regarding the appropriate domestic like product in an investigation is a factual determination, and the Commission has applied the statutory standard of “like” or “most similar in characteristics and uses” on a case-by-case basis.15 No single factor is dispositive, and the Commission may consider other factors it deems relevant based on the facts of a particular investigation.16 The Commission looks for clear dividing lines among possible like products and disregards minor variations.17 Although the Commission must accept Commerce’s determination as to the scope of the imported merchandise that is subsidized or sold at less than fair value,18 the Commission determines what domestic product is like the imported articles Commerce has identified.19
13 19 U.S.C. § 1677(4)(A). 14 19 U.S.C. § 1677(10). 15 See, e.g., Cleo Inc. v. United States, 501 F.3d 1291, 1299 (Fed. Cir. 2007); NEC Corp. v.
Department of Commerce, 36 F. Supp. 2d 380, 383 (Ct. Int’l Trade 1998); Nippon Steel Corp. v. United States, 19 CIT 450, 455 (1995); Torrington Co. v. United States, 747 F. Supp. 744, 749 n.3 (Ct. Int’l Trade 1990), aff’d, 938 F.2d 1278 (Fed. Cir. 1991) (“every like product determination ‘must be made on the particular record at issue’ and the ‘unique facts of each case’”). The Commission generally considers a number of factors, including the following: (1) physical characteristics and uses; (2) interchangeability; (3) channels of distribution; (4) customer and producer perceptions of the products; (5) common manufacturing facilities, production processes, and production employees; and, where appropriate, (6) price. See Nippon, 19 CIT at 455 n.4; Timken Co. v. United States, 913 F. Supp. 580, 584 (Ct. Int’l Trade 1996).
16 See, e.g., S. Rep. No. 96-249 at 90-91 (1979). 17 Nippon, 19 CIT at 455; Torrington, 747 F. Supp. at 748-49; see also S. Rep. No. 96-249 at 90-91
(Congress has indicated that the like product standard should not be interpreted in “such a narrow fashion as to permit minor differences in physical characteristics or uses to lead to the conclusion that the product and article are not ‘like’ each other, nor should the definition of ‘like product’ be interpreted in such a fashion as to prevent consideration of an industry adversely affected by the imports under consideration.”).
18 See, e.g., USEC, Inc. v. United States, 34 Fed. Appx. 725, 730 (Fed. Cir. 2002) (“The ITC may not modify the class or kind of imported merchandise examined by Commerce.”); Algoma Steel Corp. v. United States, 688 F. Supp. 639, 644 (Ct. Int’l Trade 1988), aff’d, 865 F.3d 240 (Fed. Cir.), cert. denied, 492 U.S. 919 (1989).
19 Hosiden Corp. v. Advanced Display Mfrs., 85 F.3d 1561, 1568 (Fed. Cir. 1996) (the Commission may find a single like product corresponding to several different classes or kinds defined by Commerce); Cleo, 501 F.3d at 1298 n.1 (“Commerce’s {scope} finding does not control the Commission’s {like product} determination.”); Torrington, 747 F. Supp. at 748-52 (affirming the Commission’s determination defining six like products in investigations in which Commerce found five classes or kinds).

6
B. Product Description
Commerce defined the scope of the imported merchandise under investigation as follows:
The products subject to this investigation are bands made of vulcanized rubber, with a flat length, as actually measured end-to-end by the band lying flat, no less than 1⁄2 inch and no greater than 10 inches; with a width, which measures the dimension perpendicular to the length, actually of at least 3/64 inch and no greater than 2 inches; and a wall thickness actually from 0.020 inch to 0.125 inch. Vulcanized rubber has been chemically processed into a more durable material by the addition of sulfur or other equivalent curatives or accelerators. Subject products are included regardless of color or inclusion of printed material on the rubber band’s surface, including but not limited to, rubber bands with printing on them, such as a product name, advertising, or slogan, and printed material (e.g., a tag) fastened to the rubber band by an adhesive or another temporary type of connection. The scope includes vulcanized rubber bands which are contained or otherwise exist in various forms and packages, such as, without limitation, vulcanized rubber bands included within a desk accessory set or other type of set or package, and vulcanized rubber band balls. The scope excludes products that consist of an elastomer loop and durable tag all-in one, and bands that are being used at the time of import to fasten an imported product.
Excluded from the scope of this investigation are vulcanized rubber bands of various sizes with arrow shaped rubber protrusions from the outer diameter that exceeds at the anchor point a wall thickness of 0.125 inches and where the protrusion is used to loop around, secure and lock in place.
Excluded from the scope of this investigation are yarn/fabric-covered vulcanized rubber hair bands, regardless of size.
Merchandise covered by this investigation is currently classified in the Harmonized Tariff Schedule of the United States (HTSUS) under subheading 4016.99.3510. Merchandise covered by the scope may also enter under HTSUS subheading 4016.99.6050. While the HTSUS subheadings are provided for convenience and customs purposes, the written description of the scope of the investigation is dispositive.20
20 Rubber Bands From the People’s Republic of China: Final Determination of Sales at Less Than
Fair Value, 83 Fed. Reg. 58547, 58549 (Nov. 20, 2018). Rubber Bands From the People’s Republic of China: Final Affirmative Countervailing Duty Determination, 83 Fed. Reg. 58538, 58539-40 (Nov. 20, 2018).
Between the time of its initiation notice and its preliminary determinations, Commerce added the two exclusion paragraphs quoted above to the scope definitions in the antidumping and countervailing duty investigations on imports from China. Compare Rubber Bands From the People's Republic of China, Sri Lanka, and Thailand: Initiation of Less-Than-Fair-Value Investigations, 83 Fed. Reg. 8424 (Feb. 27, 2018) with Rubber Bands From The People's Republic Of China: Preliminary Affirmative Determination Of Critical Circumstances, In Part, In The Countervailing Duty Investigation, and (Continued...)

7
Rubber bands are commonly used to hold multiple objects together, including papers, fruits and vegetables, pieces of equipment, and other items.21 The rubber bands subject to these investigations are cylindrical tube-shaped elastic bands of vulcanized natural and synthetic rubbers of various lengths, widths, thicknesses, colors, and rubber content. Natural rubber raw materials used for rubber band production are sourced principally from rubber trees that grow in tropical areas near the equator, particularly in Southeast Asia (Thailand, Indonesia, Vietnam, and Malaysia). Synthetic rubbers are petroleum derivatives.22
C. Arguments of the Parties
Alliance argues that the Commission should define a single domestic like product consisting of rubber bands coextensive with Commerce’s scope of investigation, as it did in the preliminary determinations.23 Respondents do not raise any arguments concerning the definition of the domestic like product.
D. Domestic Like Product Analysis
In its preliminary determinations, the Commission defined a single domestic like product consisting of rubber bands coextensive with Commerce’s scope of investigation. The Commission found that all such rubber bands share the same basic physical characteristics and uses, that they are sold in comparable channels of distribution (typically large wholesalers and retailers, and end users), that they are produced in the same manufacturing facilities using the same production processes, and that there is a general interchangeability between rubber band products and an overlap in at least some end uses. The Commission acknowledged that rubber bands with different rubber content and raw materials may be priced differently, but found that the record did not indicate a clear dividing line between different rubber band products.24
The record in these final phase investigations contains some additional information on the domestic like product factors. This additional information is consistent with the Commission’s analysis in the preliminary determinations concerning the factors of manufacturing facilities, interchangeability, customer perception, and price.25 Based on the
(…Continued) Amendment To The Scope Of The Preliminary Determination In The Countervailing Duty Investigation, 83 Fed. Reg. 45217 (Sept. 6, 2018).
21 CR at I-4, PR at I-3. 22 CR at I-13, PR at I-10. 23 Alliance’s Prehearing Brief at 5-6. 24 Preliminary Determinations, USITC Pub. 4770 at 7-8. 25 With respect to manufacturing facilities, the final record contains additional details of
Alliance’s production processes and confirmation that Alliance’s *** are in Hot Springs, Arkansas. Commission Trip Notes, EDIS Doc. 659537 (Oct. 17, 2018).
With respect to interchangeability, there is no industry standard for measuring rubber content, and rubber bands with different levels of rubber content may be used interchangeably within a close range of sizes. Moreover, purchasers may choose higher rubber content bands over lower rubber (Continued...)

8
record, and the lack of any contrary argument, we define a single domestic like product consisting of rubber bands, coextensive with Commerce’s scope of investigation, for the same reasons specified in the preliminary determinations.
III. Domestic Industry
The domestic industry is defined as the domestic “producers as a whole of a domestic like product, or those producers whose collective output of a domestic like product constitutes a major proportion of the total domestic production of the product.”26 In defining the domestic industry, the Commission’s general practice has been to include in the industry producers of all domestic production of the like product, whether toll-produced, captively consumed, or sold in the domestic merchant market.
A. Related Parties
We must determine whether any producer of the domestic like product should be excluded from the domestic industry pursuant to section 771(4)(B) of the Tariff Act. This provision allows the Commission, if appropriate circumstances exist, to exclude from the domestic industry producers that are related to an exporter or importer of subject merchandise or which are themselves importers.27 Exclusion of such a producer is within the Commission’s discretion based upon the facts presented in each investigation.28
(…Continued) content bands as they may be more cost-effective when they are bought on a per-pound basis, as they weigh less than the lower rubber content bands. CR at II-13, IV-14-IV-20; PR at II-8, IV-6-9. Hearing Transcript (“Tr.”) at 64-67. Alliance Posthearing Brief, Exhibit 1 at 1, Responses to Commissioner Questions.
As for customer perception and price, Alliance states that rubber bands are largely viewed as a commodity product and priced accordingly. Alliance Prehearing Brief at 7. The record indicates some variations in pricing per pound among different types of domestically produced rubber band products. CR/PR at Tables V-3-7.
26 19 U.S.C. § 1677(4)(A). 27 See Torrington Co. v. United States, 790 F. Supp. 1161, 1168 (Ct. Int’l Trade 1992), aff’d
without opinion, 991 F.2d 809 (Fed. Cir. 1993); Sandvik AB v. United States, 721 F. Supp. 1322, 1331-32 (Ct. Int’l Trade 1989), aff’d mem., 904 F.2d 46 (Fed. Cir. 1990); Empire Plow Co. v. United States, 675 F. Supp. 1348, 1352 (Ct. Int’l Trade 1987).
28 The primary factors the Commission has examined in deciding whether appropriate circumstances exist to exclude a related party include the following:
(1) the percentage of domestic production attributable to the importing producer; (2) the reason the U.S. producer has decided to import the product subject to investigation
(whether the firm benefits from the LTFV sales or subsidies or whether the firm must import in order to enable it to continue production and compete in the U.S. market);
(3) whether inclusion or exclusion of the related party will skew the data for the rest of the industry;
(4) the ratio of import shipments to U.S. production for the imported product; and (Continued...)

9
In the preliminary determinations, the Commission found that Alliance was a related party due to its imports of subject merchandise from Thailand; it found, however, that appropriate circumstances did not exist to exclude Alliance from the domestic industry *** and because its exclusion would result in a lack of domestic industry data.29
For purposes of these determinations, Alliance is a related party because it imported merchandise from Thailand currently subject to investigation during the period of investigation.30 We next consider whether appropriate circumstances exist to exclude Alliance from the domestic industry. Neither Alliance nor Respondents made any related party arguments.
Alliance is the largest domestic producer of rubber bands, accounting for at least 90 percent of U.S. production in 2017,31 and the sole responding domestic producer in these investigations. Alliance imported *** pounds of merchandise from Thailand (***) in 2015, *** pounds in 2016, and *** pounds in 2017, which are equivalent to less than *** percent of its domestic production in each of those years.32 It did not import any subject merchandise in January-June (interim) 2018.33 Alliance stated that it imported subject merchandise ***.34
The *** size of Alliance’s imports of subject merchandise relative to its domestic production indicates that its principal interest lies in domestic production. Moreover, given that Alliance is the single responding U.S. producer in these investigations, the exclusion of Alliance would result in the lack of any domestic industry data.35 Also, no party has argued that Alliance be excluded from the definition of the domestic industry. Given these considerations, we find that appropriate circumstances do not exist to exclude Alliance from the domestic industry. We consequently define the domestic industry as all U.S. producers of the domestic like product.
(…Continued)
(5) whether the primary interest of the importing producer lies in domestic production or importation. Changzhou Trina Solar Energy Co. v. USITC, 100 F. Supp.3d 1314, 1326-31 (Ct. Int’l. Trade 2015); see also Torrington Co. v. United States, 790 F. Supp. at 1168.
29 Preliminary Determinations, USITC Pub. 4770 at 9, Confidential Version, EDIS No. 640109 (March 27, 2018) at 12.
30 CR/PR at Table III-6. Alliance’s imports were of merchandise ***. Id. As discussed above in section I., these imports are currently subject to investigation, notwithstanding that the exporter received de minimis margins in Commerce’s preliminary antidumping and countervailing duty determinations on rubber bands from Thailand.
31 CR at I-6, PR at I-4. 32 CR at III-10, PR at III-5. 33 CR/PR at Table III-6. 34 CR/PR at Table III-6. 35 The Commission sent questionnaires to eight U.S. firms that were potentially domestic
producers based on information in the petitions, but it received a domestic producer questionnaire response only from Alliance. *** stated that it produced rubber bands within the scope of these investigations, but ***. It stated that ***. Both *** and another firm stated that *** were the only notable domestic rubber band producers. CR/PR at III-1 & n.2.

10
IV. Cumulation36
For purposes of evaluating the volume and effects for a determination of material injury by reason of subject imports, section 771(7)(G)(i) of the Tariff Act requires the Commission to cumulate subject imports from all countries as to which petitions were filed and/or investigations self-initiated by Commerce on the same day, if such imports compete with each other and with the domestic like product in the U.S. market. In assessing whether subject imports compete with each other and with the domestic like product, the Commission generally has considered four factors:
(1) the degree of fungibility between subject imports from different countries and between subject imports and the domestic like product, including consideration of specific customer requirements and other quality related questions;
(2) the presence of sales or offers to sell in the same geographic markets of subject imports from different countries and the domestic like product;
(3) the existence of common or similar channels of distribution for subject imports from different countries and the domestic like product; and
(4) whether the subject imports are simultaneously present in the market.37
While no single factor is necessarily determinative, and the list of factors is not exclusive, these factors are intended to provide the Commission with a framework for determining whether the subject imports compete with each other and with the domestic like product.38 Only a “reasonable overlap” of competition is required.39
36 Pursuant to Section 771(24) of the Tariff Act, imports from a subject country of merchandise
corresponding to a domestic like product that account for less than 3 percent of all such merchandise imported into the United States during the most recent 12 months for which data are available preceding the filing of the petition generally shall be deemed negligible. 19 U.S.C. §§ 1671b(a), 1673b(a), 1677(24)(A)(i), 1677(24)(B); see also 15 C.F.R. § 2013.1 (developing countries for purposes of 19 U.S.C. § 1677(36)).
Subject imports from China accounted for *** percent of total U.S. imports during January 2017 through December 2017, the 12-month period preceding the filing of the petitions. CR/PR at Table IV-5. Because they exceed the applicable three percent negligibility thresholds, we find that subject imports from China are not negligible.
37 See Certain Cast-Iron Pipe Fittings from Brazil, the Republic of Korea, and Taiwan, Inv. Nos. 731-TA-278-280 (Final), USITC Pub. 1845 (May 1986), aff’d, Fundicao Tupy, S.A. v. United States, 678 F. Supp. 898 (Ct. Int’l Trade), aff’d, 859 F.2d 915 (Fed. Cir. 1988).
38 See, e.g., Wieland Werke, AG v. United States, 718 F. Supp. 50 (Ct. Int’l Trade 1989). 39 The Statement of Administrative Action (SAA) to the Uruguay Round Agreements Act (URAA),
expressly states that “the new section will not affect current Commission practice under which the statutory requirement is satisfied if there is a reasonable overlap of competition.” H.R. Rep. No. 103-(Continued...)

11
Alliance argues that the Commission should cumulate subject imports from China and Thailand, as the petitions were filed simultaneously and there is a reasonable overlap of competition between the domestic like product and subject imports from China and Thailand.40 Respondents do not address cumulation for present material injury in their written submissions or hearing testimony.
For purposes of our determinations on subject imports from China, we consider subject imports from China and those subject imports from Thailand from exporters other than LHH on a cumulated basis, because the statutory criteria for cumulation are satisfied for those subject imports, as discussed below. As an initial matter, Alliance filed the antidumping and countervailing duty petitions with respect to imports from both subject countries on the same day, January 30, 2018. Imports of subject merchandise from Thailand sourced from exporter LHH are statutorily prohibited from being cumulated with other subject merchandise for purposes of the Commission’s determinations on subject imports from China because they are subject to preliminary negative antidumping and countervailing duty determinations.41 42
(…Continued) 316, Vol. I at 848 (1994) (citing Fundicao Tupy, S.A. v. United States, 678 F. Supp. at 902; see Goss Graphic Sys., Inc. v. United States, 33 F. Supp. 2d 1082, 1087 (Ct. Int’l Trade 1998) (“cumulation does not require two products to be highly fungible”); Wieland Werke, AG, 718 F. Supp. at 52 (“Completely overlapping markets are not required.”).
40 Alliance argues that the domestic like product and subject imports from China and Thailand have comparable rubber content, which makes them fungible, and that U.S. producers, importers, and purchasers all agree that imports from both subject countries are generally interchangeable with each other and the domestic like product. Further, the domestic like product and subject imports from China and Thailand are sold in the same channels of distribution, compete in the same four broad regions of the contiguous United States, and are simultaneously present in the U.S. market. Alliance Prehearing Brief at 12-15.
41 19 U.S.C. §1677(G)(ii)(I) provides that the Commission shall not cumulatively assess the volume and effect of imports of the subject merchandise “with respect to which the administering authority has made a preliminary negative determination, unless the administering authority subsequently made a final affirmative determination with respect to those imports before the Commission’s final determination is made.” In its preliminary determinations, Commerce found a zero antidumping margin and a de minimis countervailable subsidy rate for subject merchandise exported by LHH. Rubber Bands From Thailand: Preliminary Affirmative Determination of Sales at Less Than Fair Value, Postponement of Final Determination, and Extension of Provisional Measures, 83 Fed. Reg. 45220, 45221 (Sept. 6, 2018). Rubber Bands From Thailand: Preliminary Negative Countervailing Duty Determination and Alignment of Final Determination With Final Antidumping Duty Determination, 83 Fed. Reg. 31728 (July 9, 2018). Consequently, the statute precludes these imports from being cumulated in the determinations concerning rubber bands from China.
42 We observe that Commerce has made affirmative final subsidy and dumping determinations with respect to subject imports from China, and preliminarily has found certain imports from Thailand to be dumped but not subsidized. Consequently, any decision to cumulate imports in these investigations will involve “cross-cumulating” subsidized imports from China with imports from Thailand preliminarily found only to have been dumped. In these investigations, we continue our longstanding practice of cross-cumulating dumped and subsidized imports. See Polyethylene Terephthalate (PET) Resin from (Continued...)

12
Fungibility. Overall, the record indicates a high degree of interchangeability for rubber bands of similar size. A majority of marketplace participants (including ***, importers, and purchasers) reported that rubber bands produced in the United States, China, and Thailand were always or frequently interchangeable.43 Purchasers found the domestic product comparable with imports from each subject country, and imports from China and Thailand comparable to each other, on a wide variety of purchasing factors.44 The majority of purchasers found that rubber bands produced in the United States, China, and Thailand always met minimum quality specifications.45
The record reflects that Alliance and U.S. importers of subject imports from China and subject imports from Thailand preliminarily found to be dumped, all ship a broad range of rubber bands. In particular, there are shipments of domestic product and imports from each subject source of rubber bands with similar rubber content, in the same sizes.46
We find that the record indicates a sufficient degree of interchangeability and comparability between and among subject imports from China, subject imports from Thailand preliminarily found to be dumped, and the domestic like product, to establish that products from these sources are fungible.
Channels of Distribution. Substantial proportions of shipments of the domestic like product, subject imports from China, and subject imports from Thailand preliminarily found to be dumped are sold in a common channel of distribution: to retailers. Further, a substantial
(…Continued) Canada, China, India, and Oman, Inv. Nos. 701-TA-531-532 and 731-TA-1270-1273 (Final), USITC Pub. 4604 at 9-11 (April 2016); Circular Welded Carbon-Quality Steel Pipe from India, Oman, the United Arab Emirates, and Vietnam, Inv. Nos. 701-TA-482 to 484 (Final), USITC Pub. 4362 at 12 n.59 (Dec. 2012); Softwood Lumber from Canada, Inv. Nos. 701-TA-414 and 731-TA-928 (Final), USITC Pub. 3509 at 29-31 (May 2009); Bingham & Taylor v. United States, 815 F.2d 982 (Fed. Cir. 1987).
43 CR at II-19, PR at II-12; CR/PR at Table II-10. The facts available with respect to certain data tabulated in section II of the Commission report concern all subject imports from Thailand, including those exported by LHH.
44 CR/PR at Table II-9. 45 CR/PR at Table II-11. 46 There were shipments in 2017 of the domestic like product, subject imports from China, and
subject imports from Thailand preliminarily found to be dumped, in three categories of rubber content: greater than 50 and less than 65 percent rubber; greater than 65 and less than 80 percent rubber; and, greater than 80 and less than 95 percent rubber. U.S. producers also shipped domestic product and U.S. importers shipped subject imports from China in the less than 50 percent rubber category, and U.S. importers shipped subject imports from China and subject imports from Thailand preliminarily found to be dumped in the greater than 95 percent rubber category. CR/PR at Table IV-6 and Figure IV-4. CR/PR at Table IV-7 (substantial overlap in various sizes).

13
proportion of shipments of the domestic like product and subject imports from Thailand preliminarily found to be dumped are sold to distributors and end users.47
Geographic Overlap. Domestically produced rubber bands and subject imports from China and Thailand are sold in all regions of the United States.48
Simultaneous Presence in Market. The domestic like product, subject imports from China, and those subject imports from Thailand preliminarily found to be dumped were present in the U.S. market throughout the period of investigation.49
Conclusion. We find that subject imports from China, and those subject imports from Thailand preliminarily found to be dumped, are fungible with the domestic like product and each other, that these imports from each subject country and the domestic like product are sold in similar channels of distribution and in similar geographical markets, and have been simultaneously present in the U.S. market. In light of the foregoing, we find that there is a reasonable overlap of competition between and among the domestic like product, subject imports from China, and subject imports from Thailand preliminarily found to be dumped. Consequently, we cumulate subject imports from China and subject imports from Thailand preliminarily found to be dumped in determining whether the domestic industry is materially injured by reason of subject imports from China.
V. Material Injury by Reason of Subject Imports
Based on the record in the final phase of these investigations, we find that an industry in the United States is materially injured by reason of imports of rubber bands from China found by Commerce to be sold in the United States at LTFV and subsidized by the government of China.
A. Legal Standards
In the final phase of antidumping and countervailing duty investigations, the Commission determines whether an industry in the United States is materially injured or threatened with material injury by reason of the imports under investigation.50 In making this determination, the Commission must consider the volume of subject imports, their effect on
47 CR/PR at Table II-1. In 2017, a substantial share of U.S. shipments of the domestic like product
were sold to distributors (*** percent), retailers (*** percent) and end users (*** percent); a substantial share of U.S. shipments of subject imports from Thailand preliminarily found to be dumped were sold to distributors (*** percent), retailers (*** percent), and end users (*** percent); and *** U.S. shipments of subject imports from China were sold to retailers. Id.
48 CR/PR at Table II-2. Available data on this factor concern all subject imports from Thailand. 49 CR/PR at Table IV-9, Tables V-3-8. 50 19 U.S.C. §§ 1671d(b), 1673d(b). The Trade Preferences Extension Act of 2015, Pub. L. 114-27,
amended the provisions of the Tariff Act pertaining to Commission determinations of material injury and threat of material injury by reason of subject imports in certain respects. We have applied these amendments here.

14
prices for the domestic like product, and their impact on domestic producers of the domestic like product, but only in the context of U.S. production operations.51 The statute defines “material injury” as “harm which is not inconsequential, immaterial, or unimportant.”52 In assessing whether the domestic industry is materially injured by reason of subject imports, we consider all relevant economic factors that bear on the state of the industry in the United States.53 No single factor is dispositive, and all relevant factors are considered “within the context of the business cycle and conditions of competition that are distinctive to the affected industry.”54
Although the statute requires the Commission to determine whether the domestic industry is “materially injured or threatened with material injury by reason of” unfairly traded imports,55 it does not define the phrase “by reason of,” indicating that this aspect of the injury analysis is left to the Commission’s reasonable exercise of its discretion.56 In identifying a causal link, if any, between subject imports and material injury to the domestic industry, the Commission examines the facts of record that relate to the significance of the volume and price effects of the subject imports and any impact of those imports on the condition of the domestic industry. This evaluation under the “by reason of” standard must ensure that subject imports are more than a minimal or tangential cause of injury and that there is a sufficient causal, not merely a temporal, nexus between subject imports and material injury.57
In many investigations, there are other economic factors at work, some or all of which may also be having adverse effects on the domestic industry. Such economic factors might include nonsubject imports; changes in technology, demand, or consumer tastes; competition among domestic producers; or management decisions by domestic producers. The legislative history explains that the Commission must examine factors other than subject imports to ensure that it is not attributing injury from other factors to the subject imports, thereby
51 19 U.S.C. § 1677(7)(B). The Commission “may consider such other economic factors as are
relevant to the determination” but shall “identify each {such} factor ... and explain in full its relevance to the determination.” 19 U.S.C. § 1677(7)(B).
52 19 U.S.C. § 1677(7)(A). 53 19 U.S.C. § 1677(7)(C)(iii). 54 19 U.S.C. § 1677(7)(C)(iii). 55 19 U.S.C. §§ 1671d(a), 1673d(a). 56 Angus Chemical Co. v. United States, 140 F.3d 1478, 1484-85 (Fed. Cir. 1998) (“{T}he statute
does not ‘compel the commissioners’ to employ {a particular methodology}.”), aff’g, 944 F. Supp. 943, 951 (Ct. Int’l Trade 1996).
57 The Federal Circuit, in addressing the causation standard of the statute, observed that “{a}s long as its effects are not merely incidental, tangential, or trivial, the foreign product sold at less than fair value meets the causation requirement.” Nippon Steel Corp. v. USITC, 345 F.3d 1379, 1384 (Fed. Cir. 2003). This was further ratified in Mittal Steel Point Lisas Ltd. v. United States, 542 F.3d 867, 873 (Fed. Cir. 2008), where the Federal Circuit, quoting Gerald Metals, Inc. v. United States, 132 F.3d 716, 722 (Fed. Cir. 1997), stated that “this court requires evidence in the record ‘to show that the harm occurred “by reason of” the LTFV imports, not by reason of a minimal or tangential contribution to material harm caused by LTFV goods.’” See also Nippon Steel Corp. v. United States, 458 F.3d 1345, 1357 (Fed. Cir. 2006); Taiwan Semiconductor Industry Ass’n v. USITC, 266 F.3d 1339, 1345 (Fed. Cir. 2001).

15
inflating an otherwise tangential cause of injury into one that satisfies the statutory material injury threshold.58 In performing its examination, however, the Commission need not isolate the injury caused by other factors from injury caused by unfairly traded imports.59 Nor does the “by reason of” standard require that unfairly traded imports be the “principal” cause of injury or contemplate that injury from unfairly traded imports be weighed against other factors, such as nonsubject imports, which may be contributing to overall injury to an industry.60 It is clear that the existence of injury caused by other factors does not compel a negative determination.61
Assessment of whether material injury to the domestic industry is “by reason of” subject imports “does not require the Commission to address the causation issue in any particular way” as long as “the injury to the domestic industry can reasonably be attributed to the subject imports” and the Commission “ensure{s} that it is not attributing injury from other sources to
58 SAA at 851-52 (“{T}he Commission must examine other factors to ensure that it is not
attributing injury from other sources to the subject imports.”); S. Rep. 96-249 at 75 (1979) (the Commission “will consider information which indicates that harm is caused by factors other than less-than-fair-value imports.”); H.R. Rep. 96-317 at 47 (1979) (“in examining the overall injury being experienced by a domestic industry, the ITC will take into account evidence presented to it which demonstrates that the harm attributed by the Alliance to the subsidized or dumped imports is attributable to such other factors;” those factors include “the volume and prices of nonsubsidized imports or imports sold at fair value, contraction in demand or changes in patterns of consumption, trade restrictive practices of and competition between the foreign and domestic producers, developments in technology and the export performance and productivity of the domestic industry”); accord Mittal Steel, 542 F.3d at 877.
59 SAA at 851-52 (“{T}he Commission need not isolate the injury caused by other factors from injury caused by unfair imports.”); Taiwan Semiconductor Industry Ass’n, 266 F.3d at 1345 (“{T}he Commission need not isolate the injury caused by other factors from injury caused by unfair imports ... . Rather, the Commission must examine other factors to ensure that it is not attributing injury from other sources to the subject imports.” (emphasis in original)); Asociacion de Productores de Salmon y Trucha de Chile AG v. United States, 180 F. Supp. 2d 1360, 1375 (Ct. Int’l Trade 2002) (“{t}he Commission is not required to isolate the effects of subject imports from other factors contributing to injury” or make “bright-line distinctions” between the effects of subject imports and other causes.); see also Softwood Lumber from Canada, Inv. Nos. 701-TA-414 and 731-TA-928 (Remand), USITC Pub. 3658 at 100-01 (Dec. 2003) (Commission recognized that “{i}f an alleged other factor is found not to have or threaten to have injurious effects to the domestic industry, i.e., it is not an ‘other causal factor,’ then there is nothing to further examine regarding attribution to injury”), citing Gerald Metals, 132 F.3d at 722 (the statute “does not suggest that an importer of LTFV goods can escape countervailing duties by finding some tangential or minor cause unrelated to the LTFV goods that contributed to the harmful effects on domestic market prices.”).
60 S. Rep. 96-249 at 74-75; H.R. Rep. 96-317 at 47. 61 See Nippon Steel Corp., 345 F.3d at 1381 (“an affirmative material-injury determination under
the statute requires no more than a substantial-factor showing. That is, the ‘dumping’ need not be the sole or principal cause of injury.”).

16
the subject imports.”62 Indeed, the Federal Circuit has examined and affirmed various Commission methodologies and has disavowed “rigid adherence to a specific formula.”63
The Federal Circuit’s decisions in Gerald Metals, Bratsk, and Mittal Steel all involved cases where the relevant “other factor” was the presence in the market of significant volumes of price-competitive nonsubject imports. The Commission interpreted the Federal Circuit’s guidance in Bratsk as requiring it to apply a particular additional methodology following its finding of material injury in cases involving commodity products and a significant market presence of price-competitive nonsubject imports.64 The additional “replacement/benefit” test looked at whether nonsubject imports might have replaced subject imports without any benefit to the U.S. industry. The Commission applied that specific additional test in subsequent cases, including the Carbon and Certain Alloy Steel Wire Rod from Trinidad and Tobago determination that underlies the Mittal Steel litigation.
Mittal Steel clarifies that the Commission’s interpretation of Bratsk was too rigid and makes clear that the Federal Circuit does not require the Commission to apply an additional test nor any one specific methodology; instead, the court requires the Commission to have “evidence in the record” to “show that the harm occurred ‘by reason of’ the LTFV imports,” and requires that the Commission not attribute injury from nonsubject imports or other factors to subject imports.65 Accordingly, we do not consider ourselves required to apply the replacement/benefit test that was included in Commission opinions subsequent to Bratsk.
The progression of Gerald Metals, Bratsk, and Mittal Steel clarifies that, in cases involving commodity products where price-competitive nonsubject imports are a significant factor in the U.S. market, the Court will require the Commission to give full consideration, with adequate explanation, to non-attribution issues when it performs its causation analysis.66
62 Mittal Steel, 542 F.3d at 877-78; see also id. at 873 (“While the Commission may not enter an affirmative determination unless it finds that a domestic industry is materially injured ‘by reason of’ subject imports, the Commission is not required to follow a single methodology for making that determination ... {and has} broad discretion with respect to its choice of methodology.”) citing United States Steel Group v. United States, 96 F.3d 1352, 1362 (Fed. Cir. 1996) and S. Rep. 96-249 at 75. In its decision in Swiff-Train v. United States, 793 F.3d 1355 (Fed. Cir. 2015), the Federal Circuit affirmed the Commission’s causation analysis as comporting with the Court’s guidance in Mittal.
63 Nucor Corp. v. United States, 414 F.3d 1331, 1336, 1341 (Fed. Cir. 2005); see also Mittal Steel, 542 F.3d at 879 (“Bratsk did not read into the antidumping statute a Procrustean formula for determining whether a domestic injury was ‘by reason’ of subject imports.”).
64 Mittal Steel, 542 F.3d at 875-79. 65 Mittal Steel, 542 F.3d at 873 (quoting from Gerald Metals, 132 F.3d at 722), 875-79 & n.2
(recognizing the Commission’s alternative interpretation of Bratsk as a reminder to conduct a non-attribution analysis).
66 To that end, after the Federal Circuit issued its decision in Bratsk, the Commission began to present published information or send out information requests in the final phase of investigations to producers in nonsubject countries that accounted for substantial shares of U.S. imports of subject merchandise (if, in fact, there were large nonsubject import suppliers). In order to provide a more complete record for the Commission’s causation analysis, these requests typically seek information on capacity, production, and shipments of the product under investigation in the major source countries that export to the United States. The Commission plans to continue utilizing published or requested (Continued...)

17
The question of whether the material injury threshold for subject imports is satisfied notwithstanding any injury from other factors is factual, subject to review under the substantial evidence standard.67 Congress has delegated this factual finding to the Commission because of the agency’s institutional expertise in resolving injury issues.68
B. Conditions of Competition and the Business Cycle
The following conditions of competition inform our analysis of whether there is material injury by reason of cumulated subject imports.
1. Demand Considerations
Demand for rubber bands in the United States is affected by demand in a wide range of end use markets including stationery, industrial packaging, agriculture, retail, government and post office, advertising specialty, and newspapers.69 A few market participants noted declining demand for rubber bands used to bundle newspapers; one importer stated that the use of stretch film and arrow rubber band tags has reduced rubber band usage, and one purchaser reported an increase in demand for rubber bands due to general economic growth.70 A plurality of firms reported no change in U.S. demand for rubber bands since January 1, 2015. Eight of the twenty-five responding importers and three of the fifteen responding purchasers reported decreased demand. Six importers, three purchasers, *** reported fluctuating demand.71 Apparent U.S. consumption of rubber bands measured by quantity decreased by *** percent from 2015 to 2017. 72 By contrast, there was little change in apparent U.S. consumption between the interim periods.73
2. Supply Considerations
The domestic industry was the largest supplier of rubber bands to the U.S. market during the period of investigation. Its market share increased from *** percent in 2015 to ***
(…Continued) information in the final phase of investigations in which there are substantial levels of nonsubject imports.
67 We provide in our discussion below a full analysis of other factors alleged to have caused any material injury experienced by the domestic industry.
68 Mittal Steel, 542 F.3d at 873; Nippon Steel Corp., 458 F.3d at 1350, citing U.S. Steel Group, 96 F.3d at 1357; S. Rep. 96-249 at 75 (“The determination of the ITC with respect to causation is ... complex and difficult, and is a matter for the judgment of the ITC.”).
69 CR at I-14; PR at I-10. 70 CR at II-8; PR at II-5. Importer *** reported that the decline of the newspaper industry has
led to a decline in demand from that sector. Id. at 9. 71 CR/PR at Table II-4. 72 CR/PR at Table C-1. 73 Apparent U.S. consumption was *** percent higher in interim (January to June) 2018 than in
interim 2017. CR/PR at Table C-1.
18
percent in 2016 and *** percent in 2017, but was lower in interim 2018, when it was *** percent, than in interim 2017, when it was *** percent.74 As previously discussed, the only responding domestic producer in these investigations is Alliance, which accounts for at least 90 percent of U.S. production of rubber bands.75 Cumulated subject imports from China and Thailand were the second largest source of supply. Their U.S. market share decreased from *** percent in 2015 to *** percent in 2016 and *** percent in 2017, but was higher in interim 2018, when it was *** percent, than in interim 2017, when it was *** percent.76 Thailand-LHH imports were the third largest supplier to the U.S. market, and their U.S. market share fluctuated over the period of investigation, increasing from *** percent in 2015, to *** percent in 2016, then decreasing to *** percent in 2017; it was *** percent in interim 2017 and higher, at *** percent in interim 2018.77 Imports from sources other than China and Thailand had a very small presence in the market throughout the period; their market share was *** percent in 2015, *** percent in 2016, *** percent in 2017, *** percent in interim 2017, and *** percent in interim 2018.78
3. Substitutability and Other Conditions
The record indicates that there is a high degree of substitutability between domestically produced rubber bands, subject imports from China, and those subject imports from Thailand that we have cumulated.79 The U.S. producer and the majority of importers and purchasers reported that rubber bands produced in the United States, China, and Thailand are always or frequently interchangeable with each other and with the domestic like product.80 A majority of purchasers reported that the domestic like product and imports from each subject country were comparable with respect to 16 of 19 purchasing factors, including “quality meets industry standards,” “quality exceeds industry standards,” and “availability.”81 Furthermore, the U.S. producer and U.S. importers of subject imports from China and cumulated subject imports from Thailand ship rubber bands with similar rubber content, in the same sizes.82 The record indicates that price is an important consideration in purchasing decisions. Purchasers reported that price and quality were the most important factors they consider in purchasing decisions.83 The majority of purchasers (12 of 20 responding firms) reported that
74 CR/PR at Table IV-11. 75 CR at III-1-2; PR at III-1. The record indicates that ***. CR/PR at III-1, n.2. 76 CR/PR at Table IV-11. 77 CR/PR at Table IV-11. 78 CR/PR at Table IV-11. 79 CR at II-10; PR at II-6. As previously stated, some of the available data in section II of the
Commission report concern all subject imports from Thailand, including those exported by LHH. 80 CR/PR at Table II-10. 81 CR/PR at Table II-9. 82 CR/PR at Table IV-6 & Figure IV-4 (U.S. shipments by rubber content); CR/PR at Table IV-7 and
Figure IV-6 (U.S. shipments by size). 83 CR/PR at Table II-6.
19
they usually purchase the lowest-priced product and four reported that they always purchase the lowest-priced product.84 Nonprice factors can also play a role in purchasing decisions.85 U.S. purchasers of rubber bands are large wholesalers and retailers and end users; the largest responding purchasers of rubber bands in descending order of purchases and imports during 2017 were ***.86 The domestic industry sells *** percent of its rubber bands under short-term contracts, *** percent through spot sales, and *** percent under annual contracts; U.S. importers sell *** percent of their rubber bands through spot sales.87 Raw material costs accounted for a substantial portion of the domestic industry’s cost of goods sold (“COGS”) during the period of investigation. The ratio of raw material costs to COGS fell from *** percent in 2015 to *** percent in 2017; this ratio was *** percent in interim 2017 and lower, at *** percent, in interim 2018.88 The per-pound unit value of raw materials declined from $*** in 2015 to $*** in 2016 and $*** in 2017; it was $*** in interim 2017 and lower, at $*** in interim 2018.89 Rubber is the domestic industry’s primary raw material input in the production of rubber bands.90 Monthly prices for natural rubber and synthetic rubber fluctuated in 2015 and 2016 and spiked in 2017 (reportedly due to supply concerns over flooding in Thailand); natural rubber prices gradually decreased in 2018 and synthetic rubber prices increased.91 In September 2018, the Office of the U.S. Trade Representative issued a 10 percent tariff on rubber bands from China under Section 301(b) of the Trade Act of 1974.92
C. Volume of Subject Imports
Section 771(7)(C)(i) of the Tariff Act provides that the “Commission shall consider whether the volume of imports of the merchandise, or any increase in that volume, either in absolute terms or relative to production or consumption in the United States, is significant.”93
84 CR at II-12; PR at II-7. 85 A substantial majority of purchasers reported that factors such as availability, delivery terms,
product consistency, and reliability of supply were very important purchasing factors. CR/PR at Table II-7. When asked to assess how often differences other than price were significant in sales of rubber bands from the United States or subject countries, the U.S. producer reported that differences other than price are *** significant, a majority of importers reported that such differences were sometimes or never significant, and a majority of responding purchasers reported that such differences between the domestic like product and subject imports were always or frequently significant. CR/PR at Table II-12.
86 CR/PR at II-1. 87 CR/PR at Table V-2. Respondent U. Yong asserts that Staples, a large retailer, engages in an
annual bidding process for the rubber bands that it purchases, but Alliance and respondent Encore disagree. U. Yong Prehearing Brief at 9; Alliance Posthearing Brief at 9; Tr. at 112-114 (Nelson).
88 CR/PR at Table VI-1. 89 CR/PR at Table VI-1. 90 CR at VI-5 n.5; PR at VI-2 n.5. 91 CR/PR at Figure V-1. 92 CR at I-7-8, PR at I-5. 93 19 U.S.C. § 1677(7)(C)(i).
20
Cumulated subject imports had a substantial presence in the U.S. market throughout the period of investigation; they decreased from *** pounds in 2015 to *** pounds in 2016 and *** pounds in 2017.94 The share of apparent U.S. consumption held by cumulated subject imports similarly decreased from *** percent in 2015 to *** percent in 2016 and *** percent in 2017.95
In late 2017 and interim 2018, there was a sharp increase in the absolute and relative presence of cumulated subject imports. Staples made a decision to switch the supplier of its private label rubber band account from Alliance, which supplied this account in 2016 and 2017, to a subject Thai producer. Although Alliance lost the Staples private label rubber band account in 2017, it continued to supply that account through most of that year, and the full effects of the loss of this account were not realized, or apparent in the data we collected, until interim 2018. Alliance continued to ship product to Staples in interim 2018, but at much smaller volumes than in 2017.96 Consequently, cumulated subject import volume was *** pounds in interim 2018, which was *** percent higher than the *** pounds in interim 2017.97 Staples’ increased direct imports of subject merchandise from Thailand for purposes of its private label rubber bands *** for the higher cumulated subject import volume in interim 2018 compared to interim 2017.98 99
The share of apparent U.S. consumption held by cumulated subject imports in interim 2018 was *** percent, which was *** percentage points higher than the *** percent share in interim 2017, and *** percentage points greater than the market share in full year 2017.100 The gains of the cumulated subject imports in interim 2018 were overwhelmingly at the expense of the domestic industry. The share of apparent U.S. consumption held by the
94 CR/PR at Table IV-2. 95 CR/PR at Table IV-11. 96 *** purchased ***. CR/PR at Table V-12 n.5. Alliance began fulfilling the ***. CR at III-2-3 &
nn. 4, 7; PR at III-2 & nn.4, 7. The level of Staples’ purchases from Alliance were *** in 2016 and 2017 when Staples was purchasing private label rubber bands from Alliance. Staples purchased *** pounds from Alliance in 2015, *** pounds in 2016, *** pounds in 2017, *** pounds in interim 2017 and *** pounds in interim 2018. Staples Purchaser Questionnaire Response at 5, EDIS Doc. No. 659556 (Oct. 23, 2018). CR/PR at Table V-12 n.5. EDIS Doc. No. 663135 (Dec. 3, 2018).
Consistent with Alliance’s account of these facts, Staples reports that ***. CR at II-17, V-31; PR at II-10, V-11.
97 CR/PR at Tables IV-2 & C-1. 98 Staples had direct imports of *** pounds of cumulated subject imports from Thailand in
interim 2018, as compared to *** in interim 2017. Staples’ Importer Questionnaire at 21, EDIS Doc. No. 658522 (Oct. 11, 2018).
99 The surge in imports from Thailand began in late 2017, coinciding with the switch in suppliers for Staples’ private label account from Alliance to a subject Thai supplier. Staples’ 2017 imports from Thai sources we have cumulated began in ***. In the aggregate, Staples imported ***. Staples’ Importer Questionnaire at 26], EDIS Doc. No. 658522 (Oct. 11, 2018).
100 CR/PR at Table C-1.

21
domestic industry was *** percent in interim 2018, which was *** percentage points lower than its *** percent share in interim 2017.101
Based on the above discussion, we find that cumulated subject import volume is significant, in absolute terms and relative to apparent U.S. consumption and that, while cumulated subject imports declined in the full years of the period of investigation, there was a significant increase between interim periods, both in absolute terms and relative to apparent U.S. consumption.
D. Price Effects of the Subject Imports
Section 771(7)(C)(ii) of the Tariff Act provides that, in evaluating the price effects of the subject imports, the Commission shall consider whether
(I) there has been significant price underselling by the imported merchandise as compared with the price of domestic like products of the United States, and
(II) the effect of imports of such merchandise otherwise depresses prices to a significant degree or prevents price increases, which otherwise would have occurred, to a significant degree.102
As previously discussed, the record shows that price is an important consideration in purchasing decisions, and there is a high degree of substitutability between domestically produced rubber bands and cumulated subject imports from China and Thailand.
The Commission requested U.S. producers and importers to provide quarterly data for the total quantity and f.o.b. value of six rubber band products shipped to unrelated U.S. customers during January 2015 to June 2018.103 One U.S. producer (Alliance) and seven importers provided usable pricing data for sales of the requested products, although not all firms reported pricing for all products for all quarters. Pricing data reported by these firms
101 CR/PR at Table C-1. 102 19 U.S.C. § 1677(7)(C)(ii). 103 The rubber band products for which the Commission requested pricing data are as follows: Product 1: Size #32 rubber bands (3” X 1/8”), with a natural rubber/latex content >=65% and <80%, sold in 1 lb. poly bags. Product 2: Size #33 rubber bands (3 1/2” X 1/8”), with a natural rubber/latex content >=65%
and <80%, sold in 1 lb. poly bags. Product 3: Size #64 rubber bands (3 1/2” X 1/4”), with a natural rubber/latex content >=65%
and <80%, sold in 1 lb. poly bags. Product 4: Size #18 rubber bands (3” X 1/16”), newspaper size, with a natural rubber/latex
content >=65% and <80%, sold in 1 lb. poly bags. Product 5: Size #14 rubber bands (2” X 1/16”), agricultural size, with a natural rubber/latex
content >=65% and <80%, sold in 1 lb. poly bags. Product 6: Size #18 rubber bands (3” X 1/16”), with a natural rubber/latex content >=65%
and <80%, sold in 3.5 ounce bags. CR at V-7-8; PR at V-5-6.

22
accounted for approximately *** percent of the U.S. producer’s commercial shipments of rubber bands, *** percent of non-retail commercial shipments of cumulated subject imports from Thailand, and *** percent of non-retail commercial shipments of imports from Thailand-LHH in 2017. No pricing data were reported for subject imports from China.104 105
Prices for cumulated subject imports were below those for the domestic like product in 45 of 70 quarterly comparisons (with *** of subject imports in those quarters), with margins of underselling ranging from 0.0 to 35.5 percent. In the remaining 25 quarterly comparisons (with *** of subject imports in those quarters), prices for the cumulated subject imports from Thailand were between 0.7 to 19.1 percent above prices for the domestic like product.106 The available pricing data consequently indicate that cumulated subject imports predominantly undersold the domestic like product.
Moreover, the underselling by the subject imports led to the domestic industry losing significant sales. In particular, Alliance lost sales to Staples for its private label rubber band business due to the lower prices of the subject imports. Staples stated that it purchased ***.107 As previously discussed, in 2017 Staples awarded its private label business, which was supplied by Alliance during 2016-2017, to a supplier of subject merchandise from Thailand. Staples acknowledges that it switched the supplier of its private label rubber bands from Alliance ***.108 In addition, ***.109 According to Alliance, Staples informed it that the price offered by the supplier of subject merchandise from Thailand was *** per pound compared to Alliance’s price of *** per pound, a difference of *** per pound.110
We find that Alliance lost the significant Staples private label business due to the lower-priced subject imports, and that these significant lost sales caused the domestic industry to lose market share to cumulated subject imports in interim 2018. Moreover, the record indicates that Alliance lost sales to other purchasers due to the lower prices of the cumulated subject imports. Of 22 responding purchasers, 11 reported that, since 2015, they had purchased cumulated subject imports instead of U.S.-produced product. Ten of these purchasers reported that the subject import prices were lower than the prices for the U.S.-produced product, and eight purchasers reported that price was a primary reason for the decision to purchase
104 CR at V-8-9, PR at V-6. Five importers reported pricing data for subject imports from
Thailand, five reported pricing data for imports from Thailand-LHH, and none reported pricing data for imports from China. CR at V-8 n.17, PR at V-6 n.17.
105 The Commission also requested data from importers of landed duty-paid values and quantities for imports of pricing product 6 for retail sale, repackaging, or internal consumption, i.e., direct imports. One importer (***) provided such cost data for cumulated subject imports from Thailand, and no importers provided data for subject imports from China. We have no data concerning domestic products with which to compare these direct import data because U.S. producer Alliance reported no sales of pricing product 6. Moreover, the direct import data that we received covered relatively small quantities of subject imports. CR at V-21, PR at V-8; CR/PR at Table V-9.
106 CR at V-23, PR at V-9; CR/PR at Table V-11. 107 CR/PR at Table V-13. 108 CR at II-17, V-31; PR at II-10, V-11. 109 CR at V-32; PR at V-11. See also EDIS Document No. 662515 (Nov. 27, 2018). 110 CR at V-27 n.22; PR at V-10 n.22.

23
cumulated subject imports rather than the domestic like product.111 We find the underselling that led to these lost sales to be significant.
We have considered whether cumulated subject imports have depressed domestic prices to a significant degree. Prices for both the domestic like product and cumulated subject imports generally decreased from 2015 to 2017, but in interim 2018 the pricing trends were mixed.112 Between the first quarter of 2015 and the second quarter of 2018, prices increased for one of the domestically produced pricing products, and declined between *** percent and *** percent for the other four.113 Apparent U.S. consumption declined from 2015 to 2017, and was relatively flat in interim 2018 compared to interim 2017.114 Similarly, unit cost of goods sold (“COGS”) declined from 2015 to 2017, and showed little variation between interim 2017 and interim 2018.115 As previously discussed, rubber costs fluctuated during the period of investigation.116 Given factors unrelated to subject imports, such as the declines in apparent U.S. consumption and unit COGS from 2015 to 2017, that could have contributed to price declines from 2015 to 2017, the fluctuations in rubber costs, and the lack of clear price trends in interim 2018, we do not find that subject imports depressed domestic prices to a significant degree.
We have also considered whether cumulated subject imports have prevented price increases which otherwise would have occurred, to a significant degree. Conditions of competition from 2015 to 2017, specifically the declines in apparent U.S. consumption and unit COGS, would not have made price increases likely during that period. As previously discussed, in interim 2018, apparent U.S. consumption and unit COGS varied little from interim 2017 levels. The record does not indicate that the domestic industry attempted unsuccessfully to raise prices during interim 2018. We consequently do not find that cumulated subject imports prevented price increases that otherwise would have occurred, to a significant degree.
In conclusion, we find that significant underselling by the cumulated subject imports led to lost sales, in particular significant lost sales at the private label Staples account, and that these lost sales resulted in market share shifts in interim 2018 to the domestic industry’s detriment, including the adverse effects described below.
111 CR at V-27, 29; PR at V-10; CR/PR at Tables V-13 and V-14. Alliance provided details of price
negotiations and copies of emails in which customers either told Alliance about the lower subject import prices it was accepting, or referenced Alliance’s prices as considerably higher than subject import prices. Alliance Posthearing Brief at 10-11, Exhibits 2 & 3.
112 Prices during interim 2018 increased for four of the five domestically produced products, and four of the six subject Thai products. CR/PR at Tables V-3-V-8, Figures V-2-7. As previously discussed, the record does not contain any pricing data with respect to subject imports from China.
113 CR/PR at Table V-10. 114 CR/PR at Table IV-10. 115 CR/PR at Table VI-1. 116 CR/PR at Figure V-1.
24
E. Impact of the Subject Imports117
Section 771(7)(C)(iii) of the Tariff Act provides that in examining the impact of subject imports, the Commission “shall evaluate all relevant economic factors which have a bearing on the state of the industry.”118 These factors include output, sales, inventories, capacity utilization, market share, employment, wages, productivity, gross profits, net profits, operating profits, cash flow, return on investment, return on capital, ability to raise capital, ability to service debts, research and development, and factors affecting domestic prices. No single factor is dispositive and all relevant factors are considered “within the context of the business cycle and conditions of competition that are distinctive to the affected industry.”119
We find that cumulated subject imports had a significant impact on the domestic industry during the period of investigation, particularly in interim 2018. From 2015 to 2017, most of Alliance’s trade and financial performance indicators were flat or improving. Production and capacity utilization steadily increased.120 U.S. shipments increased from ***
117 The statute instructs the Commission to consider the “magnitude of the dumping margin” in
an antidumping proceeding as part of its consideration of the impact of imports. 19 U.S.C. § 1677(7)(C)(iii)(V). In its final LTFV determination with respect to subject imports from China, Commerce found a dumping margin of 27.27 percent for imports from the China-wide entity. Rubber Bands from the People's Republic of China: Final Determination of Sales at Less Than Fair Value, 83 Fed. Reg. 58547, 58548 (Nov. 20. 2018). In its preliminary LTFV determination with respect to subject imports from Thailand, Commerce found dumping margins of zero for LHH, 5.86 percent for U. Yong Industry Co., Ltd. and 5.86 percent for the all others rate. Rubber Bands from Thailand: Preliminary Affirmative Determination of Sales at Less Than Fair Value, Postponement of Final Determination, and Extension of Provisional Measures, 83 Fed. Reg. 45220, 45221 (Sept. 6, 2018). We take into account in our analysis the fact that Commerce has made preliminary or final findings that all subject producers in China and Thailand other than LHH are selling subject imports in the United States at less than fair value. In addition to this consideration, our impact analysis has considered other factors affecting domestic prices. Our analysis of the significant underselling of subject imports, described in both the price effects discussion and below, is particularly probative to an assessment of the impact of the subject imports.
118 19 U.S.C. § 1677(7)(C)(iii); see also SAA at 851 and 885 (“In material injury determinations, the Commission considers, in addition to imports, other factors that may be contributing to overall injury. While these factors, in some cases, may account for the injury to the domestic industry, they also may demonstrate that an industry is facing difficulties from a variety of sources and is vulnerable to dumped or subsidized imports.”).
119 19 U.S.C. § 1677(7)(C)(iii). This provision was amended by the Trade Preferences Extension Act of 2015, Pub. L. 114-27. 120 Capacity was unchanged at *** pounds from 2015 to 2017. Production increased gradually from *** pounds in 2015 to *** pounds in 2016 and *** pounds in 2017. Capacity utilization was *** percent in 2015, *** percent in 2016, and *** percent in 2017. CR/PR at Table III-3. We note that Commission staff estimates that Alliance’s average production capacity is lower than its reported capacity based on its current operations, but Alliance explains that it has cut back on its production shifts, and that it could expand its production in line with its reported production capacity. CR at III-4 & nn.9-10; PR at III-2-3 & nn.9-10.
25
pounds in 2015 to *** pounds in 2016 and *** pounds in 2017.121 The domestic industry’s market share increased from *** percent in 2015 to *** percent in 2016 and *** percent in 2017.122 Employment indicators were either essentially flat, or increasing modestly.123 Net sales gradually increased from 2015 to 2017 measured in quantity and value.124 The domestic industry’s operating income increased from $*** in 2015 to $*** in 2016 and 2017, and its operating income as a share of net sales was *** percent in 2015, *** percent in 2016, and *** percent in 2017.125 Other measures of financial performance also improved.126 The industry’s capital expenditures and research and development (“R&D”) expenses fluctuated.127 Alliance’s assets increased, and its operating return on assets fluctuated and increased to some degree.128
However, the industry’s condition sharply deteriorated in interim 2018 as the loss of the Staples private label account had a widespread effect on most of Alliance’s trade and financial performance indicators. Production and capacity utilization were lower in interim 2018 than in interim 2017.129 U.S. shipments were *** pounds in interim 2018, lower than the *** pounds
121 CR/PR at Table III-4. Alliance’s end-of-period (“EOP”) inventories were *** pounds in 2015,
*** pounds in 2016, and *** pounds in 2017. CR/PR at Table III-5. 122 CR/PR at Table IV-11. 123 The number of production workers was essentially flat from 2015 to 2017; total hours
worked and total wages paid increased by a modest *** and *** percent, respectively. Productivity, measured in pounds per hour, fluctuated within a narrow range. CR/PR at Tables III-7 and C-1.
124 Total net sales revenue was $*** in 2015, $*** in 2016, and $*** in 2017. By quantity, net sales were *** pounds in 2015, *** pounds in 2016, and *** pounds in 2017. CR/PR at Tables VI-1 & C-1.
125 CR/PR at Table C-1. 126 Gross profit was $*** in 2015, $*** in 2016, and $*** in 2017. Net income was $*** in
2015, $*** in 2016, and $*** in 2017. Cash flow was $*** in 2015, $*** in 2016, and $*** in 2017. CR/PR at Tables VI-1 & C-1.
127 Alliance’s capital expenditures were $*** in 2015, $*** in 2016 and $*** in 2017. Its R&D expenditures were $*** in 2015, $*** in 2016, and $*** in 2017. CR/PR at Table VI-4.
Alliance devoted a significant share, $1.3 million, of its capital expenditures from 2015 to 2017 to build 20,000 square feet of warehouse space to hold rubber intended to be used to make rubber bands for the Staples private label account. Alliance states that having the rubber on-site was critical to providing on time delivery. CR at III-2-3 & n.5, PR at III-2 & n.5; CR at VI-9 n.12, PR at VI-5 n.12. Alliance asserts that the cost of the warehouse is part of the injury it has experienced given that the warehouse is now unnecessary and 80 percent empty. Alliance Prehearing Brief at 29-30; Alliance Posthearing Brief at 13. Respondent U. Yong argues that building the warehouse was a poor business decision because Alliance could have rented warehouse space instead, and that the cost of the warehouse should not be blamed on subject imports. Respondent U. Yong Prehearing Brief at 6-7.
128 Alliance’s assets increased from $*** in 2015 to $*** in 2016 to $*** in 2017. Its operating return on assets was *** percent in 2015, *** percent in 2016, and *** percent in 2017. CR/PR at Table VI-5.
129 Capacity was unchanged at *** pounds in interim 2017 and interim 2018. Production was *** pounds in interim 2017 and *** pounds in interim 2018. Capacity utilization was *** percent in interim 2017 and *** percent in interim 2018. CR/PR at Table III-3.

26
in interim 2017.130 The domestic industry’s market share was *** percent in interim 2018, down approximately six percentage points from the *** percent level in interim 2017.131 The number of production related workers (“PRWs”) and productivity were lower in interim 2018 than in interim 2017.132 Net sales were lower in interim 2018 than in interim 2017, measured by both quantity and value.133 The domestic industry’s operating income was $*** in interim 2018, less than the $*** in interim 2017; its operating income as a share of net sales was sharply lower in interim 2018, when it was *** percent, than in interim 2017, when it was *** percent.134 The industry’s capital expenditures decreased and its R&D expenses increased.135
We find that significant underselling by cumulated subject imports caused the domestic industry to lose sales, in particular a substantial volume of sales associated with the Staples private label account, which resulted in lower market share, lower output, sales, and revenue, and sharply lower profitability for the domestic industry in interim 2018.
We have considered whether there are other factors that may have had an impact on the domestic industry during the period of investigation to ensure that we are not attributing injury from such other factors to subject imports. We find that those imports that we have not cumulated cannot explain the injury to the domestic industry caused by cumulated subject imports. The available pricing data reflect that Thailand-LHH imports were usually priced higher than the cumulated subject imports, and in a majority of instances priced higher than the domestic like product.136 Furthermore, when cumulated subject imports increased and gained market share at the expense of the domestic industry in interim 2018, the volume and market share of imports from other sources was essentially flat.137 The other imports in the U.S.
130 CR/PR at Tables III-4 and C-1. Alliance’s EOP inventories were *** pounds in interim 2017
and *** pounds in interim 2018. CR/PR at Table III-5. 131 CR/PR at Table IV-11. 132 The number of PRWs was *** in interim 2017 and *** in interim 2018. Total hours worked
were *** hours in interim 2017 and *** in interim 2018. Hours worked per PRW were *** hours in interim 2017 and *** hours in interim 2018. Total wages paid were $*** in interim 2017 and interim 2018. Productivity measured in pounds per hour was *** pounds per hour in interim 2017 and *** pounds per hour in interim 2018. CR/PR at Table III-7.
133 Total net sales revenue was $*** in interim 2017 and $*** in interim 2018. By quantity, net sales were *** pounds in interim 2017 and *** pounds in interim 2018. CR/PR at Tables VI-1 & C-1.
134 CR/PR at Table C-1. Gross profit was $*** in interim 2017 and $*** in interim 2018. Net income was $*** in interim 2017 and $*** in interim 2018. Cash flow was $*** in interim 2017 and $*** in interim 2018. CR/PR at Tables VI-1 & C-1.
135 Alliance’s capital expenditures were $*** in interim 2017 and $*** in interim 2018. Its R&D expenditures were $*** in interim 2017 and $*** in interim 2018. CR/PR at Table VI-4. Assets and return on assets are not computed on a less than full year basis.
136 Prices for Thailand-LHH imports were higher than prices for the cumulated subject imports in 57 price comparisons and lower in 27 price comparisons; they were higher than prices for the domestic like product in 40 price comparisons and lower in 30 price comparisons. CR at V-23; PR at V-9.
137 The volume of combined Thailand-LHH imports and imports from sources other than China or Thailand was *** pounds in both interim 2017 and interim 2018; it was *** pounds in 2015, *** pounds in 2016, and *** pounds in 2017. CR/PR at Table IV-2. (Continued...)

27
market were not responsible for the domestic industry’s significant lost sales, which were lost to subject imports due to their lower prices, or responsible for the domestic industry’s loss of market share in interim 2018. Therefore, these other imports were not responsible for the deterioration of the domestic industry’s output and financial performance in interim 2018, which resulted from the lost sales and market share.138
We have also considered the role of demand during the period of investigation. Measured by apparent U.S. consumption, demand increased slightly in interim 2018 compared to interim 2017, by *** percent. Therefore, demand was not a factor in the domestic industry’s lost sales and ensuing loss of revenues and output in interim 2018.
We consequently find that cumulated subject imports had a significant impact on the domestic industry during the period of investigation, particularly in interim 2018. Accordingly, we determine that the domestic industry producing rubber bands is materially injured by reason of imports of rubber bands from China found by Commerce to be sold in the United States at LTFV and subsidized by the government of China.
VI. Critical Circumstances
A. Legal Standards and Party Arguments
In its final antidumping and countervailing duty determinations concerning rubber bands from China, Commerce found that critical circumstances exist with respect to certain subject producers/exporters. Because we have determined that the domestic industry is materially injured by reason of subject imports from China, we must further determine “whether the imports subject to the affirmative {Commerce critical circumstances} determination ... are likely to undermine seriously the remedial effect of the antidumping
(…Continued)
The U.S. market share for combined Thailand-LHH imports and imports from sources other than China and Thailand increased from *** percent in 2015 to *** percent in 2016 and then decreased to *** percent in 2017; it was *** percent in interim 2017 and lower, at *** percent, in interim 2018. CR/PR at Table IV-11.
138 Respondent U. Yong argues that the domestic industry would likely not be any better off in the absence of cumulated subject imports, because the sales that went to cumulated subject imports would go to imports from other sources instead. U. Yong Prehearing Brief at 11-13. We find that there is no correlation between the volume trends of cumulated subject imports and imports from other sources that would suggest that a decline in one leads to an increase in the other. The volume of cumulated subject imports steadily decreased from 2015 to 2017 and were sharply higher in interim 2018 than interim 2017. By contrast, the volume of imports from other sources fluctuated from 2015 to 2017 and then were stable in the interim periods. CR/PR at Table IV-2. Moreover, we note that ***, which has been importing subject merchandise from China, has indicated that it will be purchasing rubber bands from Alliance in 2018 due to its concerns over tariffs on Chinese manufactured goods; this indicates that purchasers would not necessarily turn to Thailand-LHH or nonsubject imports if orders were placed on cumulated subject imports. CR at V-32; PR at V-11.

28
{and/or countervailing duty} order{s} to be issued.”139 The SAA indicates that the Commission is to determine “whether, by massively increasing imports prior to the effective date of relief, the importers have seriously undermined the remedial effect of the order” and specifically “whether the surge in imports prior to the suspension of liquidation, rather than the failure to provide retroactive relief, is likely to seriously undermine the remedial effect of the order.”140 The legislative history for the critical circumstances provision indicates that the provision was designed “to deter exporters whose merchandise is subject to an investigation from circumventing the intent of the law by increasing their exports to the United States during the period between initiation of an investigation and a preliminary determination by {Commerce}.”141 An affirmative critical circumstances determination by the Commission, in conjunction with an affirmative determination of material injury by reason of subject imports, would normally result in the retroactive imposition of duties for those imports subject to the affirmative Commerce critical circumstances determination for a period 90 days prior to the suspension of liquidation.
The statute provides that, in making this determination, the Commission shall consider, among other factors it considers relevant,
(I) the timing and the volume of the imports,
(II) a rapid increase in inventories of the imports, and
(III) any other circumstances indicating that the remedial effect of the {order} will be seriously undermined.142
In considering the timing and volume of subject imports, the Commission's practice is to consider import quantities prior to the filing of the petition with those subsequent to the filing of the petition using monthly statistics on the record regarding those firms for which Commerce has made an affirmative critical circumstances determination.143
Alliance argues that the Commission should find that critical circumstances exist in these investigations. It maintains that subject imports from China surged immediately following the filing of the petitions, and that the absence of a critical circumstances finding would undermine the remedial effect of any antidumping and countervailing duty orders against rubber bands from China.144 Respondents did not make any arguments with respect to critical circumstances.
139 19 U.S.C. §§ 1671d(b)(4)(A)(ii), 1673d(b)(4)(A)(ii). 140 SAA at 877. 141 ICC Industries, Inc. v United States, 812 F.2d 694, 700 (Fed. Cir. 1987), quoting H.R. Rep. No.
96-317 at 63 (1979), aff’g 632 F. Supp. 36 (Ct. Int’l Trade 1986). See 19 U.S.C. §§ 1671b(e)(2), 1673b(e)(2).
142 19 U.S.C. §§ 1671d(b)(4)(A)(ii), 1673d(b)(4)(A)(ii). 143 See Lined Paper School Supplies from China, India, and Indonesia, Inv. Nos. 701-TA-442-43,
731-TA-1095-97, USITC Pub. 3884 at 46-48 (Sept. 2006); Carbazole Violet Pigment from China and India, Inv. Nos. 701-TA-437 and 731-TA-1060-61 (Final), USITC Pub. 3744 at 26 (Dec. 2004); Certain Frozen Fish Fillets from Vietnam, Inv. No. 731-TA-1012 (Final), USITC Pub. 3617 at 20-22 (Aug. 2003).
144 Alliance Prehearing Brief at 45.

29
B. Analysis
Commerce’s final determination in the antidumping duty investigation on China found that critical circumstances exist with respect to all subject imports from China.145 Commerce’s final determination in the countervailing duty investigation on China found that critical circumstances exist with respect to subject imports exported by Graceful Imp. & Exp. Co., Ltd., Moyoung Trading Co., Ltd., and Ningbo Syloon Imp & Exp Co., Ltd.146 Thus, Commerce’s affirmative critical circumstances determinations in the antidumping and countervailing duty investigations extend to different companies. The statute requires that the Commission make its critical circumstances determinations on the basis of imports subject to Commerce’s affirmative critical circumstances determination; therefore, we separately examine the respective data for each investigation below.147
We first consider the appropriate period for comparison of pre-petition and post-petition levels of the imports subject to affirmative critical circumstances findings. While the Commission typically considers six-month periods, it has relied on a shorter comparison period when Commerce’s preliminary determination fell within the six-month post-petition period.148 That situation arises here. We thus compare the volume of subject imports five months prior to the filing of the petition with the volume of subject imports five months after the filing of the petition in our critical circumstances analyses.149
145 Rubber Bands From the People’s Republic of China: Final Determination of Sales at Less Than
Fair Value, 83 Fed. Reg. 58547, 58548 (Nov. 20, 2018). 146 Rubber Bands From the People’s Republic of China: Final Affirmative Countervailing Duty
Determination, 83 Fed. Reg. 58538, 58538-39 (Nov. 20, 2018). 147 See, e.g., Steel Wire Garment Hangers from Vietnam, Inv. Nos. 701-TA-487 and 731-TA-1198
(Final), USITC Pub. 4371 at 4-5 (Jan. 2013) and Crystalline Silicon Photovoltaic Cells and Modules from China, Inv. Nos. 701-TA-481 and 731-TA-1190 (Final), USITC Pub. 4360 at 40-41 (Nov. 2012).
148 In particular, the Commission has used five-month periods in recent investigations where the timing of the first preliminary Commerce determination authorizing the imposition of provisional duties would have served to reduce subject import volume in the sixth month of the post-petition period. See, e.g., Cold-Rolled Steel Flat Products from China and Japan, Inv. Nos. 701-TA-541 and 731-TA-1284 and 1286 (Final), USITC Pub. 4619 (July 2016); Polyethylene Terephthalate (PET) Resin from Canada, China, India, and Oman, Inv. Nos. 701-TA-531-532 and 731-TA-1270-1273 (Final), USITC Pub. 4604 at 31-32 (Apr. 2016); Carbon and Certain Steel Wire Rod from China, Inv. Nos. 701-TA-512, 731-TA-1248 (Final), USITC Pub. 4509 at 25-26 (Jan. 2015) (using five-month periods because preliminary Commerce countervailing duty determination caused reduction of subject import volume in sixth month).
149 The petitions in these investigations were filed on January 30, 2018, and Commerce made its preliminary affirmative determination in the countervailing duty investigation with respect to China on July 2, 2018. CR at I-2; PR at 1. Rubber Bands From the People’s Republic of China: Preliminary Affirmative Countervailing Duty Determination and Alignment of Final Determination With Final Antidumping Determination, 83 Fed. Reg. 31729 (July 9, 2018). Thus, we consider the periods September 2017 through January 2018 and February 2018 through June 2018.

30
1. Antidumping Duty Investigation
The volume of subject imports from China decreased from *** pounds in the five-month pre-petition period to *** pounds in the five-month post-petition period (a decrease of ***).150 Available information show that U.S. importers’ end-of-period (“EOP”) inventories of subject imports from China were *** pounds in December 2017 and *** pounds in June 2018.151 Given the decrease in import volume in the post-petition period and the lower EOP inventories in June 2018 compared to December 2017, we find that the imports subject to Commerce’s antidumping duty critical circumstances determination would not undermine seriously the remedial effect of the antidumping duty order. Consequently, and in the absence of any other circumstances indicating that the remedial effect of the antidumping duty order will be seriously undermined, we make a negative critical circumstances determination with regard to subject imports from China subject to Commerce’s affirmative critical circumstances finding in the antidumping duty investigation.
2. Countervailing Duty Investigation
The volume of subject imports from China from the three exporters for which Commerce made affirmative critical circumstances findings in the countervailing duty investigation decreased from *** pounds for the five-month pre-petition period to *** pounds for the five-month post-petition period (a decrease of *** percent).152 Available information shows that importers’ EOP inventories were *** pounds in December 2017 and *** pounds in June 2018.153 Given the decrease in import volume in the post-petition period and the lower EOP inventories in June 2018 compared to December 2017, we find that the imports subject to Commerce’s countervailing duty critical circumstances determination would not undermine seriously the remedial effect of the countervailing duty order. Consequently, and in the absence of any other circumstances indicating that the remedial effect of the countervailing duty order will be seriously undermined, we make a negative critical circumstances determination with regard to those subject imports from China subject to Commerce’s affirmative critical circumstances finding in the countervailing duty investigation.
VII. Conclusion
For the reasons stated above, we determine that an industry in the United States is materially injured by reason of subject imports of rubber bands from China that are sold in the
150 CR/PR at Table IV-3. An analysis using six-month periods shows a decrease of ***), from ***
pounds in the period August 2017 through January 2018 to *** pounds in the period February 2018 through July 2018. Id.
151 CR/PR at Table VII-5. 152 CR/PR at Table IV-4. An analysis using six-month periods shows a decrease (of ***), from ***
pounds in the period August 2017 through January 2018 to *** pounds in the period February 2018 through July 2018. Id.
153 CR/PR at Table VII-5. The information available concerns all subject imports from China.

31
United States at less than fair value and subsidized by the government of China. We also determine that critical circumstances do not exist with respect to imports of rubber bands from China for which Commerce made affirmative critical circumstances determinations.


I-1
PART I: INTRODUCTION
BACKGROUND These investigations result from petitions filed with the U.S. Department of Commerce
(“Commerce”) and the U.S. International Trade Commission (“USITC” or “Commission”) by Alliance Rubber Co. (“Alliance”), Hot Springs, Arkansas, on January 30, 2018, alleging that an industry in the United States is materially injured and threatened with material injury by reason of subsidized and less-than-fair-value (“LTFV”) imports of rubber bands1 from China, Sri Lanka, and Thailand. On March 19, 2018, the Commission determined that LTFV imports of rubber bands from Sri Lanka were negligible and its antidumping and countervailing duty investigations with regard to rubber bands from Sri Lanka were thereby terminated.2 The following tabulation provides information relating to the background of these investigations.3 4
Effective date Action January 30, 2018 Petitions filed with Commerce and the Commission; institution of the
Commission's investigations (83 FR 5143, February 5, 2018) February 20, 2018 Commerce’s notices of initiation March 19, 2018 Commission’s preliminary determinations July 2, 2018 Commerce’s preliminary CVD determinations (83 FR 31728, 83 FR
31729, July 9, 2018) August 29, 2018 Commerce’s preliminary critical circumstances determination (China)
and amendment to scope of preliminary China CVD determination (83 FR 45217, September 6, 2018)
August 29, 2018 Commerce’s preliminary LTFV determinations (83 FR 45213, 83 FR 45220, September 6, 2018); scheduling of final phase of Commission investigations (83 FR 46969; September 17, 2018)
November 13, 2018 Commerce’s final CVD determination (China) (83 FR 58538, November 20, 2018); Commerce’s final LTFV determination (China) (83 FR 58547, November 20, 2018)
November 13, 2018 Commission’s hearing December 14, 2018 Commission’s vote (China) February 11, 2019 Commission’s views February 28, 2019 (expected) Scheduled date for Commerce’s final determination (Thailand)
Note.—Due to the lapse in appropriations and ensuing cessation of Commission operations, all import injury investigations conducted under authority of Title VII of the Tariff Act of 1930 accordingly have been tolled pursuant to19 U.S.C. §§ 1671d(b)(2), 1673d(b)(2).
1 See the section entitled “The Subject Merchandise” in Part I of this report for a complete description of the merchandise subject in this proceeding.
2 Rubber Bands From China, Sri Lanka, and Thailand; Determinations, 83 FR 12594, March 22, 2018. 3 Pertinent Federal Register notices are referenced in appendix A, and may be found at the
Commission’s website (www.usitc.gov). 4 A list of witnesses appearing at the hearing is presented in appendix B of this report.

I-2
STATUTORY CRITERIA AND ORGANIZATION OF THE REPORT
Statutory criteria
Section 771(7)(B) of the Tariff Act of 1930 (the “Act”) (19 U.S.C. § 1677(7)(B)) provides that in making its determinations of injury to an industry in the United States, the Commission--
shall consider (I) the volume of imports of the subject merchandise, (II) the effect of imports of that merchandise on prices in the United States for domestic like products, and (III) the impact of imports of such merchandise on domestic producers of domestic like products, but only in the context of production operations within the United States; and. . . may consider such other economic factors as are relevant to the determination regarding whether there is material injury by reason of imports.
Section 771(7)(C) of the Act (19 U.S.C. § 1677(7)(C)) further provides that--5 In evaluating the volume of imports of merchandise, the Commission shall consider whether the volume of imports of the merchandise, or any increase in that volume, either in absolute terms or relative to production or consumption in the United States is significant.. . .In evaluating the effect of imports of such merchandise on prices, the Commission shall consider whether. . .(I) there has been significant price underselling by the imported merchandise as compared with the price of domestic like products of the United States, and (II) the effect of imports of such merchandise otherwise depresses prices to a significant degree or prevents price increases, which otherwise would have occurred, to a significant degree.. . . In examining the impact required to be considered under subparagraph (B)(i)(III), the Commission shall evaluate (within the context of the business cycle and conditions of competition that are distinctive to the affected industry) all relevant economic factors which have a bearing on the state of the industry in the United States, including, but not limited to. . . (I) actual and potential decline in output, sales, market share, gross profits, operating profits, net profits, ability to service debt, productivity, return on investments, return on assets, and utilization of capacity, (II) factors affecting domestic prices, (III) actual and potential negative effects on cash flow, inventories, employment, wages, growth, ability to raise capital, and investment, (IV) actual and potential negative effects on the existing development and production efforts of the domestic industry, including efforts to develop a derivative or more
5 Amended by PL 114-27 (as signed, June 29, 2015), Trade Preferences Extension Act of 2015.
I-3
advanced version of the domestic like product, and (V) in {an antidumping investigation}, the magnitude of the margin of dumping.
In addition, Section 771(7)(J) of the Act (19 U.S.C. § 1677(7)(J)) provides that—6 (J) EFFECT OF PROFITABILITY.—The Commission may not determine that there is no material injury or threat of material injury to an industry in the United States merely because that industry is profitable or because the performance of that industry has recently improved.
Organization of report Part I of this report presents information on the subject merchandise, subsidy and
dumping margins, and domestic like product. Part II of this report presents information on conditions of competition and other relevant economic factors. Part III presents information on the condition of the U.S. industry, including data on capacity, production, shipments, inventories, and employment. Parts IV and V present the volume of subject imports and pricing of domestic and imported products, respectively. Part VI presents information on the financial experience of U.S. producers. Part VII presents the statutory requirements and information obtained for use in the Commission’s consideration of the question of threat of material injury as well as information regarding nonsubject countries.
MARKET SUMMARY Rubber bands are commonly used to hold multiple objects together, including papers,
fruits and vegetables, pieces of equipment, and other items. Rubber bands are sold in many industry segments, including the following: stationery, paper and packaging, newspaper, agricultural, retail, government, post office, and advertising.7 The leading U.S. producer of rubber bands is the petitioner, Alliance,8 while identified producers or exporters of rubber bands outside the United States include the following: Liang Hah Heng International Rubber Co., Ltd. (“LHH”),9 Progress Inter Rubber Co., Ltd. (“Progress Rubber”), Srithepthai Rubber Products Co., Ltd. (“Srithepthai”) in Thailand, and U. Yong Industry Co., Ltd. (“U. Yong”). The leading U.S. importers of in-scope rubber bands from China during 2017 were ***, while the
6 Amended by PL 114-27 (as signed, June 29, 2015), Trade Preferences Extension Act of 2015. 7 Petitions, p. 10. 8 Petitions, pp. 21-22 and 25. Petitioner Alliance identified two firms other than itself that are
possible U.S. producers of rubber bands in the United States. 9 This Thai firm is currently subject to a preliminary zero antidumping margin and a preliminary de
minimis counteravailable subsidy margin. Rubber Bands From Thailand: Preliminary Affirmative Determination of Sales at Less Than Fair Value, Postponement of Final Determination, and Extension of Provisional Measures, 83 FR 45220, September 6, 2018.

I-4
leading importers of subject in-scope rubber bands from Thailand during 2017 were ***. The leading U.S. importers of rubber bands from Thailand-LHH and nonsubject sources were ***. U.S. purchasers of rubber bands are wholesalers, retailers, and end users in office stationery, newspaper, agricultural, and other industries; leading purchasers based on purchaser questionnaire responses include ***.
Apparent U.S. consumption of rubber bands totaled approximately *** pounds ($***) in 2017. U.S. producers’ U.S. shipments of rubber bands totaled *** pounds ($***) in 2017, and accounted for *** percent of apparent U.S. consumption by quantity and *** percent by value. U.S. imports from subject sources totaled *** pounds ($***) in 2017 and accounted for *** percent of apparent U.S. consumption by quantity and *** percent by value. U.S. imports from Thailand-LHH and U.S. imports from nonsubject sources totaled *** pounds ($***) in 2017 and accounted for *** percent of apparent U.S. consumption by quantity and *** percent by value.
SUMMARY DATA AND DATA SOURCES
A summary of data collected in these investigations is presented in appendix C, table C-1. Except as noted, U.S. industry data are based on questionnaire responses of one firm that accounted for at least 90 percent of U.S. production of rubber bands during 2017.10 U.S. import data presented for China and Thailand measured by quantity and value were compiled using adjusted *** import records. *** data are presented in this report instead of public official Commerce import statistics because U.S. imports on the basis of quantity are not available from public records for HTS statistical reporting number 4016.99.35.10 (rubber bands of natural rubber). Quantity data compiled from *** import records are based on shipping weight, which also includes the weight of packaging.11 The questionnaire responses of importers account for an estimated *** percent of imports from China and an estimated *** percent of subject imports from Thailand in 2017.12
Foreign producer data for Thailand is based on the questionnaire responses of four firms that accounted for an estimated *** percent of subject imports from Thailand in 2017 and an estimated *** percent all U.S. imports of rubber bands from Thailand. The Commission did not receive any usable response to its questionnaire from any producer China.
10 Conference transcript, p. 31 (Risner). 11 Unless otherwise noted, *** import data presented in this report have been adjusted to remove
data from the following firms that provided certifications that they did not import rubber bands: ***. 12 Coverage for imports was lower in the prehearing report for both China and Thailand. Coverage for
imports from China was reported at *** percent and *** percent of all imports of rubber bands from Thailand in the prehearing report. Rubber Bands from China, Sri Lanka, and Thailand Inv. Nos. 701-TA-598-600 and 731-TA-1408-1410, Prehearing Report, INV-QQ-126, October 30, 2018, p. I-6. Staff attribute the coverage increase in this report to newly received questionnaire responses from ***. Staff estimates coverage of all imports of rubber bands from Thailand at *** percent.
I-5
PREVIOUS AND RELATED INVESTIGATIONS Rubber bands have not been the subject of any prior antidumping or countervailing duty
investigations in the United States.13
Section 301 Investigations On August 18, 2017, the Office of the U.S. Trade Representative (“USTR”) initiated an
investigation into certain acts, policies, and practices of the government of China related to technology transfer, intellectual property and innovation.14 On April 6, 2018, USTR, pursuant to Section 301(b) of the Trade Act of 1974, determined it was appropriate to impose a 25 percent duty on certain products from China.15 Additional duties were applied in two tranches to include 818 tariff subheadings and 279 tariff subheadings.16 On August 7, 2018, the USTR announced that supplemental action may be taken to impose additional duties on production from China,17 and subsequently held a 6-day public hearing from August 20-27, 2018. On September 21, 2018, USTR modified its section 301 tariff to impose additional duties on products from China to include rubber bands.18 19 The initial duty rate on or after September 24, 2018 is 10 percent ad valorem with an increase to 25 percent ad valorem on January 1, 2019.20
13 Petitions, p. 7; conference transcript, p. 44 (Goldberg). 14 Initiation of Section 301 Investigation; Hearing; and Requests for Public Comments: China’s Acts,
Policies, and Practices Related to Technology Transfer, Intellectual Property, and Innovation, 82 FR 40213, August 24, 2017.
15 Notice of Determination and Request for Public Comment Concerning Proposed Determination of Action Pursuant to Section 301: China’s Acts, Policies, and Practices Related to Technology Transfer, Intellectual Property, and innovation, 83 FR 14906, April 6, 2018.
16 Notice of Action and Request for Public Comment Concerning Proposed Determination of Action Pursuant to Section 301: China’s Acts, Policies, and Practices Related to Technology Transfer, Intellectual Property, and innovation, 83 FR 28710, June 20, 2018; and Notice of Action Pursuant to Section 301: China’s Acts, Policies, and Practices Related to Technology Transfer, Intellectual Property, and Innovation, 83 FR 40823, August 16, 2018.
17 Extension of Public Comment Period Concerning Proposed Modification of Action Pursuant to Section 301: China’s Acts, Policies, and Practices related to Technology Transfer, Intellectual Property, and Innovation, 83 FR 38760, August 7, 2018.
18 Identified as HTS 4016.99.35. 19 Notice of Modification of Section 301 action: China’s Acts, Policies, and Practices Related to
Technology Transfer, Intellectual Property, and Innovation, 83 FR 47974, September 21, 2018. 20 Ibid.
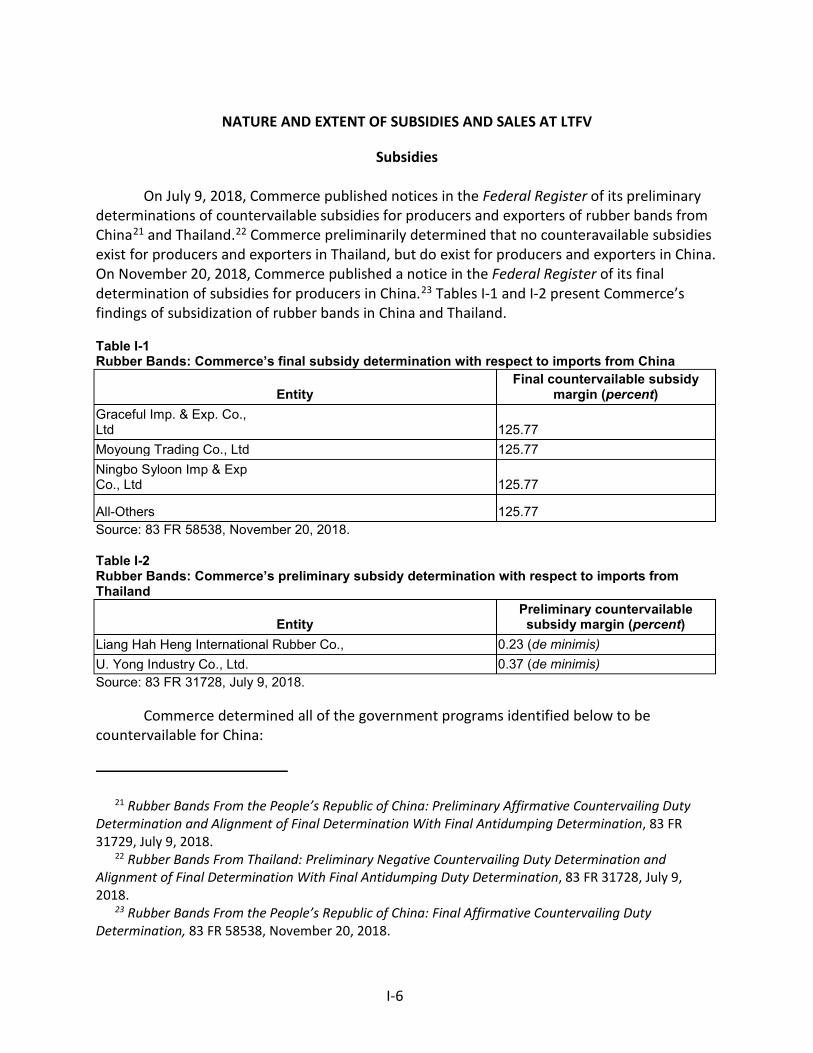
I-6
NATURE AND EXTENT OF SUBSIDIES AND SALES AT LTFV
Subsidies
On July 9, 2018, Commerce published notices in the Federal Register of its preliminary determinations of countervailable subsidies for producers and exporters of rubber bands from China21 and Thailand.22 Commerce preliminarily determined that no counteravailable subsidies exist for producers and exporters in Thailand, but do exist for producers and exporters in China. On November 20, 2018, Commerce published a notice in the Federal Register of its final determination of subsidies for producers in China.23 Tables I-1 and I-2 present Commerce’s findings of subsidization of rubber bands in China and Thailand.
Table I-1 Rubber Bands: Commerce’s final subsidy determination with respect to imports from China
Entity Final countervailable subsidy
margin (percent) Graceful Imp. & Exp. Co., Ltd 125.77 Moyoung Trading Co., Ltd 125.77 Ningbo Syloon Imp & Exp Co., Ltd 125.77
All-Others 125.77 Source: 83 FR 58538, November 20, 2018.
Table I-2 Rubber Bands: Commerce’s preliminary subsidy determination with respect to imports from Thailand
Entity Preliminary countervailable subsidy margin (percent)
Liang Hah Heng International Rubber Co., 0.23 (de minimis) U. Yong Industry Co., Ltd. 0.37 (de minimis) Source: 83 FR 31728, July 9, 2018.
Commerce determined all of the government programs identified below to be countervailable for China:
21 Rubber Bands From the People’s Republic of China: Preliminary Affirmative Countervailing Duty Determination and Alignment of Final Determination With Final Antidumping Determination, 83 FR 31729, July 9, 2018.
22 Rubber Bands From Thailand: Preliminary Negative Countervailing Duty Determination and Alignment of Final Determination With Final Antidumping Duty Determination, 83 FR 31728, July 9, 2018.
23 Rubber Bands From the People’s Republic of China: Final Affirmative Countervailing Duty Determination, 83 FR 58538, November 20, 2018.

I-7
Program Name 1. Export Loans From Chinese State-Owned Banks 2. Export Seller’s Credit Program 3. Export Credit Guarantees 4. Export Buyer’s Credit 5. Export Credit Insurance Subsidies 6. Provision Of Natural Rubber For LTAR 7. Provision Of Land-Use Rights In Industrial And Other Special Economic Zones For LTAR 8. Provision Of Electricity For LTAR 9. Income Tax Deductions For Research And Development Expenses Under The Enterprise
Income Tax Law 10. Import Tariff Reductions To Foreign Invested Enterprises And Certain Domestic
Enterprises Using Imported Equipment In Encouraged Industries 11. Import Tariff Reductions To Foreign Invested Enterprises And Certain Domestic
Enterprises Using Imported Equipment In Encouraged Industries 12. GOC And Sub-Central Government Subsidies For The Development Of Famous Brands
And China World Top Brands 13. Special Fund For Energy Savings Technology Reform 14. SME International Market Exploration/Development Fund 15. SME Technology Innovation Fund 16. Export Assistance Grants
Sales at LTFV
On September 6, 2018, Commerce published a notice in the Federal Register of its preliminary determinations of sales at LTFV with respect to imports from China 24 and Thailand.25 On November 20, 2018, Commerce published a notice in the Federal Register of its final determination of sales at LTFV with respect to imports from China.26 Tables I-3 and I-4 present Commerce’s dumping margins with respect to imports of rubber bands from China and Thailand.
Table I-3 Rubber Bands: Commerce’s final weighted-average LTFV margins with respect to imports from China
Exporter/ Producer Final dumping margin
(percent) China-Wide Entity 27.27 Source: 83 FR 58547, November 20, 2018.
24Less-Than-Fair-Value Investigation of Rubber Bands From the People’s Republic of China: Preliminary Affirmative Determination of Sales at Less Than Fair Value and Preliminary Affirmative Determination of Critical Circumstances, , 83 FR 45213, September 6, 2018.
25Rubber Bands From Thailand: Preliminary Affirmative Determination of Sales at Less Than Fair Value, Postponement of Final Determination, and Extension of Provisional Measures, 83 FR 45220, September 6, 2018.
26 Rubber Bands From the People's Republic of China: Final Determination of Sales at Less Than Fair Value, 83 FR 58547, November 20, 2018.

I-8
Table I-4 Rubber Bands: Commerce’s preliminary weighted-average LTFV margins with respect to imports from Thailand
Exporter/Producer Preliminary dumping margin
(percent) Liang Hah Heng International Rubber Co., Ltd./Hah Shung Heng Co 0.00
U. Yong Industry Co., Ltd 5.86
All Others 5.86 Source: 83 FR 45220, September 6, 2018.
THE SUBJECT MERCHANDISE
Commerce’s scope In the current proceeding, Commerce has defined the scope as follows: … bands made of vulcanized rubber, with a flat length, as actually measured end-to-end by the band lying flat, no less than ½ inch and no greater than 10 inches; with a width, which measures the dimension perpendicular to the length, actually of at least 3/64 inch and no greater than 2 inches; and a wall thickness actually from 0.020 inch to 0.125 inch. Vulcanized rubber has been chemically processed into a more durable material by the addition of sulfur or other equivalent curatives or accelerators. Subject products are included regardless of color or inclusion of printed material on the rubber band’s surface, including but not limited to, rubber bands with printing on them, such as a product name, advertising, or slogan, and printed material (e.g., a tag) fastened to the rubber band by an adhesive or another temporary type of connection. The scope includes vulcanized rubber bands which are contained or otherwise exist in various forms and packages, such as, without limitation, vulcanized rubber bands included within a desk accessory set or other type of set or package, and vulcanized rubber band balls. The scope excludes products that consist of an elastomer loop and durable tag all-in-one, and bands that are being used at the time of import to fasten an imported product. Excluded from the scope of this investigation are vulcanized rubber bands of various sizes with arrow shaped rubber protrusions from the outer diameter that exceeds at the anchor point a wall thickness of 0.125 inches and where the protrusion is used to loop around, secure and lock in place. Excluded from the scope of this investigation are yarn/fabric-covered vulcanized rubber hair bands, regardless of size.

I-9
Merchandise covered by this investigation is currently classified in the Harmonized Tariff Schedule of the United States (HTSUS) under subheading 4016.99.3510. Merchandise covered by the scope may also enter under HTSUS subheading 4016.99.6050. While the HTSUS subheadings are provided for convenience and customs purposes, the written description of the scope of the investigation is dispositive.27
Tariff treatment
Based on the scope set forth by the Department of Commerce, information available to the Commission indicates that the merchandise subject to these investigations are imported under the following provisions of the Harmonized Tariff Schedule of the United States (“HTS”): HTS statistical reporting number 4016.99.35.10 (rubber bands made of vulcanized rubber, except Hard Rubber, of natural rubber). Merchandise covered by the scope may also be imported under HTS statistical reporting number 4016.99.6050 (a residual or “basket” line that may include not only rubber bands other than natural rubber, but also other items that are outside the scope of these investigations). The 2018 general rate of duty is free for HTS subheading 4016.99.35 and is 2.5 percent ad valorem for HTS subheading 4016.99.60. HTS subheadings 4016.99.35 and 4016.99.60 are among the products of China that are subject to an additional 10-percent ad valorem duty, to rise to 25-percent ad valorem28 29 under heading 9903.88.03, pursuant to action taken under Section 301 of the Trade Act of 1974.30 31 Decisions on the tariff classification and treatment of imported goods are within the authority of U.S. Customs and Border Protection.
THE PRODUCT
Rubber bands subject to these investigations are cylindrical tube-shaped elastic bands of vulcanized natural and synthetic rubbers of various lengths, widths, thicknesses, colors, and rubber content, each type having similar characteristics.32 Since its invention in the mid-1800s,33 natural rubber bands have been the predominant type produced and used worldwide for a multitude of consumer and industrial applications owing to its somewhat lower cost,
27Rubber Bands From the People's Republic of China: Final Affirmative Countervailing Duty Determination, 83 FR 58538, November 20, 2018.
28 Annexes A and C of 83 FR 47974 on January 1, 2019 (annex B of 83 FR 47974) 29 Notice of Modification of Section 301 Action: China’s Acts, Policies, and Practices Related to
Technology Transfer, Intellectual Property, and Innovation, 83 FR 47974, September 21, 2018. 30 See U.S. notes 20(e) and 20(f)30 to subchapter III of chapter 99. 31 HTSUS (2018) Revision 13, USITC Publication No. 4832, October 2018, p. 99-III-67. 32 Commission staff plant trip to Alliance Rubber Company, Hot Springs, AR, October 4, 2018;
Petitions, p. 22. 33 https://www.enchantedlearning.com/inventors/brit.shtml, retrieved October, 2018; Petition, p.
10.

I-10
together with excellent binding and organizational properties associated with superior elasticity, stretch strength, grip, and tear resistance.34 Natural rubber raw materials used for rubber band production are sourced principally in solid compressed bales produced from the liquid polyisoprene latex derivatives of rubber trees that grow in tropical areas near the equator, particularly in Southeast Asia (Thailand, Indonesia, Vietnam and Malaysia), while synthetic rubbers, e.g., synthetic polyisoprene rubber, are petroleum derivatives.35 According to petitioner, not as much competition is seen in synthetic rubber bands because of their higher cost, but they are interchangeable with natural rubber bands.36 37 However, non-latex synthetic bands, principally produced from synthetic polyisoprene and ethylene-propylene diene monomer (“EPDM”), have hypoallergenic properties that natural rubber does not have.38 Additionally, EPDM provides superior UV resistance, heat, cold (freezer), ozone, weather, and aging resistance. Synthetic rubber bands also display more vivid colors and printing.39
Petitioner’s rubber bands in 2017 were sold in seven basic industries including Stationery, *** percent (home, office and school); Industrial Packaging, *** percent (manufacturing, food processing, printing and publishing); Agricultural, *** percent (produce and floral); Retail, *** percent; Government and Post Office, *** percent; Advertising Specialty, *** percent; and Newspapers, *** percent. Alliance also manufactures and sells many other types of bands in the above categories including military, imprinted, and shellfish bands. While Stationery band sales’ shares have trended downward from *** percent in 2017 to *** percent in 2018 based on October 2017-18 YTD comparisons, Industrial shares have experienced similar upward trends.40 Rubber bands are typically sold in the United States to large wholesalers and retailers in plastic packaging and bulk forms.41
A variety of assorted general purpose and high quality rubber bands is shown in the following diagrams (figure I-1).
34 http://www.keenerrubber.com/Glossary.htm , retrieved February 23, 2018. 35 Staff field trip report to Alliance, Hot Springs, AR, October 4, 2018; Petitions, pp. 12-13. 36 Hearing transcript, p. 41, and Conference transcript, p. 42 (Risner). 37 “Material Safety Data Sheets, Keener Rubber Company,”
http://www.keenerrubber.com/natural_rubber.htm; http://www.keenerrubber.com/synthetic_rubber.htm, retrieved February 26, 2018.
38 Hearing transcript, p. 54 (Risner and Swayze). 39 Alliance Rubber Company, http://www.rubberband.com, retrieved February 27, 2018. 40 Hearing transcript, pp. 52-53 (Swayze and Risner); Staff field trip report to Alliance, Hot Springs,
AR, October 4, 2018. Petitions, pp. 7-25; petitioner correspondence, November 21, 2018. 41 Staff field trip to Alliance, Hot Springs, AR, October 4, 2018; Petitions, p.22.

I-11
Figure I-1 Rubber bands: Assorted colors and sizes
Source: Wikipedia, https://en.wikipedia.org/wiki/Rubber_band, retrieved October 30, 2018; York Rubber Website, https://yorkrubber.net, retrieved October 30, 2018.
Rubber band sizes are generally standardized by producers into a specified numbering
system series, detailing lengths and widths beginning with smaller numbered widths. Length is always specified as the “lay flat” length, measured with the cylindrical band flattened on its side as shown in the following diagram (figure I-2).
Figure I-2 Rubber bands: Standardized dimensions
. Source: Wikipedia, https://en.wikipedia.org/wiki/Rubber_band, retrieved October 30, 2018.
The rubber band size chart presented in table I-5 details the petitioner’s three standard
natural rubber band sizes and grades used for a variety of stationery and other applications. Principal band widths and accompanying lay flat lengths are sequentially numbered based on band width sizes principally of 1/16, 1/8, 1/4 and 1/2 inch widths, with lengths ranging from 7/8 inches to 3 1/2 inches or more. Bands of similar widths numbered above 100 are longer and may range up to 10 inches in length or more. According to the petitioner’s material safety data sheet (“MSDS”) for standard bands of natural rubber, the rubber content may range between 45 to 85 percent, with fillers and other additives ranging between 15 to 55 percent.42 The Petitioner’s Pale Crepe Gold® band is reportedly a premium product with the highest rubber content (***)43 and price, maximum elongation when stretched (775 percent), lowest density
42 Alliance MSDS Datasheet, http://sds.staples.com/msds/808634.pdf, retrieved February 1, 2018. 43 Staff field trip report to Alliance, Hot Springs, AR, October 4, 2018, responses to Commission staff
questions; Petitioner’s postconference brief, pp. 1-2.
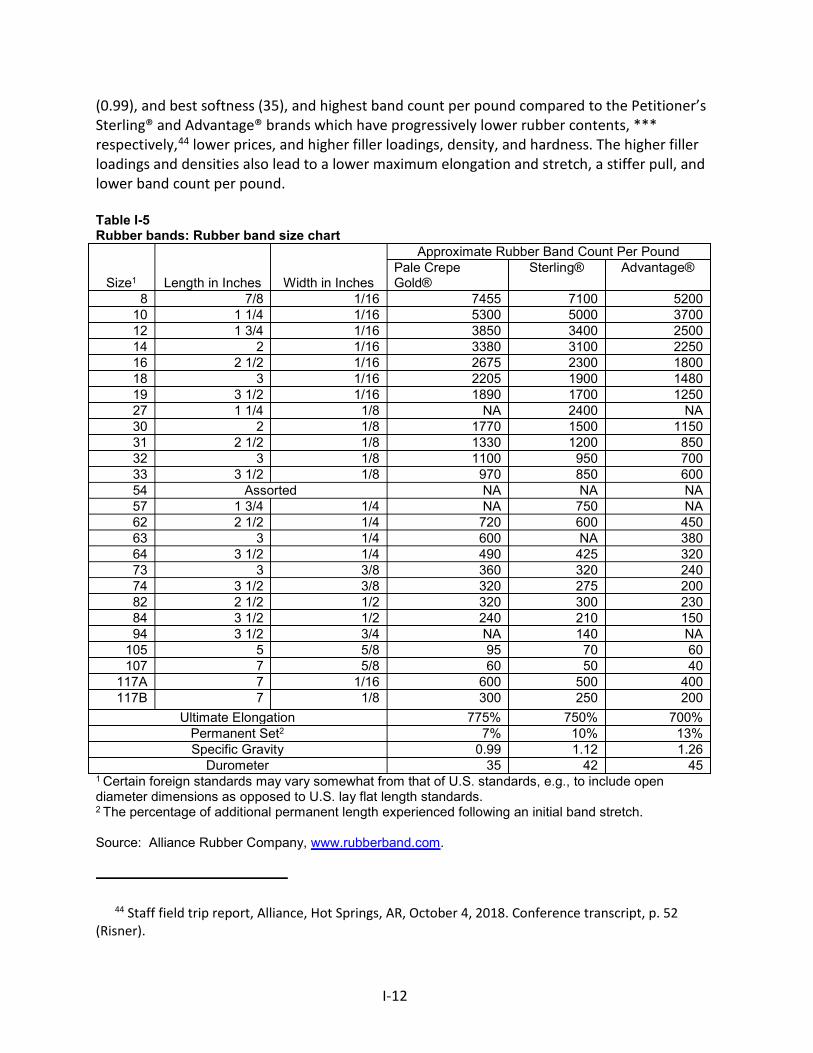
I-12
(0.99), and best softness (35), and highest band count per pound compared to the Petitioner’s Sterling® and Advantage® brands which have progressively lower rubber contents, *** respectively,44 lower prices, and higher filler loadings, density, and hardness. The higher filler loadings and densities also lead to a lower maximum elongation and stretch, a stiffer pull, and lower band count per pound. Table I-5 Rubber bands: Rubber band size chart
Size1 Length in Inches Width in Inches
Approximate Rubber Band Count Per Pound Pale Crepe Gold®
Sterling® Advantage®
8 7/8 1/16 7455 7100 5200 10 1 1/4 1/16 5300 5000 3700 12 1 3/4 1/16 3850 3400 2500 14 2 1/16 3380 3100 2250 16 2 1/2 1/16 2675 2300 1800 18 3 1/16 2205 1900 1480 19 3 1/2 1/16 1890 1700 1250 27 1 1/4 1/8 NA 2400 NA 30 2 1/8 1770 1500 1150 31 2 1/2 1/8 1330 1200 850 32 3 1/8 1100 950 700 33 3 1/2 1/8 970 850 600 54 Assorted NA NA NA 57 1 3/4 1/4 NA 750 NA 62 2 1/2 1/4 720 600 450 63 3 1/4 600 NA 380 64 3 1/2 1/4 490 425 320 73 3 3/8 360 320 240 74 3 1/2 3/8 320 275 200 82 2 1/2 1/2 320 300 230 84 3 1/2 1/2 240 210 150 94 3 1/2 3/4 NA 140 NA
105 5 5/8 95 70 60 107 7 5/8 60 50 40
117A 7 1/16 600 500 400 117B 7 1/8 300 250 200
Ultimate Elongation 775% 750% 700% Permanent Set2 7% 10% 13% Specific Gravity 0.99 1.12 1.26
Durometer 35 42 45 1 Certain foreign standards may vary somewhat from that of U.S. standards, e.g., to include open diameter dimensions as opposed to U.S. lay flat length standards. 2 The percentage of additional permanent length experienced following an initial band stretch. Source: Alliance Rubber Company, www.rubberband.com.
44 Staff field trip report, Alliance, Hot Springs, AR, October 4, 2018. Conference transcript, p. 52 (Risner).

I-13
Manufacturing processes
Rubber band production begins with raw materials procurement, including various solid forms of purified natural polyisoprene rubber for the intended application, such as the following: “crepe rubber” a typically more expensive lighter-colored grade of natural rubber; technically specified rubber (“TSR”), usually a medium to light colored rubber; and ribbed smoked sheet (“RSS”), a darker smoked rubber.45 Synthetic rubbers of polyisoprene and ethylene-propylene diene monomer (“EPDM”) are used in the production of synthetic rubber bands. An array of additives must also be procured to process the rubber, including pigments and dyes, mineral fillers, processing oils, peptides for rubber breakdown and associated additives, sulfur and other curing agents for vulcanization, antioxidants and various lubricants used in rubber processing and extrusion.46 47
Bales of solid natural rubber produced in southeastern Asian countries destined for ocean shipment to the United States are typically packaged in several crates or pallets of a net weight of about 19 metric tons (c.a., 42,000 pounds of rubber per 20 foot shipping container).48 Containers are offloaded at the port of entry and the crates or palletized rubber transferred to *** for shipment to the petitioner’s factory warehouse.49
The initial basic steps in manufacturing involve mixing a recipe of rubber and various additives in a Banbury mixer containing large sigma-shaped blades and a hydraulic ram designed to break down the rubber into a doughy consistency and blend it with the various additives. The homogenous doughy mixture is next dropped onto a chilled rotating mill of two large rotating drums designed to sheet out the mixture and cut it into narrow strips about ¼ inches thick by 4 inches wide in preparation for extrusion.50 Much of the preparation of the various additive recipes or stock is ***.51
***. Here, the narrow rubber stock is continuously fed into the extruder through the feed hopper to its interior barrel in which a rotating cylindrical screw equipped with a series of raised helical rims subjects the rubber stock material to high shear and forward movement resulting in heat and pressure build up, stock softening, and blending. At this point heat is somewhat controlled via the chilled screw to prevent curing, but the pressure of the heated
45 Alliance sources its natural rubber from ***, ideally suited for rubber band production. Staff field trip report to Alliance, Hot Springs, AR, October 4, 2018.
46 Staff field trip report to Alliance, Hot Springs, AR, October 4, 2018; Petitions, pp. 12-14. 47 Nineteen chemical additives and rubber are required to produce Alliance’s large portfolio of rubber
band products. Hearing transcript, p. 85 (Swayze). 48 ***, retrieved October 2018. 49 Rubber is reportedly by far the largest competitive raw material input cost item. Hearing transcript
pp. 98-100 (Kearns, Swayze, Risner, and Goldberg). “Domestic Industry Presentation,” Petitioner Counsel, Stinson Leonard Street LLP, Commission Hearing, November 13, 2018.
50 Staff field trip report to Alliance, Hot Springs, AR, October 4, 2018; Petitioner’s postconference brief, pp. 7-8, and Attachment 1, p. 2.
51 Staff field trip report to Alliance, Hot Springs, AR, October 4, 2018; Petitioner’s postconference brief, Attachment I, p. 1.
I-14
worked stock continues to build until it is sufficiently high enough to extrude the blended rubber stock material through a die configured to produce a hollow cylindrical rubber tube of the desired diameter and thickness of the rubber band dimensions to be produced.52
The subsequent tube curing and finishing processes of petitioner and certain subject foreign producers are different.53 54 The petitioner’s tube cure method is based on a *** whereby the extruded hollow tube is *** as it is fed to a ***. ***.55 This results in a crosslinking of sulfur and other curing agents with the natural polyisoprene rubber or synthetic rubbers resulting in a thermoset rubber compound possessing all of the superior properties of a finished rubber band. After exiting the ***.56 The lubricious cured tube is next fed to a high speed rotary cutting machine where it is cut into rubber bands of specified width, and then fed to ***.57 The finished product is then completed with packaging, labeling, and printing, and is palletized and warehoused for shipment to customers. Each container is manufactured from purchased plastic film or flats of cardboard.58 Alliance has recently added a new million dollar custom silicone elastomer extrusion line to its product portfolio that reportedly offers more environmental temperature ranges; UV, ozone, chemical and oil resistance; fire-retardant features; and the ability to meet food contract packaging specifications.59
The rubber tube curing processes employed by certain subject foreign producers consist of a number of manual and other processes.60 61 As the tube exits the extruder, it is injected internally with talc as a lubricant. The extruded tubes are next manually pulled by hand onto a series of long aluminum tubes or poles, known as mandrels, of the given diameter of the tubes and placed on a series of racks in a horizontally positioned high pressure-temperature steam autoclave for curing. The autoclave is closed and curing is effected for a given time period. Following curing, the vulcanized rubber tubes are discharged from the autoclave, cooled, and manually removed (or pulled) from the mandrels. This is followed by manually washing off the talc from the tubes in large water pools. The wet tubes are next flattened and fed through a
52 Staff field trip report to Alliance, Hot Springs, AR, October 4, 2018. 53 Petitions, p. 12. 54 Alliance believes its production process *** to that of its subject competitors. Staff field trip report
to Alliance, Hot Springs, AR, October 4, 2018. Hearing transcript, p. 98 (Swayze). 55 Staff field trip report to Alliance, Hot Springs, AR, October 4, 2018; Petitioner’s postconference
brief, Attachment I, p. 3. 56 Staff field trip report, Alliance, Hot Springs, AR, October 4, 2018; Petitioner’s postconference brief,
Attachment I, p. 4. 57 Staff field trip report, Alliance, Hot Springs, AR, October 4, 2018; Petitioner’s postconference brief,
Attachment I, pp. 4-5. 58 Staff field trip report, Alliance, Hot Springs, AR, October 4, 2018; Petitions, pp. 13-14. 59 “Alliance adds Custom Silicone Extrusion to its Production Capabilities,” July 24, 2018,
https://www.rubberband.com/news-events. Hearing transcript, p. 83 (Swayze). 60 Respondent Winne’s postconference brief and Respondent Schermerhorn’s postconference brief,
Exhibits 4 and I (“Production Process Flowchart”). 61 Rubber Bands from China, Sri Lanka, and Thailand, Investigation Nos. 701-TA-598-600 and 731-TA-
1408-1410 (Preliminary), USITC Publication 4770, March 2018, p. I-13.

I-15
rotating cutting machine to the desired width of the finished rubber bands. The finished rubber bands are weighed and packaged for shipment.62 63 A one-pound, heat-sealed plastic bag of size 31 (2 1/2 x 1/8 inch) natural rubber bands of Thailand origin was displayed during the staff conference.64 Alliance displayed a large assortment of its subject scope bands at the hearing.65
DOMESTIC LIKE PRODUCT ISSUES
No issues with respect to domestic like product have been raised in these investigations. In the preliminary phase, petitioner urged the Commission to find a single domestic like product that is coextensive with the scope of these investigations.66 Respondents did not contest the domestic like product definition for purposes of the Commission’s preliminary determinations.
The Commission defined domestic like product to include all rubber bands coextensive with the scope in its preliminary determinations.67
62 Petitions, pp. 12-13 and 23-24. 63 “How its made, rubber bands.” https://www.wimp.com/how-its-made-rubber-bands/, retrieved
February 1, 2018. 64 Conference transcript, p. 97 (Jordan). 65 Hearing transcript, p. 32 (Johanson), p. 54 (Swayze). 66 Petitions, Vol. I at 20-24; Conf. Tr. at 19 (Risner). 67 Rubber Bands from China, Sri Lanka, and Thailand, USITC Publication 4770, March 2018, p. 9.


II-1
PART II: CONDITIONS OF COMPETITION IN THE U.S. MARKET
U.S. MARKET CHARACTERISTICS
Rubber bands are used to bundle objects together and are typically sold to large wholesalers and retailers in a wide range of industries including retail, stationery, newspaper, agricultural, paper and packaging, government, and industrial.1 Most rubber bands are produced from natural rubber (latex), but synthetic (non-latex) rubber bands are used for medical applications and school applications in which latex allergies are a concern and are preferred for imprinting.2
Apparent U.S. consumption of rubber bands decreased in each year during 2015-2017. Overall, apparent U.S. consumption in 2017 was *** percent lower than in 2015. Apparent U.S. consumption was *** percent higher in the first half of 2018 than in the first half of 2017.
U.S. PURCHASERS
The Commission received 22 questionnaire responses from firms that purchased rubber bands since January 2015.3 Twelve responding purchasers are retailers, 9 are distributors, and one is an end user. The largest responding purchasers of rubber bands, in descending order of purchases and imports during 2017 were ***.
CHANNELS OF DISTRIBUTION
The responding U.S. producers’ commercial shipments went to *** (table II-1). Subject Thai imports went to all three channels: distributors, retailers, and end users. The share of subject Thai private label retail shipments declined from 2015 to 2017, but was higher in the first half of 2018 than in the first half of 2017. Imported Chinese rubber bands went almost exclusively to retailers, including retailers that imported directly from China. Four retailers, (***) accounted for *** of reported imports from China in 2017 (see table IV-1). Imports from all other countries went exclusively to distributors.
GEOGRAPHIC DISTRIBUTION
The responding U.S. producer reported selling rubber bands to ***. Imports from China and Thailand were sold in all U.S. regions (table II-2). For the responding U.S. producer, ***
1 Petitions, pp. 4, 22; Hearing transcript, p. 9 (Swayze). 2 Conference transcript, p. 36 (Risner). 3 Of the 22 responding purchasers, 15 purchased domestic rubber bands, 11 purchased subject
imports of rubber bands from China, 4 purchased subject imports from Thailand, 7 purchased imports from LHH in Thailand, and 2 purchased imports of rubber bands from other sources. These numbers include firms that imported rubber bands directly and/or purchased rubber bands from an importer.

II-2
percent of sales were within 100 miles of its production facility, *** percent were between 101 and 1,000 miles, and *** percent were over 1,000 miles. Importers sold 39 percent within 100 miles of their U.S. point of shipment, 56 percent between 101 and 1,000 miles, and 4 percent over 1,000 miles.
Table II-1 Rubber bands: U.S. producers’ and importers’ total U.S. shipments, by sources and channels of distribution, 2015-17, January-June 2017, and January-June 2018
* * * * * * * Table II-2 Rubber bands: Geographic market areas in the United States served by U.S. producers and importers
Region U.S. producers China Thailand Northeast *** 11 15 Midwest *** 11 16 Southeast *** 12 15 Central Southwest *** 12 15 Mountains *** 11 15 Pacific Coast *** 13 15 Other1 *** 9 9 All regions (except Other) *** 11 15 Reporting firms 1 14 16 1 All other U.S. markets, including AK, HI, PR, and VI. Source: Compiled from data submitted in response to Commission questionnaires.
SUPPLY AND DEMAND CONSIDERATIONS
U.S. supply Table II-3 provides a summary of the supply factors regarding rubber bands from U.S.
producers and from subject countries.

II-3
Table II-3 Rubber bands: Supply factors that affect the ability to increase shipments to the U.S. market
Country
Capacity (million pounds)
Capacity utilization (percent)
Ratio of inventories to
total shipments (percent)
Shipments by market, 2017 (percent)
Able to shift to
alternate products
2015 2017 2015 2017 2015 2017
Home market
shipments
Exports to non-U.S. markets
No. of firms reporting
“yes” United States *** *** *** *** *** *** *** *** *** of 1 China1 9.1 9.1 --- --- --- --- --- --- --- Thailand (subject) *** *** *** *** *** *** *** *** 1 of 3 1 China capacity is based on petitioner’s estimate (see Part VII). Note.--The responding U.S. producer accounted for the vast majority of U.S. production of rubber bands in 2017. The four responding Thai firms’ exports to the United States accounted for *** percent all U.S. imports of rubber bands from Thailand and *** percent of subject imports from Thailand in 2017. No responses were received from producer/exporter firms in China. For additional data on the number of responding firms and their share of U.S. production and of U.S. imports from each subject country, please refer to Part I, “Summary Data and Data Sources.” Source: Compiled from data submitted in response to Commission questionnaires. Domestic production
Based on available information, U.S. producers of rubber bands have the ability to
respond to changes in demand with moderate-to-large changes in the quantity of shipments of U.S.-produced rubber bands to the U.S. market. The main contributing factor to this degree of responsiveness of supply is the availability of unused capacity. Factors mitigating responsiveness of supply include a limited ability to shift shipments from alternate markets and inventories, and a limited ability to shift production to or from alternate products.
U.S. producer Alliance’s capacity to produce rubber bands ***. Capacity utilization increased slightly from 2015 to 2017 but was slightly lower in interim 2018 than interim 2017. Alliance exports rubber bands to ***. Alliance stated in its preliminary phase questionnaire response *** switch production from rubber bands to other products.
Subject imports from China Based on available information,4 producers of rubber bands from China have the ability
to respond to changes in demand with moderate changes in the quantity of shipments of rubber bands to the U.S. market.
4 Data on the rubber band industry in China are limited. The petitioner provided estimated capacity based on online marketing from six producers in China. For more information, see Part VII.

II-4
Subject imports from Thailand Based on available information, subject producers of rubber bands from Thailand have
the ability to respond to changes in demand with large changes in the quantity of shipments of rubber bands to the U.S. market. The main contributing factors to this degree of responsiveness of supply are the availability of unused capacity and an ability to shift shipments from alternate markets. Factors mitigating responsiveness of supply include an inability to shift production to or from alternate products.
Thai capacity was unchanged from 2015 to 2017. The vast majority of Thai production of rubber bands was shipped to non-U.S. export markets.
Imports from nonsubject countries Imports from countries other than China and Thailand accounted for *** percent of
total U.S. imports in 2017. Sri Lanka was the largest source of imports from countries other than China and Thailand during January 2015-June 2018. Imports from LHH Thailand accounted for *** percent of total imports in 2017.
Supply constraints
All but one responding firm reported no supply constraints for rubber bands. ***, all but one importer, and all purchasers reported no supply constraints. Importer (***) reported a “normal back order situation” because of products that arrived late. Similarly, no purchaser reported a change in the availability of U.S.-produced rubber bands, subject imports, or nonsubject imports since January 1, 2015.
At the staff conference, Respondent Winne stated that bad weather in Thailand caused a raw rubber shortage. It stated that raw rubber producers prioritize more profitable industries, such as the tire industry over rubber band producers, causing a shortage of rubber for rubber band production during periods of high auto demand.5 Winne stated that in February 2017, Alliance refused to sell it rubber bands because, ***.6
New suppliers No responding purchaser indicated that new suppliers have entered the U.S. market
since January 1, 2015.
5 Conference transcript, p. 140 (Aversano). 6 Respondent Winne’s postconference brief, p. 3 and Exh. 2.

II-5
U.S. demand Based on available information, the overall demand for rubber bands is likely to
experience small changes in response to changes in price. The main contributing factors to this responsiveness are the limited range of substitute products and the small cost share of rubber bands in end uses. End uses and cost share
U.S. demand for rubber bands depends on the demand for rubber bands in a wide range
of end uses. End uses include the bundling of office, agricultural, and industrial products, and retail sale. Most firms did not indicate reasons for demand trends, although a few firms noted declining demand for rubber bands used to bundle newspapers, one importer stated that the use of stretch film and arrow rubber band tags has reduced rubber band usage, and one purchaser reported an increase because of general economic growth. Respondent Schermerhorn stated that demand from the newspaper industry is declining, and that weather affects agricultural sector demand for rubber bands.7 According to Alliance, rubber band demand for newspapers has continued to decline during the period of investigation, and rubber band demand for agricultural uses have experienced a short-term decline.8 Rubber bands account for a small share of the total cost of a bundle of goods.9
Business cycles Most firms (***, 18 of 25 importers, and 17 of 22 purchasers) indicated that the market
was not subject to business cycles. Seven importers and five purchasers reported that the rubber band market was subject to business cycles, including seasonality and weather effects on the agricultural and fisheries industries. Purchaser *** reported back to school and back to business demand. Purchaser *** stated that the lobster catch affects demand.
Importer *** reported that the decline of the newspaper industry has led to a decline in demand from that sector and that drought in California has caused drastic fluctuations in rubber band use by the agricultural industry. Importer *** reported that a decline in the lobster catch in 2017 reduced demand for rubber bands.
Regarding changes in conditions of competition, importer *** reported increased competition and imports, and stated that online services such as Amazon are driving down prices and importer *** reported increased direct sales to end users.
7 Conference transcript, p. 116 (Jordan). 8 Hearing transcript, p. 57 (Goldberg). 9 Rubber bands used in egg dye and tie-dye kits reportedly accounted for 2 to 5 percent of the total
cost.
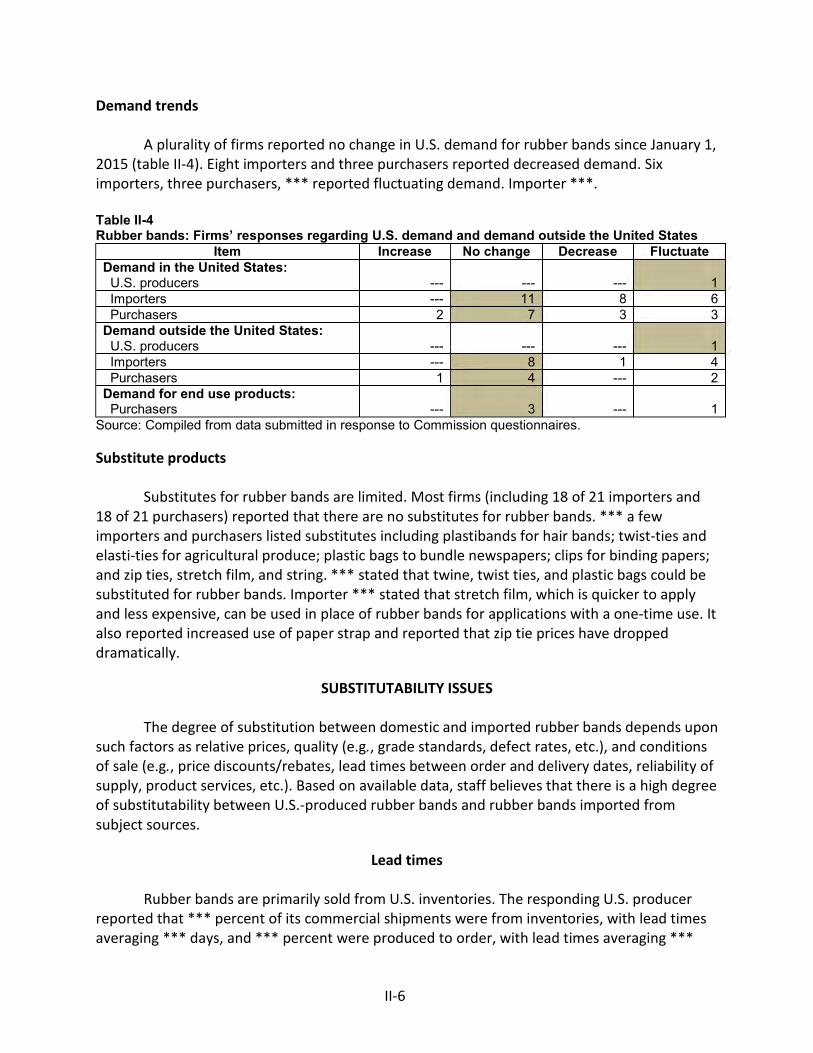
II-6
Demand trends A plurality of firms reported no change in U.S. demand for rubber bands since January 1,
2015 (table II-4). Eight importers and three purchasers reported decreased demand. Six importers, three purchasers, *** reported fluctuating demand. Importer ***.
Table II-4 Rubber bands: Firms’ responses regarding U.S. demand and demand outside the United States
Item Increase No change Decrease Fluctuate Demand in the United States: U.S. producers --- --- --- 1 Importers --- 11 8 6 Purchasers 2 7 3 3 Demand outside the United States: U.S. producers --- --- --- 1 Importers --- 8 1 4 Purchasers 1 4 --- 2 Demand for end use products: Purchasers --- 3 --- 1
Source: Compiled from data submitted in response to Commission questionnaires. Substitute products
Substitutes for rubber bands are limited. Most firms (including 18 of 21 importers and
18 of 21 purchasers) reported that there are no substitutes for rubber bands. *** a few importers and purchasers listed substitutes including plastibands for hair bands; twist-ties and elasti-ties for agricultural produce; plastic bags to bundle newspapers; clips for binding papers; and zip ties, stretch film, and string. *** stated that twine, twist ties, and plastic bags could be substituted for rubber bands. Importer *** stated that stretch film, which is quicker to apply and less expensive, can be used in place of rubber bands for applications with a one-time use. It also reported increased use of paper strap and reported that zip tie prices have dropped dramatically.
SUBSTITUTABILITY ISSUES The degree of substitution between domestic and imported rubber bands depends upon
such factors as relative prices, quality (e.g., grade standards, defect rates, etc.), and conditions of sale (e.g., price discounts/rebates, lead times between order and delivery dates, reliability of supply, product services, etc.). Based on available data, staff believes that there is a high degree of substitutability between U.S.-produced rubber bands and rubber bands imported from subject sources.
Lead times Rubber bands are primarily sold from U.S. inventories. The responding U.S. producer
reported that *** percent of its commercial shipments were from inventories, with lead times averaging *** days, and *** percent were produced to order, with lead times averaging ***
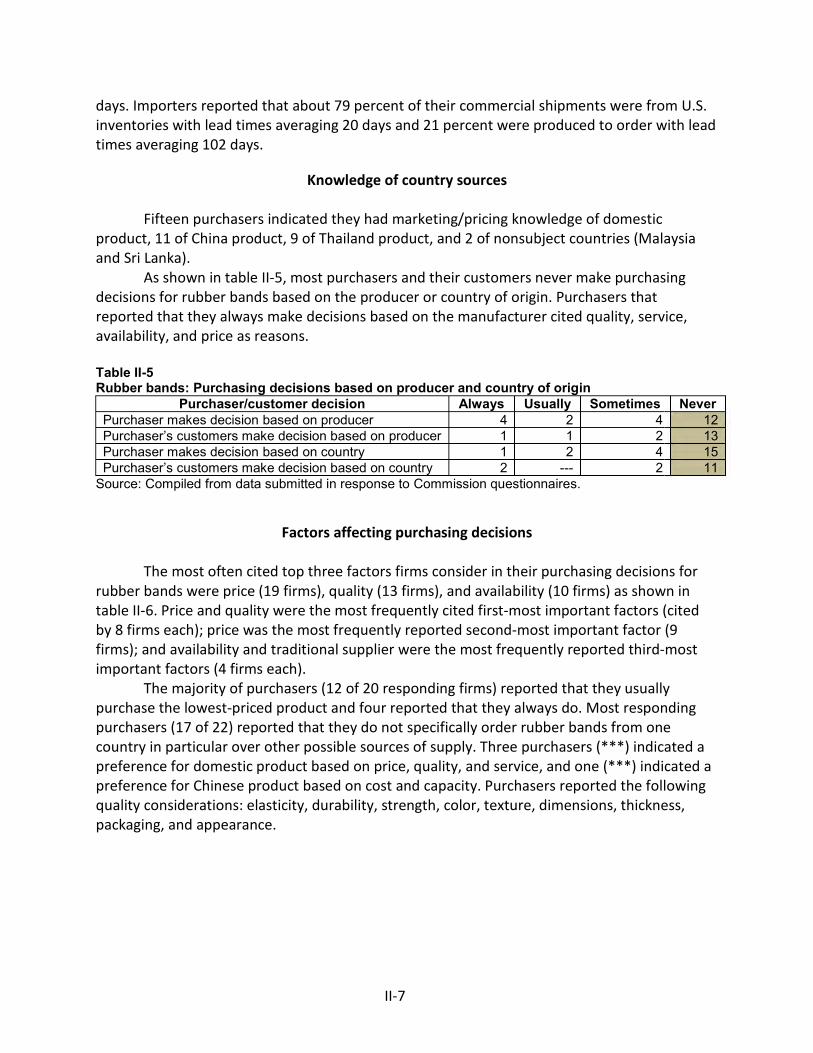
II-7
days. Importers reported that about 79 percent of their commercial shipments were from U.S. inventories with lead times averaging 20 days and 21 percent were produced to order with lead times averaging 102 days.
Knowledge of country sources Fifteen purchasers indicated they had marketing/pricing knowledge of domestic
product, 11 of China product, 9 of Thailand product, and 2 of nonsubject countries (Malaysia and Sri Lanka).
As shown in table II-5, most purchasers and their customers never make purchasing decisions for rubber bands based on the producer or country of origin. Purchasers that reported that they always make decisions based on the manufacturer cited quality, service, availability, and price as reasons.
Table II-5 Rubber bands: Purchasing decisions based on producer and country of origin
Purchaser/customer decision Always Usually Sometimes Never Purchaser makes decision based on producer 4 2 4 12 Purchaser’s customers make decision based on producer 1 1 2 13 Purchaser makes decision based on country 1 2 4 15 Purchaser’s customers make decision based on country 2 --- 2 11
Source: Compiled from data submitted in response to Commission questionnaires.
Factors affecting purchasing decisions The most often cited top three factors firms consider in their purchasing decisions for
rubber bands were price (19 firms), quality (13 firms), and availability (10 firms) as shown in table II-6. Price and quality were the most frequently cited first-most important factors (cited by 8 firms each); price was the most frequently reported second-most important factor (9 firms); and availability and traditional supplier were the most frequently reported third-most important factors (4 firms each).
The majority of purchasers (12 of 20 responding firms) reported that they usually purchase the lowest-priced product and four reported that they always do. Most responding purchasers (17 of 22) reported that they do not specifically order rubber bands from one country in particular over other possible sources of supply. Three purchasers (***) indicated a preference for domestic product based on price, quality, and service, and one (***) indicated a preference for Chinese product based on cost and capacity. Purchasers reported the following quality considerations: elasticity, durability, strength, color, texture, dimensions, thickness, packaging, and appearance.
I I I I I

II-8
Table II-6 Rubber bands: Ranking of factors used in purchasing decisions as reported by U.S. purchasers, by factor
Factor First Second Third Total Price 8 9 2 19 Quality 8 5 0 13 Availability 2 4 4 10 Traditional supplier/supplier relationship 2 0 4 6 Capacity 1 0 2 3 Lead time/delivery/on-time performance 1 0 2 3 Other1 1 2 5 8
1 Other factors include supplier must be able to provide other products for first factor; packaging and style/design for second factor; and exclusivity, packaging, service, and range of product line for third factor. Source: Compiled from data submitted in response to Commission questionnaires.
The petitioner stated that while many buyers only purchase based on price, factors such as quality, availability, transportation, product range, and technical support are also important to customers. It stated that colored rubber bands, rubber bands with imprinting, and odorless rubber bands are some additional characteristics that could lead to higher pricing.10 According to respondents, purchasers’ quality considerations include rubber content, count per pound, freshness, consistency of dimension, elasticity, durability and strength, packaging, and performance.11
Rubber content and grades Petitioner and respondents highlighted the importance of rubber content in
determining the quality and price of rubber bands. Rubber content can range from 50 percent to 95 percent.12 Higher rubber content increases elasticity, longevity, memory, and the softness of the stretch, and decreases weight.13 Additionally, higher rubber content increases the count per pound as they weigh less than rubber bands with lower rubber content, and may have a cost advantage when purchased on the basis of weight.14
There is no industry standard that defines grades based on rubber content.15 U.S. producer Alliance produces three different grades of rubber bands based on rubber content. According to Alliance, imported rubber bands from China and Thailand are comparable to grades of U.S.-produced rubber bands.16 17 Respondent Schermerhorn reported offering two
10 Conference transcript, p. 63 (Risner). 11 Conference transcript, p. 101 (Jordan) and Respondent Schermerhorn’s postconference brief, p. 3. 12 Conference transcript, pp. 51, 54 (Risner) and 112 (Jordan). 13 Conference transcript, pp. 31-32 (Risner) and 101 (Jordan). 14 For more information on the effects of rubber content on rubber band prices, see part V. 15 Conference transcript, pp. 32 (Risner) and 113 (Aversano). 16 Conference transcript, p. 50 (Risner).
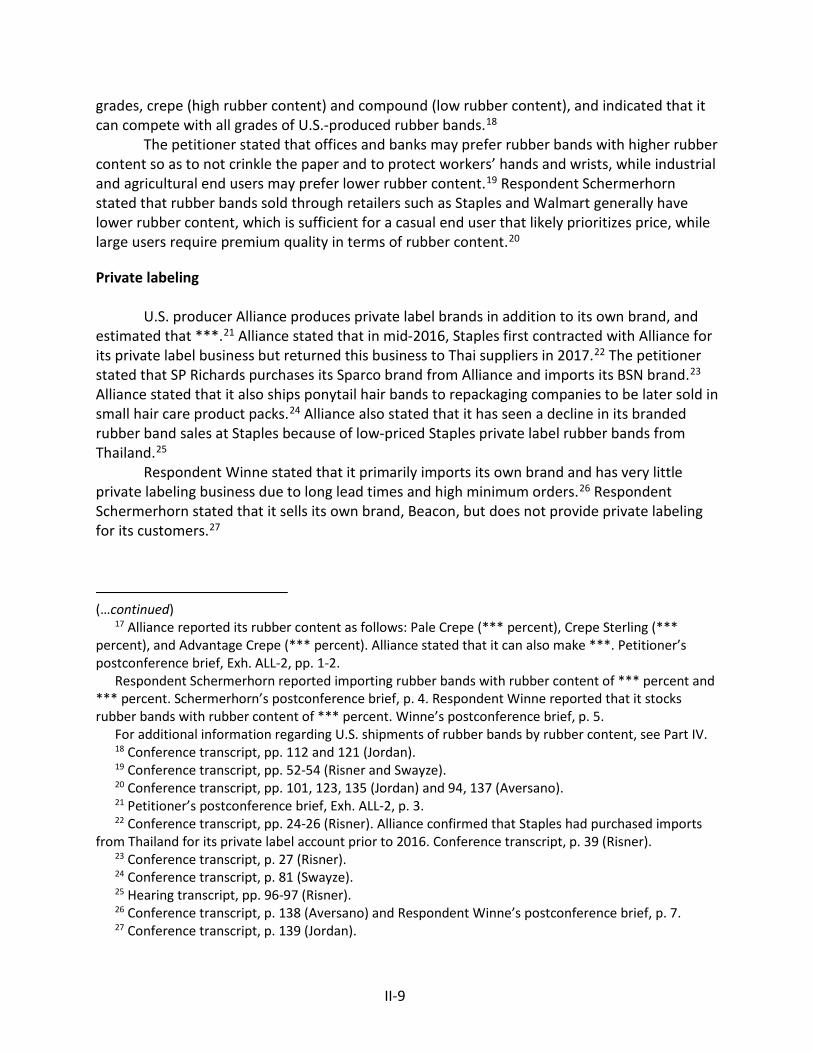
II-9
grades, crepe (high rubber content) and compound (low rubber content), and indicated that it can compete with all grades of U.S.-produced rubber bands.18
The petitioner stated that offices and banks may prefer rubber bands with higher rubber content so as to not crinkle the paper and to protect workers’ hands and wrists, while industrial and agricultural end users may prefer lower rubber content.19 Respondent Schermerhorn stated that rubber bands sold through retailers such as Staples and Walmart generally have lower rubber content, which is sufficient for a casual end user that likely prioritizes price, while large users require premium quality in terms of rubber content.20
Private labeling U.S. producer Alliance produces private label brands in addition to its own brand, and
estimated that ***.21 Alliance stated that in mid-2016, Staples first contracted with Alliance for its private label business but returned this business to Thai suppliers in 2017.22 The petitioner stated that SP Richards purchases its Sparco brand from Alliance and imports its BSN brand.23 Alliance stated that it also ships ponytail hair bands to repackaging companies to be later sold in small hair care product packs.24 Alliance also stated that it has seen a decline in its branded rubber band sales at Staples because of low-priced Staples private label rubber bands from Thailand.25
Respondent Winne stated that it primarily imports its own brand and has very little private labeling business due to long lead times and high minimum orders.26 Respondent Schermerhorn stated that it sells its own brand, Beacon, but does not provide private labeling for its customers.27
(…continued)
17 Alliance reported its rubber content as follows: Pale Crepe (*** percent), Crepe Sterling (*** percent), and Advantage Crepe (*** percent). Alliance stated that it can also make ***. Petitioner’s postconference brief, Exh. ALL-2, pp. 1-2.
Respondent Schermerhorn reported importing rubber bands with rubber content of *** percent and *** percent. Schermerhorn’s postconference brief, p. 4. Respondent Winne reported that it stocks rubber bands with rubber content of *** percent. Winne’s postconference brief, p. 5.
For additional information regarding U.S. shipments of rubber bands by rubber content, see Part IV. 18 Conference transcript, pp. 112 and 121 (Jordan). 19 Conference transcript, pp. 52-54 (Risner and Swayze). 20 Conference transcript, pp. 101, 123, 135 (Jordan) and 94, 137 (Aversano). 21 Petitioner’s postconference brief, Exh. ALL-2, p. 3. 22 Conference transcript, pp. 24-26 (Risner). Alliance confirmed that Staples had purchased imports
from Thailand for its private label account prior to 2016. Conference transcript, p. 39 (Risner). 23 Conference transcript, p. 27 (Risner). 24 Conference transcript, p. 81 (Swayze). 25 Hearing transcript, pp. 96-97 (Risner). 26 Conference transcript, p. 138 (Aversano) and Respondent Winne’s postconference brief, p. 7. 27 Conference transcript, p. 139 (Jordan).

II-10
Importance of specified purchase factors
Purchasers were asked to rate the importance of 19 factors in their purchasing decisions (table II-7). The factors rated as very important by more than half of responding purchasers were availability (22 firms); delivery terms, price, product consistency, and reliability of supply (19 each); delivery time and quality meets industry standards (18 each); strength (16); elasticity (14); and minimum quantity requirements (13).
Table II-7 Rubber bands: Importance of purchase factors, as reported by U.S. purchasers, by factor
Factor Very
important Somewhat important
Not important
Availability 22 --- --- Delivery terms 19 3 --- Price 19 3 --- Product consistency 19 3 --- Reliability of supply 19 3 --- Delivery time 18 4 --- Quality meets industry standards 18 3 1 Strength 16 4 2 Elasticity 14 4 3 Minimum quantity requirements 13 3 5 Quality exceeds industry standards 10 8 3 Discounts offered 9 5 7 U.S. transportation costs 8 5 8 Color 7 8 7 Packaging 7 10 5 Product range 7 10 4 Technical support/service 7 5 9 Natural rubber content 6 8 8 Extension of credit 4 8 9
Source: Compiled from data submitted in response to Commission questionnaires. Supplier certification
Less than half of responding purchasers (10 of 22) require their suppliers to become certified or qualified to sell rubber bands to their firm. Purchasers reported that the time to qualify a new supplier was 90 days or fewer. No responding purchasers reported that any suppliers had failed in their attempt to qualify rubber bands, or had lost their approved status since 2015.
Changes in purchasing patterns Purchasers’ reported changes in their purchasing patterns from different sources since
2015 are shown in table II-8. Most purchasers (18 of 22) reported that they had not changed suppliers since January 1, 2015. Four firms (***) reported changes. ***.
It stated that the reasons for adding these Chinese suppliers were cost, quality, delivery terms, and capacity. *** reported changes among its Chinese suppliers. ***. It stated that price
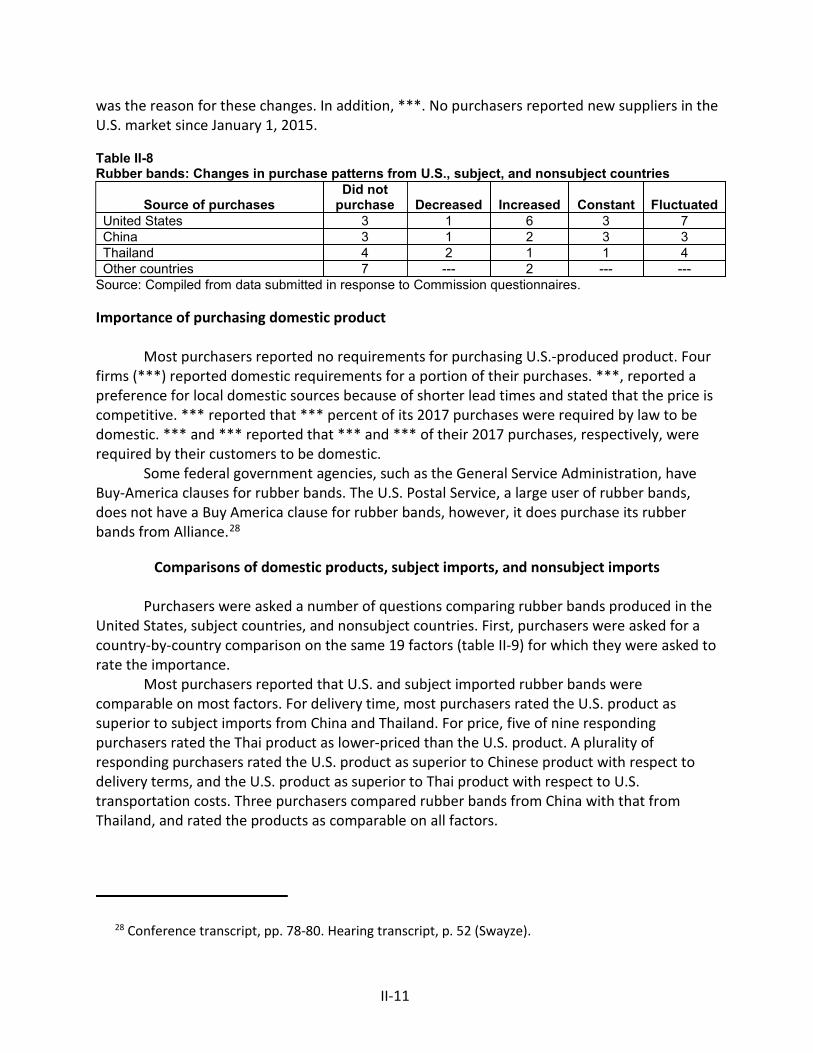
II-11
was the reason for these changes. In addition, ***. No purchasers reported new suppliers in the U.S. market since January 1, 2015.
Table II-8 Rubber bands: Changes in purchase patterns from U.S., subject, and nonsubject countries
Source of purchases Did not
purchase Decreased Increased Constant Fluctuated United States 3 1 6 3 7 China 3 1 2 3 3 Thailand 4 2 1 1 4 Other countries 7 --- 2 --- ---
Source: Compiled from data submitted in response to Commission questionnaires. Importance of purchasing domestic product
Most purchasers reported no requirements for purchasing U.S.-produced product. Four firms (***) reported domestic requirements for a portion of their purchases. ***, reported a preference for local domestic sources because of shorter lead times and stated that the price is competitive. *** reported that *** percent of its 2017 purchases were required by law to be domestic. *** and *** reported that *** and *** of their 2017 purchases, respectively, were required by their customers to be domestic.
Some federal government agencies, such as the General Service Administration, have Buy-America clauses for rubber bands. The U.S. Postal Service, a large user of rubber bands, does not have a Buy America clause for rubber bands, however, it does purchase its rubber bands from Alliance.28
Comparisons of domestic products, subject imports, and nonsubject imports Purchasers were asked a number of questions comparing rubber bands produced in the
United States, subject countries, and nonsubject countries. First, purchasers were asked for a country-by-country comparison on the same 19 factors (table II-9) for which they were asked to rate the importance.
Most purchasers reported that U.S. and subject imported rubber bands were comparable on most factors. For delivery time, most purchasers rated the U.S. product as superior to subject imports from China and Thailand. For price, five of nine responding purchasers rated the Thai product as lower-priced than the U.S. product. A plurality of responding purchasers rated the U.S. product as superior to Chinese product with respect to delivery terms, and the U.S. product as superior to Thai product with respect to U.S. transportation costs. Three purchasers compared rubber bands from China with that from Thailand, and rated the products as comparable on all factors.
28 Conference transcript, pp. 78-80. Hearing transcript, p. 52 (Swayze).
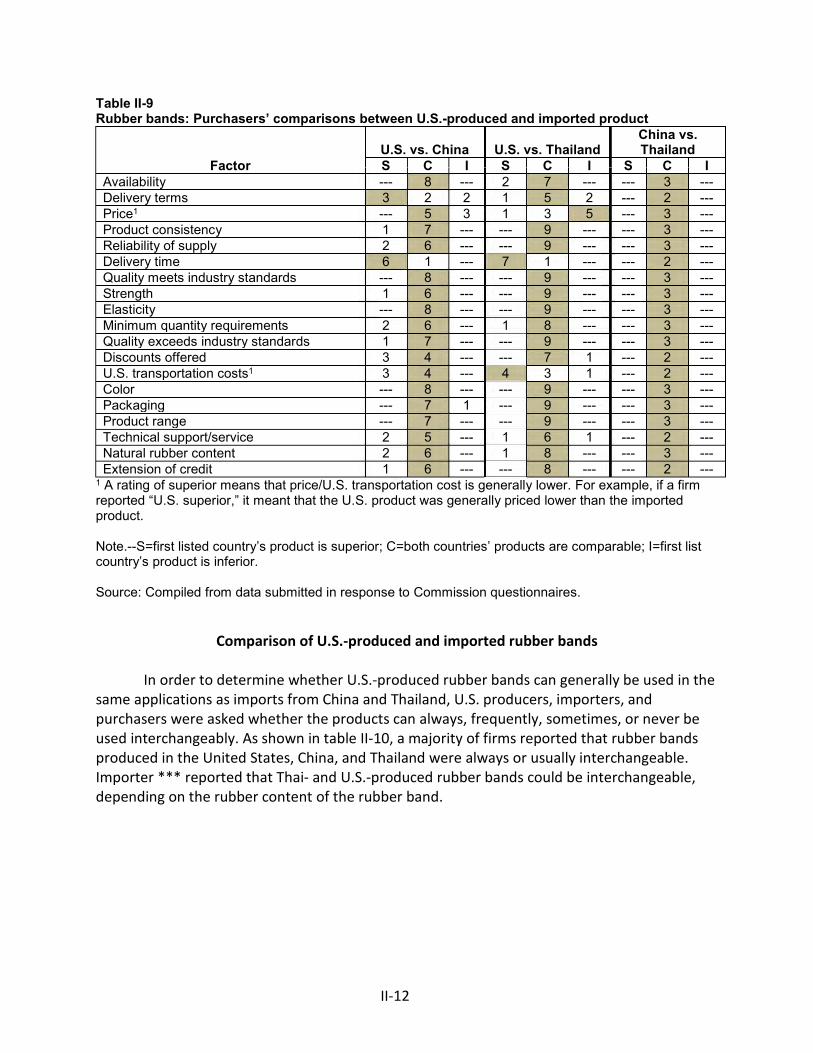
II-12
Table II-9 Rubber bands: Purchasers’ comparisons between U.S.-produced and imported product
Factor U.S. vs. China U.S. vs. Thailand
China vs. Thailand
S C I S C I S C I Availability --- 8 --- 2 7 --- --- 3 --- Delivery terms 3 2 2 1 5 2 --- 2 --- Price1 --- 5 3 1 3 5 --- 3 --- Product consistency 1 7 --- --- 9 --- --- 3 --- Reliability of supply 2 6 --- --- 9 --- --- 3 --- Delivery time 6 1 --- 7 1 --- --- 2 --- Quality meets industry standards --- 8 --- --- 9 --- --- 3 --- Strength 1 6 --- --- 9 --- --- 3 --- Elasticity --- 8 --- --- 9 --- --- 3 --- Minimum quantity requirements 2 6 --- 1 8 --- --- 3 --- Quality exceeds industry standards 1 7 --- --- 9 --- --- 3 --- Discounts offered 3 4 --- --- 7 1 --- 2 --- U.S. transportation costs1 3 4 --- 4 3 1 --- 2 --- Color --- 8 --- --- 9 --- --- 3 --- Packaging --- 7 1 --- 9 --- --- 3 --- Product range --- 7 --- --- 9 --- --- 3 --- Technical support/service 2 5 --- 1 6 1 --- 2 --- Natural rubber content 2 6 --- 1 8 --- --- 3 --- Extension of credit 1 6 --- --- 8 --- --- 2 ---
1 A rating of superior means that price/U.S. transportation cost is generally lower. For example, if a firm reported “U.S. superior,” it meant that the U.S. product was generally priced lower than the imported product. Note.--S=first listed country’s product is superior; C=both countries’ products are comparable; I=first list country’s product is inferior. Source: Compiled from data submitted in response to Commission questionnaires.
Comparison of U.S.-produced and imported rubber bands In order to determine whether U.S.-produced rubber bands can generally be used in the
same applications as imports from China and Thailand, U.S. producers, importers, and purchasers were asked whether the products can always, frequently, sometimes, or never be used interchangeably. As shown in table II-10, a majority of firms reported that rubber bands produced in the United States, China, and Thailand were always or usually interchangeable. Importer *** reported that Thai- and U.S.-produced rubber bands could be interchangeable, depending on the rubber content of the rubber band.

II-13
Table II-10 Rubber bands: Interchangeability between rubber bands produced in the United States and in other countries, by country pair
Country pair U.S. producers U.S. importers U.S. purchasers A F S N A F S N A F S N
U.S. vs. subject countries: U.S. vs. China *** *** *** *** 7 4 --- --- 7 2 1 --- U.S. vs. Thailand *** *** *** *** 6 6 1 1 6 3 1 --- Subject countries comparisons: China vs. Thailand *** *** *** *** 3 3 --- --- 1 1 --- --- Nonsubject countries comparisons: U.S. vs. nonsubject *** *** *** *** 1 2 --- --- 2 --- --- 1 China vs. nonsubject *** *** *** *** 1 1 --- --- 1 --- --- --- Thailand vs. nonsubject *** *** *** *** 1 1 --- --- 1 --- --- ---
Note.—A=Always, F=Frequently, S=Sometimes, N=Never. Source: Compiled from data submitted in response to Commission questionnaires.
As can be seen from table II-11, the majority of responding purchasers reported that rubber bands produced in the United States, China, and Thailand always met minimum quality specifications.
Table II-11 Rubber bands: Ability to meet minimum quality specifications, by source1
Source Always Usually Sometimes Rarely or never United States 12 2 --- --- China 5 3 1 --- Thailand 5 3 --- --- All other sources 2 1 --- ---
1 Purchasers were asked how often domestically produced or imported rubber bands meets minimum quality specifications for their own or their customers’ uses. Source: Compiled from data submitted in response to Commission questionnaires.
In addition, producers, importers, and purchasers were asked to assess how often differences other than price were significant in sales of rubber bands from the United States, subject, or nonsubject countries. As seen in table II-12, the U.S. producer reported that differences other than price between country pairs are *** significant. A majority of importers reported that such differences were sometimes or never significant, although a third of importers reported that such differences were always significant in comparing the United States and Thailand. A majority of responding purchasers reported that non-price differences between domestic product and subject imported product were always or frequently significant.
Three importers provided explanations with respect to Thailand. Importer *** reported that the “world’s best” rubber bands come from Thailand and that it has ***. Importer *** reported that quality is always a differentiating factor between product from Thailand compared to product from the United States or from China. Importer *** stated that quality, cooperation, and product availability are always significant. One importer provided an

II-14
explanation with respect to China; (***) reported that it imports Chinese rubber bands as part of a finished kit. Table II-12 Rubber bands: Significance of differences other than price between rubber bands produced in the United States and in other countries, by country pair
Country pair U.S. producers U.S. importers U.S. purchasers A F S N A F S N A F S N
U.S. vs. subject countries: U.S. vs. China --- --- *** --- 2 3 4 3 5 2 2 1 U.S. vs. Thailand --- --- *** --- 4 2 4 3 3 4 3 1 Subject countries comparisons: China vs. Thailand --- --- *** --- 1 --- 2 --- --- 2 --- --- Nonsubject countries comparisons: U.S. vs. nonsubject --- --- *** --- --- 1 1 --- 1 1 --- 1 China vs. nonsubject --- --- *** --- --- --- 1 --- --- 1 --- --- Thailand vs. nonsubject --- --- *** --- --- --- 1 --- --- 1 --- ---
Note.--A = Always, F = Frequently, S = Sometimes, N = Never. Source: Compiled from data submitted in response to Commission questionnaires.
Among purchasers, *** stated that flexibility in service is an advantage of its Thai supplier. Two purchasers noted advantages of domestic product: *** stated that U.S. producers offer shorter lead times, high quality, competitive pricing, and fewer communication challenges to resolve issues, and *** stated that the quality of U.S.-produced rubber bands is sometimes higher than rubber bands produced in other countries.
ELASTICITY ESTIMATES This section discusses elasticity estimates. Parties did not comment on these estimates
in either their prehearing or posthearing briefs.
U.S. supply elasticity The domestic supply elasticity29 for rubber bands measures the sensitivity of the
quantity supplied by U.S. producers to changes in the U.S. market price of rubber bands. The elasticity of domestic supply depends on several factors including the level of excess capacity, the ease with which producers can alter capacity, producers’ ability to shift to production of other products, the existence of inventories, and the availability of alternate markets for U.S.-produced rubber bands. Analysis of these factors above indicates that the U.S. industry has the ability to greatly increase or decrease shipments to the U.S. market; an estimate in the range of 4 to 8 is suggested.
29 A supply function is not defined in the case of a non-competitive market.

II-15
U.S. demand elasticity The U.S. demand elasticity for rubber bands measures the sensitivity of the overall
quantity demanded to a change in the U.S. market price of rubber bands. This estimate depends on factors discussed above such as the existence, availability, and commercial viability of substitute products, as well as the component share of the rubber bands in the production of any downstream products. Based on the available information, the aggregate demand for rubber bands is likely to be inelastic; a range of -0.5 to -0.75 is suggested.
Substitution elasticity The elasticity of substitution depends upon the extent of product differentiation
between the domestic and imported products.30 Product differentiation, in turn, depends upon such factors as quality (e.g., chemistry, appearance, etc.) and conditions of sale (e.g., availability, sales terms/ discounts/ promotions, etc.). Based on available information, the elasticity of substitution between U.S.-produced rubber bands and imported rubber bands is likely to be in the range of 4 to 6.
30 The substitution elasticity measures the responsiveness of the relative U.S. consumption levels of the subject imports and the domestic like products to changes in their relative prices. This reflects how easily purchasers switch from the U.S. product to the subject products (or vice versa) when prices change.


III-1
PART III: U.S. PRODUCER’S PRODUCTION, SHIPMENTS, AND EMPLOYMENT
The Commission analyzes a number of factors in making injury determinations (see 19 U.S.C. §§ 1677(7)(B) and 1677(7)(C)). Information on the subsidies and dumping margins was presented in Part I of this report and information on the volume and pricing of imports of the subject merchandise is presented in Part IV and Part V. Information on the other factors specified is presented in this section and/or Part VI and (except as noted) is based on the questionnaire response of one firm that accounted for at least 90 percent of U.S. production of rubber bands during 2017.1
U.S. PRODUCERS
The Commission issued a U.S. producer questionnaire to eight firms based on information contained in the petitions. One firm, petitioner Alliance, provided usable data on its production operations.2 Staff believes that this response represents at least 90 percent of U.S. production of rubber bands.3 Table III-1 presents the responding U.S. producer of rubber bands, its production locations, position on the petitions, and share of total in-scope rubber band production. Table III-1 Rubber bands: U.S. producer, its position on the petitions, location of production, and share of reported production, 2017
Firm Position on petitions Production locations Share of production
(percent)
Alliance Petitioner Hot Springs, AR Salinas, CA 100.0
Total 100.0 Source: Compiled from data submitted in response to Commission questionnaires.
1 Conference transcript, p. 31 (Risner). 2 A second firm, ***, submitted a letter to the Commission confirming it produces rubber bands
within the scope of these investigations ***. Another firm, ***, confirmed via email that it does not produce natural rubber bands, but it produces only a small amount of synthetic rubber bands that are of sizes outside the scope of these investigations. This firm also noted that ***. Additionally, one firm, ***, submitted a “NO” response to the U.S. producer questionnaire. Letter from ***, February 12, 2018; email from ***, September 18, 2018; email from ***, February 22, 2018; and *** U.S. producer questionnaire.
3 Conference transcript, p. 31 (Risner). In response to staff questions regarding domestic production, *** reported production of approximately *** pounds of in-scope and out-of-scope rubber bands in 2017. The firm ***. Total rubber bands produced by *** were approximately *** percent of Alliance’s reported in-scope domestic production in 2017. In its letter to the Commission, the firm stated ***. Email from ***, February 13, 2018 and letter from ***, February 12, 2018.

III-2
Alliance reported it was not related to or affiliated with any foreign producers of rubber bands or U.S. importers of rubber bands. Nonetheless, as discussed in greater detail below, Alliance ***.
Alliance reported one change in operations since January 1, 2015. In 2017, Alliance built a $1.3 million, 20,000 square foot warehouse with the primary purpose of housing the rubber used for the manufacture of the rubber bands for the private label contract it signed with Staples in 2015.4 The petitioner reported that the commitment to the Staples contract required it to take possession and store rubber in order to secure a set, low price for the raw material input.5 Petitioner stated that in 2017, Staples did not renew its contract with Alliance,6 but instead sourced its private label rubber bands from ***, a producer in Thailand, that offered a price half that of the petitioner.7 Alliance stated, ***.8 Table III-2 presents the U.S. producer’s information on reported changes in operations since January 1, 2015. Table III-2 Rubber bands: U.S. producer's reported changes in operations, since January 1, 2015
* * * * * * *
U.S. PRODUCTION, CAPACITY, AND CAPACITY UTILIZATION Table III-3 and figure III-1 present the U.S. producer’s production, capacity, and capacity
utilization. Total reported capacity was *** pounds in 2015-17.9 Staff estimates “average production capacity” to be *** pounds over the period.10 Production of rubber bands increased
4 According to the petitions, prior to 2015 ***. Petitions, pp. 33-34 and conference transcript, p. 37 (Risner); hearing transcript, p. 20 (Risner).
5 In response to staff questions about industry practices of building warehouses for 1-2 year contracts, witnesses for the petitioner testified that “if you don’t have access to the rubber that you bought at a set price, then the price of rubber could fluctuate during the term of that contract and you would be stuck with a loss.” The petitioner stated it is not aware of a market for hedging the price of rubber. Furthermore, the petitioner stated “had Alliance not built the warehouse it risked losing the Staples business because it did not have adequate inventory of rubber on site to fill the large Staples order.” Conference transcript, pp. 38 and 82 (Risner) and Petitioner’s postconference brief, p. 4.
6 Witnesses for the petitioner testified that contracts for large customers are at least 12 months but can vary up to 24 or 36 months, depending on the customer. Conference transcript, p. 39 (Risner).
7 Alliance stated that the ***. Conference transcript, pp. 37-39 (Risner); Petitioner’s postconference brief, p. 19; ***.
8 Petitions, p. 37. 9 Alliance’s average capacity based on ***. Witnesses for the petitioner testified that in 1999 Alliance
ran three full-time shifts, producing 25.5 million pounds of rubber bands a year, and that Alliance could “easily handle 30 million pounds a year” on existing equipment. Alliance’s U.S. producer questionnaire, p. 7 and conference transcript, pp. 77-78 (Swayze).
10 Alliance reported ***. Alliance’s postconference brief, p. 31. Based on Alliance’s current operations, staff estimates that reported capacity is above what the firm could reasonably have
(continued...)
III-3
in each full calendar year since 2015. Production was *** percent higher in 2017 compared with 2015, but *** in January-June 2018 than in January-June 2017. The petitioner stated that its increase in production in 2017 is “strictly due to the Staples private label business. Without that, {Alliance} would have seen a slight decrease.”11 Reported capacity utilization increased by *** percentage points from 2015 to 2017 to *** percent. Reported capacity utilization was *** percentage points lower in January-June 2018 than January-June 2017. Alliance expected to experience a negative impact from the loss of the Staples business beginning in 2018 and argues that additional customers may also switch to foreign-produced rubber bands.12 Table III-3 Rubber bands: U.S. producer's capacity, production, and capacity utilization, 2015-17, January to June 2017, and January to June 2018
* * * * * * * Figure III-1 Rubber bands: U.S. producer’s capacity, production, and capacity utilization, 2015-17, January to June 2017, and January to June 2018
* * * * * * *
Alternative products Alliance produces TPE (“thermoplastic elastomers”) bands and silicone bands, both of
which fall outside Commerce’s scope. ***.13 Alliance began producing silicone bands in 201814 and estimates annual sales of silicone bands at $***.15 Alliance produced TPE bands in sales volumes of ***.16 Alliance also is now capable of producing ***.17
Alliance reported being unaware of any other U.S. production of out-of-scope rubber bands.18
(…continued) expected to attain during the specified period. Staff estimates average production capacity is *** pounds annually, or *** pounds for January-June. Staff’s estimated average production capacity is based on reported capacity multiplied by ***.
11 Conference transcript, p. 33 (Risner). 12 Petitions, pp. 1-2 and 37-40. 13 Staff field trip report, Alliance, October 4, 2018. 14 Alliance Rubber Company adds Custom Silicone Extrusion to its Production Capabilities,
https://www.rubberband.com/news-events/69/alliance-rubber-company-produces-custom-silicone-profiles, accessed October 15, 2018.
15 Email from ***, October 15, 2018. 16 Ibid. 17 Ibid. 18 U.S. producer *** verified via email that it produces out-of-scope rubber bands but did not specify
how much of its production was outside the scope of these investigations. Additionally, U.S. producer *** confirmed via email that it produces ***. Email from ***, February 13, 2018; email from ***, February 22, 2018; and telephone interview with ***, February 22, 2018.

III-4
U.S. PRODUCERS’ U.S. SHIPMENTS AND EXPORTS
Table III-4 presents U.S. producer Alliance’s U.S. shipments, export shipments, and total shipments. Table III-4 Rubber bands: U.S. producer's U.S. shipments, export shipments, and total shipments, 2015-17, January to June 2017, and January to June 2018
* * * * * * *
Alliance’s U.S. shipments of rubber bands accounted for approximately *** percent of total shipments by quantity and by value, and its share of U.S. shipments relative to exports *** from 2015 to 2017, but was *** in January-June 2018 than in January-June 2017. Total shipments by quantity increased by *** percent from 2015 to 2017, as the *** percent decrease in exports was offset by the *** percent increase in U.S. shipments. Total shipments were lower in January-June 2018 than January-June 2017 by *** percent. Similarly, total shipments by value increased by *** percent from 2015 to 2017, as the *** percent decrease in exports was offset by the *** percent increase in U.S. shipments. Total shipments by value were lower in January-June 2018 than in January-June 2017 by *** percent, or ***. The average unit value (dollars per pound) of total shipments declined by $*** from 2015 to 2017 and was $*** in January-June 2018 than in January-June 2017.
Shipments by product type Alliance reported U.S. shipments of rubber bands with rubber content ranging from *** percent to *** percent in 2017. The majority *** of U.S. shipments in 2017 had rubber content above or equal to ***. By width, in 2017, Alliance reported *** percent of U.S. shipments had a width of 1/16 inch,19 *** percent had a width of 1/8 inch,20 and *** percent had other widths. Further analysis of U.S. shipments by product type is presented in the “Fungibility” section of Part IV.
U.S. PRODUCER’S INVENTORIES Table III-5 presents U.S. producer’s end-of-period inventories and the ratio of these
inventories to U.S. producer’s production, U.S. shipments, and total shipments.
19 Includes common industry sizes 8 through 19 and 117-A, which have a width of 1/16”. Lengths are as follows: size 8—7/8”, size 10—1 ¼”, size 12—1 ¾”, size 14—2”, size 16—2 ½”, size 18—3”, size 19—3 ½”, and size 117-A—7”.
20 Includes common industry sizes 27 through 33 and 117-B, which have a width of 1/8”. Lengths are as follows: size 27—1 ¼”, size 30—2”, size 31—2 ½”, size 32—3”, size 33—3 ½”, and size 117-B—7”.

III-5
Table III-5 Rubber bands: U.S. producer’s inventories, 2015-17, January to June 2017, and January to June 2018
* * * * * * * End-of-period inventories of rubber bands increased by *** percent from 2015 to 2016
and then declined by *** percent in 2017. End-of-period inventories were *** percent lower in January-June 2018 than in January-June 2017. Inventories accounted for between *** percent and *** percent of U.S. production, U.S. shipments, and total shipments between 2015 and 2017.
U.S. PRODUCER’S IMPORTS AND PURCHASES U.S. producer Alliance’s imports of rubber bands are presented in table III-6.
Table III-6 Rubber bands: U.S. producer’s imports, 2015-17, January to June 2017, and January to June 2018
* * * * * * * Alliance reported ***.21 Alliance’s *** in 2017.22 Alliance ***.23 As a ratio of imports to
U.S. production, Alliance’s imports accounted for ***.
U.S. EMPLOYMENT, WAGES, AND PRODUCTIVITY Table III-7 shows U.S. producer Alliance’s employment-related data.
Table III-7 Rubber bands: U.S. producer’s employment related data, 2015-17, January to June 2017, and January to June 2018
* * * * * * * Alliance employed *** production and related workers (“PRWs”) in 2017 and has
maintained a near-constant size workforce since 2015.24 PRWs were *** in January-June 2018 than in January-June 2017. Total hours worked increased by *** percent from 2015 to *** hours in 2016 and held steady in 2017. Total hours worked were *** percent lower in January-
21 Alliance ***. Alliance reported *** production of ***. 22 Alliance also imported ***. Email from ***, October 15, 2018. 23 ***. Staff field trip report, Alliance, October 4, 2018. 24 When producing full time on three shifts in 1999, Alliance employed 250 people. Conference
transcript, p. 77 (Swayze).
III-6
June 2018 than in January-June 2017. Total wages paid increased by *** percent from 2015 to 2016 and were flat in 2017, while hourly wages fluctuated within *** between 2015 and 2017. Productivity, as measured by pounds produced per hour, increased by *** percent from 2015 to 2017.25
25 Alliance testified to investing in automation over the years. According to witnesses for the petitioner, “if you were to look at {Alliance’s} production facility versus a facility overseas, you would find a lot more automation, a lot more packaging capabilities.” Conference transcript, p. 34 (Risner).
IV-1
PART IV: U.S. IMPORTS, APPARENT U.S. CONSUMPTION, AND MARKET SHARES
U.S. IMPORTERS
The Commission issued importer questionnaires to 86 firms identified as possible importers of rubber bands, as well as to all firms identified as possible U.S. producers of rubber bands.1 The Commission received usable questionnaire responses from 27 companies, representing *** percent of U.S. imports from China, and *** percent of U.S. subject imports from Thailand during 2017 under HTS statistical reporting number 4016.99.3510.2 Table IV-1 lists all responding U.S. importers of rubber bands, their locations, and their shares of reported U.S. imports in 2017.
1 The Commission issued questionnaires to those firms identified in the petitions, along with firms that, based on a review of data provided by U.S. Customs and Border Protection (“Customs”), may have accounted for more than one percent of total imports under HTS statistical reporting number 4016.99.3510 during 2015-17.
2 The coverage figures were calculated from *** data.

IV-2
Table IV-1 Rubber bands: U.S. importers, their headquarters, and share of total imports by source, 2017
Firm Headquarters
Share of imports by source (percent)
China Thailand subject
Subject sources
Thailand- LHH
All other sources
Nonsubject sources
All import sources
99 Cents Only Commerce, CA *** *** *** *** *** *** *** ACCO Brands Lake Zurich, IL *** *** *** *** *** *** ***
Advantus Jacksonville, FL *** *** *** *** *** *** ***
Alliance Hot Springs, AR *** *** *** *** *** *** ***
Annie International
North Wales, PA *** *** *** *** *** *** ***
Band-It Rubber Corona, CA *** *** *** *** *** *** *** Buick Hope Valley, RI *** *** *** *** *** *** ***
Continental San Leandro, CA *** *** *** *** *** *** ***
DMPG Toronto, ON *** *** *** *** *** *** ***
Dollar Tree Chesapeake, VA *** *** *** *** *** *** ***
Duncan Enterprises Fresno, CA *** *** *** *** *** *** *** Encore Vernon Hills, IL *** *** *** *** *** *** *** Essendant Deerfield, IL *** *** *** *** *** *** *** Family Dollar Matthews, NC *** *** *** *** *** *** *** Frank Winne Mt. Laurel, NJ *** *** *** *** *** *** *** Great Southern Memphis, TN *** *** *** *** *** *** *** Home Depot Atlanta, GA *** *** *** *** *** *** *** Officemate Edison, NJ *** *** *** *** *** *** *** Schermerhorn Lombard, IL *** *** *** *** *** *** *** Shalom Dayton, NJ *** *** *** *** *** *** ***
Staples Framingham, MA *** *** *** *** *** *** ***
Target Minneapolis, MN *** *** *** *** *** *** ***
Tytan Lenexa, KS *** *** *** *** *** *** *** Unlimited Beauty Vernon, CA *** *** *** *** *** *** *** Wafler Farms Wolcott, NY *** *** *** *** *** *** *** Walgreen Deerfield, IL *** *** *** *** *** *** *** Walmart Bentonville, AR *** *** *** *** *** *** ***
Total *** *** *** *** *** *** *** Note.--Shares and ratios shown as "0.0" represent values greater than zero, but less than "0.05" percent. Source: Compiled from data submitted in response to Commission questionnaires.
U.S. IMPORTS Table IV-2 and figure IV-1 present data for U.S. imports of rubber bands from China,
Thailand, and all other sources. Import data presented were compiled using adjusted *** import records. *** data are presented in this report instead of public official Commerce import statistics because U.S. imports on the basis of quantity are not available from public

IV-3
records for HTS statistical reporting number 4016.99.35.10 (rubber bands of natural rubber). Quantity data compiled from *** import records are based on shipping weight, which also includes the weight of packaging.3 Table IV-2 Rubber bands: U.S. imports, by source, 2015-17, January to June 2017, and January to June 2018
* * * * * * * Figure IV-1 Rubber bands: U.S. import volumes and prices, 2015-17, January to June 2017, and January to June 2018
* * * * * * *
Imports of rubber bands from subject sources combined decreased by *** percent from 2015 to 2017 in terms of quantity and by *** percent in terms of value. Subject imports by quantity were *** percent higher in January-June 2018 than in January-June 2017. The average unit values of subject imports decreased from $*** per pound in 2015 to $*** per pound in 2016, before increasing to $*** per pound in 2017. Unit values were $*** per pound lower in January-June 2018 than in January-June 2017. The ratio of subject imports by quantity to U.S. production decreased from *** percent in 2015 to *** percent in 2017. The ratio of subject imports by quantity to U.S. production was higher in January-June 2018 than in January-June 2017 by *** percentage points.
In 2017, imports of rubber bands from LHH accounted for *** percent of all rubber bands imports and rubber bands from nonsubject sources accounted for *** percent of all rubber band imports. In 2017, *** percent of nonsubject imports of rubber bands were from Thai exporter ***. The average unit values of aggregate nonsubject imports increased irregularly from $*** per pound in 2015 to $*** per pound in 2017. Unit values were higher in interim 2018 at $*** per pound than in 2017 at $*** per pound.
Thailand was the largest source for subject U.S. imports of rubber bands, accounting for *** percent of the total quantity and *** percent of the total value of U.S. imports of rubber bands in 2017. Subject U.S. imports from Thailand fell by *** percent from 2015 to 2017 in terms of quantity and by *** percent in terms of value. Subject imports from Thailand were *** percent higher by quantity in January-June 2018 than in January-June 2017, and were *** percent higher by value in January-June 2018 than in January-June 2017. The average unit values of subject U.S. imports from Thailand, *** increased irregularly from $*** per pound in 2015 to $*** per pound 2017. Average unit values from subject Thailand were $*** per pound in January-June 2018 compared with $*** per pound in January-June 2017.
China was the second largest source of U.S. imports of rubber bands, accounting for *** percent of the total quantity and *** percent of the total value of U.S. imports of rubber bands
3 Unless otherwise noted, *** import data presented in this report have been adjusted to remove data from the following firms that provided certifications that they did not import rubber bands: ***.
IV-4
in 2017. U.S. imports from China (based on quantity) fell by *** percent from 2015 to 2016, before increasing in 2017 to a level that was *** percent lower than in 2015. Imports were *** percent higher in January-June 2018 than in January-June 2017, by quantity. Imports from China based on value showed a similar trend from 2015 to 2017. However, in January-June 2018, imports by value were *** percent lower than in January-June 2017. This is part of a downward trend in average unit values for imports from China: the average unit values of U.S. imports from China, which were the higher of the two subject countries from 2015 to 2017, declined from $*** per pound in 2015 to $*** per pound in 2017; average unit values were $*** in January-June 2017 and $*** in January-June 2018.
CRITICAL CIRCUMSTANCES In these investigations, if both Commerce and the Commission make affirmative final
critical circumstances determinations, certain subject imports may be subject to antidumping duties retroactive by 90 days from September 6, 2018, the effective date of Commerce’s preliminary affirmative LTFV and CVD determinations.
On November 20, 2018, Commerce issued its final determinations that “critical circumstances” exist with regard to imports from China of rubber bands from “China-wide entity” in its LTFV investigation.4 In the twelve month period around the filing of the petition, (January 30, 2018,) imports of rubber bands from China (i.e., “China-wide entity”) fluctuated from month to month. October, 2017, had the *** volume of imports from China in a single month (***), while June, 2018, had the *** volume of imports from China for a single month (***). Aggregate imports from China in the six months preceding the filing of the petition exceeded aggregate imports in the following six months by *** percent. Table IV-3 and figure IV-2 present these data.
4 83 FR 58547, November 20, 2018, referenced in app. A. When petitioners file timely allegations of critical circumstances, Commerce examines whether there is a reasonable basis to believe or suspect that (1) either there is a history of dumping and material injury by reason of dumped imports in the United States or elsewhere of the subject merchandise, or the person by whom, or for whose account, the merchandise was imported knew or should have known that the exporter was selling the subject merchandise at LTFV and that there was likely to be material injury by reason of such sales; and (2) there have been massive imports of the subject merchandise over a relatively short period.

IV-5
Table IV-3 Rubber bands: U.S. imports from China subject to Commerce's final AD critical circumstance findings, August 2017 through July 2018
* * * * * * * Figure IV-2 Rubber bands: U.S. imports from China subject to Commerce's final AD critical circumstance findings, August 2017 through July
* * * * * * * On November 20, 2018, Commerce issued its final determinations that “critical
circumstances” exist with regard to imports from China of rubber bands from the firms Graceful Imp. & Exp. Co., Ltd. (Graceful), Moyoung Trading Co., Ltd. (Moyoung), and Ningbo Syloon Imp & Exp Co., Ltd. (Ningbo Syloon) in its CVD investigation.5 Imports from Graceful, Moyoung, and Ningbo Syloon, in August, 2017 and October, 2017, had the *** volume of imports for single months (***, respectively). Aggregate imports from these firms in the six months preceding the filing of the petition exceeded aggregate imports in the following six months by *** percent. Table IV-4 and figure IV-3 present these data.
Table IV-4 Rubber bands: U.S. imports from China subject to Commerce's final CVD critical circumstance findings, August 2017 through July 2018
* * * * * * * Figure IV-3 Rubber bands: U.S. imports from China subject to Commerce's final CVD critical circumstance findings, August 2017 through July 2018
* * * * * * *
NEGLIGIBILITY The statute requires that an investigation be terminated without an injury
determination if imports of the subject merchandise are found to be negligible.6 Negligible imports are generally defined in the Act, as amended, as imports from a country of merchandise corresponding to a domestic like product where such imports account for less than 3 percent of the volume of all such merchandise imported into the United States in the most recent 12-month period for which data are available that precedes the filing of the petition or the initiation of the investigation. However, if there are imports of such merchandise
5 Rubber Bands From the People's Republic of China: Final Affirmative Countervailing Duty Determination, 83 FR 58538, November 20, 2018.
6 Sections 703(a)(1), 705(b)(1), 733(a)(1), and 735(b)(1) of the Act (19 U.S.C. §§ 1671b(a)(1), 1671d(b)(1), 1673b(a)(1), and 1673d(b)(1)).

IV-6
from a number of countries subject to investigations initiated on the same day that individually account for less than 3 percent of the total volume of the subject merchandise, and if the imports from those countries collectively account for more than 7 percent of the volume of all such merchandise imported into the United States during the applicable 12-month period, then imports from such countries are deemed not to be negligible.7
Table IV-5 presents data on U.S. imports of rubber bands during the 12-month period preceding the filing of the petitions for which data are available. Subject imports from Thailand accounted for *** percent of total imports of rubber bands by quantity from January 2017 to December 2017. Imports of rubber bands from China accounted for *** percent of total imports of rubber bands by quantity from January 2017 to December 2017. Table IV-5 Rubber bands: U.S. imports in the twelve month period preceding the filing of the petition, January 2017 through December 2017
* * * * * * *
CUMULATION CONSIDERATIONS In assessing whether imports should be cumulated, the Commission determines
whether U.S. imports from the subject countries compete with each other and with the domestic like product and has generally considered four factors: (1) fungibility, (2) presence of sales or offers to sell in the same geographical markets, (3) common or similar channels of distribution, and (4) simultaneous presence in the market. Information regarding channels of distribution, market areas, and interchangeability appear in Part II. Additional information concerning fungibility, geographical markets, and simultaneous presence in the market is presented below.
Fungibility
Rubber content Generally, the higher the rubber content, the better the attributes of the rubber band,
including increased elasticity, longevity, memory, and modulus, as well as a softer stretch.8 Parties testified that the rubber content of rubber bands made from natural rubber generally ranges from about 50 percent on the low end to 95 percent on the high end.9
Data concerning the U.S. producer’s and U.S. importers’ U.S. shipments of rubber bands, by rubber content, are presented in table IV-6 and figure IV-4. These data may be affected somewhat by inconsistent methods of rubber content calculation and/or certain misperceptions of rubber content. There is no industry standard for the calculation of rubber
7 Section 771 (24) of the Act (19 U.S.C § 1677(24)). 8 Conference transcript, pp. 31-32 (Risner). 9 Conference transcript, pp. 54-55 (Risner), p. 114 (Jordan), and p. 126 (Adelizzi).

IV-7
content in that some firms include rubber oil as part of the rubber content and some do not.10 In addition, there may be general industry misperceptions and/or incorrect portrayals concerning rubber content, as some importers seem to rely on information from their suppliers that seems inconsistent with rubber band production as described in this report,11 and some firms may incorrectly advertise a more desirable, higher rubber content product than is actually being offered.12 Table IV-6 Rubber bands: Shares of U.S. producer’s and importers' U.S. shipments, by rubber content, 2017
* * * * * * * Figure IV-4 Rubber bands: U.S. producers' and U.S. importers' U.S. shipments by rubber content, 2017
* * * * * * * Low-grade rubber bands (i.e., at least 50 percent but less than 65 percent rubber
content) comprised *** percent of the U.S. producer’s U.S. shipments of rubber bands and *** percent of subject Thai importers’ U.S. shipments. *** U.S. producer’s U.S. shipments were mid-grade rubber bands (i.e., at least 65 percent but less than 80 percent rubber content), whereas *** of the subject Thai importers’ total U.S. shipments were mid-grade rubber bands (*** percent). High-grade rubber bands (i.e., at least 80 percent but less than 95 percent rubber content) comprised *** percent of the subject Thai importers’ U.S. shipments and *** of the U.S. producer’s U.S. shipments. Low-grade and high-grade rubber bands accounted for *** percent and *** percent, respectively, of U.S. shipments of imports from China, whereas *** percent were reportedly rubber bands with a rubber content of ***.
Rubber band types
Petitioner Alliance detailed several major groupings of standard natural rubber band
sizes that are used for a variety of stationery and other applications (figure IV-5).13 Data on three major groupings, as well as data on rubber band balls, were requested by the Commission in its questionnaires in this proceeding.
10 Email from ***, February 23, 2018 (“***.”). Alliance states that “***.” Alliance Rubber Co.’s Response to February 20, 2018 Follow-Up Questions ***, February 22, 2018.
11 See e.g., Email from ***. 12 Conference transcript, p. 54 (Risner) (“I have seen quotes come through from Thailand that would
say 100 percent rubber. . . But it would be impossible to create a rubber band with 100 percent rubber”) and Email from ***, February 21, 2018 (“***”).
13 Petitions, p. 12.

IV-8
Figure IV-5 Rubber bands: Major groupings of standard natural rubber band sizes
Source: Petitions, Exhibit GEN-1.
Data concerning U.S. producer and importers’ U.S. shipments of rubber bands, by size are presented in table IV-7 and figure IV-6. These data show that during 2017, “all other sizes” comprised the largest overall category of U.S. shipments. *** of the U.S. producers’ U.S. shipments of rubber bands shipments of rubber bands were “all other” sizes, whereas *** of the China and subject Thailand importers’ U.S. shipments of rubber bands were the “all other” size. In 2017, *** percent of all U.S. shipments of rubber band balls were imports from China,14 but rubber band balls comprised just *** percent of total U.S. shipments from all sources. U.S. shipments of common rubber band sizes with a width of 1/16" were comprised of *** percent subject Thai product, *** percent U.S. product, and *** percent Chinese product. U.S. shipments of common rubber band sizes with a width of 1/8" were comprised of *** percent U.S. product, *** percent subject Thai product, and *** percent Chinese product. U.S.
14 ***.
;EST 11 12 14 SilestlO'WflnMtoband
,. ,. ,. 117•A
27
\ 31 132
33 :::U •17-B
BEST 1/' -VALUE ~~
SIERUNG 84 ~- m:ui~ ----
94 II .
,
; ~ _ ____ Jt::::=_105 ==~==~;.;.._ [ , ,o,

IV-9
shipments of “all other” rubber band sizes were comprised of *** percent U.S. product,15 *** percent subject Thai product,16 and *** percent Chinese product.17 Table IV-7 Rubber bands: U.S. producers' and U.S. importers' U.S. shipments by rubber size, 2017
* * * * * * * Figure IV-6 Rubber bands: U.S. producers' and U.S. importers' U.S. shipments by size, 2017
* * * * * * *
Geographical markets U.S. imports of rubber bands from China and Thailand entered the United States in all
four broad regions of the contiguous United States (table IV-8). Approximately *** percent of U.S. imports from China and subject Thailand entered the United States in Customs districts on the *** borders of the United States with the *** (*** percent) of those imports entering on customs districts in the ***. The *** entered the United States from the North and South borders. Table IV-8 Rubber bands: U.S. imports by border of entry, 2017
* * * * * * *
Presence in the market Table IV-9 and figures IV-7 and IV-8 presents monthly U.S. imports from January 2015 to
June 2018. These data show that imports of rubber bands from subject sources were present in the U.S. market in every month from January 2015 to June 2018. Table IV-9 Rubber bands: U.S. imports by month, 2015-2017, and January to June 2018
* * * * * * *
15 ***. 16 ***. 17 ***.

IV-10
Figure IV-7 Rubber bands: Monthly U.S. imports from individual subject sources, 2015-17, and January to June 2018
* * * * * * * Figure IV-8 Rubber bands: Monthly U.S. imports from cumulated subject and nonsubject sources, 2015-17, and January to June
* * * * * * *
APPARENT U.S. CONSUMPTION
Table IV-10 and figure IV-9 present data on apparent U.S. consumption of rubber bands. These data show that apparent consumption quantity declined by *** percent from 2015 to 2017 in terms of quantity and declined by *** percent in terms of value. Apparent consumption was *** percent higher in January-June 2018 than in January-June 2017 by quantity, but *** percent lower by value. The demand for rubber bands depends on the demand in a wide range of end uses, including in the following market sectors: retailers, office supplies, newspapers, agriculture/produce, industrial, beauty products, stationery, paper and packaging, government and Post Office, and ad specialty.18 The parties noted a decline in use in the newspaper sector with declining newspaper sales and a decline in use in the agriculture sector with the weather-related decline in production of agricultural products associated with the drought in California and hurricane activity in Florida.19
Table IV-10 Rubber bands: Apparent U.S. consumption, 2015-17, January to June 2017, and January to June 2018
* * * * * * * Figure IV-9 Rubber bands: Apparent U.S. consumption, 2015-17, January to June 2017, and January to June 2018
* * * * * * *
U.S. MARKET SHARES U.S. market share data are presented in table IV-11. U.S. producers’ market share
increased by *** percentage points from 2015 to 2017 and the market share held by the
18 Conference transcript, p. 7 (Goldberg), p. 13 (Levinson), and p. 15 (Swayze); and petitions, p. 10. 19 Conference transcript, p. 33 (Risner), p. 116 (Jordan).

IV-11
subject sources decreased *** percentage points. U.S. producers’ market share was *** percentage points lower in January-June 2018 than in January-June 2017. The market share held by subject sources was *** percentage points greater in January-June 2018 than in January-June 2017.
Table IV-11 Rubber bands: Market shares, 2015-17, January to June 2017, and January to June 2018
* * * * * * *


V-1
PART V: PRICING DATA
FACTORS AFFECTING PRICES
Raw material costs The primary raw material in the production of natural (latex) rubber bands is rubber and
the primary raw material in the production of synthetic (non-latex) rubber bands is crude oil, which is generally more expensive than rubber.1 U.S. producer Alliance reported that it buys larger quantities of rubber when the prices are low, and will delay purchasing rubber when prices are high.2 Prices of natural and synthetic rubber fluctuated in the first half of 2015 and then declined through early 2016 (figure V-1). Prices then increased with some fluctuations reaching a period high in February 2017 (natural rubber) and March 2017 (synthetic rubber). Prices fell to near January 2015 levels in late 2017. Both prices continued to fluctuate until March 2018 after which prices of synthetic rubber rose and prices of natural rubber declined.
U.S. producer Alliance reported that raw material prices had *** since 2015. Fourteen importers reported that raw material costs had not changed since 2015, six importers reported they fluctuated, four reported they increased, and two reported they decreased. Importer *** stated that prices have fluctuated within a 5 percent range over the last 3 years, with the exception of a 35 percent spike in early 2017 that corrected within 60 days. Importer *** reported that rubber costs increased by 50 percent during 2016, and although they have since declined costs remain higher than they were in 2015. Importer *** stated that raw material cost increases are passed on to its customers. Retailers *** reported that their rubber band prices have been stable over the past three years. Respondent U. Yong stated that natural rubber prices spiked in February 2017 because of flooding in southern Thailand, but had dropped by nearly 37 percent by June 2017.3
1 Conference transcript, pp. 36, 42, 52 (Risner) and 60 (Swayze). Petitioner stated that it does not face much competition in the synthetic rubber band market because the raw material is more costly, while natural and synthetic rubber bands are, for the most part, interchangeable.
2 Conference transcript, p. 82 (Risner). 3 U. Yong’s prehearing brief, p. 8.

V-2
Figure V-1 Rubber prices: Monthly prices of natural rubber and synthetic rubber, indexed, January 2015=100
Source: Rubber Statistical Bulletin, October-December 2016 and 2017, July-September 2018.
U.S. inland transportation costs *** and nearly all responding importers reported that they typically arrange
transportation to their customers. Alliance reported U.S. inland transportation costs of ***. Importers reported costs of 1 to 15 percent, with 10 firms reporting costs of 6 percent or less and six reporting costs of 10 to 15 percent.
Firms that imported rubber bands from subject countries for retail sale were requested to estimate U.S. inland transportation costs (from the port of importation to the point of use). Five importers reported U.S. inland transportation costs for own-use imports from China and four reported costs for Thailand. Most responding firms reported that such costs were 3 to 4 percent.4
Rubber content Rubber content can affect rubber bands pricing in multiple ways.5 Higher rubber
content lends itself to higher quality rubber bands that receive a higher price. Alliance stated that price differences between low and high rubber content can range from 25 percent to 50 percent6 and respondent Winne estimated a price difference of *** percent between rubber
4 One importer reported 6 percent for China and one importer reported 15 percent for Thailand. 5 Conference transcript, pp. 93, 134 (Aversano) and Respondent Winne’s postconference brief, p. 3. 6 Conference transcript, p. 64 (Risner).
180
160
140 0 0 120 ,-, II
LI) ,-, 100 0 N
2:- 80 C1l ::::,
60 C: C1l
40
20
0 Jan-15 May-15 Sep-15 Jan-16 May-16 Sep-16 Jan-17 May-17 Sep-17 Jan-18 May-18
--Natural Rubber - - - Synthetic rubber

V-3
bands with its highest and lowest offered rubber content.7 Respondent Schermerhorn estimated that price differences for rubber bands with rubber content within a *** percent rubber-content spread can range from *** percent to *** percent, and respondent Winne stated that a *** percent difference in rubber content is accompanied by a price difference of about *** percent.8 However, higher rubber content lends itself to lighter and more elastic rubber bands, enabling purchasers to purchase smaller sizes that weigh less, and may end up costing less on a per-piece basis.9
Respondent Schermerhorn stated that prices for Thai rubber bands with 50 percent and 55 percent rubber content increased by *** to *** percent from the end of 2014 to late 2017, and that prices of rubber bands with rubber content of 75 percent increased by *** to *** percent.10 Respondent Winne stated that U.S. producer Alliance’s rubber bands are generally higher in rubber content than imported rubber bands from Thailand, and that the higher rubber content in U.S. product contributes to the higher prices.11
PRICING PRACTICES
Pricing methods
The U.S. producer and importers reported using transaction-by-transaction negotiations, contracts, price lists, and other methods (table V-1). The U.S. producer ***. Importers’ most commonly reported price setting method was transaction-by-transaction, but firms also reported using contracts, set price lists, and other methods.
7 Respondent Winne’s postconference brief, p. 7. 8 Respondent Schermerhorn’s postconference brief, Exh. 5 and respondent Winne’s postconference
brief, p. 7. 9 Conference transcript, pp. 63 (Risner) and 95 (Aversano). U.S. producer Alliance’s rubber bands
“typically stretch further enabling {purchasers} to drop back a size. Bands are bought by the pound, but used by the piece so a lot of times the high cost of the Pale Crepe Gold could actually be cheaper on a per piece basis.” Conference transcript, pp. 53, 65 (Swayze). Hearing transcript, p. 67 (Risner).
Respondent Schermerhorn stated that “your price may go up 20 percent due to the higher grade, but you get 25 more bands in the bag.” Conference transcript, p. 111 (Jordan).
10 Respondent Schermerhorn’s postconference brief, p. 4. 11 Conference transcript, p. 93 (Aversano).

V-4
Table V-1 Rubber band: U.S. producer’s and importers’ reported price setting methods, by number of responding firms1
Method U.S. producers Importers Transaction-by-transaction *** 11 Contract *** 7 Set price list *** 8 Other *** 7 Responding firms 1 24
1 The sum of responses down may not add up to the total number of responding firms as each firm was instructed to check all applicable price setting methods employed. Source: Compiled from data submitted in response to Commission questionnaires.
U.S. producer Alliance reported selling ***. The vast majority of importer sales were on a spot basis (table V-2).
Table V-2 Rubber bands: U.S. producers’ and importers’ shares of U.S. commercial shipments by type of sale, 2017
* * * * * * *
In the petition, U.S. producer Alliance stated that it typically bids on an annual basis for higher volume sales.12 Alliance stated at the hearing that retailers’ contracts lengths can vary, for example, a retailer may seek bids every three years or every five years, and may use reverse auctions or may not use an official bid process.13 Alliance’s retail customers Walmart and Office Depot do not require an annual bid, and most of Alliance’s other customers also do not have a formal bidding process.14
Alliance stated that it does not have formal contracts for most of its rubber band business.15 Alliance reported that ***. *** and responding importers reported that their contract prices for rubber bands were not indexed to raw material costs.
Nine purchasers reported that they purchase rubber bands weekly, seven purchase monthly, two purchase quarterly, and two purchase annually. Most responding purchasers (18 of 22) reported that their purchasing frequency had not changed since 2015. Most responding purchasers contact 1 to 3 suppliers before making a purchase.
12 Petitions, p. 12. ***. U. Yong’s prehearing brief, p. 6. 13 Alliance stated it has participated in reverse auctions once every three to five years. Hearing
transcript, p. 46 (Risner). 14 Hearing transcript, pp. 70 and 83 (Risner and Swayze). 15 Petitioner’s posthearing brief, exh. 1., p. 3.

V-5
Sales terms and discounts Alliance typically quotes prices on *** basis and a majority of importers typically quote
prices on an f.o.b. basis. Alliance reported ***. Some importers reported offering quantity and/or total volume discounts while some reported no discount policy. Several importers including *** reported offering discounts for large volume purchases and key customers.
Price leadership Most purchasers did not name any price leaders in the U.S. market. Three purchasers
listed Alliance as a price leader and one purchaser each listed Aero Rubber, Calpine, Amazon, and Walmart as a price leader.
PRICE DATA
The Commission requested U.S. producers and importers to provide quarterly data for the total quantity and f.o.b. value of the following rubber bands products shipped to unrelated U.S. customers during January 2015-June 2018.16
Product 1.-- Size #32 rubber bands (3” x 1/8”), with a natural rubber/latex content >=65% and <80%, sold in 1 lb. poly bags. Product 2.-- Size #33 rubber bands (3 1/2” x 1/8”), with a natural rubber/latex content >=65% and <80%, sold in 1 lb. poly bags. Product 3.-- Size #64 rubber bands (3 1/2” x 1/4”), with a natural rubber/latex content >=65% and <80%, sold in 1 lb. poly bags. Product 4.-- Size #18 rubber bands (3” x 1/16”), newspaper size, with a natural rubber/latex content >=65% and <80%, sold in 1 lb. poly bags. Product 5.-- Size #14 rubber bands (2" x 1/16"), agricultural size, with a natural rubber/latex content >=65% and <80%, sold in 1 lb. poly bags.
16 Pricing product definitions were modified in final phase draft questionnaires to indicate the rubber content. No parties submitted comments on the draft questionnaires. In addition, pricing product 6 from the preliminary phase (size #16 in 1 lb. poly bags) was replaced with a new definition (size #18 in 3.5 ounce bags) in an attempt to gather data from direct import retailers. This definition was chosen based on staff’s request to three of the largest responding importers of Chinese rubber bands in the preliminary investigation to provide a description of the products they imported from China. ***. Alliance reported that it does not sell size #18 rubber bands in 3.5 ounce bags but does sell #18 rubber bands in 4 ounce bags. Hearing transcript, p. 65 (Risner).
In its questionnaire response, U.S. producer Alliance stated, ***.

V-6
Product 6.-- Size #18 rubber bands (3” x 1/16”), with a natural rubber/latex content >=65% and <80%, sold in 3.5 ounce bags. One U.S. producer and seven importers provided usable pricing data for sales of the
requested products, although not all firms reported pricing for all products for all quarters.17 18 Pricing data reported by these firms accounted for approximately *** percent of the U.S. producer’s commercial shipments of rubber bands, *** percent of non-retail commercial shipments of subject imports from Thailand, and *** percent of non-retail commercial shipments of imports from LHH in Thailand in 2017. No price data were reported for China; the vast majority of shipments from China were retail shipments. Price data for products 1-6 are presented in tables V-3 to V-8 and figures V-2 to V-7. Table V-3 Rubber bands: Weighted-average f.o.b. prices and quantities of domestic and imported product 1 and margins of underselling/(overselling), by quarters, January 2015-June 2018
* * * * * * * Table V-4 Rubber bands: Weighted-average f.o.b. prices and quantities of domestic and imported product 2 and margins of underselling/(overselling), by quarters, January 2015-June 2018
* * * * * * * Table V-5 Rubber bands: Weighted-average f.o.b. prices and quantities of domestic and imported product 3 and margins of underselling/(overselling), by quarters, January 2015-June 2018
* * * * * * *
Table V-6 Rubber bands: Weighted-average f.o.b. prices and quantities of domestic and imported product 4
and margins of underselling/(overselling), by quarters, January 2015-June 2018
* * * * * * *
17 Five importers (***) reported price data for subject imports from Thailand, five reported price data for imports from Thailand LHH, and none reported price data for imports from China.
18 Per-unit pricing data are calculated from total quantity and total value data provided by U.S. producers and importers. The precision and variation of these figures may be affected by rounding, limited quantities, and producer or importer estimates.

V-7
Table V-7 Rubber bands: Weighted-average f.o.b. prices and quantities of domestic and imported product 5 and margins of underselling/(overselling), by quarters, January 2015-June 2018
* * * * * * * Table V-8 Rubber bands: Weighted-average f.o.b. prices and quantities of domestic and imported product 6 and margins of underselling/(overselling), by quarters, January 2015-June 2018
* * * * * * *
Figure V-2 Rubber bands: Weighted-average prices and quantities of domestic and imported product 1, by quarters, January 2015-June 2018
* * * * * * * Figure V-3 Rubber bands: Weighted-average prices and quantities of domestic and imported product 2, by quarters, January 2015-June 2018
* * * * * * * Figure V-4 Rubber bands: Weighted-average prices and quantities of domestic and imported product 3, by quarters, January 2015-June 2018
* * * * * * * Figure V-5 Rubber bands: Weighted-average prices and quantities of domestic and imported product 4, by quarters, January 2015-June 2018
* * * * * * * Figure V-6 Rubber bands: Weighted-average prices and quantities of domestic and imported product 5, by quarters, January 2015-June 2018
* * * * * * * Figure V-7 Rubber bands: Weighted-average prices and quantities of imported product 6, by quarters, January 2015-June 2018
* * * * * * *

V-8
Import purchase costs
In addition to price data, the Commission also requested that importers provide landed duty-paid values and quantities for imports of pricing product 6 for retail sale, repackaging, or internal consumption (direct imports). One importer (***) provided such data for subject imports from Thailand, and no importers provided data for imports from China. *** purchase cost data for imports of product 6 are presented in table V-9. U.S. producer Alliance reported no sales of pricing product 6.19
Six importers identified the benefits of direct importing rubber bands as opposed to purchasing them from a U.S. producer or importer. All six firms identified cost or price as a benefit. In addition, *** cited delivery model and capacity, *** cited flexibility and willingness to private label, *** cited control over product specification, and *** cited reliability and quality.20 Four importers estimated that they saved between 12 and 16 percent of the landed duty-paid value by importing themselves rather than purchasing.
In determining the additional transaction costs to directly import, three importers (***) reported that they compare the cost of importing directly to the cost of purchasing from both importers and domestic producers, and three importers (***) do not compare the costs to that of purchasing from importers or domestic producers. Two importers (***) reported supply chain or logistical management costs of 15 to 17 percent of landed-duty paid value, and one importer (***) reported inventory carrying cost of 5 percent of landed-duty paid value. Table V-9 Rubber bands: Purchase costs. Weighted-average f.o.b. landed duty-paid values and quantities of imported product 6, by quarter, January 2015-June 2018
* * * * * * *
Price and import purchase cost trends
In general, prices for the domestic product and subject imports from Thailand decreased during January 2015-June 2018. Table V-10 summarizes the price trends, by country and by product. As shown in the table, domestic price decreases ranged from *** to *** percent (products 1, 2, 4, and 5) during January 2015-June 2018, and prices of one product increased by *** percent (product 3). Subject Thai import price decreases ranged from *** to *** percent (products 1, 3, 4, and 5) and price increases ranged from *** to *** percent (products 2 and 6).
19 As noted previously, Alliance sells size #18 rubber bands in 4 ounce bags but not in 3.5 ounce bags. 20 The sixth importer, ***, stated “assumed lower cost.”

V-9
Price comparisons As shown in table V-11, prices for subject imports from Thailand were below those for
U.S.-produced product in 45 of 70 instances (*** pounds); margins of underselling ranged from 0.0 to 35.5 percent. In the remaining 25 instances (***), prices for subject imports from Thailand were between 0.7 to 19.1 percent above prices for the domestic product.
In comparing LHH Thai pricing data with U.S. producer pricing data, prices for LHH imports were lower than prices for U.S.-produced product in 30 instances and higher in 40 instances. In comparing LHH Thai pricing data with subject Thai pricing data, prices for LHH imports were lower than subject import prices in 27 instances and higher in 57 instances. Table V-10 Rubber bands: Summary of weighted-average f.o.b. prices for products 1-6 from the United States and Thailand
* * * * * * * Table V-11 Rubber bands: Instances of underselling/overselling and the range and average of margins, for subject imports from Thailand, January 2015-June 2018
* * * * * * *
LOST SALES AND LOST REVENUE In the preliminary phase investigations, the Commission requested that U.S. producers
of rubber bands report purchasers where they experienced instances of lost sales or revenue due to competition from imports of rubber bands from China and Thailand during January 2015-December 2017. The sole responding U.S. producer, Alliance, reported that it had to reduce prices and that it had lost sales. Alliance identified *** firms where it lost sales or revenue (all *** consisting of both types of allegations) due to imports of rubber bands ***. ***.
In the final phase investigations, Alliance reported that it had to reduce prices and had lost sales. In an attachment to its final questionnaire response, it provided information on additional lost sales and revenue due to subject imports *** since the preliminary phase. It reported losing sales with customers Staples, ***. It reported lost revenue with customers ***. Of these firms, ***.21
Alliance stated that it won the Staples private label account for which it bid in 2015 and then started shipping in mid-2016. Then, in spring of 2017, it was informed that it lost the
21 ***.

V-10
account to a subject Thai producer, which offered rubber bands at half the price offered by Alliance.22
Staff received purchaser questionnaire responses from 22 firms.23 Responding purchasers reported purchasing 28.2 million pounds of rubber bands during 2015-2017 (table V-12).
Of the 22 responding purchasers, eight reported that, since 2015, they had purchased imported rubber bands from China instead of U.S.-produced product. All eight of these purchasers reported that Chinese import prices were lower than U.S.-produced product, and six of these purchasers reported that price was a primary reason for the decision to purchase imported product from China rather than U.S.-produced product. Five purchasers estimated the quantity of rubber bands from China purchased instead of domestic product; quantities ranged from *** pounds to *** pounds (tables V-13 and V-14). Purchasers *** identified delivery model24 as a non-price reason for purchasing imported rather than U.S.-produced product, and *** rubber bands from a Chinese supplier that provides it with other office products. *** also stated that the U.S. producer cannot provide the desired packaging. Table V-12 Rubber bands: Purchasers’ responses to purchasing patterns
* * * * * * *
Of the 22 responding purchasers, four reported that, since 2015, they had purchased subject rubber bands from Thailand instead of U.S.-produced product. Three of these purchasers reported that Thai import prices were lower than U.S.-produced product, and two of these purchasers reported that price was a primary reason for the decision to purchase imported product from Thailand rather than U.S.-produced product. Two purchasers estimated the quantity of rubber bands from subject sources in Thailand purchased instead of domestic product as *** and *** pounds, respectively (tables V-13 and V-14). Purchaser *** identified delivery model as a non-price reason for purchasing imported rather than U.S.-produced product. *** identified product availability and the need to offer both a private brand and a national brand.
Table V-13 Rubber bands: Purchasers’ responses to purchasing subject imports instead of domestic product
* * * * * * *
22 Hearing transcript, pp. 16-18 (Risner). According to Alliance, Staples informed them that the Thai price was *** per pound compared to Alliance’s price of *** per pound. Petitioner’s postconference brief, exh. GEN-4.
23 The five purchasers that submitted lost sales lost revenue survey responses in the preliminary phase also submitted purchaser questionnaire responses in the final phase.
24 ***.

V-11
Table V-14 Rubber bands: Purchasers’ responses to purchasing subject imports instead of domestic product, by country
Source
Count of purchasers
reporting subject instead of domestic
Count of purchasers
reported that imports were priced lower
Count of purchasers
reporting that price was a
primary reason for shift
Quantity purchased (pounds)
China 8 8 6 *** Thailand 4 3 2 ***
Any subject source 11 10 8 *** Thailand LHH 6 5 3 *** Source: Compiled from data submitted in response to Commission questionnaires.
***. ***.25 ***. ***. Of the 22 responding purchasers, one reported that a U.S. producer had reduced prices
in order to compete with lower-priced imports from China, and none reported that a U.S. producer had reduced prices in order to compete with lower-priced imports from Thailand (tables V-15 and V-16; 13 reported that they did not know). There were no reported estimated price reductions from either China or Thailand. Table V-15 Rubber bands: Purchasers’ responses to U.S. producer price reductions
* * * * * * * Table V-16 Rubber bands: Purchasers’ responses to U.S. producer price reductions, by country
Source
Count of purchasers reporting U.S. producers
reduced prices
Simple average of estimated U.S. price reduction (percent)
Range of estimated U.S. price reductions (percent)
China 1 --- --- Thailand --- --- ---
All subject sources 1 --- --- Thailand LHH --- --- ---
Source: Compiled from data submitted in response to Commission questionnaires.
25 ***.


VI-1
PART VI: FINANCIAL EXPERIENCE OF U.S. PRODUCERS
BACKGROUND One U.S. producer, Alliance, reported its financial results on rubber bands.1 These data
are believed to account for the majority of U.S. production of rubber bands from January 2015 to June 2018.2 Alliance did not report internal consumption, transfers to related firms, or tolling.
Staff verified the results of *** with its company records. The verification adjustments were incorporated into this report. ***.3
OPERATIONS ON RUBBER BANDS
Table VI-1 presents the U.S. producer’s operations on rubber bands during calendar
years 2015-17, and January-June 2017 (“interim” 2017) and January-June (“interim” 2018). Table VI-2 presents changes in average unit values (“AUVs”) during the same periods.
Net sales As shown in table VI-1, Alliance’s total net sales quantity *** from *** in 2015 to *** in
2016, and to *** in 2017. Sales were *** in interim 2018, *** compared with interim 2017 ***. The *** sales in interim 2018 reportedly resulted from the loss of various accounts, including ***. 4 On a per-pound basis, Alliance’s total net sales unit value remained essentially the same from 2015 to 2016 at $*** and decreased to $*** in 2017. Similarly, unit total net sales were lower in interim 2018, *** per pound than in 2017, *** per pound.
1 Alliance reported its financial results on a calendar-year basis. 2 “There are three remaining U.S. manufacturers of rubber bands.” Alliance was the only firm to
provide usable financial data. Conference transcript, pp. 16-17 (Swayze). 3 The changes affected ***. 4 Alliance stated that the ***. Email from ***, October 18, 2018.

VI-2
Table VI-1 Rubber bands: Results of operations of Alliance, 2015-17, and January to June 2017-18
* * * * * * *
Table VI-2 Rubber bands: Changes in AUVs, between calendar years and between partial year periods
* * * * * * *
Cost of goods sold and gross profit As shown in table VI-1, raw materials represented the largest component of Alliance’s
COGS, accounting for between *** percent (2016), and *** percent (2015) of total COGS.5 The per-pound unit value of raw materials declined from $*** in 2015 to $*** in 2016 to $*** in 2017. The per-pound unit value of raw materials also was *** in interim 2018 at *** per pound compared to interim 2017 at $*** per pound.
Other factory costs were the *** component of COGS, accounting for between *** percent (2015) and *** percent (January-June 2018). On a per-pound basis, other factory costs moved within a relatively narrow range, and were $*** (2015), $*** (2016), and $*** (2017). Other factory costs were higher at $*** in interim 2018 compared to $*** in interim 2017.
As shown in table VI-1, direct labor costs were *** component of COGS, accounting for between *** percent (January-June 2018) and *** percent (2016). On a per-pound basis, direct labor costs *** from $*** (2015) to $*** (2016), and to $*** (2017). Direct labor was *** during the interim periods.
Alliance’s total COGS irregularly increased from $*** (2015) to $*** (2017). However, as a ratio to net sales, total COGS generally declined from *** percent (2015) to *** percent (2017). Interim 2017 and 2018 were similar at $*** and $***, respectively, for total COGS. However, as a ratio to net sales, total COGS was higher at *** percent (interim 2018) compared to *** percent (interim 2017).6
Alliance’s gross profit increased from $*** in 2015 to $*** in 2017. As a ratio to net sales, gross profit generally increased from *** percent (2015) to *** percent (2017). Interim 2018 was lower at $*** compared to interim 2017 at $***. As a ratio to net sales, gross profit also was lower at *** percent in interim 2018 compared to *** percent in interim 2017.
5 The firm’s raw material costs primarily reflect ***. Email from ***, February 15, 2018. 6 The higher COGS to net sales ratio in interim 2018 compared to interim 2017 was due to costs
declining less than net sales. A spokesman for Alliance explained “…impact of a lower Average Sales Price per pound. If we were able to charge a higher price, these two items would be more in line with each other. Specifically, there is a very large agricultural account that we are selling at a very low price to compete with Thai bands.” Email from ***, October 18, 2018.

VI-3
Selling general and administrative expenses and operating profit As shown in table VI-1, Alliance’s SG&A expenses ratio (total SG&A expenses divided by
total revenue) moved within a relatively narrow range from *** percent in 2015 to *** in 2017. On a per-pound basis, Alliance’s SG&A expenses were fairly consistent from $*** (2015 and 2017) to $*** (2016). The firm’s SG&A expenses during January-June 2018 were higher at *** percent of sales compared to *** percent in interim 2017. On a per-pound basis, Alliance’s SG&A expenses also were higher, $*** per pound in interim 2018 compared to $*** in interim 2017.7
Alliance’s operating income irregularly increased during the period, from $*** (2015) to $*** (2017). As a ratio to net sales, Alliance’s operating income irregularly increased from *** percent (2015) to *** percent (2017). Alliance’s operating income in interim 2018 ($***) was lower than in interim 2017 ($***). 8
All other expenses and net income Alliance reported an increase in interest expense from $*** (2015) to $*** (2016), and
a decrease to $*** (2017).9 Alliance’s all other expenses showed an irregular trend with an increase from $*** (2015) to $*** (2016), and then *** (2017).10 Alliance reported interest expenses in interim 2017 of $*** and *** for interim 2018. Alliance *** interim period.
Alliance’s net income *** during the annual periods, from $*** (2015) to $*** (2017). Alliance’s net income for interim 2018 was *** in interim 2017 at $*** compared to $***.
7 SG&A expenses in interim 2018 were higher by *** percent when compared to interim 2017. This greater amount was from $*** in legal fees from the antidumping case. Ibid.
8 Operating income was *** percent lower in interim 2018 compared to interim 2017, resulting from the combination of higher COGS (see note no. 5), higher legal fees ($***) and R&D expenses ($***), that more than offset the other SG&A expenses that declined commensurate with the *** in net sales.
9 ***. Email from ***, February 15, 2018. 10 ***. Ibid.

VI-4
Variance analysis The variance analysis presented in table VI-3 is based on the data in table VI-1.11 The
analysis shows that *** in operating profitability from 2015 to 2017 is attributable to favorable net cost/expense and volume variances that exceeded an unfavorable price variance (that is, costs and expenses decreased more than prices, and volume increased). The *** operating profit in January-June 2018 compared to January-June 2017 is primarily attributable to the combined effects of an unfavorable price variance, and unfavorable net cost/expense and volume variances (that is, prices and volume declined, and operating expenses increased). Table VI-3 Rubber bands: Variance analysis between 2015-2017, and January-June 2017-2018
* * * * * * *
CAPITAL EXPENDITURES AND RESEARCH AND DEVELOPMENT EXPENSES Table VI-4 presents Alliance’s capital expenditures and research and development
(“R&D”) expenses. Alliance reported a large *** in capital expenditures from 2015 to 2016 and then an *** in 2017 to similar (but lower) levels than in 2015. The firm’s R&D expenses showed a similar pattern from 2015 to 2017. Between the comparable interim periods, capital expenditures were lower, while R&D expenses were somewhat higher. Table VI-4 Rubber bands: Capital expenditures and R&D expenses of Alliance, 2015-17, January-June 2017 and January-June 2018
* * * * * * *
11 The Commission’s variance analysis is calculated in three parts: sales variance, cost of sales variance (COGS variance), and SG&A expense variance. Each part consists of a price variance (in the case of the sales variance) or a cost variance (in the case of the COGS and SG&A expense variance), and a volume variance. The sales or cost variance is calculated as the change in unit price or unit cost/expense times the new volume, while the volume variance is calculated as the change in volume times the old unit price or unit cost. Summarized at the bottom of the table, the price variance is from sales; the cost/expense variance is the sum of those items from COGS and SG&A variances, respectively; and the volume variance is the sum of the volume components of the net sales, COGS, and SG&A expense variances.
VI-5
ASSETS AND RETURN ON ASSETS Table VI-5 presents data on the U.S. producer’s total assets and return on assets
(“ROA”). Alliance’s total assets *** from 2015 to 2017, ***.12 The firm’s ROA increased from *** percent in 2015 to *** percent in 2016 and declined to *** percent in 2017. Table VI-5 Rubber bands: Total assets and ROA for Alliance, 2015-17
* * * * * * *
CAPITAL AND INVESTMENT The Commission requested U.S. producers of rubber bands to describe any actual or
potential negative effects of imports of rubber bands from China and Thailand on the firms’ growth, investment, ability to raise capital, development and production efforts, or the scale of capital investments. Table VI-6 presents Alliance’s responses in a tabulated format and table VI-7 provides Alliance’s narrative responses. Table VI-6 Rubber bands: Actual and anticipated negative effects of imports from China and Thailand on investment, growth, and development
* * * * * * * Table VI-7 Rubber bands: Alliance’s responses relating to the actual and anticipated negative effects of imports from China and Thailand on its investment, growth, and development, since January 1, 2015
* * * * * * *
12 Alliance testified that the primary reason it built an additional 20,000 square foot warehouse room was to house rubber to be used in the manufacturing of rubber bands to be sold to ***. Conference transcript, p. 27 (Risner). Alliance has stated that it ***. U.S. producer’s questionnaire, question III-15.


VII-1
PART VII: THREAT CONSIDERATIONS AND INFORMATION ON NONSUBJECT COUNTRIES
Section 771(7)(F)(i) of the Act (19 U.S.C. § 1677(7)(F)(i)) provides that— In determining whether an industry in the United States is threatened with material injury by reason of imports (or sales for importation) of the subject merchandise, the Commission shall consider, among other relevant economic factors1-- (I) if a countervailable subsidy is involved, such information as may be
presented to it by the administering authority as to the nature of the subsidy (particularly as to whether the countervailable subsidy is a subsidy described in Article 3 or 6.1 of the Subsidies Agreement), and whether imports of the subject merchandise are likely to increase,
(II) any existing unused production capacity or imminent, substantial increase in production capacity in the exporting country indicating the likelihood of substantially increased imports of the subject merchandise into the United States, taking into account the availability of other export markets to absorb any additional exports,
(III) a significant rate of increase of the volume or market penetration of imports of the subject merchandise indicating the likelihood of substantially increased imports,
(IV) whether imports of the subject merchandise are entering at prices that are likely to have a significant depressing or suppressing effect on domestic prices, and are likely to increase demand for further imports,
(V) inventories of the subject merchandise,
1 Section 771(7)(F)(ii) of the Act (19 U.S.C. § 1677(7)(F)(ii)) provides that “The Commission shall consider {these factors} . . . as a whole in making a determination of whether further dumped or subsidized imports are imminent and whether material injury by reason of imports would occur unless an order is issued or a suspension agreement is accepted under this title. The presence or absence of any factor which the Commission is required to consider . . . shall not necessarily give decisive guidance with respect to the determination. Such a determination may not be made on the basis of mere conjecture or supposition.”

VII-2
(VI) the potential for product-shifting if production facilities in the foreign country, which can be used to produce the subject merchandise, are currently being used to produce other products,
(VII) in any investigation under this title which involves imports of both a raw agricultural product (within the meaning of paragraph (4)(E)(iv)) and any product processed from such raw agricultural product, the likelihood that there will be increased imports, by reason of product shifting, if there is an affirmative determination by the Commission under section 705(b)(1) or 735(b)(1) with respect to either the raw agricultural product or the processed agricultural product (but not both),
(VIII) the actual and potential negative effects on the existing development and production efforts of the domestic industry, including efforts to develop a derivative or more advanced version of the domestic like product, and
(IX) any other demonstrable adverse trends that indicate the probability that there is likely to be material injury by reason of imports (or sale for importation) of the subject merchandise (whether or not it is actually being imported at the time).2
Information on the nature of the alleged subsidies was presented earlier in this report; information on the volume and pricing of imports of the subject merchandise is presented in Parts IV and V; and information on the effects of imports of the subject merchandise on U.S. producers’ existing development and production efforts is presented in Part VI. Information on inventories of the subject merchandise; foreign producers’ operations, including the potential for “product-shifting;” any other threat indicators, if applicable; and any dumping in third-country markets, follows.
2 Section 771(7)(F)(iii) of the Act (19 U.S.C. § 1677(7)(F)(iii)) further provides that, in antidumping investigations, “. . . the Commission shall consider whether dumping in the markets of foreign countries (as evidenced by dumping findings or antidumping remedies in other WTO member markets against the same class or kind of merchandise manufactured or exported by the same party as under investigation) suggests a threat of material injury to the domestic industry.”

VII-3
THE INDUSTRY IN CHINA The Commission issued foreign producers’ or exporters’ questionnaires to 44 firms
believed to produce and/or export rubber bands from China.3 The Commission did not receive any usable responses to its questionnaire.4 5
China is the world’s largest consumer of natural rubber, the largest producer and consumer of synthetic rubber, and the largest producer of tires, which is estimated to account for some 77 percent of total domestic consumption of natural and synthetic rubber.6 China’s current domestic consumption of natural rubber approximates 5.5 million short tons, and with annual production of only about 1.0 million tons it experiences a shortfall of some 4.5 million tons which is imported from the southeastern Asian countries of Thailand, Indonesia, Vietnam, and Malaysia. In comparison, U.S. consumption of natural rubber is about 1.0 million tons, all imported.7
Synthetic rubber consumed from domestic production of all types in China, including thermoplastic and silicon elastomers, was a little over 3.0 million tons, with total domestic consumption, including imports, of about 4.5 million tons. In comparison, U.S. synthetic rubber consumed from domestic production was about 1.3 million tons, and total domestic consumption 2.0 million tons.8
Lanxi Wangxing Plastic Co., Ltd, Zhejiang, China, a manufacturer and trading company, reported peak annual production of 8,000 metric tons (18 million pounds), consisting of various natural and synthetic rubber bands, thermoplastic polyurethane (TPU) bands, packaging series (Mail and Ship, Janitorial, Printing and Publishing, Manufacturing, and Food Processing), rubber band balls, printed rubber bands, and customized rubber bands. Export destinations were reported as Mideast (25 percent); domestic market (20 percent); Africa (15 percent); Eastern Europe (15% percent; Western Europe (10 percent); and North America (10 percent).9
Zhangzhou Best Clothing Co., Ltd., Dianzaixu, Punan Town, Xiangcheng, Fujian, China, manufactures and exports various hair ornaments, including elastic hair products. Its annual
3 These firms were identified through a review of information submitted in the petition and contained in *** records.
4 Although one response was received from Advantus Corporation during the preliminary phase, Advantus ***. Email from ***, September 7, 2018.
5 Staff made multiple attempts to obtain responses from firms in China, including outreach through the Embassy of the People’s Republic of China.
6 “Global and China Natural Rubber Industry Report, 2017-2021,” https://www.reportlinker.com/p04126832/Global-and-China-Natural-Rubber-Industry-Re, accessed October 19, 2018; “Elastomers Overview,” ***, January 2018.
7 “Rubber, Natural,” ***, April 13, 2017. 8 “Elastomers Overview,” *** January 2018. 9 Lanxi Wangxing Plastic Co., Ltd,
https://cnwangxing.en.alibaba.com/company_profile.html?spm=a2700.icbuShop.coowfd0, accessed October 21, 2018; reported as producer in *** Importers’ Questionnaire.

VII-4
exports exceed $20 million. It employs 500 skilled workers, 20 R&D specialists, and more than 30 quality control inspectors. The firm is reportedly mainly focused on supplying One Dollar Stores outside of Chine including One Dollar Overseas Stores, discount stores, department stores and other grocery chains. It is ISO certified.10
U.S. importers reported importing rubber bands from the following producers in China: Lanxi Wangxing Plastic Co. Ltd., L and K Int'l Co. Ltd., Longwell Plastic & Metal Products, Ningbo Senior Stationery Co. Ltd., Ningbo Syloon Imp. & Exp. Co. Ltd., Ningbo Hi-Tech Zone Syloon, Realming Hair Accessories Co., Wellsco International Group Co. Ltd., and Zhejiang Cuicao Rubber Products.
Table VII-1 presents information on global exports of articles of vulcanized rubber from China.
10 Zhangzhou Best Clothing Co. website, http://www.bt0596.com/about/?135.html, accessed October 21, 2018; reported as a producer in *** Importers’ Questionnaire.
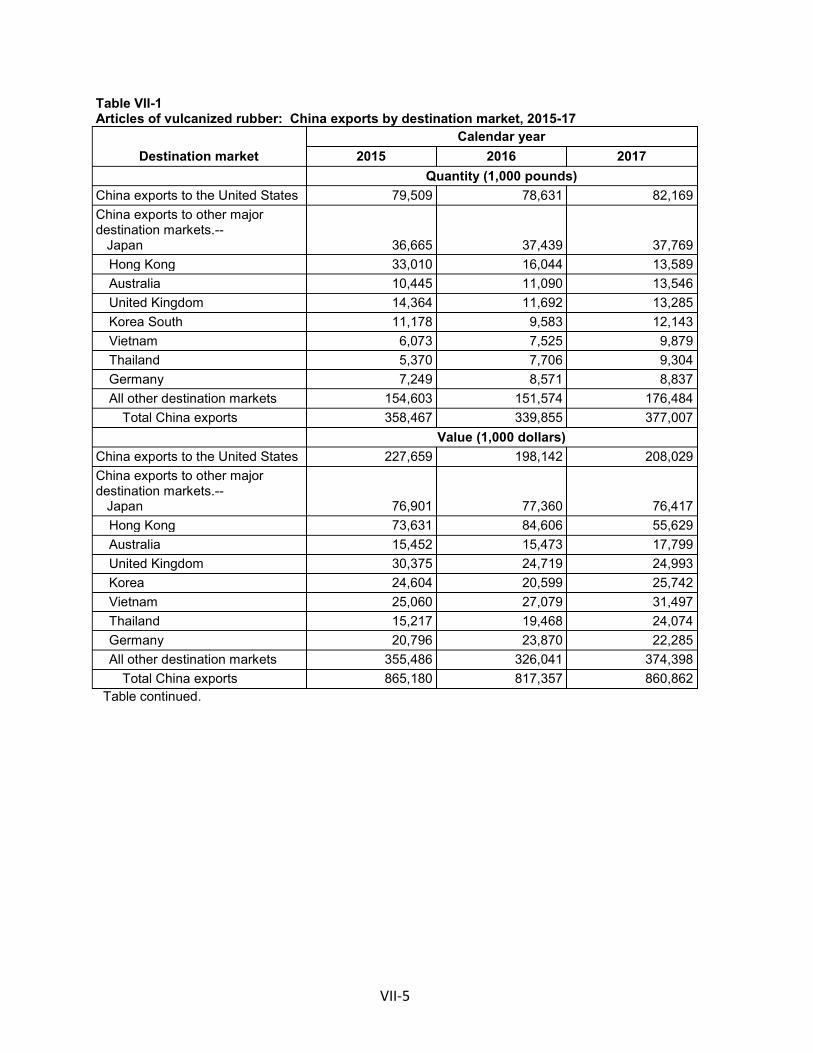
VII-5
Table VII-1 Articles of vulcanized rubber: China exports by destination market, 2015-17
Destination market Calendar year
2015 2016 2017 Quantity (1,000 pounds) China exports to the United States 79,509 78,631 82,169 China exports to other major destination markets.-- Japan 36,665 37,439 37,769
Hong Kong 33,010 16,044 13,589 Australia 10,445 11,090 13,546 United Kingdom 14,364 11,692 13,285 Korea South 11,178 9,583 12,143 Vietnam 6,073 7,525 9,879 Thailand 5,370 7,706 9,304 Germany 7,249 8,571 8,837 All other destination markets 154,603 151,574 176,484
Total China exports 358,467 339,855 377,007 Value (1,000 dollars) China exports to the United States 227,659 198,142 208,029 China exports to other major destination markets.-- Japan 76,901 77,360 76,417
Hong Kong 73,631 84,606 55,629 Australia 15,452 15,473 17,799 United Kingdom 30,375 24,719 24,993 Korea 24,604 20,599 25,742 Vietnam 25,060 27,079 31,497 Thailand 15,217 19,468 24,074 Germany 20,796 23,870 22,285 All other destination markets 355,486 326,041 374,398
Total China exports 865,180 817,357 860,862 Table continued.
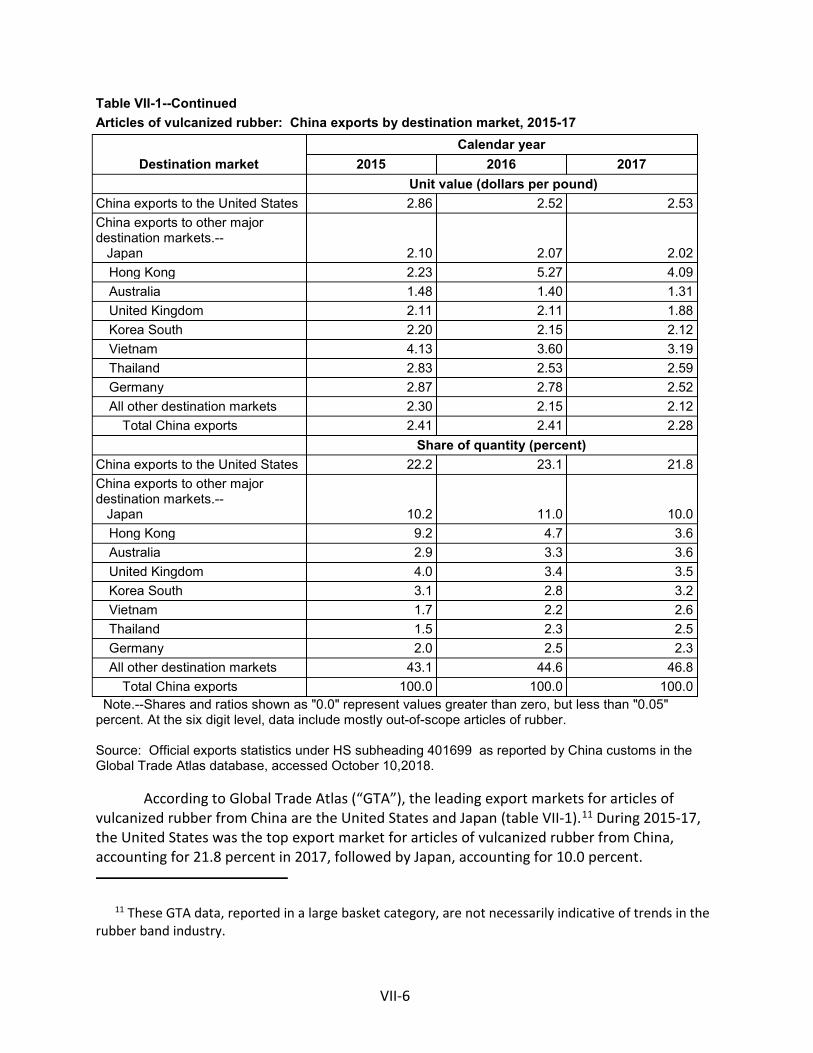
VII-6
Table VII-1--Continued Articles of vulcanized rubber: China exports by destination market, 2015-17
Destination market Calendar year
2015 2016 2017 Unit value (dollars per pound) China exports to the United States 2.86 2.52 2.53 China exports to other major destination markets.-- Japan 2.10 2.07 2.02
Hong Kong 2.23 5.27 4.09 Australia 1.48 1.40 1.31 United Kingdom 2.11 2.11 1.88 Korea South 2.20 2.15 2.12 Vietnam 4.13 3.60 3.19 Thailand 2.83 2.53 2.59 Germany 2.87 2.78 2.52 All other destination markets 2.30 2.15 2.12
Total China exports 2.41 2.41 2.28 Share of quantity (percent) China exports to the United States 22.2 23.1 21.8 China exports to other major destination markets.-- Japan 10.2 11.0 10.0
Hong Kong 9.2 4.7 3.6 Australia 2.9 3.3 3.6 United Kingdom 4.0 3.4 3.5 Korea South 3.1 2.8 3.2 Vietnam 1.7 2.2 2.6 Thailand 1.5 2.3 2.5 Germany 2.0 2.5 2.3 All other destination markets 43.1 44.6 46.8
Total China exports 100.0 100.0 100.0 Note.--Shares and ratios shown as "0.0" represent values greater than zero, but less than "0.05" percent. At the six digit level, data include mostly out-of-scope articles of rubber. Source: Official exports statistics under HS subheading 401699 as reported by China customs in the Global Trade Atlas database, accessed October 10,2018.
According to Global Trade Atlas (“GTA”), the leading export markets for articles of vulcanized rubber from China are the United States and Japan (table VII-1).11 During 2015-17, the United States was the top export market for articles of vulcanized rubber from China, accounting for 21.8 percent in 2017, followed by Japan, accounting for 10.0 percent.
11 These GTA data, reported in a large basket category, are not necessarily indicative of trends in the rubber band industry.

VII-7
THE INDUSTRY IN THAILAND
The Commission issued foreign producers’ or exporters’ questionnaires to 29 firms believed to produce and/or export rubber bands from Thailand.12 Usable responses to the Commission’s questionnaire were received from four firms: Liang Hah Heng (“LHH”), Progress Rubber, Srithepthai, and U. Yong. These firms’ exports to the United States accounted for *** percent all U.S. imports of rubber bands from Thailand and *** percent of subject imports from Thailand in 2017.13 According to estimates requested of the responding Thai producers, the production of rubber bands in Thailand reported in questionnaires accounts for approximately half of the overall production of rubber bands in Thailand.14 LHH’s data is excluded from this summary because their imports are currently subject to a preliminary zero antidumping margin and a de minimus counteravailable subsidy margin. Only *** reported that they produced out-of-scope products on the same equipment and machinery used to produce in-scope rubber bands. Table VII-2 presents information on the in-scope rubber band operations of the responding subject producers and exporters in Thailand. Table VII-2 Rubber bands: Summary data on subject firms in Thailand, 2017
Firm Production
(1,000 pounds)
Share of reported
production (percent)
Exports to the United States
(1,000 pounds)
Share of reported
exports to the United States
(percent) Total shipments (1,000 pounds)
Share of firm's total shipments exported to the United States
(percent) Progress *** *** *** *** *** *** Srithepthai *** *** *** *** *** *** U Yong *** *** *** *** *** ***
Total *** *** *** *** *** *** Source: Compiled from data submitted in response to Commission questionnaires.
Operations on rubber bands Capacity in Thailand remained stable in 2015 through January-June 2018, and is not
projected to change through 2019, as none of the responding producers in Thailand reported any operational or organizational change since January 1, 2015. Total capacity utilization was *** percent in 2017 and was *** percent in January-June 2018 compared with *** percent in January-June 2017. *** reported capacity utilization of *** percent in 2017, *** percentage points *** 2016, and *** reported capacity utilization rate was *** percent in 2017.
12 These firms were identified through a review of information submitted in the petition and contained in *** records.
13 Estimate based on proprietary *** data. 14 *** estimated its production to be *** percent of total rubber band production in Thailand in
2017. *** combined produced approximately *** the amount of rubber bands as ***. Staff adjusted *** estimation by *** to arrive at the share of production in Thailand reported by responding foreign producers in Thailand.

VII-8
Responding subject producers in Thailand reported producing *** pounds of rubber bands in 2017, and production in January-June 2018 was *** percent higher than in January-June 2017.
Most exports from responding subject producers in Thailand were to countries other than the United States in 2017. Exports to the United States were *** pounds or *** percent of total shipments in 2017. Exports to the United States were *** percent higher in January-June 2018 than in January-June 2017. *** reported that exports to the United States were *** percent higher than in January-June 2018 than in January-June 2017, an increase of *** pounds.
Subject producers in Thailand estimate that rubber band production in Thailand will increase by *** percent from 2017 to 2018 and *** percent from 2018 to 2019. Exports to the United States are reportedly projected to increase by *** percent from 2017 to 2018 and by *** percent from 2018 to 2019.15 Table VII-3 presents information on the rubber band operations of the responding subject producers and exporters in Thailand. Table VII-3 Rubber bands: Data on subject industry in Thailand, 2015-17, January-June 2017, January-June 2018, and projections for calendar years 2018 and 2019
* * * * * * *
Exports According to Global Trade Atlas (“GTA”), the leading export markets for articles of
vulcanized rubber from Thailand are the United States and Japan (table VII-4). During 2015-17, the United States was the top export market for articles of vulcanized rubber from Thailand, accounting for 13.4 percent in 2017, followed by Japan, accounting for 7.8 percent.
15 Staff has not received a 2018-19 estimate from *** so staff carried over *** 2018 projection into 2019.

VII-9
Table VII-4 Articles of vulcanized rubber: Thailand exports by destination market, 2015-17
Destination market Calendar year
2015 2016 2017 Quantity (1,000 pounds) Thailand exports to the United States 24,791 24,855 26,286 Thailand exports to other major destination markets.-- Japan 14,125 13,740 15,308
Malaysia 13,909 11,607 11,426 South Africa 11,427 10,171 9,858 China 3,979 5,084 9,698 Turkey 2,949 3,920 7,686 Indonesia 6,756 5,699 6,642 India 7,194 6,661 6,410 Philippines 4,906 5,751 5,894 All other destination markets 89,780 91,298 97,394
Total Thailand exports 179,815 178,785 196,603 Value (1,000 dollars) Thailand exports to the United States 47,190 45,900 47,493 Thailand exports to other major destination markets.-- Japan 69,218 67,898 70,039
Malaysia 58,096 44,192 46,822 South Africa 42,937 37,170 36,307 China 19,297 27,841 41,877 Turkey 4,229 6,582 18,747 Indonesia 30,434 27,042 33,411 India 20,029 21,984 19,931 Philippines 14,969 17,579 18,782 All other destination markets 206,235 221,863 256,995
Total Thailand exports 512,632 518,051 590,404 Table continued.

VII-10
Table VII-4--Continued Articles of vulcanized rubber: Thailand exports by destination market, 2015-17
Destination market Calendar year
2015 2016 2017 Unit value (dollars per pound) Thailand exports to the United States 1.90 1.85 1.81 Thailand exports to other major destination markets.-- Japan 4.90 4.94 4.58
Malaysia 4.18 3.81 4.10 South Africa 3.76 3.65 3.68 China 4.85 5.48 4.32 Turkey 1.43 1.68 2.44 Indonesia 4.50 4.75 5.03 India 2.78 3.30 3.11 Philippines 3.05 3.06 3.19 All other destination markets 2.30 2.43 2.64
Total Thailand exports 2.85 2.90 3.00 Share of quantity (percent) Thailand exports to the United States 13.8 13.9 13.4 Thailand exports to other major destination markets.-- Japan 7.9 7.7 7.8
Malaysia 7.7 6.5 5.8 South Africa 6.4 5.7 5.0 China 2.2 2.8 4.9 Turkey 1.6 2.2 3.9 Indonesia 3.8 3.2 3.4 India 4.0 3.7 3.3 Philippines 2.7 3.2 3.0 All other destination markets 49.9 51.1 49.5
Total Thailand exports 100.0 100.0 100.0 Note.--Shares and ratios shown as "0.0" represent values greater than zero, but less than "0.05" percent. At the six digit level, data include mostly out-of-scope articles of rubber. Source: Official exports statistics under HS subheading 401699 as reported by Thai Customs Department in the Global Trade Atlas database, accessed October 10,2018.
U.S. INVENTORIES OF IMPORTED MERCHANDISE Table VII-5 presents data on U.S. importers’ reported inventories of subject rubber
bands since 2015. U.S. importers reported end-of-period inventories of *** pounds of rubber bands from China, and *** pounds of subject rubber bands from Thailand in 2017.16 Subject rubber band imports from Thailand accounted for *** percent of all U.S. inventories of imported rubber bands during 2017. Inventories from subject sources increased from 2015 to 2017 by *** percent. Inventories increased by *** percent from 2016 to 2017 after decreasing
16 Respondent Schermerhorn reported investing in “large inventories” of rubber bands to meet customer orders. Conference transcript, p. 116 (Jordan).
VII-11
by *** percent from 2015 to 2016. Inventories were *** percent higher in January-June 2018 than in January-June 2017. Inventories from subject sources as a share of imports, U.S. shipments, and total shipments ranged from *** percent to *** percent during 2015-17. Table VII-5 Rubber bands: U.S. importers' end-of-period inventories of imports by source, 2015-17, January-June 2017, and January to June 2018
* * * * * * *
U.S. IMPORTERS’ OUTSTANDING ORDERS The Commission requested importers to indicate whether they imported or arranged for
the importation of rubber bands from China and Thailand during 2018-2019. Table VII-6 presents data on arranged imports. The majority (*** percent) of arranged subject imports from July 2018 through June 2019 are sourced from Thailand. Table VII-6 Rubber bands: Arranged imports, July 2018 through June 2019
* * * * * * *
ANTIDUMPING OR COUNTERVAILING DUTY ORDERS IN THIRD-COUNTRY MARKETS There are no known trade remedy actions on rubber bands in third-country markets.
None of the foreign producers provided information on any antidumping or countervailing duty orders in third country markets in their questionnaire responses. The petitioner noted that it is not aware of any trade remedy actions on rubber bands.17
17 Conference transcript, p. 44 (Goldberg).


A-1
APPENDIX A
FEDERAL REGISTER NOTICES


A-3
The Commission makes available notices relevant to its investigations and reviews on its website, www.usitc.gov. In addition, the following tabulation presents, in chronological order, Federal Register notices issued by the Commission and Commerce during the current proceeding.
Citation Title Link 83 FR 5143 January 30, 2018
Rubber Bands From China, Sri Lanka, and Thailand; Institution of Antidumping and Countervailing Duty Investigations and Scheduling of Preliminary Phase Investigations
https://www.gpo.gov/fdsys/pkg/FR-2018-02-05/pdf/2018-02176.pdf
83 FR 8424 February 20, 2018
Rubber Bands From the People's Republic of China, Sri Lanka, and Thailand: Initiation of Less-Than-Fair-Value Investigations
https://www.gpo.gov/fdsys/pkg/FR-2018-02-27/pdf/2018-03923.pdf
83 FR 8429 February 20, 2018
Rubber Bands From Thailand, the People's Republic of China, and Sri Lanka: Initiation of Countervailing Duty Investigations
https://www.gpo.gov/fdsys/pkg/FR-2018-02-27/pdf/2018-03922.pdf
83 FR 12594 March 22, 2018
Rubber Bands From China, Sri Lanka, and Thailand; Determinations
https://www.gpo.gov/fdsys/pkg/FR-2018-03-22/pdf/2018-05834.pdf
83 FR 29748 June 26, 2018
Rubber Bands From The People's Republic Of China and Thailand: Postponement Of Preliminary Determinations In The Less-Than-Fair-Value Investigations
https://www.gpo.gov/fdsys/pkg/FR-2018-06-26/pdf/2018-13672.pdf
83 FR 31729 July 7, 2018
Rubber Bands From The People's Republic Of China: Preliminary Affirmative Countervailing Duty Determination and Alignment Of Final Determination With Final Antidumping Determination
https://www.gpo.gov/fdsys/pkg/FR-2018-07-09/pdf/2018-14633.pdf
83 FR 31728 July 7, 2018
Rubber Bands From Thailand: Preliminary Negative Countervailing Duty Determination and Alignment Of Final Determination With Final Antidumping Duty Determination
https://www.gpo.gov/fdsys/pkg/FR-2018-07-09/pdf/2018-14634.pdf
83 FR 45217 September 6, 2018
Rubber Bands From The People's Republic Of China: Preliminary Affirmative Determination Of Critical Circumstances, In Part, In The Countervailing Duty Investigation, and Amendment To The Scope Of The Preliminary Determination In The Countervailing Duty Investigation
https://www.gpo.gov/fdsys/pkg/FR-2018-09-06/pdf/2018-19335.pdf
A-4
Citation Title Link 83 FR 45213 September 6, 2018
Less-Than-Fair-Value Investigation Of Rubber Bands From The People's Republic Of China: Preliminary Affirmative Determination Of Sales At Less Than Fair Value and Preliminary Affirmative Determination Of Critical Circumstances
https://www.gpo.gov/fdsys/pkg/FR-2018-09-06/pdf/2018-19333.pdf
83 FR 45220 September 6, 2018
Rubber Bands From Thailand: Preliminary Affirmative Determination Of Sales At Less Than Fair Value, Postponement Of Final Determination, and Extension Of Provisional Measures
https://www.gpo.gov/fdsys/pkg/FR-2018-09-06/pdf/2018-19332.pdf
83 FR 46969 September 17, 2018
Rubber Bands From China And Thailand; Scheduling Of The Final Phase Of Countervailing Duty and Anti-Dumping Duty Investigations
https://www.gpo.gov/fdsys/pkg/FR-2018-09-17/pdf/2018-20086.pdf
83 FR 58538 November 20, 2018
Rubber Bands From the People's Republic of China: Final Affirmative Countervailing Duty Determination
https://www.gpo.gov/fdsys/pkg/FR-2018-11-20/pdf/2018-25296.pdf
83 FR 58547 November 20, 2018
Rubber Bands From the People's Republic of China: Final Determination of Sales at Less Than Fair Value
https://www.gpo.gov/fdsys/pkg/FR-2018-11-20/pdf/2018-25294.pdf

B-1
APPENDIX B
HEARING WITNESSES


CALENDAR OF PUBLIC HEARING
Those listed below appeared as witnesses at the United States International Trade Commission's hearing:
Subject: Rubber Bands from China and Thailand
Inv. Nos.:
Date and Time:
701-T A-598 and 600 and 731-T A-1408 and 1410 (Final)
November 13, 2018 - 9:30 a.m.
Sessions were held in connection with these investigations in the Main Hearing Room (Room IOI). 500 E Street, SW., Washington, DC.
OPENING REMARKS:
Petitioner (Roy Goldberg, Stinson Leonard Street LLP)
In Support of the Imposition or Antidumping and Countervailing Duty Orders;
Stinson Leonard Street LLP Washington, DC on behalf of
Alliance Rubber Co.
Bonnie Swayze. President, Alliance Rubber Co.
Jason Risner, Director of Business Strategy, Alliance Rubber Co.
Roy Goldberg
DenyseZosa
INTERESTED PARTY IN OPPOSITION:
Encore Packages, LLC Vernon Hills. IL
Timothy Nelson. Principal, Encore Packaging
REBUITAUCLOSING REMARKS:
Petitioner (Roy Goldberg. Stinson Leonard Street LLP)
-END-
) ) - OF COUNSEL )


C-1
APPENDIX C
SUMMARY DATA

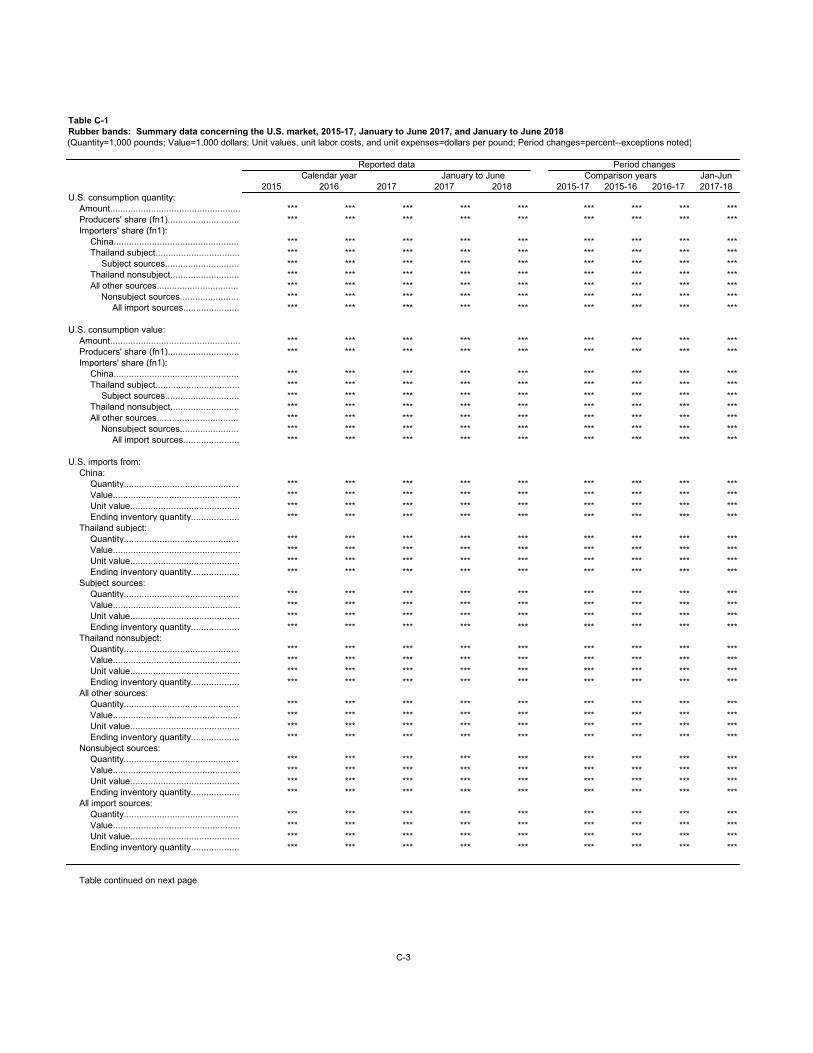
Table C-1Rubber bands: Summary data concerning the U.S. market, 2015-17, January to June 2017, and January to June 2018
Jan-Jun2015 2016 2017 2017 2018 2015-17 2015-16 2016-17 2017-18
U.S. consumption quantity:Amount................................................... *** *** *** *** *** *** *** *** ***Producers' share (fn1)............................ *** *** *** *** *** *** *** *** ***Importers' share (fn1):
China................................................. *** *** *** *** *** *** *** *** ***Thailand subject................................. *** *** *** *** *** *** *** *** ***
Subject sources............................. *** *** *** *** *** *** *** *** ***Thailand nonsubject........................... *** *** *** *** *** *** *** *** ***All other sources................................ *** *** *** *** *** *** *** *** ***
Nonsubject sources....................... *** *** *** *** *** *** *** *** ***All import sources...................... *** *** *** *** *** *** *** *** ***
U.S. consumption value:Amount................................................... *** *** *** *** *** *** *** *** ***Producers' share (fn1)............................ *** *** *** *** *** *** *** *** ***Importers' share (fn1):
China................................................. *** *** *** *** *** *** *** *** ***Thailand subject................................. *** *** *** *** *** *** *** *** ***
Subject sources............................. *** *** *** *** *** *** *** *** ***Thailand nonsubject........................... *** *** *** *** *** *** *** *** ***All other sources................................ *** *** *** *** *** *** *** *** ***
Nonsubject sources....................... *** *** *** *** *** *** *** *** ***All import sources...................... *** *** *** *** *** *** *** *** ***
U.S. imports from:China:
Quantity............................................. *** *** *** *** *** *** *** *** ***Value.................................................. *** *** *** *** *** *** *** *** ***Unit value........................................... *** *** *** *** *** *** *** *** ***Ending inventory quantity................... *** *** *** *** *** *** *** *** ***
Thailand subject:Quantity............................................. *** *** *** *** *** *** *** *** ***Value.................................................. *** *** *** *** *** *** *** *** ***Unit value........................................... *** *** *** *** *** *** *** *** ***Ending inventory quantity................... *** *** *** *** *** *** *** *** ***
Subject sources:Quantity............................................. *** *** *** *** *** *** *** *** ***Value.................................................. *** *** *** *** *** *** *** *** ***Unit value........................................... *** *** *** *** *** *** *** *** ***Ending inventory quantity................... *** *** *** *** *** *** *** *** ***
Thailand nonsubject:Quantity............................................. *** *** *** *** *** *** *** *** ***Value.................................................. *** *** *** *** *** *** *** *** ***Unit value........................................... *** *** *** *** *** *** *** *** ***Ending inventory quantity................... *** *** *** *** *** *** *** *** ***
All other sources:Quantity............................................. *** *** *** *** *** *** *** *** ***Value.................................................. *** *** *** *** *** *** *** *** ***Unit value........................................... *** *** *** *** *** *** *** *** ***Ending inventory quantity................... *** *** *** *** *** *** *** *** ***
Nonsubject sources:Quantity............................................. *** *** *** *** *** *** *** *** ***Value.................................................. *** *** *** *** *** *** *** *** ***Unit value........................................... *** *** *** *** *** *** *** *** ***Ending inventory quantity................... *** *** *** *** *** *** *** *** ***
All import sources:Quantity............................................. *** *** *** *** *** *** *** *** ***Value.................................................. *** *** *** *** *** *** *** *** ***Unit value........................................... *** *** *** *** *** *** *** *** ***Ending inventory quantity................... *** *** *** *** *** *** *** *** ***
Table continued on next page
(Quantity=1,000 pounds; Value=1,000 dollars; Unit values, unit labor costs, and unit expenses=dollars per pound; Period changes=percent--exceptions noted)
Reported data Period changesCalendar year January to June Comparison years
C-3

Table C-1--ContinuedRubber bands: Summary data concerning the U.S. market, 2015-17, January to June 2017, and January to June 2018
Jan-Jun2015 2016 2017 2017 2018 2015-17 2015-16 2016-17 2017-18
U.S. producers':Average capacity quantity....................... *** *** *** *** *** *** *** *** ***Production quantity................................. *** *** *** *** *** *** *** *** ***Capacity utilization (fn1)......................... *** *** *** *** *** *** *** *** ***U.S. shipments:
Quantity............................................. *** *** *** *** *** *** *** *** ***Value.................................................. *** *** *** *** *** *** *** *** ***Unit value........................................... *** *** *** *** *** *** *** *** ***
Export shipments:Quantity............................................. *** *** *** *** *** *** *** *** ***Value.................................................. *** *** *** *** *** *** *** *** ***Unit value........................................... *** *** *** *** *** *** *** *** ***
Ending inventory quantity....................... *** *** *** *** *** *** *** *** ***Inventories/total shipments (fn1)............. *** *** *** *** *** *** *** *** ***Production workers................................. *** *** *** *** *** *** *** *** ***Hours worked (1,000s)........................... *** *** *** *** *** *** *** *** ***Wages paid ($1,000).............................. *** *** *** *** *** *** *** *** ***Hourly wages (dollars per hour).............. *** *** *** *** *** *** *** *** ***Productivity (pounds per hour)................ *** *** *** *** *** *** *** *** ***Unit labor costs....................................... *** *** *** *** *** *** *** *** ***Net sales:
Quantity............................................. *** *** *** *** *** *** *** *** ***Value.................................................. *** *** *** *** *** *** *** *** ***Unit value........................................... *** *** *** *** *** *** *** *** ***
Cost of goods sold (COGS).................... *** *** *** *** *** *** *** *** ***Gross profit or (loss)............................... *** *** *** *** *** *** *** *** ***SG&A expenses..................................... *** *** *** *** *** *** *** *** ***Operating income or (loss)..................... *** *** *** *** *** *** *** *** ***Net income or (loss)............................... *** *** *** *** *** *** *** *** ***Capital expenditures............................... *** *** *** *** *** *** *** *** ***Unit COGS............................................. *** *** *** *** *** *** *** *** ***Unit SG&A expenses.............................. *** *** *** *** *** *** *** *** ***Unit operating income or (loss)............... *** *** *** *** *** *** *** *** ***Unit net income or (loss)......................... *** *** *** *** *** *** *** *** ***COGS/sales (fn1)................................... *** *** *** *** *** *** *** *** ***Operating income or (loss)/sales (fn1).... *** *** *** *** *** *** *** *** ***Net income or (loss)/sales (fn1).............. *** *** *** *** *** *** *** *** ***
Notes:
fn1.--Reported data are in percent and period changes are in percentage points.fn2.--Undefined.
Source: Compiled from data submitted in response to Commission questionnaires.
C-4
(Quantity=1,000 pounds; Value=1,000 dollars; Unit values, unit labor costs, and unit expenses=dollars per pound; Period changes=percent--exceptions noted)
Reported data Period changesCalendar year January to June Comparison years

APPENDIX D
DATA ON THAILAND-LHH
D-1


Appendix D-1
2015 2016 2017 2017 2018 2018 2019
Capacity *** *** *** *** *** *** ***Production *** *** *** *** *** *** ***End-of-period inventories *** *** *** *** *** *** ***Shipments: Home market shipments: Internal consumption/ transfers *** *** *** *** *** *** ***
Commercial home market shipments *** *** *** *** *** *** ***Total home market shipments *** *** *** *** *** *** ***
Export shipments to: United States *** *** *** *** *** *** ***
All other markets *** *** *** *** *** *** ***Total exports *** *** *** *** *** *** ***
Total shipments *** *** *** *** *** *** ***
Capacity utilization *** *** *** *** *** *** ***Inventories/production *** *** *** *** *** *** ***Inventories/total shipments *** *** *** *** *** *** ***Share of shipments: Home market shipments: Internal consumption/ transfers *** *** *** *** *** *** ***
Commercial home market shipments *** *** *** *** *** *** ***Total home market shipments *** *** *** *** *** *** ***
Export shipments to: United States *** *** *** *** *** *** ***
All other markets *** *** *** *** *** *** ***Total exports *** *** *** *** *** *** ***
Total shipments *** *** *** *** *** *** ***
Note.--Shares and ratios shown as "0.0" represent values greater than zero, but less than "0.05" percent.
Source: Compiled from data submitted in response to Commission questionnaires.
Rubber bands: Data on Nonsubject foreign industry, 2015-17, January to June 2017, and January to June 2018 and projection calendar years 2018 and 2019
Quantity (1,000 pounds)
Ratios and shares (percent)
Item
Actual experience ProjectionsCalendar year January to June Calendar year


![Index [] · Englischer Index Assortments of 12 birthstones ... Imitation stones, white .....82 India rubber bands](https://img.pdfslide.net/doc/110x75/5ac10d8f7f8b9ad73f8c7d46/index-index-assortments-of-12-birthstones-imitation-stones-white-82.jpg)