Embed Size (px)
Citation preview
Ruby pressure scale in a low-temperature diamond anvil cellHitoshi Yamaoka, Yumiko Zekko, Ignace Jarrige, Jung-Fu Lin, Nozomu Hiraoka et al. Citation: J. Appl. Phys. 112, 124503 (2012); doi: 10.1063/1.4769305 View online: http://dx.doi.org/10.1063/1.4769305 View Table of Contents: http://jap.aip.org/resource/1/JAPIAU/v112/i12 Published by the American Institute of Physics. Related ArticlesBX90: A new diamond anvil cell design for X-ray diffraction and optical measurements Rev. Sci. Instrum. 83, 125102 (2012) Oxy-acetylene driven laboratory scale shock tubes for studying blast wave effects Rev. Sci. Instrum. 83, 045111 (2012) Pressure distribution in a quasi-hydrostatic pressure medium: A finite element analysis J. Appl. Phys. 110, 113523 (2011) Multipurpose high-pressure high-temperature diamond-anvil cell with a novel high-precision guiding system anda dual-mode pressurization device Rev. Sci. Instrum. 82, 095108 (2011) A high temperature high pressure cell for quasielastic neutron scattering Rev. Sci. Instrum. 82, 083903 (2011) Additional information on J. Appl. Phys.Journal Homepage: http://jap.aip.org/ Journal Information: http://jap.aip.org/about/about_the_journal Top downloads: http://jap.aip.org/features/most_downloaded Information for Authors: http://jap.aip.org/authors
Ruby pressure scale in a low-temperature diamond anvil cell
Hitoshi Yamaoka,1 Yumiko Zekko,2 Ignace Jarrige,3 Jung-Fu Lin,4 Nozomu Hiraoka,5
Hirofumi Ishii,5 Ku-Ding Tsuei,5 and Jun’ichiro Mizuki2,6
1Harima Institute, RIKEN (The Institute of Physical and Chemical Research), Sayo, Hyogo 679-5148, Japan2Graduate School of Science and Technology, Kwansei Gakuin University, Sanda, Hyogo 669-1337, Japan3National Synchrotron Light Source II, Brookhaven National Laboratory, Upton, New York 11973, USA4Department of Geological Sciences, The University of Texas at Austin, Austin, Texas 78712, USA5National Synchrotron Radiation Research Center, Hsinchu 30076, Taiwan6Japan Atomic Energy Agency, SPring-8, Sayo, Hyogo 679-5148, Japan
(Received 1 August 2012; accepted 12 November 2012; published online 17 December 2012)
Laser-excited N and R fluorescence lines of heavily doped ruby have been studied up to 26 GPa at
low temperatures. While the intensity of the R lines at ambient pressure significantly decreases with
decreasing temperature, the intensity of N lines originating from exchange-coupled Cr ion pairs is
enhanced at low temperatures. The pressure induced wavelength shift of the N lines at 19 K is well
fitted with an empirical formula similar to the equation for the R1 line, showing that the intense Nline could be used as an alternative pressure scale at low temperatures. We also observe continuous
increase in non-hydrostaticity with increasing pressure at low temperatures when silicone oil and 4:1
mixture of methanol and ethanol are used as pressure media. VC 2012 American Institute of Physics.
[http://dx.doi.org/10.1063/1.4769305]
I. INTRODUCTION
Application of external hydrostatic pressure has gained
increasing interest in physics over the past few decades as
a clean and efficient way to change the density of materials.
In semiconductor physics, many experiments under high-
pressure and low-temperature conditions have been per-
formed.1,2 In strongly correlated systems low temperature
conditions are usually given more attention due to the occur-
rence of a number of highly interesting physical properties,
including superconductivity and quantum critical behavior.3
Because pressure can have dramatic effects on these low-
temperature properties, the combination of high-pressure and
low-temperature conditions is central to condensed matter
physics.
Of particular importance to a high-pressure experiment
is the reliability of a pressure gauge used. Laser-induced
ruby fluorescence R1 line has most commonly been used as a
pressure gauge for pressure determinations up to Mbar
range.4–11 The R1 and R2 fluorescence lines (694.2 and
692.81 nm, respectively) are separated by a crystal field split-
ting of the 2E level of the Cr3þ ions in a corundum (Al2O3)
lattice. Utilization of linear red shift of the ruby fluorescence
R1 line (2Eg ! 4A2g emission following 4A2g! 4T2g or4T1g excitation) as a function of pressure to 2.3 GPa was first
showed by Forman et al.4 Mao et al. introduced a nonlinear
calibration at higher pressures.8,9 Temperature-dependent
fluorescence shift had been measured for the R lines.11–21
These studies reported the shift, splitting, and width of the
R1 and R2 lines as a function of temperature. Only small
changes in both the shift and the line width were reported at
T < 100 K.12,14,17,21 In contrast, the intensity ratio of the two
R lines has been suggested as a potential thermometer over
the range 10–100 K.15 However, very few studies have been
carried out to examine the pressure-induced shift of the Rlines at low temperatures above 10 GPa.20,22 The shift of the
R1 lines has been calibrated using NaCl pressure scale up to
22 GPa and temperatures at 10 and 77 K.22 Slight deviations
of the R1 shift from the calibrated function at room tempera-
ture (RT)8,11 were also reported at 4.5 K.20
It has been shown that increasing Cr-doping level in the
ruby enhances not only the intensity of the R lines but also that
of the two N lines,23–26 which are attributed to the second (N1,4A1) and fourth (N2, 3A2) nearest neighbor pairs of the Cr3þ
ions.26 These N lines originate from the exchange coupled
pairs of the Cr3þ ions. The colors of the ruby are, respectively,
colorless, pink-like, red-like, and grey in visible light for the
Cr-concentration of much less than 0.1%, about 0.1%, about
1%, and more than 5%. The temperature-dependent N-line
spectra were also investigated, showing a similar trend for the
R lines except for the intensity.26–29 While the intensity of the
R lines was significantly reduced by a few orders of magni-
tudes,29,30 the N lines were found to gain intensity at low tem-
peratures.26,27 With the Cr3þ concentration below 0.1% only
two R lines from isolated Cr3þ ions were observed. The N-line
intensity increases with the Cr-doping concentration, although
not linearly, reflecting both the increase of the formation prob-
ability of paired ions and the energy transfer from single ions
to paired ions. Increasing the Cr-concentration above 1%
causes a broad-band emission as a result of the formation of
the Cr3þ ion clusters.
To date, the pressure dependence of the N lines at low
temperatures has not been reported. Furthermore, only a few
quantitative studies have been reported on the hydrostaticity
of the pressure mediums at low temperatures.31,32 In this pa-
per, we study the temperature and pressure dependences of
the N spectrum of heavily doped ruby, along with the R lines
for comparison, at 19 and 65 K and pressures up to 26 GPa.
0021-8979/2012/112(12)/124503/5/$30.00 VC 2012 American Institute of Physics112, 124503-1
JOURNAL OF APPLIED PHYSICS 112, 124503 (2012)
Our results show that the intensity of the N lines is much
higher than that of the R1 line and shifts with pressure in a
similar fashion to R1 at low temperatures. This indicates that
the N line could be used as a reliable alternative secondary
pressure scale in the low-temperature high-pressure range
where the R1 line is too weak to be properly detected. At low
temperatures, we observed non-hydrostatic effects even at
ambient pressure for both silicone oil and the 4:1 methanol-
ethanol mixture, while at room temperature, these media
retain hydrostaticity up to about 10 GPa.32,33
II. EXPERIMENTS
A closed-circuit He cryostat at the beamline BL12XU of
the SPring-8 is used for the low-temperature measurements
from 300 K to 16 K.34 High-pressure conditions are achieved
using a gas-membrane controlled diamond anvil cell (DAC)
equipped with 0.4-mm culet diamonds. We use a stainless-
steel gasket with silicone oil as pressure-transmitting
medium and a Be gasket with a 4:1 mixture by volume of
methanol and ethanol in two separate experiments, respec-
tively. The diameter of the sample chamber in the gasket is
about 180 lm. Be gaskets are often used in the in-plane ge-
ometry where both incoming and outgoing x-ray beams pass
through the gasket because of the higher x-ray transmissivity
compared to higher-Z materials. We note that Be gaskets
become increasingly brittle at lower temperatures, which
limits the achievable pressures at low temperatures. Pressure
is measured using the ruby R1 lines at low temperatures. As
shown below, the intensity ratio of R1 to N1 is about 0.5 at
77 K, indicating that the weight percentage of the doped-
Cr2O3 is estimated to be on the order of 1%, corresponding
to a heavily doped case.26 A green diode laser (Laser Quan-
tum DL532–10) with a wavelength of 532 nm is used to
excite the fluorescence lines. Ruby fluorescence spectra are
measured with a spectrometer (STR500-3 Raman Imaging
Spectrometer) having a grating of 600 lines/mm; the system
is calibrated using the emission lines of a Ne lamp. The
DAC system is set in the hutch of the beamline. The fluores-
cence measurement are performed outside the hutch using
optical fibers connected to the DAC system. For the
pressure-dependent measurements, we first adjust the tem-
perature at ambient pressure and then apply the pressure
while keeping the temperature constant.
III. CALIBRATION CURVES FOR RUBY R LINE SHIFT
A number of empirical calibration curves of the R1 fluo-
rescence shift at high-pressures and temperatures have been
proposed for the ruby pressure scale:
PðGPaÞ ¼ A
B
kk0
� �B
� 1
" #at RT; (1)
PðGPaÞ ¼ 2:76DkðnmÞ at 77 K; (2)
PðGPaÞ ¼ 2:74DkðnmÞ at 10 K; (3)
PðGPaÞ ¼ A0ðGPaÞln kk0
� �at 4:5K; (4)
where k and k0 are wavelengths of the R1 line at P > 0 GPa
and P¼ 0 GPa, respectively, Dk(¼ k� k0) is the wavelength
shift, and A and B are constants. At RT, many calibration
curves have been proposed.11 Here we representatively use
Eq. (1) with A¼ 1904 and B ¼ 7:715.9 Equations (2) and (3)
were derived from ruby R1 shift using NaCl up to 22 GPa
with a nitrogen pressure medium.22 The bulk modulus of
NaCl was assumed independent of temperature in the equa-
tion of state used. Equation (4) was derived from the lattice
parameters of silver at 4.5 K in a helium pressure medium.20
A0 was estimated to be 1762 613 GPa. Calibrated pressure
as a function of the ruby R1 fluorescence shift from equations
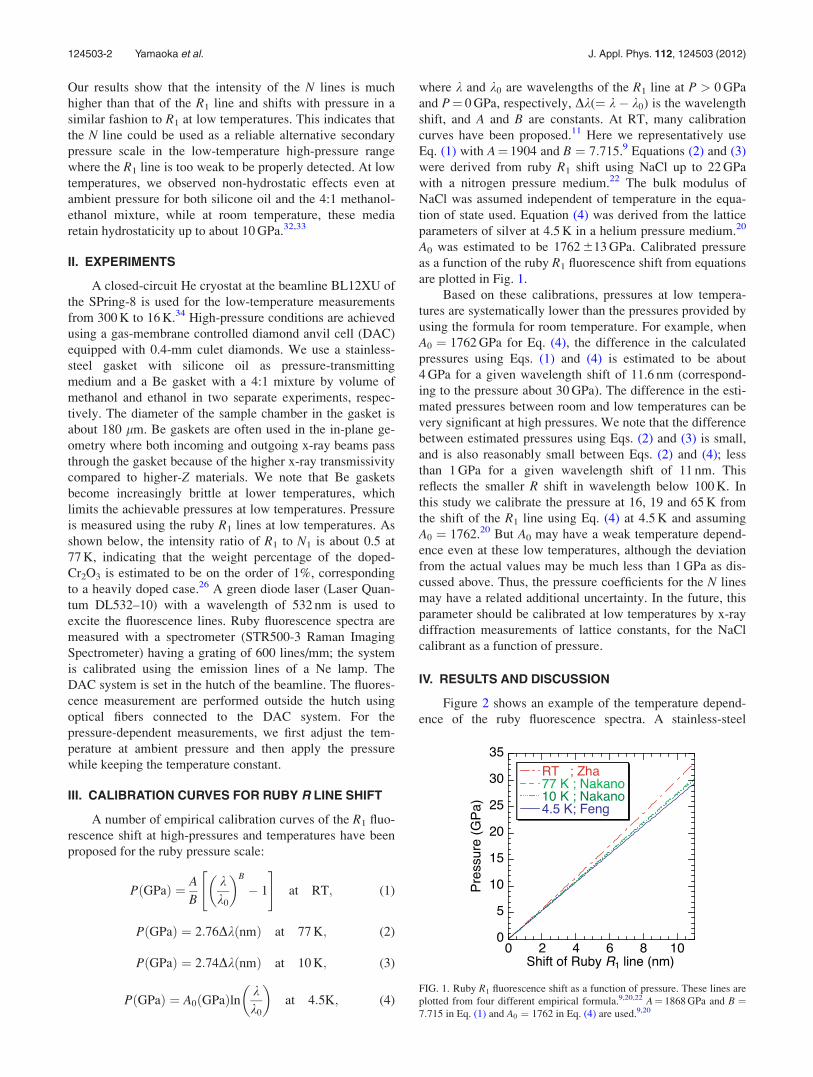
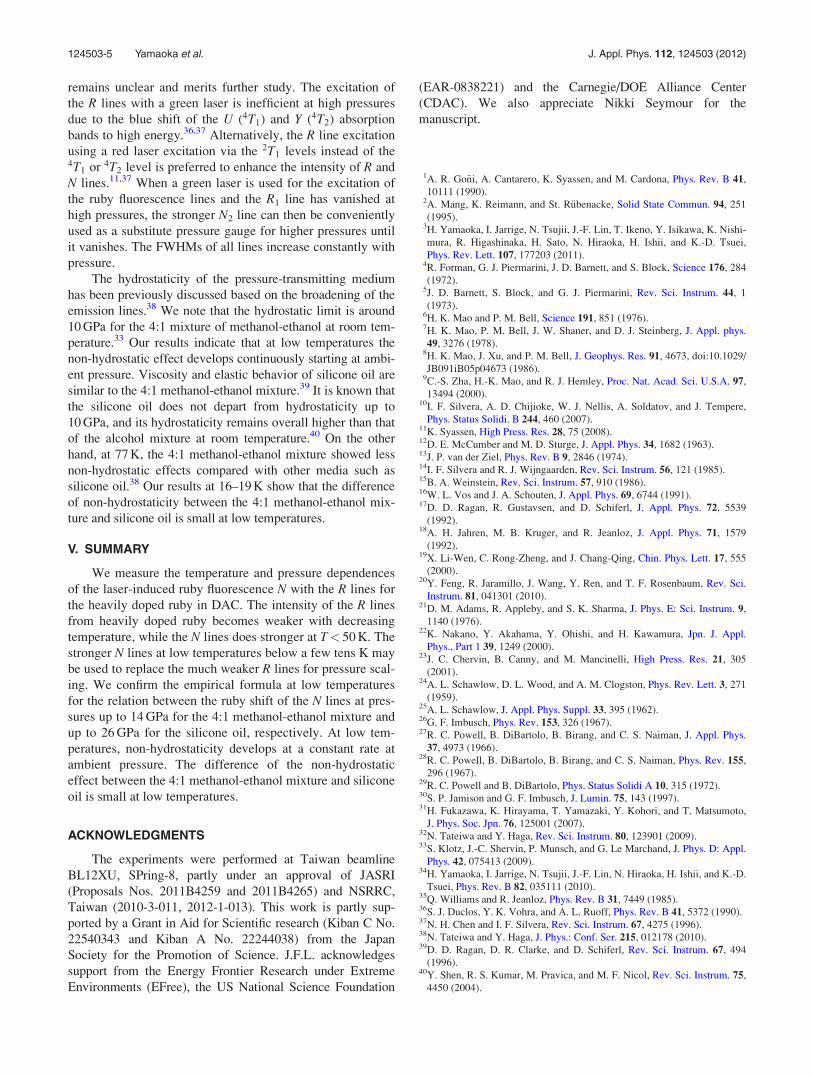
are plotted in Fig. 1.
Based on these calibrations, pressures at low tempera-
tures are systematically lower than the pressures provided by
using the formula for room temperature. For example, when
A0 ¼ 1762 GPa for Eq. (4), the difference in the calculated
pressures using Eqs. (1) and (4) is estimated to be about
4 GPa for a given wavelength shift of 11.6 nm (correspond-
ing to the pressure about 30 GPa). The difference in the esti-
mated pressures between room and low temperatures can be
very significant at high pressures. We note that the difference
between estimated pressures using Eqs. (2) and (3) is small,
and is also reasonably small between Eqs. (2) and (4); less
than 1 GPa for a given wavelength shift of 11 nm. This
reflects the smaller R shift in wavelength below 100 K. In
this study we calibrate the pressure at 16, 19 and 65 K from
the shift of the R1 line using Eq. (4) at 4.5 K and assuming
A0 ¼ 1762.20 But A0 may have a weak temperature depend-
ence even at these low temperatures, although the deviation
from the actual values may be much less than 1 GPa as dis-
cussed above. Thus, the pressure coefficients for the N lines
may have a related additional uncertainty. In the future, this
parameter should be calibrated at low temperatures by x-ray
diffraction measurements of lattice constants, for the NaCl
calibrant as a function of pressure.
IV. RESULTS AND DISCUSSION
Figure 2 shows an example of the temperature depend-
ence of the ruby fluorescence spectra. A stainless-steel
FIG. 1. Ruby R1 fluorescence shift as a function of pressure. These lines are
plotted from four different empirical formula.9,20,22 A¼ 1868 GPa and B ¼7:715 in Eq. (1) and A0 ¼ 1762 in Eq. (4) are used.9,20
124503-2 Yamaoka et al. J. Appl. Phys. 112, 124503 (2012)
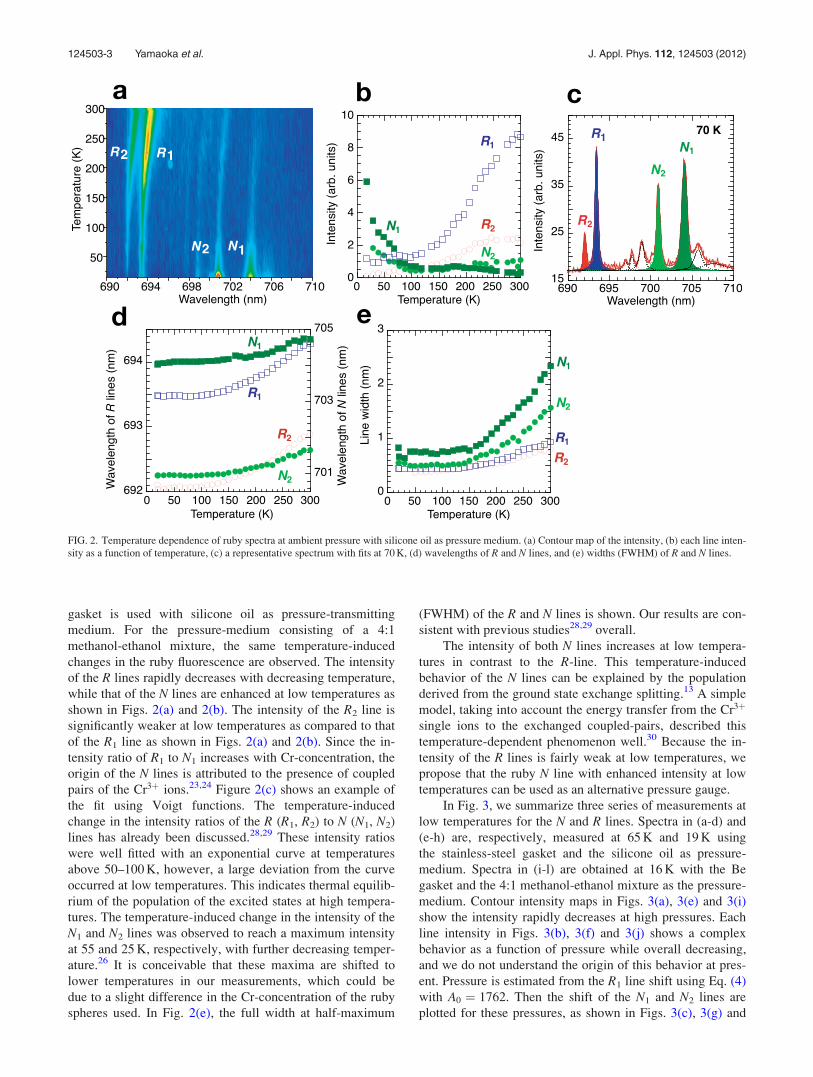
gasket is used with silicone oil as pressure-transmitting
medium. For the pressure-medium consisting of a 4:1
methanol-ethanol mixture, the same temperature-induced
changes in the ruby fluorescence are observed. The intensity
of the R lines rapidly decreases with decreasing temperature,
while that of the N lines are enhanced at low temperatures as
shown in Figs. 2(a) and 2(b). The intensity of the R2 line is
significantly weaker at low temperatures as compared to that
of the R1 line as shown in Figs. 2(a) and 2(b). Since the in-
tensity ratio of R1 to N1 increases with Cr-concentration, the
origin of the N lines is attributed to the presence of coupled
pairs of the Cr3þ ions.23,24 Figure 2(c) shows an example of
the fit using Voigt functions. The temperature-induced
change in the intensity ratios of the R (R1, R2) to N (N1, N2)
lines has already been discussed.28,29 These intensity ratios
were well fitted with an exponential curve at temperatures
above 50–100 K, however, a large deviation from the curve
occurred at low temperatures. This indicates thermal equilib-
rium of the population of the excited states at high tempera-
tures. The temperature-induced change in the intensity of the
N1 and N2 lines was observed to reach a maximum intensity
at 55 and 25 K, respectively, with further decreasing temper-
ature.26 It is conceivable that these maxima are shifted to
lower temperatures in our measurements, which could be
due to a slight difference in the Cr-concentration of the ruby
spheres used. In Fig. 2(e), the full width at half-maximum
(FWHM) of the R and N lines is shown. Our results are con-
sistent with previous studies28,29 overall.
The intensity of both N lines increases at low tempera-
tures in contrast to the R-line. This temperature-induced
behavior of the N lines can be explained by the population
derived from the ground state exchange splitting.13 A simple
model, taking into account the energy transfer from the Cr3þ
single ions to the exchanged coupled-pairs, described this
temperature-dependent phenomenon well.30 Because the in-
tensity of the R lines is fairly weak at low temperatures, we
propose that the ruby N line with enhanced intensity at low
temperatures can be used as an alternative pressure gauge.
In Fig. 3, we summarize three series of measurements at
low temperatures for the N and R lines. Spectra in (a-d) and
(e-h) are, respectively, measured at 65 K and 19 K using
the stainless-steel gasket and the silicone oil as pressure-
medium. Spectra in (i-l) are obtained at 16 K with the Be
gasket and the 4:1 methanol-ethanol mixture as the pressure-
medium. Contour intensity maps in Figs. 3(a), 3(e) and 3(i)
show the intensity rapidly decreases at high pressures. Each
line intensity in Figs. 3(b), 3(f) and 3(j) shows a complex
behavior as a function of pressure while overall decreasing,
and we do not understand the origin of this behavior at pres-
ent. Pressure is estimated from the R1 line shift using Eq. (4)
with A0 ¼ 1762. Then the shift of the N1 and N2 lines are
plotted for these pressures, as shown in Figs. 3(c), 3(g) and
FIG. 2. Temperature dependence of ruby spectra at ambient pressure with silicone oil as pressure medium. (a) Contour map of the intensity, (b) each line inten-
sity as a function of temperature, (c) a representative spectrum with fits at 70 K, (d) wavelengths of R and N lines, and (e) widths (FWHM) of R and N lines.
124503-3 Yamaoka et al. J. Appl. Phys. 112, 124503 (2012)
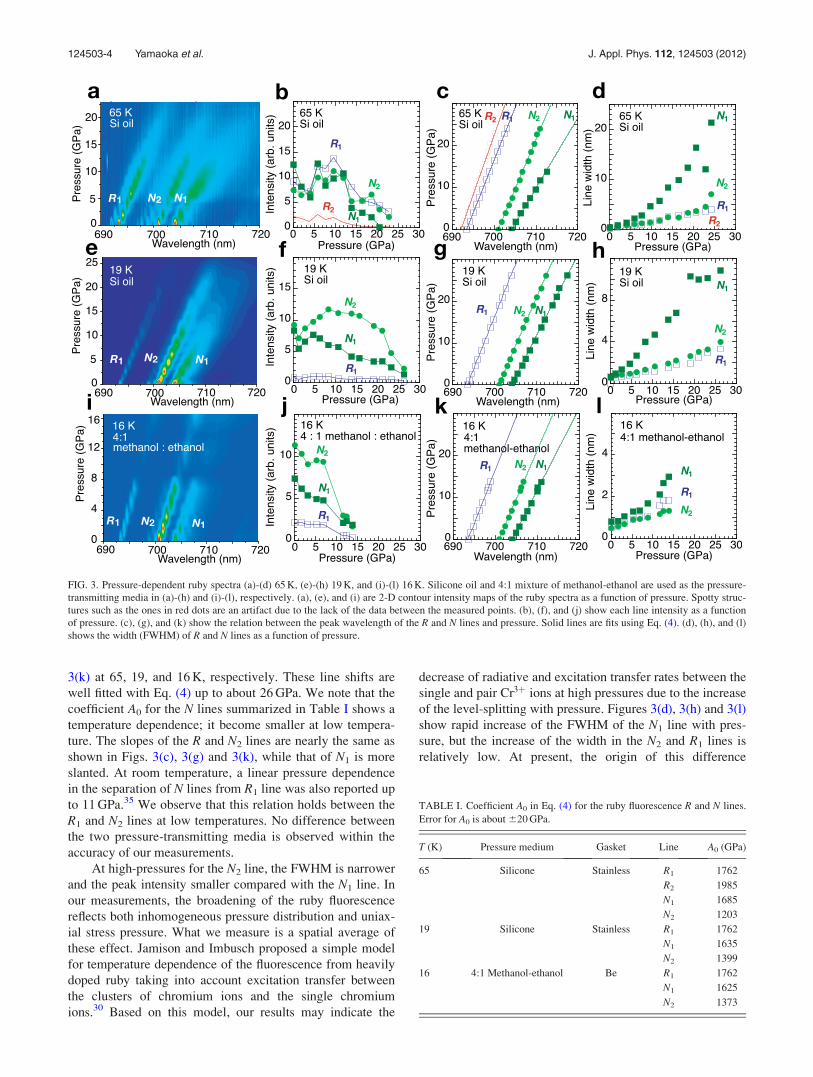
3(k) at 65, 19, and 16 K, respectively. These line shifts are
well fitted with Eq. (4) up to about 26 GPa. We note that the
coefficient A0 for the N lines summarized in Table I shows a
temperature dependence; it become smaller at low tempera-
ture. The slopes of the R and N2 lines are nearly the same as
shown in Figs. 3(c), 3(g) and 3(k), while that of N1 is more
slanted. At room temperature, a linear pressure dependence
in the separation of N lines from R1 line was also reported up
to 11 GPa.35 We observe that this relation holds between the
R1 and N2 lines at low temperatures. No difference between
the two pressure-transmitting media is observed within the
accuracy of our measurements.
At high-pressures for the N2 line, the FWHM is narrower
and the peak intensity smaller compared with the N1 line. In
our measurements, the broadening of the ruby fluorescence
reflects both inhomogeneous pressure distribution and uniax-
ial stress pressure. What we measure is a spatial average of
these effect. Jamison and Imbusch proposed a simple model
for temperature dependence of the fluorescence from heavily
doped ruby taking into account excitation transfer between
the clusters of chromium ions and the single chromium
ions.30 Based on this model, our results may indicate the
decrease of radiative and excitation transfer rates between the
single and pair Cr3þ ions at high pressures due to the increase
of the level-splitting with pressure. Figures 3(d), 3(h) and 3(l)
show rapid increase of the FWHM of the N1 line with pres-
sure, but the increase of the width in the N2 and R1 lines is
relatively low. At present, the origin of this difference
FIG. 3. Pressure-dependent ruby spectra (a)-(d) 65 K, (e)-(h) 19 K, and (i)-(l) 16 K. Silicone oil and 4:1 mixture of methanol-ethanol are used as the pressure-
transmitting media in (a)-(h) and (i)-(l), respectively. (a), (e), and (i) are 2-D contour intensity maps of the ruby spectra as a function of pressure. Spotty struc-
tures such as the ones in red dots are an artifact due to the lack of the data between the measured points. (b), (f), and (j) show each line intensity as a function
of pressure. (c), (g), and (k) show the relation between the peak wavelength of the R and N lines and pressure. Solid lines are fits using Eq. (4). (d), (h), and (l)
shows the width (FWHM) of R and N lines as a function of pressure.
TABLE I. Coefficient A0 in Eq. (4) for the ruby fluorescence R and N lines.
Error for A0 is about 620 GPa.
T (K) Pressure medium Gasket Line A0 (GPa)
65 Silicone Stainless R1 1762
R2 1985
N1 1685
N2 1203
19 Silicone Stainless R1 1762
N1 1635
N2 1399
16 4:1 Methanol-ethanol Be R1 1762
N1 1625
N2 1373
124503-4 Yamaoka et al. J. Appl. Phys. 112, 124503 (2012)
remains unclear and merits further study. The excitation of
the R lines with a green laser is inefficient at high pressures
due to the blue shift of the U (4T1) and Y (4T2) absorption
bands to high energy.36,37 Alternatively, the R line excitation
using a red laser excitation via the 2T1 levels instead of the4T1 or 4T2 level is preferred to enhance the intensity of R and
N lines.11,37 When a green laser is used for the excitation of
the ruby fluorescence lines and the R1 line has vanished at
high pressures, the stronger N2 line can then be conveniently
used as a substitute pressure gauge for higher pressures until
it vanishes. The FWHMs of all lines increase constantly with
pressure.
The hydrostaticity of the pressure-transmitting medium
has been previously discussed based on the broadening of the
emission lines.38 We note that the hydrostatic limit is around
10 GPa for the 4:1 mixture of methanol-ethanol at room tem-
perature.33 Our results indicate that at low temperatures the
non-hydrostatic effect develops continuously starting at ambi-
ent pressure. Viscosity and elastic behavior of silicone oil are
similar to the 4:1 methanol-ethanol mixture.39 It is known that
the silicone oil does not depart from hydrostaticity up to
10 GPa, and its hydrostaticity remains overall higher than that
of the alcohol mixture at room temperature.40 On the other
hand, at 77 K, the 4:1 methanol-ethanol mixture showed less
non-hydrostatic effects compared with other media such as
silicone oil.38 Our results at 16–19 K show that the difference
of non-hydrostaticity between the 4:1 methanol-ethanol mix-
ture and silicone oil is small at low temperatures.
V. SUMMARY
We measure the temperature and pressure dependences
of the laser-induced ruby fluorescence N with the R lines for
the heavily doped ruby in DAC. The intensity of the R lines
from heavily doped ruby becomes weaker with decreasing
temperature, while the N lines does stronger at T< 50 K. The
stronger N lines at low temperatures below a few tens K may
be used to replace the much weaker R lines for pressure scal-
ing. We confirm the empirical formula at low temperatures
for the relation between the ruby shift of the N lines at pres-
sures up to 14 GPa for the 4:1 methanol-ethanol mixture and
up to 26 GPa for the silicone oil, respectively. At low tem-
peratures, non-hydrostaticity develops at a constant rate at
ambient pressure. The difference of the non-hydrostatic
effect between the 4:1 methanol-ethanol mixture and silicone
oil is small at low temperatures.
ACKNOWLEDGMENTS
The experiments were performed at Taiwan beamline
BL12XU, SPring-8, partly under an approval of JASRI
(Proposals Nos. 2011B4259 and 2011B4265) and NSRRC,
Taiwan (2010-3-011, 2012-1-013). This work is partly sup-
ported by a Grant in Aid for Scientific research (Kiban C No.
22540343 and Kiban A No. 22244038) from the Japan
Society for the Promotion of Science. J.F.L. acknowledges
support from the Energy Frontier Research under Extreme
Environments (EFree), the US National Science Foundation
(EAR-0838221) and the Carnegie/DOE Alliance Center
(CDAC). We also appreciate Nikki Seymour for the
manuscript.
1A. R. Go~ni, A. Cantarero, K. Syassen, and M. Cardona, Phys. Rev. B 41,
10111 (1990).2A. Mang, K. Reimann, and St. R€ubenacke, Solid State Commun. 94, 251
(1995).3H. Yamaoka, I. Jarrige, N. Tsujii, J.-F. Lin, T. Ikeno, Y. Isikawa, K. Nishi-
mura, R. Higashinaka, H. Sato, N. Hiraoka, H. Ishii, and K.-D. Tsuei,
Phys. Rev. Lett. 107, 177203 (2011).4R. Forman, G. J. Piermarini, J. D. Barnett, and S. Block, Science 176, 284
(1972).5J. D. Barnett, S. Block, and G. J. Piermarini, Rev. Sci. Instrum. 44, 1
(1973).6H. K. Mao and P. M. Bell, Science 191, 851 (1976).7H. K. Mao, P. M. Bell, J. W. Shaner, and D. J. Steinberg, J. Appl. phys.
49, 3276 (1978).8H. K. Mao, J. Xu, and P. M. Bell, J. Geophys. Res. 91, 4673, doi:10.1029/
JB091iB05p04673 (1986).9C.-S. Zha, H.-K. Mao, and R. J. Hemley, Proc. Nat. Acad. Sci. U.S.A. 97,
13494 (2000).10I. F. Silvera, A. D. Chijioke, W. J. Nellis, A. Soldatov, and J. Tempere,
Phys. Status Solidi. B 244, 460 (2007).11K. Syassen, High Press. Res. 28, 75 (2008).12D. E. McCumber and M. D. Sturge, J. Appl. Phys. 34, 1682 (1963).13J. P. van der Ziel, Phys. Rev. B 9, 2846 (1974).14I. F. Silvera and R. J. Wijngaarden, Rev. Sci. Instrum. 56, 121 (1985).15B. A. Weinstein, Rev. Sci. Instrum. 57, 910 (1986).16W. L. Vos and J. A. Schouten, J. Appl. Phys. 69, 6744 (1991).17D. D. Ragan, R. Gustavsen, and D. Schiferl, J. Appl. Phys. 72, 5539
(1992).18A. H. Jahren, M. B. Kruger, and R. Jeanloz, J. Appl. Phys. 71, 1579
(1992).19X. Li-Wen, C. Rong-Zheng, and J. Chang-Qing, Chin. Phys. Lett. 17, 555
(2000).20Y. Feng, R. Jaramillo, J. Wang, Y. Ren, and T. F. Rosenbaum, Rev. Sci.
Instrum. 81, 041301 (2010).21D. M. Adams, R. Appleby, and S. K. Sharma, J. Phys. E: Sci. Instrum. 9,
1140 (1976).22K. Nakano, Y. Akahama, Y. Ohishi, and H. Kawamura, Jpn. J. Appl.
Phys., Part 1 39, 1249 (2000).23J. C. Chervin, B. Canny, and M. Mancinelli, High Press. Res. 21, 305
(2001).24A. L. Schawlow, D. L. Wood, and A. M. Clogston, Phys. Rev. Lett. 3, 271
(1959).25A. L. Schawlow, J. Appl. Phys. Suppl. 33, 395 (1962).26G. F. Imbusch, Phys. Rev. 153, 326 (1967).27R. C. Powell, B. DiBartolo, B. Birang, and C. S. Naiman, J. Appl. Phys.
37, 4973 (1966).28R. C. Powell, B. DiBartolo, B. Birang, and C. S. Naiman, Phys. Rev. 155,
296 (1967).29R. C. Powell and B. DiBartolo, Phys. Status Solidi A 10, 315 (1972).30S. P. Jamison and G. F. Imbusch, J. Lumin. 75, 143 (1997).31H. Fukazawa, K. Hirayama, T. Yamazaki, Y. Kohori, and T. Matsumoto,
J. Phys. Soc. Jpn. 76, 125001 (2007).32N. Tateiwa and Y. Haga, Rev. Sci. Instrum. 80, 123901 (2009).33S. Klotz, J.-C. Shervin, P. Munsch, and G. Le Marchand, J. Phys. D: Appl.
Phys. 42, 075413 (2009).34H. Yamaoka, I. Jarrige, N. Tsujii, J.-F. Lin, N. Hiraoka, H. Ishii, and K.-D.
Tsuei, Phys. Rev. B 82, 035111 (2010).35Q. Williams and R. Jeanloz, Phys. Rev. B 31, 7449 (1985).36S. J. Duclos, Y. K. Vohra, and A. L. Ruoff, Phys. Rev. B 41, 5372 (1990).37N. H. Chen and I. F. Silvera, Rev. Sci. Instrum. 67, 4275 (1996).38N. Tateiwa and Y. Haga, J. Phys.: Conf. Ser. 215, 012178 (2010).39D. D. Ragan, D. R. Clarke, and D. Schiferl, Rev. Sci. Instrum. 67, 494
(1996).40Y. Shen, R. S. Kumar, M. Pravica, and M. F. Nicol, Rev. Sci. Instrum. 75,
4450 (2004).
124503-5 Yamaoka et al. J. Appl. Phys. 112, 124503 (2012)


![[Anvil Christopher] Anvil, Christopher - Interstel(BookFi)](https://img.pdfslide.net/doc/110x75/577c7f1a1a28abe054a33ed5/anvil-christopher-anvil-christopher-interstelbookfi.jpg)