Embed Size (px)
Citation preview
Supporting FastIron Software Release 08.0.70
CONFIGURATION GUIDE
Ruckus FastIron Monitoring Configuration Guide, 08.0.70
Part Number: 53-1005293-04Publication Date: 28 June 2018

Copyright, Trademark and Proprietary RightsInformation© 2018 ARRIS Enterprises LLC. All rights reserved.
No part of this content may be reproduced in any form or by any means or used to make any derivative work (such astranslation, transformation, or adaptation) without written permission from ARRIS International plc and/or its affiliates ("ARRIS").ARRIS reserves the right to revise or change this content from time to time without obligation on the part of ARRIS to providenotification of such revision or change.
Export RestrictionsThese products and associated technical data (in print or electronic form) may be subject to export control laws of the UnitedStates of America. It is your responsibility to determine the applicable regulations and to comply with them. The following noticeis applicable for all products or technology subject to export control:
These items are controlled by the U.S. Government and authorized for export only to the country of ultimate destination for use by theultimate consignee or end-user(s) herein identified. They may not be resold, transferred, or otherwise disposed of, to any other countryor to any person other than the authorized ultimate consignee or end-user(s), either in their original form or after being incorporatedinto other items, without first obtaining approval from the U.S. government or as otherwise authorized by U.S. law and regulations.
DisclaimerTHIS CONTENT AND ASSOCIATED PRODUCTS OR SERVICES ("MATERIALS"), ARE PROVIDED "AS IS" AND WITHOUT WARRANTIES OFANY KIND, WHETHER EXPRESS OR IMPLIED. TO THE FULLEST EXTENT PERMISSIBLE PURSUANT TO APPLICABLE LAW, ARRISDISCLAIMS ALL WARRANTIES, EXPRESS OR IMPLIED, INCLUDING, BUT NOT LIMITED TO, IMPLIED WARRANTIES OFMERCHANTABILITY AND FITNESS FOR A PARTICULAR PURPOSE, TITLE, NON-INFRINGEMENT, FREEDOM FROM COMPUTER VIRUS,AND WARRANTIES ARISING FROM COURSE OF DEALING OR COURSE OF PERFORMANCE. ARRIS does not represent or warrantthat the functions described or contained in the Materials will be uninterrupted or error-free, that defects will be corrected, orare free of viruses or other harmful components. ARRIS does not make any warranties or representations regarding the use ofthe Materials in terms of their completeness, correctness, accuracy, adequacy, usefulness, timeliness, reliability or otherwise. Asa condition of your use of the Materials, you warrant to ARRIS that you will not make use thereof for any purpose that is unlawfulor prohibited by their associated terms of use.
Limitation of LiabilityIN NO EVENT SHALL ARRIS, ARRIS AFFILIATES, OR THEIR OFFICERS, DIRECTORS, EMPLOYEES, AGENTS, SUPPLIERS, LICENSORSAND THIRD PARTY PARTNERS, BE LIABLE FOR ANY DIRECT, INDIRECT, SPECIAL, PUNITIVE, INCIDENTAL, EXEMPLARY ORCONSEQUENTIAL DAMAGES, OR ANY DAMAGES WHATSOEVER, EVEN IF ARRIS HAS BEEN PREVIOUSLY ADVISED OF THEPOSSIBILITY OF SUCH DAMAGES, WHETHER IN AN ACTION UNDER CONTRACT, TORT, OR ANY OTHER THEORY ARISING FROMYOUR ACCESS TO, OR USE OF, THE MATERIALS. Because some jurisdictions do not allow limitations on how long an impliedwarranty lasts, or the exclusion or limitation of liability for consequential or incidental damages, some of the above limitationsmay not apply to you.
TrademarksARRIS, the ARRIS logo, Ruckus, Ruckus Wireless, Ruckus Networks, Ruckus logo, the Big Dog design, BeamFlex, ChannelFly,EdgeIron, FastIron, HyperEdge, ICX, IronPoint, OPENG, SmartCell, Unleashed, Xclaim, ZoneFlex are trademarks of ARRISInternational plc and/or its affiliates. Wi-Fi Alliance, Wi-Fi, the Wi-Fi logo, the Wi-Fi CERTIFIED logo, Wi-Fi Protected Access (WPA),the Wi-Fi Protected Setup logo, and WMM are registered trademarks of Wi-Fi Alliance. Wi-Fi Protected Setup™, Wi-Fi Multimedia™,and WPA2™ are trademarks of Wi-Fi Alliance. All other trademarks are the property of their respective owners.
Ruckus FastIron Monitoring Configuration Guide, 08.0.702 Part Number: 53-1005293-04
ContentsPreface...................................................................................................................................................................................................9
Document Conventions.............................................................................................................................................................................. 9Notes, Cautions, and Warnings.......................................................................................................................................................... 9
Command Syntax Conventions............................................................................................................................................................... 10Document Feedback................................................................................................................................................................................. 10Ruckus Product Documentation Resources...........................................................................................................................................10Online Training Resources........................................................................................................................................................................11Contacting Ruckus Customer Services and Support.............................................................................................................................11
What Support Do I Need?................................................................................................................................................................. 11Open a Case........................................................................................................................................................................................11Self-Service Resources.......................................................................................................................................................................11
About This Document........................................................................................................................................................................ 13Supported hardware................................................................................................................................................................................. 13What’s new in this document ..................................................................................................................................................................13How command information is presented in this guide........................................................................................................................ 13
Operations, Administration, and Maintenance............................................................................................................................. 15OAM Overview........................................................................................................................................................................................... 15Software versions installed and running on a device........................................................................................................................... 16
Determining the flash image version running on the device....................................................................................................... 16Displaying the boot image version running on the device........................................................................................................... 18Displaying the image versions installed in flash memory............................................................................................................ 18Flash image verification ................................................................................................................................................................... 18
Software Image file types......................................................................................................................................................................... 19Flash timeout............................................................................................................................................................................................. 20Software upgrades.................................................................................................................................................................................... 20Boot code synchronization feature......................................................................................................................................................... 20Viewing the contents of flash files...........................................................................................................................................................20Using SNMP to upgrade software........................................................................................................................................................... 21Software reboot......................................................................................................................................................................................... 21
Software boot configuration notes..................................................................................................................................................22Displaying the boot preference............................................................................................................................................................... 22Loading and saving configuration files................................................................................................................................................... 24
Replacing the startup configuration with the running configuration..........................................................................................24Replacing the running configuration with the startup configuration..........................................................................................24Logging changes to the startup-config file..................................................................................................................................... 25Copying a configuration file to or from a TFTP server...................................................................................................................25Dynamic configuration loading........................................................................................................................................................ 25Maximum file sizes for startup-config file and running-config.................................................................................................... 28
Loading and saving configuration files with IPv6.................................................................................................................................. 28Using the IPv6 copy command.........................................................................................................................................................28Copying a file from an IPv6 TFTP server..........................................................................................................................................29IPv6 copy command.......................................................................................................................................................................... 29IPv6 TFTP server file upload..............................................................................................................................................................30Using SNMP to save and load configuration information.............................................................................................................30Erasing image and configuration files............................................................................................................................................. 31
Ruckus FastIron Monitoring Configuration Guide, 08.0.70Part Number: 53-1005293-04 3

System reload scheduling........................................................................................................................................................................ 31Reloading at a specific time.............................................................................................................................................................. 32Reloading after a specific amount of time......................................................................................................................................32Displaying the amount of time remaining before a scheduled reload....................................................................................... 32Canceling a scheduled reload...........................................................................................................................................................32
Diagnostic error codes and remedies for TFTP transfers.....................................................................................................................32Network connectivity testing................................................................................................................................................................... 34
Pinging an IPv4 address.................................................................................................................................................................... 34Tracing an IPv4 route......................................................................................................................................................................... 34
IEEE 802.3ah EFM-OAM.............................................................................................................................................................................34Network deployment use case.........................................................................................................................................................35EFM-OAM protocol.............................................................................................................................................................................35Process overview................................................................................................................................................................................36Remote failure indication..................................................................................................................................................................37Remote loopback............................................................................................................................................................................... 37EFM-OAM error disable recovery .................................................................................................................................................... 38Configuring EFM-OAM....................................................................................................................................................................... 38Displaying OAM information............................................................................................................................................................ 39Displaying OAM statistics..................................................................................................................................................................41EFM-OAM syslog messages.............................................................................................................................................................. 43
Displaying management redundancy information .............................................................................................................................. 43Layer 3 hitless route purge ......................................................................................................................................................................43
Setting the IPv4 hitless purge timer on the defatult VRF.............................................................................................................. 44Example for setting IPv4 hitless purge timer on the default VRF................................................................................................ 44Setting the IPv4 hitless purge timer on the non-default VRF....................................................................................................... 44Example for setting the IPv4 hitless purge timer on the non-default VRF..................................................................................44Setting the IPv6 hitless purge timer on the defatult VRF.............................................................................................................. 44Example for setting the IPv6 hitless purge timer on the default VRF..........................................................................................44Setting the IPv4 hitless purge timer on the non-default VRF....................................................................................................... 44Example for setting the IPv6 hitless purge timer on the non-default VRF..................................................................................45
Energy Efficient Ethernet.......................................................................................................................................................................... 45Port support for Energy Efficient Ethernet..................................................................................................................................... 45EEE feature support on SPX .......................................................................................................................................................... 45Enabling Energy Efficient Ethernet...................................................................................................................................................46
Histogram information overview.............................................................................................................................................................47Displaying CPU histogram information...........................................................................................................................................47
External USB Hotplug................................................................................................................................................................................47Using External USB Hotplug............................................................................................................................................................. 48
Basic system management...................................................................................................................................................................... 48Viewing system information............................................................................................................................................................. 49Viewing configuration information.................................................................................................................................................. 50Enabling the display of the elapsed timestamp for port statistics reset.....................................................................................51Viewing port statistics........................................................................................................................................................................51Viewing STP statistics.........................................................................................................................................................................52Clearing statistics............................................................................................................................................................................... 52Viewing egress queue counters on ICX 7750 devices....................................................................................................................52Clearing the egress queue counters................................................................................................................................................53
Link Fault Signaling for 10Gbps Ethernet devices................................................................................................................................. 53Enabling Link Fault Signaling............................................................................................................................................................ 54Viewing the status of LFS-enabled links.......................................................................................................................................... 54
Ruckus FastIron Monitoring Configuration Guide, 08.0.704 Part Number: 53-1005293-04

Hardware Component Monitoring................................................................................................................................................... 55Virtual cable testing...................................................................................................................................................................................55
VCT configuration notes....................................................................................................................................................................55VCT command syntax........................................................................................................................................................................ 57Viewing the results of the cable analysis........................................................................................................................................ 57
Digital Optical Monitoring........................................................................................................................................................................ 58Supported media types.....................................................................................................................................................................59DOM show and configuration commands......................................................................................................................................59Enabling DOM.....................................................................................................................................................................................60Configuration example......................................................................................................................................................................61
Syslog messages for optical transceivers............................................................................................................................................... 62FastIron Fiber-optic Transceivers.............................................................................................................................................................63
Port Mirroring and Monitoring......................................................................................................................................................... 65Port mirroring and monitoring overview................................................................................................................................................65Port mirroring and monitoring configuration........................................................................................................................................65
Configuration notes for port mirroring and monitoring...............................................................................................................66Commands for port mirroring and monitoring............................................................................................................................. 66
Mirroring configuration on a traditional stack.......................................................................................................................................67Configuration notes for traditional stack mirroring...................................................................................................................... 67
Mirroring in a Campus Fabric domain.................................................................................................................................................... 68Campus Fabric mirroring limitations...............................................................................................................................................68Supported Campus Fabric mirroring scenarios............................................................................................................................. 69Unsupported Campus Fabric mirroring configurations................................................................................................................69Sample configuration for Campus Fabric mirroring......................................................................................................................69Displaying Campus Fabric mirroring information......................................................................................................................... 69
ACL-based inbound mirroring................................................................................................................................................................. 70Creating an ACL-based inbound mirror clause ............................................................................................................................. 70Destination mirror port ....................................................................................................................................................................70
MAC address filter-based mirroring........................................................................................................................................................73MAC address filter-based mirroring configuration notes............................................................................................................. 73Configuring MAC address filter-based mirroring........................................................................................................................... 74
VLAN-based mirroring.............................................................................................................................................................................. 74Configuration notes for VLAN-based mirroring............................................................................................................................. 74Configuring VLAN-based mirroring..................................................................................................................................................75Displaying VLAN-based mirroring status........................................................................................................................................ 75
Encapsulated Remote Switched Port Analyzer (ERSPAN) .................................................................................................................... 75ERSPAN configuration steps............................................................................................................................................................. 77ERSPAN feature limitations...............................................................................................................................................................77Configuring an ERSPAN profile.........................................................................................................................................................77Configuring a monitor port for ERSPAN..........................................................................................................................................82
RMON - Remote Network Monitoring............................................................................................................................................. 85RMON support...........................................................................................................................................................................................85
Maximum number of entries allowed in the RMON control table.............................................................................................. 85Statistics (RMON group 1)................................................................................................................................................................. 85History (RMON group 2).................................................................................................................................................................... 86Alarm (RMON group 3)...................................................................................................................................................................... 86Event (RMON group 9).......................................................................................................................................................................86
Utilization list for an uplink port.............................................................................................................................................................. 87Utilization list for an uplink port command syntax....................................................................................................................... 87
Ruckus FastIron Monitoring Configuration Guide, 08.0.70Part Number: 53-1005293-04 5

Displaying utilization percentages for an uplink............................................................................................................................87
sFlow.................................................................................................................................................................................................... 89sFlow overview...........................................................................................................................................................................................89
sFlow version 5...................................................................................................................................................................................89sFlow support for IPv6 packets........................................................................................................................................................ 90sFlow configuration considerations.................................................................................................................................................90
Configuring and enabling sFlow.............................................................................................................................................................. 93Specifying the collector..................................................................................................................................................................... 93Changing the polling interval............................................................................................................................................................94Changing the sampling rate..............................................................................................................................................................94Changing the sFlow source port.......................................................................................................................................................96
Enabling sFlow forwarding....................................................................................................................................................................... 96Commands for enabling sFlow forwarding.................................................................................................................................... 97
sFlow version 5 feature configuration.................................................................................................................................................... 97Egress interface ID for sampled broadcast and multicast packets..............................................................................................98Specifying the sFlow version format................................................................................................................................................98Specifying the sFlow agent IP address............................................................................................................................................ 98Specifying the version used for exporting sFlow data...................................................................................................................98Specifying the maximum flow sample size ....................................................................................................................................99Exporting CPU and memory usage information to the sFlow collector......................................................................................99Specifying the polling interval for exporting CPU and memory usage information to the sFlow collector............................99Exporting CPU-directed data (management traffic) to the sFlow collector.............................................................................. 100
Configuring sFlow with Multi-VRFs........................................................................................................................................................ 100Displaying sFlow information................................................................................................................................................................ 101Clearing sFlow statistics..........................................................................................................................................................................102
System Monitoring...........................................................................................................................................................................103Overview of system monitoring............................................................................................................................................................ 103
Configuration notes and feature limitations................................................................................................................................ 103Configure system monitoring................................................................................................................................................................ 104
disable system-monitoring all ....................................................................................................................................................... 104enable system-monitoring all ........................................................................................................................................................104sysmon timer ...................................................................................................................................................................................104sysmon log-backoff .........................................................................................................................................................................105sysmon threshold ........................................................................................................................................................................... 105
System monitoring on ICX devices........................................................................................................................................................ 106sysmon ecc-error ............................................................................................................................................................................ 106sysmon link-error ............................................................................................................................................................................106
System monitoring for Packet Processors........................................................................................................................................... 107clear sysmon counters ................................................................................................................................................................... 108show sysmon logs ...........................................................................................................................................................................108show sysmon counters .................................................................................................................................................................. 109show sysmon config ....................................................................................................................................................................... 111
Syslog................................................................................................................................................................................................. 113About Syslog messages.......................................................................................................................................................................... 113Displaying Syslog messages...................................................................................................................................................................113
Enabling real-time display of Syslog messages............................................................................................................................114Enabling real-time display for a Telnet or SSH session............................................................................................................... 114Broadcast, unknown unicast, and multicast suppression Syslog and SNMP notification...................................................... 115Displaying real-time Syslog messages ..........................................................................................................................................116
Ruckus FastIron Monitoring Configuration Guide, 08.0.706 Part Number: 53-1005293-04
Syslog service configuration...................................................................................................................................................................117Displaying the Syslog configuration.............................................................................................................................................. 117Generating the Syslog specific to RFC 5424..................................................................................................................................119Disabling or re-enabling Syslog......................................................................................................................................................121Specifying a Syslog server...............................................................................................................................................................121Specifying an additional Syslog server.......................................................................................................................................... 121Disabling logging of a message level.............................................................................................................................................121Changing the number of entries the local buffer can hold........................................................................................................ 122Changing the log facility..................................................................................................................................................................122Displaying interface names in Syslog messages..........................................................................................................................123Retaining Syslog messages after a soft reboot............................................................................................................................ 124Clearing the Syslog messages from the local buffer................................................................................................................... 124
Syslog messages............................................................................................................................................................................... 125Syslog messages......................................................................................................................................................................................125Syslog messages IPsec and IKEv2..........................................................................................................................................................156
Syslog messages system.................................................................................................................................................................157
Ruckus FastIron Monitoring Configuration Guide, 08.0.70Part Number: 53-1005293-04 7

Ruckus FastIron Monitoring Configuration Guide, 08.0.708 Part Number: 53-1005293-04
Preface• Document Conventions................................................................................................................................................ 9• Command Syntax Conventions................................................................................................................................. 10• Document Feedback................................................................................................................................................... 10• Ruckus Product Documentation Resources.............................................................................................................10• Online Training Resources..........................................................................................................................................11• Contacting Ruckus Customer Services and Support...............................................................................................11
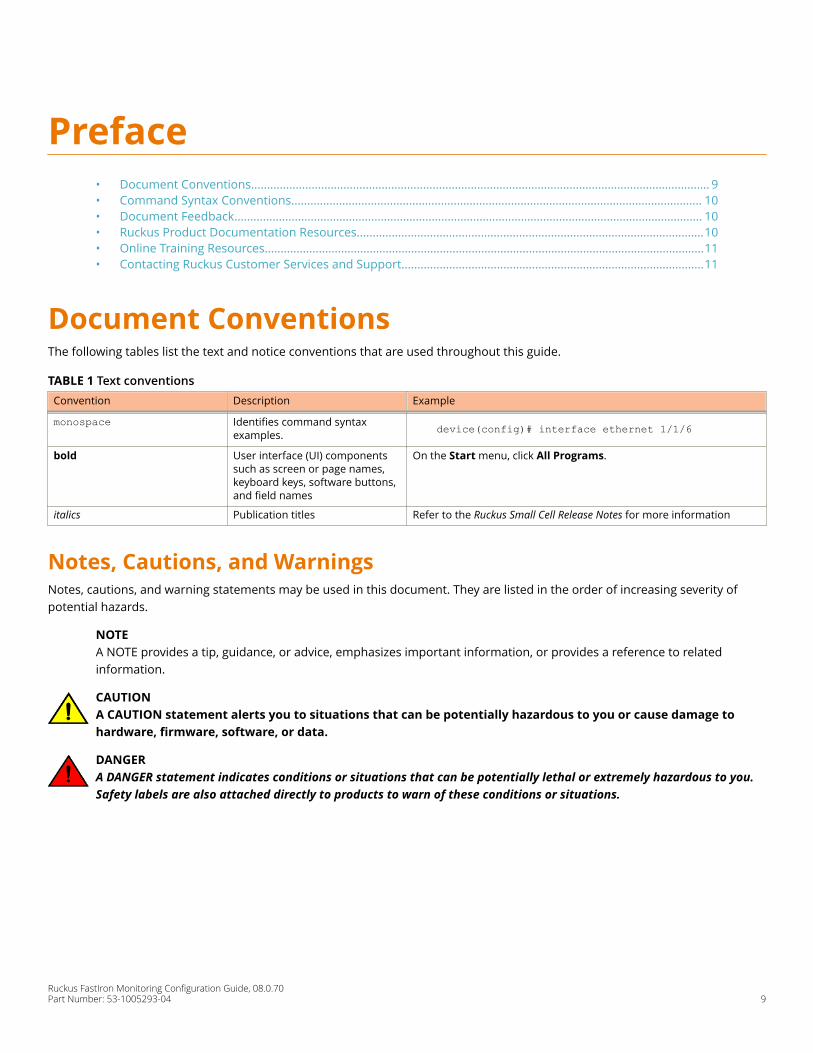
Document ConventionsThe following tables list the text and notice conventions that are used throughout this guide.
TABLE 1 Text conventionsConvention Description Example
monospace Identifies command syntaxexamples. device(config)# interface ethernet 1/1/6
bold User interface (UI) componentssuch as screen or page names,keyboard keys, software buttons,and field names
On the Start menu, click All Programs.
italics Publication titles Refer to the Ruckus Small Cell Release Notes for more information
Notes, Cautions, and WarningsNotes, cautions, and warning statements may be used in this document. They are listed in the order of increasing severity ofpotential hazards.
NOTEA NOTE provides a tip, guidance, or advice, emphasizes important information, or provides a reference to relatedinformation.
CAUTIONA CAUTION statement alerts you to situations that can be potentially hazardous to you or cause damage tohardware, firmware, software, or data.
DANGERA DANGER statement indicates conditions or situations that can be potentially lethal or extremely hazardous to you.Safety labels are also attached directly to products to warn of these conditions or situations.
Ruckus FastIron Monitoring Configuration Guide, 08.0.70Part Number: 53-1005293-04 9

Command Syntax ConventionsBold and italic text identify command syntax components. Delimiters and operators define groupings of parameters and theirlogical relationships.
Convention Description
bold text Identifies command names, keywords, and command options.
italic text Identifies a variable.
[ ] Syntax components displayed within square brackets are optional.
Default responses to system prompts are enclosed in square brackets.
{ x | y | z } A choice of required parameters is enclosed in curly brackets separated by vertical bars. You mustselect one of the options.
x | y A vertical bar separates mutually exclusive elements.
< > Nonprinting characters, for example, passwords, are enclosed in angle brackets.
... Repeat the previous element, for example, member[member...].
\ Indicates a “soft” line break in command examples. If a backslash separates two lines of a commandinput, enter the entire command at the prompt without the backslash.
Document FeedbackRuckus is interested in improving its documentation and welcomes your comments and suggestions.
You can email your comments to Ruckus at: [email protected]
When contacting us, please include the following information:
• Document title and release number
• Document part number (on the cover page)
• Page number (if appropriate)
• For example:
– Ruckus Small Cell Alarms Guide SC Release 1.3– Part number: 800-71306-001– Page 88
Ruckus Product Documentation ResourcesVisit the Ruckus website to locate related documentation for your product and additional Ruckus resources.
Release Notes and other user documentation are available at https://support.ruckuswireless.com/documents. You can locatedocumentation by product or perform a text search. Access to Release Notes requires an active support contract and RuckusSupport Portal user account. Other technical documentation content is available without logging into the Ruckus Support Portal.
White papers, data sheets, and other product documentation are available at https://www.ruckuswireless.com.
PrefaceCommand Syntax Conventions
Ruckus FastIron Monitoring Configuration Guide, 08.0.7010 Part Number: 53-1005293-04

Online Training ResourcesTo access a variety of online Ruckus training modules, including free introductory courses to wireless networking essentials, sitesurveys, and Ruckus products, visit the Ruckus Training Portal at https://training.ruckuswireless.com.
Contacting Ruckus Customer Services andSupportThe Customer Services and Support (CSS) organization is available to provide assistance to customers with active warranties ontheir Ruckus Networks products, and customers and partners with active support contracts.
For product support information and details on contacting the Support Team, go directly to the Support Portal using https://support.ruckuswireless.com, or go to https://www.ruckuswireless.com and select Support.
What Support Do I Need?Technical issues are usually described in terms of priority (or severity). To determine if you need to call and open a case or accessthe self-service resources use the following criteria:
• Priority 1 (P1)—Critical. Network or service is down and business is impacted. No known workaround. Go to the Open aCase section.
• Priority 2 (P2)—High. Network or service is impacted, but not down. Business impact may be high. Workaround may beavailable. Go to the Open a Case section.
• Priority 3 (P3)—Medium. Network or service is moderately impacted, but most business remains functional. Go to theSelf-Service Resources section.
• Priority 4 (P4)—Low. Request for information, product documentation, or product enhancements. Go to the Self-ServiceResources section.
Open a CaseWhen your entire network is down (P1), or severely impacted (P2), call the appropriate telephone number listed below to gethelp:
• Continental United States: 1-855-782-5871
• Canada: 1-855-782-5871
• Europe, Middle East, Africa, and Asia Pacific, toll-free numbers are available at https://support.ruckuswireless.com/contact-us and Live Chat is also available.
Self-Service ResourcesThe Support Portal at https://support.ruckuswireless.com/contact-us offers a number of tools to help you to research andresolve problems with your Ruckus products, including:
• Technical Documentation—https://support.ruckuswireless.com/documents
• Community Forums—https://forums.ruckuswireless.com/ruckuswireless/categories
• Knowledge Base Articles—https://support.ruckuswireless.com/answers
PrefaceContacting Ruckus Customer Services and Support
Ruckus FastIron Monitoring Configuration Guide, 08.0.70Part Number: 53-1005293-04 11

• Software Downloads and Release Notes—https://support.ruckuswireless.com/software
• Security Bulletins—https://support.ruckuswireless.com/security
Using these resources will help you to resolve some issues, and will provide TAC with additional data from your troubleshootinganalysis if you still require assistance through a support case or RMA. If you still require help, open and manage your case at https://support.ruckuswireless.com/case_management
PrefaceContacting Ruckus Customer Services and Support
Ruckus FastIron Monitoring Configuration Guide, 08.0.7012 Part Number: 53-1005293-04
About This Document• Supported hardware...................................................................................................................................................13• What’s new in this document ....................................................................................................................................13• How command information is presented in this guide..........................................................................................13
Supported hardwareThis guide supports the following Ruckus products:
• Ruckus ICX 7750 Series
• Ruckus ICX 7650 Series
• Ruckus ICX 7450 Series
• Ruckus ICX 7250 Series
• Ruckus ICX 7150 Series
For information about what models and modules these devices support, see the hardware installation guide for the specificproduct family.
What’s new in this documentThe following tables describe information added or modified in this guide for FastIron software release 8.0.70.
TABLE 2 Summary of enhancements in FastIron release 8.0.70Feature Description Described in
PoE and Port MAC SecuritySyslog messages
Syslog messages related to PoE and Port MAC Security are added. Syslog messages on page 125
How command information is presented in thisguideFor all new content supported in FastIron release 08.0.20 and later, command information is documented in a standalonecommand reference guide.
In the Ruckus FastIron Command Reference, the command pages are in alphabetical order and follow a standard format to presentsyntax, parameters, mode, usage guidelines, examples, and command history.
NOTEMany commands introduced before FastIron release 08.0.20 are also included in the guide.
Ruckus FastIron Monitoring Configuration Guide, 08.0.70Part Number: 53-1005293-04 13

Ruckus FastIron Monitoring Configuration Guide, 08.0.7014 Part Number: 53-1005293-04

Operations, Administration, andMaintenance
• OAM Overview............................................................................................................................................................. 15• Software versions installed and running on a device............................................................................................. 16• Software Image file types........................................................................................................................................... 19• Flash timeout............................................................................................................................................................... 20• Software upgrades...................................................................................................................................................... 20• Boot code synchronization feature........................................................................................................................... 20• Viewing the contents of flash files.............................................................................................................................20• Using SNMP to upgrade software............................................................................................................................. 21• Software reboot...........................................................................................................................................................21• Displaying the boot preference................................................................................................................................. 22• Loading and saving configuration files..................................................................................................................... 24• Loading and saving configuration files with IPv6.................................................................................................... 28• System reload scheduling.......................................................................................................................................... 31• Diagnostic error codes and remedies for TFTP transfers.......................................................................................32• Network connectivity testing..................................................................................................................................... 34• IEEE 802.3ah EFM-OAM...............................................................................................................................................34• Displaying management redundancy information ................................................................................................ 43• Layer 3 hitless route purge ........................................................................................................................................43• Energy Efficient Ethernet............................................................................................................................................ 45• Histogram information overview...............................................................................................................................47• External USB Hotplug..................................................................................................................................................47• Basic system management........................................................................................................................................ 48• Link Fault Signaling for 10Gbps Ethernet devices................................................................................................... 53
OAM OverviewFor easy software image management, all Ruckus devices support the download and upload of software images between theflash modules on the devices and a Trivial File Transfer Protocol (TFTP) server on the network.
Ruckus devices have two flash memory modules:
• Primary flash - The default local storage device for image files and configuration files.
• Secondary flash - A second flash storage device. You can use the secondary flash to store redundant images foradditional booting reliability or to preserve one software image while testing another one.
Only one flash device is active at a time. By default, the primary image will become active upon reload.
You can update the software contained on a flash module using TFTP to copy the update image from a TFTP server onto the flashmodule. In addition, you can copy software images and configuration files from a flash module to a TFTP server.
NOTERuckus devices are TFTP clients but not TFTP servers. You must perform the TFTP transaction from the Ruckus device.You cannot "put" a file onto the Ruckus device using the interface of your TFTP server.
Ruckus FastIron Monitoring Configuration Guide, 08.0.70Part Number: 53-1005293-04 15
NOTEIf you are attempting to transfer a file using TFTP but have received an error message, refer to Diagnostic error codesand remedies for TFTP transfers on page 32.
Software versions installed and running on adeviceUse the following methods to display the software versions running on the device and the versions installed in flash memory.
Determining the flash image version running on the deviceTo determine the flash image version running on a device, enter the show version command while in any mode of the CLI. Someexamples are shown below.
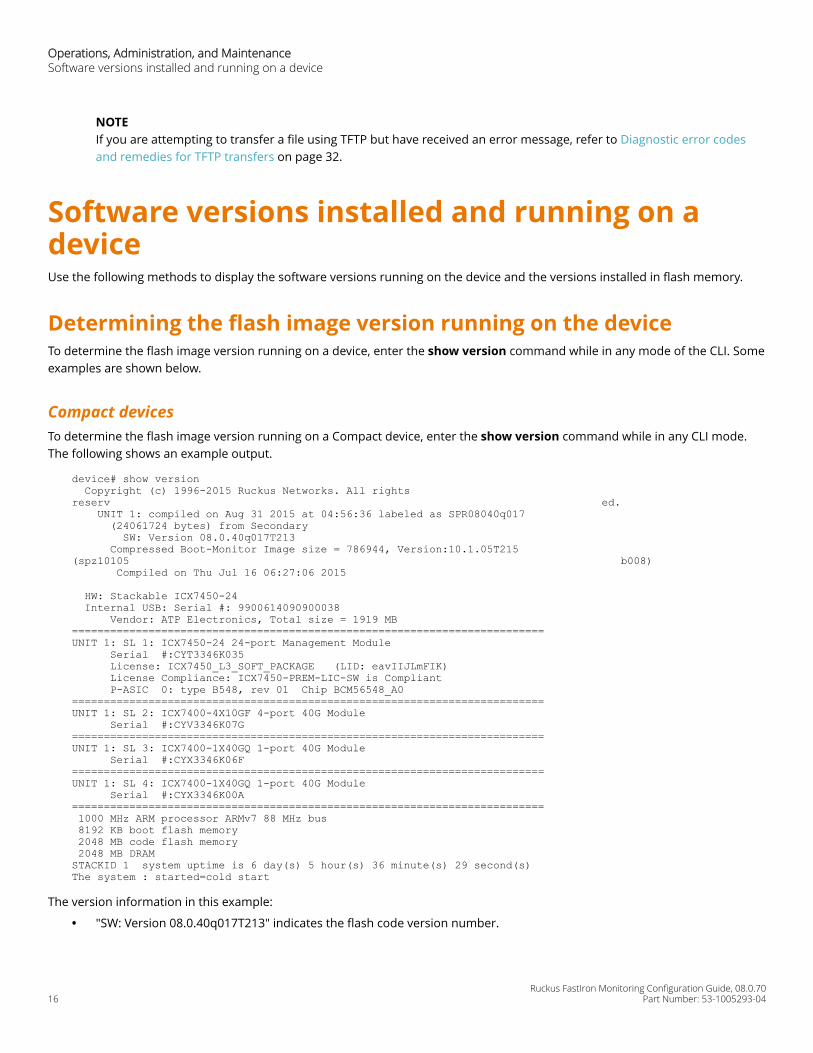
Compact devicesTo determine the flash image version running on a Compact device, enter the show version command while in any CLI mode.The following shows an example output.
device# show version Copyright (c) 1996-2015 Ruckus Networks. All rights reserv ed. UNIT 1: compiled on Aug 31 2015 at 04:56:36 labeled as SPR08040q017 (24061724 bytes) from Secondary SW: Version 08.0.40q017T213 Compressed Boot-Monitor Image size = 786944, Version:10.1.05T215 (spz10105 b008) Compiled on Thu Jul 16 06:27:06 2015
HW: Stackable ICX7450-24 Internal USB: Serial #: 9900614090900038 Vendor: ATP Electronics, Total size = 1919 MB==========================================================================UNIT 1: SL 1: ICX7450-24 24-port Management Module Serial #:CYT3346K035 License: ICX7450_L3_SOFT_PACKAGE (LID: eavIIJLmFIK) License Compliance: ICX7450-PREM-LIC-SW is Compliant P-ASIC 0: type B548, rev 01 Chip BCM56548_A0==========================================================================UNIT 1: SL 2: ICX7400-4X10GF 4-port 40G Module Serial #:CYV3346K07G==========================================================================UNIT 1: SL 3: ICX7400-1X40GQ 1-port 40G Module Serial #:CYX3346K06F==========================================================================UNIT 1: SL 4: ICX7400-1X40GQ 1-port 40G Module Serial #:CYX3346K00A========================================================================== 1000 MHz ARM processor ARMv7 88 MHz bus 8192 KB boot flash memory 2048 MB code flash memory 2048 MB DRAMSTACKID 1 system uptime is 6 day(s) 5 hour(s) 36 minute(s) 29 second(s)The system : started=cold start
The version information in this example:
• "SW: Version 08.0.40q017T213" indicates the flash code version number.
Operations, Administration, and MaintenanceSoftware versions installed and running on a device
Ruckus FastIron Monitoring Configuration Guide, 08.0.7016 Part Number: 53-1005293-04
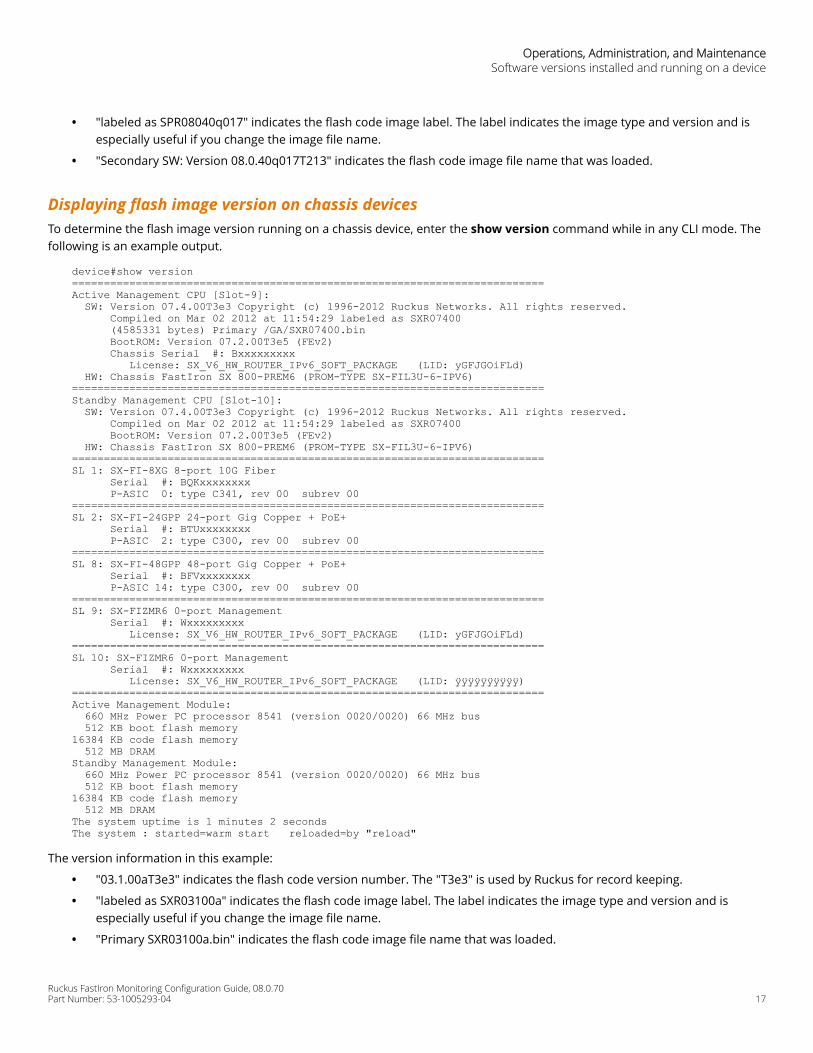
• "labeled as SPR08040q017" indicates the flash code image label. The label indicates the image type and version and isespecially useful if you change the image file name.
• "Secondary SW: Version 08.0.40q017T213" indicates the flash code image file name that was loaded.
Displaying flash image version on chassis devicesTo determine the flash image version running on a chassis device, enter the show version command while in any CLI mode. Thefollowing is an example output.
device#show version==========================================================================Active Management CPU [Slot-9]: SW: Version 07.4.00T3e3 Copyright (c) 1996-2012 Ruckus Networks. All rights reserved. Compiled on Mar 02 2012 at 11:54:29 labeled as SXR07400 (4585331 bytes) Primary /GA/SXR07400.bin BootROM: Version 07.2.00T3e5 (FEv2) Chassis Serial #: Bxxxxxxxxx License: SX_V6_HW_ROUTER_IPv6_SOFT_PACKAGE (LID: yGFJGOiFLd) HW: Chassis FastIron SX 800-PREM6 (PROM-TYPE SX-FIL3U-6-IPV6)==========================================================================Standby Management CPU [Slot-10]: SW: Version 07.4.00T3e3 Copyright (c) 1996-2012 Ruckus Networks. All rights reserved. Compiled on Mar 02 2012 at 11:54:29 labeled as SXR07400 BootROM: Version 07.2.00T3e5 (FEv2) HW: Chassis FastIron SX 800-PREM6 (PROM-TYPE SX-FIL3U-6-IPV6)==========================================================================SL 1: SX-FI-8XG 8-port 10G Fiber Serial #: BQKxxxxxxxx P-ASIC 0: type C341, rev 00 subrev 00==========================================================================SL 2: SX-FI-24GPP 24-port Gig Copper + PoE+ Serial #: BTUxxxxxxxx P-ASIC 2: type C300, rev 00 subrev 00 ==========================================================================SL 8: SX-FI-48GPP 48-port Gig Copper + PoE+ Serial #: BFVxxxxxxxx P-ASIC 14: type C300, rev 00 subrev 00==========================================================================SL 9: SX-FIZMR6 0-port Management Serial #: Wxxxxxxxxx License: SX_V6_HW_ROUTER_IPv6_SOFT_PACKAGE (LID: yGFJGOiFLd)==========================================================================SL 10: SX-FIZMR6 0-port Management Serial #: Wxxxxxxxxx License: SX_V6_HW_ROUTER_IPv6_SOFT_PACKAGE (LID: ÿÿÿÿÿÿÿÿÿÿ)==========================================================================Active Management Module: 660 MHz Power PC processor 8541 (version 0020/0020) 66 MHz bus 512 KB boot flash memory16384 KB code flash memory 512 MB DRAMStandby Management Module: 660 MHz Power PC processor 8541 (version 0020/0020) 66 MHz bus 512 KB boot flash memory16384 KB code flash memory 512 MB DRAM The system uptime is 1 minutes 2 seconds The system : started=warm start reloaded=by "reload"
The version information in this example:
• "03.1.00aT3e3" indicates the flash code version number. The "T3e3" is used by Ruckus for record keeping.
• "labeled as SXR03100a" indicates the flash code image label. The label indicates the image type and version and isespecially useful if you change the image file name.
• "Primary SXR03100a.bin" indicates the flash code image file name that was loaded.
Operations, Administration, and MaintenanceSoftware versions installed and running on a device
Ruckus FastIron Monitoring Configuration Guide, 08.0.70Part Number: 53-1005293-04 17

Displaying the boot image version running on the deviceTo determine the boot image running on a device, enter the show flash command while in any CLI mode. The following showsan example output.
device# show flashActive Management Module (Slot 9):Compressed Pri Code size = 3613675, Version 03.1.00aT3e3 (sxr03100a.bin)Compressed Sec Code size = 2250218, Version 03.1.00aT3e1 (sxs03100a.bin)Compressed BootROM Code size = 524288, Version 03.0.01T3e5Code Flash Free Space = 9699328Standby Management Module (Slot 10):Compressed Pri Code size = 3613675, Version 03.1.00aT3e3 (sxr03100a.bin)Compressed Sec Code size = 2250218, Version 03.1.00aT3e1 (sxs03100a.bin)Compressed BootROM Code size = 524288, Version 03.0.01T3e5Code Flash Free Space = 524288
Displaying the image versions installed in flash memoryEnter the show flash command to display the boot and flash images installed on the device. An example of the command outputis shown in Displaying the boot image version running on the device on page 18:
• The "Compressed Pri Code size" line lists the flash code version installed in the primary flash area.
• The "Compressed Sec Code size" line lists the flash code version installed in the secondary flash area.
• The "Boot Monitor Image size" line lists the boot code version installed in flash memory. The device does not haveseparate primary and secondary flash areas for the boot image. The flash memory module contains only one bootimage.
NOTETo minimize the boot-monitor image size on FastIron devices, the ping and tftp operations performed in the boot-monitor mode are restricted to copper ports on the FastIron Chassis management modules and to the out-of-bandmanagement port on the FastIron stackable switches. The other copper or fiber ports on these devices do not have theability to ping or tftp from the boot-monitor mode.
Flash image verificationThe Flash Image Verification feature allows you to verify boot images based on hash codes, and to generate hash codes whereneeded. This feature lets you select from three data integrity verification algorithms:
• MD5 - Message Digest algorithm (RFC 1321)
• SHA1 - US Secure Hash Algorithm (RFC 3174)
• CRC - Cyclic Redundancy Checksum algorithm
Flash image CLI commandsThe following examples show how the verify command can be used in a variety of circumstances.
To generate an MD5 hash value for the secondary image, enter the following command.
device# verify md5 secondarydevice#.........................DoneSize = 2044830, MD5 01c410d6d153189a4a5d36c955653862
Operations, Administration, and MaintenanceSoftware versions installed and running on a device
Ruckus FastIron Monitoring Configuration Guide, 08.0.7018 Part Number: 53-1005293-04
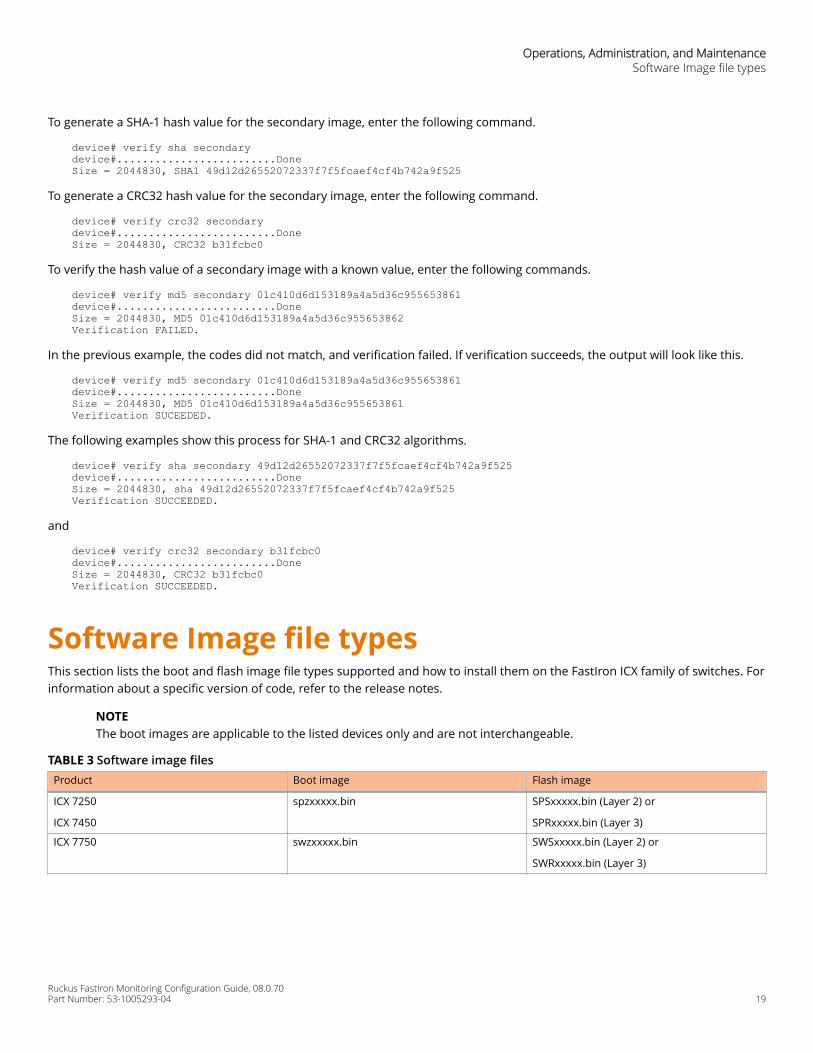
To generate a SHA-1 hash value for the secondary image, enter the following command.
device# verify sha secondarydevice#.........................DoneSize = 2044830, SHA1 49d12d26552072337f7f5fcaef4cf4b742a9f525
To generate a CRC32 hash value for the secondary image, enter the following command.
device# verify crc32 secondarydevice#.........................DoneSize = 2044830, CRC32 b31fcbc0
To verify the hash value of a secondary image with a known value, enter the following commands.
device# verify md5 secondary 01c410d6d153189a4a5d36c955653861device#.........................DoneSize = 2044830, MD5 01c410d6d153189a4a5d36c955653862Verification FAILED.
In the previous example, the codes did not match, and verification failed. If verification succeeds, the output will look like this.
device# verify md5 secondary 01c410d6d153189a4a5d36c955653861device#.........................DoneSize = 2044830, MD5 01c410d6d153189a4a5d36c955653861Verification SUCEEDED.
The following examples show this process for SHA-1 and CRC32 algorithms.
device# verify sha secondary 49d12d26552072337f7f5fcaef4cf4b742a9f525device#.........................DoneSize = 2044830, sha 49d12d26552072337f7f5fcaef4cf4b742a9f525Verification SUCCEEDED.
and
device# verify crc32 secondary b31fcbc0device#.........................DoneSize = 2044830, CRC32 b31fcbc0Verification SUCCEEDED.
Software Image file typesThis section lists the boot and flash image file types supported and how to install them on the FastIron ICX family of switches. Forinformation about a specific version of code, refer to the release notes.
NOTEThe boot images are applicable to the listed devices only and are not interchangeable.
TABLE 3 Software image files Product Boot image Flash image
ICX 7250
ICX 7450
spzxxxxx.bin SPSxxxxx.bin (Layer 2) or
SPRxxxxx.bin (Layer 3)
ICX 7750 swzxxxxx.bin SWSxxxxx.bin (Layer 2) or
SWRxxxxx.bin (Layer 3)
Operations, Administration, and MaintenanceSoftware Image file types
Ruckus FastIron Monitoring Configuration Guide, 08.0.70Part Number: 53-1005293-04 19
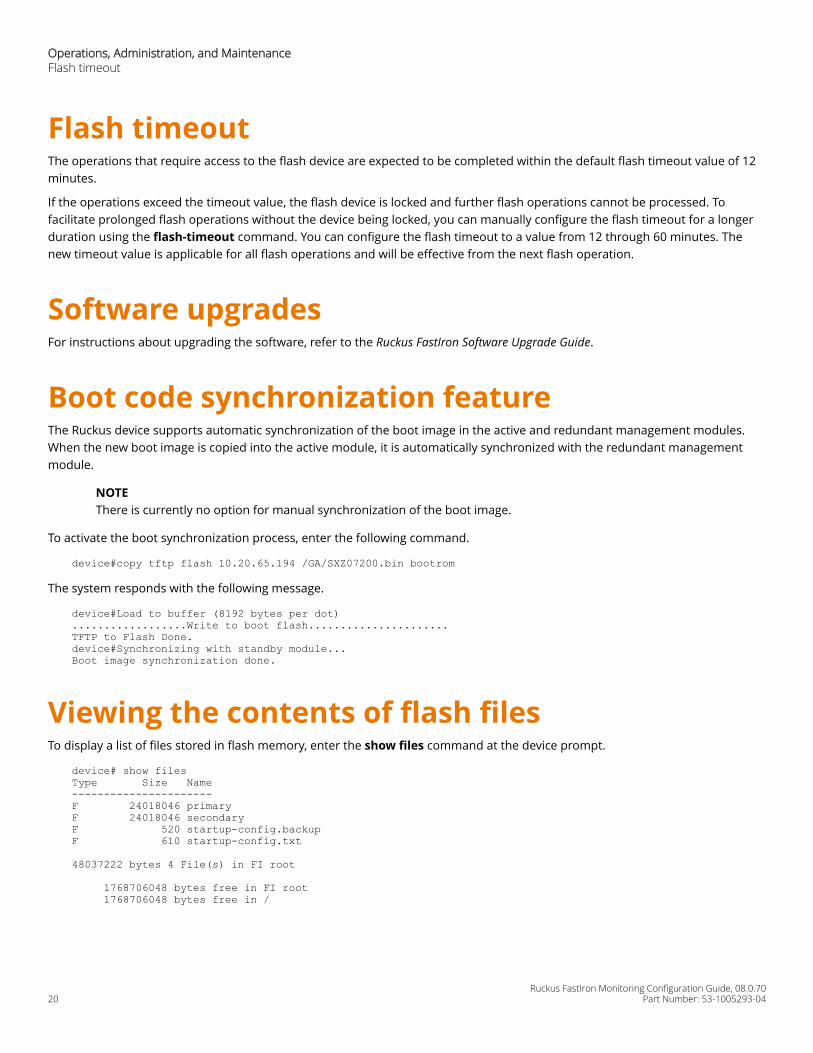
Flash timeoutThe operations that require access to the flash device are expected to be completed within the default flash timeout value of 12minutes.
If the operations exceed the timeout value, the flash device is locked and further flash operations cannot be processed. Tofacilitate prolonged flash operations without the device being locked, you can manually configure the flash timeout for a longerduration using the flash-timeout command. You can configure the flash timeout to a value from 12 through 60 minutes. Thenew timeout value is applicable for all flash operations and will be effective from the next flash operation.
Software upgradesFor instructions about upgrading the software, refer to the Ruckus FastIron Software Upgrade Guide.
Boot code synchronization featureThe Ruckus device supports automatic synchronization of the boot image in the active and redundant management modules.When the new boot image is copied into the active module, it is automatically synchronized with the redundant managementmodule.
NOTEThere is currently no option for manual synchronization of the boot image.
To activate the boot synchronization process, enter the following command.
device#copy tftp flash 10.20.65.194 /GA/SXZ07200.bin bootrom
The system responds with the following message.
device#Load to buffer (8192 bytes per dot)..................Write to boot flash......................TFTP to Flash Done.device#Synchronizing with standby module...Boot image synchronization done.
Viewing the contents of flash filesTo display a list of files stored in flash memory, enter the show files command at the device prompt.
device# show filesType Size Name----------------------F 24018046 primaryF 24018046 secondaryF 520 startup-config.backupF 610 startup-config.txt
48037222 bytes 4 File(s) in FI root
1768706048 bytes free in FI root 1768706048 bytes free in /
Operations, Administration, and MaintenanceFlash timeout
Ruckus FastIron Monitoring Configuration Guide, 08.0.7020 Part Number: 53-1005293-04
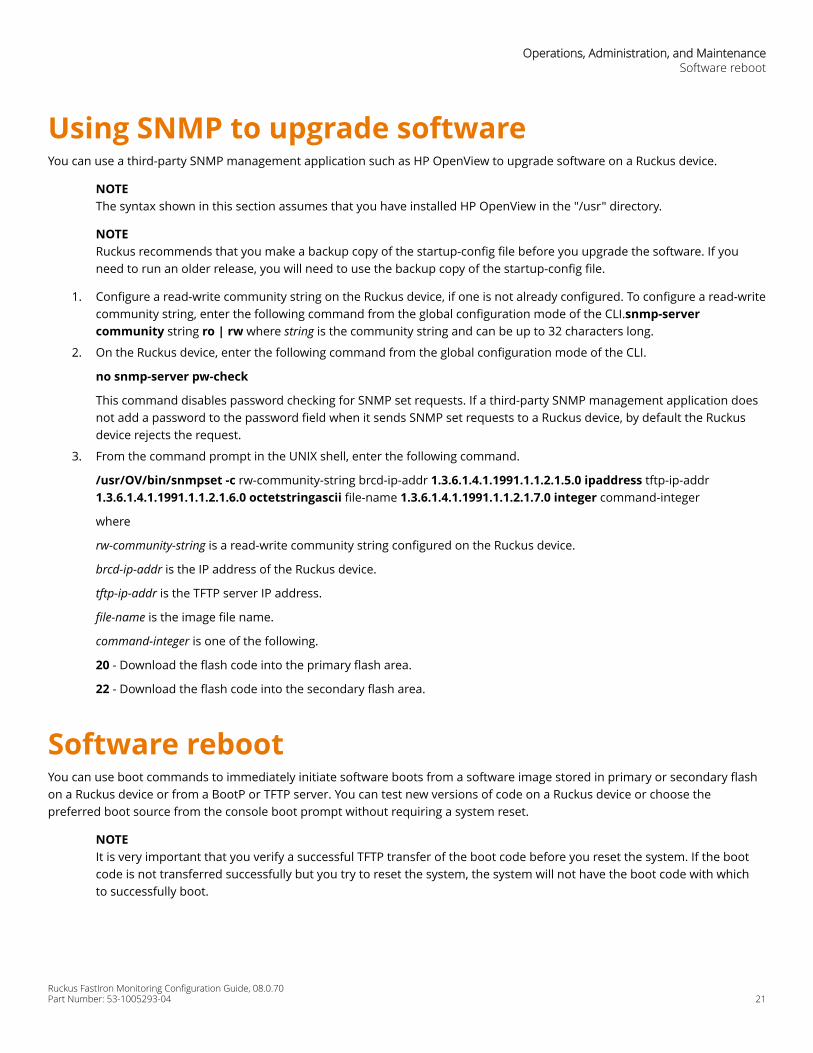
Using SNMP to upgrade softwareYou can use a third-party SNMP management application such as HP OpenView to upgrade software on a Ruckus device.
NOTEThe syntax shown in this section assumes that you have installed HP OpenView in the "/usr" directory.
NOTERuckus recommends that you make a backup copy of the startup-config file before you upgrade the software. If youneed to run an older release, you will need to use the backup copy of the startup-config file.
1. Configure a read-write community string on the Ruckus device, if one is not already configured. To configure a read-writecommunity string, enter the following command from the global configuration mode of the CLI.snmp-servercommunity string ro | rw where string is the community string and can be up to 32 characters long.
2. On the Ruckus device, enter the following command from the global configuration mode of the CLI.
no snmp-server pw-check
This command disables password checking for SNMP set requests. If a third-party SNMP management application doesnot add a password to the password field when it sends SNMP set requests to a Ruckus device, by default the Ruckusdevice rejects the request.
3. From the command prompt in the UNIX shell, enter the following command.
/usr/OV/bin/snmpset -c rw-community-string brcd-ip-addr 1.3.6.1.4.1.1991.1.1.2.1.5.0 ipaddress tftp-ip-addr1.3.6.1.4.1.1991.1.1.2.1.6.0 octetstringascii file-name 1.3.6.1.4.1.1991.1.1.2.1.7.0 integer command-integer
where
rw-community-string is a read-write community string configured on the Ruckus device.
brcd-ip-addr is the IP address of the Ruckus device.
tftp-ip-addr is the TFTP server IP address.
file-name is the image file name.
command-integer is one of the following.
20 - Download the flash code into the primary flash area.
22 - Download the flash code into the secondary flash area.
Software rebootYou can use boot commands to immediately initiate software boots from a software image stored in primary or secondary flashon a Ruckus device or from a BootP or TFTP server. You can test new versions of code on a Ruckus device or choose thepreferred boot source from the console boot prompt without requiring a system reset.
NOTEIt is very important that you verify a successful TFTP transfer of the boot code before you reset the system. If the bootcode is not transferred successfully but you try to reset the system, the system will not have the boot code with whichto successfully boot.
Operations, Administration, and MaintenanceSoftware reboot
Ruckus FastIron Monitoring Configuration Guide, 08.0.70Part Number: 53-1005293-04 21
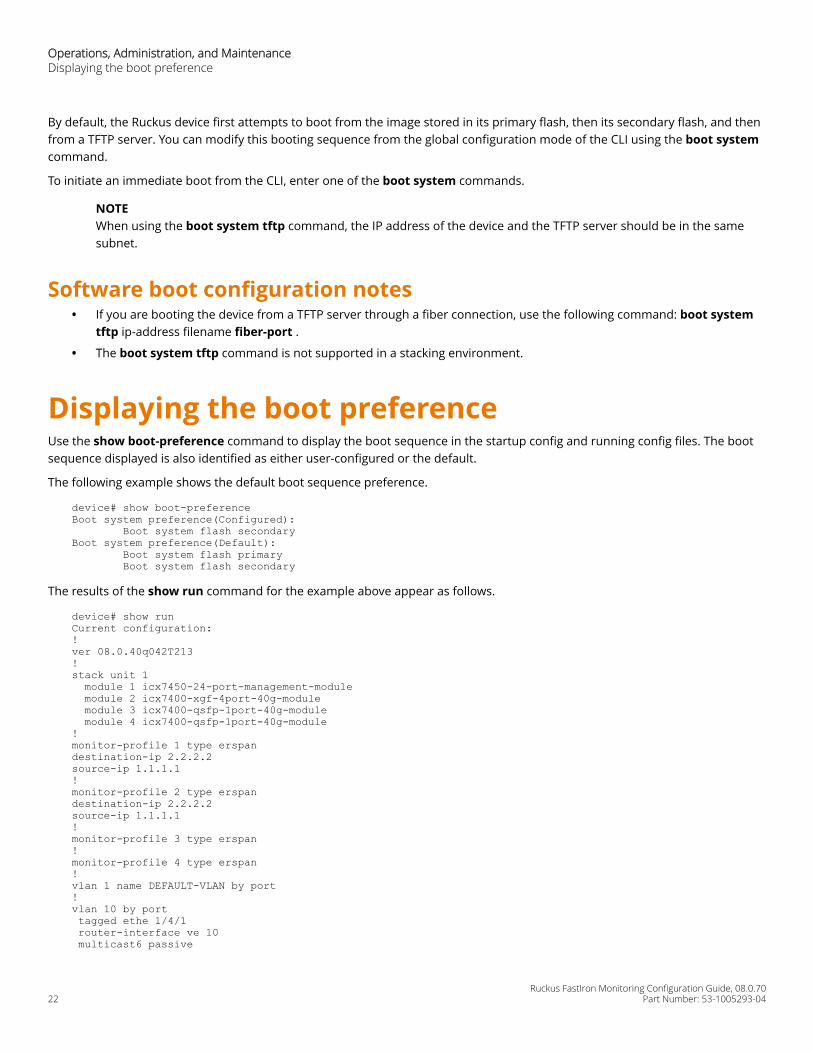
By default, the Ruckus device first attempts to boot from the image stored in its primary flash, then its secondary flash, and thenfrom a TFTP server. You can modify this booting sequence from the global configuration mode of the CLI using the boot systemcommand.
To initiate an immediate boot from the CLI, enter one of the boot system commands.
NOTEWhen using the boot system tftp command, the IP address of the device and the TFTP server should be in the samesubnet.
Software boot configuration notes• If you are booting the device from a TFTP server through a fiber connection, use the following command: boot system
tftp ip-address filename fiber-port .
• The boot system tftp command is not supported in a stacking environment.
Displaying the boot preferenceUse the show boot-preference command to display the boot sequence in the startup config and running config files. The bootsequence displayed is also identified as either user-configured or the default.
The following example shows the default boot sequence preference.
device# show boot-preferenceBoot system preference(Configured): Boot system flash secondaryBoot system preference(Default): Boot system flash primary Boot system flash secondary
The results of the show run command for the example above appear as follows.
device# show runCurrent configuration:!ver 08.0.40q042T213!stack unit 1 module 1 icx7450-24-port-management-module module 2 icx7400-xgf-4port-40g-module module 3 icx7400-qsfp-1port-40g-module module 4 icx7400-qsfp-1port-40g-module!monitor-profile 1 type erspandestination-ip 2.2.2.2source-ip 1.1.1.1!monitor-profile 2 type erspandestination-ip 2.2.2.2source-ip 1.1.1.1!monitor-profile 3 type erspan!monitor-profile 4 type erspan!vlan 1 name DEFAULT-VLAN by port!vlan 10 by port tagged ethe 1/4/1 router-interface ve 10 multicast6 passive
Operations, Administration, and MaintenanceDisplaying the boot preference
Ruckus FastIron Monitoring Configuration Guide, 08.0.7022 Part Number: 53-1005293-04
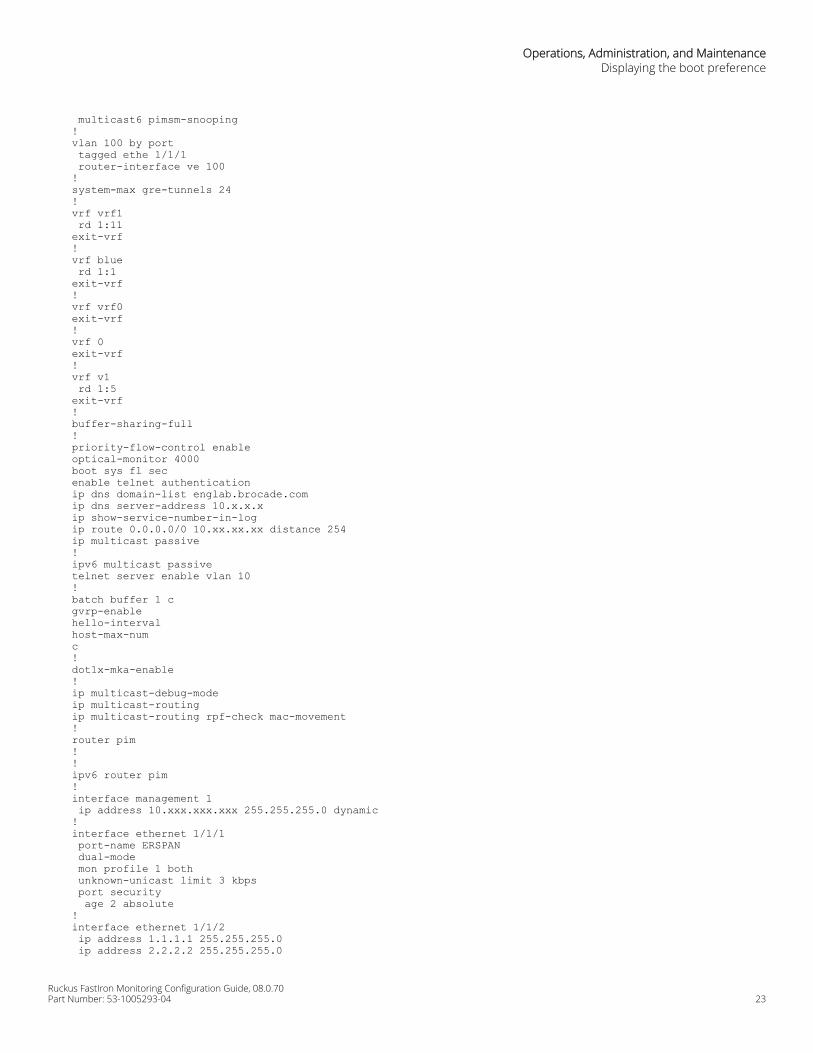
multicast6 pimsm-snooping!vlan 100 by port tagged ethe 1/1/1 router-interface ve 100!system-max gre-tunnels 24!vrf vrf1 rd 1:11exit-vrf!vrf blue rd 1:1exit-vrf!vrf vrf0exit-vrf!vrf 0exit-vrf!vrf v1 rd 1:5exit-vrf!buffer-sharing-full!priority-flow-control enableoptical-monitor 4000boot sys fl secenable telnet authenticationip dns domain-list englab.brocade.comip dns server-address 10.x.x.xip show-service-number-in-logip route 0.0.0.0/0 10.xx.xx.xx distance 254ip multicast passive!ipv6 multicast passivetelnet server enable vlan 10!batch buffer 1 cgvrp-enablehello-intervalhost-max-numc!dot1x-mka-enable!ip multicast-debug-modeip multicast-routingip multicast-routing rpf-check mac-movement!router pim!!ipv6 router pim!interface management 1 ip address 10.xxx.xxx.xxx 255.255.255.0 dynamic!interface ethernet 1/1/1 port-name ERSPAN dual-mode mon profile 1 both unknown-unicast limit 3 kbps port security age 2 absolute!interface ethernet 1/1/2 ip address 1.1.1.1 255.255.255.0 ip address 2.2.2.2 255.255.255.0
Operations, Administration, and MaintenanceDisplaying the boot preference
Ruckus FastIron Monitoring Configuration Guide, 08.0.70Part Number: 53-1005293-04 23
!interface ve 10!interface ve 100!router msdp sa-filter originate route-map w2!end
Loading and saving configuration filesFor easy configuration management, all Ruckus devices support both the download and upload of configuration files betweenthe devices and a TFTP server on the network.
You can upload either the startup configuration file or the running configuration file to the TFTP server for backup and use inbooting the system:
• Startup configuration file - This file contains the configuration information that is currently saved in flash. To display thisfile, enter the show configuration command at any CLI prompt.
• Running configuration file - This file contains the configuration active in the system RAM but not yet saved to flash.These changes could represent a short-term requirement or general configuration change. To display this file, enter theshow running-config or write terminal command at any CLI prompt.
Each device can have one startup configuration file and one running configuration file. The startup configuration file is shared byboth flash modules. The running configuration file resides in DRAM.
When you load the startup-config file, the CLI parses the file three times.
1. During the first pass, the parser searches for system-max commands. A system-max command changes the size ofstatically configured memory.
2. During the second pass, the parser implements the system-max commands if present and also implements trunkconfiguration commands (trunk command) if present.
3. During the third pass, the parser implements the remaining commands.
Replacing the startup configuration with the running configurationAfter you make configuration changes to the active system, you can save those changes by writing them to flash memory. Whenyou write configuration changes to flash memory, you replace the startup configuration with the running configuration.
To replace the startup configuration with the running configuration, enter the following command at any enable or configurationcommand prompt.
device# write memory
NOTETo return the unit to the default startup configuration, use the delete startup-config command.
Replacing the running configuration with the startup configurationIf you want to back out of the changes you have made to the running configuration and return to the startup configuration, enterthe following command from the privileged exec mode of the CLI.
device# reload
Operations, Administration, and MaintenanceLoading and saving configuration files
Ruckus FastIron Monitoring Configuration Guide, 08.0.7024 Part Number: 53-1005293-04
Logging changes to the startup-config fileYou can configure a Ruckus device to generate a Syslog message when the startup-config file is changed. The trap is enabled bydefault.
The following Syslog message is generated when the startup-config file is changed.
startup-config was changed
If the startup-config file was modified by a valid user, the following Syslog message is generated.
startup-config was changed by username
To disable or re-enable Syslog messages when the startup-config file is changed, use the following command.
device# [no] logging enable config-changed
Copying a configuration file to or from a TFTP serverTo copy the startup-config or running-config file to or from a TFTP server, use the following method.
NOTEFor details about the copy command used with IPv6, refer to Using the IPv6 copy command on page 28.
NOTEYou can name the configuration file when you copy it to a TFTP server. However, when you copy a configuration filefrom the server to a Ruckus device, the file is always copied as "startup-config" or "running-config", depending on whichtype of file you saved to the server.
To initiate transfers of configuration files to or from a TFTP server using the CLI, enter one of the following commands:
• copy startup-config tftp tftp-ip-addr filename - Use this command to upload a copy of the startup configuration filefrom the Layer 2 Switch or Layer 3 Switch to a TFTP server.
• copy running-config tftp tftp-ip-addr filename - Use this command to upload a copy of the running configuration filefrom the Layer 2 Switch or Layer 3 Switch to a TFTP server.
• copy tftp startup-config tftp-ip-addr filename - Use this command to download a copy of the startup configurationfile from a TFTP server to a Layer 2 Switch or Layer 3 Switch.
NOTEIt is recommended to use a script or the copy running-config tftp command for extensive configuration. You shouldnot copy-paste configuration with more than 2000 characters into CLI.
Dynamic configuration loadingYou can load dynamic configuration commands (commands that do not require a reload to take effect) from a file on a TFTPserver into the running-config on the Ruckus device. You can make configuration changes off-line, then load the changes directlyinto the device running-config, without reloading the software.
Dynamic configuration usage considerations• Use this feature only to load configuration information that does not require a software reload to take effect. For
example, you cannot use this feature to change statically configured memory (system-max command) or to enter trunkgroup configuration information into the running-config.
Operations, Administration, and MaintenanceLoading and saving configuration files
Ruckus FastIron Monitoring Configuration Guide, 08.0.70Part Number: 53-1005293-04 25
• Do not use this feature if you have deleted a trunk group but have not yet placed the changes into effect by saving theconfiguration and then reloading. When you delete a trunk group, the command to configure the trunk group isremoved from the device running-config, but the trunk group remains active. To finish deleting a trunk group, save theconfiguration (to the startup-config file), then reload the software. After you reload the software, then you can load theconfiguration from the file.
• Do not load port configuration information for member ports in a trunk group. Since all ports in a trunk group use theport configuration settings of the LAG virtual interface in the group, the software cannot implement the changes to themember port.
Preparing the configuration fileA configuration file that you create must follow the same syntax rules as the startup-config file the device creates.
• The configuration file is a script containing CLI configuration commands. The CLI reacts to each command entered fromthe file in the same way the CLI reacts to the command if you enter it. For example, if the command results in an errormessage or a change to the CLI configuration mode, the software responds by displaying the message or changing theCLI mode.
• The software retains the running-config that is currently on the device, and changes the running-config only by addingnew commands from the configuration file. If the running config already contains a command that is also in theconfiguration file you are loading, the CLI rejects the new command as a duplicate and displays an error message. Forexample, if the running-config already contains a a command that configures ACL 1, the software rejects ACL 1 in theconfiguration file, and displays a message that ACL 1 is already configured.
• The file can contain global configuration commands or configuration commands for interfaces, routing protocols, and soon. You cannot enter User exec or privileged exec commands.
• The default CLI configuration mode in a configuration file is the global configuration model. Thus, the first command inthe file must be a global configuration command or " ! ". The ! (exclamation point) character means "return to the globalconfiguration mode".
NOTEYou can enter text following " ! " as a comment. However, the " !" is not a comment marker. It returns the CLI to theglobal configuration mode.
NOTEIf you copy-and-paste a configuration into a management session, the CLI ignores the " ! " instead of changing the CLI tothe global configuration mode. As a result, you might get different results if you copy-and-paste a configuration insteadof loading the configuration using TFTP.
• Make sure you enter each command in the correct CLI mode. Since some commands have identical forms at both theglobal configuration mode and individual configuration modes, if the CLI response to the configuration file results in theCLI entering a configuration mode you did not intend, then you can get unexpected results.
For example, if a trunk group is active on the device, and the configuration file contains a command to disable STP on one of thesecondary ports in the trunk group, the CLI rejects the commands to enter the interface configuration mode for the port andmoves on to the next command in the file you are loading. If the next command is a spanning-tree command whose syntax isvalid at the global mode as well as the interface configuration mode, then the software applies the command globally. Here is anexample.
The configuration file contains these commands.
interface ethernet 1/1/2no spanning-tree
Operations, Administration, and MaintenanceLoading and saving configuration files
Ruckus FastIron Monitoring Configuration Guide, 08.0.7026 Part Number: 53-1005293-04
The CLI responds like this.
device(config)# interface ethernet 1/1/2 Error - cannot configure secondary ports of a trunkdevice(config)# no spanning-treedevice(config)#
• If the file contains commands that must be entered in a specific order, the commands must appear in the file in therequired order. For example, if you want to use the file to replace an IP address on an interface, you must first removethe old address using "no" in front of the ip address command, then add the new address. Otherwise, the CLI displaysan error message and does not implement the command. Here is an example.
The configuration file contains these commands.
interface ethernet 1/1/2ip address 10.10.10.10/24
The running-config already has a command to add an address to port 1/1/2, so the CLI responds like this.
device(config)# interface ethernet 1/1/2 device(config-if-e1000-11)# ip add 10.10.10.10/24Error: can only assign one primary ip address per subnetdevice(config-if-e1000-1/1/2)#
To successfully replace the address, enter commands into the file as follows.
interface ethernet 1/1/2no ip address 10.20.20.20/24ip address 10.10.10.10/24
This time, the CLI accepts the command, and no error message is displayed.
device(config)# interface ethernet 1/1/2device(config-if-e1000-1/1/2)# no ip add 10.20.20.20/24device(config-if-e1000-1/1/2)# ip add 10.10.10.10/24device(config-if-e1000-1/1/2)#
• Always use the end command at the end of the file. The end command must appear on the last line of the file, by itself.
Loading the configuration information into the running-configTo load the file from a TFTP server, use the following command:
copy tftp running-config ip-addr filename
NOTEIn the current FastIron release, the copy tftp running-config command merges only the access-lists and mac-filtersconfiguration from the configuration file on the TFTP server to the running configuration on the device.
NOTEIf you are loading a configuration file that uses a truncated form of the CLI command access-list , the software will notgo into batch mode.
For example, the following command line will initiate batch mode.
access-list 131 permit host pc1 host pc2
The following command line will not initiate batch mode.
acc 131 permit host pc1 host pc2
Operations, Administration, and MaintenanceLoading and saving configuration files
Ruckus FastIron Monitoring Configuration Guide, 08.0.70Part Number: 53-1005293-04 27
Maximum file sizes for startup-config file and running-configEach Ruckus device has a maximum allowable size for the running-config and the startup-config file. If you use TFTP to loadadditional information into a device running-config or startup-config file, it is possible to exceed the maximum allowable size. Ifthis occurs, you will not be able to save the configuration changes.
The maximum size for the running-config and the startup-config file is 640K each.
To determine the size of a running-config or startup-config file, copy it to a TFTP server, then use the directory services on theserver to list the size of the copied file. To copy the running-config or startup-config file to a TFTP server, use the followingcommands:
• Command to copy the running-config to a TFTP server:
– copy running-config tftp ip-addr filename
• Command to copy the startup-config file to a TFTP server:
– copy startup-config tftp ip-addr filename
Loading and saving configuration files with IPv6This section describes the IPv6 copy command.
Using the IPv6 copy commandThe copy command for IPv6 allows you to do the following:
• Copy a file from a specified source to an IPv6 TFTP server
• Copy a file from an IPv6 TFTP server to a specified destination
Copying a file to an IPv6 TFTP serverYou can copy a file from the following sources to an IPv6 TFTP server:
• Flash memory
• Running configuration
• Startup configuration
Copying a file from flash memoryFor example, to copy the primary or secondary boot image from the device flash memory to an IPv6 TFTP server, enter acommand such as the following.
device# copy flash tftp 2001:DB8:e0ff:7837::3 test.img secondary
This command copies the secondary boot image named test.img from flash memory to a TFTP server with the IPv6 address of2001:DB8:e0ff:7837::3.
Copying a file from the running or startup configurationFor example, to copy the running configuration to an IPv6 TFTP server, enter a command such as the following.
device# copy running-config tftp 2001:DB8:e0ff:7837::3 newrun.cfg
Operations, Administration, and MaintenanceLoading and saving configuration files with IPv6
Ruckus FastIron Monitoring Configuration Guide, 08.0.7028 Part Number: 53-1005293-04
This command copies the running configuration to a TFTP server with the IPv6 address of 2001:DB8:e0ff:7837::3 and names thefile on the TFTP server newrun.cfg.
Copying a file from an IPv6 TFTP serverYou can copy a file from an IPv6 TFTP server to the following destinations:
• Flash memory
• Running configuration
• Startup configuration
Copying a file to flash memoryFor example, to copy a boot image from an IPv6 TFTP server to the primary or secondary storage location in the device flashmemory, enter a command such as the following.
device# copy tftp flash 2001:DB8:e0ff:7837::3 test.img secondary
This command copies a boot image named test.img from an IPv6 TFTP server with the IPv6 address of 2001:DB8:e0ff:7837::3 tothe secondary storage location in the device flash memory.
Copying a file to the running or startup configurationFor example, to copy a configuration file from an IPv6 TFTP server to the running or startup configuration, enter a command suchas the following.
device# copy tftp running-config 2001:DB8:e0ff:7837::3 newrun.cfg overwrite
This command copies the newrun.cfg file from the IPv6 TFTP server and overwrites the running configuration file with thecontents of newrun.cfg.
NOTETo activate this configuration, you must reload (reset) the device.
IPv6 copy commandThe copy command for IPv6 allows you to do the following:
• Copy a primary or secondary boot image from flash memory to an IPv6 TFTP server.
• Copy the running configuration to an IPv6 TFTP server.
• Copy the startup configuration to an IPv6 TFTP server
• Upload various files from an IPv6 TFTP server.
Copying a primary or secondary boot Image from flash memory to an IPv6 TFTP serverFor example, to copy the primary or secondary boot image from the device flash memory to an IPv6 TFTP server, enter acommand such as the following.
device# copy flash primary tftp 2001:DB8:e0ff:7837::3 primary.img
This command copies the primary boot image named primary.img from flash memory to a TFTP server with the IPv6 address of2001:DB8:e0ff:7837::3.
Operations, Administration, and MaintenanceLoading and saving configuration files with IPv6
Ruckus FastIron Monitoring Configuration Guide, 08.0.70Part Number: 53-1005293-04 29
Copying the running or startup configuration to an IPv6 TFTP serverFor example, to copy a device running or startup configuration to an IPv6 TFTP server, enter a command such as the following.
device# copy running-config tftp 2001:DB8:e0ff:7837::3 bakrun.cfg
This command copies a device running configuration to a TFTP server with the IPv6 address of 2001:DB8:e0ff:7837::3 and namesthe destination file bakrun.cfg.
IPv6 TFTP server file uploadYou can upload the following files from an IPv6 TFTP server:
• Primary boot image.
• Secondary boot image.
• Running configuration.
• Startup configuration.
Uploading a primary or secondary boot image from an IPv6 TFTP serverFor example, to upload a primary or secondary boot image from an IPv6 TFTP server to a device flash memory, enter a commandsuch as the following.
device# copy tftp 2001:DB8:e0ff:7837::3 primary.img flash primary
This command uploads the primary boot image named primary.img from a TFTP server with the IPv6 address of 2001:DB8:e0ff:7837::3 to the device primary storage location in flash memory.
Uploading a running or startup configuration from an IPv6 TFTP serverFor example to upload a running or startup configuration from an IPv6 TFTP server to a device, enter a command such as thefollowing.
device# copy tftp 2001:DB8:e0ff:7837::3 newrun.cfg running-config
This command uploads a file named newrun.cfg from a TFTP server with the IPv6 address of 2001:DB8:e0ff:7837::3 to the device.
Using SNMP to save and load configuration informationYou can use a third-party SNMP management application such as HP OpenView to save and load a configuration on a Ruckusdevice. To save and load configuration information using HP OpenView, use the following procedure.
NOTEThe syntax shown in this section assumes that you have installed HP OpenView in the /usr directory.
1. Configure a read-write community string on the device, if one is not already configured. To configure a read-writecommunity string, enter the following command from the global configuration mode of the CLI.
device(config)# snmp-server community community_string rw
Operations, Administration, and MaintenanceLoading and saving configuration files with IPv6
Ruckus FastIron Monitoring Configuration Guide, 08.0.7030 Part Number: 53-1005293-04
2. On the device, enter the following command from the global configuration mode of the CLI.
device(config)# no snmp-server pw-check
This command disables password checking for SNMP set requests. If a third-party SNMP management application doesnot add a password to the password field when it sends SNMP set requests to a device, by default the device rejects therequest.
3. From the command prompt in the UNIX shell, enter the following command.
unix-shell> /usr/OV/bin/snmpset - rw-community-string device-ip-addr c 1.3.6.1.4.1.1991.1.1.2.1.5.0 a tftp-ip-addr 1.3.6.1.4.1.1991.1.1.2.1.8.0 sconfig-file-name 1.3.6.1.4.1.1991.1.1.2.1.9.0 integer command-integer
Where
rw-community-string is a read-write community string configured on the Ruckus device.
fdry-ip-addr is the IP address of the Ruckus device.
tftp-ip-addr is the TFTP server IP address.
config-file-name is the configuration file name.
command-integer is one of the following:
• 20 — Upload the startup-config file from the flash memory of the device to the TFTP server.
• 21 — Download a startup-config file from a TFTP server to the flash memory of the Ruckus device.
• 22 — Upload the running-config from the flash memory of the Ruckus device to the TFTP server.
• 23 — Download a configuration file from a TFTP server into the running-config of the Ruckus device.
NOTEOption 23 adds configuration information to the running-config on the device, and does not replacecommands. If you want to replace configuration information in the device, use "no" forms of the configurationcommands to remove the configuration information, then use configuration commands to create theconfiguration information you want. Follow the guidelines in Dynamic configuration loading on page 25.
Erasing image and configuration filesTo erase software images or configuration files, use the commands described below. These commands are valid from theprivileged exec mode of the CLI:
• erase flash primary erases the image stored in primary flash of the system.
• erase flash secondary erases the image stored in secondary flash of the system.
• erase startup-config erases the configuration stored in the startup configuration file; however, the runningconfiguration remains intact until system reboot.
System reload schedulingIn addition to reloading the system manually, you can configure the Ruckus device to reload itself at a specific time or after aspecific amount of time has passed.
Operations, Administration, and MaintenanceSystem reload scheduling
Ruckus FastIron Monitoring Configuration Guide, 08.0.70Part Number: 53-1005293-04 31
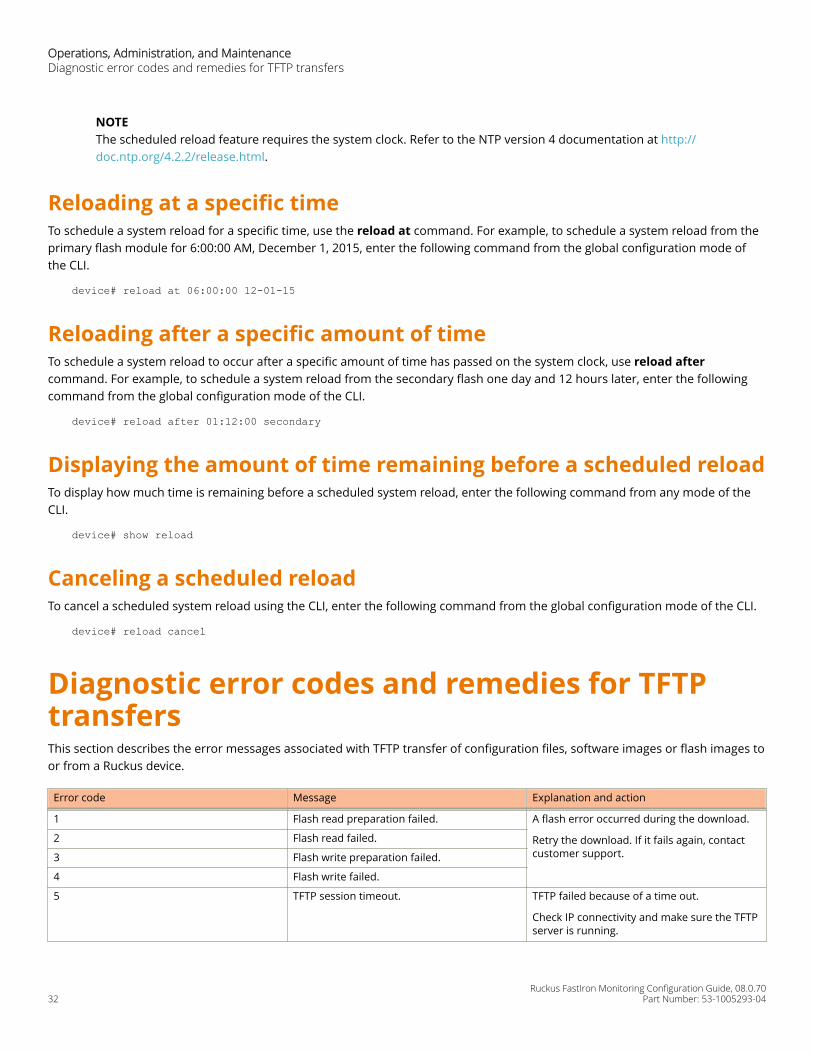
NOTEThe scheduled reload feature requires the system clock. Refer to the NTP version 4 documentation at http://doc.ntp.org/4.2.2/release.html.
Reloading at a specific timeTo schedule a system reload for a specific time, use the reload at command. For example, to schedule a system reload from theprimary flash module for 6:00:00 AM, December 1, 2015, enter the following command from the global configuration mode ofthe CLI.
device# reload at 06:00:00 12-01-15
Reloading after a specific amount of timeTo schedule a system reload to occur after a specific amount of time has passed on the system clock, use reload aftercommand. For example, to schedule a system reload from the secondary flash one day and 12 hours later, enter the followingcommand from the global configuration mode of the CLI.
device# reload after 01:12:00 secondary
Displaying the amount of time remaining before a scheduled reloadTo display how much time is remaining before a scheduled system reload, enter the following command from any mode of theCLI.
device# show reload
Canceling a scheduled reloadTo cancel a scheduled system reload using the CLI, enter the following command from the global configuration mode of the CLI.
device# reload cancel
Diagnostic error codes and remedies for TFTPtransfersThis section describes the error messages associated with TFTP transfer of configuration files, software images or flash images toor from a Ruckus device.
Error code Message Explanation and action
1 Flash read preparation failed. A flash error occurred during the download.
Retry the download. If it fails again, contactcustomer support.
2 Flash read failed.
3 Flash write preparation failed.
4 Flash write failed.
5 TFTP session timeout. TFTP failed because of a time out.
Check IP connectivity and make sure the TFTPserver is running.
Operations, Administration, and MaintenanceDiagnostic error codes and remedies for TFTP transfers
Ruckus FastIron Monitoring Configuration Guide, 08.0.7032 Part Number: 53-1005293-04
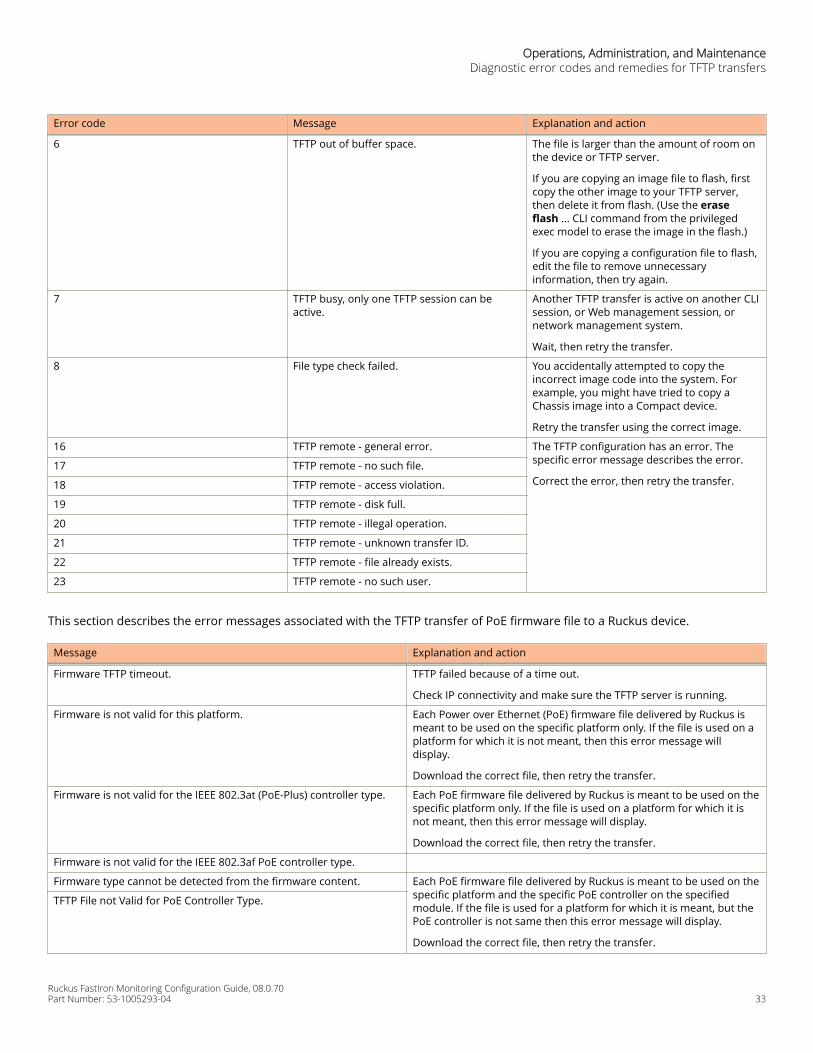
Error code Message Explanation and action
6 TFTP out of buffer space. The file is larger than the amount of room onthe device or TFTP server.
If you are copying an image file to flash, firstcopy the other image to your TFTP server,then delete it from flash. (Use the eraseflash ... CLI command from the privilegedexec model to erase the image in the flash.)
If you are copying a configuration file to flash,edit the file to remove unnecessaryinformation, then try again.
7 TFTP busy, only one TFTP session can beactive.
Another TFTP transfer is active on another CLIsession, or Web management session, ornetwork management system.
Wait, then retry the transfer.
8 File type check failed. You accidentally attempted to copy theincorrect image code into the system. Forexample, you might have tried to copy aChassis image into a Compact device.
Retry the transfer using the correct image.
16 TFTP remote - general error. The TFTP configuration has an error. Thespecific error message describes the error.
Correct the error, then retry the transfer.17 TFTP remote - no such file.
18 TFTP remote - access violation.
19 TFTP remote - disk full.
20 TFTP remote - illegal operation.
21 TFTP remote - unknown transfer ID.
22 TFTP remote - file already exists.
23 TFTP remote - no such user.
This section describes the error messages associated with the TFTP transfer of PoE firmware file to a Ruckus device.
Message Explanation and action
Firmware TFTP timeout. TFTP failed because of a time out.
Check IP connectivity and make sure the TFTP server is running.
Firmware is not valid for this platform. Each Power over Ethernet (PoE) firmware file delivered by Ruckus ismeant to be used on the specific platform only. If the file is used on aplatform for which it is not meant, then this error message willdisplay.
Download the correct file, then retry the transfer.
Firmware is not valid for the IEEE 802.3at (PoE-Plus) controller type. Each PoE firmware file delivered by Ruckus is meant to be used on thespecific platform only. If the file is used on a platform for which it isnot meant, then this error message will display.
Download the correct file, then retry the transfer.
Firmware is not valid for the IEEE 802.3af PoE controller type.
Firmware type cannot be detected from the firmware content. Each PoE firmware file delivered by Ruckus is meant to be used on thespecific platform and the specific PoE controller on the specifiedmodule. If the file is used for a platform for which it is meant, but thePoE controller is not same then this error message will display.
Download the correct file, then retry the transfer.
TFTP File not Valid for PoE Controller Type.
Operations, Administration, and MaintenanceDiagnostic error codes and remedies for TFTP transfers
Ruckus FastIron Monitoring Configuration Guide, 08.0.70Part Number: 53-1005293-04 33

Message Explanation and action
Firmware TFTP remote file access failed. The TFTP server needs read access on the PoE firmware file. Check thepermissions on the file, then try again.
Network connectivity testingAfter you install the network cables, you can test network connectivity to other devices by pinging those devices. You also canobserve the LEDs related to network connection and perform trace routes.
For more information about observing LEDs, refer to the appropriate Hardware Installation Guide.
Pinging an IPv4 addressNOTEThis section describes the IPv4 ping command. For details about IPv6 ping command, refer to the Ruckus FastIron Layer3 Routing Configuration Guide.
To verify that a Ruckus device can reach another device through the network, enter a command such as the following from anymode of the CLI on the Ruckus device:
device# ping 10.33.4.7
NOTEIf the device is a Ruckus Layer 2 Switch or Layer 3 Switch, you can use the host name only if you have already enabledthe Domain Name Server (DNS) resolver feature on the device from which you are sending the ping.
Tracing an IPv4 routeNOTEThis section describes the IPv4 traceroute command. For details about IPv6 traceroute command, refer to the RuckusFastIron Layer 3 Routing Configuration Guide.
Use the traceroute command to determine the path through which a Ruckus device can reach another device. Enter thecommand from any mode of the CLI.
The CLI displays trace route information for each hop as soon as the information is received. Traceroute requests display allresponses to a given TTL. In addition, if there are multiple equal-cost routes to the destination, the Ruckus device displays up tothree responses by default.
device# traceroute 10.33.4.7
IEEE 802.3ah EFM-OAMThe IEEE 802.3ah Ethernet in the First Mile (EFM) standard specifies the protocols and Ethernet interfaces for using Ethernet overaccess links as a first-mile technology.
Using the Ethernet in the First Mile solution, you will gain broadcast Internet access, in addition to services, such as Layer 2transparent LAN services, voice services over Ethernet Access networks, and video and multicast applications, reinforced bysecurity and Quality of Service control in order to build a scalable network.
Operations, Administration, and MaintenanceNetwork connectivity testing
Ruckus FastIron Monitoring Configuration Guide, 08.0.7034 Part Number: 53-1005293-04
The in-band management specified by IEEE 802.3ah EFM standard defines the operations, administration and maintenance(OAM) mechanism needed for the advanced monitoring and maintenance of Ethernet links in the first mile. The OAM capabilitiesfacilitate network operation and troubleshooting. Basic 802.3 frames convey OAM data between two ends of the physical link.EFM-OAM is optional and can be disabled on each physical port.
When OAM is present, two connected OAM sub-layers exchange protocol data units (OAMPDUs). OAMPDUs are standard-sizeframes that can be sent at a maximum rate of 10 frames per second. This limitation is necessary for reducing the impact on theusable bandwidth. It is possible to send each frame several times in order to increase the probability of reception. A combinationof the destination MAC address, the Ethernet type/length field and subtype allow distinguishing OAMPDU frames from otherframes.
OAM functionality is designed to provide reliable service assurance mechanisms for both provider and customer networks.
Network deployment use caseThe data-link layer OAM is targeted at last-mile applications, and service providers can use it for demarcation point OAM services.
Ethernet last-mile applications require robust infrastructure that is both passive and active. 802.3ah OAM aims to solve validationand testing problems in such an infrastructure.
Using the Ethernet demarcation, service providers can additionally manage the remote device without utilizing an IP layer. Thiscan be done by using link-layer SNMP counters, request and reply, loopback testing, and other techniques.
EFM-OAM protocolThe functionality of the EFM-OAM can be summarized under the following categories:
• Discovery: Discovery is the mechanism to detect the presence of an OAM sub-layer on the remote device. During thediscovery process, information about OAM entities, capabilities, and configurations are exchanged.
• Remote fault detection: Provides a mechanism for an OAM entity to convey error conditions to its peer by way of a flagin the OAMPDUs.
• Remote loopback: This mechanism is used to troubleshoot networks and to isolate problem segments in a largenetwork by sending test segments.
DiscoveryDiscovery is the first phase of EFM-OAM. At this phase, EFM-OAM identifies network devices along with their OAM capabilities.The Discovery process relies on the Information OAMPDUs. During discovery, the following information is advertised through theTLVs within periodic information OAMPDUs:
• OAM capabilities: Advertises the capabilities of the local OAM entity. Using this information, a peer can determine whatfunctions are supported and accessible (for example, loopback capability).
• OAM mode: The OAM mode is conveyed to the remote OAM entity. The mode can be either active or passive, and canalso be used to determine a device’s functionality.
• OAMPDU configuration: This configuration includes the maximum OAMPDU size to delivery. In combination with thelimited rate of 10 frames per second, this information can be used to limit the bandwidth allocated to OAM traffic.
Operations, Administration, and MaintenanceIEEE 802.3ah EFM-OAM
Ruckus FastIron Monitoring Configuration Guide, 08.0.70Part Number: 53-1005293-04 35
Timers
Two configurable timers control the protocol, one determining the rate at which OAMPDUs are to be sent, and the secondcontrolling the rate at which OAMPDUs are to be received to maintain the Discovery procedure from resetting.
• The timer should generate PDUs in the range of 1 - 10 PDUs per second. The default value is 1 PDU per second.
• The Hold timer assumes the peer is dead if no packet is received for a period of 1 - 10 seconds. The default value is 5seconds.
Flags
Included in every OAMPDU is a flags field, which contains, besides other information, the status of the discovery process. Thereare three possible values for the status:
• Discovering: Discovery is in progress.
• Stable: Discovery is completed. Once aware of this, the remote OAM entity can start sending any type of OAMPDU.
• Unsatisfied: When there are mismatches in the OAM configuration that prevent OAM from completing the discovery, thediscovery process is considered unsatisfied and cannot continue.
Process overviewThe discovery process allows local Data Terminating Entity (DTE) to detect OAM on a remote DTE. Once OAM support is detected,both ends of the link exchange state and configuration information (such as mode, PDU size, loopback support, and so on). Ifboth DTEs are satisfied with the settings, OAM is enabled on the link. However, the loss of a link or a failure to receive OAMPDUsfor five seconds may cause the discovery process the start over again.
DTEs may be in either active or passive mode. Active mode DTEs instigate OAM communications and can issue queries andcommands to a remote device. Passive mode DTEs generally wait for the peer device to instigate OAM communications andrespond to, but do not instigate, commands and queries. Rules of what DTEs in active or passive mode can do are discussed inthe following sections.
Rules for active modeA DTE in active mode:
• Initiates the OAM Discovery process
• Sends information PDUs
• May send event notification PDUs
• May send variable request or response PDUs
• May send loopback control PDUs
Exceptions• A DTE in active mode does not respond to variable request PDUs from DTEs in passive mode
• A DTE in active mode does not react to loopback control PDUs from DTEs in passive mode
Rules for passive modeA DTE in passive mode:
• Waits for the remote device to initiate the Discovery process
Operations, Administration, and MaintenanceIEEE 802.3ah EFM-OAM
Ruckus FastIron Monitoring Configuration Guide, 08.0.7036 Part Number: 53-1005293-04
• Sends information PDUs
• May send event notification PDUs
• May respond to variable request PDUs
• May react to received loopback control PDUs
• Is not permitted to send variable request or loopback control OAMPDUs
Remote failure indicationFaults in Ethernet that are caused by slowly deteriorating quality are more difficult to detect than completely disconnected links.A flag in the OAMPDU allows an OAM entity to send failure conditions to its peer. The failure conditions are defined as follows:
• Dying gasp: This condition is detected when the receiver goes down. The dying gasp condition is considered asunrecoverable. The conditions for a dying gasp condition include:
– Reload command (Warm reboot)– Boot system flash pri/sec command (Warm reboot)– Failure on the box (Cold reboot)
• Critical event: On any critical event, the DTE will set the critical event bit in the information OAMPDU. The device willgenerate critical event in the following cases:
– When the temperature of the box breaches the warning/shutdown threshold– Fan failure
The battleshort mode allows you to prevent the shutdown of ICX 7450 and ICX 7750 when the temperature of the box breachesthe warning or shutdown threshold. This is intended to be used in emergency conditions to allow the switches to function in ahostile environment as long as possible.
To enable the battleshort mode, execute the ignore-temp-shutdown command form global configuration mode. This commandcan also be configured at a unit level. By default, the battleshort mode is disabled.
Remote loopbackAn OAM entity can put its remote entity into loopback mode using a loopback control OAMPDU. This helps you ensure quality oflinks during installation or when troubleshooting. In loopback mode, each frame received is transmitted back on that same portexcept for OAMPDUs and pause frames. The periodic exchange of OAMPDUs must continue while in the loopback state tomaintain the OAM session. The loopback command is acknowledged by responding with an information OAMPDU with theloopback state indicated in the state field.
NOTERuckus recommends to ensure that any higher layer protocol running over the local and remote loopback ports doesnot block the interfaces in the VLAN on which loopback traffic testing is being performed.
NOTEEthernet loopback and EFM-OAM remote loopback cannot be configured on the same interface.
NOTEIf EEE is enabled globally, port ceases to be in the remote loopback mode.
Operations, Administration, and MaintenanceIEEE 802.3ah EFM-OAM
Ruckus FastIron Monitoring Configuration Guide, 08.0.70Part Number: 53-1005293-04 37
EFM-OAM error disable recoveryThe error disable recovery feature enables the device to recover the EFM-OAM interface from the error-disabled state caused byreception of a critical event from the remote device. Enter the errdisable recovery cause loam-critical-event command toenable automatic recovery of ports from error-disabled state.
The ports will recover automatically from the error-disabled state upon the expiry of the error disable recovery timeout value.
Configuring EFM-OAMThe EFM-OAM configuration includes the following procedural steps to enable EFM-OAM on an interface or multiple interfacesfor advanced monitoring and maintenance of Ethernet network.
1. Enter the configure terminal command to enter global configuration mode.
device# configure terminal
2. Enter the link-oam command to enable the EFM-OAM protocol and enter EFM-OAM protocol configuration mode.
device(config)# link-oamdevice(config-link-oam)#
3. Enter the timeout command to configure the time in seconds for which the local Data Terminal Equipment (DTE) waitsto receive OAM Protocol Data Units (OAM-PDUs) from the remote entity.
device(config-link-oam)# timeout 5
4. Enter the pdu-rate command to configure the number of PDUs to be transmitted per second by the DTE.
device(config-link-oam)# pdu-rate 2
5. Enter the ethernet command to enable EFM-OAM on an interface.
EFM-OAM can be enabled on more than one interface. You can also specify a range of interfaces to enable EFM-OAM onmultiple interfaces.
You can set the operational mode of EFM-OAM as Active or Passive.
• Enter the ethernet stackid/slot/port active command to set the EFM-OAM operational mode as active on aninterface.
device(config-link-oam)# ethernet 1/1/3 activedevice(config-link-oam)# ethernet 1/1/4 active
• Enter the ethernet stackid/slot/port to stackid/slot/port active command to set the EFM-OAM operational mode asactive on a range of interfaces.
device(config-link-oam)# ethernet 1/1/5 to 1/1/8 active
• Enter the ethernet stackid/slot/port passive command to set the EFM-OAM operational mode as passive on aninterface.
device(config-link-oam)# ethernet 2/1/1 passive
• Enter the ethernet stackid/slot/port to stackid/slot/port passive command to set the EFM-OAM operational mode aspassive on a range of interfaces.
device(config-link-oam)# ethernet 2/1/1 to 2/1/8 passive
Operations, Administration, and MaintenanceIEEE 802.3ah EFM-OAM
Ruckus FastIron Monitoring Configuration Guide, 08.0.7038 Part Number: 53-1005293-04
6. (Optional) Enter the ethernet stackid/slot/port allow-loopback command to enable the interface to respond to aloopback request from the remote device.
device(config-link-oam)# ethernet 1/1/3 allow-loopback
7. (Optional) Enter the ethernet stackid/slot/port remote-failure command to set the device for the remote-failure actionto be taken upon the reception of critical event information on the interface.
device(config-link-oam)# ethernet 1/1/3 remote-failure critical-event action block-interface
8. (Optional) Enter the remote-loopback ethernet stackid/slot/port command to start or stop the remote loopbackprocedure on a remote device.
device(config-link-oam)# remote-loopback ethernet 2/1/1 startdevice(config-link-oam)# remote-loopback ethernet 2/1/1 stop
The following shows an example of EFM-OAM configuration.
device# configure terminaldevice(config)# link-oamdevice(config-link-oam)# timeout 5device(config-link-oam)# pdu-rate 2device(config-link-oam)# ethernet 1/1/3 activedevice(config-link-oam)# ethernet 1/1/3 allow-loopbackdevice(config-link-oam)# remote-loopback ethernet 2/1/1 start device(config-link-oam)# ethernet 1/1/3 remote-failure critical-event action block-interface
Displaying OAM informationThe following sample output of the show link-oam info command displays the OAM information on all OAM-enabled ports.
device (config)# show link-oam infoEthernet Link Status OAM Status Mode Local Stable Remote Stable1/1/1 up up active satisfied satisfied1/1/2 up up passive satisfied satisfied1/1/3 up up active satisfied satisfied1/1/4 up init passive unsatisfied unsatisfied1/1/5 down down passive unsatisfied unsatisfied1/1/6 down down passive unsatisfied unsatisfied1/1/7 down down passive unsatisfied unsatisfied
The following sample output of the show link-oam info detail command displays detailed OAM information on all OAM-enabledports.
device(config)# show link-oam info detailOAM information for Ethernet port: 10/1/1 +link-oam mode: passive +link status: down +oam status: down Local information multiplexer action: forward parse action: forward stable: unsatisfied state: linkFault loopback state: disabled dying-gasp: false critical-event: false link-fault: true Remote information multiplexer action: forward parse action: forward stable: unsatisfied loopback support: disabled dying-gasp: false
Operations, Administration, and MaintenanceIEEE 802.3ah EFM-OAM
Ruckus FastIron Monitoring Configuration Guide, 08.0.70Part Number: 53-1005293-04 39
critical-event: true link-fault: false
OAM information for Ethernet port: 10/1/3 +link-oam mode: active +link status: up +oam status: down Local information multiplexer action: forward parse action: forward stable: unsatisfied state: activeSend loopback state: disabled dying-gasp: false critical-event: false link-fault: false Remote information multiplexer action: forward parse action: forward stable: unsatisfied loopback support: disabled dying-gasp: false critical-event: false link-fault: false
OAM information for Ethernet port: 10/1/4 +link-oam mode: active +link status: up +oam status: up Local information multiplexer action: forward parse action: forward stable: satisfied state: up loopback state: disabled dying-gasp: false critical-event: false link-fault: false Remote information multiplexer action: forward parse action: forward stable: satisfied loopback support: disabled dying-gasp: false critical-event: true link-fault: false
The following sample output of the show link-oam info detail ethernet command displays detailed OAM information on aspecific Ethernet port.
device(config)# show link-oam info detail ethernet 1/1/3OAM information for Ethernet port: 1/1/3 +link-oam mode: active +link status: up +oam status: up Local information multiplexer action: forward parse action: forward stable: satisfied state: up loopback state: disabled dying-gasp: false critical-event: false link-fault: false Remote information multiplexer action: forward parse action: forward stable: satisfied loopback support: disabled dying-gasp: false
Operations, Administration, and MaintenanceIEEE 802.3ah EFM-OAM
Ruckus FastIron Monitoring Configuration Guide, 08.0.7040 Part Number: 53-1005293-04
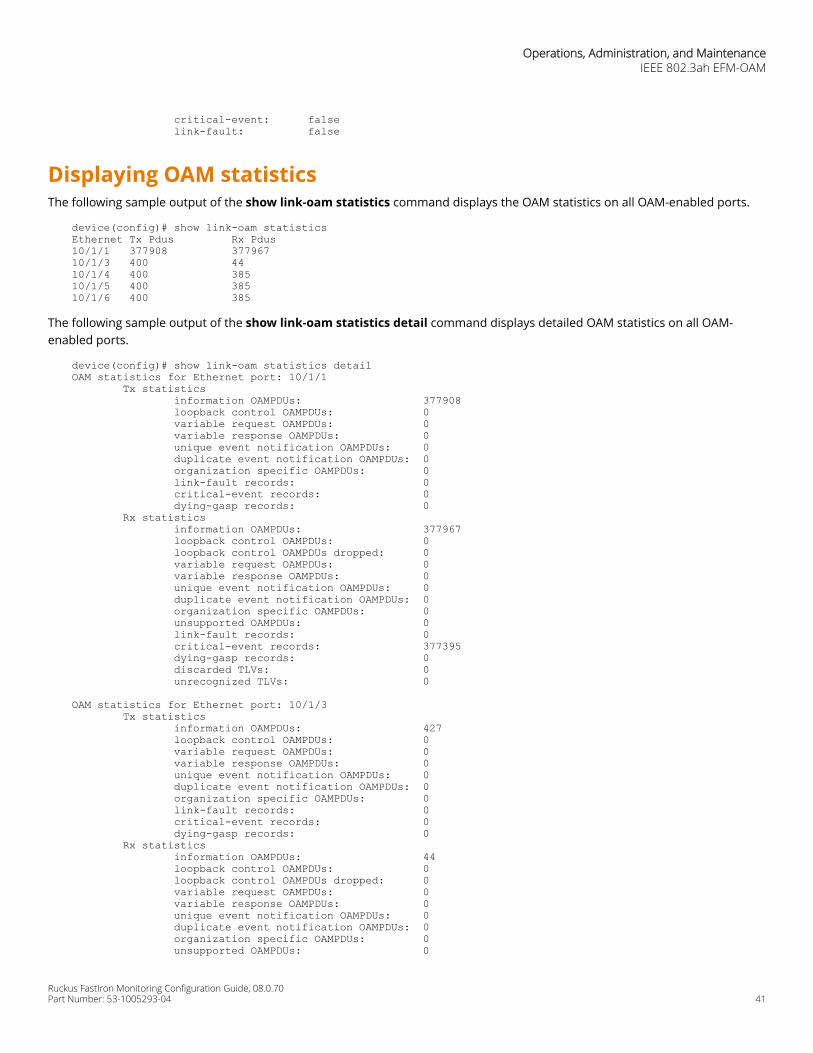
critical-event: false link-fault: false
Displaying OAM statisticsThe following sample output of the show link-oam statistics command displays the OAM statistics on all OAM-enabled ports.
device(config)# show link-oam statisticsEthernet Tx Pdus Rx Pdus 10/1/1 377908 377967 10/1/3 400 44 10/1/4 400 385 10/1/5 400 385 10/1/6 400 385
The following sample output of the show link-oam statistics detail command displays detailed OAM statistics on all OAM-enabled ports.
device(config)# show link-oam statistics detailOAM statistics for Ethernet port: 10/1/1 Tx statistics information OAMPDUs: 377908 loopback control OAMPDUs: 0 variable request OAMPDUs: 0 variable response OAMPDUs: 0 unique event notification OAMPDUs: 0 duplicate event notification OAMPDUs: 0 organization specific OAMPDUs: 0 link-fault records: 0 critical-event records: 0 dying-gasp records: 0 Rx statistics information OAMPDUs: 377967 loopback control OAMPDUs: 0 loopback control OAMPDUs dropped: 0 variable request OAMPDUs: 0 variable response OAMPDUs: 0 unique event notification OAMPDUs: 0 duplicate event notification OAMPDUs: 0 organization specific OAMPDUs: 0 unsupported OAMPDUs: 0 link-fault records: 0 critical-event records: 377395 dying-gasp records: 0 discarded TLVs: 0 unrecognized TLVs: 0
OAM statistics for Ethernet port: 10/1/3 Tx statistics information OAMPDUs: 427 loopback control OAMPDUs: 0 variable request OAMPDUs: 0 variable response OAMPDUs: 0 unique event notification OAMPDUs: 0 duplicate event notification OAMPDUs: 0 organization specific OAMPDUs: 0 link-fault records: 0 critical-event records: 0 dying-gasp records: 0 Rx statistics information OAMPDUs: 44 loopback control OAMPDUs: 0 loopback control OAMPDUs dropped: 0 variable request OAMPDUs: 0 variable response OAMPDUs: 0 unique event notification OAMPDUs: 0 duplicate event notification OAMPDUs: 0 organization specific OAMPDUs: 0 unsupported OAMPDUs: 0
Operations, Administration, and MaintenanceIEEE 802.3ah EFM-OAM
Ruckus FastIron Monitoring Configuration Guide, 08.0.70Part Number: 53-1005293-04 41
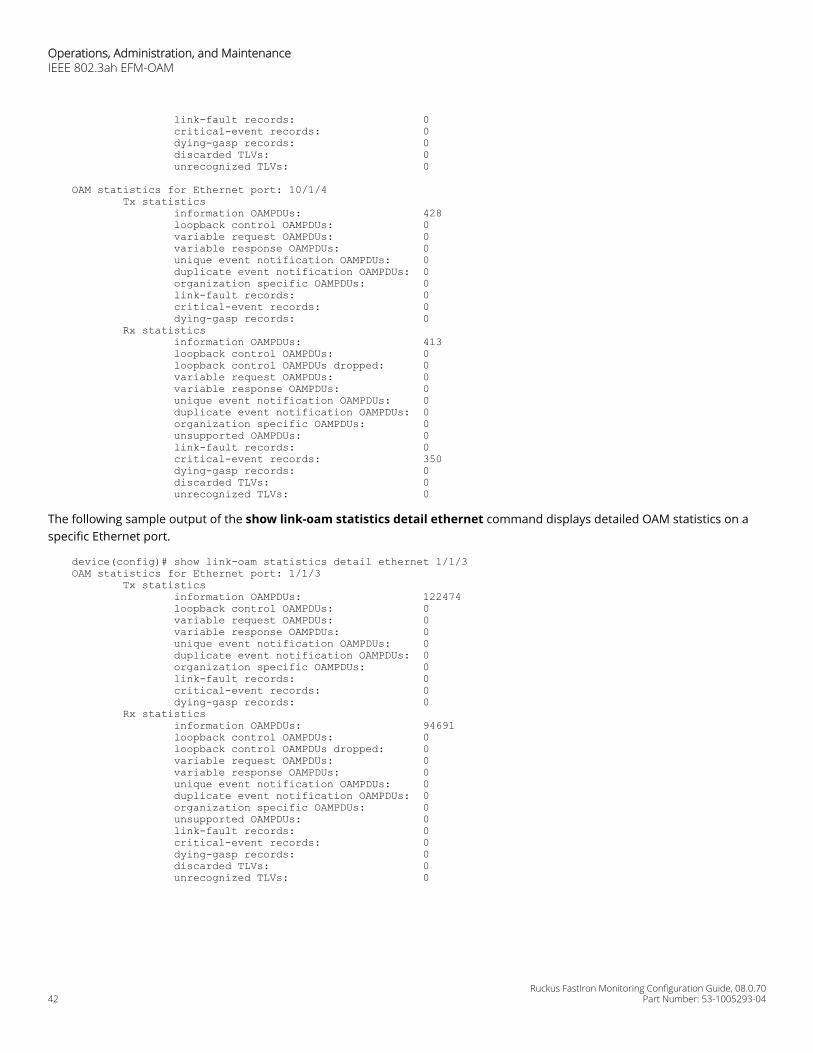
link-fault records: 0 critical-event records: 0 dying-gasp records: 0 discarded TLVs: 0 unrecognized TLVs: 0
OAM statistics for Ethernet port: 10/1/4 Tx statistics information OAMPDUs: 428 loopback control OAMPDUs: 0 variable request OAMPDUs: 0 variable response OAMPDUs: 0 unique event notification OAMPDUs: 0 duplicate event notification OAMPDUs: 0 organization specific OAMPDUs: 0 link-fault records: 0 critical-event records: 0 dying-gasp records: 0 Rx statistics information OAMPDUs: 413 loopback control OAMPDUs: 0 loopback control OAMPDUs dropped: 0 variable request OAMPDUs: 0 variable response OAMPDUs: 0 unique event notification OAMPDUs: 0 duplicate event notification OAMPDUs: 0 organization specific OAMPDUs: 0 unsupported OAMPDUs: 0 link-fault records: 0 critical-event records: 350 dying-gasp records: 0 discarded TLVs: 0 unrecognized TLVs: 0
The following sample output of the show link-oam statistics detail ethernet command displays detailed OAM statistics on aspecific Ethernet port.
device(config)# show link-oam statistics detail ethernet 1/1/3OAM statistics for Ethernet port: 1/1/3 Tx statistics information OAMPDUs: 122474 loopback control OAMPDUs: 0 variable request OAMPDUs: 0 variable response OAMPDUs: 0 unique event notification OAMPDUs: 0 duplicate event notification OAMPDUs: 0 organization specific OAMPDUs: 0 link-fault records: 0 critical-event records: 0 dying-gasp records: 0 Rx statistics information OAMPDUs: 94691 loopback control OAMPDUs: 0 loopback control OAMPDUs dropped: 0 variable request OAMPDUs: 0 variable response OAMPDUs: 0 unique event notification OAMPDUs: 0 duplicate event notification OAMPDUs: 0 organization specific OAMPDUs: 0 unsupported OAMPDUs: 0 link-fault records: 0 critical-event records: 0 dying-gasp records: 0 discarded TLVs: 0 unrecognized TLVs: 0
Operations, Administration, and MaintenanceIEEE 802.3ah EFM-OAM
Ruckus FastIron Monitoring Configuration Guide, 08.0.7042 Part Number: 53-1005293-04

EFM-OAM syslog messagesWhen EFM-OAM is enabled on an interface, the syslog messages in the following table are generated when the link goes up ordown, or when loopback mode is entered or cleared on an interface.
TABLE 4 EFM-OAM syslog messagesEvent Syslog output
Port 1 is LOAM logically Up Link-OAM: Logical link on interface Ethernet 1/1/1 is up.Port 1 is LOAM logically Down Link-OAM: Logical link on interface Ethernet 1/1/1 is down.Port 1 entered remoteLoopback mode
Link-OAM: Link entered remote loopback on ethernet 1/1/1
Port 1 cleared remote Loopbackmode
Link-OAM: Link cleared remtote loopback on ethernet 1/1/1
Port 1 entered local Loopbackmode
Link-OAM: Link entered local loopback on ethernet 1/1/1
Port 1 cleared local Loopbackmode
Link-OAM: Link cleared local loopback on ethernet 1/1/1
Dying gasp event on port 1 Link-OAM: Link received dying-gasp event on ethernet 1/1/1Critical event on port 1 Link-OAM: Link received critical event on ethernet 1/1/1
SNMP trap support is enabled for EFM-OAM from 08.0.70 release onwards.
Displaying management redundancyinformationEnter the following command from any mode of the CLI, to view the redundancy parameter settings and statistics.
device(config)# show redundancy=== MP Redundancy Settings ===Configured Active Slot = 9Running-Config Sync Period = (upon "write mem")=== MP Redundancy Statistics ===Current Active Session:Active mgmt slot = 9, Standby mgmt slot = 10 (Absent)Switchover cause = No SwitchoverStart Time = Jan 1 00:00:09Sxr Sys Hitless Enable Status = 0Total number of Switchover/Failovers = 0L3 slib baseline sync status: 0 [complete]
NOTEManagement redundancy is not available for the ICX 7450-24 platform.
Layer 3 hitless route purgeLayer 3 traffic is forwarded seamlessly during a failover, switchover, or OS upgrade when hitless management is enabled.
Some protocols support non-stop routing. On enabling non-stop routing, after switchover the management module quickly re-converge the protocol database. Whereas, some protocols support graceful restart, in which the protocol state is re-establishedwith the help of neighboring devices. Once all the protocols converge the routes which were removed from the network during
Operations, Administration, and MaintenanceLayer 3 hitless route purge
Ruckus FastIron Monitoring Configuration Guide, 08.0.70Part Number: 53-1005293-04 43

the convergence period, the routes are deleted from the devices. You can set the route purge timer per VRF instance. Configurethe timer to set the duration for which the routes should be preserved after switchover. Once this period elapses, the routepurging starts, if by then all other protocols have finished non-stop routing or graceful restart.
When switchover occurs, the route purge timer starts. If non-stop routing or graceful restart is also configured, the routevalidation and purging starts only when they are complete and the purge timer has elapsed. If for some reason more delay isexpected in learning the routes, you can configure a larger period for the purge timer.
Setting the IPv4 hitless purge timer on the defatult VRFTo configure the purge timer, enter the ip hitless-route-purge-timer command in global configuration mode.
Example for setting IPv4 hitless purge timer on the default VRFThe following example shows how to set the IPv4 hitless purge timer on the default VRF:
device(config)# ip hitless-route-purge-timer 60
Setting the IPv4 hitless purge timer on the non-default VRF1. Enter the VRF configuration mode using the vrf command.
2. Configure route distinguisher using the rd command.
3. Enter IPv4 address family configuration mode using the address-family ipv4 command.
4. Configure the router purge timer using the ip hitless-route-purge-timer command.
Example for setting the IPv4 hitless purge timer on the non-defaultVRFThe following example shows how to set the IPv4 purge timer on the non-default VRF:
device(config)# vrf bluedevice(config-vrf-blue)# rd 10:10device(config-vrf-blue)# address-family ipv4device(config-vrf-blue-ipv4)# ip hitless-route-purge-timer 60
Setting the IPv6 hitless purge timer on the defatult VRFTo configure the purge timer, enter the ipv6 hitless-route-purge-timer command in global configuration mode.
Example for setting the IPv6 hitless purge timer on the default VRFThe following example shows how to set the IPv6 hitless purge timer on the default VRF:
device(config)# ipv6 hitless-route-purge-timer 60
Setting the IPv4 hitless purge timer on the non-default VRFBefore you begin: Enable IPv6 unicast routing using the ipv6 unicast-routing command in global configuration mode.
1. Enter the VRF configuration mode using the vrf command.
Operations, Administration, and MaintenanceLayer 3 hitless route purge
Ruckus FastIron Monitoring Configuration Guide, 08.0.7044 Part Number: 53-1005293-04

2. Configure route distinguisher using the rd command.
3. Enter the IPv6 address family configuration mode using the address-family ipv6 command.
4. Configure the router purge timer using the ipv6 hitless-route-purge-timer command.
Example for setting the IPv6 hitless purge timer on the non-defaultVRFThe following example shows how to set the IPv6 purge timer on the non-default VRF:
device(config)# vrf bluedevice(config-vrf-blue)# rd 10:10device(config-vrf-blue)# address-family ipv6device(config-vrf-blue-ipv4)# ipv6 hitless-route-purge-timer 60
Energy Efficient EthernetEnergy Efficient Ethernet (EEE) regulates and saves power consumed by the active hardware components in the switch andconserves power during idle time.
EEE allows Ruckus devices to conform to green computing standards. This functionality is achieved by moving the data ports to alow-power state when their function is not necessary or when they are in a passive, no traffic condition. The EEE feature inswitching platforms reduces overall energy consumption, cooling, noise, and operating costs for energy and cooling. Lowerpower consumption also means lower heat dissipation and increased system stability, less energy usage, thereby reducing costsand impact on the environment.
EEE is a set of enhancements to the Ethernet specification to address power consumption during periods of low data activity. EEEis specified in IEEE Std 802.3az-2010 which is an amendment to the IEEE Std 802.3-2008 specification. The optional EEE capabilitycombines the IEEE 802.3 Media Access Control (MAC) sublayer with a family of physical layers defined to support operation in theLow Power Idle (LPI) mode. When the LPI mode is enabled, systems on both sides of the link can save power during periods oflow link utilization. LPI signaling allows the LPI client to indicate to the PHY, and to the link partner, that a break in the datastream is expected. The LPI client can then use this information to enter power-saving modes that require additional time toresume normal operation. LPI signaling also informs the LPI client when the link partner sends such an indication. The clientdevice connected to the EEE enabled switch port must also support the LPI functionality in order to take advantage of thisfeature on the switch.
Port support for Energy Efficient Ethernet• On ICX 7450 devices EEE is supported on 1G copper ports and 10G copper module ports.
• On ICX 7250 devices EEE is supported on 1G copper ports.
• You may notice port flap on the port when EEE is enabled.
• EEE is not supported on 1G fiber ports (ICX7450-48F), 4x10F module ports, and 1x40Q module ports.
EEE feature support on SPXIn addition to standalone and stacking environment, EEE is supported on SPX environment. When ICX7450 and ICX7250 platformis used as PE, the EEE feature can be configured from Control Bridge (CB) unit.
• On ICX7450 product family, EEE feature is supported on 1G Copper ports (PHY BCM54382) and 10G Copper ports (PHYBCM84848).
Operations, Administration, and MaintenanceEnergy Efficient Ethernet
Ruckus FastIron Monitoring Configuration Guide, 08.0.70Part Number: 53-1005293-04 45

• On ICX7250 product family, EEE feature is supported on 1G Copper ports (PHY BCM54382).
NOTEIn SPX environment, the EEE feature is supported only on 1G and 10G copper ports and in full-duplex mode. EEE featureis not supported on stacking and on configured SPX ports since any port can act as SPX port.
Initially, the port will flap whenever EEE feature is enabled or disabled on the port to advertise EEE parameters through auto-negotiation.
Enabling Energy Efficient EthernetEnergy Efficient Ethernet (EEE) is supported on select ICX devices and can be enabled globally or per port.
Follow these steps to enable EEE globally or per port, including SPX environment.
1. Enter global configuration mode.
2. Enter the eee command. The following example shows enabling EEE globally.
device(config)# eeeEEE Feature Enabled
NOTEThe no form of the command disables the feature on all supported ports, including those in the PX setup.
3. To enable EEE from the interface mode, enter the eee command.
device(config)# interface ehternet 1/1/1device(config-if-e1000-1/1/1)# eeeEEE Feature Enabled on port 1/1/1
4. (Optional) Execute the show spx command to display EEE statistics.
device(config)# show spxT=5d19h22m38.2: alone: standalone, D: dynamic cfg, S: staticID Type Role Mac Address Pri State Comment1 S ICX7750-48XGF standby 748e.f8f9.2800 0 remote Ready2 S ICX7750-48XGF active 748e.f8f9.2880 100 local Ready17 S ICX7450-24P spx-pe cc4e.245f.3330 N/A remote Ready18 S ICX7250-48 spx-pe cc4e.24b4.1ec0 N/A remote Ready…<truncated output>
5. (Optional) Execute the show eee-statistics command to display EEE statistics on all supported ports.
device(config)# show eee-statisticsPort EEE-State TXEventCount TXDuration RXEventCount RXDuration17/1/1 Enable 30 3928466 7 393805517/1/2 Enable 0 0 0 017/1/3 Enable 7 3934552 30 457509017/1/4 Enable 0 0 0 017/1/5 Enable 0 0 0 0. . . <truncated output>
6. (Optional) The show eee-statistics ethernet command displays the EEE statistics per port.
device(config)# show eee-statistics ethernet 17/1/1Port EEE-State TXEventCount TXDuration RXEventCount RXDuration17/1/1 Enable 227 3744088 19 3745412device(config)#
Operations, Administration, and MaintenanceEnergy Efficient Ethernet
Ruckus FastIron Monitoring Configuration Guide, 08.0.7046 Part Number: 53-1005293-04

Histogram information overviewThe histogram framework feature monitors and records system resource usage information. The main objective of the histogramis to record resource allocation failures and task CPU usage information. The histogram feature keeps track of task executioninformation, context switch history of tasks, buffer allocation failure and memory allocation failure.
The histogram information is collected and maintained internally, in a cyclical buffer. It can be reviewed to determine if resourceallocation failures or task CPU usage may have contributed to an application failure.
NOTEHistogram information is not maintained across reboot.
Displaying CPU histogram informationThe CPU histogram provides information about task CPU usage. The CPU histogram is viewed in the form of buckets (task usageis divided into different interval levels called buckets). For example, the task run time is divided into buckets: bucket 1 (0-50 ms),bucket 2 (50-100 ms), bucket 3 (100-150 ms), and so on. The CPU histogram collects the task CPU usage in each bucket. Thisincludes how many times a task run time or hold time falls in each bucket, and the maximum run time and total run time foreach bucket. CPU histogram information is measured for the hold-time and wait-time of the task.
• Hold time - The time that the task is holding the CPU without yield.
• Wait time - The time that the task is waiting for execution.
External USB HotplugExternal USB Hotplug support allows you to copy images, cores, logs, and configurations between the external USB and theinternal eUSB.
Ruckus device images are stored in the raw partition. Cores, logs and configurations are stored in the ext4 filesystem partition.The introduction of the External USB Hotplug gives you the option to easily copy device images, cores, logs, and configurationsbetween the external USB and the internal flash.
Operations, Administration, and MaintenanceExternal USB Hotplug
Ruckus FastIron Monitoring Configuration Guide, 08.0.70Part Number: 53-1005293-04 47

External USB Hotplug considerations• Only USB drives of up to 128 GB of any vendor type are supported.
• USB 3.0 is not supported.
• You can copy files of less than 2 GB only.
• Make sure the external USB is formatted as a "FAT" filesystem before attempting to use it. Formatting can be done on aPC or on the Ruckus device with the format disk0 command.
• You should not insert a USB-based disk drive, nor should you insert a USB hub to connect multiple USB disks.
• copy TFTP/SCP to disk0 and disk0 to TFTP/SCP commands are not supported.
• Only an administrator can execute operations on an external USB, similar to TFTP.
• You cannot access the active unit's local external USB from a member unit and vice versa.
• Boot from an external USB is not supported.
• You must run the unmount disk0 command before unplugging the external USB. The external USB can be mountedusing the mount disk0 command.
• The USB drive is only functional on the active member in a stacked environment.
Using External USB HotplugPlug in the External USB to begin using the External USB Hotplug commands. Use the show files disk0 command to check if theexternal USB is mounted and ready to use.
You can use the commands in the following table as part of the External USB Hotplug functionality.
TABLE 5 External USB Hotplug commandsCommand Description
show files disk0 Displays the files in the external USB drive.
format disk0 Formats the external USB.
mount disk0 Mounts the filesystem in the external USB drive.
unmount disk0 Unmounts the filesystem of the external USB drive. This command is required to safely plugout the USB, so that files are not lost or corrupted.
copy flash disk0 primary \ secondary Copies the image binary stored in the primary or secondary partition of the flash to adestination file in the external USB.
copy flash disk0 file Copies any file from a source file in the system flash to an external USB destination file.
copy disk0 license Copies the license file present in the external USB drive to the system.
copy disk0 running-config Copies the configuration file present on the external USB drive to the system's runningconfiguration.
copy disk0 startup-config Copies the configuration file present on the external USB drive to the system's startupconfiguration file.
Refer to the command reference for details on using the External USB Hotplug commands.
Basic system managementThe following sections contain procedures for basic system management tasks.
Operations, Administration, and MaintenanceBasic system management
Ruckus FastIron Monitoring Configuration Guide, 08.0.7048 Part Number: 53-1005293-04
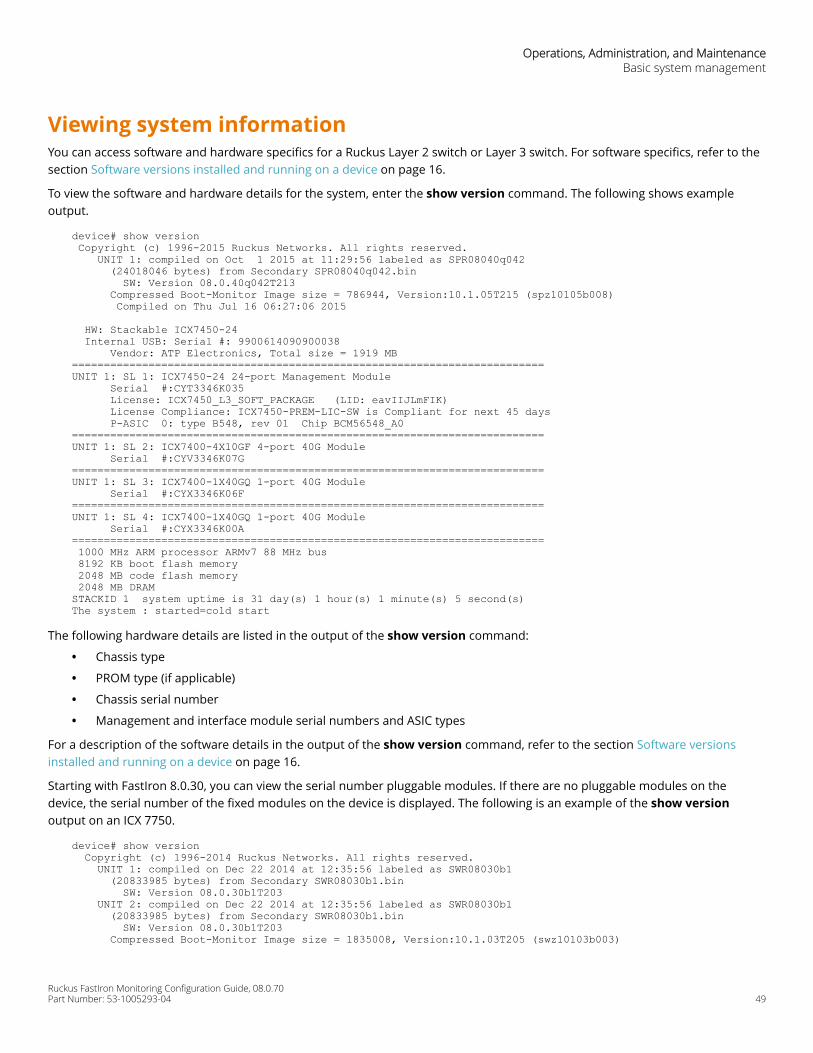
Viewing system informationYou can access software and hardware specifics for a Ruckus Layer 2 switch or Layer 3 switch. For software specifics, refer to thesection Software versions installed and running on a device on page 16.
To view the software and hardware details for the system, enter the show version command. The following shows exampleoutput.
device# show version Copyright (c) 1996-2015 Ruckus Networks. All rights reserved. UNIT 1: compiled on Oct 1 2015 at 11:29:56 labeled as SPR08040q042 (24018046 bytes) from Secondary SPR08040q042.bin SW: Version 08.0.40q042T213 Compressed Boot-Monitor Image size = 786944, Version:10.1.05T215 (spz10105b008) Compiled on Thu Jul 16 06:27:06 2015
HW: Stackable ICX7450-24 Internal USB: Serial #: 9900614090900038 Vendor: ATP Electronics, Total size = 1919 MB==========================================================================UNIT 1: SL 1: ICX7450-24 24-port Management Module Serial #:CYT3346K035 License: ICX7450_L3_SOFT_PACKAGE (LID: eavIIJLmFIK) License Compliance: ICX7450-PREM-LIC-SW is Compliant for next 45 days P-ASIC 0: type B548, rev 01 Chip BCM56548_A0==========================================================================UNIT 1: SL 2: ICX7400-4X10GF 4-port 40G Module Serial #:CYV3346K07G==========================================================================UNIT 1: SL 3: ICX7400-1X40GQ 1-port 40G Module Serial #:CYX3346K06F==========================================================================UNIT 1: SL 4: ICX7400-1X40GQ 1-port 40G Module Serial #:CYX3346K00A========================================================================== 1000 MHz ARM processor ARMv7 88 MHz bus 8192 KB boot flash memory 2048 MB code flash memory 2048 MB DRAMSTACKID 1 system uptime is 31 day(s) 1 hour(s) 1 minute(s) 5 second(s)The system : started=cold start
The following hardware details are listed in the output of the show version command:
• Chassis type
• PROM type (if applicable)
• Chassis serial number
• Management and interface module serial numbers and ASIC types
For a description of the software details in the output of the show version command, refer to the section Software versionsinstalled and running on a device on page 16.
Starting with FastIron 8.0.30, you can view the serial number pluggable modules. If there are no pluggable modules on thedevice, the serial number of the fixed modules on the device is displayed. The following is an example of the show versionoutput on an ICX 7750.
device# show version Copyright (c) 1996-2014 Ruckus Networks. All rights reserved. UNIT 1: compiled on Dec 22 2014 at 12:35:56 labeled as SWR08030b1 (20833985 bytes) from Secondary SWR08030b1.bin SW: Version 08.0.30b1T203 UNIT 2: compiled on Dec 22 2014 at 12:35:56 labeled as SWR08030b1 (20833985 bytes) from Secondary SWR08030b1.bin SW: Version 08.0.30b1T203 Compressed Boot-Monitor Image size = 1835008, Version:10.1.03T205 (swz10103b003)
Operations, Administration, and MaintenanceBasic system management
Ruckus FastIron Monitoring Configuration Guide, 08.0.70Part Number: 53-1005293-04 49
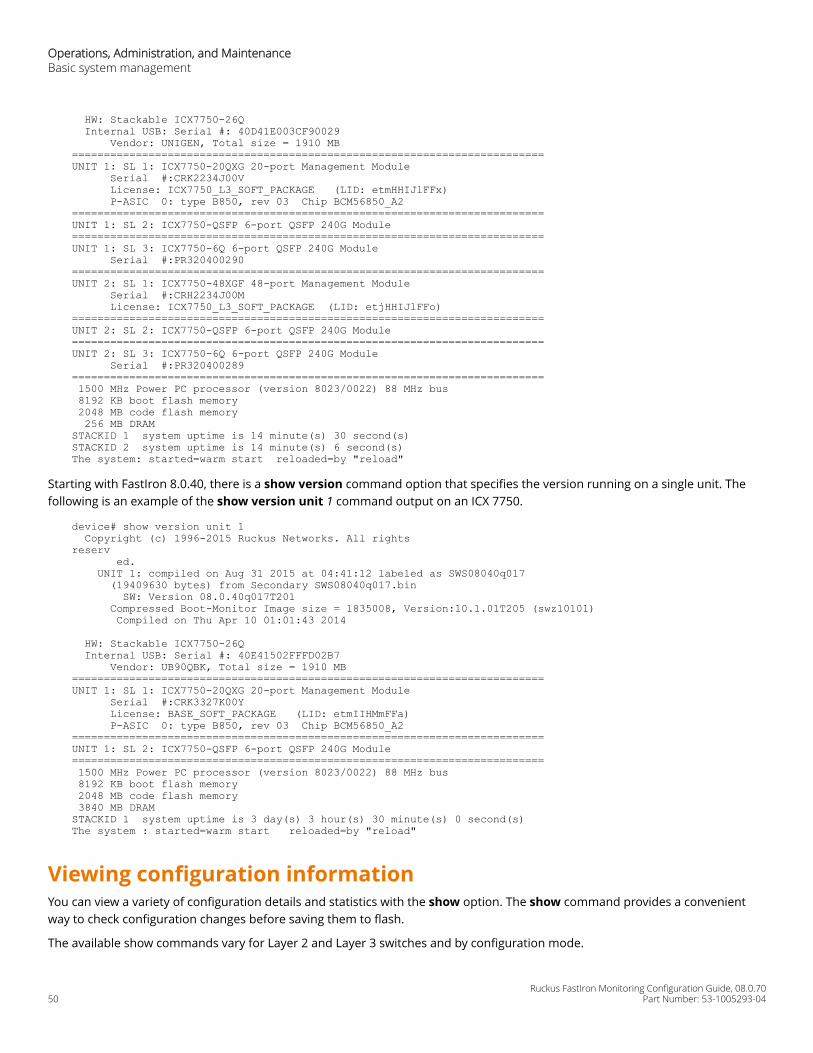
HW: Stackable ICX7750-26Q Internal USB: Serial #: 40D41E003CF90029 Vendor: UNIGEN, Total size = 1910 MB==========================================================================UNIT 1: SL 1: ICX7750-20QXG 20-port Management Module Serial #:CRK2234J00V License: ICX7750_L3_SOFT_PACKAGE (LID: etmHHIJlFFx) P-ASIC 0: type B850, rev 03 Chip BCM56850_A2==========================================================================UNIT 1: SL 2: ICX7750-QSFP 6-port QSFP 240G Module==========================================================================UNIT 1: SL 3: ICX7750-6Q 6-port QSFP 240G Module Serial #:PR320400290==========================================================================UNIT 2: SL 1: ICX7750-48XGF 48-port Management Module Serial #:CRH2234J00M License: ICX7750_L3_SOFT_PACKAGE (LID: etjHHIJlFFo)==========================================================================UNIT 2: SL 2: ICX7750-QSFP 6-port QSFP 240G Module==========================================================================UNIT 2: SL 3: ICX7750-6Q 6-port QSFP 240G Module Serial #:PR320400289========================================================================== 1500 MHz Power PC processor (version 8023/0022) 88 MHz bus 8192 KB boot flash memory 2048 MB code flash memory 256 MB DRAMSTACKID 1 system uptime is 14 minute(s) 30 second(s)STACKID 2 system uptime is 14 minute(s) 6 second(s)The system: started=warm start reloaded=by "reload"
Starting with FastIron 8.0.40, there is a show version command option that specifies the version running on a single unit. Thefollowing is an example of the show version unit 1 command output on an ICX 7750.
device# show version unit 1 Copyright (c) 1996-2015 Ruckus Networks. All rights reserv ed. UNIT 1: compiled on Aug 31 2015 at 04:41:12 labeled as SWS08040q017 (19409630 bytes) from Secondary SWS08040q017.bin SW: Version 08.0.40q017T201 Compressed Boot-Monitor Image size = 1835008, Version:10.1.01T205 (swz10101) Compiled on Thu Apr 10 01:01:43 2014
HW: Stackable ICX7750-26Q Internal USB: Serial #: 40E41502FFFD02B7 Vendor: UB90QBK, Total size = 1910 MB==========================================================================UNIT 1: SL 1: ICX7750-20QXG 20-port Management Module Serial #:CRK3327K00Y License: BASE_SOFT_PACKAGE (LID: etmIIHMmFFa) P-ASIC 0: type B850, rev 03 Chip BCM56850_A2==========================================================================UNIT 1: SL 2: ICX7750-QSFP 6-port QSFP 240G Module========================================================================== 1500 MHz Power PC processor (version 8023/0022) 88 MHz bus 8192 KB boot flash memory 2048 MB code flash memory 3840 MB DRAMSTACKID 1 system uptime is 3 day(s) 3 hour(s) 30 minute(s) 0 second(s)The system : started=warm start reloaded=by "reload"
Viewing configuration informationYou can view a variety of configuration details and statistics with the show option. The show command provides a convenientway to check configuration changes before saving them to flash.
The available show commands vary for Layer 2 and Layer 3 switches and by configuration mode.
Operations, Administration, and MaintenanceBasic system management
Ruckus FastIron Monitoring Configuration Guide, 08.0.7050 Part Number: 53-1005293-04

To determine the available show commands for the system or a specific mode of the CLI, enter the following command.
device# show ?
You can also enter show at the command prompt, then press the TAB key.
Enabling the display of the elapsed timestamp for port statisticsresetWhenever the port statistics of a device are cleared globally or on an interface, the counter values of the received andtransmitted packets on the device are reset for all the ports or for an interface, respectively.
The elapsed time after the most recent reset of the port statistics counters can be displayed in the output of the show statisticscommand by configuring the port-statistics-reset-timestamp enable command. By default, the display of the elapsedtimestamp information is disabled.
The elapsed time is calculated as the time between the most recent reset of the port statistics counters and the time when theshow statistics command is executed.
The following list provides details of the conditions under which the port statistics counters are reset and also explains theelapsed time calculation considerations.
• When the port statistics are cleared individually using the clear statistics ethernet command. The elapsed time iscalculated and displayed only for that particular interface.
• When the port statistics are cleared globally using the clear statistics command. The port statistics counters for all theports, including management ports, are cleared and the elapsed time is calculated and displayed for each of theinterfaces.
• When the management interface is cleared using the clear statistics management command. The port statisticscounters specific to management ports are cleared. The elapsed time is calculated and displayed for the managementinterface.
• If the system is reloaded (hard reboot or soft reboot), the port statistics on the device are cleared automatically. In thiscase, the time when the ports are cleared during the reload is considered as the most recent reset time.
• In a stacking device, the Elapsed Timestamp information is applicable for other unit's ports. In case of a switchover, allthe port statistics are cleared and the elapsed time is calculated and displayed for all ports.
• If hitless failover is enabled and if any unit is reloaded, the statistics of the reloading device's interfaces are cleared. Inthis case, the time when the ports are cleared during the reload is considered as the most recent reset time.
• The elapsed time is not impacted when the Network Time Protocol (NTP) syncs up with a different time other than therecorded time.
Viewing port statisticsPort statistics are polled by default every 10 seconds.
You can view statistics for ports by entering the following show commands:
• show interfaces
• show configuration
• show statistics
The Elapsed Timestamp information is displayed in the output of the following show commands:
• show statistics
Operations, Administration, and MaintenanceBasic system management
Ruckus FastIron Monitoring Configuration Guide, 08.0.70Part Number: 53-1005293-04 51
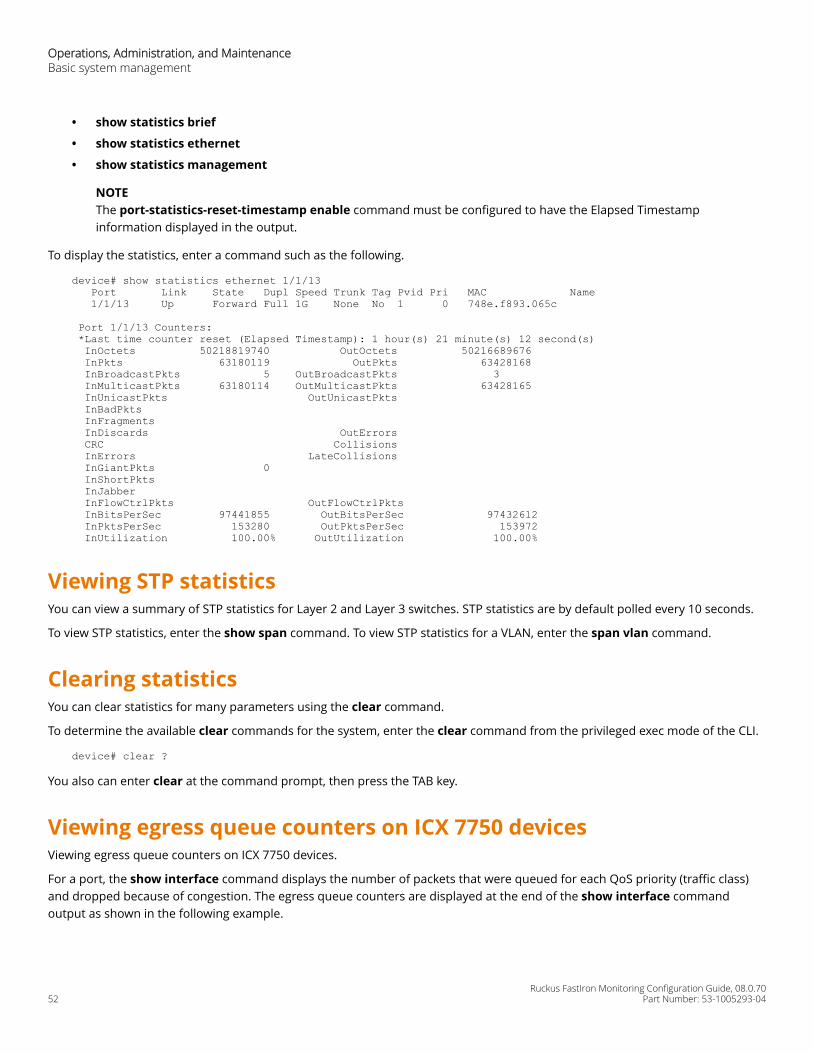
• show statistics brief
• show statistics ethernet
• show statistics management
NOTEThe port-statistics-reset-timestamp enable command must be configured to have the Elapsed Timestampinformation displayed in the output.
To display the statistics, enter a command such as the following.
device# show statistics ethernet 1/1/13 Port Link State Dupl Speed Trunk Tag Pvid Pri MAC Name 1/1/13 Up Forward Full 1G None No 1 0 748e.f893.065c
Port 1/1/13 Counters: *Last time counter reset (Elapsed Timestamp): 1 hour(s) 21 minute(s) 12 second(s) InOctets 50218819740 OutOctets 50216689676 InPkts 63180119 OutPkts 63428168 InBroadcastPkts 5 OutBroadcastPkts 3 InMulticastPkts 63180114 OutMulticastPkts 63428165 InUnicastPkts OutUnicastPkts InBadPkts InFragments InDiscards OutErrors CRC Collisions InErrors LateCollisions InGiantPkts 0 InShortPkts InJabber InFlowCtrlPkts OutFlowCtrlPkts InBitsPerSec 97441855 OutBitsPerSec 97432612 InPktsPerSec 153280 OutPktsPerSec 153972 InUtilization 100.00% OutUtilization 100.00%
Viewing STP statisticsYou can view a summary of STP statistics for Layer 2 and Layer 3 switches. STP statistics are by default polled every 10 seconds.
To view STP statistics, enter the show span command. To view STP statistics for a VLAN, enter the span vlan command.
Clearing statisticsYou can clear statistics for many parameters using the clear command.
To determine the available clear commands for the system, enter the clear command from the privileged exec mode of the CLI.
device# clear ?
You also can enter clear at the command prompt, then press the TAB key.
Viewing egress queue counters on ICX 7750 devicesViewing egress queue counters on ICX 7750 devices.
For a port, the show interface command displays the number of packets that were queued for each QoS priority (traffic class)and dropped because of congestion. The egress queue counters are displayed at the end of the show interface commandoutput as shown in the following example.
Operations, Administration, and MaintenanceBasic system management
Ruckus FastIron Monitoring Configuration Guide, 08.0.7052 Part Number: 53-1005293-04
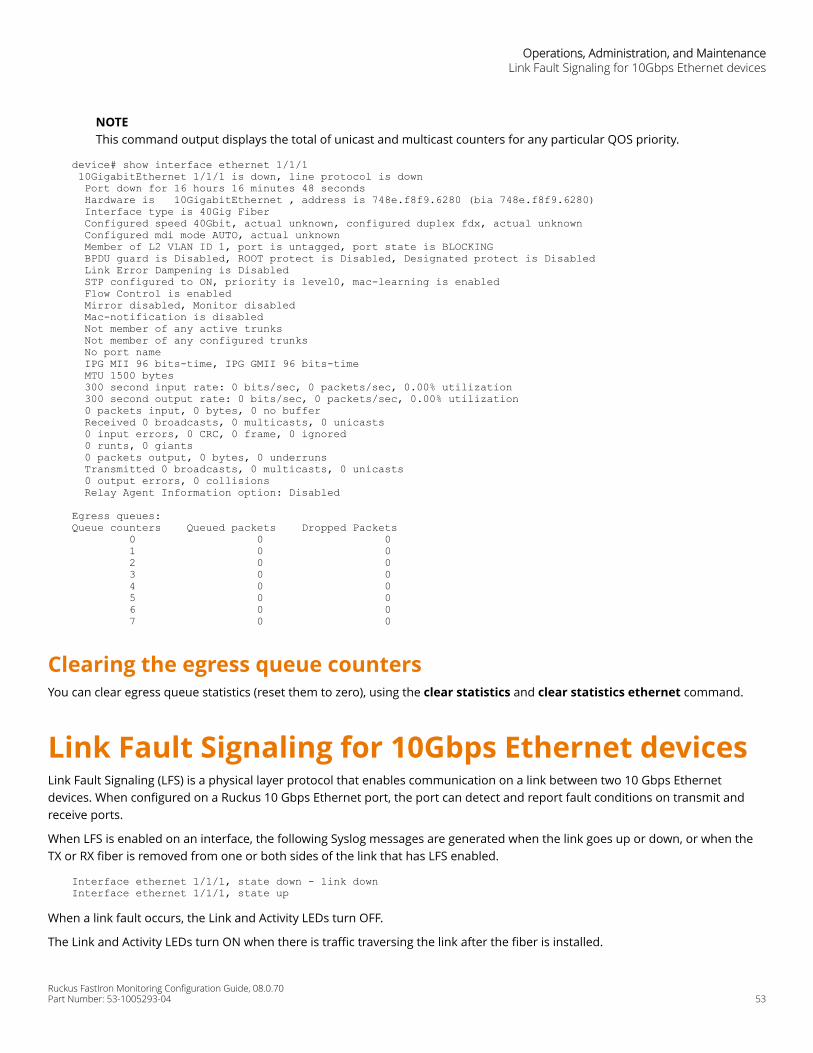
NOTEThis command output displays the total of unicast and multicast counters for any particular QOS priority.
device# show interface ethernet 1/1/1 10GigabitEthernet 1/1/1 is down, line protocol is down Port down for 16 hours 16 minutes 48 seconds Hardware is 10GigabitEthernet , address is 748e.f8f9.6280 (bia 748e.f8f9.6280) Interface type is 40Gig Fiber Configured speed 40Gbit, actual unknown, configured duplex fdx, actual unknown Configured mdi mode AUTO, actual unknown Member of L2 VLAN ID 1, port is untagged, port state is BLOCKING BPDU guard is Disabled, ROOT protect is Disabled, Designated protect is Disabled Link Error Dampening is Disabled STP configured to ON, priority is level0, mac-learning is enabled Flow Control is enabled Mirror disabled, Monitor disabled Mac-notification is disabled Not member of any active trunks Not member of any configured trunks No port name IPG MII 96 bits-time, IPG GMII 96 bits-time MTU 1500 bytes 300 second input rate: 0 bits/sec, 0 packets/sec, 0.00% utilization 300 second output rate: 0 bits/sec, 0 packets/sec, 0.00% utilization 0 packets input, 0 bytes, 0 no buffer Received 0 broadcasts, 0 multicasts, 0 unicasts 0 input errors, 0 CRC, 0 frame, 0 ignored 0 runts, 0 giants 0 packets output, 0 bytes, 0 underruns Transmitted 0 broadcasts, 0 multicasts, 0 unicasts 0 output errors, 0 collisions Relay Agent Information option: Disabled
Egress queues:Queue counters Queued packets Dropped Packets 0 0 0 1 0 0 2 0 0 3 0 0 4 0 0 5 0 0 6 0 0 7 0 0
Clearing the egress queue countersYou can clear egress queue statistics (reset them to zero), using the clear statistics and clear statistics ethernet command.
Link Fault Signaling for 10Gbps Ethernet devicesLink Fault Signaling (LFS) is a physical layer protocol that enables communication on a link between two 10 Gbps Ethernetdevices. When configured on a Ruckus 10 Gbps Ethernet port, the port can detect and report fault conditions on transmit andreceive ports.
When LFS is enabled on an interface, the following Syslog messages are generated when the link goes up or down, or when theTX or RX fiber is removed from one or both sides of the link that has LFS enabled.
Interface ethernet 1/1/1, state down - link downInterface ethernet 1/1/1, state up
When a link fault occurs, the Link and Activity LEDs turn OFF.
The Link and Activity LEDs turn ON when there is traffic traversing the link after the fiber is installed.
Operations, Administration, and MaintenanceLink Fault Signaling for 10Gbps Ethernet devices
Ruckus FastIron Monitoring Configuration Guide, 08.0.70Part Number: 53-1005293-04 53
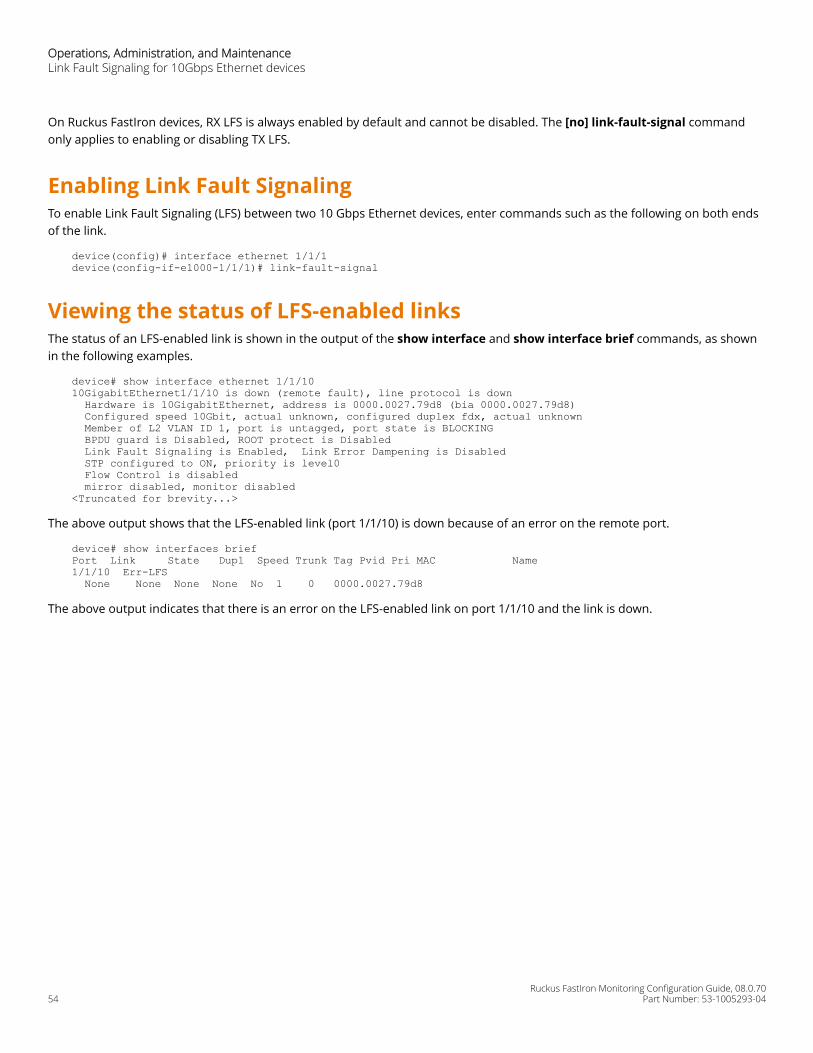
On Ruckus FastIron devices, RX LFS is always enabled by default and cannot be disabled. The [no] link-fault-signal commandonly applies to enabling or disabling TX LFS.
Enabling Link Fault SignalingTo enable Link Fault Signaling (LFS) between two 10 Gbps Ethernet devices, enter commands such as the following on both endsof the link.
device(config)# interface ethernet 1/1/1device(config-if-e1000-1/1/1)# link-fault-signal
Viewing the status of LFS-enabled linksThe status of an LFS-enabled link is shown in the output of the show interface and show interface brief commands, as shownin the following examples.
device# show interface ethernet 1/1/1010GigabitEthernet1/1/10 is down (remote fault), line protocol is down Hardware is 10GigabitEthernet, address is 0000.0027.79d8 (bia 0000.0027.79d8) Configured speed 10Gbit, actual unknown, configured duplex fdx, actual unknown Member of L2 VLAN ID 1, port is untagged, port state is BLOCKING BPDU guard is Disabled, ROOT protect is Disabled Link Fault Signaling is Enabled, Link Error Dampening is Disabled STP configured to ON, priority is level0 Flow Control is disabled mirror disabled, monitor disabled<Truncated for brevity...>
The above output shows that the LFS-enabled link (port 1/1/10) is down because of an error on the remote port.
device# show interfaces briefPort Link State Dupl Speed Trunk Tag Pvid Pri MAC Name1/1/10 Err-LFS None None None None No 1 0 0000.0027.79d8
The above output indicates that there is an error on the LFS-enabled link on port 1/1/10 and the link is down.
Operations, Administration, and MaintenanceLink Fault Signaling for 10Gbps Ethernet devices
Ruckus FastIron Monitoring Configuration Guide, 08.0.7054 Part Number: 53-1005293-04
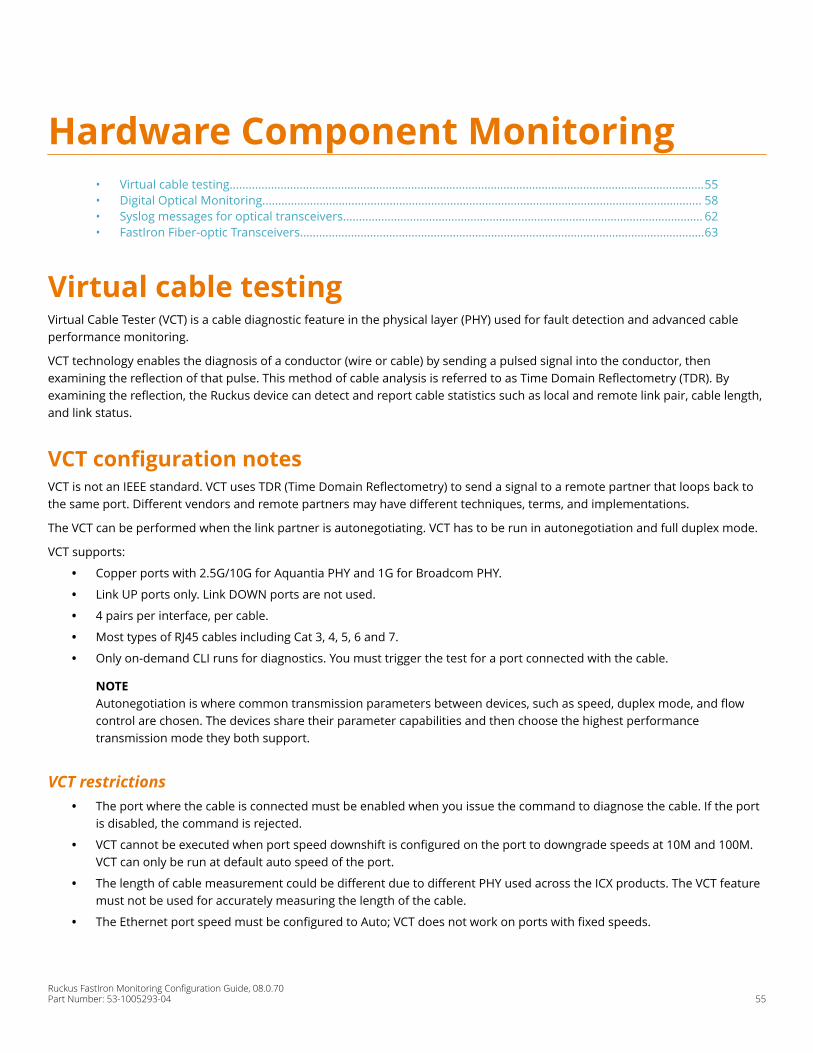
Hardware Component Monitoring• Virtual cable testing.....................................................................................................................................................55• Digital Optical Monitoring.......................................................................................................................................... 58• Syslog messages for optical transceivers................................................................................................................. 62• FastIron Fiber-optic Transceivers...............................................................................................................................63
Virtual cable testingVirtual Cable Tester (VCT) is a cable diagnostic feature in the physical layer (PHY) used for fault detection and advanced cableperformance monitoring.
VCT technology enables the diagnosis of a conductor (wire or cable) by sending a pulsed signal into the conductor, thenexamining the reflection of that pulse. This method of cable analysis is referred to as Time Domain Reflectometry (TDR). Byexamining the reflection, the Ruckus device can detect and report cable statistics such as local and remote link pair, cable length,and link status.
VCT configuration notesVCT is not an IEEE standard. VCT uses TDR (Time Domain Reflectometry) to send a signal to a remote partner that loops back tothe same port. Different vendors and remote partners may have different techniques, terms, and implementations.
The VCT can be performed when the link partner is autonegotiating. VCT has to be run in autonegotiation and full duplex mode.
VCT supports:
• Copper ports with 2.5G/10G for Aquantia PHY and 1G for Broadcom PHY.
• Link UP ports only. Link DOWN ports are not used.
• 4 pairs per interface, per cable.
• Most types of RJ45 cables including Cat 3, 4, 5, 6 and 7.
• Only on-demand CLI runs for diagnostics. You must trigger the test for a port connected with the cable.
NOTEAutonegotiation is where common transmission parameters between devices, such as speed, duplex mode, and flowcontrol are chosen. The devices share their parameter capabilities and then choose the highest performancetransmission mode they both support.
VCT restrictions• The port where the cable is connected must be enabled when you issue the command to diagnose the cable. If the port
is disabled, the command is rejected.
• VCT cannot be executed when port speed downshift is configured on the port to downgrade speeds at 10M and 100M.VCT can only be run at default auto speed of the port.
• The length of cable measurement could be different due to different PHY used across the ICX products. The VCT featuremust not be used for accurately measuring the length of the cable.
• The Ethernet port speed must be configured to Auto; VCT does not work on ports with fixed speeds.
Ruckus FastIron Monitoring Configuration Guide, 08.0.70Part Number: 53-1005293-04 55
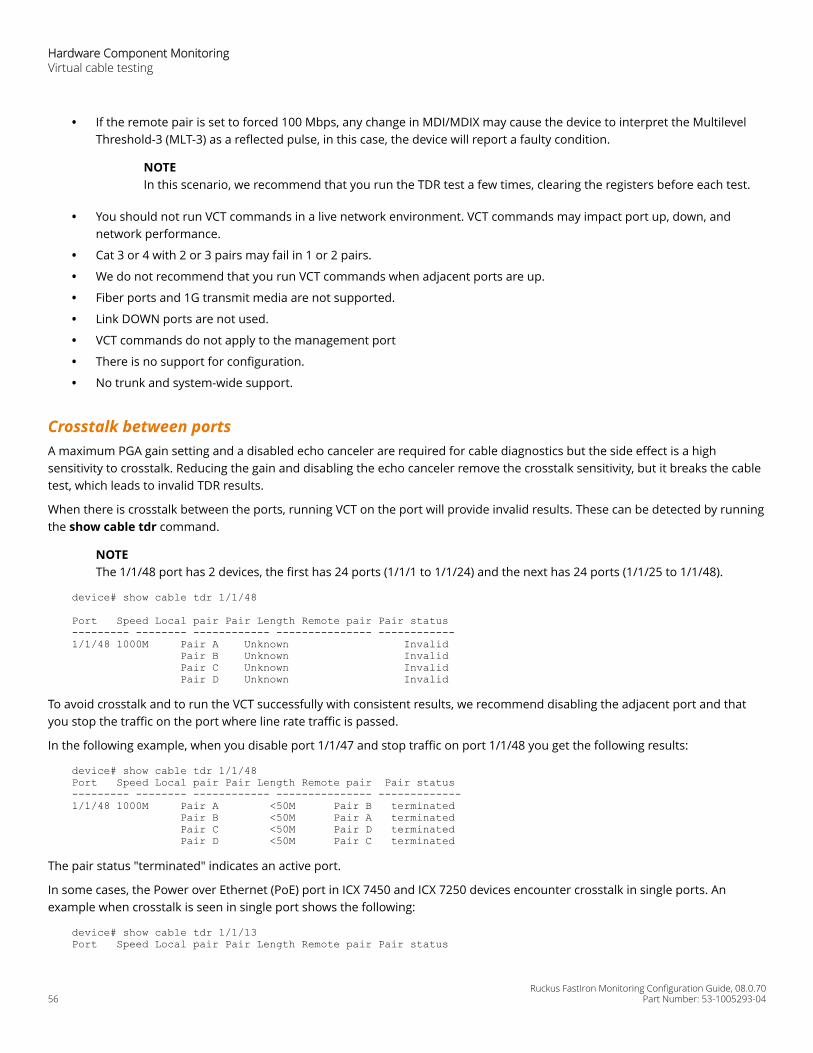
• If the remote pair is set to forced 100 Mbps, any change in MDI/MDIX may cause the device to interpret the MultilevelThreshold-3 (MLT-3) as a reflected pulse, in this case, the device will report a faulty condition.
NOTEIn this scenario, we recommend that you run the TDR test a few times, clearing the registers before each test.
• You should not run VCT commands in a live network environment. VCT commands may impact port up, down, andnetwork performance.
• Cat 3 or 4 with 2 or 3 pairs may fail in 1 or 2 pairs.
• We do not recommend that you run VCT commands when adjacent ports are up.
• Fiber ports and 1G transmit media are not supported.
• Link DOWN ports are not used.
• VCT commands do not apply to the management port
• There is no support for configuration.
• No trunk and system-wide support.
Crosstalk between portsA maximum PGA gain setting and a disabled echo canceler are required for cable diagnostics but the side effect is a highsensitivity to crosstalk. Reducing the gain and disabling the echo canceler remove the crosstalk sensitivity, but it breaks the cabletest, which leads to invalid TDR results.
When there is crosstalk between the ports, running VCT on the port will provide invalid results. These can be detected by runningthe show cable tdr command.
NOTEThe 1/1/48 port has 2 devices, the first has 24 ports (1/1/1 to 1/1/24) and the next has 24 ports (1/1/25 to 1/1/48).
device# show cable tdr 1/1/48
Port Speed Local pair Pair Length Remote pair Pair status --------- -------- ------------ --------------- ------------1/1/48 1000M Pair A Unknown Invalid Pair B Unknown Invalid Pair C Unknown Invalid Pair D Unknown Invalid
To avoid crosstalk and to run the VCT successfully with consistent results, we recommend disabling the adjacent port and thatyou stop the traffic on the port where line rate traffic is passed.
In the following example, when you disable port 1/1/47 and stop traffic on port 1/1/48 you get the following results:
device# show cable tdr 1/1/48 Port Speed Local pair Pair Length Remote pair Pair status --------- -------- ------------ --------------- ------------- 1/1/48 1000M Pair A <50M Pair B terminated Pair B <50M Pair A terminated Pair C <50M Pair D terminated Pair D <50M Pair C terminated
The pair status "terminated" indicates an active port.
In some cases, the Power over Ethernet (PoE) port in ICX 7450 and ICX 7250 devices encounter crosstalk in single ports. Anexample when crosstalk is seen in single port shows the following:
device# show cable tdr 1/1/13 Port Speed Local pair Pair Length Remote pair Pair status
Hardware Component MonitoringVirtual cable testing
Ruckus FastIron Monitoring Configuration Guide, 08.0.7056 Part Number: 53-1005293-04
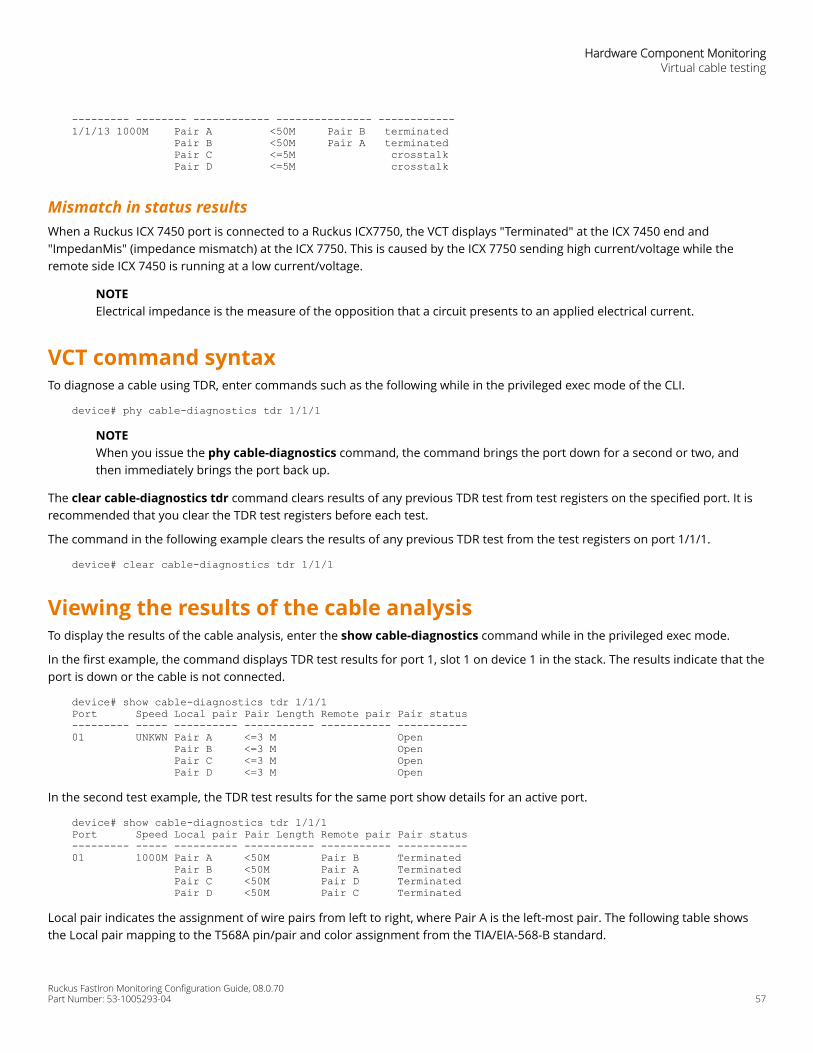
--------- -------- ------------ --------------- ------------ 1/1/13 1000M Pair A <50M Pair B terminated Pair B <50M Pair A terminated Pair C <=5M crosstalk Pair D <=5M crosstalk
Mismatch in status resultsWhen a Ruckus ICX 7450 port is connected to a Ruckus ICX7750, the VCT displays "Terminated" at the ICX 7450 end and"ImpedanMis" (impedance mismatch) at the ICX 7750. This is caused by the ICX 7750 sending high current/voltage while theremote side ICX 7450 is running at a low current/voltage.
NOTEElectrical impedance is the measure of the opposition that a circuit presents to an applied electrical current.
VCT command syntaxTo diagnose a cable using TDR, enter commands such as the following while in the privileged exec mode of the CLI.
device# phy cable-diagnostics tdr 1/1/1
NOTEWhen you issue the phy cable-diagnostics command, the command brings the port down for a second or two, andthen immediately brings the port back up.
The clear cable-diagnostics tdr command clears results of any previous TDR test from test registers on the specified port. It isrecommended that you clear the TDR test registers before each test.
The command in the following example clears the results of any previous TDR test from the test registers on port 1/1/1.
device# clear cable-diagnostics tdr 1/1/1
Viewing the results of the cable analysisTo display the results of the cable analysis, enter the show cable-diagnostics command while in the privileged exec mode.
In the first example, the command displays TDR test results for port 1, slot 1 on device 1 in the stack. The results indicate that theport is down or the cable is not connected.
device# show cable-diagnostics tdr 1/1/1Port Speed Local pair Pair Length Remote pair Pair status--------- ----- ---------- ----------- ----------- -----------01 UNKWN Pair A <=3 M Open Pair B <=3 M Open Pair C <=3 M Open Pair D <=3 M Open
In the second test example, the TDR test results for the same port show details for an active port.
device# show cable-diagnostics tdr 1/1/1Port Speed Local pair Pair Length Remote pair Pair status--------- ----- ---------- ----------- ----------- -----------01 1000M Pair A <50M Pair B Terminated Pair B <50M Pair A Terminated Pair C <50M Pair D Terminated Pair D <50M Pair C Terminated
Local pair indicates the assignment of wire pairs from left to right, where Pair A is the left-most pair. The following table showsthe Local pair mapping to the T568A pin/pair and color assignment from the TIA/EIA-568-B standard.
Hardware Component MonitoringVirtual cable testing
Ruckus FastIron Monitoring Configuration Guide, 08.0.70Part Number: 53-1005293-04 57
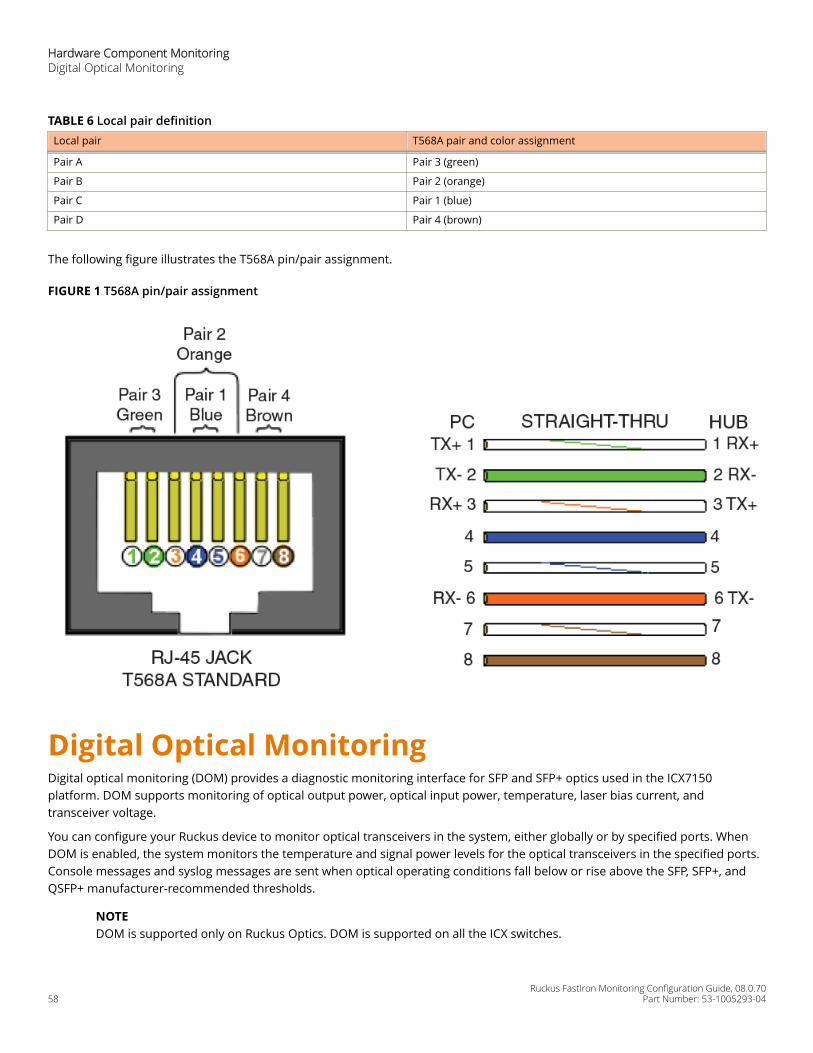
TABLE 6 Local pair definitionLocal pair T568A pair and color assignment
Pair A Pair 3 (green)
Pair B Pair 2 (orange)
Pair C Pair 1 (blue)
Pair D Pair 4 (brown)
The following figure illustrates the T568A pin/pair assignment.
FIGURE 1 T568A pin/pair assignment
Digital Optical MonitoringDigital optical monitoring (DOM) provides a diagnostic monitoring interface for SFP and SFP+ optics used in the ICX7150platform. DOM supports monitoring of optical output power, optical input power, temperature, laser bias current, andtransceiver voltage.
You can configure your Ruckus device to monitor optical transceivers in the system, either globally or by specified ports. WhenDOM is enabled, the system monitors the temperature and signal power levels for the optical transceivers in the specified ports.Console messages and syslog messages are sent when optical operating conditions fall below or rise above the SFP, SFP+, andQSFP+ manufacturer-recommended thresholds.
NOTEDOM is supported only on Ruckus Optics. DOM is supported on all the ICX switches.
Hardware Component MonitoringDigital Optical Monitoring
Ruckus FastIron Monitoring Configuration Guide, 08.0.7058 Part Number: 53-1005293-04
Supported media types• The following media types are supported:
– 1G Direct Attach Active 1M– 1G Direct Attach Active 5M– 10GE USR SFP+– 10GE LR SFP+– 10GE SR SFP+– 10GE ER SFP+– 10GE ZR SFP+– 10GBase-BXD 10GE Bidi– 10GBase-BXU 10GE Bidi– 10GE USR SFP+ TAA– 10GE SR SFP+ TAA– 10GE SR SFP+ Low Temp– 10GE LR SFP+ TAA– 10GE LR SFP+ Low Temp– 10G 1m Twinax Passive copper cable– 10G 3m Twinax Passive copper cable– 10G 5m Twinax Passive copper cable– 1000Base-SX– 1000Base-LX
NOTELRM adapter supports only LRM optics with 10G speed. No other SFP+ optics are supported.
DOM show and configuration commandsThe following commands are associated with DOM:
• show media — Displays information about the media devices installed per device, per slot, and per port.
• show optic — Displays the optical monitoring information.
• show optic thresholds — Displays the thresholds for a qualified optical transceiver in a particular port.
• show optic-timer — Displays the current DOM time interval setting.
• optical-monitor — Allows users to configure all ports (system-wide), a range of ports, or a single port for monitoring.
• show lrm_adapter ethernet— Allows users to display the LRM adapter parameters.
NOTEThe show media and DOM features are supported on LRM adapters. Command output remains the same as regularoptics. For more information on LRM adapter, please refer the hardware installation guide for the respective productfamily.
Hardware Component MonitoringDigital Optical Monitoring
Ruckus FastIron Monitoring Configuration Guide, 08.0.70Part Number: 53-1005293-04 59
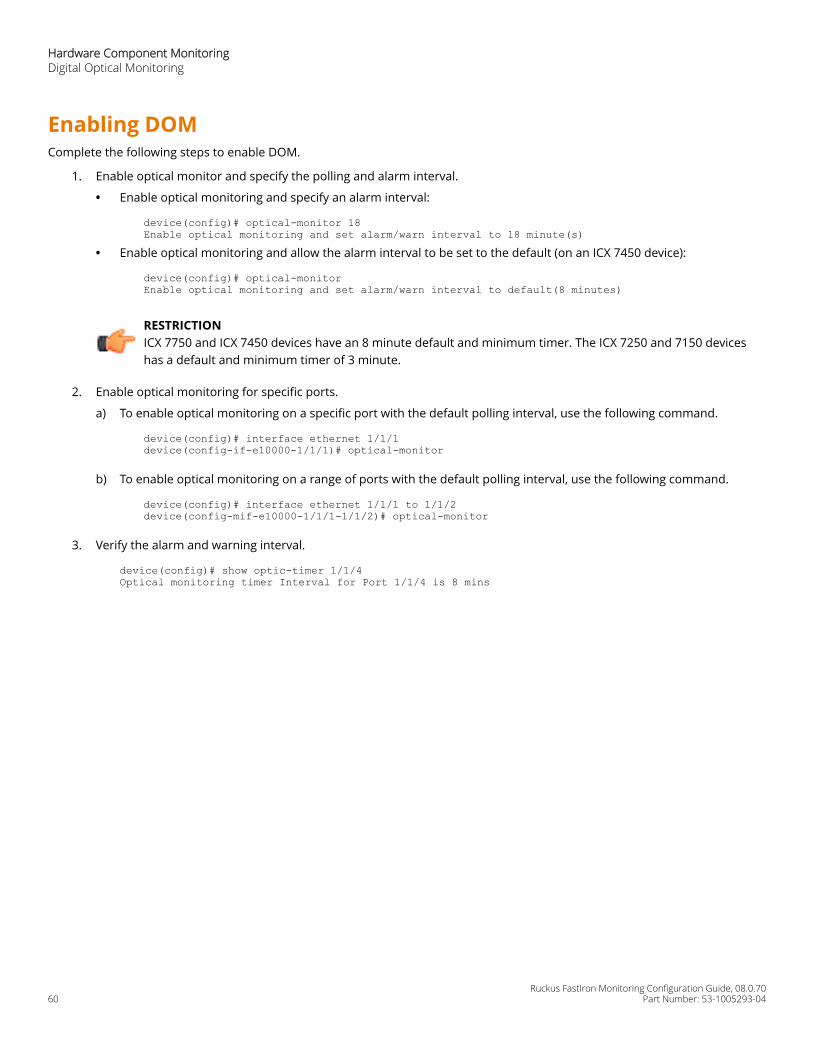
Enabling DOMComplete the following steps to enable DOM.
1. Enable optical monitor and specify the polling and alarm interval.
• Enable optical monitoring and specify an alarm interval:
device(config)# optical-monitor 18Enable optical monitoring and set alarm/warn interval to 18 minute(s)
• Enable optical monitoring and allow the alarm interval to be set to the default (on an ICX 7450 device):
device(config)# optical-monitor Enable optical monitoring and set alarm/warn interval to default(8 minutes)
RESTRICTIONICX 7750 and ICX 7450 devices have an 8 minute default and minimum timer. The ICX 7250 and 7150 deviceshas a default and minimum timer of 3 minute.
2. Enable optical monitoring for specific ports.
a) To enable optical monitoring on a specific port with the default polling interval, use the following command.
device(config)# interface ethernet 1/1/1device(config-if-e10000-1/1/1)# optical-monitor
b) To enable optical monitoring on a range of ports with the default polling interval, use the following command.
device(config)# interface ethernet 1/1/1 to 1/1/2device(config-mif-e10000-1/1/1-1/1/2)# optical-monitor
3. Verify the alarm and warning interval.
device(config)# show optic-timer 1/1/4 Optical monitoring timer Interval for Port 1/1/4 is 8 mins
Hardware Component MonitoringDigital Optical Monitoring
Ruckus FastIron Monitoring Configuration Guide, 08.0.7060 Part Number: 53-1005293-04
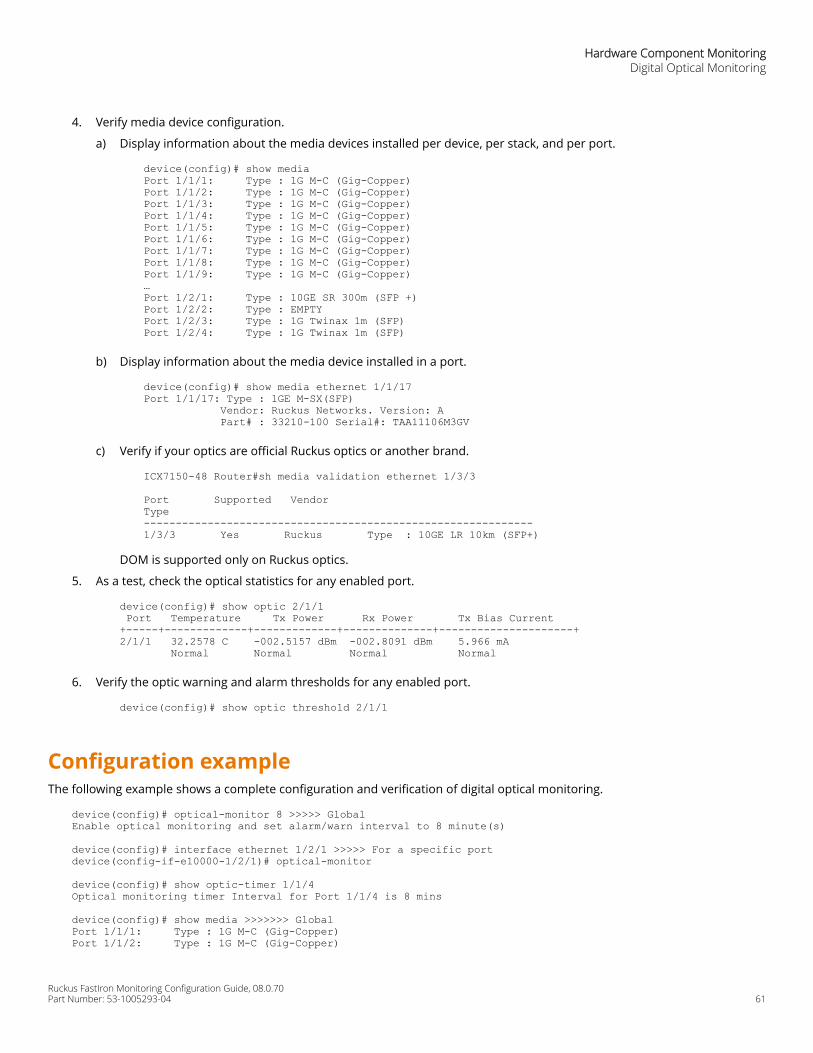
4. Verify media device configuration.
a) Display information about the media devices installed per device, per stack, and per port.
device(config)# show media Port 1/1/1: Type : 1G M-C (Gig-Copper)Port 1/1/2: Type : 1G M-C (Gig-Copper)Port 1/1/3: Type : 1G M-C (Gig-Copper)Port 1/1/4: Type : 1G M-C (Gig-Copper)Port 1/1/5: Type : 1G M-C (Gig-Copper)Port 1/1/6: Type : 1G M-C (Gig-Copper)Port 1/1/7: Type : 1G M-C (Gig-Copper)Port 1/1/8: Type : 1G M-C (Gig-Copper)Port 1/1/9: Type : 1G M-C (Gig-Copper)…Port 1/2/1: Type : 10GE SR 300m (SFP +)Port 1/2/2: Type : EMPTYPort 1/2/3: Type : 1G Twinax 1m (SFP)Port 1/2/4: Type : 1G Twinax 1m (SFP)
b) Display information about the media device installed in a port.
device(config)# show media ethernet 1/1/17Port 1/1/17: Type : 1GE M-SX(SFP) Vendor: Ruckus Networks. Version: A Part# : 33210-100 Serial#: TAA11106M3GV
c) Verify if your optics are official Ruckus optics or another brand.
ICX7150-48 Router#sh media validation ethernet 1/3/3
Port Supported Vendor Type -------------------------------------------------------------1/3/3 Yes Ruckus Type : 10GE LR 10km (SFP+)
DOM is supported only on Ruckus optics.
5. As a test, check the optical statistics for any enabled port.
device(config)# show optic 2/1/1 Port Temperature Tx Power Rx Power Tx Bias Current+-----+-------------+-------------+--------------+---------------------+2/1/1 32.2578 C -002.5157 dBm -002.8091 dBm 5.966 mA Normal Normal Normal Normal
6. Verify the optic warning and alarm thresholds for any enabled port.
device(config)# show optic threshold 2/1/1
Configuration exampleThe following example shows a complete configuration and verification of digital optical monitoring.
device(config)# optical-monitor 8 >>>>> GlobalEnable optical monitoring and set alarm/warn interval to 8 minute(s)
device(config)# interface ethernet 1/2/1 >>>>> For a specific portdevice(config-if-e10000-1/2/1)# optical-monitor
device(config)# show optic-timer 1/1/4 Optical monitoring timer Interval for Port 1/1/4 is 8 mins
device(config)# show media >>>>>>> GlobalPort 1/1/1: Type : 1G M-C (Gig-Copper)Port 1/1/2: Type : 1G M-C (Gig-Copper)
Hardware Component MonitoringDigital Optical Monitoring
Ruckus FastIron Monitoring Configuration Guide, 08.0.70Part Number: 53-1005293-04 61
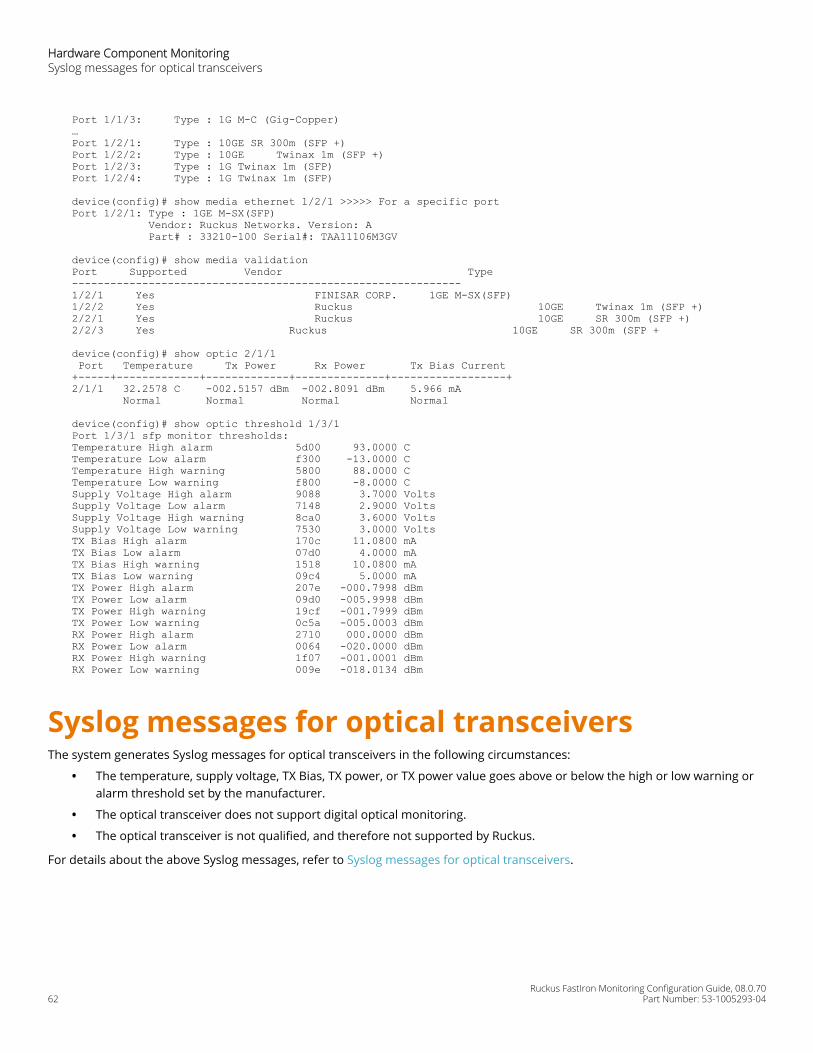
Port 1/1/3: Type : 1G M-C (Gig-Copper)…Port 1/2/1: Type : 10GE SR 300m (SFP +)Port 1/2/2: Type : 10GE Twinax 1m (SFP +)Port 1/2/3: Type : 1G Twinax 1m (SFP)Port 1/2/4: Type : 1G Twinax 1m (SFP)
device(config)# show media ethernet 1/2/1 >>>>> For a specific portPort 1/2/1: Type : 1GE M-SX(SFP) Vendor: Ruckus Networks. Version: A Part# : 33210-100 Serial#: TAA11106M3GV
device(config)# show media validationPort Supported Vendor Type-------------------------------------------------------------1/2/1 Yes FINISAR CORP. 1GE M-SX(SFP)1/2/2 Yes Ruckus 10GE Twinax 1m (SFP +)2/2/1 Yes Ruckus 10GE SR 300m (SFP +)2/2/3 Yes Ruckus 10GE SR 300m (SFP +
device(config)# show optic 2/1/1 Port Temperature Tx Power Rx Power Tx Bias Current+-----+-------------+-------------+--------------+------------------+2/1/1 32.2578 C -002.5157 dBm -002.8091 dBm 5.966 mA Normal Normal Normal Normal
device(config)# show optic threshold 1/3/1Port 1/3/1 sfp monitor thresholds:Temperature High alarm 5d00 93.0000 C Temperature Low alarm f300 -13.0000 C Temperature High warning 5800 88.0000 C Temperature Low warning f800 -8.0000 C Supply Voltage High alarm 9088 3.7000 VoltsSupply Voltage Low alarm 7148 2.9000 VoltsSupply Voltage High warning 8ca0 3.6000 VoltsSupply Voltage Low warning 7530 3.0000 VoltsTX Bias High alarm 170c 11.0800 mATX Bias Low alarm 07d0 4.0000 mATX Bias High warning 1518 10.0800 mATX Bias Low warning 09c4 5.0000 mATX Power High alarm 207e -000.7998 dBmTX Power Low alarm 09d0 -005.9998 dBmTX Power High warning 19cf -001.7999 dBmTX Power Low warning 0c5a -005.0003 dBmRX Power High alarm 2710 000.0000 dBmRX Power Low alarm 0064 -020.0000 dBmRX Power High warning 1f07 -001.0001 dBmRX Power Low warning 009e -018.0134 dBm
Syslog messages for optical transceiversThe system generates Syslog messages for optical transceivers in the following circumstances:
• The temperature, supply voltage, TX Bias, TX power, or TX power value goes above or below the high or low warning oralarm threshold set by the manufacturer.
• The optical transceiver does not support digital optical monitoring.
• The optical transceiver is not qualified, and therefore not supported by Ruckus.
For details about the above Syslog messages, refer to Syslog messages for optical transceivers.
Hardware Component MonitoringSyslog messages for optical transceivers
Ruckus FastIron Monitoring Configuration Guide, 08.0.7062 Part Number: 53-1005293-04
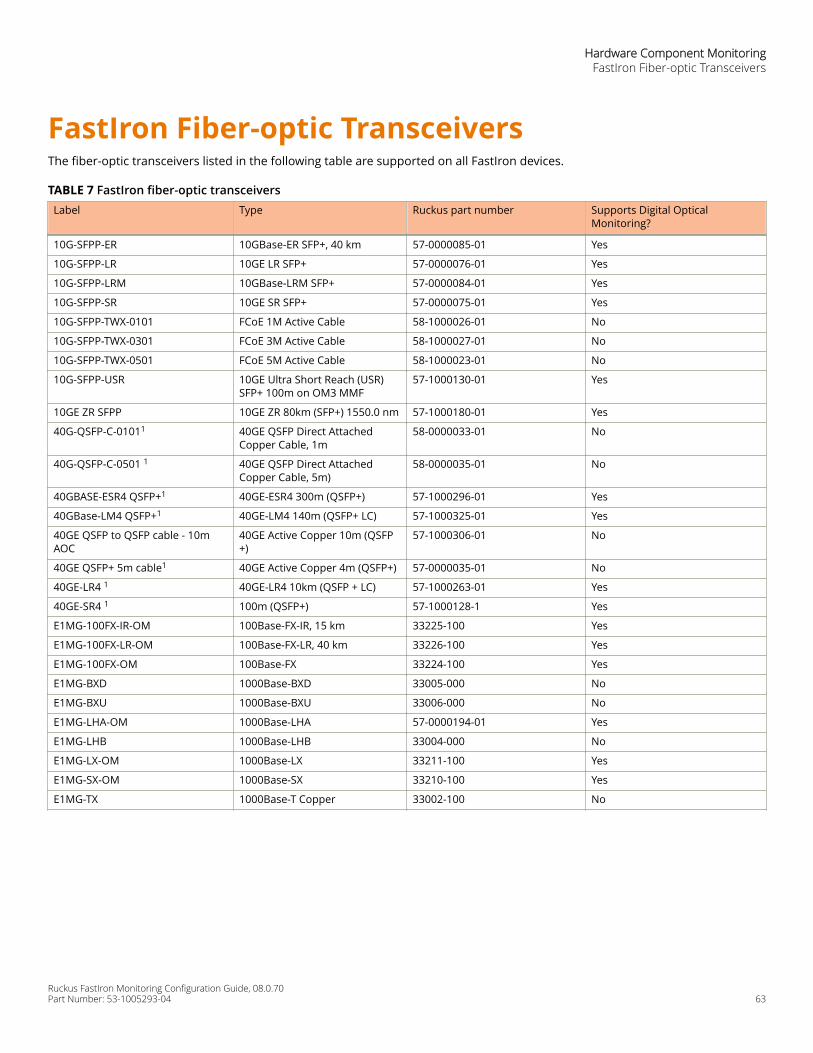
FastIron Fiber-optic TransceiversThe fiber-optic transceivers listed in the following table are supported on all FastIron devices.
TABLE 7 FastIron fiber-optic transceivers Label Type Ruckus part number Supports Digital Optical
Monitoring?
10G-SFPP-ER 10GBase-ER SFP+, 40 km 57-0000085-01 Yes
10G-SFPP-LR 10GE LR SFP+ 57-0000076-01 Yes
10G-SFPP-LRM 10GBase-LRM SFP+ 57-0000084-01 Yes
10G-SFPP-SR 10GE SR SFP+ 57-0000075-01 Yes
10G-SFPP-TWX-0101 FCoE 1M Active Cable 58-1000026-01 No
10G-SFPP-TWX-0301 FCoE 3M Active Cable 58-1000027-01 No
10G-SFPP-TWX-0501 FCoE 5M Active Cable 58-1000023-01 No
10G-SFPP-USR 10GE Ultra Short Reach (USR)SFP+ 100m on OM3 MMF
57-1000130-01 Yes
10GE ZR SFPP 10GE ZR 80km (SFP+) 1550.0 nm 57-1000180-01 Yes
40G-QSFP-C-01011 40GE QSFP Direct AttachedCopper Cable, 1m
58-0000033-01 No
40G-QSFP-C-0501 1 40GE QSFP Direct AttachedCopper Cable, 5m)
58-0000035-01 No
40GBASE-ESR4 QSFP+1 40GE-ESR4 300m (QSFP+) 57-1000296-01 Yes
40GBase-LM4 QSFP+1 40GE-LM4 140m (QSFP+ LC) 57-1000325-01 Yes
40GE QSFP to QSFP cable - 10mAOC
40GE Active Copper 10m (QSFP+)
57-1000306-01 No
40GE QSFP+ 5m cable1 40GE Active Copper 4m (QSFP+) 57-0000035-01 No
40GE-LR4 1 40GE-LR4 10km (QSFP + LC) 57-1000263-01 Yes
40GE-SR4 1 100m (QSFP+) 57-1000128-1 Yes
E1MG-100FX-IR-OM 100Base-FX-IR, 15 km 33225-100 Yes
E1MG-100FX-LR-OM 100Base-FX-LR, 40 km 33226-100 Yes
E1MG-100FX-OM 100Base-FX 33224-100 Yes
E1MG-BXD 1000Base-BXD 33005-000 No
E1MG-BXU 1000Base-BXU 33006-000 No
E1MG-LHA-OM 1000Base-LHA 57-0000194-01 Yes
E1MG-LHB 1000Base-LHB 33004-000 No
E1MG-LX-OM 1000Base-LX 33211-100 Yes
E1MG-SX-OM 1000Base-SX 33210-100 Yes
E1MG-TX 1000Base-T Copper 33002-100 No
Hardware Component MonitoringFastIron Fiber-optic Transceivers
Ruckus FastIron Monitoring Configuration Guide, 08.0.70Part Number: 53-1005293-04 63

Ruckus FastIron Monitoring Configuration Guide, 08.0.7064 Part Number: 53-1005293-04
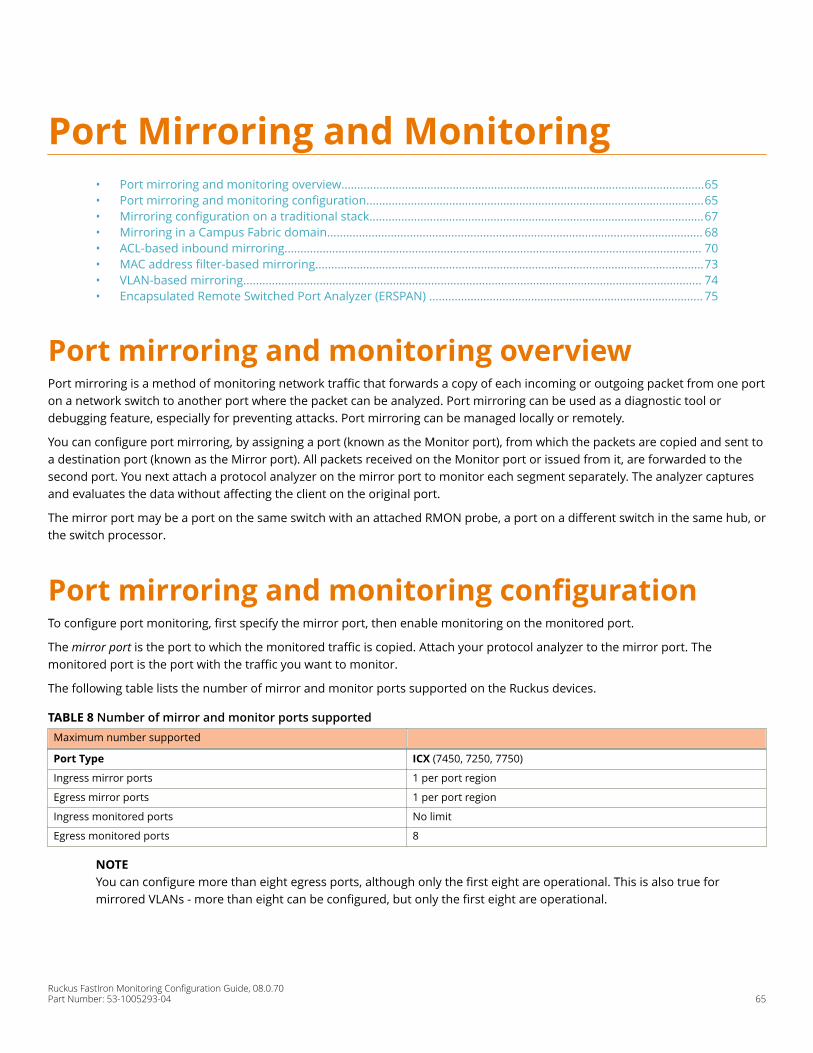
Port Mirroring and Monitoring• Port mirroring and monitoring overview..................................................................................................................65• Port mirroring and monitoring configuration..........................................................................................................65• Mirroring configuration on a traditional stack.........................................................................................................67• Mirroring in a Campus Fabric domain...................................................................................................................... 68• ACL-based inbound mirroring................................................................................................................................... 70• MAC address filter-based mirroring..........................................................................................................................73• VLAN-based mirroring................................................................................................................................................ 74• Encapsulated Remote Switched Port Analyzer (ERSPAN) ...................................................................................... 75
Port mirroring and monitoring overviewPort mirroring is a method of monitoring network traffic that forwards a copy of each incoming or outgoing packet from one porton a network switch to another port where the packet can be analyzed. Port mirroring can be used as a diagnostic tool ordebugging feature, especially for preventing attacks. Port mirroring can be managed locally or remotely.
You can configure port mirroring, by assigning a port (known as the Monitor port), from which the packets are copied and sent toa destination port (known as the Mirror port). All packets received on the Monitor port or issued from it, are forwarded to thesecond port. You next attach a protocol analyzer on the mirror port to monitor each segment separately. The analyzer capturesand evaluates the data without affecting the client on the original port.
The mirror port may be a port on the same switch with an attached RMON probe, a port on a different switch in the same hub, orthe switch processor.
Port mirroring and monitoring configurationTo configure port monitoring, first specify the mirror port, then enable monitoring on the monitored port.
The mirror port is the port to which the monitored traffic is copied. Attach your protocol analyzer to the mirror port. Themonitored port is the port with the traffic you want to monitor.
The following table lists the number of mirror and monitor ports supported on the Ruckus devices.
TABLE 8 Number of mirror and monitor ports supportedMaximum number supported
Port Type ICX (7450, 7250, 7750)
Ingress mirror ports 1 per port region
Egress mirror ports 1 per port region
Ingress monitored ports No limit
Egress monitored ports 8
NOTEYou can configure more than eight egress ports, although only the first eight are operational. This is also true formirrored VLANs - more than eight can be configured, but only the first eight are operational.
Ruckus FastIron Monitoring Configuration Guide, 08.0.70Part Number: 53-1005293-04 65
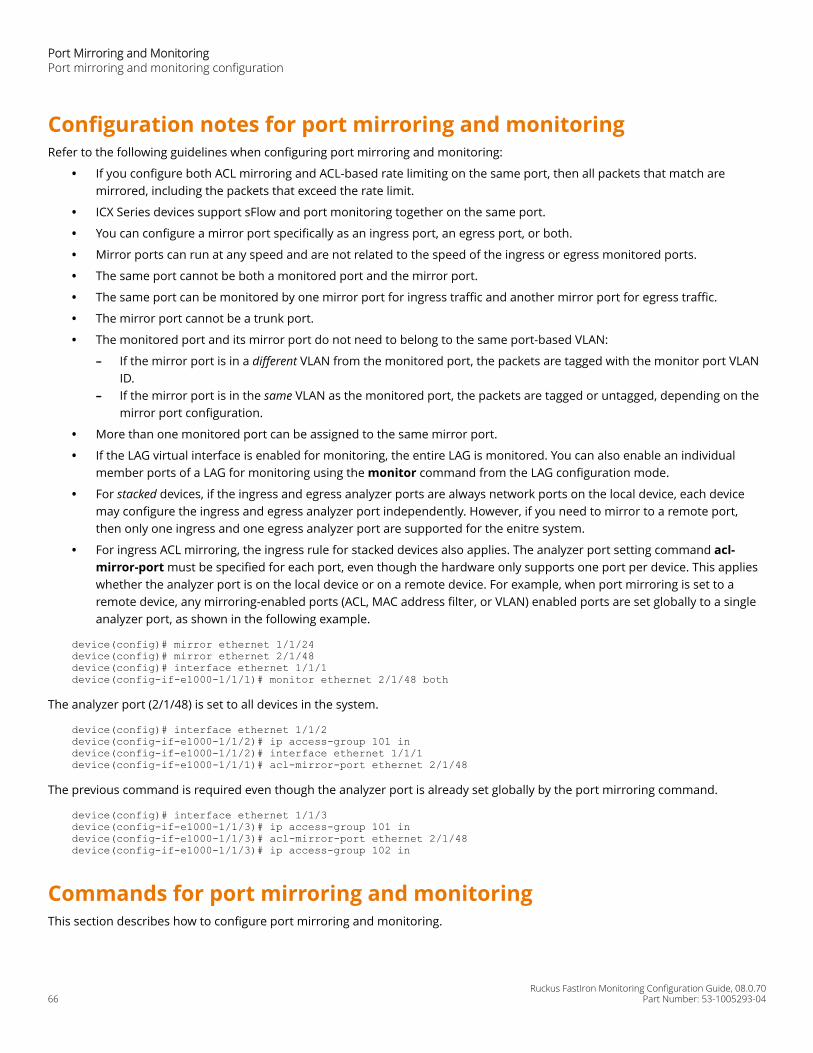
Configuration notes for port mirroring and monitoringRefer to the following guidelines when configuring port mirroring and monitoring:
• If you configure both ACL mirroring and ACL-based rate limiting on the same port, then all packets that match aremirrored, including the packets that exceed the rate limit.
• ICX Series devices support sFlow and port monitoring together on the same port.
• You can configure a mirror port specifically as an ingress port, an egress port, or both.
• Mirror ports can run at any speed and are not related to the speed of the ingress or egress monitored ports.
• The same port cannot be both a monitored port and the mirror port.
• The same port can be monitored by one mirror port for ingress traffic and another mirror port for egress traffic.
• The mirror port cannot be a trunk port.
• The monitored port and its mirror port do not need to belong to the same port-based VLAN:
– If the mirror port is in a different VLAN from the monitored port, the packets are tagged with the monitor port VLANID.
– If the mirror port is in the same VLAN as the monitored port, the packets are tagged or untagged, depending on themirror port configuration.
• More than one monitored port can be assigned to the same mirror port.
• If the LAG virtual interface is enabled for monitoring, the entire LAG is monitored. You can also enable an individualmember ports of a LAG for monitoring using the monitor command from the LAG configuration mode.
• For stacked devices, if the ingress and egress analyzer ports are always network ports on the local device, each devicemay configure the ingress and egress analyzer port independently. However, if you need to mirror to a remote port,then only one ingress and one egress analyzer port are supported for the enitre system.
• For ingress ACL mirroring, the ingress rule for stacked devices also applies. The analyzer port setting command acl-mirror-port must be specified for each port, even though the hardware only supports one port per device. This applieswhether the analyzer port is on the local device or on a remote device. For example, when port mirroring is set to aremote device, any mirroring-enabled ports (ACL, MAC address filter, or VLAN) enabled ports are set globally to a singleanalyzer port, as shown in the following example.
device(config)# mirror ethernet 1/1/24device(config)# mirror ethernet 2/1/48device(config)# interface ethernet 1/1/1device(config-if-e1000-1/1/1)# monitor ethernet 2/1/48 both
The analyzer port (2/1/48) is set to all devices in the system.
device(config)# interface ethernet 1/1/2device(config-if-e1000-1/1/2)# ip access-group 101 indevice(config-if-e1000-1/1/2)# interface ethernet 1/1/1device(config-if-e1000-1/1/1)# acl-mirror-port ethernet 2/1/48
The previous command is required even though the analyzer port is already set globally by the port mirroring command.
device(config)# interface ethernet 1/1/3device(config-if-e1000-1/1/3)# ip access-group 101 indevice(config-if-e1000-1/1/3)# acl-mirror-port ethernet 2/1/48device(config-if-e1000-1/1/3)# ip access-group 102 in
Commands for port mirroring and monitoringThis section describes how to configure port mirroring and monitoring.
Port Mirroring and MonitoringPort mirroring and monitoring configuration
Ruckus FastIron Monitoring Configuration Guide, 08.0.7066 Part Number: 53-1005293-04
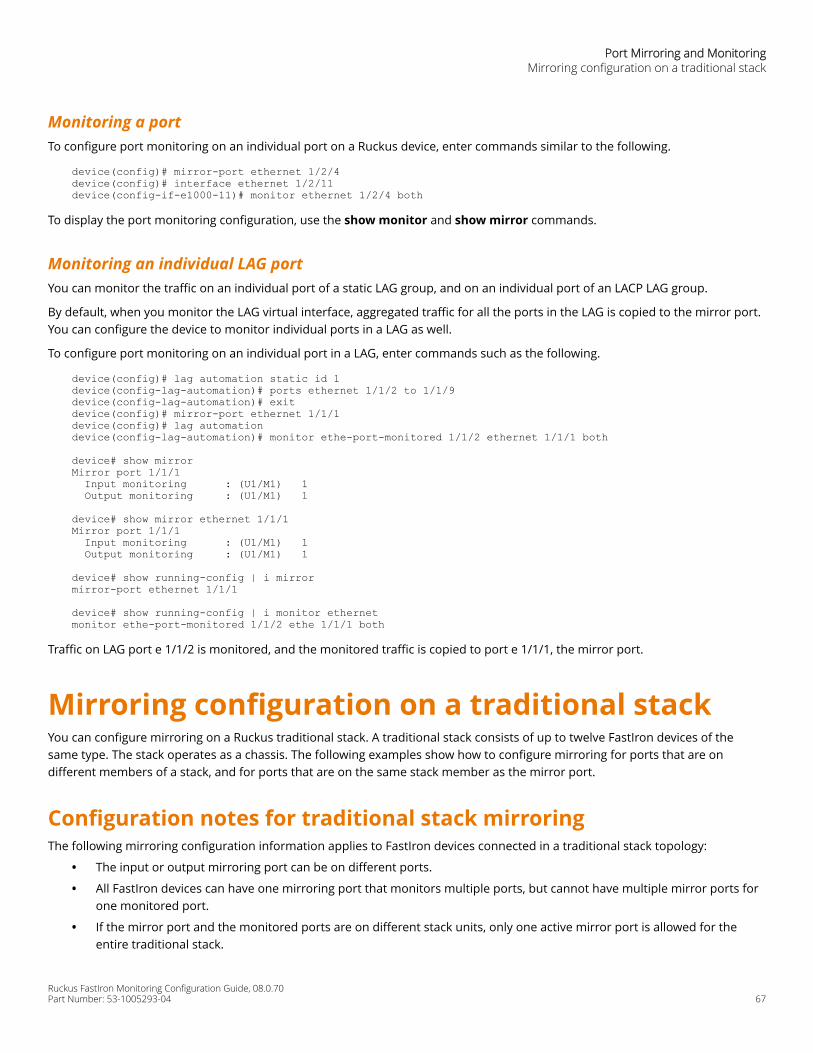
Monitoring a portTo configure port monitoring on an individual port on a Ruckus device, enter commands similar to the following.
device(config)# mirror-port ethernet 1/2/4device(config)# interface ethernet 1/2/11device(config-if-e1000-11)# monitor ethernet 1/2/4 both
To display the port monitoring configuration, use the show monitor and show mirror commands.
Monitoring an individual LAG portYou can monitor the traffic on an individual port of a static LAG group, and on an individual port of an LACP LAG group.
By default, when you monitor the LAG virtual interface, aggregated traffic for all the ports in the LAG is copied to the mirror port.You can configure the device to monitor individual ports in a LAG as well.
To configure port monitoring on an individual port in a LAG, enter commands such as the following.
device(config)# lag automation static id 1device(config-lag-automation)# ports ethernet 1/1/2 to 1/1/9 device(config-lag-automation)# exitdevice(config)# mirror-port ethernet 1/1/1device(config)# lag automation device(config-lag-automation)# monitor ethe-port-monitored 1/1/2 ethernet 1/1/1 both
device# show mirrorMirror port 1/1/1 Input monitoring : (U1/M1) 1 Output monitoring : (U1/M1) 1
device# show mirror ethernet 1/1/1Mirror port 1/1/1 Input monitoring : (U1/M1) 1 Output monitoring : (U1/M1) 1
device# show running-config | i mirrormirror-port ethernet 1/1/1
device# show running-config | i monitor ethernetmonitor ethe-port-monitored 1/1/2 ethe 1/1/1 both
Traffic on LAG port e 1/1/2 is monitored, and the monitored traffic is copied to port e 1/1/1, the mirror port.
Mirroring configuration on a traditional stackYou can configure mirroring on a Ruckus traditional stack. A traditional stack consists of up to twelve FastIron devices of thesame type. The stack operates as a chassis. The following examples show how to configure mirroring for ports that are ondifferent members of a stack, and for ports that are on the same stack member as the mirror port.
Configuration notes for traditional stack mirroringThe following mirroring configuration information applies to FastIron devices connected in a traditional stack topology:
• The input or output mirroring port can be on different ports.
• All FastIron devices can have one mirroring port that monitors multiple ports, but cannot have multiple mirror ports forone monitored port.
• If the mirror port and the monitored ports are on different stack units, only one active mirror port is allowed for theentire traditional stack.
Port Mirroring and MonitoringMirroring configuration on a traditional stack
Ruckus FastIron Monitoring Configuration Guide, 08.0.70Part Number: 53-1005293-04 67

• If the mirror port and the monitored ports are on the same port region, multiple active mirror ports are allowed for theentire traditional stack. Devices in a traditional stack support 24 ports per port region.
• The maximum number of monitored VLANs on a traditional stack is 8.
Configuring mirroring for ports on different members in a traditional stack exampleIn this example, although two ports are configured as active ports, only one active mirror port (port 1/1/24) is allowed for theentire stack because the mirror ports and the monitored ports are on different stack members.
device(config)# mirror-port ethernet 1/1/24device(config)# mirror-port ethernet 2/1/24device(config)# interface ethernet 1/1/1device(config-if-e1000-1/1/1)# monitor ethernet 1/1/24 bothdevice(config-if-e1000-1/1/1)# exitdevice(config)# interface ethernet 2/1/1device(config-if-e1000-2/1/1)# monitor ethernet 1/1/24 bothdevice(config-if-e1000-2/1/1)# exitdevice(config)# interface ethernet 4/1/1device(config-if-e1000-4/1/1)# monitor ethernet 1/1/24 both
Configuring mirroring for ports on the same stack member in a traditional stack exampleIn this example, the mirror ports are assigned to different monitor ports.
device(config)# mirror-port ethernet 1/1/24device(config)# mirror-port ethernet 2/1/24device(config)# mirror-port ethernet 3/1/24device(config)# mirror-port ethernet 4/1/24device(config)# interface ethernet 1/1/1device(config-if-e1000-1/1/1)# monitor ethernet 1/1/24 bothdevice(config)# exitdevice(config)# interface ethernet 2/1/1device(config-if-e1000-2/1/1)# monitor ethernet 2/1/24 bothdevice(config)# exitdevice(config)# interface ethernet 4/1/1device(config-if-e1000-4/1/1)# monitor ethernet 4/1/24 both
Mirroring in a Campus Fabric domainIn a Campus Fabric domain, you can mirror ports in an ICX 7150 PE unit, an ICX 7250 PE unit, an ICX 7450 PE unit, or an ICX 7750CB unit. Campus Fabric supports port mirroring, VLAN mirroring, and ACL mirroring with a mirror clause.
Campus Fabric mirroring limitations• Only one mirror port can be configured on a PE unit for port mirroring.
• When an SPX LAG is mirrored, all traffic is monitored. It is not possible to limit monitoring to an individual LAG port.
• Due to a hardware limitation, a PE mirror port cannot mirror egress flooding, for example, from broadcast, unknownunicast, or multicast traffic.
• A VLAN must have at least one port member configured before monitoring can be configured.
• All incoming traffic (tagged and untagged) in the VLAN is mirrored. Mirroring is not affected by the configuration of themirror port itself.
Port Mirroring and MonitoringMirroring in a Campus Fabric domain
Ruckus FastIron Monitoring Configuration Guide, 08.0.7068 Part Number: 53-1005293-04

Supported Campus Fabric mirroring scenariosThe following mirroring scenarios are possible in a Campus Fabric domain :
• Mirroring a port on any CB unit, monitoring from any CB port on any CB unit
• Mirroring a CB port, monitoring from a PE port (supported for port-based mirroring; not supported for ACL mirroring)
NOTEIf you are monitoring a CB port from a PE port, the monitoring port is configured as a virtual PE port on the CB,and traffic is transmitted to and from the virtual port with an E-tag addressed to the port. Packets are copiedout to the mirroring port with the E-tag intact. As a result, the monitoring device receive packets containing theE-tag.
• Mirroring a port on a PE unit, monitoring from another port on the same PE unit
• Mirroring of a CB port, monitoring from a PE port when VLAN mirroring is enabled.
Unsupported Campus Fabric mirroring configurationsThe following scenarios are not supported in a Campus Fabric domain:
• Mirroring a port on one PE unit, monitoring a port from a different PE unit
NOTEIf the CB determines the mirror port is configured on a PE port, and the monitoring port is on a different PE,the system blocks the configuration and displays a warning similar to the following message:Mirror port 17/1/1 and monitor port 18/1/2 are not on the same PE. Either move mirrorport to a CB port, or change mirror and monitor port to the same PE.
• With ACL mirroring, PE to CB or CB to PE monitoring
• With VLAN mirroring, PE cannot be used as a mirror port
• Monitoring an individual SPX LAG member
Sample configuration for Campus Fabric mirroringThe following example configures port 1/1/7 on the CB as a mirror port that monitors inbound traffic on PE port 17/1/1.
device# configure terminaldevice(config)# mirror-port ethernet 1/1/17device(config)# interface ethernet 17/1/1device(config-if-pe-e1000-17/1/1)# monitor ethernet 1/1/17 in
Displaying Campus Fabric mirroring informationThe show mirror command can be used to display information on mirroring activity for the device. The following exampledisplays information on mirroring on CB units 1 and 2. PE units 17 and 18 are being monitored.
device# show mirrorMirror port 1/1/17 Input monitoring : (U17/M1) 1 2 3 11 Input monitoring : (U17/M2) 1 Output monitoring : (U17/M1) 1 2 3 11 Output monitoring : (U17/M2) 1Mirror port 2/1/20 Input monitoring : (U17/M1) 10
Port Mirroring and MonitoringMirroring in a Campus Fabric domain
Ruckus FastIron Monitoring Configuration Guide, 08.0.70Part Number: 53-1005293-04 69
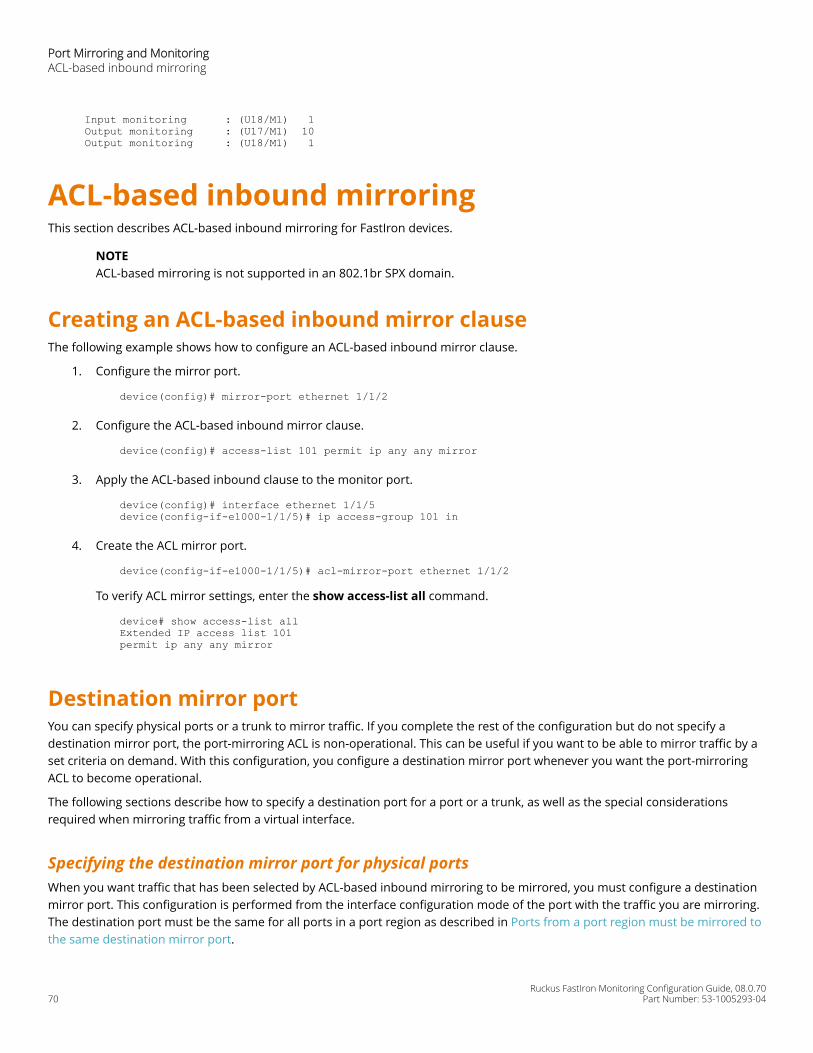
Input monitoring : (U18/M1) 1 Output monitoring : (U17/M1) 10 Output monitoring : (U18/M1) 1
ACL-based inbound mirroringThis section describes ACL-based inbound mirroring for FastIron devices.
NOTEACL-based mirroring is not supported in an 802.1br SPX domain.
Creating an ACL-based inbound mirror clauseThe following example shows how to configure an ACL-based inbound mirror clause.
1. Configure the mirror port.
device(config)# mirror-port ethernet 1/1/2
2. Configure the ACL-based inbound mirror clause.
device(config)# access-list 101 permit ip any any mirror
3. Apply the ACL-based inbound clause to the monitor port.
device(config)# interface ethernet 1/1/5device(config-if-e1000-1/1/5)# ip access-group 101 in
4. Create the ACL mirror port.
device(config-if-e1000-1/1/5)# acl-mirror-port ethernet 1/1/2
To verify ACL mirror settings, enter the show access-list all command.
device# show access-list allExtended IP access list 101permit ip any any mirror
Destination mirror portYou can specify physical ports or a trunk to mirror traffic. If you complete the rest of the configuration but do not specify adestination mirror port, the port-mirroring ACL is non-operational. This can be useful if you want to be able to mirror traffic by aset criteria on demand. With this configuration, you configure a destination mirror port whenever you want the port-mirroringACL to become operational.
The following sections describe how to specify a destination port for a port or a trunk, as well as the special considerationsrequired when mirroring traffic from a virtual interface.
Specifying the destination mirror port for physical portsWhen you want traffic that has been selected by ACL-based inbound mirroring to be mirrored, you must configure a destinationmirror port. This configuration is performed from the interface configuration mode of the port with the traffic you are mirroring.The destination port must be the same for all ports in a port region as described in Ports from a port region must be mirrored tothe same destination mirror port.
Port Mirroring and MonitoringACL-based inbound mirroring
Ruckus FastIron Monitoring Configuration Guide, 08.0.7070 Part Number: 53-1005293-04
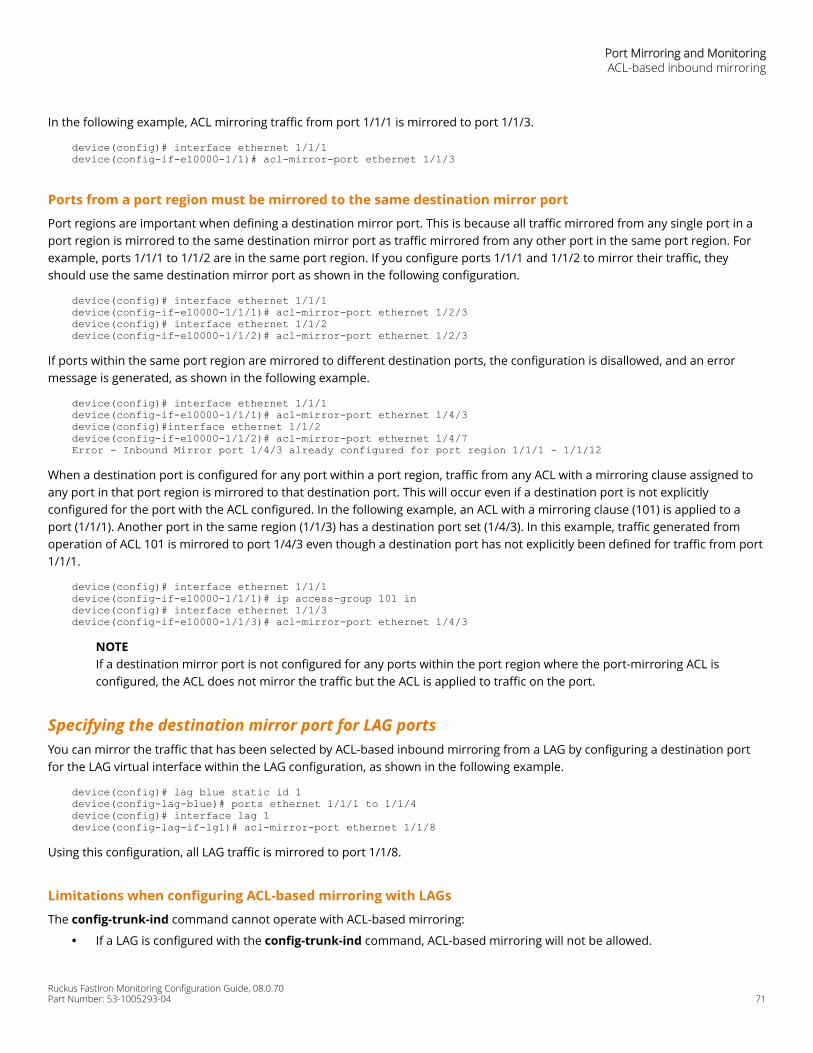
In the following example, ACL mirroring traffic from port 1/1/1 is mirrored to port 1/1/3.
device(config)# interface ethernet 1/1/1device(config-if-e10000-1/1)# acl-mirror-port ethernet 1/1/3
Ports from a port region must be mirrored to the same destination mirror port
Port regions are important when defining a destination mirror port. This is because all traffic mirrored from any single port in aport region is mirrored to the same destination mirror port as traffic mirrored from any other port in the same port region. Forexample, ports 1/1/1 to 1/1/2 are in the same port region. If you configure ports 1/1/1 and 1/1/2 to mirror their traffic, theyshould use the same destination mirror port as shown in the following configuration.
device(config)# interface ethernet 1/1/1device(config-if-e10000-1/1/1)# acl-mirror-port ethernet 1/2/3device(config)# interface ethernet 1/1/2device(config-if-e10000-1/1/2)# acl-mirror-port ethernet 1/2/3
If ports within the same port region are mirrored to different destination ports, the configuration is disallowed, and an errormessage is generated, as shown in the following example.
device(config)# interface ethernet 1/1/1device(config-if-e10000-1/1/1)# acl-mirror-port ethernet 1/4/3device(config)#interface ethernet 1/1/2device(config-if-e10000-1/1/2)# acl-mirror-port ethernet 1/4/7Error - Inbound Mirror port 1/4/3 already configured for port region 1/1/1 - 1/1/12
When a destination port is configured for any port within a port region, traffic from any ACL with a mirroring clause assigned toany port in that port region is mirrored to that destination port. This will occur even if a destination port is not explicitlyconfigured for the port with the ACL configured. In the following example, an ACL with a mirroring clause (101) is applied to aport (1/1/1). Another port in the same region (1/1/3) has a destination port set (1/4/3). In this example, traffic generated fromoperation of ACL 101 is mirrored to port 1/4/3 even though a destination port has not explicitly been defined for traffic from port1/1/1.
device(config)# interface ethernet 1/1/1device(config-if-e10000-1/1/1)# ip access-group 101 indevice(config)# interface ethernet 1/1/3device(config-if-e10000-1/1/3)# acl-mirror-port ethernet 1/4/3
NOTEIf a destination mirror port is not configured for any ports within the port region where the port-mirroring ACL isconfigured, the ACL does not mirror the traffic but the ACL is applied to traffic on the port.
Specifying the destination mirror port for LAG portsYou can mirror the traffic that has been selected by ACL-based inbound mirroring from a LAG by configuring a destination portfor the LAG virtual interface within the LAG configuration, as shown in the following example.
device(config)# lag blue static id 1device(config-lag-blue)# ports ethernet 1/1/1 to 1/1/4device(config)# interface lag 1device(config-lag-if-lg1)# acl-mirror-port ethernet 1/1/8
Using this configuration, all LAG traffic is mirrored to port 1/1/8.
Limitations when configuring ACL-based mirroring with LAGs
The config-trunk-ind command cannot operate with ACL-based mirroring:
• If a LAG is configured with the config-trunk-ind command, ACL-based mirroring will not be allowed.
Port Mirroring and MonitoringACL-based inbound mirroring
Ruckus FastIron Monitoring Configuration Guide, 08.0.70Part Number: 53-1005293-04 71
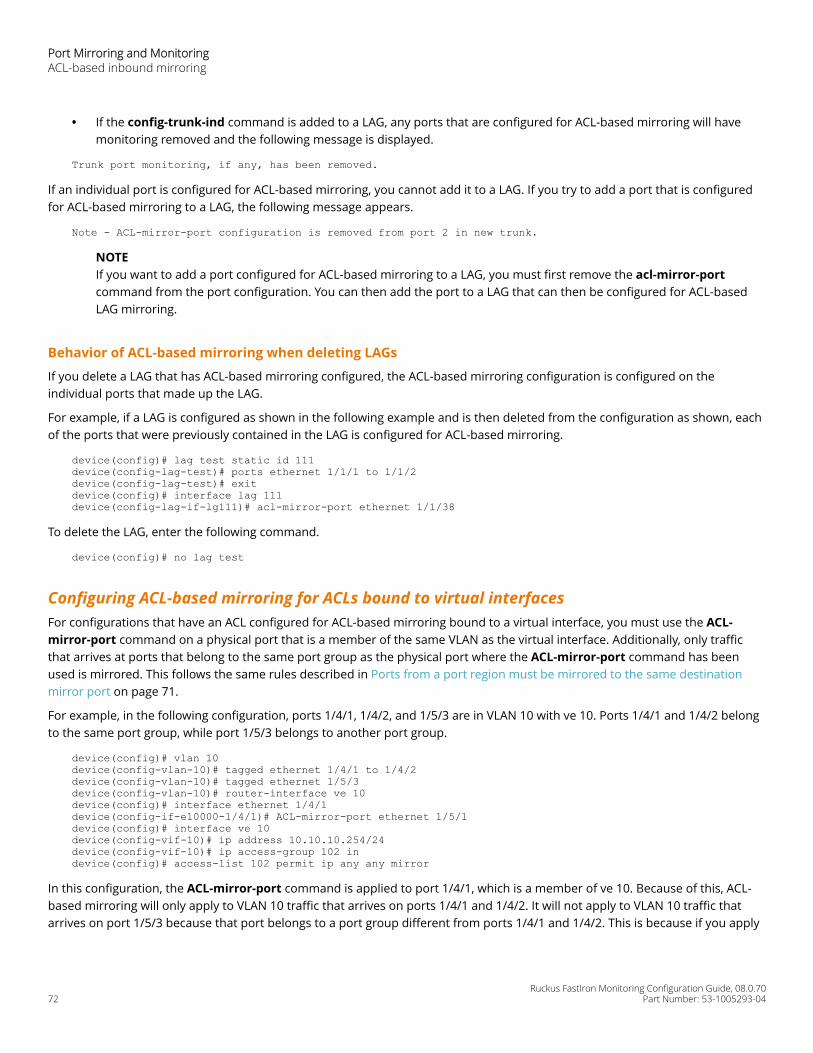
• If the config-trunk-ind command is added to a LAG, any ports that are configured for ACL-based mirroring will havemonitoring removed and the following message is displayed.
Trunk port monitoring, if any, has been removed.
If an individual port is configured for ACL-based mirroring, you cannot add it to a LAG. If you try to add a port that is configuredfor ACL-based mirroring to a LAG, the following message appears.
Note - ACL-mirror-port configuration is removed from port 2 in new trunk.
NOTEIf you want to add a port configured for ACL-based mirroring to a LAG, you must first remove the acl-mirror-portcommand from the port configuration. You can then add the port to a LAG that can then be configured for ACL-basedLAG mirroring.
Behavior of ACL-based mirroring when deleting LAGs
If you delete a LAG that has ACL-based mirroring configured, the ACL-based mirroring configuration is configured on theindividual ports that made up the LAG.
For example, if a LAG is configured as shown in the following example and is then deleted from the configuration as shown, eachof the ports that were previously contained in the LAG is configured for ACL-based mirroring.
device(config)# lag test static id 111device(config-lag-test)# ports ethernet 1/1/1 to 1/1/2device(config-lag-test)# exitdevice(config)# interface lag 111device(config-lag-if-lg111)# acl-mirror-port ethernet 1/1/38
To delete the LAG, enter the following command.
device(config)# no lag test
Configuring ACL-based mirroring for ACLs bound to virtual interfacesFor configurations that have an ACL configured for ACL-based mirroring bound to a virtual interface, you must use the ACL-mirror-port command on a physical port that is a member of the same VLAN as the virtual interface. Additionally, only trafficthat arrives at ports that belong to the same port group as the physical port where the ACL-mirror-port command has beenused is mirrored. This follows the same rules described in Ports from a port region must be mirrored to the same destinationmirror port on page 71.
For example, in the following configuration, ports 1/4/1, 1/4/2, and 1/5/3 are in VLAN 10 with ve 10. Ports 1/4/1 and 1/4/2 belongto the same port group, while port 1/5/3 belongs to another port group.
device(config)# vlan 10 device(config-vlan-10)# tagged ethernet 1/4/1 to 1/4/2device(config-vlan-10)# tagged ethernet 1/5/3device(config-vlan-10)# router-interface ve 10device(config)# interface ethernet 1/4/1device(config-if-e10000-1/4/1)# ACL-mirror-port ethernet 1/5/1device(config)# interface ve 10device(config-vif-10)# ip address 10.10.10.254/24device(config-vif-10)# ip access-group 102 indevice(config)# access-list 102 permit ip any any mirror
In this configuration, the ACL-mirror-port command is applied to port 1/4/1, which is a member of ve 10. Because of this, ACL-based mirroring will only apply to VLAN 10 traffic that arrives on ports 1/4/1 and 1/4/2. It will not apply to VLAN 10 traffic thatarrives on port 1/5/3 because that port belongs to a port group different from ports 1/4/1 and 1/4/2. This is because if you apply
Port Mirroring and MonitoringACL-based inbound mirroring
Ruckus FastIron Monitoring Configuration Guide, 08.0.7072 Part Number: 53-1005293-04
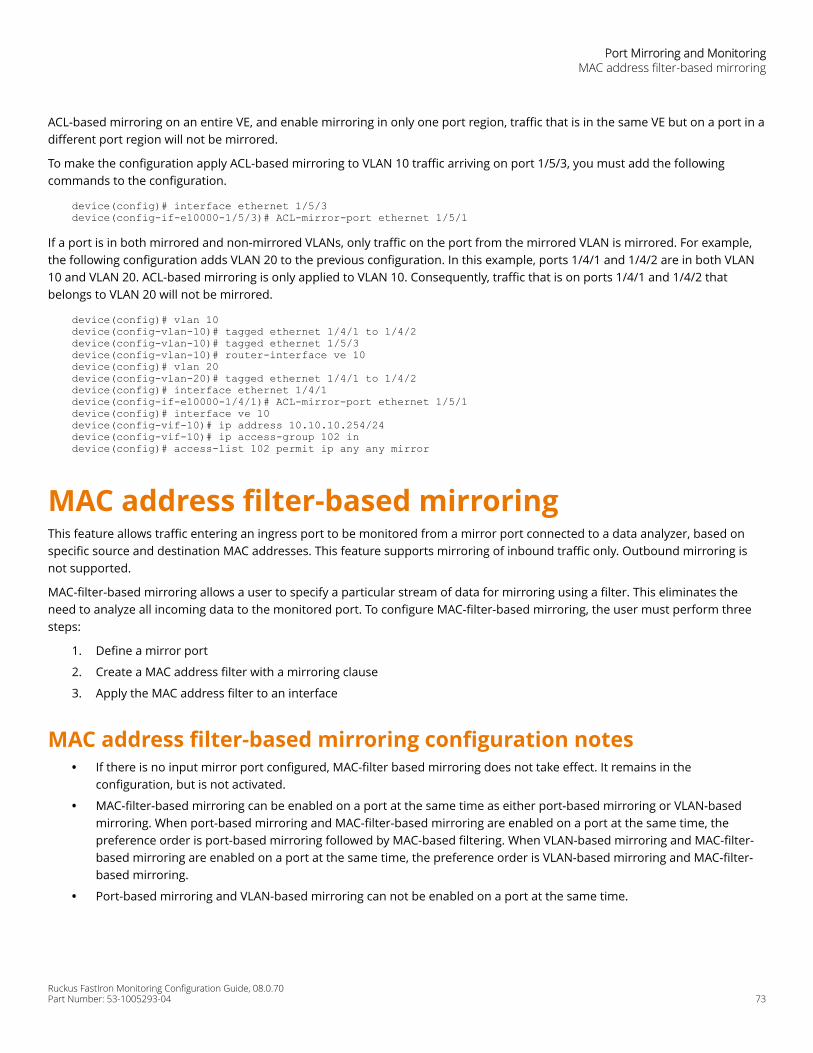
ACL-based mirroring on an entire VE, and enable mirroring in only one port region, traffic that is in the same VE but on a port in adifferent port region will not be mirrored.
To make the configuration apply ACL-based mirroring to VLAN 10 traffic arriving on port 1/5/3, you must add the followingcommands to the configuration.
device(config)# interface ethernet 1/5/3device(config-if-e10000-1/5/3)# ACL-mirror-port ethernet 1/5/1
If a port is in both mirrored and non-mirrored VLANs, only traffic on the port from the mirrored VLAN is mirrored. For example,the following configuration adds VLAN 20 to the previous configuration. In this example, ports 1/4/1 and 1/4/2 are in both VLAN10 and VLAN 20. ACL-based mirroring is only applied to VLAN 10. Consequently, traffic that is on ports 1/4/1 and 1/4/2 thatbelongs to VLAN 20 will not be mirrored.
device(config)# vlan 10 device(config-vlan-10)# tagged ethernet 1/4/1 to 1/4/2device(config-vlan-10)# tagged ethernet 1/5/3device(config-vlan-10)# router-interface ve 10device(config)# vlan 20device(config-vlan-20)# tagged ethernet 1/4/1 to 1/4/2device(config)# interface ethernet 1/4/1device(config-if-e10000-1/4/1)# ACL-mirror-port ethernet 1/5/1device(config)# interface ve 10device(config-vif-10)# ip address 10.10.10.254/24device(config-vif-10)# ip access-group 102 indevice(config)# access-list 102 permit ip any any mirror
MAC address filter-based mirroringThis feature allows traffic entering an ingress port to be monitored from a mirror port connected to a data analyzer, based onspecific source and destination MAC addresses. This feature supports mirroring of inbound traffic only. Outbound mirroring isnot supported.
MAC-filter-based mirroring allows a user to specify a particular stream of data for mirroring using a filter. This eliminates theneed to analyze all incoming data to the monitored port. To configure MAC-filter-based mirroring, the user must perform threesteps:
1. Define a mirror port
2. Create a MAC address filter with a mirroring clause
3. Apply the MAC address filter to an interface
MAC address filter-based mirroring configuration notes• If there is no input mirror port configured, MAC-filter based mirroring does not take effect. It remains in the
configuration, but is not activated.
• MAC-filter-based mirroring can be enabled on a port at the same time as either port-based mirroring or VLAN-basedmirroring. When port-based mirroring and MAC-filter-based mirroring are enabled on a port at the same time, thepreference order is port-based mirroring followed by MAC-based filtering. When VLAN-based mirroring and MAC-filter-based mirroring are enabled on a port at the same time, the preference order is VLAN-based mirroring and MAC-filter-based mirroring.
• Port-based mirroring and VLAN-based mirroring can not be enabled on a port at the same time.
Port Mirroring and MonitoringMAC address filter-based mirroring
Ruckus FastIron Monitoring Configuration Guide, 08.0.70Part Number: 53-1005293-04 73
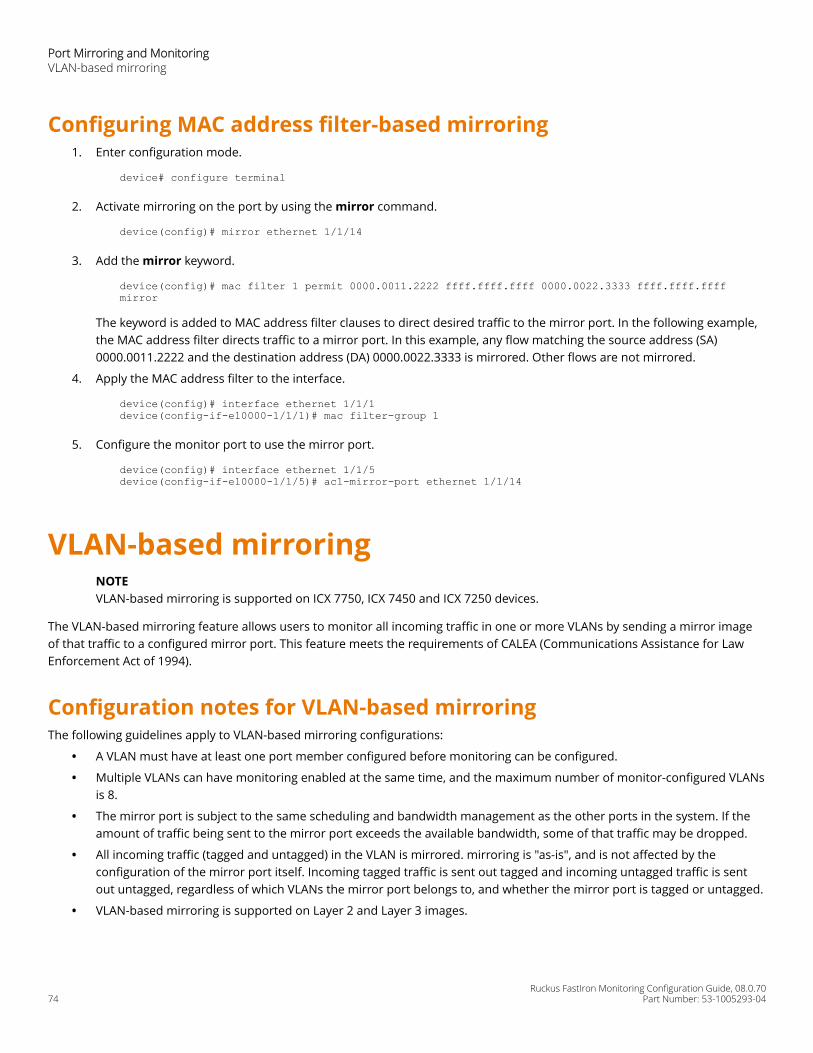
Configuring MAC address filter-based mirroring1. Enter configuration mode.
device# configure terminal
2. Activate mirroring on the port by using the mirror command.
device(config)# mirror ethernet 1/1/14
3. Add the mirror keyword.
device(config)# mac filter 1 permit 0000.0011.2222 ffff.ffff.ffff 0000.0022.3333 ffff.ffff.ffff mirror
The keyword is added to MAC address filter clauses to direct desired traffic to the mirror port. In the following example,the MAC address filter directs traffic to a mirror port. In this example, any flow matching the source address (SA)0000.0011.2222 and the destination address (DA) 0000.0022.3333 is mirrored. Other flows are not mirrored.
4. Apply the MAC address filter to the interface.
device(config)# interface ethernet 1/1/1device(config-if-e10000-1/1/1)# mac filter-group 1
5. Configure the monitor port to use the mirror port.
device(config)# interface ethernet 1/1/5device(config-if-e10000-1/1/5)# acl-mirror-port ethernet 1/1/14
VLAN-based mirroringNOTEVLAN-based mirroring is supported on ICX 7750, ICX 7450 and ICX 7250 devices.
The VLAN-based mirroring feature allows users to monitor all incoming traffic in one or more VLANs by sending a mirror imageof that traffic to a configured mirror port. This feature meets the requirements of CALEA (Communications Assistance for LawEnforcement Act of 1994).
Configuration notes for VLAN-based mirroringThe following guidelines apply to VLAN-based mirroring configurations:
• A VLAN must have at least one port member configured before monitoring can be configured.
• Multiple VLANs can have monitoring enabled at the same time, and the maximum number of monitor-configured VLANsis 8.
• The mirror port is subject to the same scheduling and bandwidth management as the other ports in the system. If theamount of traffic being sent to the mirror port exceeds the available bandwidth, some of that traffic may be dropped.
• All incoming traffic (tagged and untagged) in the VLAN is mirrored. mirroring is "as-is", and is not affected by theconfiguration of the mirror port itself. Incoming tagged traffic is sent out tagged and incoming untagged traffic is sentout untagged, regardless of which VLANs the mirror port belongs to, and whether the mirror port is tagged or untagged.
• VLAN-based mirroring is supported on Layer 2 and Layer 3 images.
Port Mirroring and MonitoringVLAN-based mirroring
Ruckus FastIron Monitoring Configuration Guide, 08.0.7074 Part Number: 53-1005293-04
Configuring VLAN-based mirroringConfigure VLAN-based mirroring using the monitor ethernet command in VLAN configuration mode. For example, to enablemirroring on VLANs 10 and 20, to mirror port e 1/1/21, enter the following commands.
device(config)# mirror-port ethernet 1/1/21 inputdevice(config)# vlan 10device(config-VLAN-10)# monitor ethernet 1/1/21device(config-VLAN-10)# exitdevice(config)# vlan 20device(config-VLAN-20)# monitor ethernet 1/1/21device(config-VLAN-20)# end
To disable mirroring on VLAN 20, enter the following commands.
device(config)# vlan 20device(config-VLAN-20)# no monitor ethernet 1/1/21device(config-VLAN-20)# end
Displaying VLAN-based mirroring statusThe show vlan command displays the VLAN-based mirroring status.
device# show vlanTotal PORT-VLAN entries: 4Maximum PORT-VLAN entries: 4060Legend: [Stk=Stack-Unit, S=Slot]PORT-VLAN 1, Name DEFAULT-VLAN, Priority level0, Spanning tree On Untagged Ports: (Stk0/S1) 3 4 5 6 7 8 9 10 11 12 13 14 Untagged Ports: (Stk0/S1) 15 16 17 18 19 20 21 22 23 24 25 26 Untagged Ports: (Stk0/S1) 27 28 29 30 31 32 33 34 35 36 37 38 Untagged Ports: (Stk0/S1) 39 40 41 42 43 44 45 46 47 48 Untagged Ports: (Stk0/S2) 1 2 Tagged Ports: None Uplink Ports: None DualMode Ports: None Mac-Vlan Ports: None Monitoring: DisabledPORT-VLAN 10, Name [None], Priority level0, Spanning tree On Untagged Ports: (Stk0/S1) 1 Tagged Ports: None Uplink Ports: None DualMode Ports: None Mac-Vlan Ports: None Monitoring: EnabledPORT-VLAN 20, Name [None], Priority level0, Spanning tree On Untagged Ports: (Stk0/S1) 2 Tagged Ports: None Uplink Ports: None DualMode Ports: None Mac-Vlan Ports: None Monitoring: Disabled
Encapsulated Remote Switched Port Analyzer(ERSPAN)ERSPAN allows mirroring of packets across a Layer 3 network. Using ERSPAN, you can encapsulate monitored traffic and send itto an analysis station not directly connected to the switch.
ERSPAN encapsulates mirrored packets using GRE with IP delivery. After a packet has been encapsulated, it is forwardedthroughout the Layer 3-routed network across a special Layer 3 tunnel. The data section contains the original mirrored packet.
Port Mirroring and Monitoring Encapsulated Remote Switched Port Analyzer (ERSPAN)
Ruckus FastIron Monitoring Configuration Guide, 08.0.70Part Number: 53-1005293-04 75
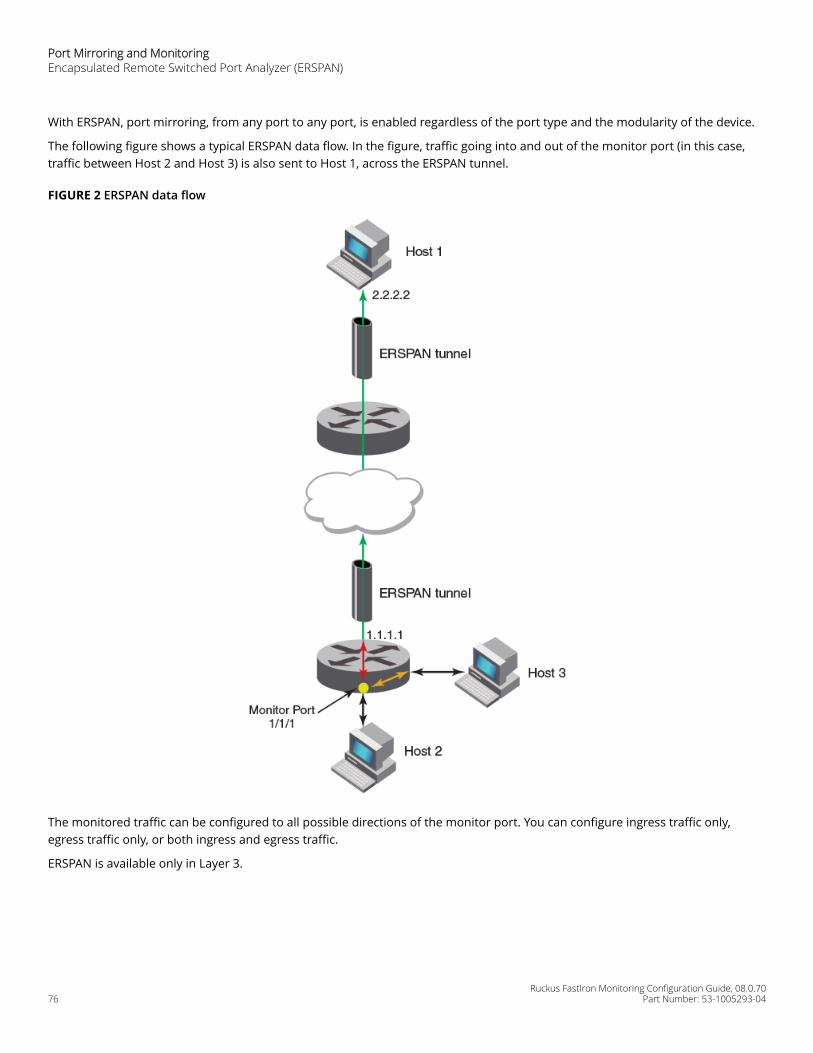
With ERSPAN, port mirroring, from any port to any port, is enabled regardless of the port type and the modularity of the device.
The following figure shows a typical ERSPAN data flow. In the figure, traffic going into and out of the monitor port (in this case,traffic between Host 2 and Host 3) is also sent to Host 1, across the ERSPAN tunnel.
FIGURE 2 ERSPAN data flow
The monitored traffic can be configured to all possible directions of the monitor port. You can configure ingress traffic only,egress traffic only, or both ingress and egress traffic.
ERSPAN is available only in Layer 3.
Port Mirroring and MonitoringEncapsulated Remote Switched Port Analyzer (ERSPAN)
Ruckus FastIron Monitoring Configuration Guide, 08.0.7076 Part Number: 53-1005293-04
ERSPAN configuration stepsYou must complete the following tasks to enable ERSPAN:
• Configure the ERSPAN profile.
• Configure the monitor port.
ERSPAN feature limitations• The maximum number of mirroring sessions per device is four.
• VLAN mirroring is not supported.
• In some cases, speed mismatches may prevent mirroring of all traffic.
• You cannot terminate the Generic Routing Encapsulation (GRE) tunnel on an ICX switch. ERSPAN must be terminated onthe host/analyzer.
• ERSPAN has not been tested against implementations by other vendors.
Configuring an ERSPAN profileAn ERSPAN profile defines a tunnel over a Layer 3 network from a router to a remote host. Mirrored packets can then be sent tothis remote host.
The router must have a configured IP on at least one of the interfaces.
1. Enter global configuration mode.
device# configure terminal
2. Create an ERSPAN profile and assign it a number.
device(config)# monitor-profile 1 type erspan
This command puts you in monitor-profile mode.
3. Enter the IP address of the source router.
device(config-monitor-profile 1)# source-ip 10.1.1.1
The IP address can be any IP on the router.
4. Enter the IP address of the destination host.
device(config-monitor-profile 1)# destination-ip 1.1.1.1
The IP address is for the host that is collecting the mirrored traffic, not the device.
5. Exit monitor-profile mode.
device(config-monitor-profile 1)# exit
Port Mirroring and MonitoringEncapsulated Remote Switched Port Analyzer (ERSPAN)
Ruckus FastIron Monitoring Configuration Guide, 08.0.70Part Number: 53-1005293-04 77
6. Verify the configuration.
device(config)# show erspan profile 1Profile 1Type ERSPANMirror destination reachable.*/Error condition - Mirror destination Not reachable/*Destination IP 10.1.1.100Destination MAC 0000.0000.0000Source IP 10.1.1.1Source MAC cc4e.0000.0000Ports monitored: Input monitoring : (U1/M1) 1 Output monitoring : (U1/M1) 1 HW destination id for each device:stack_id/device:dest_id
If Mirror destination Not reachable. appears in the output, see the section Troubleshooting ERSPAN reachabilityerrors on page 78.
ERSPAN profile configuration exampledevice# configure terminaldevice(config)# monitor-profile 1 type erspandevice(config-monitor-profile 1)# source-ip 10.1.1.1device(config-monitor-profile 1)# destination-ip 10.1.1.100device(config-monitor-profile 1)# exitdevice(config)# show erspan profile 1
Next, you need to configure the monitor port.
Troubleshooting ERSPAN reachability errorsFollow these examples to troubleshoot and resolve ERSPAN destination not reachable errors.
device(config)# show erspan profile 1Profile 1Type ERSPANMirror destination Not reachable.Reason: ***********Destination IP 10.1.1.100Destination MAC 0000.0000.0000Source IP 10.1.1.1Source MAC cc4e.0000.0000Ports monitored: Input monitoring : (U1/M1) 1 Output monitoring : (U1/M1) 1 HW destination id for each device:stack_id/device:dest_id
There are seven reasons why a Mirror destination Not reachable error occurs.
Case Reason
1 ARP is not resolved.
2 Route does not exist.
3 Outgoing port is a management port.
4 Outgoing port is a loopback port.
5 Outgoing port is a GRE IP tunnel port.
6 Outgoing port is not known.
7 Outgoing port is a sink port.
Port Mirroring and MonitoringEncapsulated Remote Switched Port Analyzer (ERSPAN)
Ruckus FastIron Monitoring Configuration Guide, 08.0.7078 Part Number: 53-1005293-04
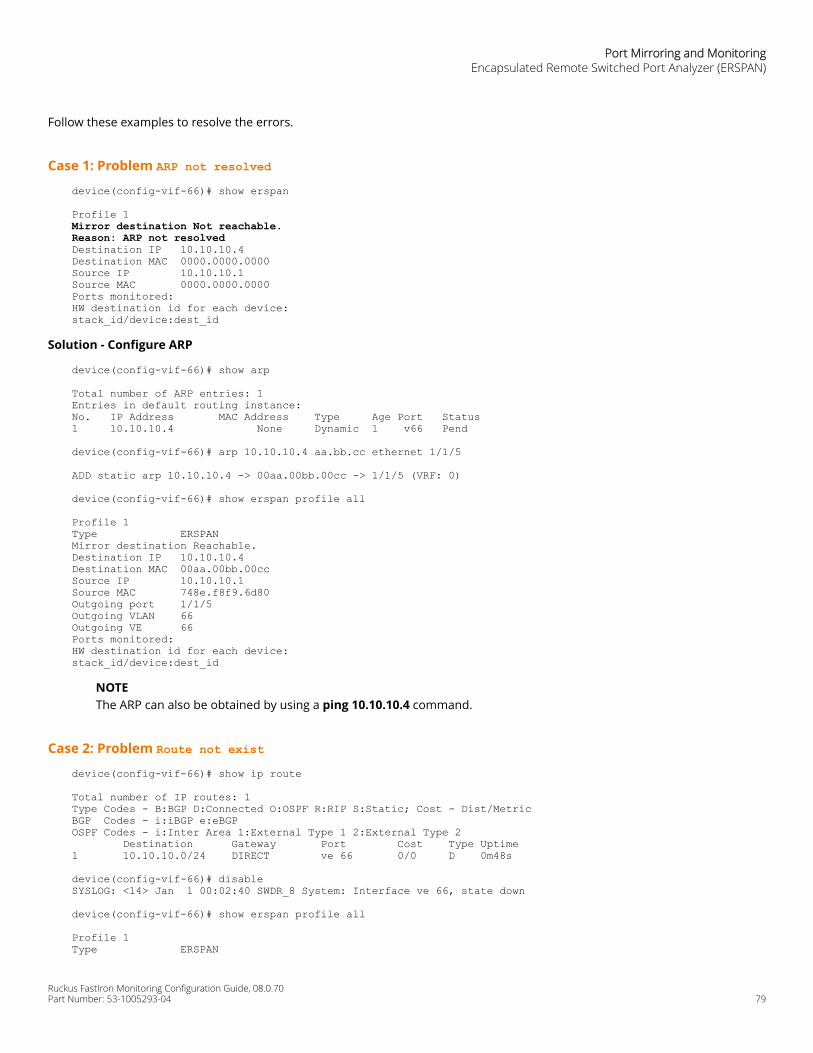
Follow these examples to resolve the errors.
Case 1: Problem ARP not resolveddevice(config-vif-66)# show erspan
Profile 1Mirror destination Not reachable.Reason: ARP not resolvedDestination IP 10.10.10.4Destination MAC 0000.0000.0000Source IP 10.10.10.1Source MAC 0000.0000.0000Ports monitored:HW destination id for each device:stack_id/device:dest_id
Solution - Configure ARP
device(config-vif-66)# show arp
Total number of ARP entries: 1Entries in default routing instance:No. IP Address MAC Address Type Age Port Status1 10.10.10.4 None Dynamic 1 v66 Pend
device(config-vif-66)# arp 10.10.10.4 aa.bb.cc ethernet 1/1/5
ADD static arp 10.10.10.4 -> 00aa.00bb.00cc -> 1/1/5 (VRF: 0)
device(config-vif-66)# show erspan profile all
Profile 1Type ERSPANMirror destination Reachable.Destination IP 10.10.10.4Destination MAC 00aa.00bb.00ccSource IP 10.10.10.1Source MAC 748e.f8f9.6d80Outgoing port 1/1/5Outgoing VLAN 66Outgoing VE 66Ports monitored:HW destination id for each device:stack_id/device:dest_id
NOTEThe ARP can also be obtained by using a ping 10.10.10.4 command.
Case 2: Problem Route not existdevice(config-vif-66)# show ip route
Total number of IP routes: 1Type Codes - B:BGP D:Connected O:OSPF R:RIP S:Static; Cost - Dist/MetricBGP Codes - i:iBGP e:eBGPOSPF Codes - i:Inter Area 1:External Type 1 2:External Type 2 Destination Gateway Port Cost Type Uptime1 10.10.10.0/24 DIRECT ve 66 0/0 D 0m48s
device(config-vif-66)# disable SYSLOG: <14> Jan 1 00:02:40 SWDR_8 System: Interface ve 66, state down
device(config-vif-66)# show erspan profile all
Profile 1Type ERSPAN
Port Mirroring and MonitoringEncapsulated Remote Switched Port Analyzer (ERSPAN)
Ruckus FastIron Monitoring Configuration Guide, 08.0.70Part Number: 53-1005293-04 79

Mirror destination Not reachable.Reason: Route not existDestination IP 10.10.10.4Destination MAC 0000.0000.0000Source IP 10.10.10.1Source MAC 748e.f8f9.6d80Ports monitored:HW destination id for each device:stack_id/device:dest_id
Solution - Enable the interface (VIF)
device(config-vif-66)# enable
SYSLOG: <14> Jan 1 00:03:07 SWDR_8 System: Interface ve 66, state up
device(config-vif-66)# show erspan profile all
Profile 1Type ERSPANMirror destination Reachable.Destination IP 10.10.10.4Destination MAC 00aa.00bb.00ccSource IP 10.10.10.1Source MAC 748e.f8f9.6d80Outgoing port 1/1/5Outgoing VLAN 66Outgoing VE 66Ports monitored:HW destination id for each device:stack_id/device:dest_id
Case 3: Problem Outgoing port is management portdevice(config-vif-66)# show erspan profile 1
Profile 1Type ERSPANMirror destination Not reachable.Reason: Outgoing port is management portDestination IP 10.10.10.4Destination MAC 0000.0000.0000Source IP 10.10.10.1Source MAC 748e.f8f9.6d80Ports monitored:HW destination id for each device:stack_id/device:dest_id
device(config-vif-66)# show ip route
Total number of IP routes: 2Type Codes - B:BGP D:Connected O:OSPF R:RIP S:Static; Cost - Dist/MetricBGP Codes - i:iBGP e:eBGPOSPF Codes - i:Inter Area 1:External Type 1 2:External Type 2 Destination Gateway Port Cost Type Uptime1 10.10.10.0/24 DIRECT e mgmt1 0/0 D 0m2s 2 40.40.40.0/24 DIRECT e mgmt1 0/0 D 0m2s
The router for an ERSPAN destination IP can be learned by routing protocols (RIP, OSPF, etc.) or you can configure it statisticallyusing ip route command. The commands disable or enable when run on the port is one way to add or remove routes.
Solution
There is no solution to this problem if you continue to use a management port as the outgoing port. You cannot use an IPaddress reachable through a management port as an ERSPAN destination.
Port Mirroring and MonitoringEncapsulated Remote Switched Port Analyzer (ERSPAN)
Ruckus FastIron Monitoring Configuration Guide, 08.0.7080 Part Number: 53-1005293-04
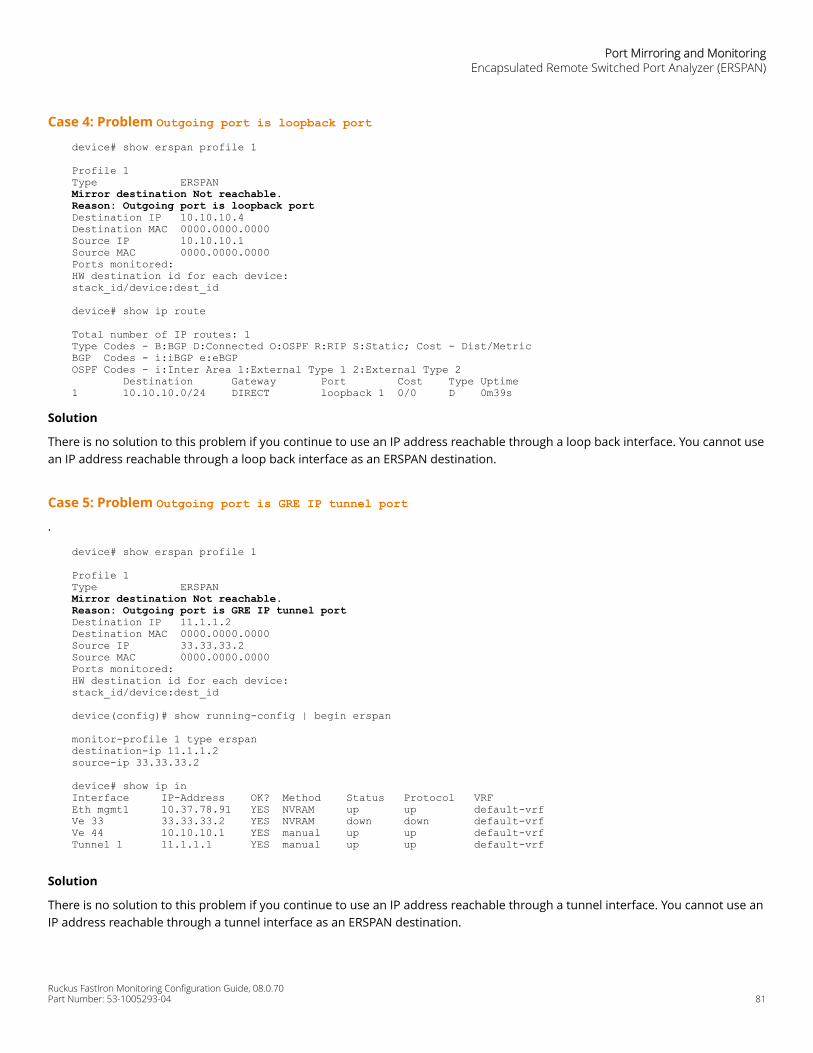
Case 4: Problem Outgoing port is loopback portdevice# show erspan profile 1
Profile 1Type ERSPANMirror destination Not reachable.Reason: Outgoing port is loopback portDestination IP 10.10.10.4Destination MAC 0000.0000.0000Source IP 10.10.10.1Source MAC 0000.0000.0000Ports monitored:HW destination id for each device:stack_id/device:dest_id
device# show ip route
Total number of IP routes: 1Type Codes - B:BGP D:Connected O:OSPF R:RIP S:Static; Cost - Dist/MetricBGP Codes - i:iBGP e:eBGPOSPF Codes - i:Inter Area 1:External Type 1 2:External Type 2 Destination Gateway Port Cost Type Uptime1 10.10.10.0/24 DIRECT loopback 1 0/0 D 0m39s
Solution
There is no solution to this problem if you continue to use an IP address reachable through a loop back interface. You cannot usean IP address reachable through a loop back interface as an ERSPAN destination.
Case 5: Problem Outgoing port is GRE IP tunnel port.
device# show erspan profile 1
Profile 1Type ERSPANMirror destination Not reachable.Reason: Outgoing port is GRE IP tunnel portDestination IP 11.1.1.2Destination MAC 0000.0000.0000Source IP 33.33.33.2Source MAC 0000.0000.0000Ports monitored:HW destination id for each device:stack_id/device:dest_id
device(config)# show running-config | begin erspan
monitor-profile 1 type erspandestination-ip 11.1.1.2source-ip 33.33.33.2
device# show ip inInterface IP-Address OK? Method Status Protocol VRF Eth mgmt1 10.37.78.91 YES NVRAM up up default-vrf Ve 33 33.33.33.2 YES NVRAM down down default-vrf Ve 44 10.10.10.1 YES manual up up default-vrf Tunnel 1 11.1.1.1 YES manual up up default-vrf
Solution
There is no solution to this problem if you continue to use an IP address reachable through a tunnel interface. You cannot use anIP address reachable through a tunnel interface as an ERSPAN destination.
Port Mirroring and MonitoringEncapsulated Remote Switched Port Analyzer (ERSPAN)
Ruckus FastIron Monitoring Configuration Guide, 08.0.70Part Number: 53-1005293-04 81

Case 6: Problem Outgoing port is not known.device# show erspan profile 1
Profile 1Type ERSPANMirror destination Not reachable.Reason: Outgoing port is not knownDestination IP 11.1.1.2Destination MAC 0000.0000.0000Source IP 33.33.33.2Source MAC 0000.0000.0000Ports monitored:HW destination id for each device:stack_id/device:dest_id
Solution - The same as with Case 2: Route not exist
Case 7: Problem Outgoing port is a sink portdevice# show erspan profile 1
Profile 1Type ERSPAN
Mirror destination Not reachable.Reason: Outgoing port is a sink portDestination IP 11.1.1.2Destination MAC 0000.0000.0000Source IP 33.33.33.2Source MAC 0000.0000.0000Ports monitored:HW destination id for each device:stack_id/device:dest_id
Solution - The same as with Case 2: Route not exist.
Configuring a monitor port for ERSPANAn ERSPAN monitor port is the port on which traffic is captured and sent to a remote destination over a Layer 3 network.
Before you configure the monitor port, you must configure an ERSPAN profile.
1. Enter global configuration mode.
device# configure terminal
2. Enter interface configuration mode.
device(config)# interface ethernet 1/2/3
3. Configure the mirror port for ERSPAN.
device(config-if-e1000-1/2/3)# monitor profile 1 both
Port Mirroring and MonitoringEncapsulated Remote Switched Port Analyzer (ERSPAN)
Ruckus FastIron Monitoring Configuration Guide, 08.0.7082 Part Number: 53-1005293-04
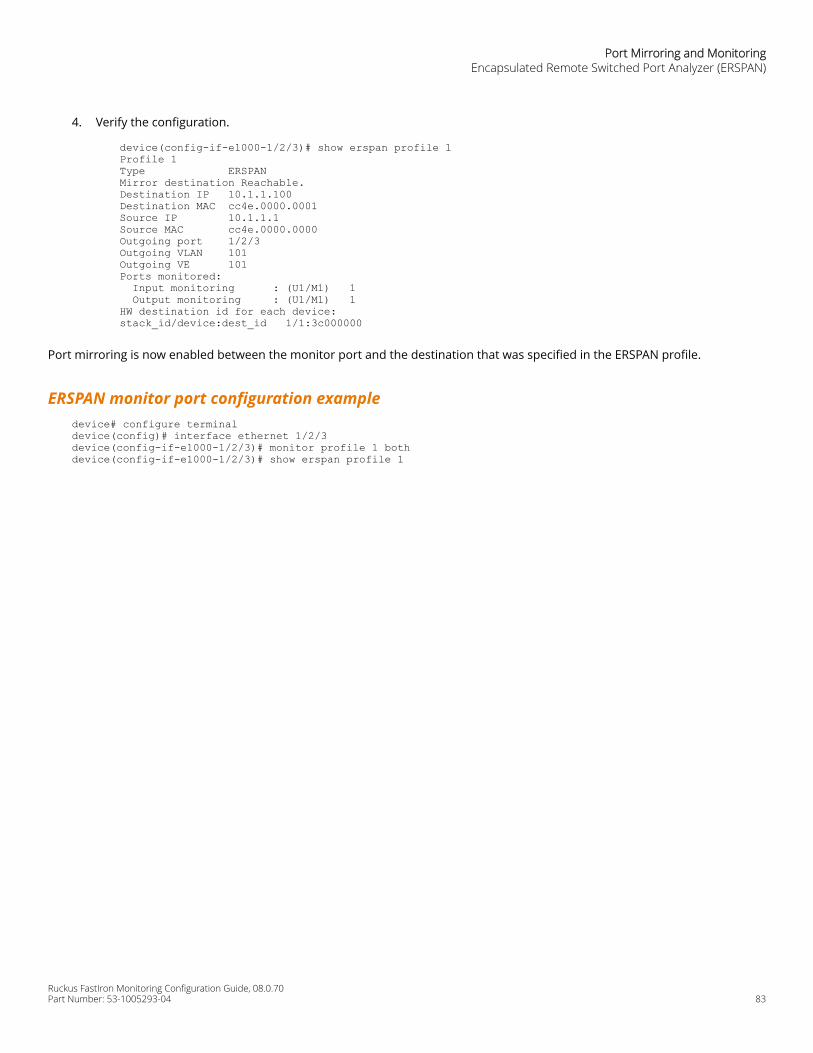
4. Verify the configuration.
device(config-if-e1000-1/2/3)# show erspan profile 1Profile 1Type ERSPANMirror destination Reachable.Destination IP 10.1.1.100Destination MAC cc4e.0000.0001Source IP 10.1.1.1Source MAC cc4e.0000.0000Outgoing port 1/2/3Outgoing VLAN 101Outgoing VE 101Ports monitored: Input monitoring : (U1/M1) 1 Output monitoring : (U1/M1) 1 HW destination id for each device:stack_id/device:dest_id 1/1:3c000000
Port mirroring is now enabled between the monitor port and the destination that was specified in the ERSPAN profile.
ERSPAN monitor port configuration exampledevice# configure terminal device(config)# interface ethernet 1/2/3device(config-if-e1000-1/2/3)# monitor profile 1 bothdevice(config-if-e1000-1/2/3)# show erspan profile 1
Port Mirroring and MonitoringEncapsulated Remote Switched Port Analyzer (ERSPAN)
Ruckus FastIron Monitoring Configuration Guide, 08.0.70Part Number: 53-1005293-04 83

Ruckus FastIron Monitoring Configuration Guide, 08.0.7084 Part Number: 53-1005293-04
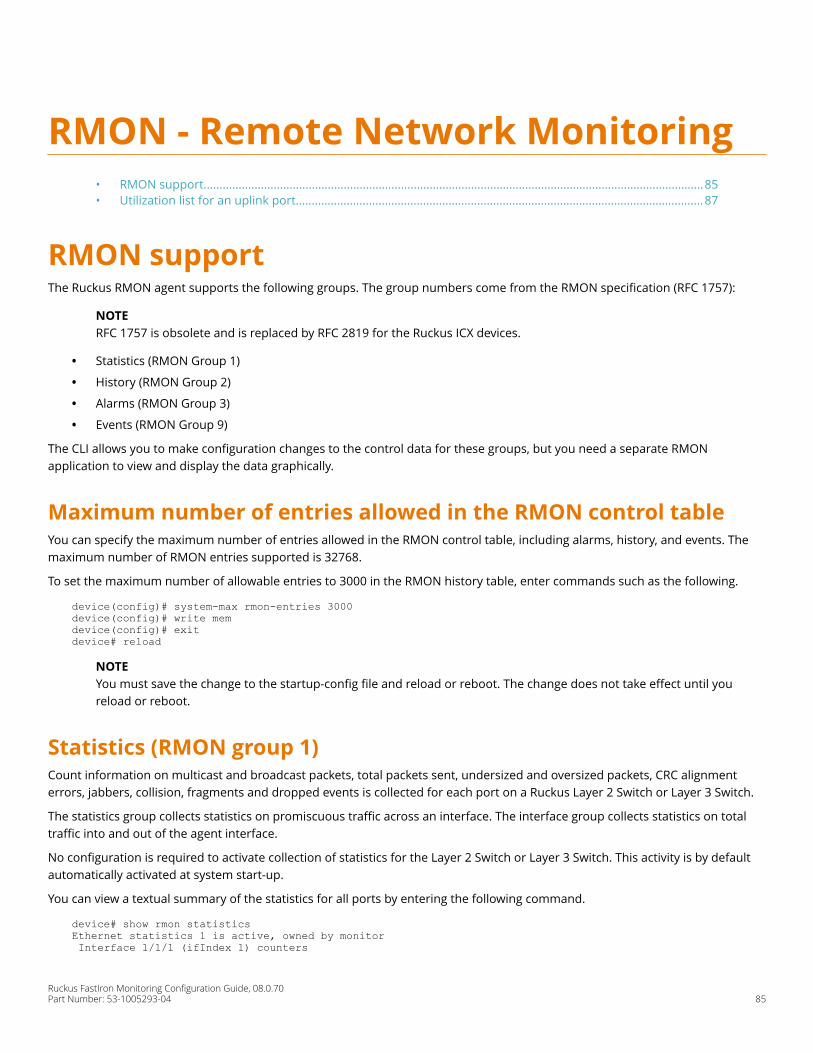
RMON - Remote Network Monitoring• RMON support.............................................................................................................................................................85• Utilization list for an uplink port................................................................................................................................87
RMON supportThe Ruckus RMON agent supports the following groups. The group numbers come from the RMON specification (RFC 1757):
NOTERFC 1757 is obsolete and is replaced by RFC 2819 for the Ruckus ICX devices.
• Statistics (RMON Group 1)
• History (RMON Group 2)
• Alarms (RMON Group 3)
• Events (RMON Group 9)
The CLI allows you to make configuration changes to the control data for these groups, but you need a separate RMONapplication to view and display the data graphically.
Maximum number of entries allowed in the RMON control tableYou can specify the maximum number of entries allowed in the RMON control table, including alarms, history, and events. Themaximum number of RMON entries supported is 32768.
To set the maximum number of allowable entries to 3000 in the RMON history table, enter commands such as the following.
device(config)# system-max rmon-entries 3000device(config)# write memdevice(config)# exitdevice# reload
NOTEYou must save the change to the startup-config file and reload or reboot. The change does not take effect until youreload or reboot.
Statistics (RMON group 1)Count information on multicast and broadcast packets, total packets sent, undersized and oversized packets, CRC alignmenterrors, jabbers, collision, fragments and dropped events is collected for each port on a Ruckus Layer 2 Switch or Layer 3 Switch.
The statistics group collects statistics on promiscuous traffic across an interface. The interface group collects statistics on totaltraffic into and out of the agent interface.
No configuration is required to activate collection of statistics for the Layer 2 Switch or Layer 3 Switch. This activity is by defaultautomatically activated at system start-up.
You can view a textual summary of the statistics for all ports by entering the following command.
device# show rmon statisticsEthernet statistics 1 is active, owned by monitor Interface 1/1/1 (ifIndex 1) counters
Ruckus FastIron Monitoring Configuration Guide, 08.0.70Part Number: 53-1005293-04 85

Octets 0 Drop events 0 Packets 0 Broadcast pkts 0 Multicast pkts 0 CRC alignment errors 0 Undersize pkts 0 Oversize pkts 0 Fragments 0 Jabbers 0 Collisions 0 64 octets pkts 0 65 to 127 octets pkts 0 128 to 255 octets pkts 0 256 to 511 octets pkts 0 512 to 1023 octets pkts 0 1024 to 1518 octets pkts 0
NOTEThough 48GC modules receive oversized packets and jabbers, they do not support count information for oversizedpackets and jabbers and the output of the show rmon statistics command reports 0 for both of these counters.The SNMP numbers of the ports start at 1 and increase sequentially. For example, if you are using a Chassis device andslot 1 contains an 8-port module, the SNMP number of the first port in slot 2 is 9. The physical port number of the sameport is 1/2/1.
History (RMON group 2)By default all active ports generate two history control data entries per active Layer 2 Switch port or Layer 3 Switch interface. Anactive port is defined as one with a link up. If the link goes down the two entries are automatically deleted.
Two history entries are generated for each device:
• A sampling of statistics every 30 seconds
• A sampling of statistics every 30 minutes
The history data can be accessed and displayed using any of the popular RMON applications
A sample RMON history command is shown below.
device(config)# rmon history 1 interface 1 buckets 10 interval 10 owner nyc02
You can modify the sampling interval and the bucket (number of entries saved before overwrite) using the CLI. In the aboveexample, owner refers to the RMON station that requests the information.
NOTETo review the control data entry for each port or interface, enter the show rmon history command.
Alarm (RMON group 3)Alarm is designed to monitor configured thresholds for any SNMP integer, time tick, gauge or counter MIB object. Using the CLI,you can define what MIB objects are monitored, the type of thresholds that are monitored (falling, rising or both), the value ofthose thresholds, and the sample type (absolute or delta).
An alarm event is reported each time that a threshold is exceeded. The alarm entry also indicates the action (event) to be taken ifthe threshold be exceeded.
A sample CLI alarm entry is shown below.
device(config)# rmon alarm 1 ifInOctets.6 10 delta rising-threshold 100 1 falling threshold 50 1 owner nyc02
Event (RMON group 9)There are two elements to the Event Group--the event control table and the event log table .
RMON - Remote Network MonitoringRMON support
Ruckus FastIron Monitoring Configuration Guide, 08.0.7086 Part Number: 53-1005293-04
The event control table defines the action to be taken when an alarm is reported. Defined events can be found by entering theCLI command, show event. The Event Log Table collects and stores reported events for retrieval by an RMON application.
A sample entry of the event control table is shown below.
device(config)# rmon event 1 description ‘testing a longer string’ trap public owner nyc02
NOTEFastIron devices currently support only the trap option.
Utilization list for an uplink portYou can configure uplink utilization lists that display the percentage of a given uplink port bandwidth that is used by a specific listof downlink ports. The percentages are based on 30-second intervals of RMON packet statistics for the ports. Both transmit andreceive traffic is counted in each percentage.
NOTEThis feature is intended for ISP or collocation environments in which downlink ports are dedicated to various customers’traffic and are isolated from one another. If traffic regularly passes between the downlink ports, the informationdisplayed by the utilization lists does not provide a clear depiction of traffic exchanged by the downlink ports and theuplink port.
Each uplink utilization list consists of the following:
• Utilization list number (1, 2, 3, or 4)
• One or more uplink ports
• One or more downlink ports
Each list displays the uplink port and the percentage of that port bandwidth that was utilized by the downlink ports over themost recent 30-second interval.
You can configure up to four bandwidth utilization lists.
Utilization list for an uplink port command syntaxTo configure an uplink utilization list, enter commands such as the following. The commands in this example configure a linkutilization list with port 1/1/1 as the uplink port and ports 1/1/2 and 1/1/3 as the downlink ports.
device(config)# relative-utilization 1 uplink ethernet 1/1/1 downlink ethernet 1/1/2 to 1/1/3 device(config)# write memory
Displaying utilization percentages for an uplinkAfter you configure an uplink utilization list, you can display the list to observe the percentage of the uplink bandwidth that eachof the downlink ports used during the most recent 30-second port statistics interval. The number of packets sent and receivedbetween the two ports is listed, as well as the ratio of each individual downlink port packets relative to the total number ofpackets on the uplink.
To display an uplink utilization list, enter a command such as the following from any mode of the CLI.
device# show relative-utilization 1 uplink: ethe 130-sec total uplink packet count = 3011
RMON - Remote Network MonitoringUtilization list for an uplink port
Ruckus FastIron Monitoring Configuration Guide, 08.0.70Part Number: 53-1005293-04 87

packet count ratio (%) 1/1/2:60 1/1/3:40
In this example, ports 1/1/2 and 1/1/3 are sending traffic to port 1/1/1. Port 1/1/2 and port 1/1/3 are isolated (not shared bymultiple clients) and typically do not exchange traffic with other ports except for the uplink port, 1/1/1.
NOTEThe example above represents a pure configuration in which traffic is exchanged only by ports 1/1/2 and 1/1/1, and byports 1/1/3 and 1/1/1. For this reason, the percentages for the two downlink ports equal 100%. In some cases, thepercentages do not always equal 100%. This is true in cases where the ports exchange some traffic with other ports inthe system or when the downlink ports are configured together in a port-based VLAN.
In the following example, ports 1/1/2 and 1/1/3 are in the same port-based VLAN.
device# show relative-utilization 1 uplink: ethe 130-sec total uplink packet count = 3011packet count ratio (%) 1/1/2:100 1/1/3:100
Here is another example showing different data for the same link utilization list. In this example, port 1/1/2 is connected to a huband is sending traffic to port 1/1/1. Port 1/1/3 is unconnected.
device# show relative-utilization 1 uplink: ethe 130-sec total uplink packet count = 2996packet count ratio (%) 1/1/2:100 1/1/3:---
RMON - Remote Network MonitoringUtilization list for an uplink port
Ruckus FastIron Monitoring Configuration Guide, 08.0.7088 Part Number: 53-1005293-04
sFlow• sFlow overview.............................................................................................................................................................89• Configuring and enabling sFlow................................................................................................................................ 93• Enabling sFlow forwarding......................................................................................................................................... 96• sFlow version 5 feature configuration...................................................................................................................... 97• Configuring sFlow with Multi-VRFs..........................................................................................................................100• Displaying sFlow information.................................................................................................................................. 101• Clearing sFlow statistics............................................................................................................................................102
sFlow overviewsFlow is a standards-based protocol that allows network traffic to be sampled at a user-defined rate for the purpose ofmonitoring traffic flow patterns and identifying packet transfer rates on user-specified interfaces.
Ruckus devices support sFlow version 5 by default. When sFlow is enabled on a Layer 2 or Layer 3 switch, the system performsthe following sFlow-related tasks:
• Samples traffic flows by copying packet header information
• Identifies ingress and egress interfaces for the sampled flows
• Combines sFlow samples into UDP packets and forwards them to the sFlow collectors for analysis
• Forwards byte and packet count data, or counter samples, to sFlow collectors
sFlow is described in RFC 3176, "InMon Corporation's sFlow: A Method for Monitoring Traffic in Switched and Routed Networks".
On FastIron devices, you can use QoS queue 1 for priority traffic, even when sFlow is enabled on the port.
sFlow version 5sFlow version 5 enhances and modifies the format of the data sent to the sFlow collector. sFlow version 5 introduces several newsFlow features and also defines a new datagram syntax used by the sFlow agent to report flow samples and interface counters tothe sFlow collector.
sFlow version 5 adds support for the following:
• sFlow version 5 datagrams
• Sub-agent support
• Configurable sFlow export packet size
• Support for the new data field and sample type length in flow samples
• Configurable interval for exporting Ruckus-specific data structure
sFlow version 5 is backward-compatible with sFlow version 2. By default, the sFlow agent exports sFlow version 5 flow samples bydefault, but you can configure the device to export the data in sFlow version 2 format. You can switch between sFlow version 2and sFlow version 5 formats. The sFlow collector automatically parses each incoming sample and decodes it based on theversion number.
The configuration procedures for sFlow version 5 are the same as for sFlow version 2, except where explicitly noted.Configuration procedures for sFlow are in the section Configuring and enabling sFlow on page 93. The features and CLIcommands that are specific to sFlow version 5 are described in the section sFlow version 5 feature configuration on page 97.
Ruckus FastIron Monitoring Configuration Guide, 08.0.70Part Number: 53-1005293-04 89
sFlow support for IPv6 packetsThe Ruckus implementation of sFlow features support IPv6 packets. This support includes extended router information andextended gateway information in the sampled packet. Note that sFlow support for IPv6 packets exists only on devices runningsoftware that supports IPv6.
The configuration procedures for this feature are the same as for IPv4, except where the collector is a link-local address on aLayer 3 switch. For details refer to Specifying the collector on page 93.
Extended router informationIPv6 sFlow sampled packets include the following extended router information:
• IP address of the next hop router
• Outgoing VLAN ID
• Source IP address prefix length
• Destination IP address prefix length
Note that in IPv6 devices, the prefix lengths of the source and destination IP addresses are collected if BGP is configured and theroute lookup is completed. In IPv4 devices, this information is collected only if BGP is configured on the devices.
Extended gateway informationIf BGP is enabled, extended gateway information is included in IPv6 sFlow sampled packets, including the following BGPinformation about a packet destination route:
• The Autonomous System number for the router
• The source IP Autonomous System of the route
• The source peer Autonomous System for the route
• The Autonomous System patch to the destination
NOTEAutonomous System communities and local preferences are not included in the sampled packets.
To obtain extended gateway information, use "struct extended_gateway" as described in RFC 3176.
IPv6 packet samplingIPv6 sampling is performed by the packet processor. The system uses the sampling rate setting to selectively mark themonitoring bit in the header of an incoming packet. Marked packets tell the CPU that the packets are subject to sFlow sampling.
sFlow configuration considerationsThis section lists the sFlow configuration considerations on Ruckus devices.
On ICX Series devices, you can use QoS queue 1 for priority traffic, even when sFlow is enabled on the port.
If ICX stacks are rebooted, sFlow is disabled on standby and member units until the configuration is synchronized between theActive and Standby Controllers.
sFlow is not supported on PE ports on 802.1br-enabled Ruckus devices.
sFlowsFlow overview
Ruckus FastIron Monitoring Configuration Guide, 08.0.7090 Part Number: 53-1005293-04

sFlow and hardware support• Ruckus devices support sFlow packet sampling of inbound traffic only. These devices do not sample outbound packets.
However, Ruckus devices support byte and packet count statistics for both traffic directions.
• sFlow is supported on all Ethernet ports (10/100, Gbps, and 10 Gbps)
sFlow and CPU utilizationEnabling sFlow may cause a slight and noticeable increase of up to 20% in CPU utilization. In typical scenarios, this is normalbehavior for sFlow, and does not affect the functionality of other features on the switch.
sFlow and agent addressThe sampled sFlow data sent to the collectors includes an agent_address field. This field identifies the IP address of the devicethat sent the data:
• On a Layer 2 switch, agent_address is the Layer 2 switch management IP address. You must configure the managementIP address in order to export sFlow data from the device. If the switch has both an IPv4 and IPv6 address, theagent_address is the IPv4 address. If the switch has an IPv6 address only, the agent_address is the global IPv6 address.
• On a Layer 3 switch with IPv6 interfaces only, sFlow looks for an IPv6 address in the following order, and uses the firstaddress found:
– The first IPv6 address on the lowest-numbered loopback interface– The first IPv6 address on the lowest-numbered VE interface– The first IPv6 address on any interface
• On a Layer 3 switch with both IPv4 and IPv6 interfaces, or with IPv4 interfaces only, sFlow looks for an IP address in thefollowing order, and uses the first address found:
– The IPv4 router ID configured by the ip router-id command– The first IPv4 address on the lowest-numbered loopback interface– The first IPv4 address on the lowest-numbered virtual interface– The first IPv4 address on any interface
NOTEThe device uses the router ID only if the device also has an IP interface with the same address. Router ID is notsupported on IPv6 devices.
NOTEIf an IP address is not already configured when you enable sFlow, the feature uses the source address 0.0.0.0. To displaythe agent_address, enable sFlow, then enter the show sflow command. Refer to Enabling sFlow forwarding on page 96and Displaying sFlow information on page 101.
NOTEIn sFlow version 5, you can set an arbitrary IPv4 or IPv6 address as the sFlow agent IP address. Refer to Specifying thesFlow agent IP address on page 98.
sFlowsFlow overview
Ruckus FastIron Monitoring Configuration Guide, 08.0.70Part Number: 53-1005293-04 91
sFlow and source IP addressWhen the sFlow packet is sent to the sFlow collector, by default, the IP address of the outgoing interface is used in the sFlowdatagram.
However, you can specify the source interface, from which the IP address is selected for the sFlow datagram, using the sflowsource command. The Ethernet, VE, or loopback interface can be configured as the source interface for both IPv4 and IPv6addresses.
sFlow source IP address configuration notes• The first IP address in the interface IP address list is considered the source IP address.
• If the sFlow destination is IPv6, and the sFlow source is configured for an IPv6 address, then an IPv6 address is selectedfrom the configured interface.
• If the sFlow destination is IPv4, and the sFlow source is configured for IPv4 address, then an IPv4 address is selectedfrom the configured interface.
• At any point of time, only one source of the Ethernet, VE, or loopback interface can be specified as the source interface.
• Upon configuring another source for an IPv4 or IPv6 address, any previously configured source for the IPv4 or IPv6address is deleted.
• If the source IP address is not configured, by default, the IP address of the outgoing interface is used in the sFlowdatagram.
• You can configure IPv4 and IPv6 source interfaces independently.
• LAG virtual interface or any member ports of the LAG cannot be configured as sFlow source.
• The sFlow source IP configuration is supported on sFlow version 2 and sFlow version 5 and is valid only for the routerbuild.
• Addition and deletion of IPv4 and IPv6 addresses on an sFlow source interface triggers the following events:
– If the added IP address is the first IP address in the table, then it is considered as the source IP address.– If the added IP address is positioned on top of the IP table (due to IP address sequence order), then it is reassigned
as the source IP address.– If the IP address that is used as the source IP is deleted, the next IP address on the same interface is considered as
the source IP address.– If all the IP addresses are deleted from the source interface, the IP address of the outgoing interface is used in the
sFlow datagram.
sFlow and source portBy default, sFlow sends data to the collector out of UDP source port 8888, but you can specify a different source port. For moreinformation, refer to Changing the sFlow source port on page 96.
sFlow and sampling rateThe sampling rate is the average ratio of the number of packets incoming on an sFlow enabled port, to the number of flowsamples taken from those packets. sFlow sampling can affect performance in some configurations.
Note that on the FastIron devices, the configured sampling rate and the actual rate are the same. The software does not adjustthe configured sampling rate as on other Ruckus devices.
sFlowsFlow overview
Ruckus FastIron Monitoring Configuration Guide, 08.0.7092 Part Number: 53-1005293-04
NOTEThe value range for sampling rate is from 256 through 1073741823 on Ruckus ICX 7750, ICX 7450, and ICX 7250 devices.The default value is 4096 for all devices.
sFlow and port monitoringICX series devices support sFlow and port monitoring together on the same port.
Configuring and enabling sFlowNOTEThe commands in this section apply to sFlow version 2 and sFlow version 5. CLI commands that are specific to sFlowversion 5 are documented in sFlow version 5 feature configuration on page 97.
To configure sFlow, perform the following tasks:
• Optional - If your device supports sFlow version 5, change the version used for exporting sFlow data
• Specify collector information. The collector is the external device to which you are exporting the sFlow data. You canspecify up to four collectors.
• Optional - Change the polling interval
• Optional - Change the sampling mode to include dropped packets
• Optional - Change the sampling rate
• Optional - Change the sFlow source IP address
• Optional - Change the sFlow source port
• Enable sFlow globally
• Enable sFlow forwarding on individual interfaces
• Enable sFlow forwarding on individual trunk ports
• If your device supports sFlow version 5, configure sFlow version 5 features
Specifying the collectorsFlow exports traffic statistics to an external collector. You can specify up to four collectors. You can specify more than onecollector with the same IP address if the UDP port numbers are unique. You can have up to four unique combinations of IPaddresses and UDP port numbers.
Specifying an sFlow collector on IPv4 devicesTo specify an sFlow collector on an IPv4 device, enter a command such as the following.
device(config)# sflow destination 10.10.10.1
This command specifies a collector with IPv4 address 10.10.10.1, listening for sFlow data on UDP port 6343.
sFlowConfiguring and enabling sFlow
Ruckus FastIron Monitoring Configuration Guide, 08.0.70Part Number: 53-1005293-04 93

Specifying an sFlow collector on IPv6 devicesTo specify an sFlow collector on an IPv6 device, enter a command such as the following.
device(config)# sflow destination ipv6 2001:DB8:0::0b:02a
This command specifies a collector with IPv6 address 2001:DB8::0b:02a, listening for sFlow data on UDP port 6343.
Changing the polling intervalThe polling interval defines how often sFlow byte and packet counter data for a port are sent to the sFlow collectors. If multipleports are enabled for sFlow, the Ruckus device staggers transmission of the counter data to smooth performance. For example, ifsFlow is enabled on two ports and the polling interval is 20 seconds, the Ruckus device sends counter data every ten seconds.The counter data for one of the ports are sent after ten seconds, and counter data for the other port are sent after an additionalten seconds. Ten seconds later, new counter data for the first port are sent. Similarly, if sFlow is enabled on five ports and thepolling interval is 20 seconds, the Ruckus device sends counter data every four seconds.
The default polling interval is 20 seconds. You can change the interval to a value from 0 to 4294967295 seconds. The intervalvalue applies to all interfaces on which sFlow is enabled. If you set the polling interval to 0, counter data sampling is disabled.
To change the polling interval, enter a command such as the following from the global configuration mode of the CLI.
device(config)# sflow polling-interval 30
Changing the sampling rateThe sampling rate is the average ratio of the number of packets incoming on an sFlow-enabled port, to the number of flowsamples taken from those packets.
You can change the default (global) sampling rate. You also can change the rate on an individual port, overriding the defaultsampling rate of 4096. With a sampling rate of 4096, on average, one in every 4096 packets forwarded on an interface issampled.
Configuration considerationsThe sampling rate is a fraction in the form 1/N, meaning that, on average, one out of every N packets is sampled. The sflowsample command from the global configuration mode or port mode specifies N, the denominator of the fraction. Thus a highernumber for the denominator means a lower sampling rate since fewer packets are sampled. Likewise, a lower number for thedenominator means a higher sampling rate because more packets are sampled. For example, if you change the denominatorfrom 512 to 128, the sampling rate increases because four times as many packets are sampled.
NOTERuckus recommends that you do not change the denominator to a value lower than the default. Sampling requires CPUresources. Using a low denominator for the sampling rate can cause high CPU utilization.
On Ruckus ICX 7750, ICX 7450, and ICX 7250, the CPU-bound sFlow sample packets are rate-limited to 50 samples per second toavoid high CPU utilization.
If the input traffic rate is more on the interface, the sampling rate must be configured to a higher value to keep the number ofsample packets within the CPU rate limit. Else, the excess sample packets are dropped by the CPU.
sFlowConfiguring and enabling sFlow
Ruckus FastIron Monitoring Configuration Guide, 08.0.7094 Part Number: 53-1005293-04

The following examples show the ideal sample rate configurations for various input rates that keep the sample packets withinthe CPU rate limit.
• If the input traffic rate is 200,000 packets/sec, the interface sample rate must be set to 4096. (200000/4096 = less than50 samples)
• If the input traffic rate is 400,000 packets/sec, the interface sample rate must be set to 8192. (400000/8192 = less than50 samples)
As the sample packets are generated within the CPU rate limit (50 samples/sec) in the above example, the packets are forwardedto the sFlow collector.
Configured rate and actual rate — When you enter a sampling rate value, this value is the configured rate as well as the actualsampling rate.
Change to global rate — If you change the global sampling rate, the change is applied to all sFlow-enabled ports except thoseports on which you have already explicitly set the sampling rate. For example, suppose that sFlow is enabled on ports 1/1/1,1/1/2, and 1/5/1. If you configure the sampling rate on port 1/1/1 but leave the other two ports using the default rate, then achange to the global sampling rate applies to ports 1/1/2 and 1/5/1 but not port 1/1/1. sFlow assumes that you want to continueusing the sampling rate you explicitly configured on an individual port even if you globally change the sampling rate for the otherports.
Module rate – While different ports on a module may be configured to have different sampling rates, the hardware for themodule is programmed to take samples at a single rate (the module sampling rate). The module sampling rate is the highestsampling rate (that is, the lowest number) configured for any of the ports on the module.
When ports on a given module are configured with different sampling rates, the CPU discards some of the samples supplied bythe hardware for ports with configured sampling rates that are lower than the module sampling rate. This is referred to assubsampling, and the ratio between the port sampling rate and the module sampling rate is known as the subsampling factor.For example, if the module in slot 4 has sFlow enabled on ports 1/4/2 and 1/4/8, and port 1/4/2 is using the default sampling rateof 512, and port 1/4/8 is configured explicitly for a rate of 2048, then the module sampling rate is 512 because this is this highestport sampling rate (lowest number). The subsampling factor for port 1/4/2 is 1, meaning that every sample taken by thehardware is exported, while the subsampling factor for port 1/4/8 is 4, meaning that one out of every four samples taken by thehardware is exported. Whether the port sampling rate is configured explicitly, or whether it uses the global default setting, hasno effect on the calculations.
You do not need to perform any of these calculations to change a sampling rate. You can display the rates you entered for thedefault sampling rate, module rates, and all sFlow-enabled ports by entering the show sflow command. Refer to DisplayingsFlow information on page 101.
Sampling rate for new ports — When you enable sFlow on a port, the port's sampling rate is set to the global default samplingrate. This also applies to ports on which you disable and then re-enable sFlow. The port does not retain the sampling rate it hadwhen you disabled sFlow on the port, even if you had explicitly set the sampling rate on the port.
Changing the default sampling rateTo change the default (global) sampling rate, enter a command such as the following at the global CONFIG level of the CLI.
device(config)# sflow sample 2048
Changing the sampling rate of a moduleYou cannot change a module sampling rate directly. You can change a module sampling rate only by changing the sampling rateof a port on that module.
sFlowConfiguring and enabling sFlow
Ruckus FastIron Monitoring Configuration Guide, 08.0.70Part Number: 53-1005293-04 95
Changing the sampling rate on a portYou can configure an individual port to use a different sampling rate than the global default sampling rate. This is useful in caseswhere ports have different bandwidths. For example, if you are using sFlow on 10/100 ports and Gbps Ethernet ports, you mightwant to configure the Gbps ports to use a higher sampling rate (and thus gather fewer samples per number of packets) than the10/100 ports.
To change the sampling rate on an individual port, enter a command such as the following from the configuration mode for theport.
device(config-if-1/1/1)# sflow sample 8192
Changing the sampling rate for a trunk portYou can configure an individual static trunk port to use a different sampling rate than the global default sampling rate. Thisfeature is also supported on LACP trunk ports. This feature is useful in cases where ports have different bandwidths. Forexample, if you are using sFlow on 10/100 ports and Gbps Ethernet ports, you might want to configure the Gbps ports to use ahigher sampling rate (and thus gather fewer samples per number of packets) than the 10/100 ports.
To configure a static trunk port to use a different sampling rate than the global default sampling rate, enter commands such asthe following:
device(config)# lag test dynamic id 1device(config-lag-blue)# ports ethernet 1/1/1 to 1/1/4device(config-lag-blue)# sflow sample 8192
Changing the sFlow source portBy default, sFlow sends data to the collector using UDP source port 8888, but you can change the source UDP port to any portnumber in the range 1025-65535.
To change the source UDP port, enter a command such as the following:
device(config)# sflow source-port 8000
Enabling sFlow forwardingsFlow exports data only for the interfaces on which you enable sFlow forwarding. You can enable sFlow forwarding on Ethernetinterfaces.
NOTEWhen management port is used, sFlow can be received only from active units in a stack (not from all units). However, ifyou use management VLAN with data port, sFlow is received normally. To receive sFlow from all units in a stack, youmust use a data port.
To enable sFlow forwarding, perform the following:
• Globally enable the sFlow feature
• Enable sFlow forwarding on individual interfaces
• Enable sFlow forwarding on individual trunk ports
NOTEBefore you enable sFlow, make sure the device has an IP address that sFlow can use as its source address. Refer to sFlow and agent address on page 91 for the source address requirements.
sFlowEnabling sFlow forwarding
Ruckus FastIron Monitoring Configuration Guide, 08.0.7096 Part Number: 53-1005293-04
NOTEWhen you enable sFlow forwarding on an 802.1X-enabled interface, the samples taken from the interface include theusername used to obtain access to either or both the inbound and outbound ports, if that information is available. Forinformation about 802.1X, refer to "Flexible Authentication" chapter in the Ruckus FastIron Security Configuration Guide
Commands for enabling sFlow forwardingThis section shows how to enable sFlow forwarding.
Globally enabling sFlow forwardingTo enable sFlow forwarding, you must first enable it on a global basis, then on individual interfaces or trunk ports, or both.
To globally enable sFlow forwarding, enter the following command.
device(config)# sflow enable
You can now enable sFlow forwarding on individual ports as described in the next two sections.
Enabling sFlow forwarding on individual interfacesTo enable sFlow forwarding enter commands such as the following.
device(config)# sflow enabledevice(config)# interface ethernet 1/1/1 to 1/1/8device(config-mif-1/1/1-1/1/8)# sflow forwarding
These commands globally enable sFlow, then enable sFlow forwarding on Ethernet ports 1/1/1 - 1/1/8. You must use both thesflow enable and sflow forwarding commands to enable the feature.
Enabling sFlow forwarding on LAG portsThis feature is supported on ports of a static LAG group. It is also supported on LACP LAG ports.
To enable sFlow forwarding on a LAG port, enter commands such as the following.
device(config)# sflow enabledevice(config)# lag test static id 111device(config-lag-test)# ports ethernet 1/4/1 to 1/4/8device(config-lag-test)# sflow forwarding
These commands globally enable sFlow, then enable sFlow forwarding on LAG ports. You must use both the sflow enable andsflow forwarding commands to enable the feature.
sFlow version 5 feature configurationNOTEThe commands in this section are supported when sFlow version 5 is enabled on the device. These commands are notsupported with sFlow version 2. sFlow version 5 also supports all of the sFlow configuration commands in Configuringand enabling sFlow on page 93.
When sFlow version 5 is enabled on the device, you can do the following:
• Specify the sFlow version (version 2 or version 5)
sFlowsFlow version 5 feature configuration
Ruckus FastIron Monitoring Configuration Guide, 08.0.70Part Number: 53-1005293-04 97
• Specify the sFlow agent IP address
• Specify the maximum flow sample size
• Export CPU and memory usage Information to the sFlow collector
• Specify the polling interval for exporting CPU and memory usage information to the sFlow collector
• Export CPU-directed data (management traffic) to the sFlow collector
Egress interface ID for sampled broadcast and multicast packetsFor broadcast and multicast traffic, the egress interface ID for sampled traffic is always 0x80000000. When broadcast andmulticast packets are sampled, they are usually forwarded to more than one port. However, the output port field in an sFlowdatagram supports the display of one egress interface ID only. Therefore, the sFlow version 5 agent always sets the output portID to 0x80000000 for broadcast and multicast packets that are sampled.
Specifying the sFlow version formatIf your device supports sFlow version 5, you can optionally specify the version used for exporting sFlow data. Refer Specifying thesFlow agent IP address on page 98.
Specifying the sFlow agent IP addressThe sampled sFlow data sent to the collectors includes an agent_address field. This field identifies the device (the sFlow agent)that sent the data. By default, the device automatically selects the sFlow agent IP address based on the configuration, asdescribed in the section sFlow and agent address on page 91. Alternatively, you can configure the device to instead use anarbitrary IPv4 or IPv6 address as the sFlow agent IP address.
To specify an IPv4 address as the sFlow agent IP address, enter a command such as the following
device(config)# sflow agent-ip 10.10.10.1
To specify an IPv6 address as the sFlow agent IP address, enter a command such as the following.
device(config)# sflow agent-ip FE80::240:D0FF:FE48:4672
Specifying the version used for exporting sFlow dataBy default, when sFlow is enabled globally on the Ruckus device, the sFlow agent exports sFlow data in version 5 format. You canchange this setting so that the sFlow agent exports data in version 2 format. You can switch between versions without rebootingthe device or disabling sFlow.
NOTEWhen the sFlow version number is changed, the system resets the sFlow counters and flow sample sequence numbers.
To specify the sFlow version used for exporting sFlow data, enter the following command.
device(config)# sflow version 2
The default is 5.
sFlowsFlow version 5 feature configuration
Ruckus FastIron Monitoring Configuration Guide, 08.0.7098 Part Number: 53-1005293-04

Specifying the maximum flow sample sizeWith sFlow version 5, you can specify the maximum size of the flow sample sent to the sFlow collector. If a packet is larger thanthe specified maximum size, only the data of the packet up to the specified maximum number of bytes is exported. If the size ofthe packet is smaller than the specified maximum, then the entire packet is exported.
For example, to specify 1024 bytes as the maximum flow sample size, enter the following command.
device(config)# sflow max-packet-size 1024
The following sample list provides information about the sFlow sample size sent to the sFlow collector, when the max-packet-sizeis configured with different values.
TABLE 9 sFlow sample size sent to the sFlow collector with varying max-packet-size valuesMaximum packet size Size of the sFlow sample sent to the sFlow collector
0 bytes Only the information about the packet is captured and no data from the packet is sent to the sFlow collector.
1 byte 1 byte from the packet is sent to the sFlow collector. However, it is padded with zero to make it 4 bytes.
2 bytes 2 bytes from the packet is sent to the sFlow collector. However, it is padded with zero to make it 4 bytes.
100 bytes 100 bytes from packet is sent to the sFlow collector.
200 bytes 200 bytes from packet is sent to the sFlow collector.
1200 bytes 1200 bytes from the packet is sent to the sFlow collector.
Exporting CPU and memory usage information to the sFlowcollectorWith sFlow version 5, you can optionally configure the sFlow agent on the Ruckus device to export information about CPU andmemory usage to the sFlow collector.
To export CPU usage and memory usage information, enter the following command.
device(config)# sflow export system-info
By default, CPU usage information and memory usage information are not exported.
Specifying the polling interval for exporting CPU and memory usageinformation to the sFlow collectorThe polling interval defines how often sFlow data for a port is sent to the sFlow collector. With sFlow version 5, you can optionallyset the polling interval used for exporting CPU and memory usage information.
For example, to set the polling interval for exporting CPU and memory usage information to 30 seconds, enter the followingcommand.
device(config)# sflow export system-info 30
You can specify a polling interval from 5 seconds to 1,800 seconds (30 minutes). The default polling interval for exporting CPUand memory usage information is 300 seconds (5 minutes).
sFlowsFlow version 5 feature configuration
Ruckus FastIron Monitoring Configuration Guide, 08.0.70Part Number: 53-1005293-04 99
Exporting CPU-directed data (management traffic) to the sFlowcollectorYou can select which and how often data destined to the CPU (for example, Telnet sessions) is sent to the sFlow collector.
CLI commands allow you to do the following:
• Enable the sFlow agent to export CPU-directed data
• Specify the sampling rate for exported CPU-directed data
Enabling the sFlow agent to export CPU-directed dataTo enable the sFlow agent on a Ruckus device to export data destined to the CPU to the sFlow collector, enter the followingcommand.
device(config)# sflow export cpu-traffic
By default, this feature is disabled. The sFlow agent does not send data destined to the CPU to the sFlow collector.
Specifying the sampling rate for exported CPU-directed dataThe sampling rate is the average ratio of the number of packets incoming on an sFlow-enabled port, to the number of flowsamples taken from those packets. You can optionally set the sampling rate for CPU-directed data exported to the sFlowcollector. For example, to set this sampling rate to 2048, enter the following command.
device(config)# sflow export cpu-traffic 2048
The default sampling rate depends on the Ruckus device being configured. Refer to Changing the sampling rate on page 94 forthe default sampling rate for each kind of Ruckus device.
Configuring sFlow with Multi-VRFssFlow is a traffic monitoring protocol that supports VRFs. sFlow provides traffic sampling on configured ports based on samplerate and port information to a collector. By default, sFlow uses the management VRF to send the samples to the collector.
Collectors can be added and per VRF so that collectors can be spread out across different VRFs. The sFlow forwarding port canbelong to a non-default VRF, and captured sFlow packets will have correct sample routing next hop information.
sFlow forwarding ports can come from ports belonging to any VRF. The port does not have to be in the same VRF as the collector.sFlow collects packets from all sFlow forwarding ports, even if they do not belong to a VRF, compiles the packets into the sFlowsamples, and sends the samples to the particular collector with no filtering for VRF membership. For counter samples, samplestatistics from each port are sent to each collector specified, even if the port and collector do not belong to a VRF instance.
To distinguish collected packets from different VRFs, refer to the in vlan and out vlan data fields for each captured ingresspacket. For example, when two collected packets are from different VRFs but have the same source/destination IP and the sameincoming/outgoing port, the VLAN field differs in the two samples. A VLAN/VE can only belong to one VRF. The collector does nothave any VRF knowledge, but, based on the VLAN fields, the collector can distinguish which packet came from which VLAN/VRF.
To configure an sFlow collector and specify a VRF, enter the following command.
device(config)# sflow destination 10.10.10.vrf customer1
To disable the management VRF in sFlow, enter the following command.
device(config)# sflow management-vrf disable
sFlowConfiguring sFlow with Multi-VRFs
Ruckus FastIron Monitoring Configuration Guide, 08.0.70100 Part Number: 53-1005293-04
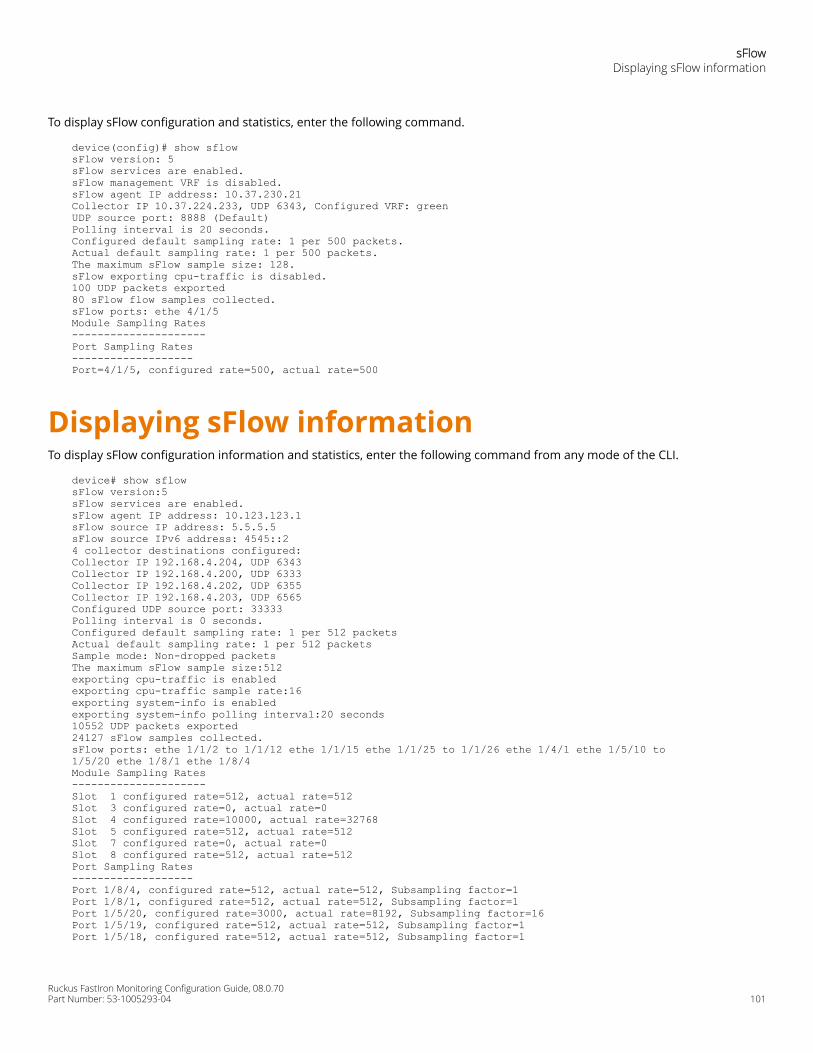
To display sFlow configuration and statistics, enter the following command.
device(config)# show sflow sFlow version: 5 sFlow services are enabled.sFlow management VRF is disabled. sFlow agent IP address: 10.37.230.21 Collector IP 10.37.224.233, UDP 6343, Configured VRF: green UDP source port: 8888 (Default) Polling interval is 20 seconds. Configured default sampling rate: 1 per 500 packets. Actual default sampling rate: 1 per 500 packets. The maximum sFlow sample size: 128. sFlow exporting cpu-traffic is disabled. 100 UDP packets exported 80 sFlow flow samples collected. sFlow ports: ethe 4/1/5Module Sampling Rates --------------------- Port Sampling Rates ------------------- Port=4/1/5, configured rate=500, actual rate=500
Displaying sFlow informationTo display sFlow configuration information and statistics, enter the following command from any mode of the CLI.
device# show sflowsFlow version:5sFlow services are enabled.sFlow agent IP address: 10.123.123.1sFlow source IP address: 5.5.5.5sFlow source IPv6 address: 4545::24 collector destinations configured:Collector IP 192.168.4.204, UDP 6343Collector IP 192.168.4.200, UDP 6333Collector IP 192.168.4.202, UDP 6355Collector IP 192.168.4.203, UDP 6565Configured UDP source port: 33333Polling interval is 0 seconds.Configured default sampling rate: 1 per 512 packetsActual default sampling rate: 1 per 512 packetsSample mode: Non-dropped packetsThe maximum sFlow sample size:512exporting cpu-traffic is enabledexporting cpu-traffic sample rate:16exporting system-info is enabledexporting system-info polling interval:20 seconds10552 UDP packets exported24127 sFlow samples collected.sFlow ports: ethe 1/1/2 to 1/1/12 ethe 1/1/15 ethe 1/1/25 to 1/1/26 ethe 1/4/1 ethe 1/5/10 to1/5/20 ethe 1/8/1 ethe 1/8/4Module Sampling Rates---------------------Slot 1 configured rate=512, actual rate=512Slot 3 configured rate=0, actual rate=0Slot 4 configured rate=10000, actual rate=32768Slot 5 configured rate=512, actual rate=512Slot 7 configured rate=0, actual rate=0Slot 8 configured rate=512, actual rate=512Port Sampling Rates-------------------Port 1/8/4, configured rate=512, actual rate=512, Subsampling factor=1Port 1/8/1, configured rate=512, actual rate=512, Subsampling factor=1Port 1/5/20, configured rate=3000, actual rate=8192, Subsampling factor=16Port 1/5/19, configured rate=512, actual rate=512, Subsampling factor=1Port 1/5/18, configured rate=512, actual rate=512, Subsampling factor=1
sFlowDisplaying sFlow information
Ruckus FastIron Monitoring Configuration Guide, 08.0.70Part Number: 53-1005293-04 101

Port 1/5/17, configured rate=1500, actual rate=2048, Subsampling factor=4...Output truncated...
Clearing sFlow statisticsTo clear the UDP packet and sFlow sample counters in the show sflow display, enter the following command.
device# clear statistics
NOTEThis command also clears the statistics counters used by other features.
sFlowClearing sFlow statistics
Ruckus FastIron Monitoring Configuration Guide, 08.0.70102 Part Number: 53-1005293-04

System Monitoring• Overview of system monitoring.............................................................................................................................. 103• Configure system monitoring.................................................................................................................................. 104• System monitoring on ICX devices..........................................................................................................................106• System monitoring for Packet Processors............................................................................................................. 107
Overview of system monitoringSystem monitoring (sysmon) is a utility that runs as a background process and monitors connections and components of thedevice for specific errors and logs them. It has a default policy that controls the parameters that are monitored and actions to betaken if a fault is detected. These policies include the type of errors, the threshold for errors to be logged, and the frequency ofchecking for errors. You can use the CLI commands to configure these policies.
The sysmon utility monitors the hardware error registers to identify errors and failures. You can configure the sysmon timer todefine how frequently the sysmon utility queries the hardware error registers. The data generated by the sysmon utility is writtento either the sysmon internal log or to the syslog.
Sysmon starts the timer based on the specified timer setting, with the default value as three minutes. After the interval specifiedby the timer, the utility checks the hardware error registers. If the sysmon utility detects an error in a hardware error register, itincrements the relevant error count by 1. Otherwise, it restarts the timer and waits for the given interval. Hardware errorregisters are cleared when read, so after Sysmon reads the value, they are reset to zero.
Sysmon checks the value of the error counters it maintains and the values specified in the sysmon threshold. If the value of theerror counters exceeds the matching threshold, it takes the action specified (logs internally or to the syslog). Otherwise, itrestarts the timer and waits for the specified interval before checking for errors again.
To ensure that logging repeating errors does not cause the logs to overflow, you can specify a back-off value that allows the utilityto skip the specified number of error instances before logging again. If the error count is smaller than the specified log back-offvalue, the utility logs the error to the internal log or syslog, restarts the timer and waits for the specified interval before checkingfor errors again.
Configuration notes and feature limitationsOn ICX devices, the sysmon utility monitors the following errors:
• Link errors.
• ECC errors.
By default, system monitoring starts on system boot up and runs in the background every three minutes. You can configure,disable, or enable, the time interval through the CLI. If you define the system monitoring interval at the global configurationmode, this value overrides the individual settings.
You can define a system monitoring threshold that is defined as N/W, where N is the number of error events in a specifiedwindow (W) of consecutive polling periods. When the threshold is reached, the action that is defined is performed. The thresholdenables the sysmon utility to ignore random errors that occur because of corrupted data coming in to the device, and performthe action only for errors generated because of device failure. A threshold of 1/W means no threshold.
Ruckus FastIron Monitoring Configuration Guide, 08.0.70Part Number: 53-1005293-04 103

You can choose the log action as either to the internal sysmon buffer or to the syslog. If you choose the internal sysmon buffer,logs that are written beyond the limit of the sysmon buffer rolls over. If you choose logging to syslog, messages are sent to theconfigured syslog servers.
Configure system monitoringYou can use the following commands from the privileged exec mode to globally configure the sysmon utility:
• disable system-monitoring all
• enable system-monitoring all
• sysmon timer
In addition, you can enable or disable system monitoring for each event type from the CLI, with each event type having separatethreshold and log back off values using the following commands:
• sysmon log-backoff
• sysmon threshold
disable system-monitoring allDisables system monitoring at the global level for all monitoring types.
disable system-monitoring all
Privileged exec mode.
Disabling sysmon at the global level disables any individually configured and enabled sysmon tasks as well. However, anysysmon configuration that is made, including global and event-specific configuration are retained.
The following example disables system monitoring:
device# disable system-monitoring all
enable system-monitoring allEnables system monitoring at the global level for all event types.
enable system-monitoring all
Privileged exec mode.
This command enables system monitoring globally, and covers all event-specific system monitoring configuration as well. Ifspecific configuration is not made for different types, default values defined at the global level are used.
The following example enables all system monitoring tasks at the global level:
device# enable system-monitoring all
sysmon timerConfigures the global system monitoring timer.
sysmon timer minutes
minutes Specifies the system monitoring timer in minutes. The range of values is 1 through 60. The default value is 3.
System MonitoringConfigure system monitoring
Ruckus FastIron Monitoring Configuration Guide, 08.0.70104 Part Number: 53-1005293-04
Global configuration mode.
The following example sets the system monitoring timer to five minutes:
device(config)# sysmon timer 5
sysmon log-backoffDefines the number of times to skip logging an event before logging again at the global level. The no form of this commandresets the parameter to default value.
sysmon log-backoff number
no sysmon log-backoff
number Specifies the number of times to skip an event logging before logging again.
Global configuration mode.
Logging every error may not provide any new information, but adds significantly to the number of error entries that need to beanalyzed. You can configure the system monitoring utility to ignore a certain number of errors (within a stream of consecutiveerrors) before writing the entry to the log again.
This option helps you further isolate issues that randomly occur from issues because of device failure. The sysmon utility keeps acounter of the number of times the threshold value is exceed. If the number exceeds the back-off value, the error is logged asspecified by the action option.
The following example sets the number of times to skip logging to 20.
device(config)# sysmon log-backoff 20
sysmon thresholdDefines the threshold for errors at the global level. The no form of this command resets the threshold configuration to defaultvalues.
sysmon threshold events polling-interval
no sysmon threshold
events Specifies the threshold in terms of the number of events. Valid values are 1 through 10. When expressed inthe command, the default value is 2.
polling-interval Specifies the number of polling windows. The device polls the internal registers at the interval specified by thesysmon timer value. Valid values 1-32. However, the polling window number must be equal or greater thanthe number of events. When expressed in the command, the default value is 10.
Global configuration mode.
The type-specific threshold values that you define overrides the global threshold value for each event. However, if you define theglobal value later, the latest value prevails. The threshold is defined as N/W, where N is the number of events, and W is thenumber of consecutive polling periods. When the threshold is reached, actions configured for this event type will take place.Note that a threshold of 1/W implies that there is no threshold, and the action will always be triggered.
The following example sets the threshold to 3 events over 7 consecutive polling periods:
device(config)# sysmon threshold 3 7
System MonitoringConfigure system monitoring
Ruckus FastIron Monitoring Configuration Guide, 08.0.70Part Number: 53-1005293-04 105
System monitoring on ICX devicesOn ICX devices the system monitors for error correction code (ECC) and link errors.
ECC and link errors are monitored on a stack unit basis.
Use the following commands configure and display the status of system monitoring on fabric adaptors:
• sysmon ecc-error
• sysmon link-error
sysmon ecc-errorConfigures how sysmon handles ECC errors. The no version of this command disables system monitoring on internal ECC errors.
sysmon ecc-error -count { threshold events polling-interval | log-backoff value | action { none | syslog } }
no sysmon fa error-count
threshold Defines the threshold for errors. The threshold is defined as N/W, where N is the number of events, and W isthe number of consecutive polling periods. When the threshold is reached, actions configured for this eventtype take place.
NOTEA threshold of 1/W implies that there is no threshold, and the action is always triggered.
events Specifies the threshold in terms of the number of events. Valid values are 1 through 10.polling-interval Specifies the number of polling windows. The device polls the internal registers at the
interval specified by the sysmon timer value. Valid values 1-32. However, the polling windownumber must be equal or greater than the number of events.
log-backoff If an error condition persists, it is continuously logged (internally and/or externally to syslog as defined by theaction). The log back-off count skips configured number of logs before logging again.
action Specifies the action to take when error count exceeds the specified threshold and log back-off values.
none The error is logged in the internal sysmon logs. This is the default value.syslog The error is logged to Syslog.
Global configuration mode.
The following example configures system monitoring for fabric adaptor errors:
device(config)# sysmon ecc-error threshold 3 7 device(config)# sysmon ecc-error action syslog device(config)# sysmon ecc-error log-backoff 15
sysmon link-errorConfigures how sysmon handles link errors. The no version of this command disables system monitoring on link errors.
sysmon link-error { threshold events polling-interval | log-backoff value | action { none | syslog } }
no sysmon link-error
threshold Defines the threshold for errors. The threshold is defined as N/W, where N is the number of events, and W isthe number of consecutive polling periods. When the threshold is reached, actions configured for this eventtype take place.
System MonitoringSystem monitoring on ICX devices
Ruckus FastIron Monitoring Configuration Guide, 08.0.70106 Part Number: 53-1005293-04

NOTEA threshold of 1/W implies that there is no threshold, and the action is always triggered.
events Specifies the threshold in terms of the number of events. Valid values are 1 through 10.polling-interval Specifies the number of polling windows. The device polls the internal registers at the
interval specified by the sysmon timer value. Valid values 1-32. However, the polling windownumber must be equal or greater than the number of events.
log-backoff If an error condition persists, it is continuously logged (internally and/or externally to syslog as defined by theaction). The log back-off count skips configured number of logs before logging again.
action Specifies the action to take when the error count exceeds the specified threshold and log back-off values.
none The error is logged in the internal sysmon logs. This is the default value.syslog The error is logged to syslog.
Global configuration mode.
The following example configures system monitoring for fabric adaptor errors:
device(config)# sysmon link-error threshold 3 7 device(config)# sysmon link-error action syslog device(config)# sysmon link-error log-backoff 15
System monitoring for Packet ProcessorsOn ICX devices, errors typically detected in packet processors include:
• Parity errors
• Error Checking Code (ECC) errors
• ConfigTable0 errors
• TCAM error
• TCAM action parity errors
• Token bucket priority parity errors
• State variable parity errors
• Link list RAM ECC errors
• FBUF RAM ECC errors
• Egress VLAN parity errors
• Ingress VLAN parity errors
• Layer 2 port isolation parity errors
• Layer 3 port isolation parity errors
• VIDX parity errors
Use the following commands to configure and display the statistics of cross bar or switch fabric module:
• show sysmon logs
• show sysmon counters
• show sysmon config
System MonitoringSystem monitoring for Packet Processors
Ruckus FastIron Monitoring Configuration Guide, 08.0.70Part Number: 53-1005293-04 107
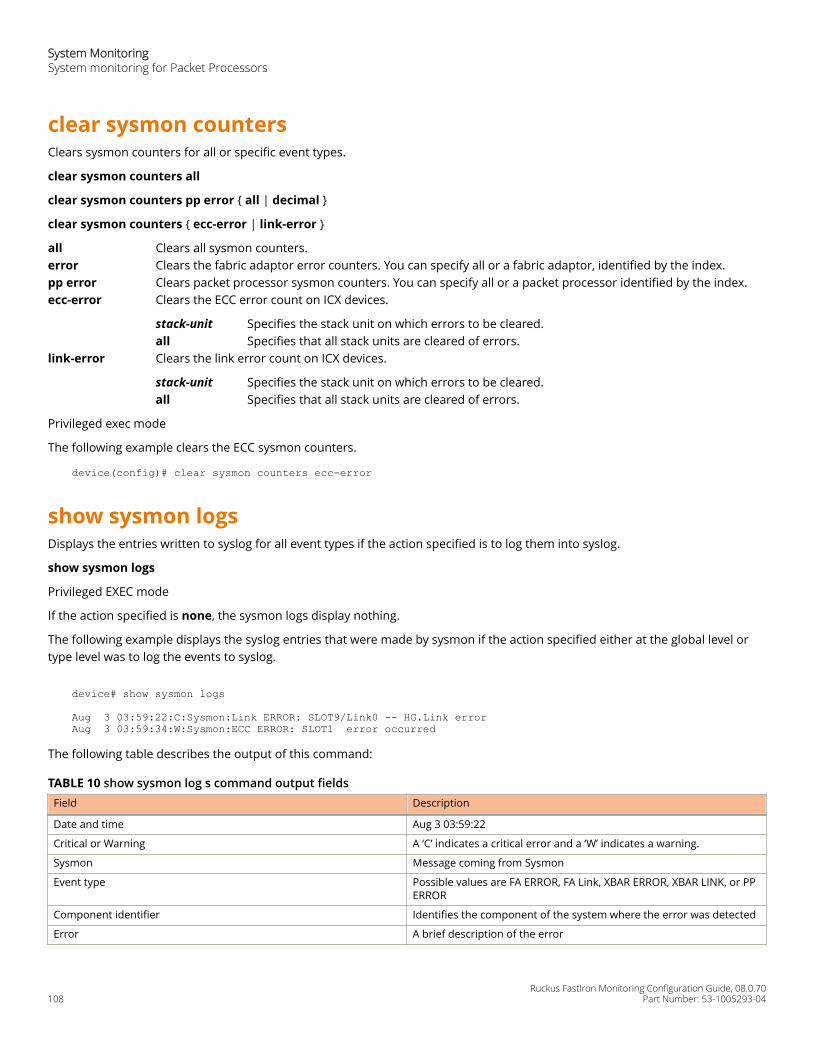
clear sysmon countersClears sysmon counters for all or specific event types.
clear sysmon counters all
clear sysmon counters pp error { all | decimal }
clear sysmon counters { ecc-error | link-error }
all Clears all sysmon counters.error Clears the fabric adaptor error counters. You can specify all or a fabric adaptor, identified by the index.pp error Clears packet processor sysmon counters. You can specify all or a packet processor identified by the index.ecc-error Clears the ECC error count on ICX devices.
stack-unit Specifies the stack unit on which errors to be cleared.all Specifies that all stack units are cleared of errors.
link-error Clears the link error count on ICX devices.
stack-unit Specifies the stack unit on which errors to be cleared.all Specifies that all stack units are cleared of errors.
Privileged exec mode
The following example clears the ECC sysmon counters.
device(config)# clear sysmon counters ecc-error
show sysmon logsDisplays the entries written to syslog for all event types if the action specified is to log them into syslog.
show sysmon logs
Privileged EXEC mode
If the action specified is none, the sysmon logs display nothing.
The following example displays the syslog entries that were made by sysmon if the action specified either at the global level ortype level was to log the events to syslog.
device# show sysmon logs
Aug 3 03:59:22:C:Sysmon:Link ERROR: SLOT9/Link0 -- HG.Link errorAug 3 03:59:34:W:Sysmon:ECC ERROR: SLOT1 error occurred
The following table describes the output of this command:
TABLE 10 show sysmon log s command output fieldsField Description
Date and time Aug 3 03:59:22
Critical or Warning A ‘C’ indicates a critical error and a ‘W’ indicates a warning.
Sysmon Message coming from Sysmon
Event type Possible values are FA ERROR, FA Link, XBAR ERROR, XBAR LINK, or PPERROR
Component identifier Identifies the component of the system where the error was detected
Error A brief description of the error
System MonitoringSystem monitoring for Packet Processors
Ruckus FastIron Monitoring Configuration Guide, 08.0.70108 Part Number: 53-1005293-04

show sysmon countersDisplays sysmon counters for all or specific event types.
show sysmon counters type { error | link }
show sysmon counters { ecc-error | link-error }
type The event type for which sysmon counters are displayed. For ICX devices, the options are ecc-error and link-error. The default value is all.
error Displays the error counter for the specified event type.link Displays the link error counters. You can specify either all or specific links.
ecc-error Displays the ECC error count on ICX devices.
stack-unit Specifies the stack unit on which errors to be displayed.all Displays errors for all stack units.
link-error Displays the link error count on ICX devices.
stack-unit Specifies the stack unit on which errors to be displayed.all Displays errors for all stack units.
Privileged exec mode
System MonitoringSystem monitoring for Packet Processors
Ruckus FastIron Monitoring Configuration Guide, 08.0.70Part Number: 53-1005293-04 109
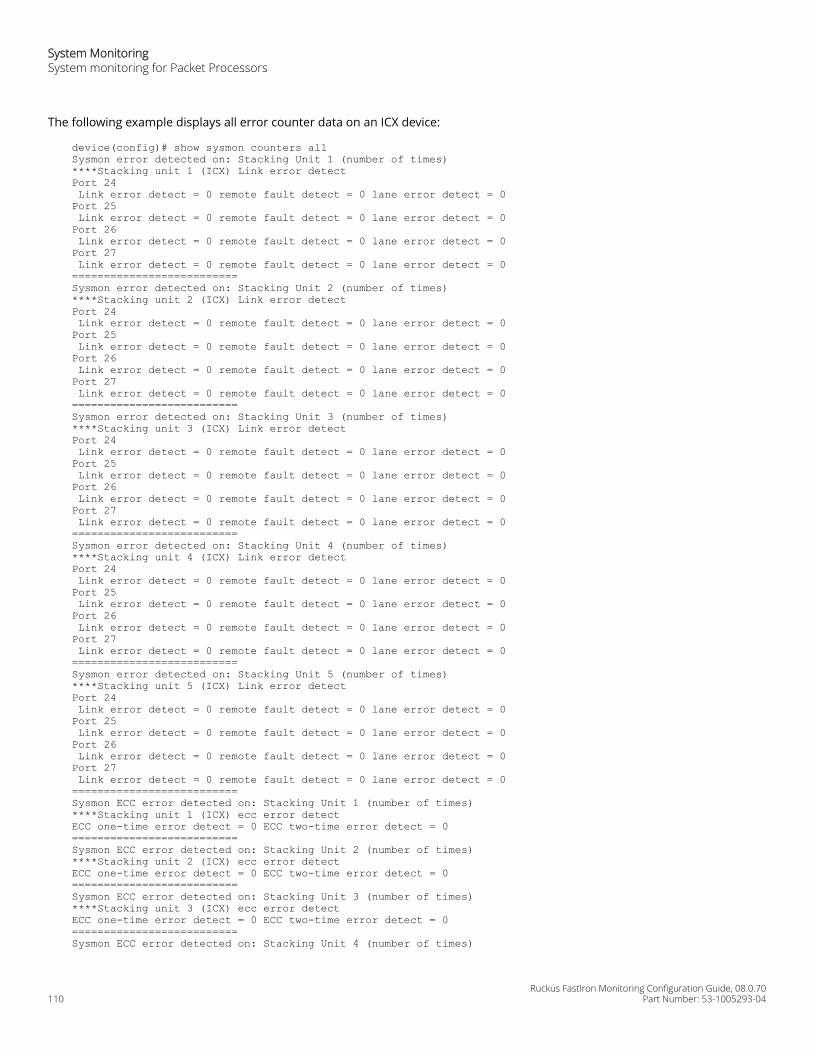
The following example displays all error counter data on an ICX device:
device(config)# show sysmon counters allSysmon error detected on: Stacking Unit 1 (number of times)****Stacking unit 1 (ICX) Link error detectPort 24 Link error detect = 0 remote fault detect = 0 lane error detect = 0Port 25 Link error detect = 0 remote fault detect = 0 lane error detect = 0Port 26 Link error detect = 0 remote fault detect = 0 lane error detect = 0Port 27 Link error detect = 0 remote fault detect = 0 lane error detect = 0==========================Sysmon error detected on: Stacking Unit 2 (number of times)****Stacking unit 2 (ICX) Link error detectPort 24 Link error detect = 0 remote fault detect = 0 lane error detect = 0Port 25 Link error detect = 0 remote fault detect = 0 lane error detect = 0Port 26 Link error detect = 0 remote fault detect = 0 lane error detect = 0Port 27 Link error detect = 0 remote fault detect = 0 lane error detect = 0==========================Sysmon error detected on: Stacking Unit 3 (number of times)****Stacking unit 3 (ICX) Link error detectPort 24 Link error detect = 0 remote fault detect = 0 lane error detect = 0Port 25 Link error detect = 0 remote fault detect = 0 lane error detect = 0Port 26 Link error detect = 0 remote fault detect = 0 lane error detect = 0Port 27 Link error detect = 0 remote fault detect = 0 lane error detect = 0==========================Sysmon error detected on: Stacking Unit 4 (number of times)****Stacking unit 4 (ICX) Link error detectPort 24 Link error detect = 0 remote fault detect = 0 lane error detect = 0Port 25 Link error detect = 0 remote fault detect = 0 lane error detect = 0Port 26 Link error detect = 0 remote fault detect = 0 lane error detect = 0Port 27 Link error detect = 0 remote fault detect = 0 lane error detect = 0==========================Sysmon error detected on: Stacking Unit 5 (number of times)****Stacking unit 5 (ICX) Link error detectPort 24 Link error detect = 0 remote fault detect = 0 lane error detect = 0Port 25 Link error detect = 0 remote fault detect = 0 lane error detect = 0Port 26 Link error detect = 0 remote fault detect = 0 lane error detect = 0Port 27 Link error detect = 0 remote fault detect = 0 lane error detect = 0==========================Sysmon ECC error detected on: Stacking Unit 1 (number of times)****Stacking unit 1 (ICX) ecc error detectECC one-time error detect = 0 ECC two-time error detect = 0==========================Sysmon ECC error detected on: Stacking Unit 2 (number of times)****Stacking unit 2 (ICX) ecc error detectECC one-time error detect = 0 ECC two-time error detect = 0==========================Sysmon ECC error detected on: Stacking Unit 3 (number of times)****Stacking unit 3 (ICX) ecc error detectECC one-time error detect = 0 ECC two-time error detect = 0==========================Sysmon ECC error detected on: Stacking Unit 4 (number of times)
System MonitoringSystem monitoring for Packet Processors
Ruckus FastIron Monitoring Configuration Guide, 08.0.70110 Part Number: 53-1005293-04
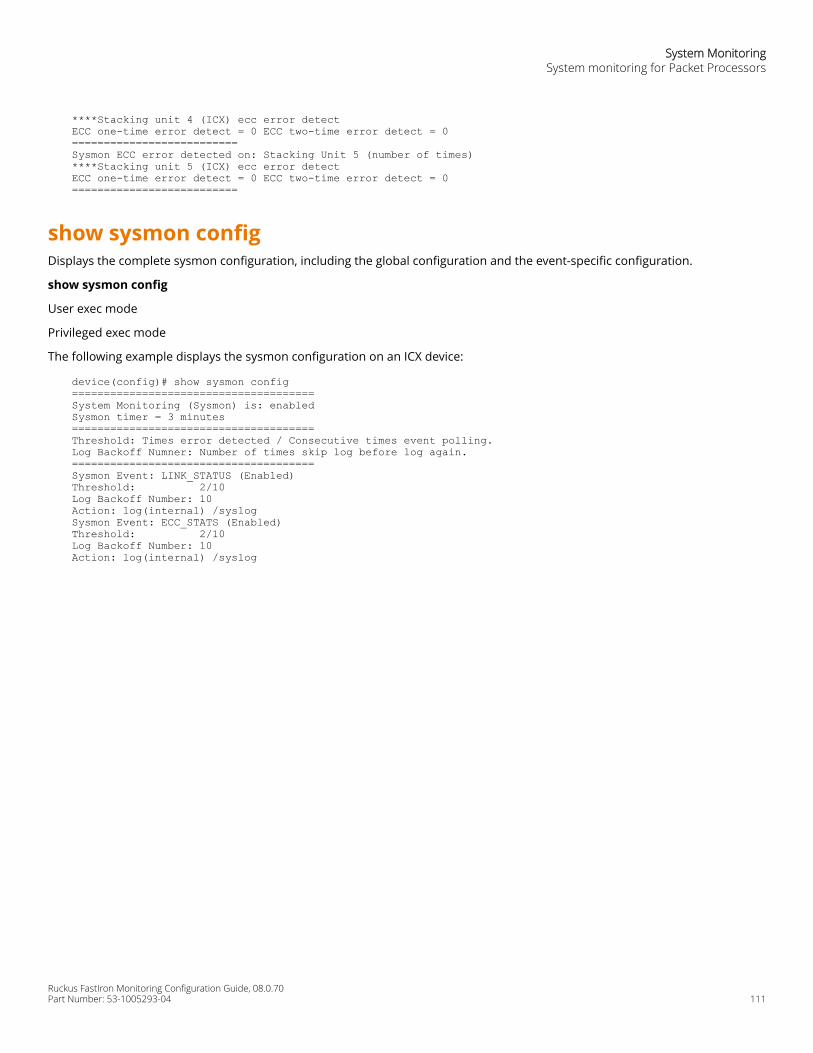
****Stacking unit 4 (ICX) ecc error detectECC one-time error detect = 0 ECC two-time error detect = 0==========================Sysmon ECC error detected on: Stacking Unit 5 (number of times)****Stacking unit 5 (ICX) ecc error detectECC one-time error detect = 0 ECC two-time error detect = 0==========================
show sysmon configDisplays the complete sysmon configuration, including the global configuration and the event-specific configuration.
show sysmon config
User exec mode
Privileged exec mode
The following example displays the sysmon configuration on an ICX device:
device(config)# show sysmon config======================================System Monitoring (Sysmon) is: enabledSysmon timer = 3 minutes======================================Threshold: Times error detected / Consecutive times event polling.Log Backoff Numner: Number of times skip log before log again.======================================Sysmon Event: LINK_STATUS (Enabled)Threshold: 2/10Log Backoff Number: 10Action: log(internal) /syslogSysmon Event: ECC_STATS (Enabled)Threshold: 2/10Log Backoff Number: 10Action: log(internal) /syslog
System MonitoringSystem monitoring for Packet Processors
Ruckus FastIron Monitoring Configuration Guide, 08.0.70Part Number: 53-1005293-04 111

Ruckus FastIron Monitoring Configuration Guide, 08.0.70112 Part Number: 53-1005293-04
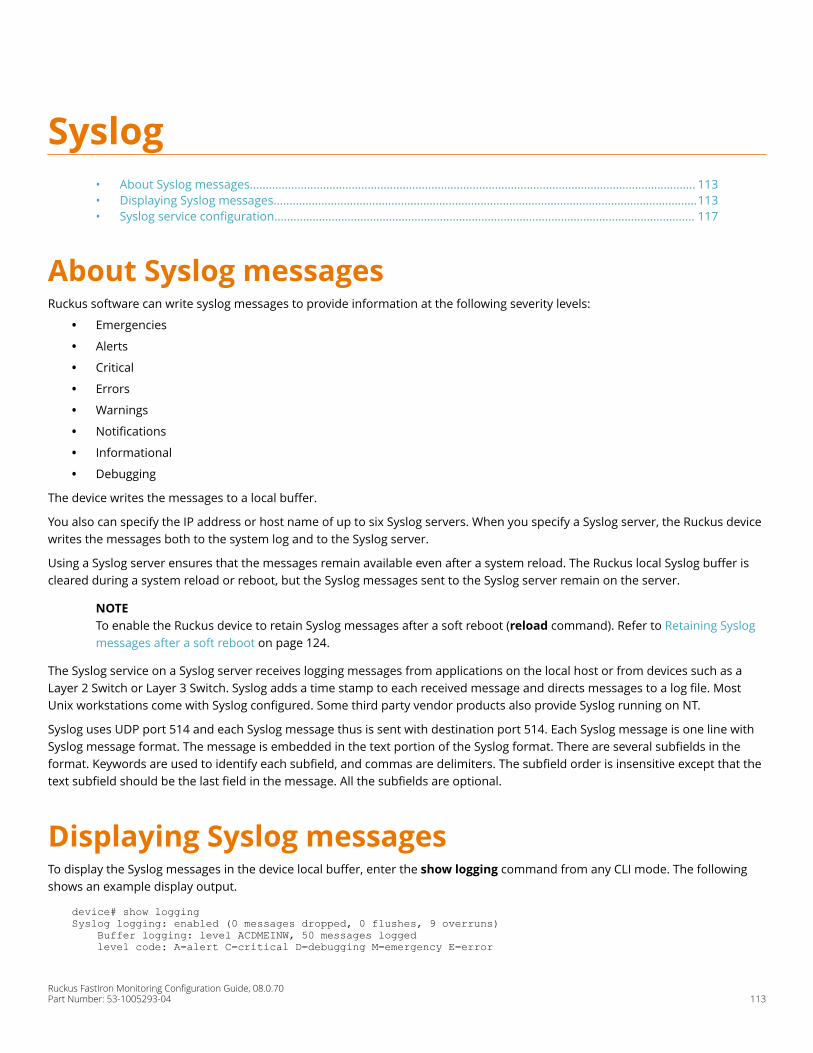
Syslog• About Syslog messages............................................................................................................................................ 113• Displaying Syslog messages.....................................................................................................................................113• Syslog service configuration.................................................................................................................................... 117
About Syslog messagesRuckus software can write syslog messages to provide information at the following severity levels:
• Emergencies
• Alerts
• Critical
• Errors
• Warnings
• Notifications
• Informational
• Debugging
The device writes the messages to a local buffer.
You also can specify the IP address or host name of up to six Syslog servers. When you specify a Syslog server, the Ruckus devicewrites the messages both to the system log and to the Syslog server.
Using a Syslog server ensures that the messages remain available even after a system reload. The Ruckus local Syslog buffer iscleared during a system reload or reboot, but the Syslog messages sent to the Syslog server remain on the server.
NOTETo enable the Ruckus device to retain Syslog messages after a soft reboot (reload command). Refer to Retaining Syslogmessages after a soft reboot on page 124.
The Syslog service on a Syslog server receives logging messages from applications on the local host or from devices such as aLayer 2 Switch or Layer 3 Switch. Syslog adds a time stamp to each received message and directs messages to a log file. MostUnix workstations come with Syslog configured. Some third party vendor products also provide Syslog running on NT.
Syslog uses UDP port 514 and each Syslog message thus is sent with destination port 514. Each Syslog message is one line withSyslog message format. The message is embedded in the text portion of the Syslog format. There are several subfields in theformat. Keywords are used to identify each subfield, and commas are delimiters. The subfield order is insensitive except that thetext subfield should be the last field in the message. All the subfields are optional.
Displaying Syslog messagesTo display the Syslog messages in the device local buffer, enter the show logging command from any CLI mode. The followingshows an example display output.
device# show loggingSyslog logging: enabled (0 messages dropped, 0 flushes, 9 overruns) Buffer logging: level ACDMEINW, 50 messages logged level code: A=alert C=critical D=debugging M=emergency E=error
Ruckus FastIron Monitoring Configuration Guide, 08.0.70Part Number: 53-1005293-04 113
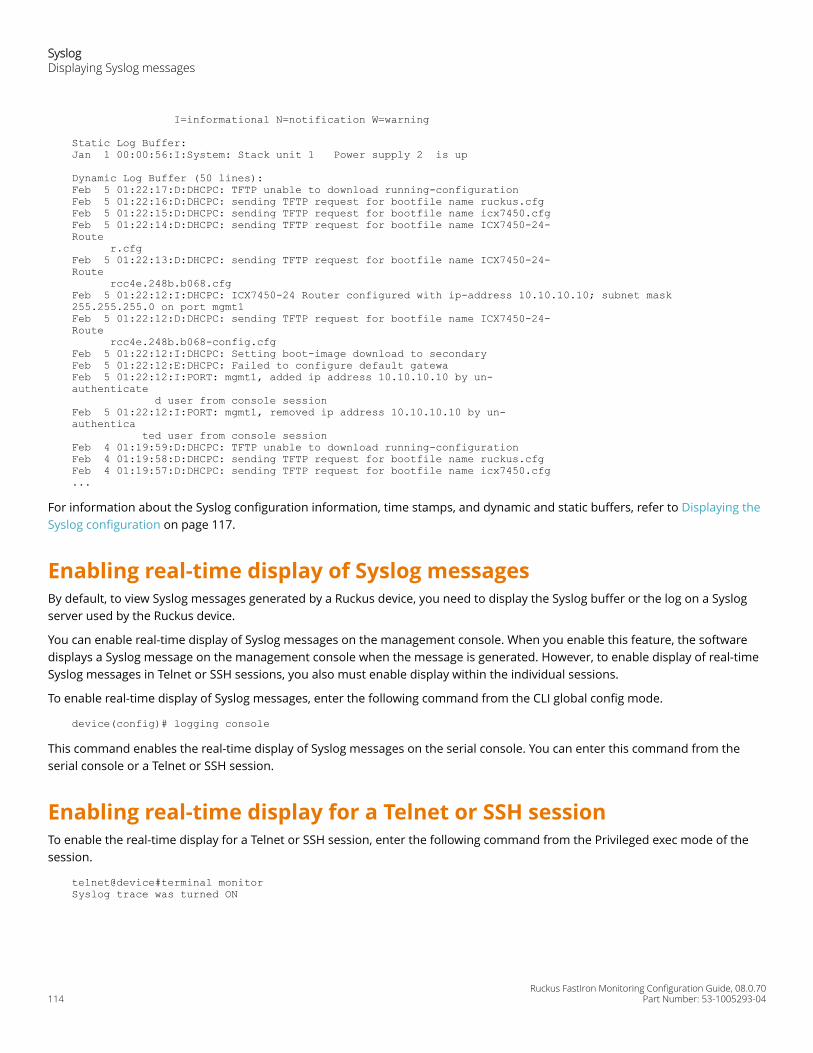
I=informational N=notification W=warning
Static Log Buffer:Jan 1 00:00:56:I:System: Stack unit 1 Power supply 2 is up
Dynamic Log Buffer (50 lines):Feb 5 01:22:17:D:DHCPC: TFTP unable to download running-configurationFeb 5 01:22:16:D:DHCPC: sending TFTP request for bootfile name ruckus.cfgFeb 5 01:22:15:D:DHCPC: sending TFTP request for bootfile name icx7450.cfgFeb 5 01:22:14:D:DHCPC: sending TFTP request for bootfile name ICX7450-24-Route r.cfgFeb 5 01:22:13:D:DHCPC: sending TFTP request for bootfile name ICX7450-24-Route rcc4e.248b.b068.cfgFeb 5 01:22:12:I:DHCPC: ICX7450-24 Router configured with ip-address 10.10.10.10; subnet mask 255.255.255.0 on port mgmt1Feb 5 01:22:12:D:DHCPC: sending TFTP request for bootfile name ICX7450-24-Route rcc4e.248b.b068-config.cfgFeb 5 01:22:12:I:DHCPC: Setting boot-image download to secondaryFeb 5 01:22:12:E:DHCPC: Failed to configure default gatewaFeb 5 01:22:12:I:PORT: mgmt1, added ip address 10.10.10.10 by un-authenticate d user from console sessionFeb 5 01:22:12:I:PORT: mgmt1, removed ip address 10.10.10.10 by un-authentica ted user from console sessionFeb 4 01:19:59:D:DHCPC: TFTP unable to download running-configurationFeb 4 01:19:58:D:DHCPC: sending TFTP request for bootfile name ruckus.cfgFeb 4 01:19:57:D:DHCPC: sending TFTP request for bootfile name icx7450.cfg...
For information about the Syslog configuration information, time stamps, and dynamic and static buffers, refer to Displaying theSyslog configuration on page 117.
Enabling real-time display of Syslog messagesBy default, to view Syslog messages generated by a Ruckus device, you need to display the Syslog buffer or the log on a Syslogserver used by the Ruckus device.
You can enable real-time display of Syslog messages on the management console. When you enable this feature, the softwaredisplays a Syslog message on the management console when the message is generated. However, to enable display of real-timeSyslog messages in Telnet or SSH sessions, you also must enable display within the individual sessions.
To enable real-time display of Syslog messages, enter the following command from the CLI global config mode.
device(config)# logging console
This command enables the real-time display of Syslog messages on the serial console. You can enter this command from theserial console or a Telnet or SSH session.
Enabling real-time display for a Telnet or SSH sessionTo enable the real-time display for a Telnet or SSH session, enter the following command from the Privileged exec mode of thesession.
telnet@device#terminal monitorSyslog trace was turned ON
SyslogDisplaying Syslog messages
Ruckus FastIron Monitoring Configuration Guide, 08.0.70114 Part Number: 53-1005293-04
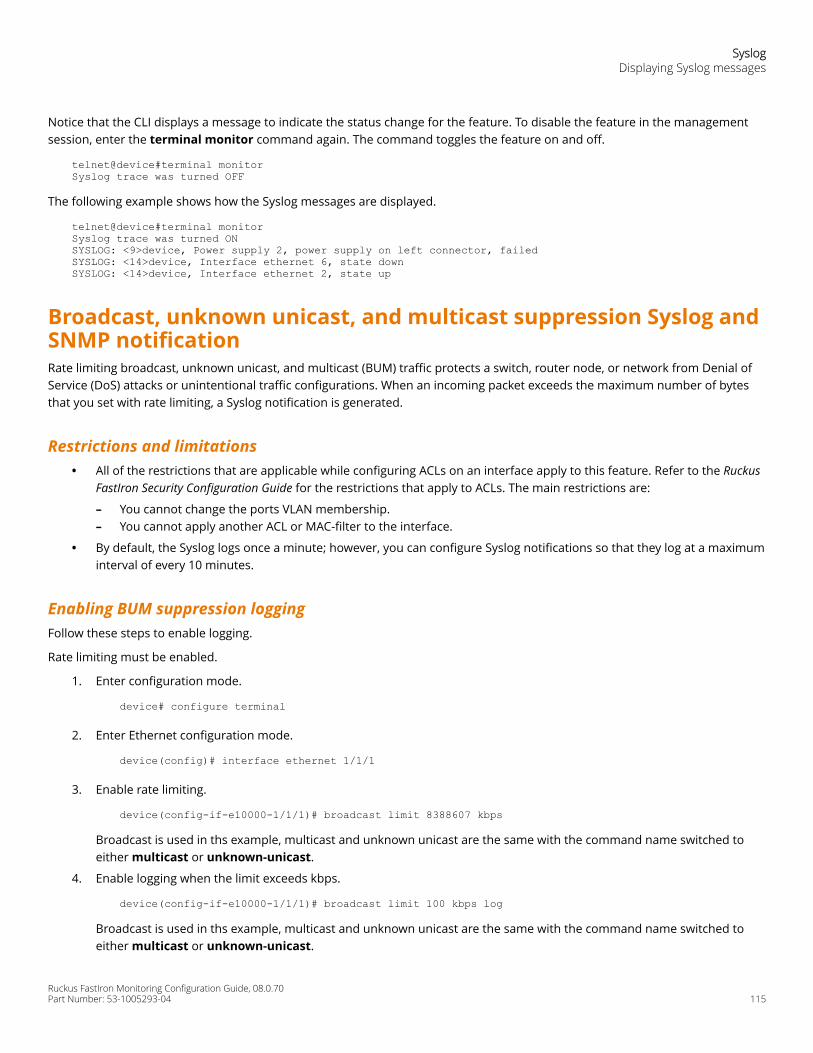
Notice that the CLI displays a message to indicate the status change for the feature. To disable the feature in the managementsession, enter the terminal monitor command again. The command toggles the feature on and off.
telnet@device#terminal monitorSyslog trace was turned OFF
The following example shows how the Syslog messages are displayed.
telnet@device#terminal monitorSyslog trace was turned ONSYSLOG: <9>device, Power supply 2, power supply on left connector, failedSYSLOG: <14>device, Interface ethernet 6, state downSYSLOG: <14>device, Interface ethernet 2, state up
Broadcast, unknown unicast, and multicast suppression Syslog andSNMP notificationRate limiting broadcast, unknown unicast, and multicast (BUM) traffic protects a switch, router node, or network from Denial ofService (DoS) attacks or unintentional traffic configurations. When an incoming packet exceeds the maximum number of bytesthat you set with rate limiting, a Syslog notification is generated.
Restrictions and limitations• All of the restrictions that are applicable while configuring ACLs on an interface apply to this feature. Refer to the Ruckus
FastIron Security Configuration Guide for the restrictions that apply to ACLs. The main restrictions are:
– You cannot change the ports VLAN membership.– You cannot apply another ACL or MAC-filter to the interface.
• By default, the Syslog logs once a minute; however, you can configure Syslog notifications so that they log at a maximuminterval of every 10 minutes.
Enabling BUM suppression loggingFollow these steps to enable logging.
Rate limiting must be enabled.
1. Enter configuration mode.
device# configure terminal
2. Enter Ethernet configuration mode.
device(config)# interface ethernet 1/1/1
3. Enable rate limiting.
device(config-if-e10000-1/1/1)# broadcast limit 8388607 kbps
Broadcast is used in ths example, multicast and unknown unicast are the same with the command name switched toeither multicast or unknown-unicast.
4. Enable logging when the limit exceeds kbps.
device(config-if-e10000-1/1/1)# broadcast limit 100 kbps log
Broadcast is used in ths example, multicast and unknown unicast are the same with the command name switched toeither multicast or unknown-unicast.
SyslogDisplaying Syslog messages
Ruckus FastIron Monitoring Configuration Guide, 08.0.70Part Number: 53-1005293-04 115
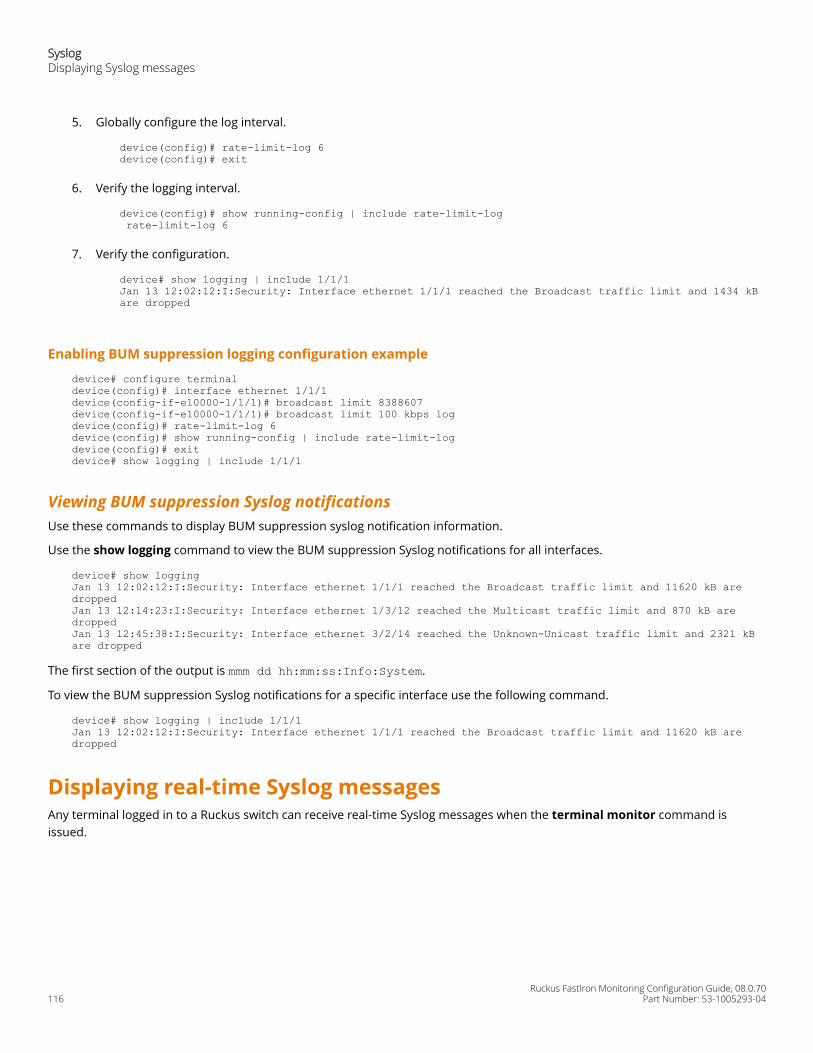
5. Globally configure the log interval.
device(config)# rate-limit-log 6 device(config)# exit
6. Verify the logging interval.
device(config)# show running-config | include rate-limit-log rate-limit-log 6
7. Verify the configuration.
device# show logging | include 1/1/1Jan 13 12:02:12:I:Security: Interface ethernet 1/1/1 reached the Broadcast traffic limit and 1434 kB are dropped
Enabling BUM suppression logging configuration example
device# configure terminaldevice(config)# interface ethernet 1/1/1device(config-if-e10000-1/1/1)# broadcast limit 8388607device(config-if-e10000-1/1/1)# broadcast limit 100 kbps logdevice(config)# rate-limit-log 6device(config)# show running-config | include rate-limit-logdevice(config)# exitdevice# show logging | include 1/1/1
Viewing BUM suppression Syslog notificationsUse these commands to display BUM suppression syslog notification information.
Use the show logging command to view the BUM suppression Syslog notifications for all interfaces.
device# show loggingJan 13 12:02:12:I:Security: Interface ethernet 1/1/1 reached the Broadcast traffic limit and 11620 kB are droppedJan 13 12:14:23:I:Security: Interface ethernet 1/3/12 reached the Multicast traffic limit and 870 kB are droppedJan 13 12:45:38:I:Security: Interface ethernet 3/2/14 reached the Unknown-Unicast traffic limit and 2321 kB are dropped
The first section of the output is mmm dd hh:mm:ss:Info:System.
To view the BUM suppression Syslog notifications for a specific interface use the following command.
device# show logging | include 1/1/1Jan 13 12:02:12:I:Security: Interface ethernet 1/1/1 reached the Broadcast traffic limit and 11620 kB are dropped
Displaying real-time Syslog messagesAny terminal logged in to a Ruckus switch can receive real-time Syslog messages when the terminal monitor command isissued.
SyslogDisplaying Syslog messages
Ruckus FastIron Monitoring Configuration Guide, 08.0.70116 Part Number: 53-1005293-04
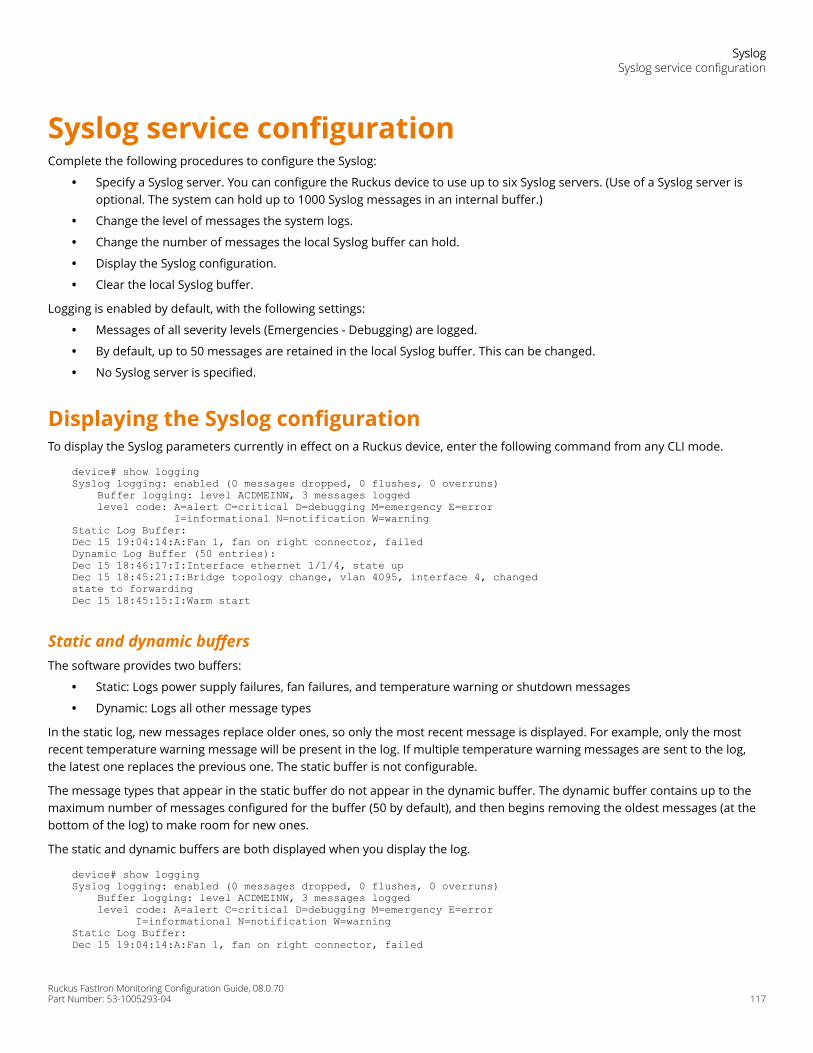
Syslog service configurationComplete the following procedures to configure the Syslog:
• Specify a Syslog server. You can configure the Ruckus device to use up to six Syslog servers. (Use of a Syslog server isoptional. The system can hold up to 1000 Syslog messages in an internal buffer.)
• Change the level of messages the system logs.
• Change the number of messages the local Syslog buffer can hold.
• Display the Syslog configuration.
• Clear the local Syslog buffer.
Logging is enabled by default, with the following settings:
• Messages of all severity levels (Emergencies - Debugging) are logged.
• By default, up to 50 messages are retained in the local Syslog buffer. This can be changed.
• No Syslog server is specified.
Displaying the Syslog configurationTo display the Syslog parameters currently in effect on a Ruckus device, enter the following command from any CLI mode.
device# show loggingSyslog logging: enabled (0 messages dropped, 0 flushes, 0 overruns) Buffer logging: level ACDMEINW, 3 messages logged level code: A=alert C=critical D=debugging M=emergency E=error I=informational N=notification W=warningStatic Log Buffer:Dec 15 19:04:14:A:Fan 1, fan on right connector, failedDynamic Log Buffer (50 entries):Dec 15 18:46:17:I:Interface ethernet 1/1/4, state upDec 15 18:45:21:I:Bridge topology change, vlan 4095, interface 4, changedstate to forwardingDec 15 18:45:15:I:Warm start
Static and dynamic buffersThe software provides two buffers:
• Static: Logs power supply failures, fan failures, and temperature warning or shutdown messages
• Dynamic: Logs all other message types
In the static log, new messages replace older ones, so only the most recent message is displayed. For example, only the mostrecent temperature warning message will be present in the log. If multiple temperature warning messages are sent to the log,the latest one replaces the previous one. The static buffer is not configurable.
The message types that appear in the static buffer do not appear in the dynamic buffer. The dynamic buffer contains up to themaximum number of messages configured for the buffer (50 by default), and then begins removing the oldest messages (at thebottom of the log) to make room for new ones.
The static and dynamic buffers are both displayed when you display the log.
device# show loggingSyslog logging: enabled (0 messages dropped, 0 flushes, 0 overruns) Buffer logging: level ACDMEINW, 3 messages logged level code: A=alert C=critical D=debugging M=emergency E=error I=informational N=notification W=warningStatic Log Buffer:Dec 15 19:04:14:A:Fan 1, fan on right connector, failed
SyslogSyslog service configuration
Ruckus FastIron Monitoring Configuration Guide, 08.0.70Part Number: 53-1005293-04 117
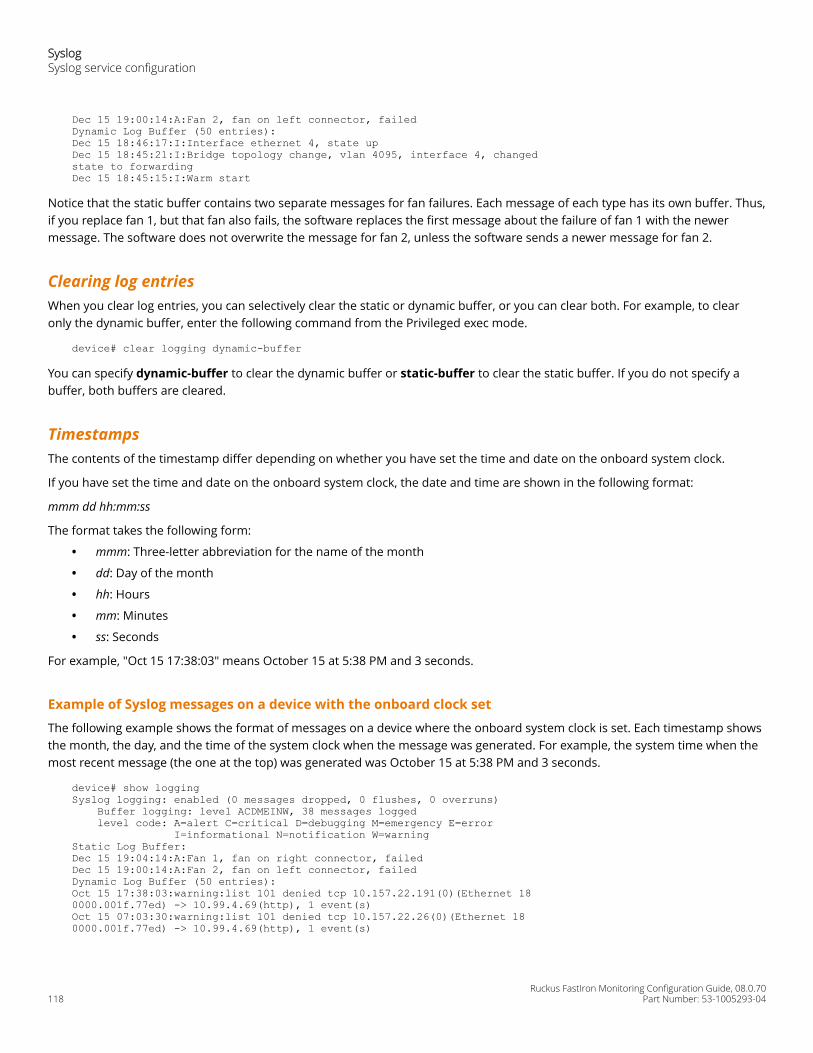
Dec 15 19:00:14:A:Fan 2, fan on left connector, failedDynamic Log Buffer (50 entries):Dec 15 18:46:17:I:Interface ethernet 4, state upDec 15 18:45:21:I:Bridge topology change, vlan 4095, interface 4, changedstate to forwardingDec 15 18:45:15:I:Warm start
Notice that the static buffer contains two separate messages for fan failures. Each message of each type has its own buffer. Thus,if you replace fan 1, but that fan also fails, the software replaces the first message about the failure of fan 1 with the newermessage. The software does not overwrite the message for fan 2, unless the software sends a newer message for fan 2.
Clearing log entriesWhen you clear log entries, you can selectively clear the static or dynamic buffer, or you can clear both. For example, to clearonly the dynamic buffer, enter the following command from the Privileged exec mode.
device# clear logging dynamic-buffer
You can specify dynamic-buffer to clear the dynamic buffer or static-buffer to clear the static buffer. If you do not specify abuffer, both buffers are cleared.
TimestampsThe contents of the timestamp differ depending on whether you have set the time and date on the onboard system clock.
If you have set the time and date on the onboard system clock, the date and time are shown in the following format:
mmm dd hh:mm:ss
The format takes the following form:
• mmm: Three-letter abbreviation for the name of the month
• dd: Day of the month
• hh: Hours
• mm: Minutes
• ss: Seconds
For example, "Oct 15 17:38:03" means October 15 at 5:38 PM and 3 seconds.
Example of Syslog messages on a device with the onboard clock set
The following example shows the format of messages on a device where the onboard system clock is set. Each timestamp showsthe month, the day, and the time of the system clock when the message was generated. For example, the system time when themost recent message (the one at the top) was generated was October 15 at 5:38 PM and 3 seconds.
device# show loggingSyslog logging: enabled (0 messages dropped, 0 flushes, 0 overruns) Buffer logging: level ACDMEINW, 38 messages logged level code: A=alert C=critical D=debugging M=emergency E=error I=informational N=notification W=warningStatic Log Buffer:Dec 15 19:04:14:A:Fan 1, fan on right connector, failedDec 15 19:00:14:A:Fan 2, fan on left connector, failedDynamic Log Buffer (50 entries):Oct 15 17:38:03:warning:list 101 denied tcp 10.157.22.191(0)(Ethernet 18 0000.001f.77ed) -> 10.99.4.69(http), 1 event(s)Oct 15 07:03:30:warning:list 101 denied tcp 10.157.22.26(0)(Ethernet 18 0000.001f.77ed) -> 10.99.4.69(http), 1 event(s)
SyslogSyslog service configuration
Ruckus FastIron Monitoring Configuration Guide, 08.0.70118 Part Number: 53-1005293-04
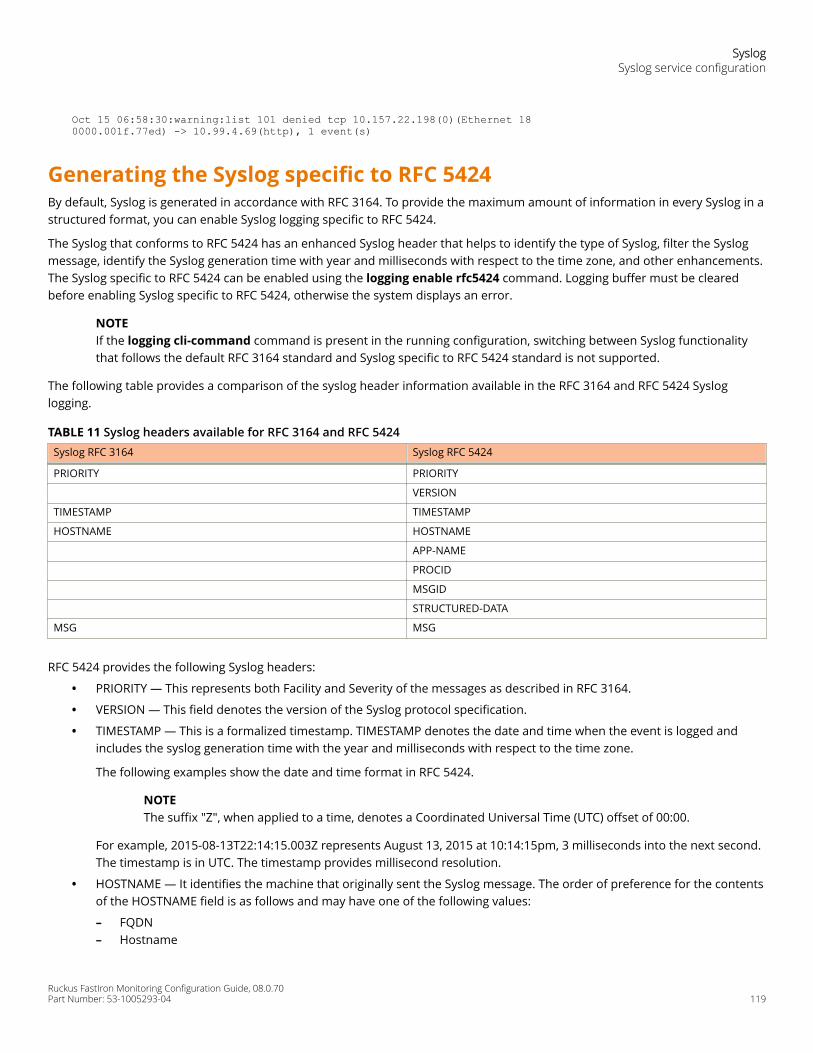
Oct 15 06:58:30:warning:list 101 denied tcp 10.157.22.198(0)(Ethernet 18 0000.001f.77ed) -> 10.99.4.69(http), 1 event(s)
Generating the Syslog specific to RFC 5424By default, Syslog is generated in accordance with RFC 3164. To provide the maximum amount of information in every Syslog in astructured format, you can enable Syslog logging specific to RFC 5424.
The Syslog that conforms to RFC 5424 has an enhanced Syslog header that helps to identify the type of Syslog, filter the Syslogmessage, identify the Syslog generation time with year and milliseconds with respect to the time zone, and other enhancements.The Syslog specific to RFC 5424 can be enabled using the logging enable rfc5424 command. Logging buffer must be clearedbefore enabling Syslog specific to RFC 5424, otherwise the system displays an error.
NOTEIf the logging cli-command command is present in the running configuration, switching between Syslog functionalitythat follows the default RFC 3164 standard and Syslog specific to RFC 5424 standard is not supported.
The following table provides a comparison of the syslog header information available in the RFC 3164 and RFC 5424 Sysloglogging.
TABLE 11 Syslog headers available for RFC 3164 and RFC 5424Syslog RFC 3164 Syslog RFC 5424
PRIORITY PRIORITY
VERSION
TIMESTAMP TIMESTAMP
HOSTNAME HOSTNAME
APP-NAME
PROCID
MSGID
STRUCTURED-DATA
MSG MSG
RFC 5424 provides the following Syslog headers:
• PRIORITY — This represents both Facility and Severity of the messages as described in RFC 3164.
• VERSION — This field denotes the version of the Syslog protocol specification.
• TIMESTAMP — This is a formalized timestamp. TIMESTAMP denotes the date and time when the event is logged andincludes the syslog generation time with the year and milliseconds with respect to the time zone.
The following examples show the date and time format in RFC 5424.
NOTEThe suffix "Z", when applied to a time, denotes a Coordinated Universal Time (UTC) offset of 00:00.
For example, 2015-08-13T22:14:15.003Z represents August 13, 2015 at 10:14:15pm, 3 milliseconds into the next second.The timestamp is in UTC. The timestamp provides millisecond resolution.
• HOSTNAME — It identifies the machine that originally sent the Syslog message. The order of preference for the contentsof the HOSTNAME field is as follows and may have one of the following values:
– FQDN– Hostname
SyslogSyslog service configuration
Ruckus FastIron Monitoring Configuration Guide, 08.0.70Part Number: 53-1005293-04 119
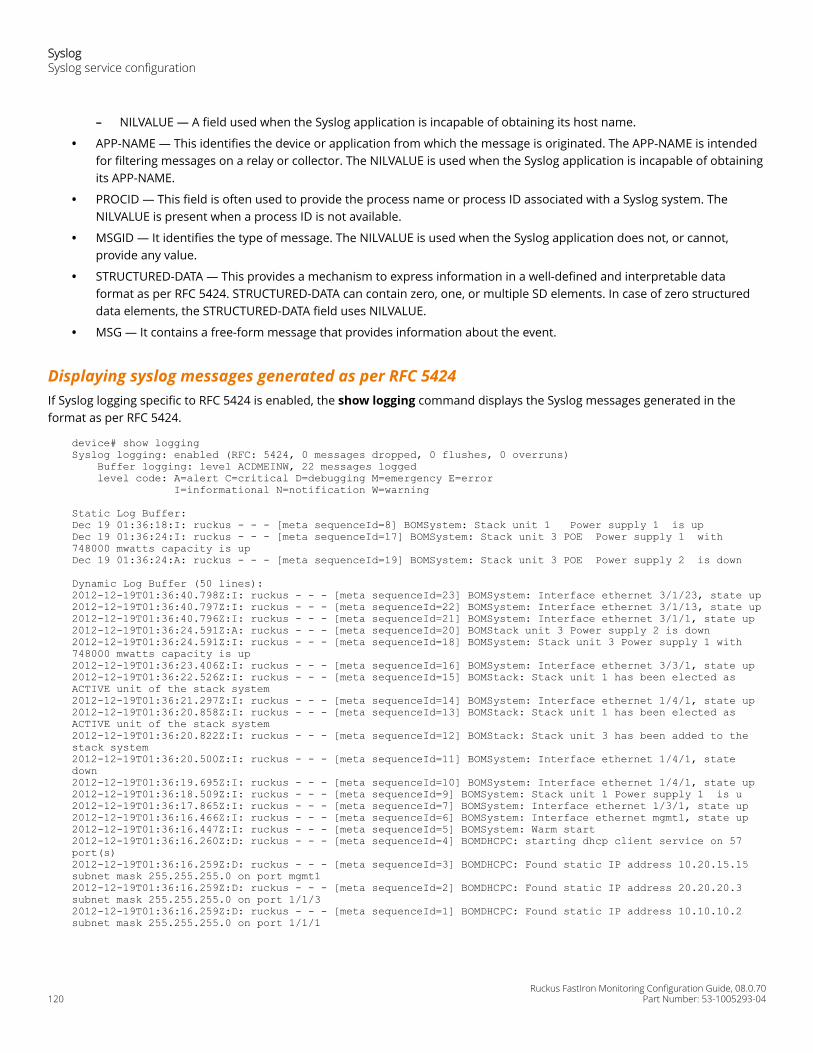
– NILVALUE — A field used when the Syslog application is incapable of obtaining its host name.
• APP-NAME — This identifies the device or application from which the message is originated. The APP-NAME is intendedfor filtering messages on a relay or collector. The NILVALUE is used when the Syslog application is incapable of obtainingits APP-NAME.
• PROCID — This field is often used to provide the process name or process ID associated with a Syslog system. TheNILVALUE is present when a process ID is not available.
• MSGID — It identifies the type of message. The NILVALUE is used when the Syslog application does not, or cannot,provide any value.
• STRUCTURED-DATA — This provides a mechanism to express information in a well-defined and interpretable dataformat as per RFC 5424. STRUCTURED-DATA can contain zero, one, or multiple SD elements. In case of zero structureddata elements, the STRUCTURED-DATA field uses NILVALUE.
• MSG — It contains a free-form message that provides information about the event.
Displaying syslog messages generated as per RFC 5424If Syslog logging specific to RFC 5424 is enabled, the show logging command displays the Syslog messages generated in theformat as per RFC 5424.
device# show loggingSyslog logging: enabled (RFC: 5424, 0 messages dropped, 0 flushes, 0 overruns) Buffer logging: level ACDMEINW, 22 messages logged level code: A=alert C=critical D=debugging M=emergency E=error I=informational N=notification W=warning
Static Log Buffer:Dec 19 01:36:18:I: ruckus - - - [meta sequenceId=8] BOMSystem: Stack unit 1 Power supply 1 is up Dec 19 01:36:24:I: ruckus - - - [meta sequenceId=17] BOMSystem: Stack unit 3 POE Power supply 1 with 748000 mwatts capacity is up Dec 19 01:36:24:A: ruckus - - - [meta sequenceId=19] BOMSystem: Stack unit 3 POE Power supply 2 is down
Dynamic Log Buffer (50 lines):2012-12-19T01:36:40.798Z:I: ruckus - - - [meta sequenceId=23] BOMSystem: Interface ethernet 3/1/23, state up2012-12-19T01:36:40.797Z:I: ruckus - - - [meta sequenceId=22] BOMSystem: Interface ethernet 3/1/13, state up2012-12-19T01:36:40.796Z:I: ruckus - - - [meta sequenceId=21] BOMSystem: Interface ethernet 3/1/1, state up2012-12-19T01:36:24.591Z:A: ruckus - - - [meta sequenceId=20] BOMStack unit 3 Power supply 2 is down2012-12-19T01:36:24.591Z:I: ruckus - - - [meta sequenceId=18] BOMSystem: Stack unit 3 Power supply 1 with 748000 mwatts capacity is up2012-12-19T01:36:23.406Z:I: ruckus - - - [meta sequenceId=16] BOMSystem: Interface ethernet 3/3/1, state up2012-12-19T01:36:22.526Z:I: ruckus - - - [meta sequenceId=15] BOMStack: Stack unit 1 has been elected as ACTIVE unit of the stack system2012-12-19T01:36:21.297Z:I: ruckus - - - [meta sequenceId=14] BOMSystem: Interface ethernet 1/4/1, state up2012-12-19T01:36:20.858Z:I: ruckus - - - [meta sequenceId=13] BOMStack: Stack unit 1 has been elected as ACTIVE unit of the stack system2012-12-19T01:36:20.822Z:I: ruckus - - - [meta sequenceId=12] BOMStack: Stack unit 3 has been added to the stack system2012-12-19T01:36:20.500Z:I: ruckus - - - [meta sequenceId=11] BOMSystem: Interface ethernet 1/4/1, state down2012-12-19T01:36:19.695Z:I: ruckus - - - [meta sequenceId=10] BOMSystem: Interface ethernet 1/4/1, state up2012-12-19T01:36:18.509Z:I: ruckus - - - [meta sequenceId=9] BOMSystem: Stack unit 1 Power supply 1 is u2012-12-19T01:36:17.865Z:I: ruckus - - - [meta sequenceId=7] BOMSystem: Interface ethernet 1/3/1, state up2012-12-19T01:36:16.466Z:I: ruckus - - - [meta sequenceId=6] BOMSystem: Interface ethernet mgmt1, state up2012-12-19T01:36:16.447Z:I: ruckus - - - [meta sequenceId=5] BOMSystem: Warm start2012-12-19T01:36:16.260Z:D: ruckus - - - [meta sequenceId=4] BOMDHCPC: starting dhcp client service on 57 port(s)2012-12-19T01:36:16.259Z:D: ruckus - - - [meta sequenceId=3] BOMDHCPC: Found static IP address 10.20.15.15 subnet mask 255.255.255.0 on port mgmt12012-12-19T01:36:16.259Z:D: ruckus - - - [meta sequenceId=2] BOMDHCPC: Found static IP address 20.20.20.3 subnet mask 255.255.255.0 on port 1/1/32012-12-19T01:36:16.259Z:D: ruckus - - - [meta sequenceId=1] BOMDHCPC: Found static IP address 10.10.10.2 subnet mask 255.255.255.0 on port 1/1/1
SyslogSyslog service configuration
Ruckus FastIron Monitoring Configuration Guide, 08.0.70120 Part Number: 53-1005293-04
Disabling or re-enabling SyslogSyslog is enabled by default. To disable it, enter the logging on command from the global config mode.
device(config)# no logging on
To re-enable logging, re-enter the logging on command.
device(config)# logging on
This command enables local Syslog logging with the following defaults:
• Messages of all severity levels (Emergencies - Debugging) are logged.
• Up to 50 messages are retained in the local Syslog buffer.
• No Syslog server is specified.
Specifying a Syslog serverTo specify a Syslog server, enter the logging host command.
device(config)# logging host 10.0.0.99
Specifying an additional Syslog serverTo specify an additional Syslog server, enter the logging host command again.
device(config)# logging host 10.0.0.99
You can specify up to six Syslog servers.
Disabling logging of a message levelTo change the message level, disable logging of specific message levels. You must disable the message levels on an individualbasis.
For example, to disable logging of debugging and informational messages, enter the following commands.
device(config)# no logging buffered debuggingdevice(config)# no logging buffered informational
The message level parameter can have one of the following values:
• alerts
• critical
• debugging
• emergencies
• errors
• informational
• notifications
• warnings
The commands in the example above change the log level to notification messages or higher. The software does not loginformational or debugging messages. The changed message level also applies to the Syslog servers.
SyslogSyslog service configuration
Ruckus FastIron Monitoring Configuration Guide, 08.0.70Part Number: 53-1005293-04 121
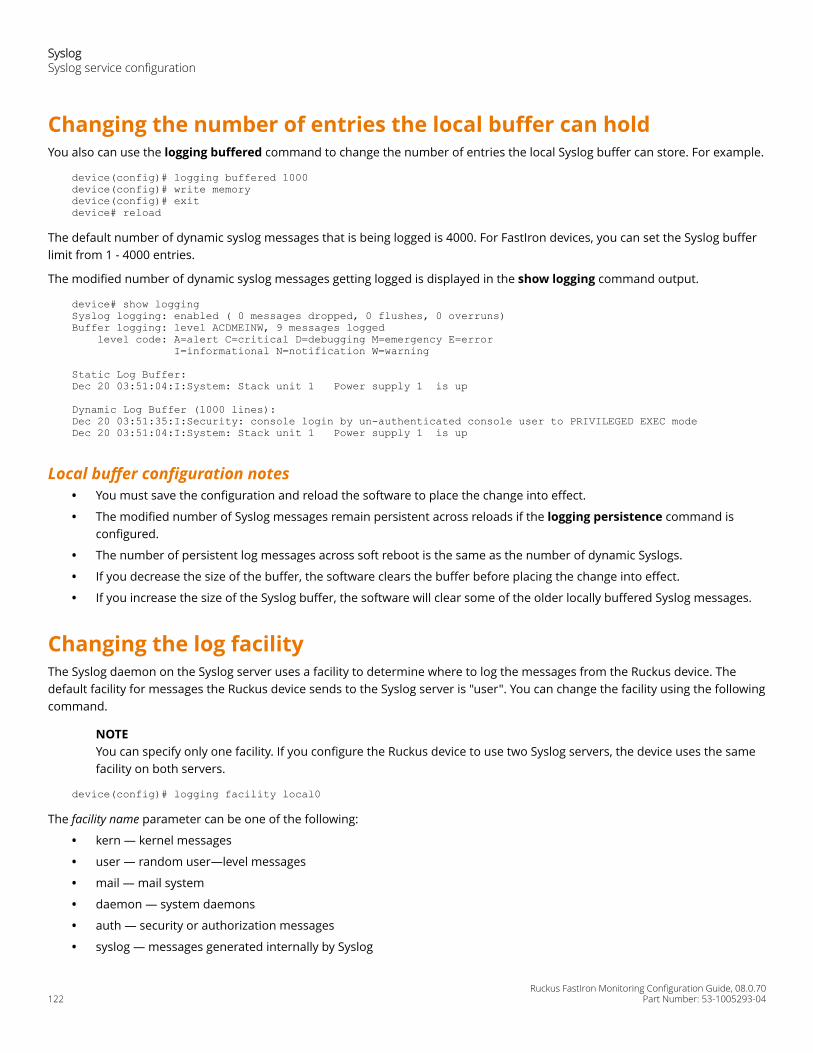
Changing the number of entries the local buffer can holdYou also can use the logging buffered command to change the number of entries the local Syslog buffer can store. For example.
device(config)# logging buffered 1000device(config)# write memorydevice(config)# exitdevice# reload
The default number of dynamic syslog messages that is being logged is 4000. For FastIron devices, you can set the Syslog bufferlimit from 1 - 4000 entries.
The modified number of dynamic syslog messages getting logged is displayed in the show logging command output.
device# show loggingSyslog logging: enabled ( 0 messages dropped, 0 flushes, 0 overruns)Buffer logging: level ACDMEINW, 9 messages logged level code: A=alert C=critical D=debugging M=emergency E=error I=informational N=notification W=warning
Static Log Buffer:Dec 20 03:51:04:I:System: Stack unit 1 Power supply 1 is up
Dynamic Log Buffer (1000 lines):Dec 20 03:51:35:I:Security: console login by un-authenticated console user to PRIVILEGED EXEC modeDec 20 03:51:04:I:System: Stack unit 1 Power supply 1 is up
Local buffer configuration notes• You must save the configuration and reload the software to place the change into effect.
• The modified number of Syslog messages remain persistent across reloads if the logging persistence command isconfigured.
• The number of persistent log messages across soft reboot is the same as the number of dynamic Syslogs.
• If you decrease the size of the buffer, the software clears the buffer before placing the change into effect.
• If you increase the size of the Syslog buffer, the software will clear some of the older locally buffered Syslog messages.
Changing the log facilityThe Syslog daemon on the Syslog server uses a facility to determine where to log the messages from the Ruckus device. Thedefault facility for messages the Ruckus device sends to the Syslog server is "user". You can change the facility using the followingcommand.
NOTEYou can specify only one facility. If you configure the Ruckus device to use two Syslog servers, the device uses the samefacility on both servers.
device(config)# logging facility local0
The facility name parameter can be one of the following:
• kern — kernel messages
• user — random user—level messages
• mail — mail system
• daemon — system daemons
• auth — security or authorization messages
• syslog — messages generated internally by Syslog
SyslogSyslog service configuration
Ruckus FastIron Monitoring Configuration Guide, 08.0.70122 Part Number: 53-1005293-04
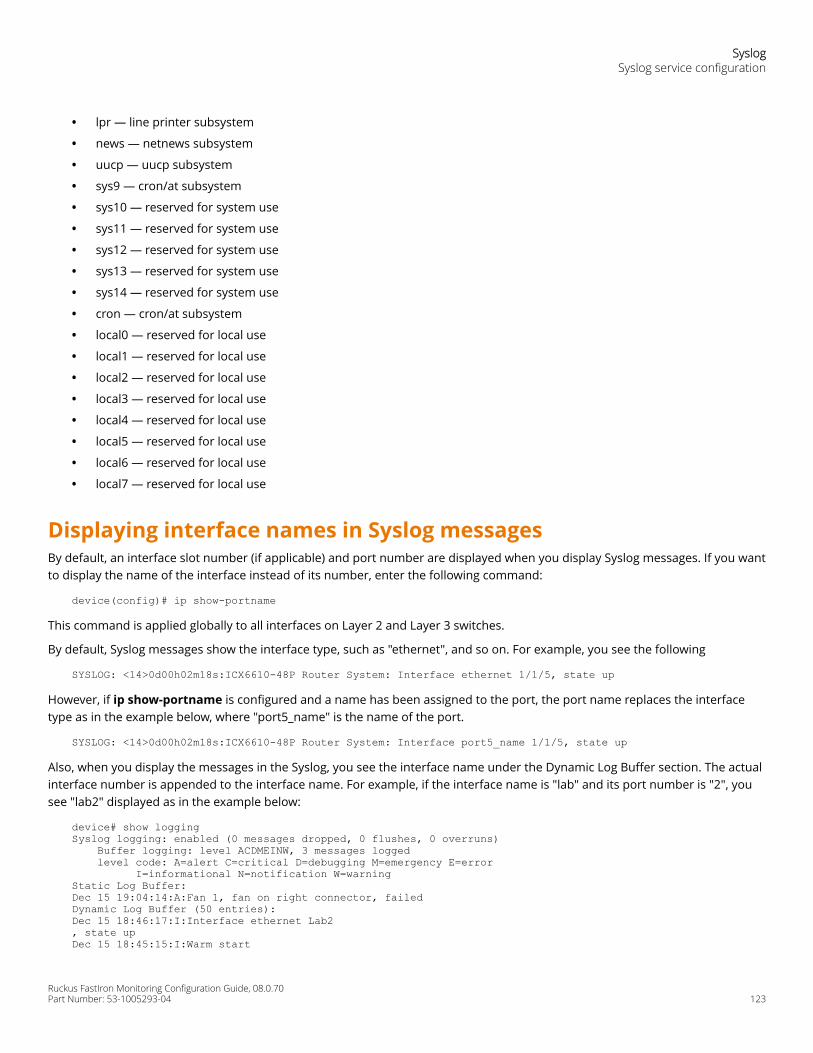
• lpr — line printer subsystem
• news — netnews subsystem
• uucp — uucp subsystem
• sys9 — cron/at subsystem
• sys10 — reserved for system use
• sys11 — reserved for system use
• sys12 — reserved for system use
• sys13 — reserved for system use
• sys14 — reserved for system use
• cron — cron/at subsystem
• local0 — reserved for local use
• local1 — reserved for local use
• local2 — reserved for local use
• local3 — reserved for local use
• local4 — reserved for local use
• local5 — reserved for local use
• local6 — reserved for local use
• local7 — reserved for local use
Displaying interface names in Syslog messagesBy default, an interface slot number (if applicable) and port number are displayed when you display Syslog messages. If you wantto display the name of the interface instead of its number, enter the following command:
device(config)# ip show-portname
This command is applied globally to all interfaces on Layer 2 and Layer 3 switches.
By default, Syslog messages show the interface type, such as "ethernet", and so on. For example, you see the following
SYSLOG: <14>0d00h02m18s:ICX6610-48P Router System: Interface ethernet 1/1/5, state up
However, if ip show-portname is configured and a name has been assigned to the port, the port name replaces the interfacetype as in the example below, where "port5_name" is the name of the port.
SYSLOG: <14>0d00h02m18s:ICX6610-48P Router System: Interface port5_name 1/1/5, state up
Also, when you display the messages in the Syslog, you see the interface name under the Dynamic Log Buffer section. The actualinterface number is appended to the interface name. For example, if the interface name is "lab" and its port number is "2", yousee "lab2" displayed as in the example below:
device# show loggingSyslog logging: enabled (0 messages dropped, 0 flushes, 0 overruns) Buffer logging: level ACDMEINW, 3 messages logged level code: A=alert C=critical D=debugging M=emergency E=error I=informational N=notification W=warningStatic Log Buffer:Dec 15 19:04:14:A:Fan 1, fan on right connector, failedDynamic Log Buffer (50 entries):Dec 15 18:46:17:I:Interface ethernet Lab2, state upDec 15 18:45:15:I:Warm start
SyslogSyslog service configuration
Ruckus FastIron Monitoring Configuration Guide, 08.0.70Part Number: 53-1005293-04 123
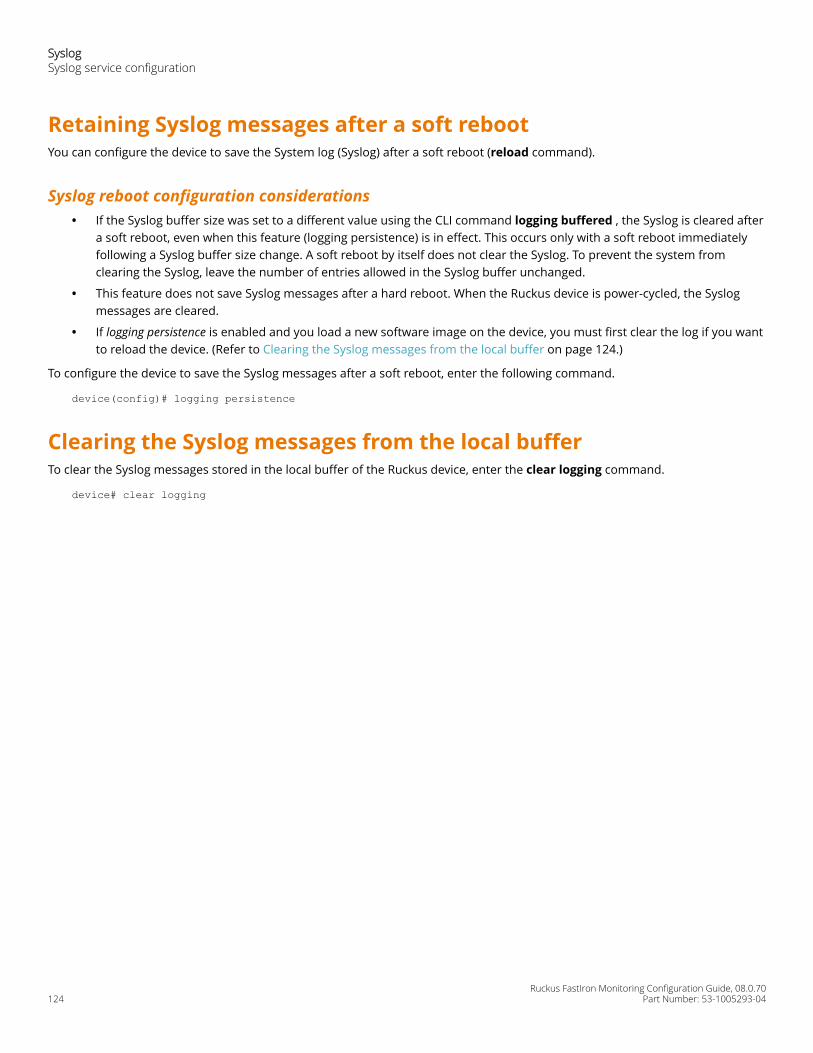
Retaining Syslog messages after a soft rebootYou can configure the device to save the System log (Syslog) after a soft reboot (reload command).
Syslog reboot configuration considerations• If the Syslog buffer size was set to a different value using the CLI command logging buffered , the Syslog is cleared after
a soft reboot, even when this feature (logging persistence) is in effect. This occurs only with a soft reboot immediatelyfollowing a Syslog buffer size change. A soft reboot by itself does not clear the Syslog. To prevent the system fromclearing the Syslog, leave the number of entries allowed in the Syslog buffer unchanged.
• This feature does not save Syslog messages after a hard reboot. When the Ruckus device is power-cycled, the Syslogmessages are cleared.
• If logging persistence is enabled and you load a new software image on the device, you must first clear the log if you wantto reload the device. (Refer to Clearing the Syslog messages from the local buffer on page 124.)
To configure the device to save the Syslog messages after a soft reboot, enter the following command.
device(config)# logging persistence
Clearing the Syslog messages from the local bufferTo clear the Syslog messages stored in the local buffer of the Ruckus device, enter the clear logging command.
device# clear logging
SyslogSyslog service configuration
Ruckus FastIron Monitoring Configuration Guide, 08.0.70124 Part Number: 53-1005293-04
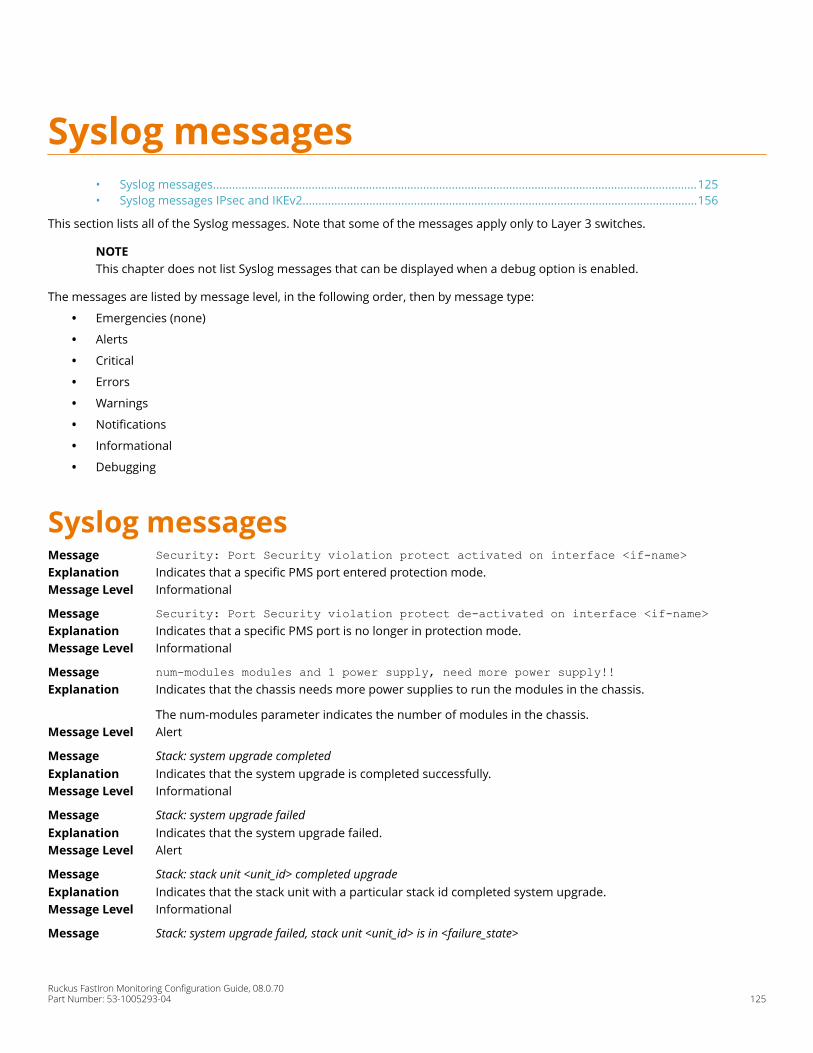
Syslog messages• Syslog messages........................................................................................................................................................125• Syslog messages IPsec and IKEv2............................................................................................................................156
This section lists all of the Syslog messages. Note that some of the messages apply only to Layer 3 switches.
NOTEThis chapter does not list Syslog messages that can be displayed when a debug option is enabled.
The messages are listed by message level, in the following order, then by message type:
• Emergencies (none)
• Alerts
• Critical
• Errors
• Warnings
• Notifications
• Informational
• Debugging
Syslog messagesMessage Security: Port Security violation protect activated on interface <if-name>Explanation Indicates that a specific PMS port entered protection mode.Message Level Informational
Message Security: Port Security violation protect de-activated on interface <if-name>Explanation Indicates that a specific PMS port is no longer in protection mode.Message Level Informational
Message num-modules modules and 1 power supply, need more power supply!!Explanation Indicates that the chassis needs more power supplies to run the modules in the chassis.
The num-modules parameter indicates the number of modules in the chassis.Message Level Alert
Message Stack: system upgrade completedExplanation Indicates that the system upgrade is completed successfully.Message Level Informational
Message Stack: system upgrade failedExplanation Indicates that the system upgrade failed.Message Level Alert
Message Stack: stack unit <unit_id> completed upgradeExplanation Indicates that the stack unit with a particular stack id completed system upgrade.Message Level Informational
Message Stack: system upgrade failed, stack unit <unit_id> is in <failure_state>
Ruckus FastIron Monitoring Configuration Guide, 08.0.70Part Number: 53-1005293-04 125
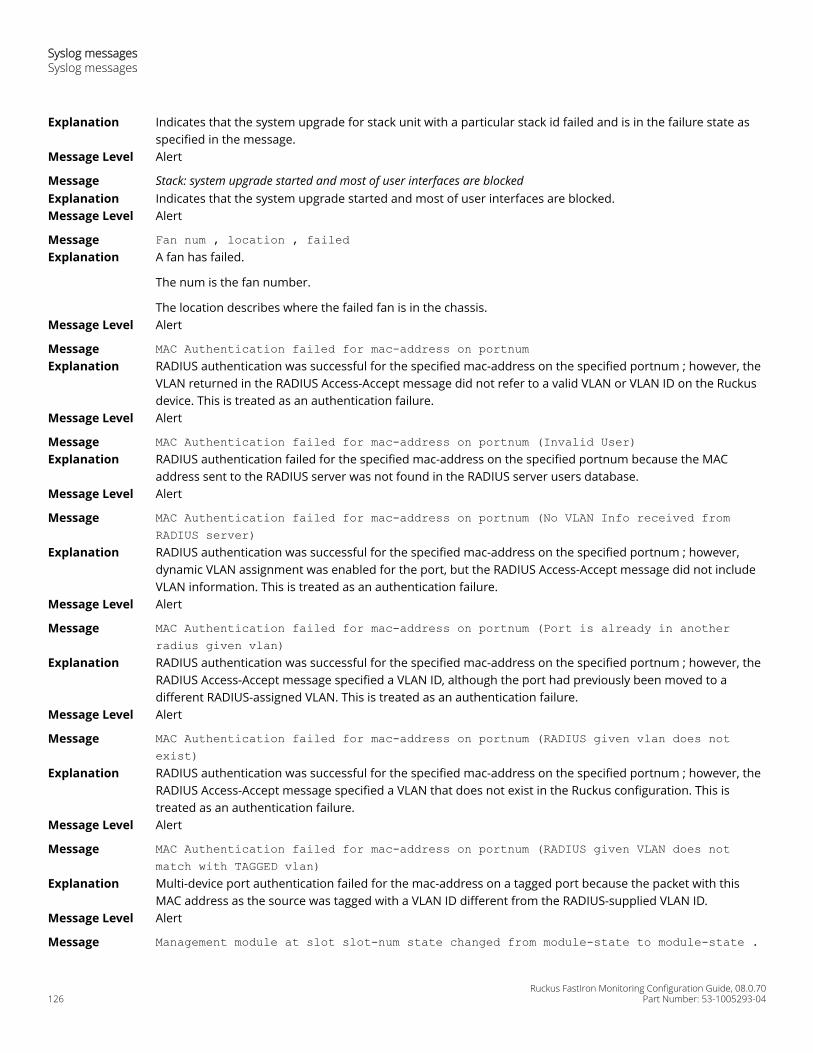
Explanation Indicates that the system upgrade for stack unit with a particular stack id failed and is in the failure state asspecified in the message.
Message Level Alert
Message Stack: system upgrade started and most of user interfaces are blockedExplanation Indicates that the system upgrade started and most of user interfaces are blocked.Message Level Alert
Message Fan num , location , failedExplanation A fan has failed.
The num is the fan number.
The location describes where the failed fan is in the chassis.Message Level Alert
Message MAC Authentication failed for mac-address on portnumExplanation RADIUS authentication was successful for the specified mac-address on the specified portnum ; however, the
VLAN returned in the RADIUS Access-Accept message did not refer to a valid VLAN or VLAN ID on the Ruckusdevice. This is treated as an authentication failure.
Message Level Alert
Message MAC Authentication failed for mac-address on portnum (Invalid User)Explanation RADIUS authentication failed for the specified mac-address on the specified portnum because the MAC
address sent to the RADIUS server was not found in the RADIUS server users database.Message Level Alert
Message MAC Authentication failed for mac-address on portnum (No VLAN Info received fromRADIUS server)
Explanation RADIUS authentication was successful for the specified mac-address on the specified portnum ; however,dynamic VLAN assignment was enabled for the port, but the RADIUS Access-Accept message did not includeVLAN information. This is treated as an authentication failure.
Message Level Alert
Message MAC Authentication failed for mac-address on portnum (Port is already in anotherradius given vlan)
Explanation RADIUS authentication was successful for the specified mac-address on the specified portnum ; however, theRADIUS Access-Accept message specified a VLAN ID, although the port had previously been moved to adifferent RADIUS-assigned VLAN. This is treated as an authentication failure.
Message Level Alert
Message MAC Authentication failed for mac-address on portnum (RADIUS given vlan does notexist)
Explanation RADIUS authentication was successful for the specified mac-address on the specified portnum ; however, theRADIUS Access-Accept message specified a VLAN that does not exist in the Ruckus configuration. This istreated as an authentication failure.
Message Level Alert
Message MAC Authentication failed for mac-address on portnum (RADIUS given VLAN does notmatch with TAGGED vlan)
Explanation Multi-device port authentication failed for the mac-address on a tagged port because the packet with thisMAC address as the source was tagged with a VLAN ID different from the RADIUS-supplied VLAN ID.
Message Level Alert
Message Management module at slot slot-num state changed from module-state to module-state .
Syslog messagesSyslog messages
Ruckus FastIron Monitoring Configuration Guide, 08.0.70126 Part Number: 53-1005293-04
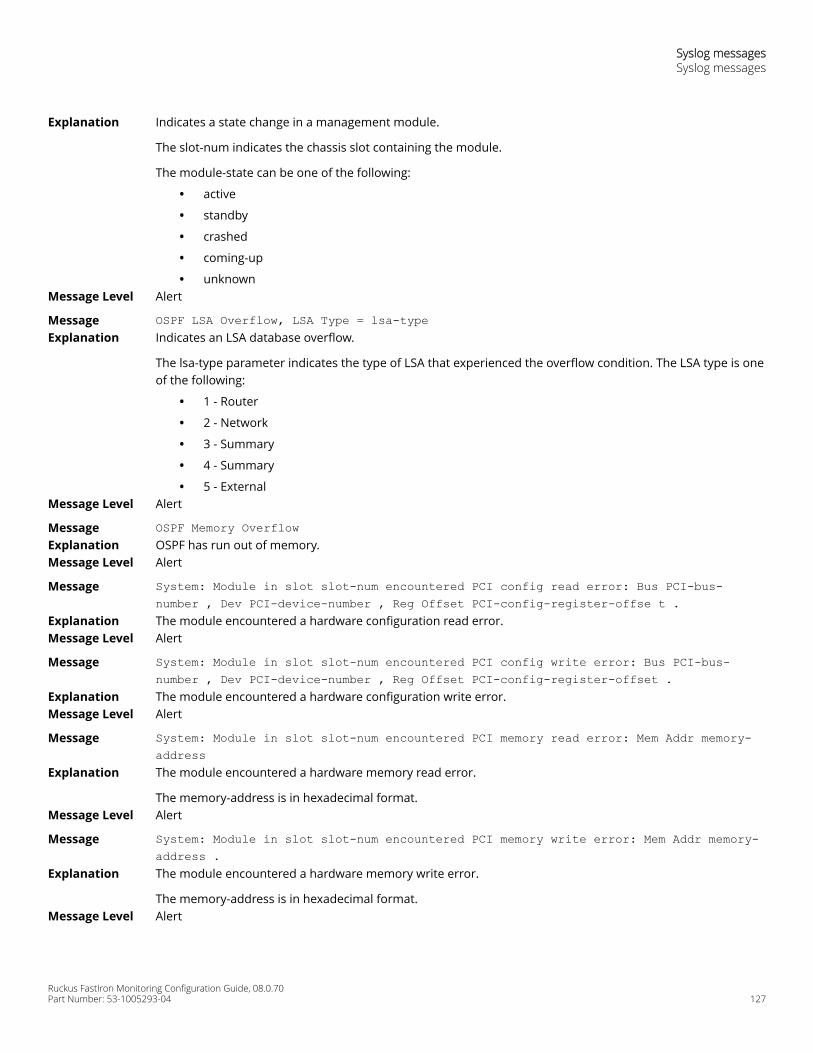
Explanation Indicates a state change in a management module.
The slot-num indicates the chassis slot containing the module.
The module-state can be one of the following:
• active
• standby
• crashed
• coming-up
• unknownMessage Level Alert
Message OSPF LSA Overflow, LSA Type = lsa-typeExplanation Indicates an LSA database overflow.
The lsa-type parameter indicates the type of LSA that experienced the overflow condition. The LSA type is oneof the following:
• 1 - Router
• 2 - Network
• 3 - Summary
• 4 - Summary
• 5 - ExternalMessage Level Alert
Message OSPF Memory OverflowExplanation OSPF has run out of memory.Message Level Alert
Message System: Module in slot slot-num encountered PCI config read error: Bus PCI-bus-number , Dev PCI-device-number , Reg Offset PCI-config-register-offse t .
Explanation The module encountered a hardware configuration read error.Message Level Alert
Message System: Module in slot slot-num encountered PCI config write error: Bus PCI-bus-number , Dev PCI-device-number , Reg Offset PCI-config-register-offset .
Explanation The module encountered a hardware configuration write error.Message Level Alert
Message System: Module in slot slot-num encountered PCI memory read error: Mem Addr memory-address
Explanation The module encountered a hardware memory read error.
The memory-address is in hexadecimal format.Message Level Alert
Message System: Module in slot slot-num encountered PCI memory write error: Mem Addr memory-address .
Explanation The module encountered a hardware memory write error.
The memory-address is in hexadecimal format.Message Level Alert
Syslog messagesSyslog messages
Ruckus FastIron Monitoring Configuration Guide, 08.0.70Part Number: 53-1005293-04 127
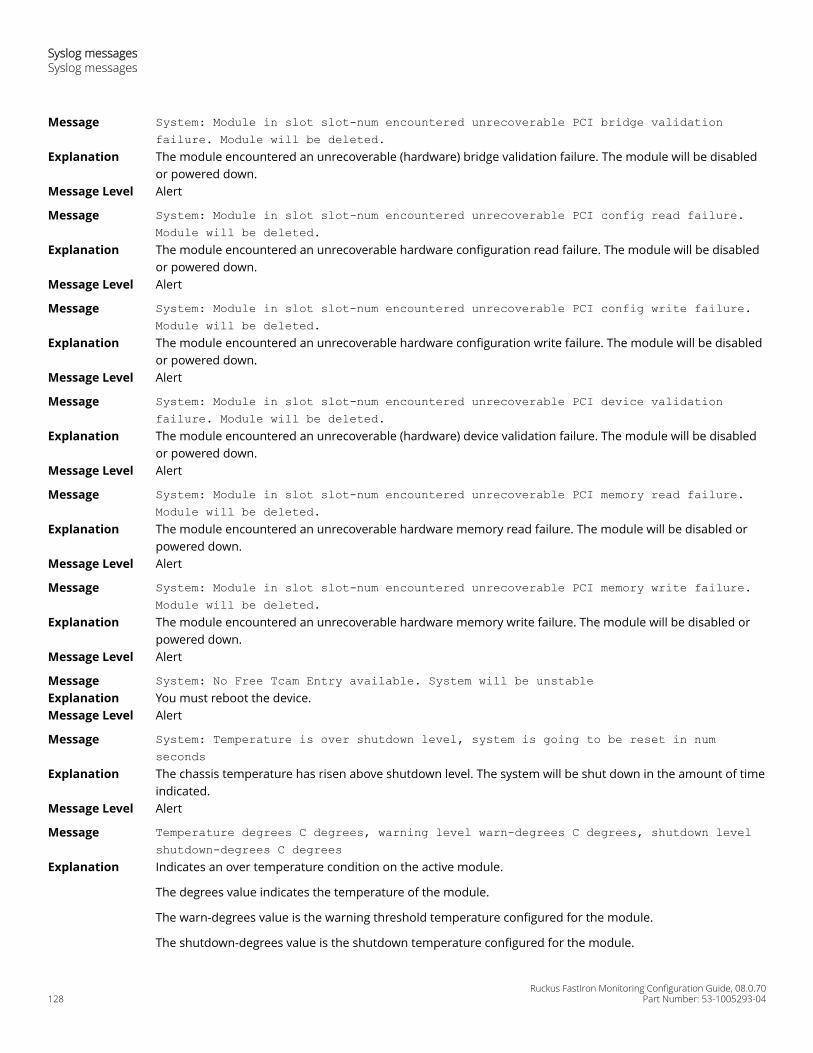
Message System: Module in slot slot-num encountered unrecoverable PCI bridge validationfailure. Module will be deleted.
Explanation The module encountered an unrecoverable (hardware) bridge validation failure. The module will be disabledor powered down.
Message Level Alert
Message System: Module in slot slot-num encountered unrecoverable PCI config read failure.Module will be deleted.
Explanation The module encountered an unrecoverable hardware configuration read failure. The module will be disabledor powered down.
Message Level Alert
Message System: Module in slot slot-num encountered unrecoverable PCI config write failure.Module will be deleted.
Explanation The module encountered an unrecoverable hardware configuration write failure. The module will be disabledor powered down.
Message Level Alert
Message System: Module in slot slot-num encountered unrecoverable PCI device validationfailure. Module will be deleted.
Explanation The module encountered an unrecoverable (hardware) device validation failure. The module will be disabledor powered down.
Message Level Alert
Message System: Module in slot slot-num encountered unrecoverable PCI memory read failure.Module will be deleted.
Explanation The module encountered an unrecoverable hardware memory read failure. The module will be disabled orpowered down.
Message Level Alert
Message System: Module in slot slot-num encountered unrecoverable PCI memory write failure.Module will be deleted.
Explanation The module encountered an unrecoverable hardware memory write failure. The module will be disabled orpowered down.
Message Level Alert
Message System: No Free Tcam Entry available. System will be unstableExplanation You must reboot the device.Message Level Alert
Message System: Temperature is over shutdown level, system is going to be reset in numseconds
Explanation The chassis temperature has risen above shutdown level. The system will be shut down in the amount of timeindicated.
Message Level Alert
Message Temperature degrees C degrees, warning level warn-degrees C degrees, shutdown levelshutdown-degrees C degrees
Explanation Indicates an over temperature condition on the active module.
The degrees value indicates the temperature of the module.
The warn-degrees value is the warning threshold temperature configured for the module.
The shutdown-degrees value is the shutdown temperature configured for the module.
Syslog messagesSyslog messages
Ruckus FastIron Monitoring Configuration Guide, 08.0.70128 Part Number: 53-1005293-04
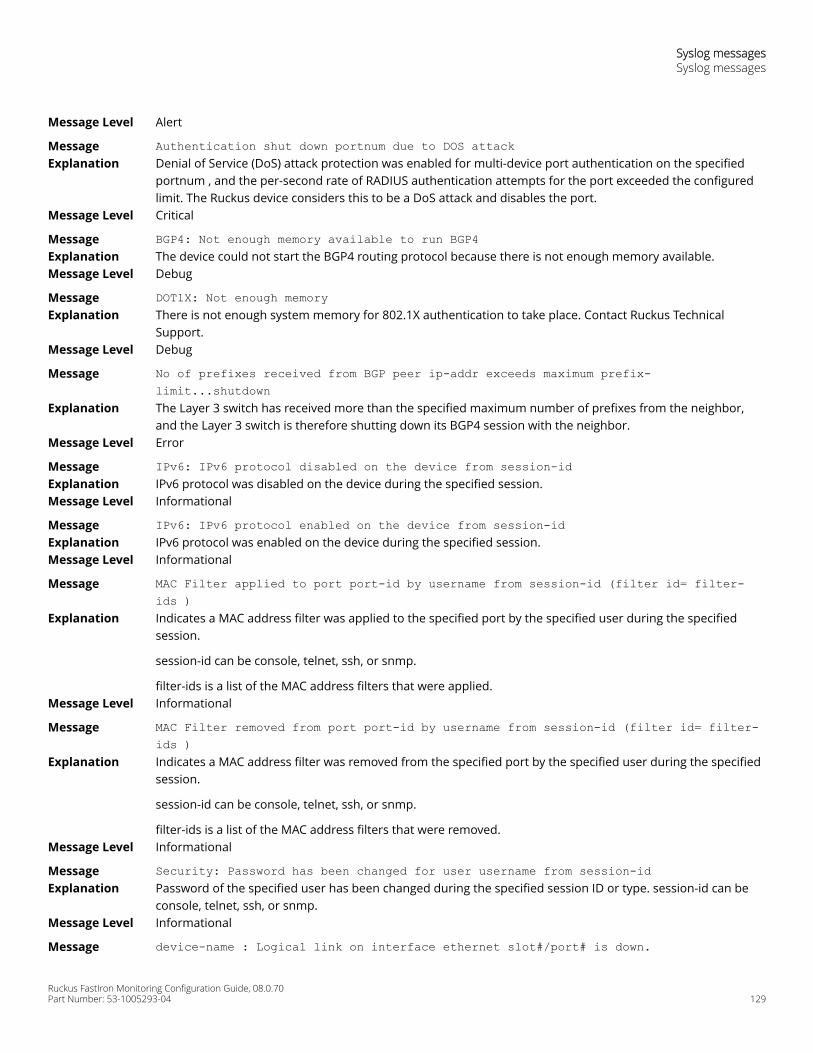
Message Level Alert
Message Authentication shut down portnum due to DOS attackExplanation Denial of Service (DoS) attack protection was enabled for multi-device port authentication on the specified
portnum , and the per-second rate of RADIUS authentication attempts for the port exceeded the configuredlimit. The Ruckus device considers this to be a DoS attack and disables the port.
Message Level Critical
Message BGP4: Not enough memory available to run BGP4Explanation The device could not start the BGP4 routing protocol because there is not enough memory available.Message Level Debug
Message DOT1X: Not enough memoryExplanation There is not enough system memory for 802.1X authentication to take place. Contact Ruckus Technical
Support.Message Level Debug
Message No of prefixes received from BGP peer ip-addr exceeds maximum prefix-limit...shutdown
Explanation The Layer 3 switch has received more than the specified maximum number of prefixes from the neighbor,and the Layer 3 switch is therefore shutting down its BGP4 session with the neighbor.
Message Level Error
Message IPv6: IPv6 protocol disabled on the device from session-idExplanation IPv6 protocol was disabled on the device during the specified session.Message Level Informational
Message IPv6: IPv6 protocol enabled on the device from session-idExplanation IPv6 protocol was enabled on the device during the specified session.Message Level Informational
Message MAC Filter applied to port port-id by username from session-id (filter id= filter-ids )
Explanation Indicates a MAC address filter was applied to the specified port by the specified user during the specifiedsession.
session-id can be console, telnet, ssh, or snmp.
filter-ids is a list of the MAC address filters that were applied.Message Level Informational
Message MAC Filter removed from port port-id by username from session-id (filter id= filter-ids )
Explanation Indicates a MAC address filter was removed from the specified port by the specified user during the specifiedsession.
session-id can be console, telnet, ssh, or snmp.
filter-ids is a list of the MAC address filters that were removed.Message Level Informational
Message Security: Password has been changed for user username from session-idExplanation Password of the specified user has been changed during the specified session ID or type. session-id can be
console, telnet, ssh, or snmp.Message Level Informational
Message device-name : Logical link on interface ethernet slot#/port# is down.
Syslog messagesSyslog messages
Ruckus FastIron Monitoring Configuration Guide, 08.0.70Part Number: 53-1005293-04 129

Explanation The specified ports were logically brought down while singleton was configured on the port.Message Level Informational
Message device-name : Logical link on interface ethernet slot#/port# is up.Explanation The specified ports were logically brought up while singleton was configured on the port.Message Level Informational
Message user-name login to PRIVILEGED modeExplanation A user has logged into the Privileged exec mode of the CLI.
The user-name is the user name.Message Level Informational
Message user-name login to USER EXEC modeExplanation A user has logged into the User exec mode of the CLI.
The user-name is the user name.Message Level Informational
Message user-name logout from PRIVILEGED modeExplanation A user has logged out of Privileged exec mode of the CLI.
The user-name is the user name.Message Level Informational
Message user-name logout from USER EXEC modeExplanation A user has logged out of the User exec mode of the CLI.
The user-name is the user name.Message Level Informational
Message ACL ACL id added | deleted | modified from console | telnet | ssh| snmp sessionExplanation A user created, modified, deleted, or applied an ACL through an SNMP, console, SSH, or Telnet session.Message Level Informational
Message Bridge is new root, vlan vlan-id , root ID root-idExplanation A Spanning Tree Protocol (STP) topology change has occurred, resulting in the Ruckus device becoming the
root bridge.
The vlan-id is the ID of the VLAN in which the STP topology change occurred.
The root-id is the STP bridge root ID.Message Level Informational
Message Bridge root changed, vlan vlan-id , new root ID string , root interface portnumExplanation A Spanning Tree Protocol (STP) topology change has occurred.
The vlan-id is the ID of the VLAN in which the STP topology change occurred.
The root-id is the STP bridge root ID.
The portnum is the number of the port connected to the new root bridge.Message Level Informational
Message Bridge topology change, vlan vlan-id , interface portnum , changed state to stp-state
Explanation A Spanning Tree Protocol (STP) topology change has occurred on a port.
The vlan-id is the ID of the VLAN in which the STP topology change occurred.
Syslog messagesSyslog messages
Ruckus FastIron Monitoring Configuration Guide, 08.0.70130 Part Number: 53-1005293-04
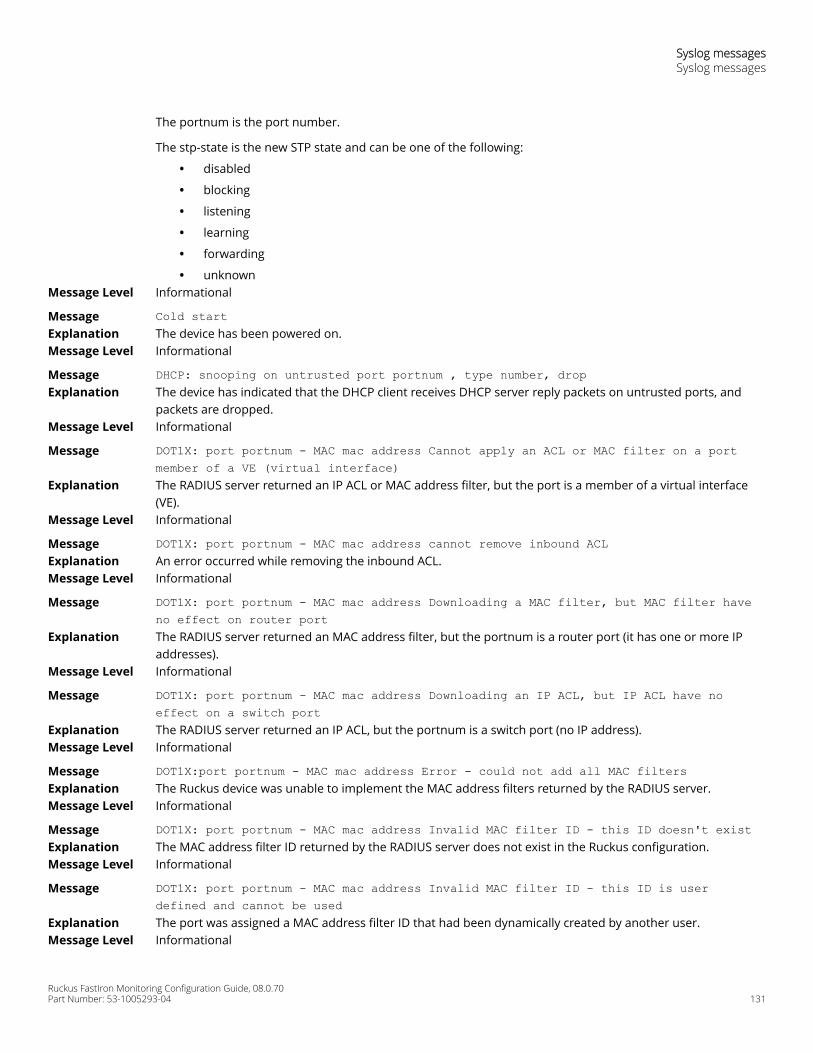
The portnum is the port number.
The stp-state is the new STP state and can be one of the following:
• disabled
• blocking
• listening
• learning
• forwarding
• unknownMessage Level Informational
Message Cold startExplanation The device has been powered on.Message Level Informational
Message DHCP: snooping on untrusted port portnum , type number, dropExplanation The device has indicated that the DHCP client receives DHCP server reply packets on untrusted ports, and
packets are dropped.Message Level Informational
Message DOT1X: port portnum - MAC mac address Cannot apply an ACL or MAC filter on a portmember of a VE (virtual interface)
Explanation The RADIUS server returned an IP ACL or MAC address filter, but the port is a member of a virtual interface(VE).
Message Level Informational
Message DOT1X: port portnum - MAC mac address cannot remove inbound ACLExplanation An error occurred while removing the inbound ACL.Message Level Informational
Message DOT1X: port portnum - MAC mac address Downloading a MAC filter, but MAC filter haveno effect on router port
Explanation The RADIUS server returned an MAC address filter, but the portnum is a router port (it has one or more IPaddresses).
Message Level Informational
Message DOT1X: port portnum - MAC mac address Downloading an IP ACL, but IP ACL have noeffect on a switch port
Explanation The RADIUS server returned an IP ACL, but the portnum is a switch port (no IP address).Message Level Informational
Message DOT1X:port portnum - MAC mac address Error - could not add all MAC filtersExplanation The Ruckus device was unable to implement the MAC address filters returned by the RADIUS server.Message Level Informational
Message DOT1X: port portnum - MAC mac address Invalid MAC filter ID - this ID doesn't existExplanation The MAC address filter ID returned by the RADIUS server does not exist in the Ruckus configuration.Message Level Informational
Message DOT1X: port portnum - MAC mac address Invalid MAC filter ID - this ID is userdefined and cannot be used
Explanation The port was assigned a MAC address filter ID that had been dynamically created by another user.Message Level Informational
Syslog messagesSyslog messages
Ruckus FastIron Monitoring Configuration Guide, 08.0.70Part Number: 53-1005293-04 131
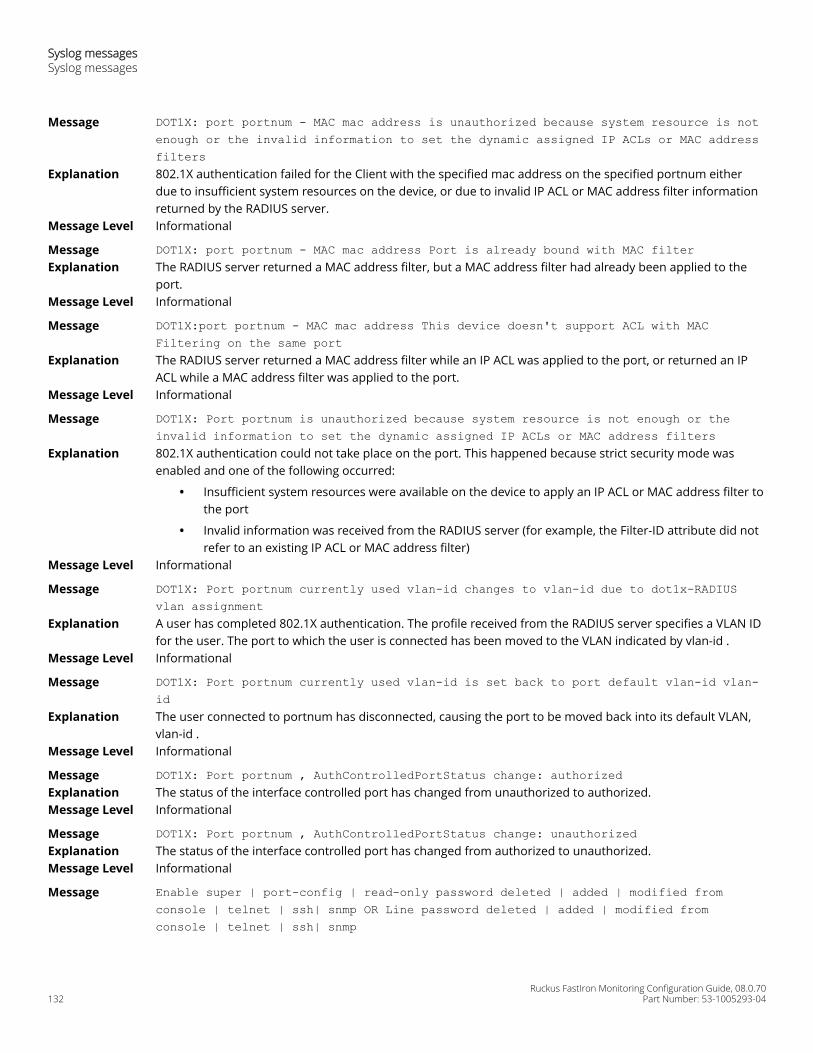
Message DOT1X: port portnum - MAC mac address is unauthorized because system resource is notenough or the invalid information to set the dynamic assigned IP ACLs or MAC addressfilters
Explanation 802.1X authentication failed for the Client with the specified mac address on the specified portnum eitherdue to insufficient system resources on the device, or due to invalid IP ACL or MAC address filter informationreturned by the RADIUS server.
Message Level Informational
Message DOT1X: port portnum - MAC mac address Port is already bound with MAC filterExplanation The RADIUS server returned a MAC address filter, but a MAC address filter had already been applied to the
port.Message Level Informational
Message DOT1X:port portnum - MAC mac address This device doesn't support ACL with MACFiltering on the same port
Explanation The RADIUS server returned a MAC address filter while an IP ACL was applied to the port, or returned an IPACL while a MAC address filter was applied to the port.
Message Level Informational
Message DOT1X: Port portnum is unauthorized because system resource is not enough or theinvalid information to set the dynamic assigned IP ACLs or MAC address filters
Explanation 802.1X authentication could not take place on the port. This happened because strict security mode wasenabled and one of the following occurred:
• Insufficient system resources were available on the device to apply an IP ACL or MAC address filter tothe port
• Invalid information was received from the RADIUS server (for example, the Filter-ID attribute did notrefer to an existing IP ACL or MAC address filter)
Message Level Informational
Message DOT1X: Port portnum currently used vlan-id changes to vlan-id due to dot1x-RADIUSvlan assignment
Explanation A user has completed 802.1X authentication. The profile received from the RADIUS server specifies a VLAN IDfor the user. The port to which the user is connected has been moved to the VLAN indicated by vlan-id .
Message Level Informational
Message DOT1X: Port portnum currently used vlan-id is set back to port default vlan-id vlan-id
Explanation The user connected to portnum has disconnected, causing the port to be moved back into its default VLAN,vlan-id .
Message Level Informational
Message DOT1X: Port portnum , AuthControlledPortStatus change: authorizedExplanation The status of the interface controlled port has changed from unauthorized to authorized.Message Level Informational
Message DOT1X: Port portnum , AuthControlledPortStatus change: unauthorizedExplanation The status of the interface controlled port has changed from authorized to unauthorized.Message Level Informational
Message Enable super | port-config | read-only password deleted | added | modified fromconsole | telnet | ssh| snmp OR Line password deleted | added | modified fromconsole | telnet | ssh| snmp
Syslog messagesSyslog messages
Ruckus FastIron Monitoring Configuration Guide, 08.0.70132 Part Number: 53-1005293-04
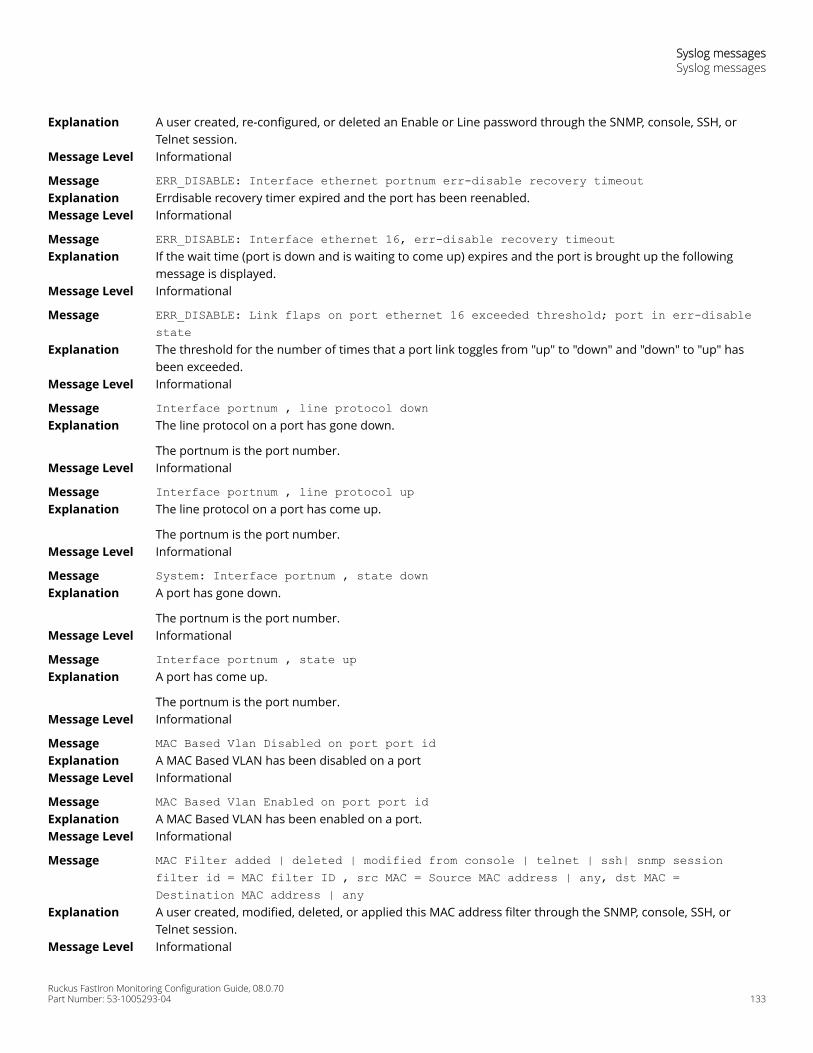
Explanation A user created, re-configured, or deleted an Enable or Line password through the SNMP, console, SSH, orTelnet session.
Message Level Informational
Message ERR_DISABLE: Interface ethernet portnum err-disable recovery timeoutExplanation Errdisable recovery timer expired and the port has been reenabled.Message Level Informational
Message ERR_DISABLE: Interface ethernet 16, err-disable recovery timeoutExplanation If the wait time (port is down and is waiting to come up) expires and the port is brought up the following
message is displayed.Message Level Informational
Message ERR_DISABLE: Link flaps on port ethernet 16 exceeded threshold; port in err-disablestate
Explanation The threshold for the number of times that a port link toggles from "up" to "down" and "down" to "up" hasbeen exceeded.
Message Level Informational
Message Interface portnum , line protocol downExplanation The line protocol on a port has gone down.
The portnum is the port number.Message Level Informational
Message Interface portnum , line protocol upExplanation The line protocol on a port has come up.
The portnum is the port number.Message Level Informational
Message System: Interface portnum , state downExplanation A port has gone down.
The portnum is the port number.Message Level Informational
Message Interface portnum , state upExplanation A port has come up.
The portnum is the port number.Message Level Informational
Message MAC Based Vlan Disabled on port port idExplanation A MAC Based VLAN has been disabled on a portMessage Level Informational
Message MAC Based Vlan Enabled on port port idExplanation A MAC Based VLAN has been enabled on a port.Message Level Informational
Message MAC Filter added | deleted | modified from console | telnet | ssh| snmp sessionfilter id = MAC filter ID , src MAC = Source MAC address | any, dst MAC =Destination MAC address | any
Explanation A user created, modified, deleted, or applied this MAC address filter through the SNMP, console, SSH, orTelnet session.
Message Level Informational
Syslog messagesSyslog messages
Ruckus FastIron Monitoring Configuration Guide, 08.0.70Part Number: 53-1005293-04 133
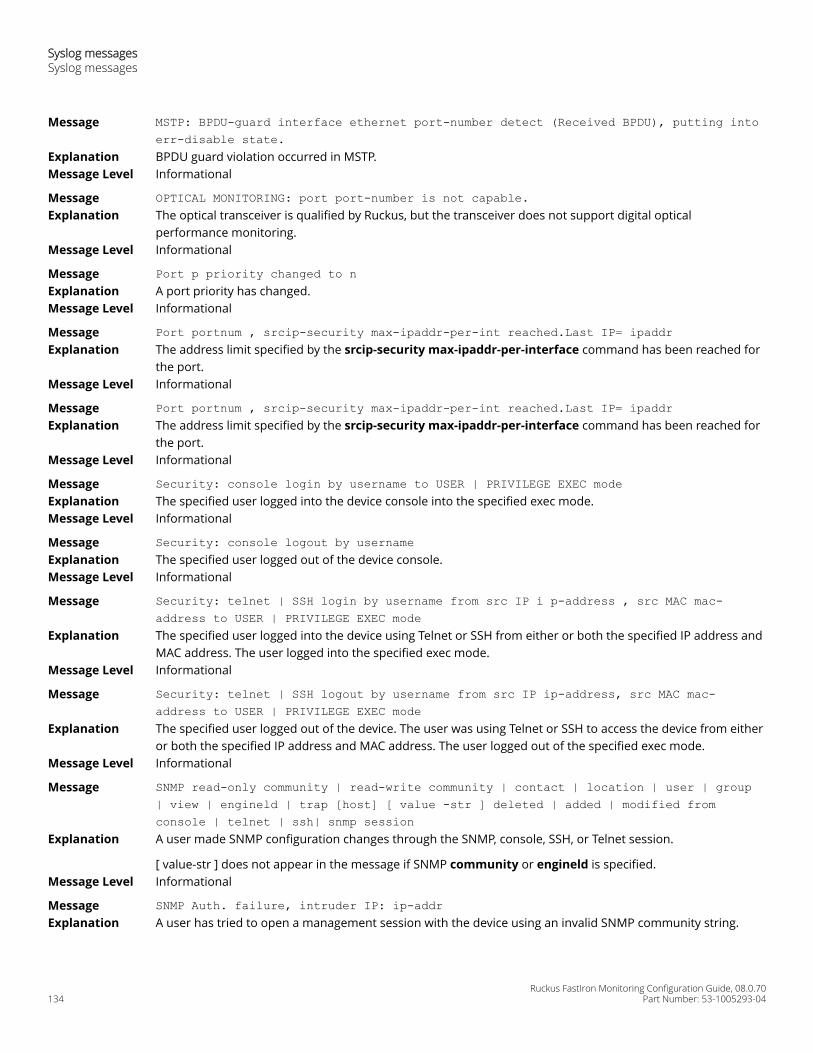
Message MSTP: BPDU-guard interface ethernet port-number detect (Received BPDU), putting intoerr-disable state.
Explanation BPDU guard violation occurred in MSTP.Message Level Informational
Message OPTICAL MONITORING: port port-number is not capable.Explanation The optical transceiver is qualified by Ruckus, but the transceiver does not support digital optical
performance monitoring.Message Level Informational
Message Port p priority changed to nExplanation A port priority has changed.Message Level Informational
Message Port portnum , srcip-security max-ipaddr-per-int reached.Last IP= ipaddrExplanation The address limit specified by the srcip-security max-ipaddr-per-interface command has been reached for
the port.Message Level Informational
Message Port portnum , srcip-security max-ipaddr-per-int reached.Last IP= ipaddrExplanation The address limit specified by the srcip-security max-ipaddr-per-interface command has been reached for
the port.Message Level Informational
Message Security: console login by username to USER | PRIVILEGE EXEC modeExplanation The specified user logged into the device console into the specified exec mode.Message Level Informational
Message Security: console logout by usernameExplanation The specified user logged out of the device console.Message Level Informational
Message Security: telnet | SSH login by username from src IP i p-address , src MAC mac-address to USER | PRIVILEGE EXEC mode
Explanation The specified user logged into the device using Telnet or SSH from either or both the specified IP address andMAC address. The user logged into the specified exec mode.
Message Level Informational
Message Security: telnet | SSH logout by username from src IP ip-address, src MAC mac-address to USER | PRIVILEGE EXEC mode
Explanation The specified user logged out of the device. The user was using Telnet or SSH to access the device from eitheror both the specified IP address and MAC address. The user logged out of the specified exec mode.
Message Level Informational
Message SNMP read-only community | read-write community | contact | location | user | group| view | engineld | trap [host] [ value -str ] deleted | added | modified fromconsole | telnet | ssh| snmp session
Explanation A user made SNMP configuration changes through the SNMP, console, SSH, or Telnet session.
[ value-str ] does not appear in the message if SNMP community or engineld is specified.Message Level Informational
Message SNMP Auth. failure, intruder IP: ip-addrExplanation A user has tried to open a management session with the device using an invalid SNMP community string.
Syslog messagesSyslog messages
Ruckus FastIron Monitoring Configuration Guide, 08.0.70134 Part Number: 53-1005293-04
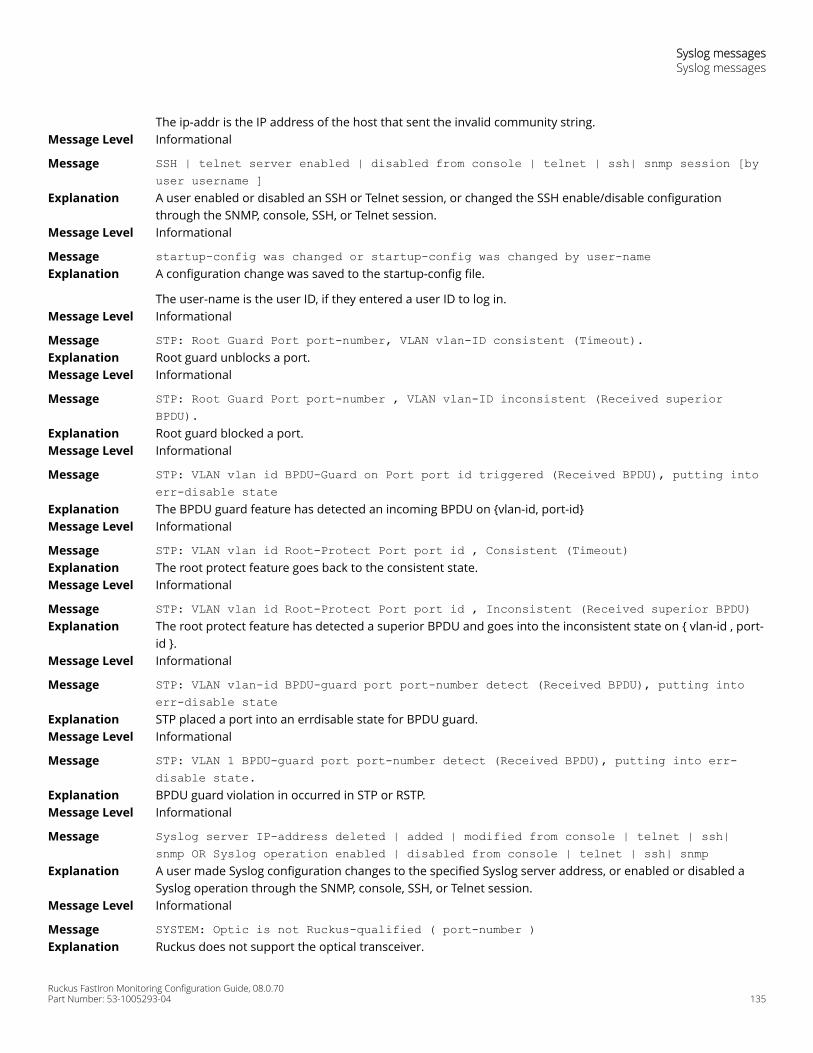
The ip-addr is the IP address of the host that sent the invalid community string.Message Level Informational
Message SSH | telnet server enabled | disabled from console | telnet | ssh| snmp session [byuser username ]
Explanation A user enabled or disabled an SSH or Telnet session, or changed the SSH enable/disable configurationthrough the SNMP, console, SSH, or Telnet session.
Message Level Informational
Message startup-config was changed or startup-config was changed by user-nameExplanation A configuration change was saved to the startup-config file.
The user-name is the user ID, if they entered a user ID to log in.Message Level Informational
Message STP: Root Guard Port port-number, VLAN vlan-ID consistent (Timeout).Explanation Root guard unblocks a port.Message Level Informational
Message STP: Root Guard Port port-number , VLAN vlan-ID inconsistent (Received superiorBPDU).
Explanation Root guard blocked a port.Message Level Informational
Message STP: VLAN vlan id BPDU-Guard on Port port id triggered (Received BPDU), putting intoerr-disable state
Explanation The BPDU guard feature has detected an incoming BPDU on {vlan-id, port-id}Message Level Informational
Message STP: VLAN vlan id Root-Protect Port port id , Consistent (Timeout)Explanation The root protect feature goes back to the consistent state.Message Level Informational
Message STP: VLAN vlan id Root-Protect Port port id , Inconsistent (Received superior BPDU)Explanation The root protect feature has detected a superior BPDU and goes into the inconsistent state on { vlan-id , port-
id }.Message Level Informational
Message STP: VLAN vlan-id BPDU-guard port port-number detect (Received BPDU), putting intoerr-disable state
Explanation STP placed a port into an errdisable state for BPDU guard.Message Level Informational
Message STP: VLAN 1 BPDU-guard port port-number detect (Received BPDU), putting into err-disable state.
Explanation BPDU guard violation in occurred in STP or RSTP.Message Level Informational
Message Syslog server IP-address deleted | added | modified from console | telnet | ssh|snmp OR Syslog operation enabled | disabled from console | telnet | ssh| snmp
Explanation A user made Syslog configuration changes to the specified Syslog server address, or enabled or disabled aSyslog operation through the SNMP, console, SSH, or Telnet session.
Message Level Informational
Message SYSTEM: Optic is not Ruckus-qualified ( port-number )Explanation Ruckus does not support the optical transceiver.
Syslog messagesSyslog messages
Ruckus FastIron Monitoring Configuration Guide, 08.0.70Part Number: 53-1005293-04 135
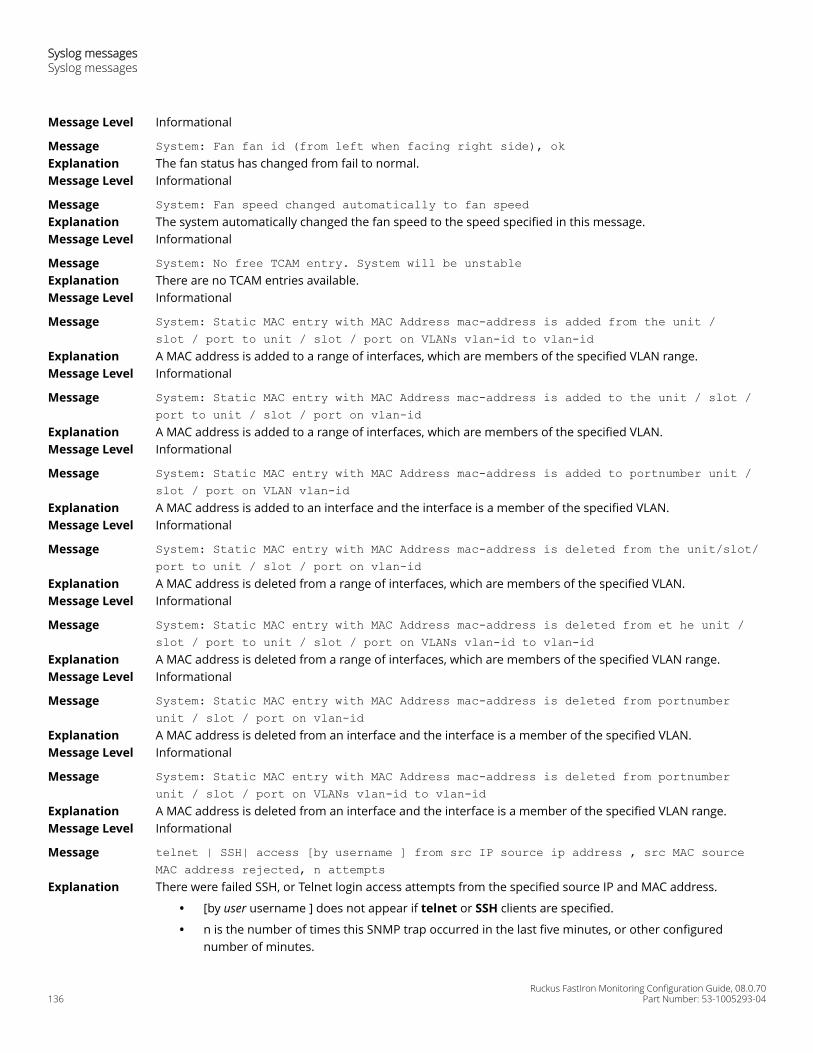
Message Level Informational
Message System: Fan fan id (from left when facing right side), okExplanation The fan status has changed from fail to normal.Message Level Informational
Message System: Fan speed changed automatically to fan speedExplanation The system automatically changed the fan speed to the speed specified in this message.Message Level Informational
Message System: No free TCAM entry. System will be unstableExplanation There are no TCAM entries available.Message Level Informational
Message System: Static MAC entry with MAC Address mac-address is added from the unit /slot / port to unit / slot / port on VLANs vlan-id to vlan-id
Explanation A MAC address is added to a range of interfaces, which are members of the specified VLAN range.Message Level Informational
Message System: Static MAC entry with MAC Address mac-address is added to the unit / slot /port to unit / slot / port on vlan-id
Explanation A MAC address is added to a range of interfaces, which are members of the specified VLAN.Message Level Informational
Message System: Static MAC entry with MAC Address mac-address is added to portnumber unit /slot / port on VLAN vlan-id
Explanation A MAC address is added to an interface and the interface is a member of the specified VLAN.Message Level Informational
Message System: Static MAC entry with MAC Address mac-address is deleted from the unit/slot/port to unit / slot / port on vlan-id
Explanation A MAC address is deleted from a range of interfaces, which are members of the specified VLAN.Message Level Informational
Message System: Static MAC entry with MAC Address mac-address is deleted from et he unit /slot / port to unit / slot / port on VLANs vlan-id to vlan-id
Explanation A MAC address is deleted from a range of interfaces, which are members of the specified VLAN range.Message Level Informational
Message System: Static MAC entry with MAC Address mac-address is deleted from portnumberunit / slot / port on vlan-id
Explanation A MAC address is deleted from an interface and the interface is a member of the specified VLAN.Message Level Informational
Message System: Static MAC entry with MAC Address mac-address is deleted from portnumberunit / slot / port on VLANs vlan-id to vlan-id
Explanation A MAC address is deleted from an interface and the interface is a member of the specified VLAN range.Message Level Informational
Message telnet | SSH| access [by username ] from src IP source ip address , src MAC sourceMAC address rejected, n attempts
Explanation There were failed SSH, or Telnet login access attempts from the specified source IP and MAC address.
• [by user username ] does not appear if telnet or SSH clients are specified.
• n is the number of times this SNMP trap occurred in the last five minutes, or other configurednumber of minutes.
Syslog messagesSyslog messages
Ruckus FastIron Monitoring Configuration Guide, 08.0.70136 Part Number: 53-1005293-04

Message Level Informational
Message Trunk group ( ports ) created by 802.3ad link-aggregation module.Explanation 802.3ad link aggregation is configured on the device, and the feature has dynamically created a trunk group
(aggregate link).
The ports variable is a list of the ports that were aggregated to make the trunk group.Message Level Informational
Message user username added | deleted | modified from console | telnet | ssh| snmpExplanation A user created, modified, or deleted a local user account through the SNMP, console, SSH, or Telnet session.Message Level Informational
Message vlan vlan id added | deleted | modified from console | telnet | ssh| snmp sessionExplanation A user created, modified, or deleted a VLAN through the SNMP, console, SSH, or Telnet session.Message Level Informational
Message Warm startExplanation The system software (flash code) has been reloaded.Message Level Informational
Message Stack: Stack unit unit# has been deleted to the stack systemExplanation The specified unit has been deleted from the stacking system.Message Level Informational
Message Stack unit unitNumber has been elected as ACTIVE unit of the stack systemExplanation The specified unit in a stack has been elected as the Master unit for the stacking system.Message Level Informational
Message Stack: Stack unit unit# has been added to the stack systemExplanation The specified unit has been added to the stacking system.Message Level Informational
Message System: Management MAC address changed to mac_addressExplanation The management MAC address of a stacking system has been changedMessage Level Informational
Message System: Stack unit unit# Fan fan# ( description ), failedExplanation The operational status of a fan in the specified unit in a stack changed from normal to failure.Message Level Informational
Message System: Stack unit unit# Power supply power-supply# is downExplanation The operational status of a power supply of the specified unit in a stack changed from normal to failure.Message Level Informational
Message System: Stack unit unit# Power supply power-supply# is upExplanation The operational status of a power supply of the specified unit in a stack changed from failure to normal.Message Level Informational
Message System: Stack unit unit# Fan fan# ( description ), okExplanation The operational status of a fan in the specified unit in a stack changed from failure to normal.Message Level Informational
Message System: Stack unit unitNumbe r Temperature actual-temp C degrees, warning levelwarning-temp C degrees, shutdown level shutdown-temp C degrees
Explanation The actual temperature reading for a unit in a stack is above the warning temperature threshold.Message Level Informational
Syslog messagesSyslog messages
Ruckus FastIron Monitoring Configuration Guide, 08.0.70Part Number: 53-1005293-04 137

Message vlan vlan-id Bridge is RootBridge mac-address (MgmtPriChg)Explanation 802.1W changed the current bridge to be the root bridge of the given topology due to administrative change
in bridge priority.Message Level Informational
Message vlan vlan-id Bridge is RootBridge mac-address (MsgAgeExpiry)Explanation The message age expired on the Root port so 802.1W changed the current bridge to be the root bridge of the
topology.Message Level Informational
Message vlan vlan-id interface portnum Bridge TC Event (DOT1wTransition)Explanation 802.1W recognized a topology change event in the bridge. The topology change event is the forwarding action
that started on a non-edge Designated port or Root port.Message Level Informational
Message vlan vlan-id interface portnum STP state - state (DOT1wTransition)Explanation 802.1W changed the state of a port to a new state: forwarding, learning, blocking. If the port changes to
blocking, the bridge port is in discarding state.Message Level Informational
Message vlan vlan-id New RootBridge mac-address RootPort portnum (BpduRcvd)Explanation 802.1W selected a new root bridge as a result of the BPDUs received on a bridge port.Message Level Informational
Message vlan vlan-id New RootPort portnum (RootSelection)Explanation 802.1W changed the port role to Root port, using the root selection computation.Message Level Informational
Message ACL exceed max DMA L4 cam resource, using flow based ACL insteadExplanation The port does not have enough Layer 4 CAM entries for the ACL.
To correct this condition, allocate more Layer 4 CAM entries. To allocate more Layer 4 CAM entries, enter thefollowing command at the CLI configuration level for the interface:
ip access-group max-l4-cam numMessage Level Notification
Message ACL insufficient L4 cam resource, using flow based ACL insteadExplanation The port does not have a large enough CAM partition for the ACLsMessage Level Notification
Message ACL insufficient L4 session resource, using flow based ACL insteadExplanation The device does not have enough Layer 4 session entries.
To correct this condition, allocate more memory for sessions. To allocate more memory, enter the followingcommand from the global configuration mode of the CLI interface:
system-max session-limit numMessage Level Notification
Message ACL port fragment packet inspect rate rate exceeded on port portnumExplanation The fragment rate allowed on an individual interface has been exceeded.
The rate indicates the maximum rate allowed.
The portnum indicates the port.
This message can occur if fragment thottling is enabled.
Syslog messagesSyslog messages
Ruckus FastIron Monitoring Configuration Guide, 08.0.70138 Part Number: 53-1005293-04
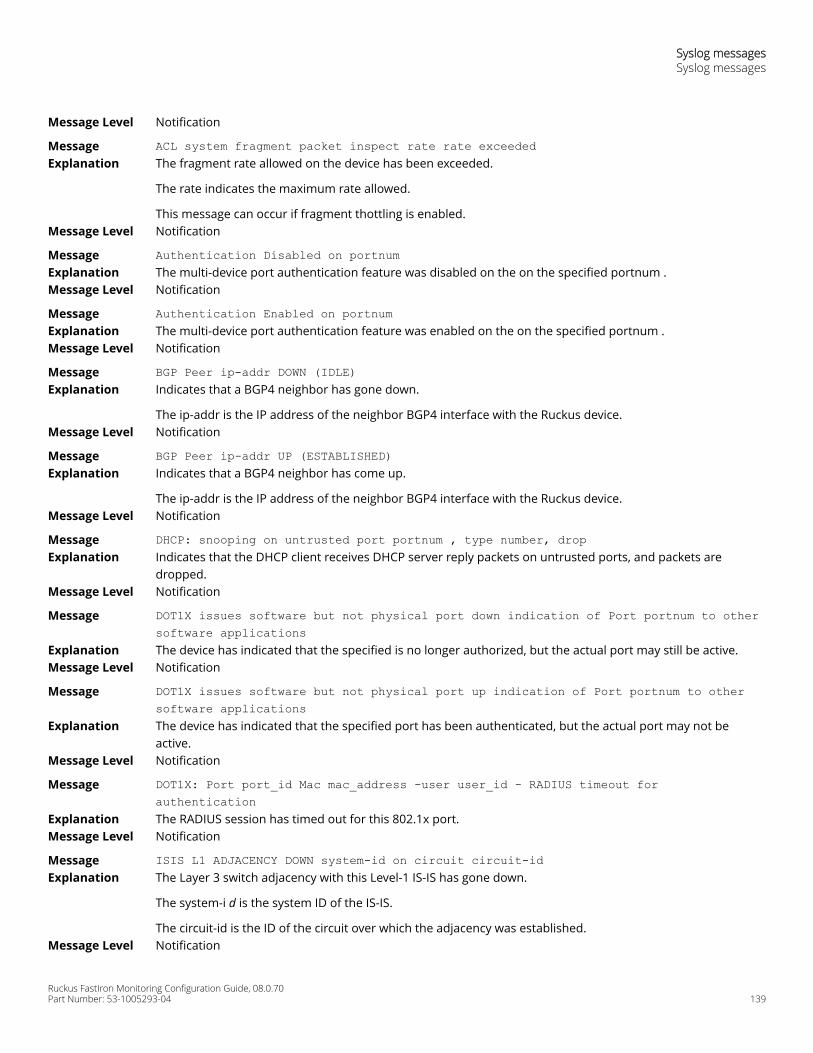
Message Level Notification
Message ACL system fragment packet inspect rate rate exceededExplanation The fragment rate allowed on the device has been exceeded.
The rate indicates the maximum rate allowed.
This message can occur if fragment thottling is enabled.Message Level Notification
Message Authentication Disabled on portnumExplanation The multi-device port authentication feature was disabled on the on the specified portnum .Message Level Notification
Message Authentication Enabled on portnumExplanation The multi-device port authentication feature was enabled on the on the specified portnum .Message Level Notification
Message BGP Peer ip-addr DOWN (IDLE)Explanation Indicates that a BGP4 neighbor has gone down.
The ip-addr is the IP address of the neighbor BGP4 interface with the Ruckus device.Message Level Notification
Message BGP Peer ip-addr UP (ESTABLISHED)Explanation Indicates that a BGP4 neighbor has come up.
The ip-addr is the IP address of the neighbor BGP4 interface with the Ruckus device.Message Level Notification
Message DHCP: snooping on untrusted port portnum , type number, dropExplanation Indicates that the DHCP client receives DHCP server reply packets on untrusted ports, and packets are
dropped.Message Level Notification
Message DOT1X issues software but not physical port down indication of Port portnum to othersoftware applications
Explanation The device has indicated that the specified is no longer authorized, but the actual port may still be active.Message Level Notification
Message DOT1X issues software but not physical port up indication of Port portnum to othersoftware applications
Explanation The device has indicated that the specified port has been authenticated, but the actual port may not beactive.
Message Level Notification
Message DOT1X: Port port_id Mac mac_address -user user_id - RADIUS timeout forauthentication
Explanation The RADIUS session has timed out for this 802.1x port.Message Level Notification
Message ISIS L1 ADJACENCY DOWN system-id on circuit circuit-idExplanation The Layer 3 switch adjacency with this Level-1 IS-IS has gone down.
The system-i d is the system ID of the IS-IS.
The circuit-id is the ID of the circuit over which the adjacency was established.Message Level Notification
Syslog messagesSyslog messages
Ruckus FastIron Monitoring Configuration Guide, 08.0.70Part Number: 53-1005293-04 139
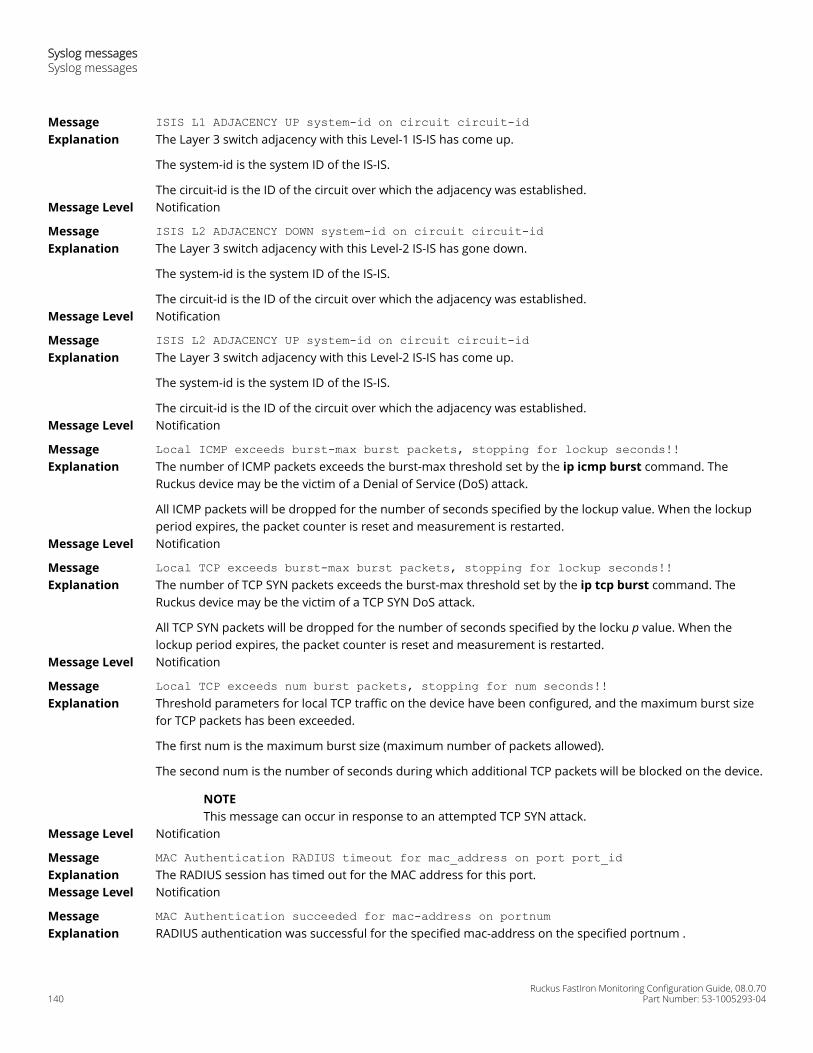
Message ISIS L1 ADJACENCY UP system-id on circuit circuit-idExplanation The Layer 3 switch adjacency with this Level-1 IS-IS has come up.
The system-id is the system ID of the IS-IS.
The circuit-id is the ID of the circuit over which the adjacency was established.Message Level Notification
Message ISIS L2 ADJACENCY DOWN system-id on circuit circuit-idExplanation The Layer 3 switch adjacency with this Level-2 IS-IS has gone down.
The system-id is the system ID of the IS-IS.
The circuit-id is the ID of the circuit over which the adjacency was established.Message Level Notification
Message ISIS L2 ADJACENCY UP system-id on circuit circuit-idExplanation The Layer 3 switch adjacency with this Level-2 IS-IS has come up.
The system-id is the system ID of the IS-IS.
The circuit-id is the ID of the circuit over which the adjacency was established.Message Level Notification
Message Local ICMP exceeds burst-max burst packets, stopping for lockup seconds!!Explanation The number of ICMP packets exceeds the burst-max threshold set by the ip icmp burst command. The
Ruckus device may be the victim of a Denial of Service (DoS) attack.
All ICMP packets will be dropped for the number of seconds specified by the lockup value. When the lockupperiod expires, the packet counter is reset and measurement is restarted.
Message Level Notification
Message Local TCP exceeds burst-max burst packets, stopping for lockup seconds!!Explanation The number of TCP SYN packets exceeds the burst-max threshold set by the ip tcp burst command. The
Ruckus device may be the victim of a TCP SYN DoS attack.
All TCP SYN packets will be dropped for the number of seconds specified by the locku p value. When thelockup period expires, the packet counter is reset and measurement is restarted.
Message Level Notification
Message Local TCP exceeds num burst packets, stopping for num seconds!!Explanation Threshold parameters for local TCP traffic on the device have been configured, and the maximum burst size
for TCP packets has been exceeded.
The first num is the maximum burst size (maximum number of packets allowed).
The second num is the number of seconds during which additional TCP packets will be blocked on the device.
NOTEThis message can occur in response to an attempted TCP SYN attack.
Message Level Notification
Message MAC Authentication RADIUS timeout for mac_address on port port_idExplanation The RADIUS session has timed out for the MAC address for this port.Message Level Notification
Message MAC Authentication succeeded for mac-address on portnumExplanation RADIUS authentication was successful for the specified mac-address on the specified portnum .
Syslog messagesSyslog messages
Ruckus FastIron Monitoring Configuration Guide, 08.0.70140 Part Number: 53-1005293-04
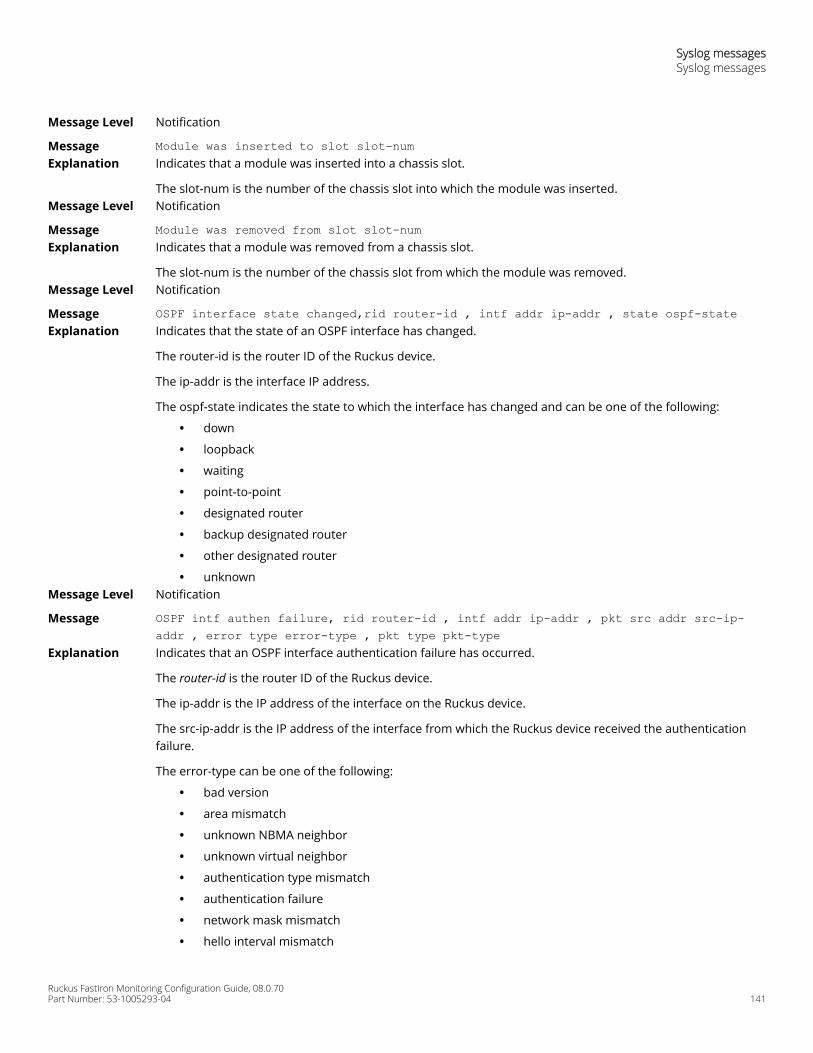
Message Level Notification
Message Module was inserted to slot slot-numExplanation Indicates that a module was inserted into a chassis slot.
The slot-num is the number of the chassis slot into which the module was inserted.Message Level Notification
Message Module was removed from slot slot-numExplanation Indicates that a module was removed from a chassis slot.
The slot-num is the number of the chassis slot from which the module was removed.Message Level Notification
Message OSPF interface state changed,rid router-id , intf addr ip-addr , state ospf-stateExplanation Indicates that the state of an OSPF interface has changed.
The router-id is the router ID of the Ruckus device.
The ip-addr is the interface IP address.
The ospf-state indicates the state to which the interface has changed and can be one of the following:
• down
• loopback
• waiting
• point-to-point
• designated router
• backup designated router
• other designated router
• unknownMessage Level Notification
Message OSPF intf authen failure, rid router-id , intf addr ip-addr , pkt src addr src-ip-addr , error type error-type , pkt type pkt-type
Explanation Indicates that an OSPF interface authentication failure has occurred.
The router-id is the router ID of the Ruckus device.
The ip-addr is the IP address of the interface on the Ruckus device.
The src-ip-addr is the IP address of the interface from which the Ruckus device received the authenticationfailure.
The error-type can be one of the following:
• bad version
• area mismatch
• unknown NBMA neighbor
• unknown virtual neighbor
• authentication type mismatch
• authentication failure
• network mask mismatch
• hello interval mismatch
Syslog messagesSyslog messages
Ruckus FastIron Monitoring Configuration Guide, 08.0.70Part Number: 53-1005293-04 141
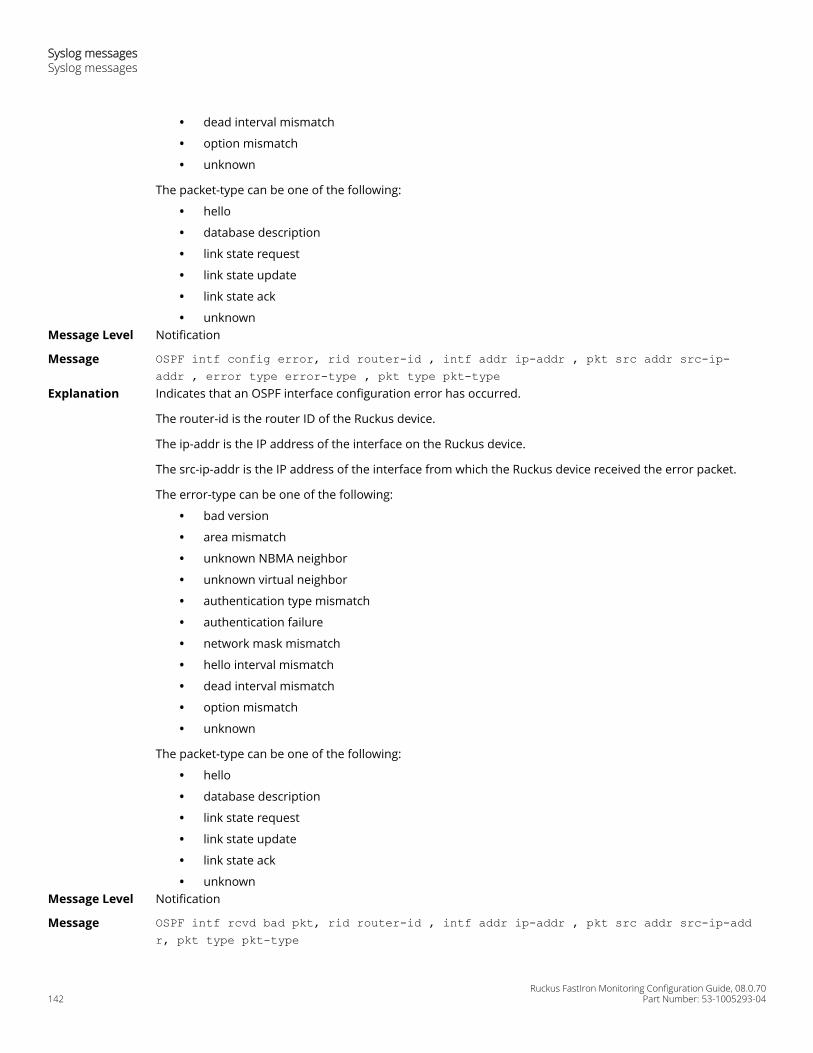
• dead interval mismatch
• option mismatch
• unknown
The packet-type can be one of the following:
• hello
• database description
• link state request
• link state update
• link state ack
• unknownMessage Level Notification
Message OSPF intf config error, rid router-id , intf addr ip-addr , pkt src addr src-ip-addr , error type error-type , pkt type pkt-type
Explanation Indicates that an OSPF interface configuration error has occurred.
The router-id is the router ID of the Ruckus device.
The ip-addr is the IP address of the interface on the Ruckus device.
The src-ip-addr is the IP address of the interface from which the Ruckus device received the error packet.
The error-type can be one of the following:
• bad version
• area mismatch
• unknown NBMA neighbor
• unknown virtual neighbor
• authentication type mismatch
• authentication failure
• network mask mismatch
• hello interval mismatch
• dead interval mismatch
• option mismatch
• unknown
The packet-type can be one of the following:
• hello
• database description
• link state request
• link state update
• link state ack
• unknownMessage Level Notification
Message OSPF intf rcvd bad pkt, rid router-id , intf addr ip-addr , pkt src addr src-ip-addr, pkt type pkt-type
Syslog messagesSyslog messages
Ruckus FastIron Monitoring Configuration Guide, 08.0.70142 Part Number: 53-1005293-04
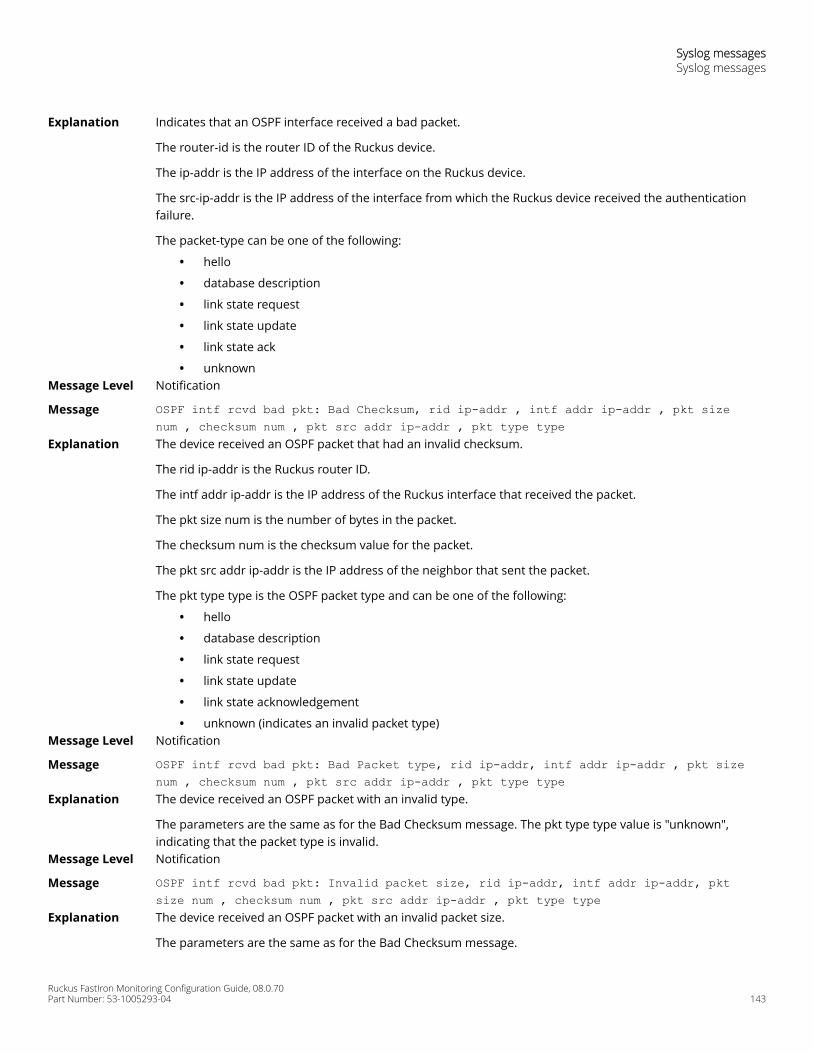
Explanation Indicates that an OSPF interface received a bad packet.
The router-id is the router ID of the Ruckus device.
The ip-addr is the IP address of the interface on the Ruckus device.
The src-ip-addr is the IP address of the interface from which the Ruckus device received the authenticationfailure.
The packet-type can be one of the following:
• hello
• database description
• link state request
• link state update
• link state ack
• unknownMessage Level Notification
Message OSPF intf rcvd bad pkt: Bad Checksum, rid ip-addr , intf addr ip-addr , pkt sizenum , checksum num , pkt src addr ip-addr , pkt type type
Explanation The device received an OSPF packet that had an invalid checksum.
The rid ip-addr is the Ruckus router ID.
The intf addr ip-addr is the IP address of the Ruckus interface that received the packet.
The pkt size num is the number of bytes in the packet.
The checksum num is the checksum value for the packet.
The pkt src addr ip-addr is the IP address of the neighbor that sent the packet.
The pkt type type is the OSPF packet type and can be one of the following:
• hello
• database description
• link state request
• link state update
• link state acknowledgement
• unknown (indicates an invalid packet type)Message Level Notification
Message OSPF intf rcvd bad pkt: Bad Packet type, rid ip-addr, intf addr ip-addr , pkt sizenum , checksum num , pkt src addr ip-addr , pkt type type
Explanation The device received an OSPF packet with an invalid type.
The parameters are the same as for the Bad Checksum message. The pkt type type value is "unknown",indicating that the packet type is invalid.
Message Level Notification
Message OSPF intf rcvd bad pkt: Invalid packet size, rid ip-addr, intf addr ip-addr, pktsize num , checksum num , pkt src addr ip-addr , pkt type type
Explanation The device received an OSPF packet with an invalid packet size.
The parameters are the same as for the Bad Checksum message.
Syslog messagesSyslog messages
Ruckus FastIron Monitoring Configuration Guide, 08.0.70Part Number: 53-1005293-04 143
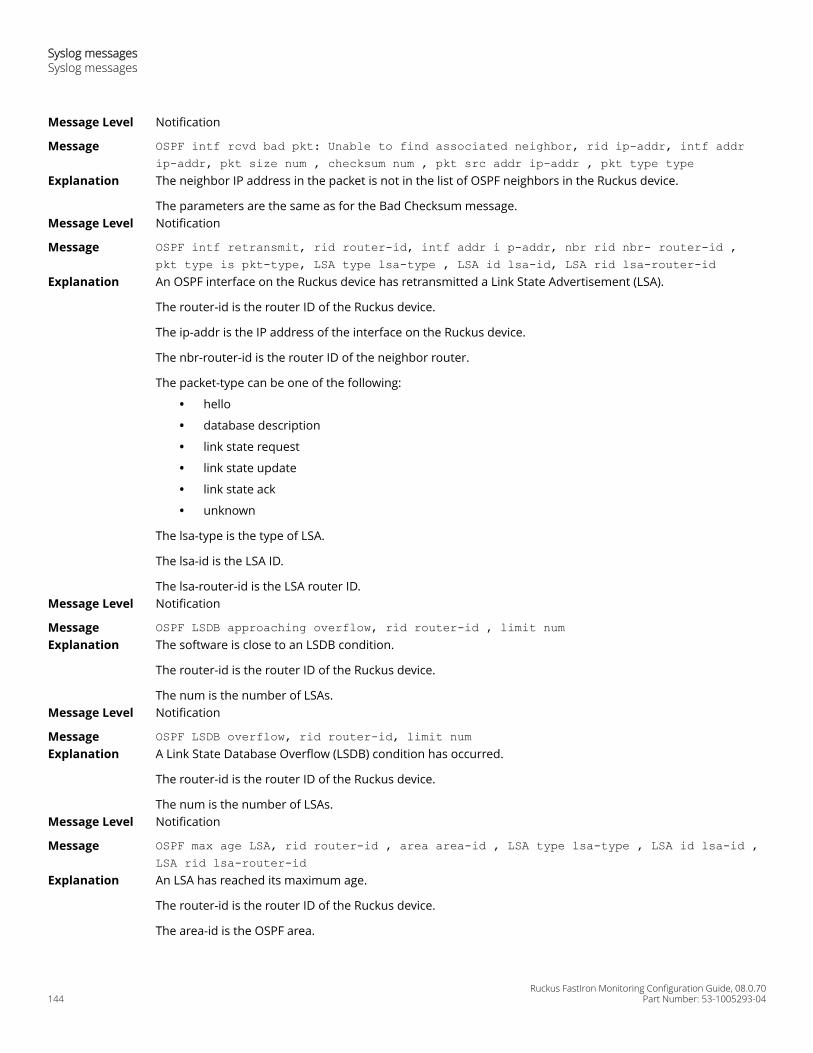
Message Level Notification
Message OSPF intf rcvd bad pkt: Unable to find associated neighbor, rid ip-addr, intf addrip-addr, pkt size num , checksum num , pkt src addr ip-addr , pkt type type
Explanation The neighbor IP address in the packet is not in the list of OSPF neighbors in the Ruckus device.
The parameters are the same as for the Bad Checksum message.Message Level Notification
Message OSPF intf retransmit, rid router-id, intf addr i p-addr, nbr rid nbr- router-id ,pkt type is pkt-type, LSA type lsa-type , LSA id lsa-id, LSA rid lsa-router-id
Explanation An OSPF interface on the Ruckus device has retransmitted a Link State Advertisement (LSA).
The router-id is the router ID of the Ruckus device.
The ip-addr is the IP address of the interface on the Ruckus device.
The nbr-router-id is the router ID of the neighbor router.
The packet-type can be one of the following:
• hello
• database description
• link state request
• link state update
• link state ack
• unknown
The lsa-type is the type of LSA.
The lsa-id is the LSA ID.
The lsa-router-id is the LSA router ID.Message Level Notification
Message OSPF LSDB approaching overflow, rid router-id , limit numExplanation The software is close to an LSDB condition.
The router-id is the router ID of the Ruckus device.
The num is the number of LSAs.Message Level Notification
Message OSPF LSDB overflow, rid router-id, limit numExplanation A Link State Database Overflow (LSDB) condition has occurred.
The router-id is the router ID of the Ruckus device.
The num is the number of LSAs.Message Level Notification
Message OSPF max age LSA, rid router-id , area area-id , LSA type lsa-type , LSA id lsa-id ,LSA rid lsa-router-id
Explanation An LSA has reached its maximum age.
The router-id is the router ID of the Ruckus device.
The area-id is the OSPF area.
Syslog messagesSyslog messages
Ruckus FastIron Monitoring Configuration Guide, 08.0.70144 Part Number: 53-1005293-04
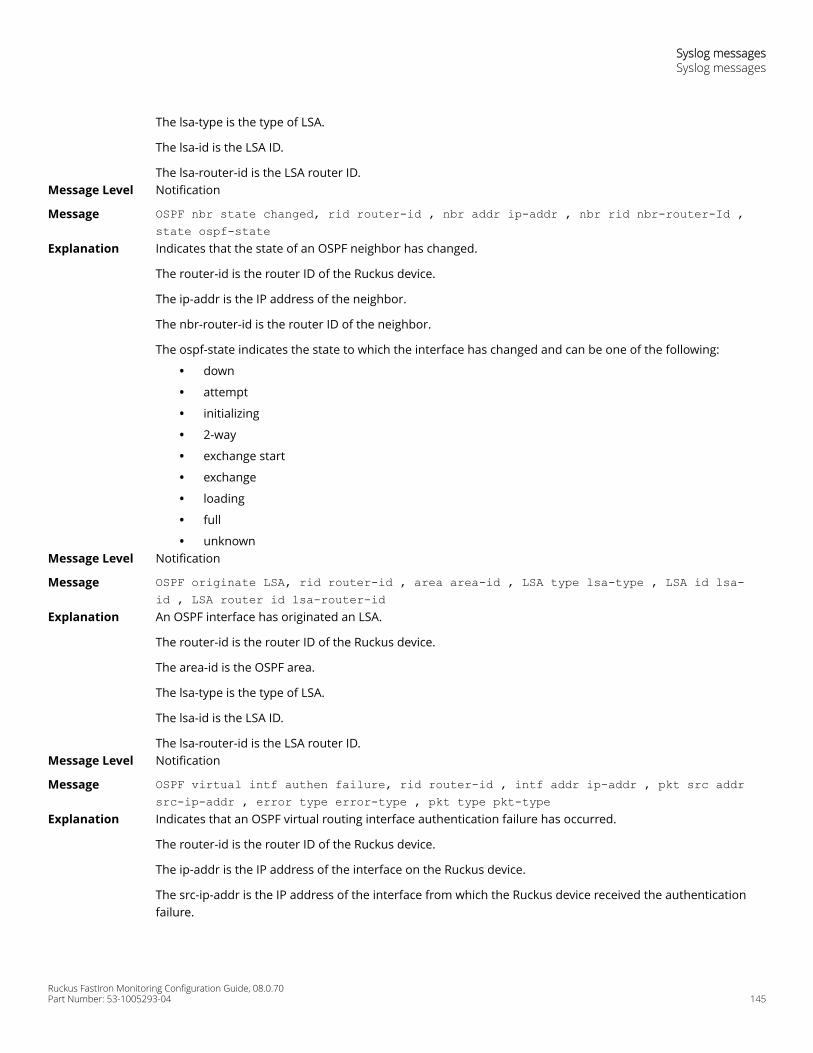
The lsa-type is the type of LSA.
The lsa-id is the LSA ID.
The lsa-router-id is the LSA router ID.Message Level Notification
Message OSPF nbr state changed, rid router-id , nbr addr ip-addr , nbr rid nbr-router-Id ,state ospf-state
Explanation Indicates that the state of an OSPF neighbor has changed.
The router-id is the router ID of the Ruckus device.
The ip-addr is the IP address of the neighbor.
The nbr-router-id is the router ID of the neighbor.
The ospf-state indicates the state to which the interface has changed and can be one of the following:
• down
• attempt
• initializing
• 2-way
• exchange start
• exchange
• loading
• full
• unknownMessage Level Notification
Message OSPF originate LSA, rid router-id , area area-id , LSA type lsa-type , LSA id lsa-id , LSA router id lsa-router-id
Explanation An OSPF interface has originated an LSA.
The router-id is the router ID of the Ruckus device.
The area-id is the OSPF area.
The lsa-type is the type of LSA.
The lsa-id is the LSA ID.
The lsa-router-id is the LSA router ID.Message Level Notification
Message OSPF virtual intf authen failure, rid router-id , intf addr ip-addr , pkt src addrsrc-ip-addr , error type error-type , pkt type pkt-type
Explanation Indicates that an OSPF virtual routing interface authentication failure has occurred.
The router-id is the router ID of the Ruckus device.
The ip-addr is the IP address of the interface on the Ruckus device.
The src-ip-addr is the IP address of the interface from which the Ruckus device received the authenticationfailure.
Syslog messagesSyslog messages
Ruckus FastIron Monitoring Configuration Guide, 08.0.70Part Number: 53-1005293-04 145
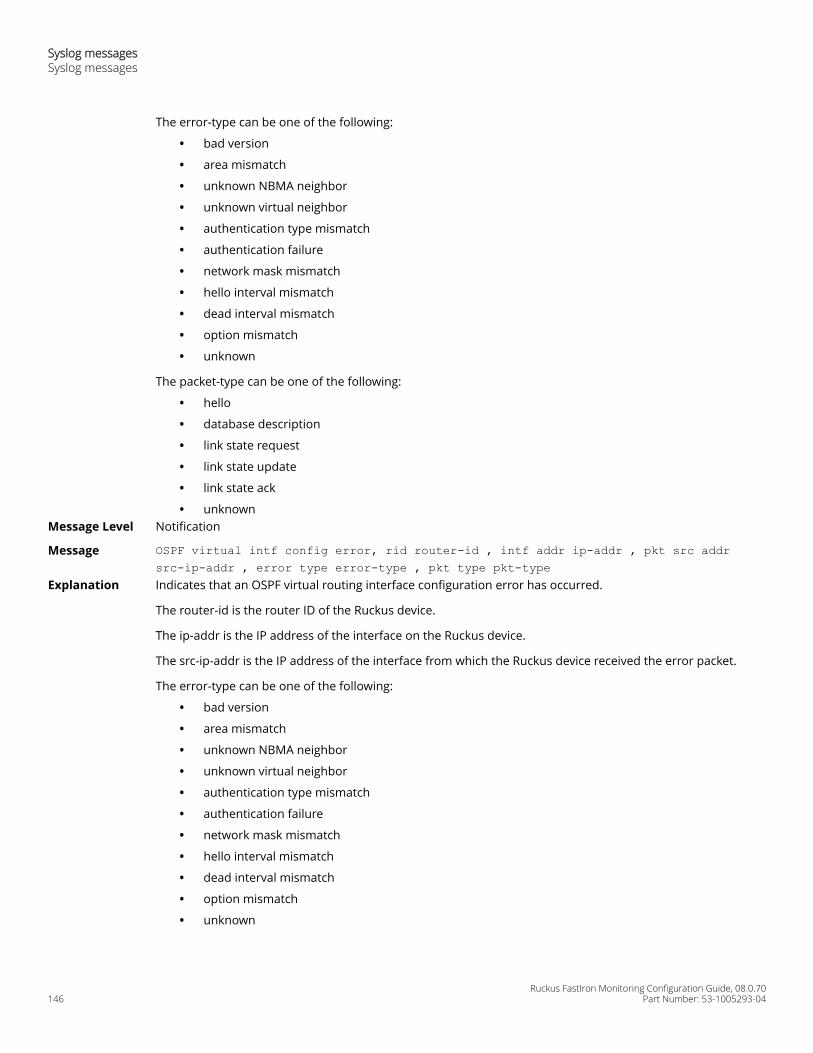
The error-type can be one of the following:
• bad version
• area mismatch
• unknown NBMA neighbor
• unknown virtual neighbor
• authentication type mismatch
• authentication failure
• network mask mismatch
• hello interval mismatch
• dead interval mismatch
• option mismatch
• unknown
The packet-type can be one of the following:
• hello
• database description
• link state request
• link state update
• link state ack
• unknownMessage Level Notification
Message OSPF virtual intf config error, rid router-id , intf addr ip-addr , pkt src addrsrc-ip-addr , error type error-type , pkt type pkt-type
Explanation Indicates that an OSPF virtual routing interface configuration error has occurred.
The router-id is the router ID of the Ruckus device.
The ip-addr is the IP address of the interface on the Ruckus device.
The src-ip-addr is the IP address of the interface from which the Ruckus device received the error packet.
The error-type can be one of the following:
• bad version
• area mismatch
• unknown NBMA neighbor
• unknown virtual neighbor
• authentication type mismatch
• authentication failure
• network mask mismatch
• hello interval mismatch
• dead interval mismatch
• option mismatch
• unknown
Syslog messagesSyslog messages
Ruckus FastIron Monitoring Configuration Guide, 08.0.70146 Part Number: 53-1005293-04
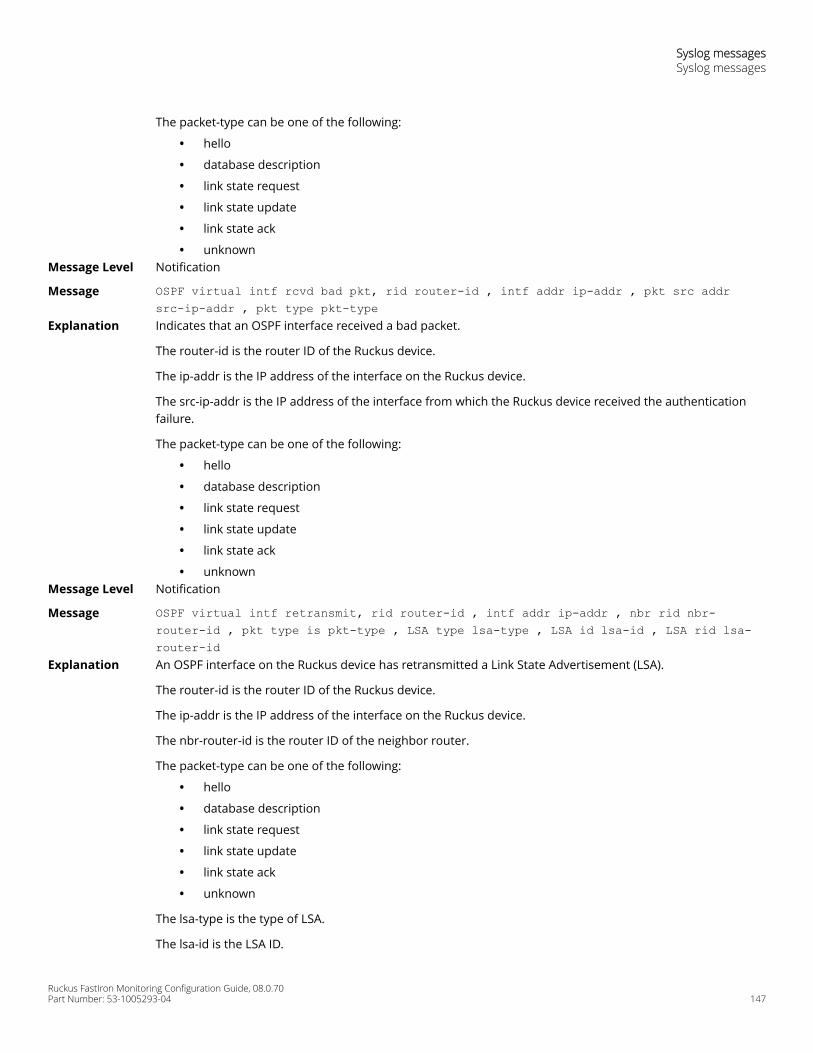
The packet-type can be one of the following:
• hello
• database description
• link state request
• link state update
• link state ack
• unknownMessage Level Notification
Message OSPF virtual intf rcvd bad pkt, rid router-id , intf addr ip-addr , pkt src addrsrc-ip-addr , pkt type pkt-type
Explanation Indicates that an OSPF interface received a bad packet.
The router-id is the router ID of the Ruckus device.
The ip-addr is the IP address of the interface on the Ruckus device.
The src-ip-addr is the IP address of the interface from which the Ruckus device received the authenticationfailure.
The packet-type can be one of the following:
• hello
• database description
• link state request
• link state update
• link state ack
• unknownMessage Level Notification
Message OSPF virtual intf retransmit, rid router-id , intf addr ip-addr , nbr rid nbr-router-id , pkt type is pkt-type , LSA type lsa-type , LSA id lsa-id , LSA rid lsa-router-id
Explanation An OSPF interface on the Ruckus device has retransmitted a Link State Advertisement (LSA).
The router-id is the router ID of the Ruckus device.
The ip-addr is the IP address of the interface on the Ruckus device.
The nbr-router-id is the router ID of the neighbor router.
The packet-type can be one of the following:
• hello
• database description
• link state request
• link state update
• link state ack
• unknown
The lsa-type is the type of LSA.
The lsa-id is the LSA ID.
Syslog messagesSyslog messages
Ruckus FastIron Monitoring Configuration Guide, 08.0.70Part Number: 53-1005293-04 147
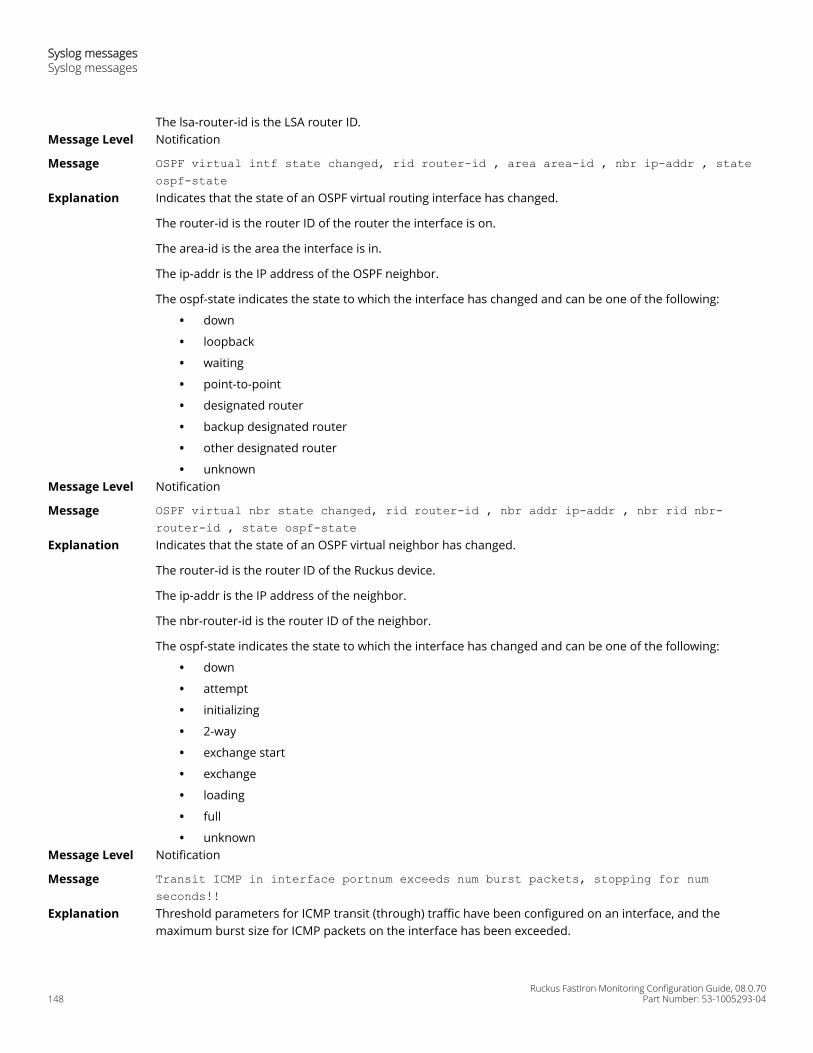
The lsa-router-id is the LSA router ID.Message Level Notification
Message OSPF virtual intf state changed, rid router-id , area area-id , nbr ip-addr , stateospf-state
Explanation Indicates that the state of an OSPF virtual routing interface has changed.
The router-id is the router ID of the router the interface is on.
The area-id is the area the interface is in.
The ip-addr is the IP address of the OSPF neighbor.
The ospf-state indicates the state to which the interface has changed and can be one of the following:
• down
• loopback
• waiting
• point-to-point
• designated router
• backup designated router
• other designated router
• unknownMessage Level Notification
Message OSPF virtual nbr state changed, rid router-id , nbr addr ip-addr , nbr rid nbr-router-id , state ospf-state
Explanation Indicates that the state of an OSPF virtual neighbor has changed.
The router-id is the router ID of the Ruckus device.
The ip-addr is the IP address of the neighbor.
The nbr-router-id is the router ID of the neighbor.
The ospf-state indicates the state to which the interface has changed and can be one of the following:
• down
• attempt
• initializing
• 2-way
• exchange start
• exchange
• loading
• full
• unknownMessage Level Notification
Message Transit ICMP in interface portnum exceeds num burst packets, stopping for numseconds!!
Explanation Threshold parameters for ICMP transit (through) traffic have been configured on an interface, and themaximum burst size for ICMP packets on the interface has been exceeded.
Syslog messagesSyslog messages
Ruckus FastIron Monitoring Configuration Guide, 08.0.70148 Part Number: 53-1005293-04
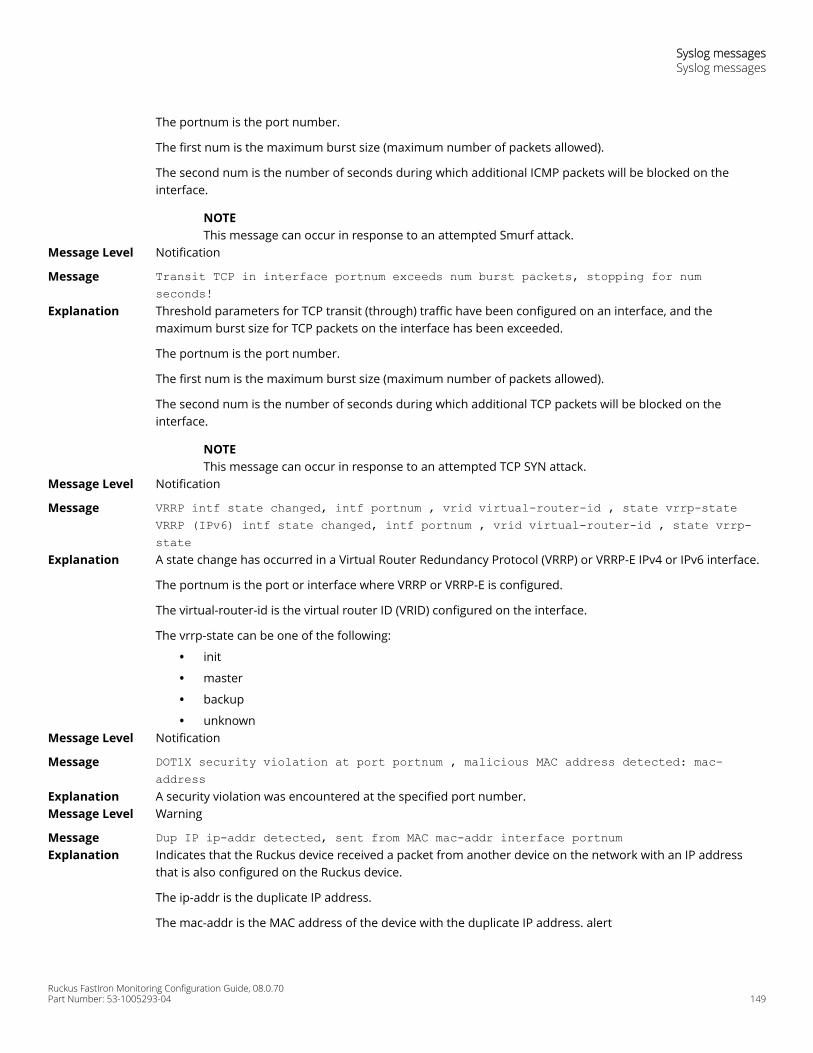
The portnum is the port number.
The first num is the maximum burst size (maximum number of packets allowed).
The second num is the number of seconds during which additional ICMP packets will be blocked on theinterface.
NOTEThis message can occur in response to an attempted Smurf attack.
Message Level Notification
Message Transit TCP in interface portnum exceeds num burst packets, stopping for numseconds!
Explanation Threshold parameters for TCP transit (through) traffic have been configured on an interface, and themaximum burst size for TCP packets on the interface has been exceeded.
The portnum is the port number.
The first num is the maximum burst size (maximum number of packets allowed).
The second num is the number of seconds during which additional TCP packets will be blocked on theinterface.
NOTEThis message can occur in response to an attempted TCP SYN attack.
Message Level Notification
Message VRRP intf state changed, intf portnum , vrid virtual-router-id , state vrrp-stateVRRP (IPv6) intf state changed, intf portnum , vrid virtual-router-id , state vrrp-state
Explanation A state change has occurred in a Virtual Router Redundancy Protocol (VRRP) or VRRP-E IPv4 or IPv6 interface.
The portnum is the port or interface where VRRP or VRRP-E is configured.
The virtual-router-id is the virtual router ID (VRID) configured on the interface.
The vrrp-state can be one of the following:
• init
• master
• backup
• unknownMessage Level Notification
Message DOT1X security violation at port portnum , malicious MAC address detected: mac-address
Explanation A security violation was encountered at the specified port number.Message Level Warning
Message Dup IP ip-addr detected, sent from MAC mac-addr interface portnumExplanation Indicates that the Ruckus device received a packet from another device on the network with an IP address
that is also configured on the Ruckus device.
The ip-addr is the duplicate IP address.
The mac-addr is the MAC address of the device with the duplicate IP address. alert
Syslog messagesSyslog messages
Ruckus FastIron Monitoring Configuration Guide, 08.0.70Part Number: 53-1005293-04 149
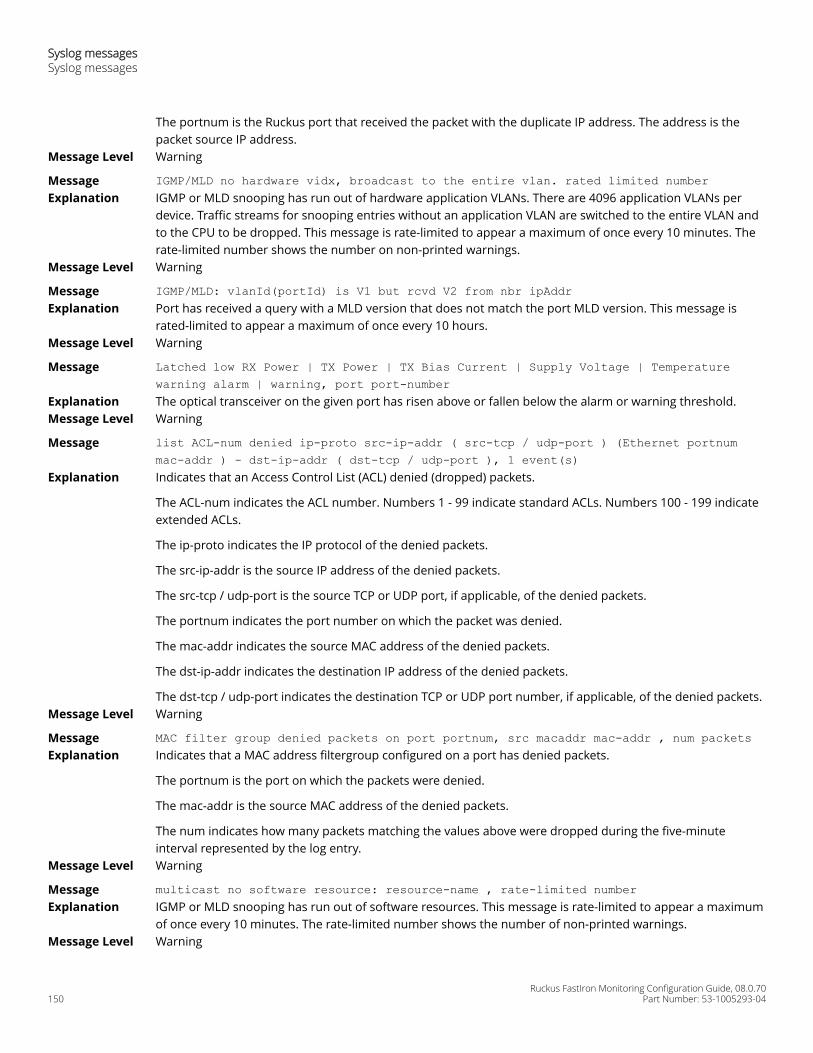
The portnum is the Ruckus port that received the packet with the duplicate IP address. The address is thepacket source IP address.
Message Level Warning
Message IGMP/MLD no hardware vidx, broadcast to the entire vlan. rated limited numberExplanation IGMP or MLD snooping has run out of hardware application VLANs. There are 4096 application VLANs per
device. Traffic streams for snooping entries without an application VLAN are switched to the entire VLAN andto the CPU to be dropped. This message is rate-limited to appear a maximum of once every 10 minutes. Therate-limited number shows the number on non-printed warnings.
Message Level Warning
Message IGMP/MLD: vlanId(portId) is V1 but rcvd V2 from nbr ipAddrExplanation Port has received a query with a MLD version that does not match the port MLD version. This message is
rated-limited to appear a maximum of once every 10 hours.Message Level Warning
Message Latched low RX Power | TX Power | TX Bias Current | Supply Voltage | Temperaturewarning alarm | warning, port port-number
Explanation The optical transceiver on the given port has risen above or fallen below the alarm or warning threshold.Message Level Warning
Message list ACL-num denied ip-proto src-ip-addr ( src-tcp / udp-port ) (Ethernet portnummac-addr ) - dst-ip-addr ( dst-tcp / udp-port ), 1 event(s)
Explanation Indicates that an Access Control List (ACL) denied (dropped) packets.
The ACL-num indicates the ACL number. Numbers 1 - 99 indicate standard ACLs. Numbers 100 - 199 indicateextended ACLs.
The ip-proto indicates the IP protocol of the denied packets.
The src-ip-addr is the source IP address of the denied packets.
The src-tcp / udp-port is the source TCP or UDP port, if applicable, of the denied packets.
The portnum indicates the port number on which the packet was denied.
The mac-addr indicates the source MAC address of the denied packets.
The dst-ip-addr indicates the destination IP address of the denied packets.
The dst-tcp / udp-port indicates the destination TCP or UDP port number, if applicable, of the denied packets.Message Level Warning
Message MAC filter group denied packets on port portnum, src macaddr mac-addr , num packetsExplanation Indicates that a MAC address filtergroup configured on a port has denied packets.
The portnum is the port on which the packets were denied.
The mac-addr is the source MAC address of the denied packets.
The num indicates how many packets matching the values above were dropped during the five-minuteinterval represented by the log entry.
Message Level Warning
Message multicast no software resource: resource-name , rate-limited numberExplanation IGMP or MLD snooping has run out of software resources. This message is rate-limited to appear a maximum
of once every 10 minutes. The rate-limited number shows the number of non-printed warnings.Message Level Warning
Syslog messagesSyslog messages
Ruckus FastIron Monitoring Configuration Guide, 08.0.70150 Part Number: 53-1005293-04
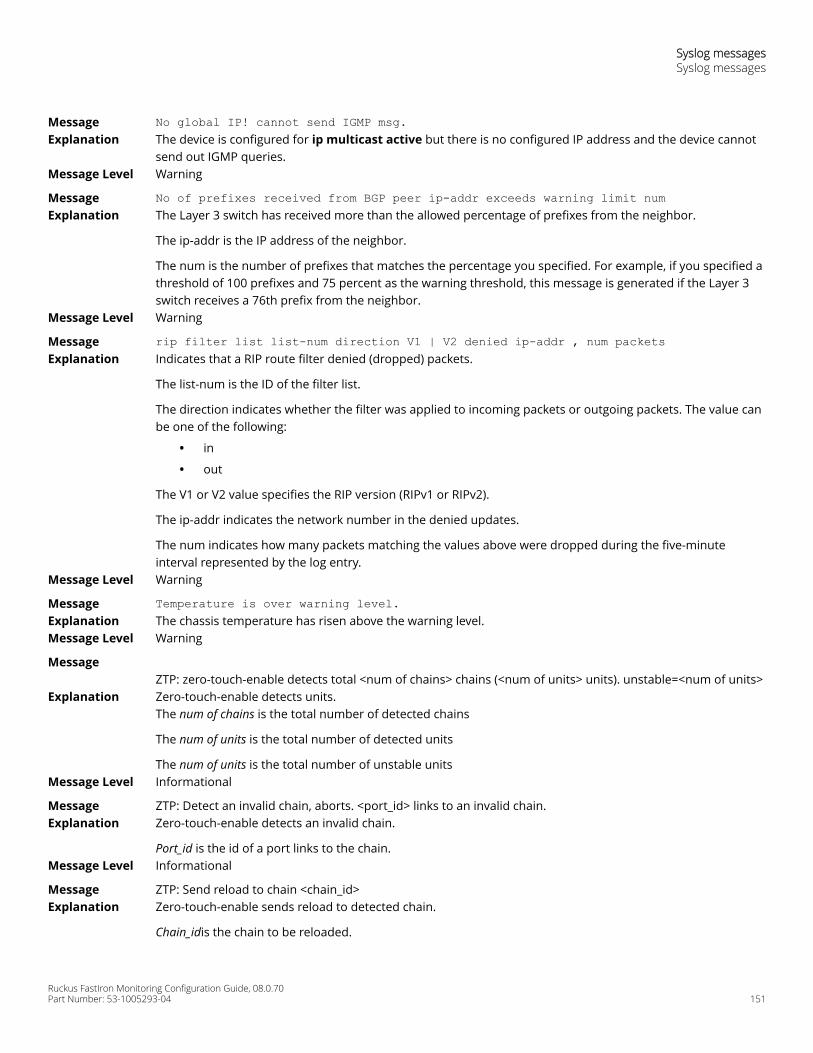
Message No global IP! cannot send IGMP msg.Explanation The device is configured for ip multicast active but there is no configured IP address and the device cannot
send out IGMP queries.Message Level Warning
Message No of prefixes received from BGP peer ip-addr exceeds warning limit numExplanation The Layer 3 switch has received more than the allowed percentage of prefixes from the neighbor.
The ip-addr is the IP address of the neighbor.
The num is the number of prefixes that matches the percentage you specified. For example, if you specified athreshold of 100 prefixes and 75 percent as the warning threshold, this message is generated if the Layer 3switch receives a 76th prefix from the neighbor.
Message Level Warning
Message rip filter list list-num direction V1 | V2 denied ip-addr , num packetsExplanation Indicates that a RIP route filter denied (dropped) packets.
The list-num is the ID of the filter list.
The direction indicates whether the filter was applied to incoming packets or outgoing packets. The value canbe one of the following:
• in
• out
The V1 or V2 value specifies the RIP version (RIPv1 or RIPv2).
The ip-addr indicates the network number in the denied updates.
The num indicates how many packets matching the values above were dropped during the five-minuteinterval represented by the log entry.
Message Level Warning
Message Temperature is over warning level.Explanation The chassis temperature has risen above the warning level.Message Level Warning
MessageZTP: zero-touch-enable detects total <num of chains> chains (<num of units> units). unstable=<num of units>
Explanation Zero-touch-enable detects units.The num of chains is the total number of detected chains
The num of units is the total number of detected units
The num of units is the total number of unstable unitsMessage Level Informational
Message ZTP: Detect an invalid chain, aborts. <port_id> links to an invalid chain.Explanation Zero-touch-enable detects an invalid chain.
Port_id is the id of a port links to the chain.Message Level Informational
Message ZTP: Send reload to chain <chain_id>Explanation Zero-touch-enable sends reload to detected chain.
Chain_idis the chain to be reloaded.
Syslog messagesSyslog messages
Ruckus FastIron Monitoring Configuration Guide, 08.0.70Part Number: 53-1005293-04 151
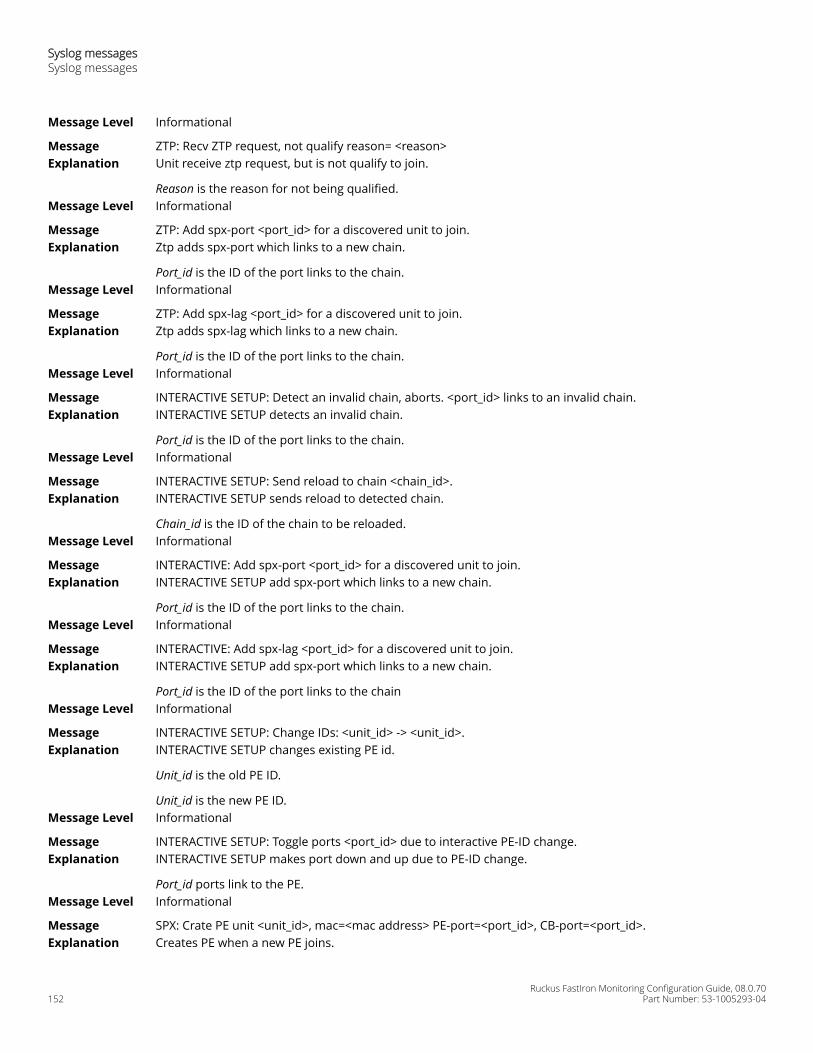
Message Level Informational
Message ZTP: Recv ZTP request, not qualify reason= <reason>Explanation Unit receive ztp request, but is not qualify to join.
Reason is the reason for not being qualified.Message Level Informational
Message ZTP: Add spx-port <port_id> for a discovered unit to join.Explanation Ztp adds spx-port which links to a new chain.
Port_id is the ID of the port links to the chain.Message Level Informational
Message ZTP: Add spx-lag <port_id> for a discovered unit to join.Explanation Ztp adds spx-lag which links to a new chain.
Port_id is the ID of the port links to the chain.Message Level Informational
Message INTERACTIVE SETUP: Detect an invalid chain, aborts. <port_id> links to an invalid chain.Explanation INTERACTIVE SETUP detects an invalid chain.
Port_id is the ID of the port links to the chain.Message Level Informational
Message INTERACTIVE SETUP: Send reload to chain <chain_id>.Explanation INTERACTIVE SETUP sends reload to detected chain.
Chain_id is the ID of the chain to be reloaded.Message Level Informational
Message INTERACTIVE: Add spx-port <port_id> for a discovered unit to join.Explanation INTERACTIVE SETUP add spx-port which links to a new chain.
Port_id is the ID of the port links to the chain.Message Level Informational
Message INTERACTIVE: Add spx-lag <port_id> for a discovered unit to join.Explanation INTERACTIVE SETUP add spx-port which links to a new chain.
Port_id is the ID of the port links to the chainMessage Level Informational
Message INTERACTIVE SETUP: Change IDs: <unit_id> -> <unit_id>.Explanation INTERACTIVE SETUP changes existing PE id.
Unit_id is the old PE ID.
Unit_id is the new PE ID.Message Level Informational
Message INTERACTIVE SETUP: Toggle ports <port_id> due to interactive PE-ID change.Explanation INTERACTIVE SETUP makes port down and up due to PE-ID change.
Port_id ports link to the PE.Message Level Informational
Message SPX: Crate PE unit <unit_id>, mac=<mac address> PE-port=<port_id>, CB-port=<port_id>.Explanation Creates PE when a new PE joins.
Syslog messagesSyslog messages
Ruckus FastIron Monitoring Configuration Guide, 08.0.70152 Part Number: 53-1005293-04
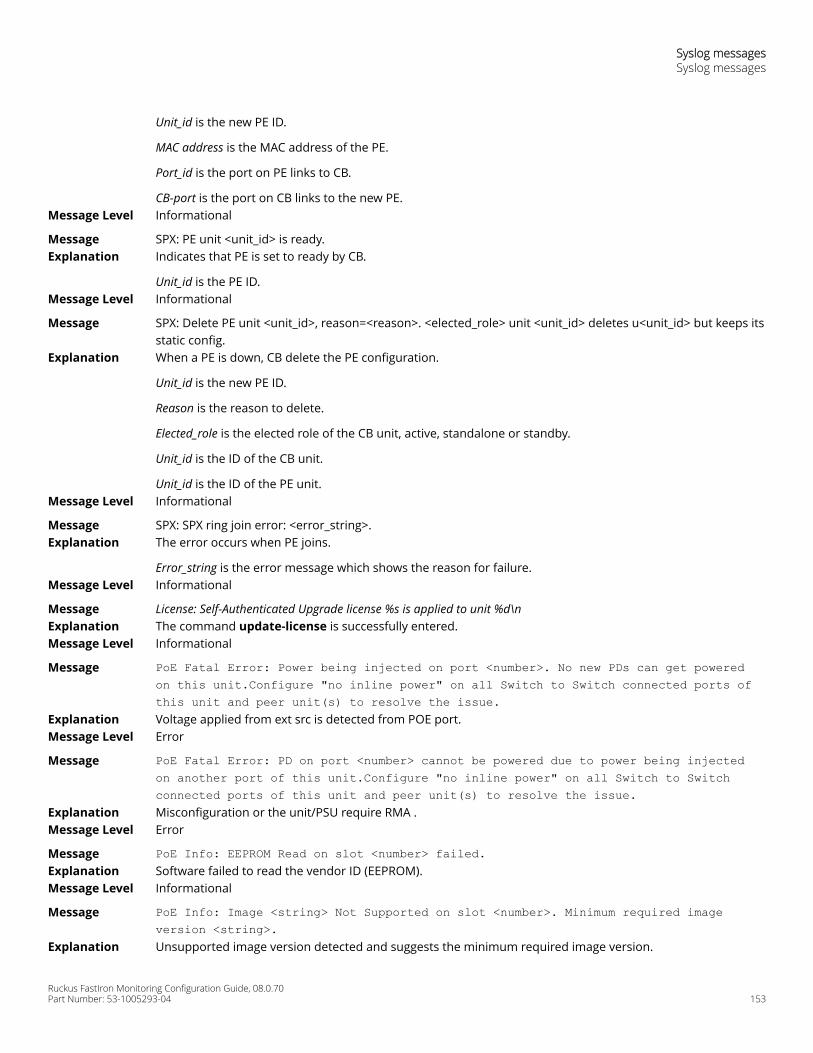
Unit_id is the new PE ID.
MAC address is the MAC address of the PE.
Port_id is the port on PE links to CB.
CB-port is the port on CB links to the new PE.Message Level Informational
Message SPX: PE unit <unit_id> is ready.Explanation Indicates that PE is set to ready by CB.
Unit_id is the PE ID.Message Level Informational
Message SPX: Delete PE unit <unit_id>, reason=<reason>. <elected_role> unit <unit_id> deletes u<unit_id> but keeps itsstatic config.
Explanation When a PE is down, CB delete the PE configuration.
Unit_id is the new PE ID.
Reason is the reason to delete.
Elected_role is the elected role of the CB unit, active, standalone or standby.
Unit_id is the ID of the CB unit.
Unit_id is the ID of the PE unit.Message Level Informational
Message SPX: SPX ring join error: <error_string>.Explanation The error occurs when PE joins.
Error_string is the error message which shows the reason for failure.Message Level Informational
Message License: Self-Authenticated Upgrade license %s is applied to unit %d\nExplanation The command update-license is successfully entered.Message Level Informational
Message PoE Fatal Error: Power being injected on port <number>. No new PDs can get poweredon this unit.Configure "no inline power" on all Switch to Switch connected ports ofthis unit and peer unit(s) to resolve the issue.
Explanation Voltage applied from ext src is detected from POE port.Message Level Error
Message PoE Fatal Error: PD on port <number> cannot be powered due to power being injectedon another port of this unit.Configure "no inline power" on all Switch to Switchconnected ports of this unit and peer unit(s) to resolve the issue.
Explanation Misconfiguration or the unit/PSU require RMA .Message Level Error
Message PoE Info: EEPROM Read on slot <number> failed.Explanation Software failed to read the vendor ID (EEPROM).Message Level Informational
Message PoE Info: Image <string> Not Supported on slot <number>. Minimum required imageversion <string>.
Explanation Unsupported image version detected and suggests the minimum required image version.
Syslog messagesSyslog messages
Ruckus FastIron Monitoring Configuration Guide, 08.0.70Part Number: 53-1005293-04 153

Message Level Informational
Message PoE Warning: Upgrading firmware in slot <number>....DO NOT HOTSWAP OR POWER DOWN THEMODULE.
Explanation Indicates that the firmware upgrade process is under way and module should not be powered down orhotswapped.
Message Level Warning
Message U%d-MSG: PoE Info: Firmware Download on slot <number>.....<number> percentcompleted.
Explanation Indicates the status of firmware download.Message Level Informational
Message PoE: Port <port-number> lost non-PD, so enabling PD detection.Explanation Indicates that PD detection is enabled after losing non-PD on a specific port.Message Level Informational
Message PoE: Power enabled on port <port-number>.Explanation Indicates that power is enabled on a port.Message Level Informational
Message PoE: Power disabled on port <port-number> because of detection of non-PD. PDdetection will be disabled on port.
Explanation Indicates that power is disabled upon detection of non-PD and PD detection will be disabled.Message Level Informational
Message PoE: Power disabled on port <port-number> because of admin initiated firmwareupgrade.
Explanation Indicates that power is disabled upon admin-initiated firmware upgrade.Message Level Alert
Message PoE: Power disabled on port <port-number> because of admin off.Explanation Indicates that power is disabled after admin off.Message Level Alert
Message PoE: Power disabled on port <port-number> because of power management.Explanation Indicates that power is disabled because of power management.Message Level Informational
Message PoE: Power disabled on port <port-number> because of PD disconnection.Explanation Indicates that power is disabled upon PD disconnection.Message Level Informational
Message PoE: Power disabled on port <port-number> because of PD overload.Explanation Indicates that power is disabled because of PD overload.Message Level Informational
Message PoE: Power disabled on port <port-number> because of PD fault.Explanation Indicates that power is disabled because of PD fault.Message Level Alert
Message PoE: Power disabled on port <port-number> because of internal fault.Explanation Indicates that power is disabled because of internal fault.Message Level Alert
Message PoE: Power disabled on port <port-number> because of PSU fault.
Syslog messagesSyslog messages
Ruckus FastIron Monitoring Configuration Guide, 08.0.70154 Part Number: 53-1005293-04
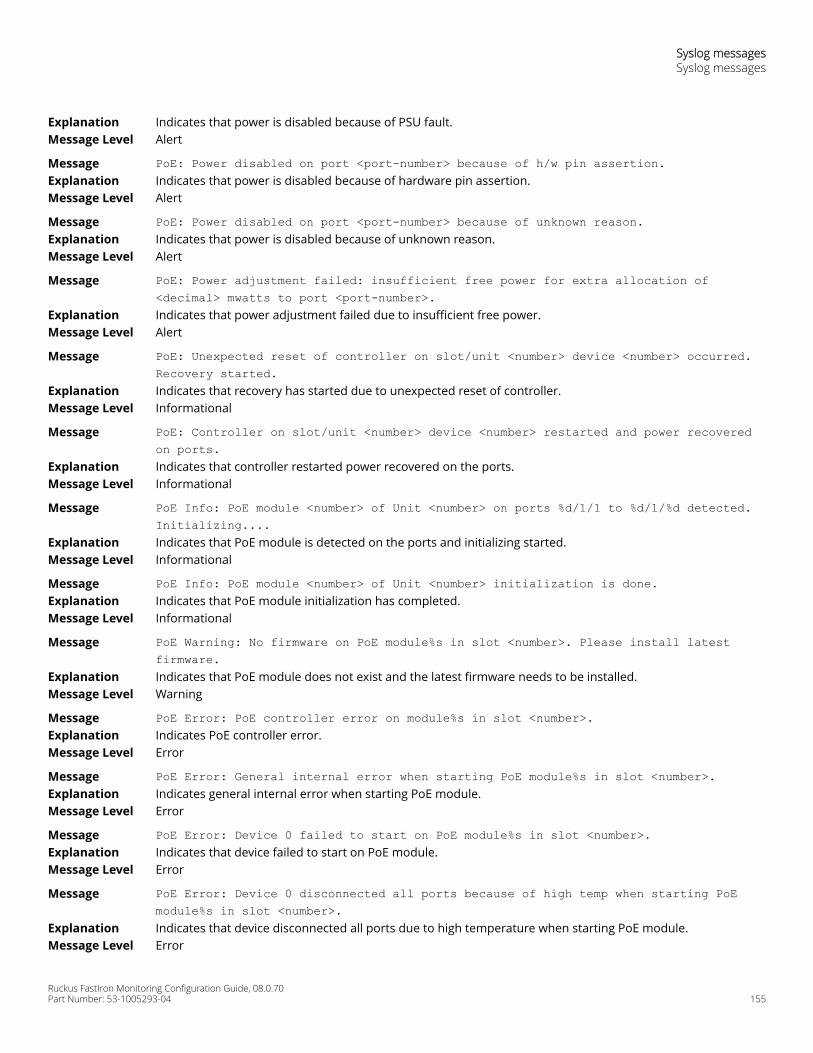
Explanation Indicates that power is disabled because of PSU fault.Message Level Alert
Message PoE: Power disabled on port <port-number> because of h/w pin assertion.Explanation Indicates that power is disabled because of hardware pin assertion.Message Level Alert
Message PoE: Power disabled on port <port-number> because of unknown reason.Explanation Indicates that power is disabled because of unknown reason.Message Level Alert
Message PoE: Power adjustment failed: insufficient free power for extra allocation of<decimal> mwatts to port <port-number>.
Explanation Indicates that power adjustment failed due to insufficient free power.Message Level Alert
Message PoE: Unexpected reset of controller on slot/unit <number> device <number> occurred.Recovery started.
Explanation Indicates that recovery has started due to unexpected reset of controller.Message Level Informational
Message PoE: Controller on slot/unit <number> device <number> restarted and power recoveredon ports.
Explanation Indicates that controller restarted power recovered on the ports.Message Level Informational
Message PoE Info: PoE module <number> of Unit <number> on ports %d/1/1 to %d/1/%d detected.Initializing....
Explanation Indicates that PoE module is detected on the ports and initializing started.Message Level Informational
Message PoE Info: PoE module <number> of Unit <number> initialization is done.Explanation Indicates that PoE module initialization has completed.Message Level Informational
Message PoE Warning: No firmware on PoE module%s in slot <number>. Please install latestfirmware.
Explanation Indicates that PoE module does not exist and the latest firmware needs to be installed.Message Level Warning
Message PoE Error: PoE controller error on module%s in slot <number>.Explanation Indicates PoE controller error.Message Level Error
Message PoE Error: General internal error when starting PoE module%s in slot <number>.Explanation Indicates general internal error when starting PoE module.Message Level Error
Message PoE Error: Device 0 failed to start on PoE module%s in slot <number>.Explanation Indicates that device failed to start on PoE module.Message Level Error
Message PoE Error: Device 0 disconnected all ports because of high temp when starting PoEmodule%s in slot <number>.
Explanation Indicates that device disconnected all ports due to high temperature when starting PoE module.Message Level Error
Syslog messagesSyslog messages
Ruckus FastIron Monitoring Configuration Guide, 08.0.70Part Number: 53-1005293-04 155

Message PoE Alarm: Device 0 has high temp alarm when starting PoE module%s in slot <number>.Explanation Indicates high temperature on device when starting PoE module.Message Level Alert
Message PoE Error: Device 0 failed on PoE module%s in slot <number>.Explanation Indicates that device has failed on PoE module.Message Level Error
Message PoE Fatal: Device 0 disconnected all ports because high temp exceeded disconnectionlimit on PoE module%s in slot <number>.
Explanation Indicates that device has disconnected all ports because high temp exceeded disconnection limit on PoEmodule.
Message Level Critical
Message PoE Fatal Error: Lost communication link with the PoE controller in slot <number>.Shutting down and restarting the PoE module to recover.
Explanation Indicates that PoE module restarts to recover after shutdown after communication link break with the PoEcontroller.
Message Level Error
Message PoE Error: Incompatible firmware for PoE module %d. Please install latest firmware.Explanation Indicates that the firmware is not compatible after performing PoE Hardware - firmware compatibility check
during boot up and firmware upgrade.Message Level Error
Message PoE Alarm: VOP Test Reported Error on device <number>, no af/at detection possiblefor ports %s, But PDs would get powered.
Explanation Indicates that VOP Test Reported Error on device but PDs may get powered.Message Level Alert
Syslog messages IPsec and IKEv2Message IKEv2: Maximum IKE Peers Limit ReachedExplanation The maximum IKEv2 peer limit is reached on the device.Message Level Warning
Message IKEv2: Recovered from Maximum IKE Peers Limit ConditionExplanation The device is recovered after reaching the maximum IKEv2 peer limit.Message Level Informational
Message IKEv2: IKEv2 session <up_down> source <source_address> Destination<destination_address> VRF <vrf_id> SPI <spi_id>
Explanation A state change has occurred for an IKEv2 session.
The up_down is the state of the interface.
The source_address is the source IP address of the IKEv2 session.
The destination address is the destination IP address in the packet.
The vrf_id is the tunnel base VRF.
The spi_id is the security parameter index (SPI) in the packet.Message Level Informational
Syslog messagesSyslog messages IPsec and IKEv2
Ruckus FastIron Monitoring Configuration Guide, 08.0.70156 Part Number: 53-1005293-04

Message IKEv2: Invalid Message Type Received with Source <source_address> Destination<destination_address> SPI <spi_id> MessageType <x>
Explanation An invalid IKEv2 message type is received.
The source_address is the source IP address in the packet.
The destination address is the destination IP address in the packet.
The spi_id is the security parameter index (SPI) in the packet.
The x is the value of the unsupported message type in the IKEv2 packet.Message Level Informational
Message IKEv2: Invalid Payload Type Received with Source <source_address> Destination<destination_address> SPI <spi_id> PayloadType <x>
Explanation A state change has occurred for an IPsec session.
The source_address is the source IP address in the packet.
The destination address is the destination IP address in the packet.
The spi_id is the security parameter index (SPI) in the packet.
The x is the value of the unsupported payload type.Message Level Informational
Message IPsec: IPSec module <module_id> on unit <unit_id> is <up_down>Explanation A state change has occurred for an IPsec module. Hot swapping of the module is not supported, but an IPsec
module is marked as down when the IPsec module is not usable.
The module_id is the module ID.
The unit_id is the unit ID.
The up_down is the state of the module.Message Level Alert
Message IPsec: IPsec session <up_down> source <source_address> Destination<destination_address> VRF <vrf_id> SPI <spi_id> Direction <direction>
Explanation A state change has occurred for an IPsec session.
The up_down is the state of the interface.
The source_address is the source IP address of the IPsec session.
The destination address is the destination IP address in the packet.
The vrf_id is the tunnel base VRF.
The spi_id is the security parameter index (SPI) in the packet.
The direction is ingress or egress.Message Level Informational
Syslog messages systemMessage System: Interface ipsec_tnnl <tunnel_id>, state upExplanation The IPsec tunnel interface has come up .
The tunnel_id is the tunnel ID.
Syslog messagesSyslog messages IPsec and IKEv2
Ruckus FastIron Monitoring Configuration Guide, 08.0.70Part Number: 53-1005293-04 157

Message Level Informational
Message System: Interface ipsec_tnnl <tunnel_id>, state down <reason>Explanation The IPsec tunnel interface has gone down.
The tunnel_id is the tunnel ID.
The reason variable can be one of the following:
• clear IKE SA
• clear IPSEC SA
• IKE session down
• IPSEC session down
• tunnel source interface down
• tunnel no destination route
• Administratively brought down
• IPSEC card down
• Switchover and FailoverMessage Level Informational
Syslog messagesSyslog messages IPsec and IKEv2
Ruckus FastIron Monitoring Configuration Guide, 08.0.70158 Part Number: 53-1005293-04

© 2018 ARRIS Enterprises LLC. All rights reserved.Ruckus Wireless, Inc., a wholly owned subsidiary of ARRIS International plc.350 West Java Dr., Sunnyvale, CA 94089 USAwww.ruckuswireless.com