Embed Size (px)
Citation preview
RUFFERINVESTMENT
COMPANY�LIMITED
Annual Financial Report
for the year ended 30 June 2011

Page
Financial�Highlights 1
Company�Information 1
Chairman’s�Review 2
Directors 3
Report�of�the�Directors 4
Investment�Manager’s�Report 11
Company�Performance 12
Investment�Policy 13
Top�Ten�Holdings 14
Independent�Auditor’s�Report 15
Statement�of�Financial�Position 17
Statement�of�Comprehensive�Income 18
Statement�of�Changes�in�Equity 19
Statement�of�Cash�Flows 20
Notes�to�the�Financial�Statements 21
Portfolio�Statement 38
General�Information 42
Management�and�Administration 43
RUFFER INVESTMENT COMPANY LIMITEDContents
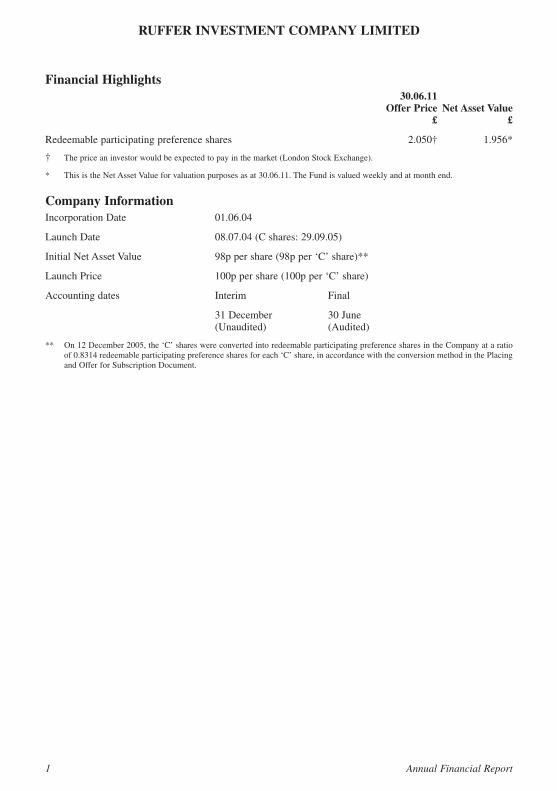
Financial Highlights 30.06.11 Offer Price Net Asset Value £ £
Redeemable�participating�preference�shares������������������������������������������������������������������2.050†�����������������1.956*
†�����The�price�an�investor�would�be�expected�to�pay�in�the�market�(London�Stock�Exchange).
* ������This�is�the�Net�Asset�Value�for�valuation�purposes�as�at�30.06.11.�The�Fund�is�valued�weekly�and�at�month�end.
Company InformationIncorporation�Date� 01.06.04
Launch�Date� 08.07.04�(C�shares:�29.09.05)
Initial�Net�Asset�Value� 98p�per�share�(98p�per�‘C’�share)**
Launch�Price� 100p�per�share�(100p�per�‘C’�share)
Accounting�dates� Interim� Final
31�December� 30�June(Unaudited)� (Audited)
** ����On�12�December�2005,�the�‘C’�shares�were�converted�into�redeemable�participating�preference�shares�in�the�Company�at�a�ratioof�0.8314�redeemable�participating�preference�shares�for�each�‘C’�share,�in�accordance�with�the�conversion�method�in�the�Placingand�Offer�for�Subscription�Document.
1 Annual Financial Report
RUFFER INVESTMENT COMPANY LIMITED
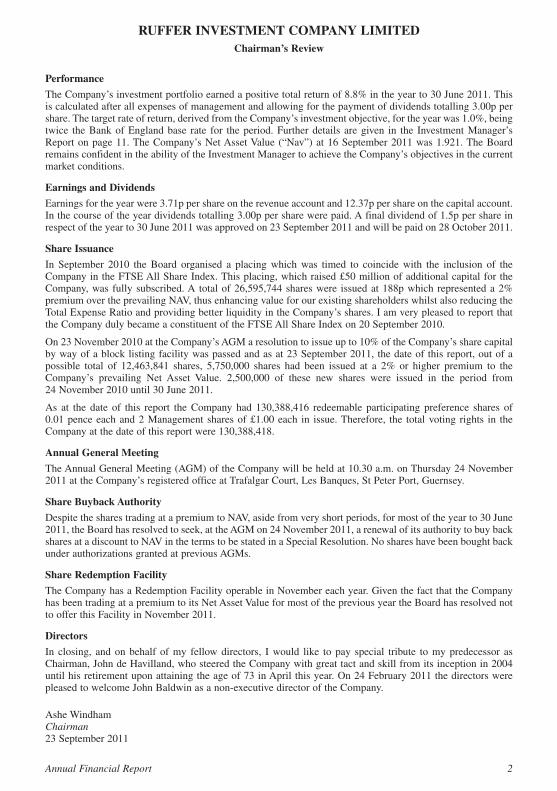
Performance
The�Company’s�investment�portfolio�earned�a�positive�total�return�of�8.8%�in�the�year�to�30�June�2011.�Thisis�calculated�after�all�expenses�of�management�and�allowing�for�the�payment�of�dividends�totalling�3.00p�pershare.�The�target�rate�of�return,�derived�from�the�Company’s�investment�objective,�for�the�year�was�1.0%,�beingtwice� the�Bank�of�England�base� rate� for� the�period.�Further�details� are�given� in� the� Investment�Manager’sReport�on�page 11. The�Company’s�Net�Asset�Value�(“Nav”)�at�16�September�2011�was�1.921.�The�Boardremains�confident�in�the�ability�of�the�Investment�Manager�to�achieve�the�Company’s�objectives�in�the�currentmarket�conditions.
Earnings and Dividends
Earnings�for�the�year�were�3.71p�per�share�on�the�revenue�account�and�12.37p�per�share�on�the�capital�account.In�the�course�of�the�year�dividends�totalling�3.00p�per�share�were�paid.�A�final�dividend�of�1.5p�per�share�inrespect�of�the�year�to�30�June�2011�was�approved�on�23�September�2011�and�will�be�paid�on 28 October�2011.
Share Issuance
In� September� 2010� the�Board� organised� a� placing�which�was� timed� to� coincide�with� the� inclusion� of� theCompany�in�the�FTSE�All�Share�Index.�This�placing,�which�raised�£50�million�of�additional�capital�for�theCompany,�was� fully�subscribed.�A� total�of�26,595,744�shares�were� issued�at�188p�which�represented�a�2%premium�over�the�prevailing�NAV,�thus�enhancing�value�for�our�existing�shareholders�whilst�also�reducing�theTotal�Expense�Ratio�and�providing�better�liquidity�in�the�Company’s�shares.�I�am�very�pleased�to�report�thatthe�Company�duly�became�a�constituent�of�the�FTSE�All�Share�Index�on�20�September�2010.
On�23�November�2010�at�the�Company’s�AGM�a�resolution�to�issue�up�to�10%�of�the�Company’s�share�capitalby�way�of�a�block�listing�facility�was�passed�and�as�at�23�September�2011,�the�date�of�this�report,�out�of�apossible� total� of� 12,463,841� shares,� 5,750,000� shares� had� been� issued� at� a� 2%� or� higher� premium� to� theCompany’s� prevailing� Net� Asset� Value.� 2,500,000� of� these� new� shares� were� issued� in� the� period� from24 November�2010�until�30�June�2011.
As� at� the� date� of� this� report� the�Company� had� 130,388,416� redeemable� participating� preference� shares� of0.01 pence�each�and�2�Management� shares�of�£1.00�each� in� issue.�Therefore,� the� total�voting� rights� in� theCompany�at�the�date�of�this�report�were�130,388,418.
Annual General Meeting
The�Annual�General�Meeting�(AGM)�of�the�Company�will�be�held�at�10.30�a.m.�on�Thursday�24�November2011�at�the�Company’s�registered�office�at�Trafalgar�Court,�Les�Banques,�St�Peter�Port,�Guernsey.
Share Buyback Authority
Despite�the�shares�trading�at�a�premium�to�NAV,�aside�from�very�short�periods,�for�most�of�the�year�to�30�June2011,�the�Board�has�resolved�to�seek,�at�the�AGM�on�24�November 2011,�a�renewal�of�its�authority�to�buy�backshares�at�a�discount�to�NAV�in�the�terms�to�be�stated�in�a�Special�Resolution.�No�shares�have�been�bought�backunder�authorizations�granted�at�previous�AGMs.
Share Redemption Facility
The�Company�has�a�Redemption�Facility�operable�in�November�each�year.�Given�the�fact�that�the�Companyhas�been�trading�at�a�premium�to�its�Net�Asset�Value�for�most�of�the�previous�year�the�Board�has�resolved�notto�offer�this�Facility�in�November�2011.
Directors
In� closing,� and�on�behalf� of�my� fellow�directors,� I�would� like� to� pay� special� tribute� to�my�predecessor� asChairman,�John�de�Havilland,�who�steered�the�Company�with�great�tact�and�skill�from�its�inception�in�2004until�his�retirement�upon�attaining�the�age�of�73�in�April�this�year.�On�24�February�2011�the�directors�werepleased�to�welcome�John�Baldwin�as�a�non-executive�director�of�the�Company.
Ashe�WindhamChairman23�September�2011
Annual Financial Report 2
RUFFER INVESTMENT COMPANY LIMITEDChairman’s Review
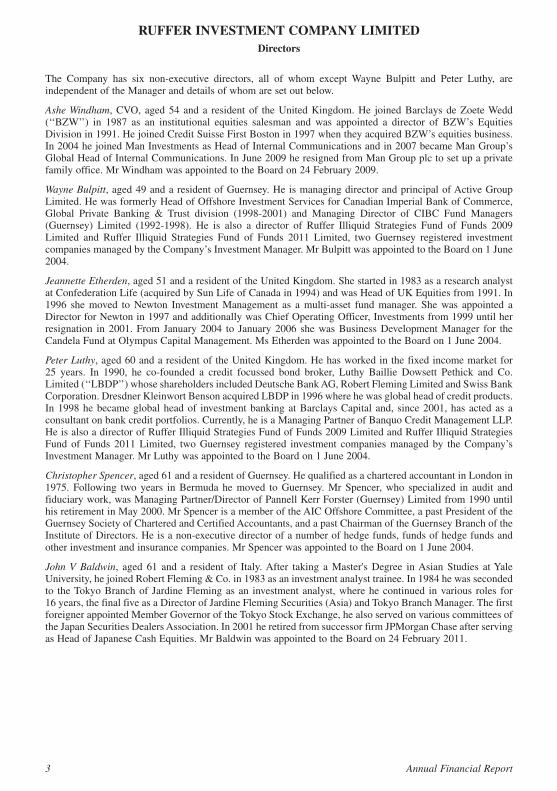
The� Company� has� six� non-executive� directors,� all� of� whom� except�Wayne� Bulpitt� and� Peter� Luthy,� areindependent�of�the�Manager�and�details�of�whom�are�set�out�below.
Ashe Windham,�CVO,�aged�54�and�a� resident�of� the�United�Kingdom.�He� joined�Barclays�de�Zoete�Wedd(‘‘BZW’’)� in� 1987� as� an� institutional� equities� salesman� and� was� appointed� a� director� of� BZW’s� EquitiesDivision�in�1991.�He�joined�Credit�Suisse�First�Boston�in�1997�when�they�acquired�BZW’s�equities�business.In�2004�he�joined�Man�Investments�as�Head�of�Internal�Communications�and�in�2007�became�Man�Group’sGlobal�Head�of�Internal�Communications.�In�June�2009�he�resigned�from�Man�Group�plc�to�set�up�a�privatefamily�office.�Mr�Windham�was�appointed�to�the�Board�on�24�February�2009.
Wayne Bulpitt,�aged�49�and�a�resident�of�Guernsey.�He�is�managing�director�and�principal�of�Active�GroupLimited.�He�was�formerly�Head�of�Offshore�Investment�Services�for�Canadian�Imperial�Bank�of�Commerce,Global� Private� Banking� &� Trust� division� (1998-2001)� and� Managing� Director� of� CIBC� Fund� Managers(Guernsey)� Limited� (1992-1998).� He� is� also� a� director� of� Ruffer� Illiquid� Strategies� Fund� of� Funds� 2009Limited� and� Ruffer� Illiquid� Strategies� Fund� of� Funds� 2011� Limited,� two� Guernsey� registered� investmentcompanies�managed�by�the�Company’s�Investment�Manager.�Mr�Bulpitt�was�appointed�to�the�Board�on�1�June2004.
Jeannette Etherden,�aged�51�and�a�resident�of�the�United�Kingdom.�She�started�in�1983�as�a�research�analystat�Confederation�Life�(acquired�by�Sun�Life�of�Canada�in�1994)�and�was�Head�of�UK�Equities�from�1991.�In1996� she�moved� to�Newton� Investment�Management� as� a�multi-asset� fund�manager.� She�was� appointed� aDirector�for�Newton�in�1997�and�additionally�was�Chief�Operating�Officer,�Investments�from�1999�until�herresignation� in�2001.�From�January�2004� to� January�2006� she�was�Business�Development�Manager� for� theCandela�Fund�at�Olympus�Capital�Management.�Ms�Etherden�was�appointed�to�the�Board�on�1�June�2004.
Peter Luthy,�aged�60�and�a�resident�of�the�United�Kingdom.�He�has�worked�in�the�fixed�income�market�for25 years.� In� 1990,� he� co-founded� a� credit� focussed� bond� broker,� Luthy� Baillie� Dowsett� Pethick� and� Co.Limited�(‘‘LBDP’’)�whose�shareholders�included�Deutsche�Bank�AG,�Robert�Fleming�Limited�and�Swiss�BankCorporation.�Dresdner�Kleinwort�Benson�acquired�LBDP�in�1996�where�he�was�global�head�of�credit�products.In�1998�he�became�global�head�of� investment�banking�at�Barclays�Capital� and,� since�2001,�has�acted�as�aconsultant�on�bank�credit�portfolios.�Currently,�he�is�a�Managing�Partner�of�Banquo�Credit�Management�LLP.He�is�also�a�director�of�Ruffer�Illiquid�Strategies�Fund�of�Funds�2009�Limited�and�Ruffer�Illiquid�StrategiesFund� of� Funds� 2011�Limited,� two�Guernsey� registered� investment� companies�managed� by� the�Company’sInvestment�Manager.�Mr�Luthy�was�appointed�to�the�Board�on�1�June�2004.
Christopher Spencer,�aged�61�and�a�resident�of�Guernsey.�He�qualified�as�a�chartered�accountant�in�London�in1975.� Following� two� years� in�Bermuda� he�moved� to�Guernsey.�Mr�Spencer,�who� specialized� in� audit� andfiduciary�work,�was�Managing�Partner/Director�of�Pannell�Kerr�Forster�(Guernsey)�Limited�from�1990�untilhis�retirement�in�May�2000.�Mr�Spencer�is�a�member�of�the�AIC�Offshore�Committee,�a�past�President�of�theGuernsey�Society�of�Chartered�and�Certified�Accountants,�and�a�past�Chairman�of�the�Guernsey�Branch�of�theInstitute�of�Directors.�He�is�a�non-executive�director�of�a�number�of�hedge�funds,�funds�of�hedge�funds�andother�investment�and�insurance�companies.�Mr�Spencer�was�appointed�to�the�Board�on�1�June�2004.
John V Baldwin,� aged� 61� and� a� resident� of� Italy.�After� taking� a�Master's�Degree� in�Asian� Studies� at�YaleUniversity,�he�joined�Robert�Fleming�&�Co.�in�1983�as�an�investment�analyst�trainee.�In�1984�he�was�secondedto� the�Tokyo�Branch�of� Jardine�Fleming�as�an� investment�analyst,�where�he�continued� in�various� roles� for16 years,�the�final�five�as�a�Director�of�Jardine�Fleming�Securities�(Asia)�and�Tokyo�Branch�Manager.�The�firstforeigner�appointed�Member�Governor�of�the�Tokyo�Stock�Exchange,�he�also�served�on�various�committees�ofthe�Japan�Securities�Dealers�Association.�In�2001�he�retired�from�successor�firm�JPMorgan�Chase�after�servingas�Head�of�Japanese�Cash�Equities.�Mr�Baldwin�was�appointed�to�the�Board�on�24�February�2011.
3 Annual Financial Report
RUFFER INVESTMENT COMPANY LIMITEDDirectors
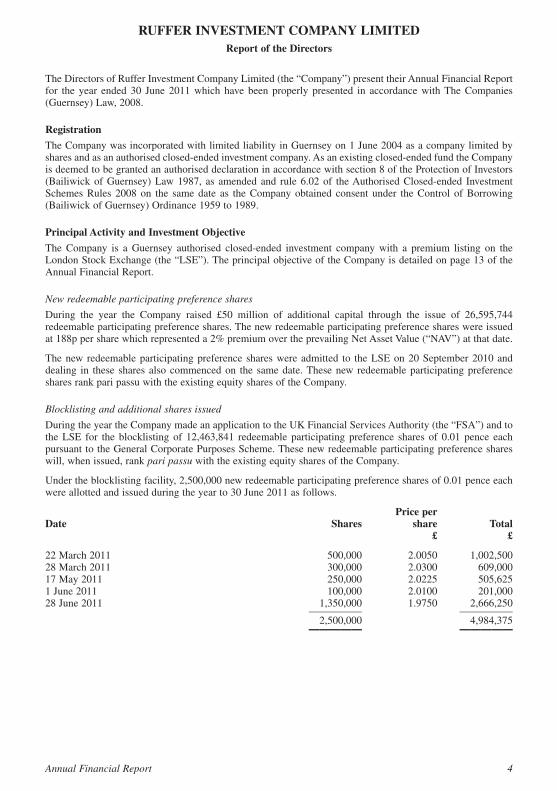
The�Directors�of�Ruffer�Investment�Company�Limited�(the�“Company”)�present�their�Annual�Financial�Reportfor� the� year� ended� 30� June� 2011�which� have� been� properly� presented� in� accordance�with�The�Companies(Guernsey)�Law,�2008.
Registration
The�Company�was�incorporated�with�limited�liability�in�Guernsey�on�1�June�2004�as�a�company�limited�byshares�and�as�an�authorised�closed-ended�investment�company.�As�an�existing�closed-ended�fund�the�Companyis�deemed�to�be�granted�an�authorised�declaration�in�accordance�with�section�8�of�the�Protection�of�Investors(Bailiwick�of�Guernsey)�Law�1987,� as� amended�and� rule�6.02�of� the�Authorised�Closed-ended� InvestmentSchemes�Rules� 2008�on� the� same�date� as� the�Company�obtained� consent� under� the�Control� of�Borrowing(Bailiwick�of�Guernsey)�Ordinance�1959�to�1989.
Principal Activity and Investment Objective
The�Company� is� a�Guernsey� authorised� closed-ended� investment� company�with� a� premium� listing� on� theLondon�Stock�Exchange�(the�“LSE”).�The�principal�objective�of�the�Company�is�detailed�on�page 13 of�theAnnual�Financial�Report.
New redeemable participating preference shares
During� the� year� the� Company� raised� £50� million� of� additional� capital� through� the� issue� of� 26,595,744redeemable�participating�preference�shares.�The�new�redeemable�participating�preference�shares�were�issuedat�188p�per�share�which�represented�a�2%�premium�over�the�prevailing�Net�Asset�Value�(“NAV”)�at�that�date.
The�new�redeemable�participating�preference� shares�were�admitted� to� the�LSE�on�20�September�2010�anddealing� in� these� shares� also�commenced�on� the� same�date.�These�new� redeemable�participating�preferenceshares�rank�pari�passu�with�the�existing�equity�shares�of�the�Company.
Blocklisting and additional shares issued
During�the�year�the�Company�made�an�application�to�the�UK�Financial�Services�Authority�(the�“FSA”)�and�tothe�LSE� for� the� blocklisting� of� 12,463,841� redeemable� participating� preference� shares� of� 0.01� pence� eachpursuant�to�the�General�Corporate�Purposes�Scheme.�These�new�redeemable�participating�preference�shareswill,�when�issued,�rank�pari passu with�the�existing�equity�shares�of�the�Company.
Under�the�blocklisting�facility,�2,500,000�new�redeemable�participating�preference�shares�of�0.01�pence�eachwere�allotted�and�issued�during�the�year�to�30�June�2011�as�follows.
Price per Date Shares share Total £ £
22�March�2011���������������������������������������������������������������������������������500,000�����������������2.0050������������1,002,50028�March�2011���������������������������������������������������������������������������������300,000�����������������2.0300���������������609,00017�May�2011 ������������������������������������������������������������������������������������250,000�����������������2.0225���������������505,6251�June�2011 ��������������������������������������������������������������������������������������100,000�����������������2.0100���������������201,00028�June�2011 ���������������������������������������������������������������������������������1,350,000�����������������1.9750������������2,666,250���������������������������������������������������������������������������������������������������—————������������������������������������—————�������������������������������������������������������������������������������������������������������2,500,000 ����������������������������������������4,984,375���������������������������������������������������������������������������������������������������—————������������������������������������—————
Annual Financial Report 4
RUFFER INVESTMENT COMPANY LIMITEDReport of the Directors
Principal Activity and Investment Objective (continued)
Blocklisting and additional shares issued (continued)
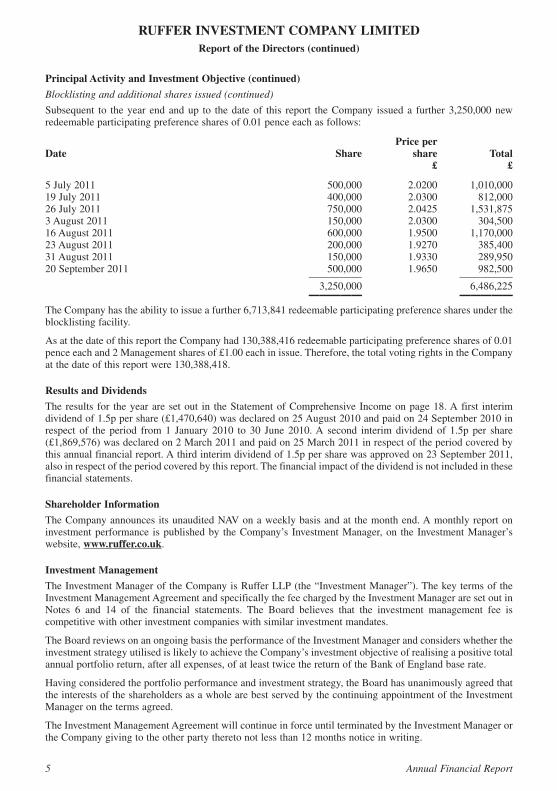
Subsequent� to� the�year� end�and�up� to� the�date�of� this� report� the�Company� issued�a� further 3,250,000�newredeemable�participating�preference�shares�of�0.01�pence�each�as�follows:
Price perDate Share share Total £ £
5�July�2011���������������������������������������������������������������������������������������500,000�����������������2.0200������������1,010,00019�July�2011�������������������������������������������������������������������������������������400,000�����������������2.0300���������������812,00026�July�2011�������������������������������������������������������������������������������������750,000�����������������2.0425������������1,531,8753�August�2011 ����������������������������������������������������������������������������������150,000�����������������2.0300���������������304,50016�August�2011 ��������������������������������������������������������������������������������600,000�����������������1.9500������������1,170,00023�August�2011 ��������������������������������������������������������������������������������200,000�����������������1.9270���������������385,40031 August�2011 ��������������������������������������������������������������������������������150,000�����������������1.9330���������������289,95020�September�2011 ��������������������������������������������������������������������������500,000�����������������1.9650���������������982,500���������������������������������������������������������������������������������������������������—————������������������������������������—————�������������������������������������������������������������������������������������������������������3,250,000���������������������������� ������������6,486,225���������������������������������������������������������������������������������������������������—————������������������������������������—————The�Company�has�the�ability�to�issue�a�further 6,713,841�redeemable�participating�preference�shares�under�theblocklisting�facility.
As�at�the�date�of�this�report�the�Company�had�130,388,416�redeemable�participating�preference�shares�of�0.01pence�each�and�2�Management�shares�of�£1.00�each�in�issue.�Therefore,�the�total�voting�rights�in�the�Companyat�the�date�of�this�report�were�130,388,418.
Results and Dividends
The�results� for� the�year�are�set�out� in� the�Statement�of�Comprehensive� Income�on�page 18.�A�first� interimdividend�of�1.5p�per�share�(£1,470,640)�was�declared�on�25�August�2010�and�paid�on�24�September�2010�inrespect� of� the� period� from�1� January� 2010� to� 30� June� 2010.�A� second� interim�dividend� of� 1.5p� per� share(£1,869,576)�was�declared�on�2�March�2011�and�paid�on�25�March�2011�in�respect�of�the�period�covered�bythis�annual�financial�report.�A�third�interim�dividend�of�1.5p�per�share�was�approved�on�23�September�2011,also�in�respect�of�the�period�covered�by�this�report.�The�financial�impact�of�the�dividend�is�not�included�in�thesefinancial�statements.
Shareholder Information
The�Company�announces�its�unaudited�NAV�on�a�weekly�basis�and�at�the�month�end.�A�monthly�report�oninvestment�performance� is�published�by� the�Company’s� Investment�Manager,�on� the� Investment�Manager’swebsite,�www.ruffer.co.uk.
Investment Management
The�Investment�Manager�of�the�Company�is�Ruffer�LLP�(the�“Investment�Manager”).�The�key�terms�of�theInvestment�Management�Agreement�and�specifically�the�fee�charged�by�the�Investment�Manager�are�set�out�inNotes� 6� and� 14 of� the� financial� statements.� The� Board� believes� that� the� investment� management� fee� iscompetitive�with�other�investment�companies�with�similar�investment�mandates.
The�Board�reviews�on�an�ongoing�basis�the�performance�of�the�Investment�Manager�and�considers�whether�theinvestment�strategy�utilised�is�likely�to�achieve�the�Company’s�investment�objective�of�realising�a�positive�totalannual�portfolio�return,�after�all�expenses,�of�at�least�twice�the�return�of�the�Bank�of�England�base�rate.
Having�considered�the�portfolio�performance�and�investment�strategy,�the�Board�has�unanimously�agreed�thatthe�interests�of�the�shareholders�as�a�whole�are�best�served�by�the�continuing�appointment�of�the�InvestmentManager�on�the�terms�agreed.
The�Investment�Management�Agreement�will�continue�in�force�until�terminated�by�the�Investment�Manager�orthe�Company�giving�to�the�other�party�thereto�not�less�than�12�months�notice�in�writing.
5 Annual Financial Report
RUFFER INVESTMENT COMPANY LIMITEDReport of the Directors (continued)
Directors
The�details�of�the�Directors�of�the�Company�during�the�year�and�at�the�date�of�this�Report�are�set�out�on�page 3and�on�the�Management�and�Administration�summary�on�page 43.
Directors’ Interests
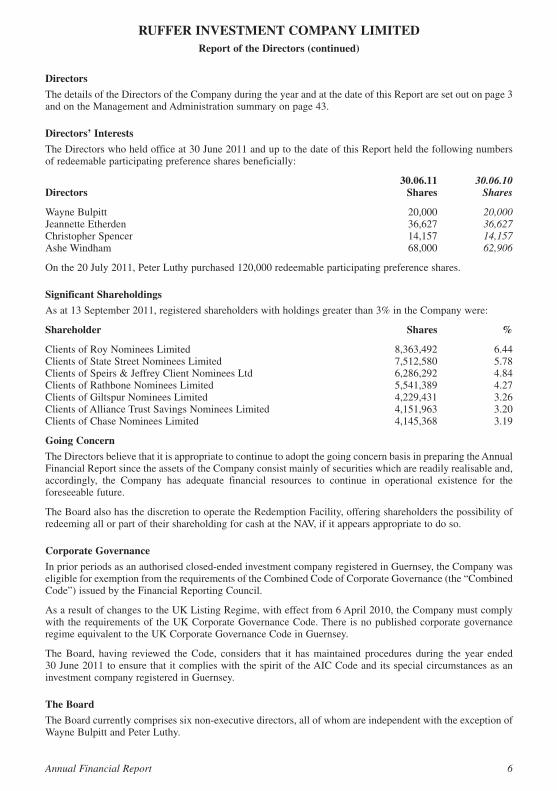
The�Directors�who�held�office�at�30�June�2011�and�up�to�the�date�of�this�Report�held�the�following�numbersof�redeemable�participating�preference�shares�beneficially:
30.06.11 30.06.10Directors Shares Shares
Wayne�Bulpitt�����������������������������������������������������������������������������������������������������������������20,000�����������������20,000Jeannette�Etherden ���������������������������������������������������������������������������������������������������������36,627�����������������36,627Christopher�Spencer �������������������������������������������������������������������������������������������������������14,157�����������������14,157Ashe�Windham ���������������������������������������������������������������������������������������������������������������68,000�����������������62,906
On�the�20�July�2011,�Peter�Luthy�purchased�120,000�redeemable�participating�preference�shares.
Significant Shareholdings
As�at�13�September�2011,�registered�shareholders�with�holdings�greater�than�3%�in�the�Company�were:
Shareholder Shares %
Clients�of�Roy�Nominees�Limited ����������������������������������������������������������������������������8,363,492���������������������6.44Clients�of�State�Street�Nominees�Limited�����������������������������������������������������������������7,512,580���������������������5.78Clients�of�Speirs�&�Jeffrey�Client�Nominees�Ltd �����������������������������������������������������6,286,292���������������������4.84Clients�of�Rathbone�Nominees�Limited��������������������������������������������������������������������5,541,389���������������������4.27Clients�of�Giltspur�Nominees�Limited����������������������������������������������������������������������4,229,431���������������������3.26Clients�of�Alliance�Trust�Savings�Nominees�Limited�����������������������������������������������4,151,963���������������������3.20Clients�of�Chase�Nominees�Limited �������������������������������������������������������������������������4,145,368���������������������3.19
Going Concern
The�Directors�believe�that�it�is�appropriate�to�continue�to�adopt�the�going�concern�basis�in�preparing�the�AnnualFinancial�Report�since�the�assets�of�the�Company�consist�mainly�of�securities�which�are�readily�realisable�and,accordingly,� the� Company� has� adequate� financial� resources� to� continue� in� operational� existence� for� theforeseeable�future.
The�Board�also�has�the�discretion�to�operate�the�Redemption�Facility,�offering�shareholders�the�possibility�ofredeeming�all�or�part�of�their�shareholding�for�cash�at�the�NAV,�if�it�appears�appropriate�to�do�so.
Corporate Governance
In�prior�periods�as�an�authorised�closed-ended�investment�company�registered�in�Guernsey,�the�Company�waseligible�for�exemption�from�the�requirements�of�the�Combined�Code�of�Corporate�Governance�(the�“CombinedCode”)�issued�by�the�Financial�Reporting�Council.
As�a�result�of�changes�to�the�UK�Listing�Regime,�with�effect�from�6�April�2010,�the�Company�must�complywith� the�requirements�of� the�UK�Corporate�Governance�Code.�There� is�no�published�corporate�governanceregime�equivalent�to�the�UK�Corporate�Governance�Code�in�Guernsey.
The�Board,� having� reviewed� the�Code,� considers� that� it� has�maintained� procedures� during� the� year� ended30 June�2011�to�ensure�that�it�complies�with�the�spirit�of�the�AIC�Code�and�its�special�circumstances�as�aninvestment�company�registered�in�Guernsey.
The Board
The�Board�currently�comprises�six�non-executive�directors,�all�of�whom�are�independent�with�the�exception�ofWayne�Bulpitt�and�Peter�Luthy.
Annual Financial Report 6
RUFFER INVESTMENT COMPANY LIMITEDReport of the Directors (continued)
The Board (continued)
Under� the� UK� Corporate� Governance� Code� Wayne� Bulpitt� and� Peter� Luthy� are� considered� not� to� beindependent� by� reason�of� being�directors� of� other� funds�managed�by� the�Company’s� Investment�Manager.None�of�the�Directors�has�a�contract�of�service�with�the�Company.
The�Board�meets�on�at�least�four�occasions�each�year,�at�which�time�the�Directors�review�the�management�ofthe�Company’s� assets� and� all� other� significant�matters� so� as� to� ensure� that� the�Directors�maintain� overallcontrol�and�supervision�of�the�Company’s�affairs.�The�Board�is�responsible�for�the�appointment�and�monitoringof�all�service�providers�to�the�Company.
Chairman, Senior Independent Director and Chief Executive
The�Chairman�of�the�Board�is�Ashe�Windham.�A�biography�for�Mr�Windham�and�all�other�Directors�appearson�page 3.�In�considering�the�independence�of�the�Chairman,�the�Board�has�taken�note�of�the�provisions�of�theCombined�Code�relating�to�independence,�and�has�determined�that�Mr�Windham�is�an�independent�Director.
As�the�Chairman�is�an�independent�Director,�no�appointment�of�a�senior�independent�director�has�been�made.The�Company�has�no�employees�and�therefore�there�is�no�requirement�for�a�chief�executive.
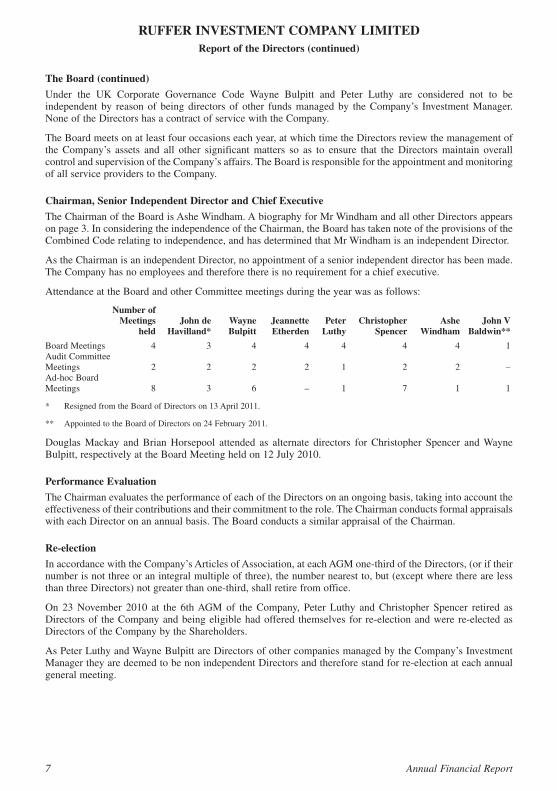
Attendance�at�the�Board�and�other�Committee�meetings�during�the�year�was�as�follows:
Number ofMeetings John de Wayne Jeannette Peter Christopher Ashe John V
held Havilland* Bulpitt Etherden Luthy Spencer Windham Baldwin**
Board�Meetings 4 3 4 4 4 4 4 1Audit�CommitteeMeetings 2 2 2 2 1 2 2 –Ad-hoc�BoardMeetings 8 3 6 – 1 7 1 1
* ������Resigned�from�the�Board�of�Directors�on�13�April�2011.
** ����Appointed�to�the�Board�of�Directors�on�24�February�2011.
Douglas�Mackay� and�Brian�Horsepool� attended� as� alternate� directors� for�Christopher� Spencer� and�WayneBulpitt,�respectively�at�the�Board�Meeting�held�on�12�July�2010.
Performance Evaluation
The�Chairman�evaluates�the�performance�of�each�of�the�Directors�on�an�ongoing�basis,�taking�into�account�theeffectiveness�of�their�contributions�and�their�commitment�to�the�role.�The�Chairman�conducts�formal�appraisalswith�each�Director�on�an�annual�basis.�The�Board�conducts�a�similar�appraisal�of�the�Chairman.
Re-election
In�accordance�with�the�Company’s�Articles�of�Association,�at�each�AGM�one-third�of�the�Directors,�(or�if�theirnumber�is�not�three�or�an�integral�multiple�of�three),�the�number�nearest�to,�but�(except�where�there�are�lessthan�three�Directors)�not�greater�than�one-third,�shall�retire�from�office.
On� 23�November� 2010� at� the� 6th�AGM�of� the�Company,� Peter� Luthy� and�Christopher� Spencer� retired� asDirectors�of� the�Company�and�being�eligible�had�offered� themselves� for� re-election�and�were� re-elected�asDirectors�of�the�Company�by�the�Shareholders.
As�Peter�Luthy�and�Wayne�Bulpitt are�Directors�of�other�companies�managed�by�the�Company’s�InvestmentManager�they�are�deemed�to�be�non�independent�Directors�and�therefore�stand�for�re-election�at�each�annualgeneral�meeting.
7 Annual Financial Report
RUFFER INVESTMENT COMPANY LIMITEDReport of the Directors (continued)
Re-election (continued)
The�Directors�may�at�any� time�appoint�any�person� to�be�a�Director�either� to� fill�a�casual�vacancy�or�as�anaddition�to�the�existing�directors.�Any�director�so�appointed�shall�hold�office�only�until,�and�shall�be�eligiblefor�re-election�at,�the�next�general�meeting�following�their�appointment�but�shall�not�be�taken�into�account�indetermining�the�directors�or� the�number�of�directors�who�are�to�retire�by�rotation�at� that�meeting�if� it� is�anAGM.
In� accordance�with� the�Company’s�Articles� of�Association� John� de�Havilland� resigned� from� the�Board� ofDirectors�on�13�April�2011�having�reached�the�mandatory�retirement�age�of�73.
Supply of Information
The� quarterly� board�meetings� are� the� principal� source� of� regular� information� for� the�Board� enabling� it� todetermine�policy�and�to�monitor�performance�and�compliance.�The�Board�also�receives�regular�weekly�andmonthly� reports� on� portfolio� activity� and� performance� as� well� as� occasional� reports� on� items� of� interest.A representative�of�the�Investment�Manager�attends�each�board�meeting�thus�enabling�the�Board�to�discuss�andreview�the�Company’s�operations�and�performance.
All�of�the�Directors�have�direct�access�to�the�Company�Secretary,�and�may,�at�the�expense�of�the�Company,seek�independent�professional�advice�on�any�matter�that�concerns�them�in�the�furtherance�of�their�duties.
Directors’ Responsibilities in Respect of the Financial Statements
The� Directors� are� responsible� for� preparing� the� Report� of� the� Directors� and� the� financial� statements� inaccordance�with�applicable�law�and�regulations.
Company�law�requires�the�Directors�to�prepare�financial�statements�for�each�financial�year.�Under�that�law�theyhave� elected� to� prepare� the� financial� statements� in� accordance� with� International� Financial� ReportingStandards�(“IFRS”)�and�applicable�law.
The�financial�statements�are�required�by�law�to�give�a�true�and�fair�view�of�the�state�of�affairs�of�the�Companyand�of�the�profit�or�loss�of�the�Company�for�that�period.
In�preparing�those�financial�statements�the�Directors�are�required�to:
• �����select�suitable�accounting�policies�and�then�apply�them�consistently;
• �����make�judgements�and�estimates�that�are�reasonable�and�prudent;
• �����state�whether� applicable� accounting� standards� have� been� followed,� subject� to� any�material� departuresdisclosed�and�explained�in�the�financial�statements;�and
• �����prepare�the�financial�statements�on�the�going�concern�basis�unless�it�is�inappropriate�to�assume�that�theCompany�will�continue�in�business.
The�Directors�are�responsible�for�keeping�proper�accounting�records�which�disclose�with�reasonable�accuracyat�any�time�the�financial�position�of�the�Company�and�enable�them�to�ensure�that�the�financial�statements�havebeen� properly� prepared� in� accordance� with� The� Companies� (Guernsey)� Law,� 2008.� They� have� generalresponsibility�for�taking�such�steps�as�are�reasonably�open�to�them�to�safeguard�the�assets�of�the�Company�andto�prevent�and�detect�fraud�and�other�irregularities.
Directors’ Responsibility Statement
The� Directors� confirm� that� they� have� complied� with� the� above� requirements� in� preparing� the� financialstatements�and�that�to�the�best�of�their�knowledge�and�belief:
(a) ��The�Annual�Financial�Report,�prepared�in�accordance�with�International�Financial�Reporting�Standards,gives�a�true�and�fair�view�of�the�assets,�liabilities,�financial�position�and�profit�of�the�Company;�and
(b) ��The�Chairman’s�Review,�Investment�Manager’s�Report�and�Report�of�the�Directors�includes�a�fair�reviewof� the�development�and�performance�of� the�business�and� the�position�of� the�Company� together�with�adescription�of�the�principal�risks�and�uncertainties�that�the�Company�faces.
The�Directors�recognise�their�responsibilities�stated�above.
Annual Financial Report 8
RUFFER INVESTMENT COMPANY LIMITEDReport of the Directors (continued)
Disclosure of Information to the Auditor
The�Directors�who�held�office�at�the�date�of�approval�of�these�financial�statements�confirm�that,�so�far�as�theyare�each�aware,�there�is�no�relevant�audit�information�of�which�the�Company’s�auditor�is�unaware;�and�eachDirector�has�taken�all�the�steps�that�they�ought�to�have�taken�as�a�Director�to�make�themselves�aware�of�anyrelevant�audit�information�and�to�establish�that�the�Company’s�auditor�is�aware�of�that�information.
Audit Committee
The� Company’s� Audit� Committee� is� comprised of� the� Independent� Directors, with� Christopher� Spencerappointed�as�Chairman.�The�Audit�Committee�has�the�following�remit:�to�meet�bi-annually�and�to�consider,inter-alia:�(a) annual�and�interim�financial�statements;�(b)�auditor�reports;�and�(c)�terms�of�appointment�andremuneration�for�the�auditor�(including�overseeing�the�independence�of�the�auditor�particularly�as�it�relates�tothe�provision�of�non-audit�services).�The�Board�is�satisfied�that�the�Audit�Committee�contains�members�withsufficient�recent�and�relevant�financial�experience.
The�Audit�Committee�has�considered� the�requirement� for�an�annual� internal�audit�of� the�Company.�On� thebasis� that� the�Company� is� an� investment� company�with�no� employees,� and,� due� to� the�Company’s� serviceproviders�all�being�regulated�entities�who�themselves�are�subject�to�internal�audits,�the�Audit�Committee�is�ofthe�opinion�that�an�internal�audit�is�not�necessary�for�the�Company.
Nomination Committee
The�Board�as�a�whole�fulfils�the�function�of�a�Nomination�Committee.�Any�proposal�for�a�new�Director�willbe� discussed� and� approved� by� the� Board.� The� Board�will� determine�whether� in� future� an� external� searchconsultancy�or�open�advertising�is�used�in�the�appointments�of�non-executive�Directors.
Directors’ Remuneration
The� level�of�Directors’� fees� is�determined�by� the�whole�Board�on�an�annual�basis�and� therefore�a�separateRemuneration�Committee�has�not�been�appointed.�When�considering�the�level�of�Directors’�remuneration�theBoard�considers� the� industry�standard�and�the� level�of�work� that� is�undertaken.�Since�all�Directors�are�nonexecutive,� the�Company� is�not� required� to�comply�with� the�principles�of� the�Combined�Code� in� respect�ofexecutive�directors’� remuneration.�Directors’� fees�are�disclosed�fully� in�each�Annual�Financial�Report.�Thebasic� fee� payable� to� the� Chairman� is� £28,500� per� annum and� £20,000� per� annum to� each� non-executivedirector.�These�fees�have�remained�unchanged�since�1�April�2008,�although�a�supplement�of�£5,000�was�paidto� each� director� for� the� extra� work� incurred� as� a� result� of� the� issue� of� £50�million� worth� of� redeemableparticipating�preference�shares�on�20�September�2010.�None�of�the�Directors�had�a�service�contract�with�theCompany�during� the�year�and�accordingly�a�director� is�not�entitled� to�any�minimum�period�of�notice�or� tocompensation�in�the�event�of�their�removal�as�a�director.
Internal Control
The�Board�is�responsible�for�establishing�and�maintaining�the�Company’s�system�of�internal�control�and�formaintaining�and�reviewing�its�effectiveness.�The�system�of�internal�controls�is�designed�to�manage�rather�thanto�eliminate�the�risk�of�failure�to�achieve�business�objectives�and�as�such�can�only�provide�reasonable,�but�notabsolute,�assurance�against�material�misstatement�or�loss.
The�Board�considers�on�an�ongoing�basis�the�process�for�identifying,�evaluating�and�managing�any�significantrisks� faced� by� the�Company.�The� process� includes� reviewing� reports� from� the�Company�Secretary� on� riskcontrol�and�compliance,�in�conjunction�with�the�Investment�Manager’s�regular�reports�which�cover�investmentperformance.
The�Board� has� contractually� delegated� to� external� parties� various� functions� as� listed� below.�The� duties� ofinvestment�management,�accounting�and�custody�are�segregated.�Each�of�the�contracts�entered�into�with�theparties�was�entered�into�after�full�and�proper�consideration�by�the�Board�of�the�quality�and�cost�of�servicesoffered,�including�the�control�systems�in�operation�as�far�as�they�relate�to�the�affairs�of�the�Company.
9 Annual Financial Report
RUFFER INVESTMENT COMPANY LIMITEDReport of the Directors (continued)
Internal Control (continued)
• �����Investment�Management�is�provided�by�Ruffer�LLP,�a�company�authorised�by�the�FSA.
• �����Administration,�Accounting,�Registrar�and�Company�Secretarial�duties�are�performed�by�Northern�TrustInternational�Fund�Administration�Services�(Guernsey)�Limited,�a�company�licensed�and�regulated�by�theGuernsey�Financial�Services�Commission.
• �����CREST� agency� functions� are� performed� by� Computershare� (CI)� Limited,� a� company� licensed� andregulated�by�the�Jersey�Financial�Services�Commission.
• �����Custody�of�assets�is�undertaken�by�the�RBC�Dexia�Investor�Services�Trust,�a�joint�venture�equally�ownedby�Royal�Bank�of�Canada�and�Dexia�and�is�authorised�and�regulated�by�the�FSA.
Dialogue with Shareholders
The�Investment�Manager�and�the�Corporate�Broker�maintain�regular�dialogue�with�institutional�shareholders,feedback� from� which� is� reported� to� the� Board.� In� addition,� Board� members� sometimes� attend� meetingsbetween�the�Investment�Manager�and�institutional�shareholders�and�they�are�available�to�answer�shareholders’questions�at�any� time,�and�specifically�at� the�AGM.�The�Company�Secretary� is�available� to�answer�generalshareholder�queries�at�any�time�during�the�year.
Auditor
The�Auditor,�Moore�Stephens,�have�indicated�their�willingness�to�continue�in�office.�Accordingly,�a�resolutionfor�their�reappointment�will�be�proposed�at�the�forthcoming�Annual�General�Meeting.
On�behalf�of�the�Board
Ashe Windham Christopher SpencerChairman Director
23�September�2011
Annual Financial Report 10
RUFFER INVESTMENT COMPANY LIMITEDReport of the Directors (continued)
For the year ended 30 June 2011
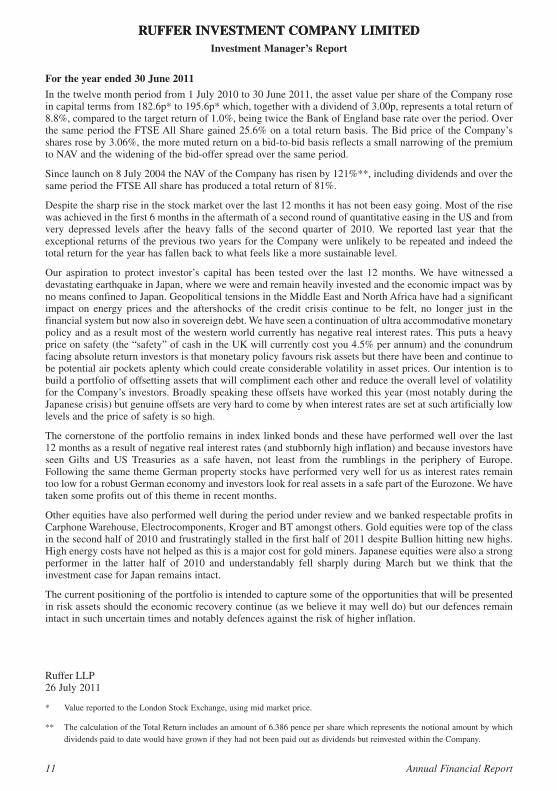
In�the�twelve�month�period�from�1�July�2010�to�30�June�2011,�the�asset�value�per�share�of�the�Company�rosein�capital�terms�from�182.6p*�to�195.6p*�which,�together�with�a�dividend�of�3.00p,�represents�a�total�return�of8.8%,�compared�to�the�target�return�of�1.0%,�being�twice�the�Bank�of�England�base�rate�over�the�period.�Overthe�same�period�the�FTSE�All�Share�gained�25.6%�on�a�total�return�basis. The�Bid�price�of�the�Company’sshares�rose�by�3.06%,�the�more�muted�return�on�a�bid-to-bid�basis�reflects�a�small�narrowing�of�the�premiumto�NAV�and�the�widening�of�the�bid-offer�spread�over�the�same�period.
Since�launch�on�8�July�2004�the�NAV�of�the�Company�has�risen�by�121%**,�including�dividends�and�over�thesame�period�the�FTSE�All�share�has�produced�a�total�return�of�81%.
Despite�the�sharp�rise�in�the�stock�market�over�the�last�12�months�it�has�not�been�easy�going.�Most�of�the�risewas�achieved�in�the�first�6�months�in�the�aftermath�of�a�second�round�of�quantitative�easing�in�the�US�and�fromvery� depressed� levels� after� the� heavy� falls� of� the� second� quarter� of� 2010.�We� reported� last� year� that� theexceptional�returns�of�the�previous�two�years�for�the�Company�were�unlikely�to�be�repeated�and�indeed�thetotal�return�for�the�year�has�fallen�back�to�what�feels�like�a�more�sustainable�level.
Our� aspiration� to� protect� investor’s� capital� has� been� tested� over� the� last� 12�months.�We� have�witnessed� adevastating�earthquake�in�Japan,�where�we�were�and�remain�heavily�invested�and�the�economic�impact�was�byno�means�confined�to�Japan.�Geopolitical�tensions�in�the�Middle�East�and�North�Africa�have�had�a�significantimpact� on� energy� prices� and� the� aftershocks� of� the� credit� crisis� continue� to� be� felt,� no� longer� just� in� thefinancial�system�but�now�also�in�sovereign�debt.�We�have�seen�a�continuation�of�ultra�accommodative�monetarypolicy�and�as�a�result�most�of�the�western�world�currently�has�negative�real�interest�rates.�This�puts�a�heavyprice�on�safety�(the�“safety”�of�cash�in�the�UK�will�currently�cost�you�4.5%�per�annum)�and�the�conundrumfacing�absolute�return�investors�is�that�monetary�policy�favours�risk�assets�but�there�have�been�and�continue�tobe�potential�air�pockets�aplenty�which�could�create�considerable�volatility�in�asset�prices.�Our�intention�is�tobuild�a�portfolio�of�offsetting�assets�that�will�compliment�each�other�and�reduce�the�overall�level�of�volatilityfor�the�Company’s�investors.�Broadly�speaking�these�offsets�have�worked�this�year�(most�notably�during�theJapanese�crisis)�but�genuine�offsets�are�very�hard�to�come�by�when�interest�rates�are�set�at�such�artificially�lowlevels�and�the�price�of�safety�is�so�high.
The�cornerstone�of�the�portfolio�remains�in�index�linked�bonds�and�these�have�performed�well�over�the�last12 months�as�a�result�of�negative�real�interest�rates�(and�stubbornly�high�inflation)�and�because�investors�haveseen� Gilts� and� US� Treasuries� as� a� safe� haven,� not� least� from� the� rumblings� in� the� periphery� of� Europe.Following�the�same�theme�German�property�stocks�have�performed�very�well�for�us�as�interest�rates�remaintoo�low�for�a�robust�German�economy�and�investors�look�for�real�assets�in�a�safe�part�of�the�Eurozone.�We�havetaken�some�profits�out�of�this�theme�in�recent�months.
Other�equities�have�also�performed�well�during�the�period�under�review�and�we�banked�respectable�profits�inCarphone�Warehouse,�Electrocomponents,�Kroger�and�BT�amongst�others.�Gold�equities�were�top�of�the�classin�the�second�half�of�2010�and�frustratingly�stalled�in�the�first�half�of�2011�despite�Bullion�hitting�new�highs.High�energy�costs�have�not�helped�as�this�is�a�major�cost�for�gold�miners.�Japanese�equities�were�also�a�strongperformer� in� the� latter� half� of� 2010� and� understandably� fell� sharply� during�March� but� we� think� that� theinvestment�case�for�Japan�remains�intact.
The�current�positioning�of�the�portfolio�is�intended�to�capture�some�of�the�opportunities�that�will�be�presentedin�risk�assets�should�the�economic�recovery�continue�(as�we�believe�it�may�well�do)�but�our�defences�remainintact�in�such�uncertain�times�and�notably�defences�against�the�risk�of�higher�inflation.
Ruffer�LLP26�July�2011
* ������Value�reported�to�the�London�Stock�Exchange,�using�mid�market�price.
** ����The�calculation�of�the�Total�Return�includes�an�amount�of�6.386�pence�per�share�which�represents�the�notional�amount�by�whichdividends�paid�to�date�would�have�grown�if�they�had�not�been�paid�out�as�dividends�but�reinvested�within�the�Company.
RUFFER INVESTMENT COMPANY LIMITED
11 Annual Financial Report
RUFFER INVESTMENT COMPANY LIMITEDInvestment Manager’s Report
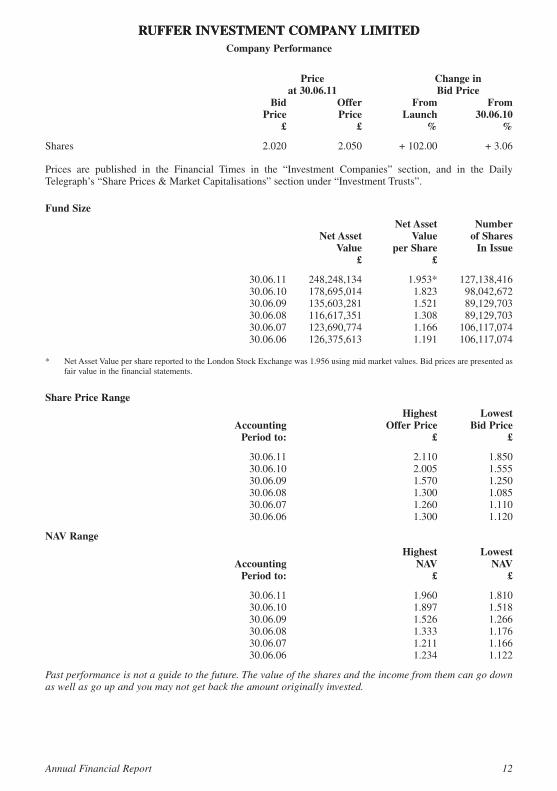
Price Change in at 30.06.11 Bid Price Bid Offer From From Price Price Launch 30.06.10 £ £ % %
Shares�����������������������������������������������������������������������2.020�������������������2.050 �������������+�102.00 �����������������+�3.06
Prices� are� published� in� the� Financial� Times� in� the� “Investment� Companies”� section,� and� in� the� DailyTelegraph’s�“Share�Prices�&�Market�Capitalisations”�section�under�“Investment�Trusts”.
Fund Size
Net Asset Number Net Asset Value of Shares Value per Share In Issue £ £
����������������������������������������������������������������������������30.06.11��������248,248,134�����������������1.953*��������127,138,416����������������������������������������������������������������������������30.06.10��������178,695,014�������������������1.823����������98,042,672����������������������������������������������������������������������������30.06.09��������135,603,281�������������������1.521����������89,129,703����������������������������������������������������������������������������30.06.08��������116,617,351�������������������1.308����������89,129,703����������������������������������������������������������������������������30.06.07��������123,690,774�������������������1.166��������106,117,074����������������������������������������������������������������������������30.06.06��������126,375,613�������������������1.191��������106,117,074
* ������Net�Asset�Value�per�share�reported�to�the�London�Stock�Exchange�was�1.956�using�mid�market�values.�Bid�prices�are�presented�asfair�value�in�the�financial�statements.
Share Price Range
Highest Lowest Accounting Offer Price Bid Price Period to: £ £
����������������������������������������������������������������������������30.06.11 �����������������������������������������������2.110�������������������1.850����������������������������������������������������������������������������30.06.10 �����������������������������������������������2.005�������������������1.555����������������������������������������������������������������������������30.06.09 �����������������������������������������������1.570�������������������1.250����������������������������������������������������������������������������30.06.08 �����������������������������������������������1.300�������������������1.085����������������������������������������������������������������������������30.06.07 �����������������������������������������������1.260�������������������1.110����������������������������������������������������������������������������30.06.06 �����������������������������������������������1.300�������������������1.120
NAV Range
Highest Lowest Accounting NAV NAV Period to: £ £
����������������������������������������������������������������������������30.06.11 �����������������������������������������������1.960�������������������1.810����������������������������������������������������������������������������30.06.10 �����������������������������������������������1.897�������������������1.518����������������������������������������������������������������������������30.06.09 �����������������������������������������������1.526�������������������1.266����������������������������������������������������������������������������30.06.08 �����������������������������������������������1.333�������������������1.176����������������������������������������������������������������������������30.06.07 �����������������������������������������������1.211�������������������1.166����������������������������������������������������������������������������30.06.06 �����������������������������������������������1.234�������������������1.122
Past performance is not a guide to the future. The value of the shares and the income from them can go downas well as go up and you may not get back the amount originally invested.
RUFFER INVESTMENT COMPANY LIMITED
Annual Financial Report 12
RUFFER INVESTMENT COMPANY LIMITEDCompany Performance
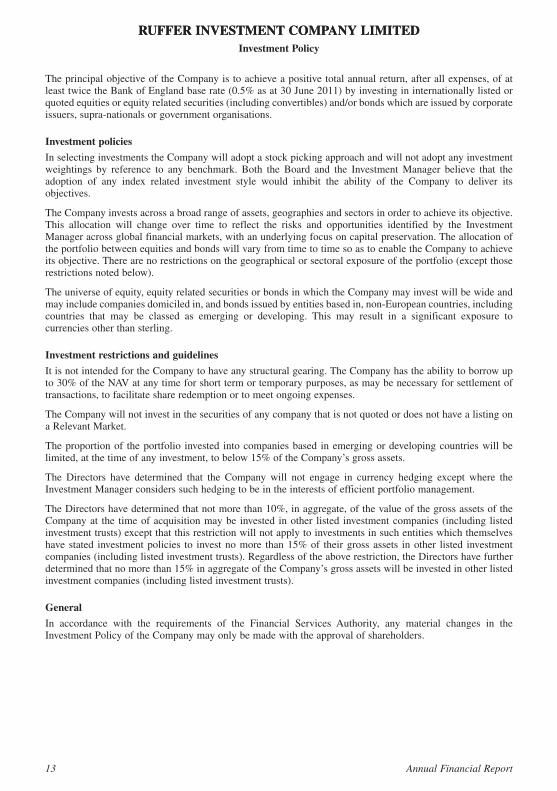
The�principal�objective�of�the�Company�is�to�achieve�a�positive�total�annual�return,�after�all�expenses,�of�atleast�twice�the�Bank�of�England�base�rate�(0.5%�as�at�30�June�2011)�by�investing�in�internationally�listed�orquoted�equities�or�equity�related�securities�(including�convertibles)�and/or�bonds�which�are�issued�by�corporateissuers,�supra-nationals�or�government�organisations.
Investment policies
In�selecting�investments�the�Company�will�adopt�a�stock�picking�approach�and�will�not�adopt�any�investmentweightings� by� reference� to� any� benchmark.� Both� the� Board� and� the� Investment�Manager� believe� that� theadoption� of� any� index� related� investment� style� would� inhibit� the� ability� of� the� Company� to� deliver� itsobjectives.
The�Company�invests�across�a�broad�range�of�assets,�geographies�and�sectors�in�order�to�achieve�its�objective.This� allocation� will� change� over� time� to� reflect� the� risks� and� opportunities� identified� by� the� InvestmentManager�across�global�financial�markets,�with�an�underlying�focus�on�capital�preservation.�The�allocation�ofthe�portfolio�between�equities�and�bonds�will�vary�from�time�to�time�so�as�to�enable�the�Company�to�achieveits�objective.�There�are�no�restrictions�on�the�geographical�or�sectoral�exposure�of�the�portfolio�(except�thoserestrictions�noted�below).
The�universe�of�equity,�equity�related�securities�or�bonds�in�which�the�Company�may�invest�will�be�wide�andmay�include�companies�domiciled�in,�and�bonds�issued�by�entities�based�in,�non-European�countries,�includingcountries� that� may� be� classed� as� emerging� or� developing.� This� may� result� in� a� significant� exposure� tocurrencies�other�than�sterling.
Investment restrictions and guidelines
It�is�not�intended�for�the�Company�to�have�any�structural�gearing.�The�Company�has�the�ability�to�borrow�upto�30%�of�the�NAV�at�any�time�for�short�term�or�temporary�purposes,�as�may�be�necessary�for�settlement�oftransactions,�to�facilitate�share�redemption�or�to�meet�ongoing�expenses.
The�Company�will�not�invest�in�the�securities�of�any�company�that�is�not�quoted�or�does�not�have�a�listing�ona�Relevant�Market.
The�proportion�of� the�portfolio� invested� into�companies�based� in�emerging�or�developing�countries�will�belimited,�at�the�time�of�any�investment,�to�below�15%�of�the�Company’s�gross�assets.
The� Directors� have� determined� that� the� Company� will� not� engage� in� currency� hedging� except� where� theInvestment�Manager�considers�such�hedging�to�be�in�the�interests�of�efficient�portfolio�management.
The�Directors�have�determined�that�not�more�than�10%,�in�aggregate,�of�the�value�of�the�gross�assets�of�theCompany�at� the� time�of�acquisition�may�be� invested� in�other� listed� investment�companies� (including� listedinvestment�trusts)�except�that�this�restriction�will�not�apply�to�investments�in�such�entities�which�themselveshave�stated� investment�policies� to� invest�no�more� than�15%�of� their�gross�assets� in�other� listed� investmentcompanies�(including�listed�investment�trusts).�Regardless�of�the�above�restriction,�the�Directors�have�furtherdetermined�that�no�more�than�15%�in�aggregate�of�the�Company’s�gross�assets�will�be�invested�in�other�listedinvestment�companies�(including�listed�investment�trusts).
General
In� accordance� with� the� requirements� of� the Financial� Services Authority,� any� material� changes� in� theInvestment�Policy�of�the�Company�may�only�be�made�with�the�approval�of�shareholders.
RUFFER INVESTMENT COMPANY LIMITED
13 Annual Financial Report
RUFFER INVESTMENT COMPANY LIMITEDInvestment Policy
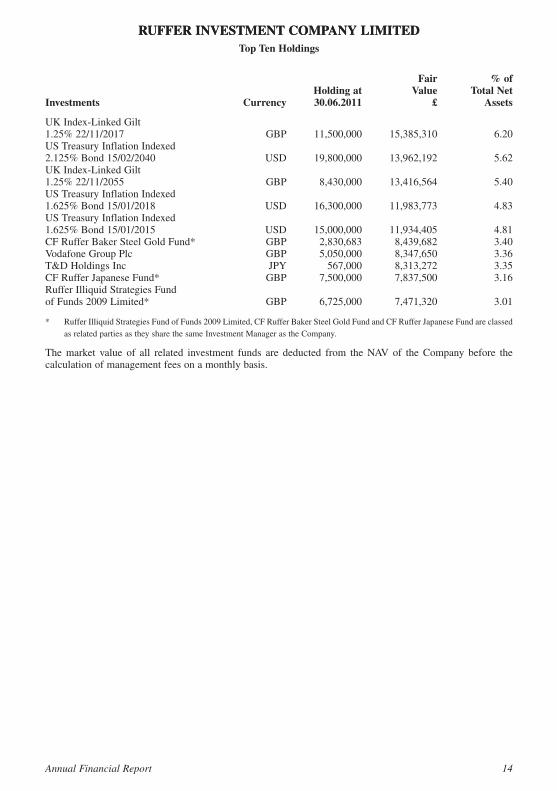
Fair % of Holding at Value Total NetInvestments Currency 30.06.2011 £ Assets
UK�Index-Linked�Gilt1.25%�22/11/2017�����������������������������������������������������GBP����������11,500,000����������15,385,310���������������������6.20US�Treasury�Inflation�Indexed2.125%�Bond�15/02/2040�����������������������������������������USD����������19,800,000����������13,962,192���������������������5.62UK�Index-Linked�Gilt1.25%�22/11/2055�����������������������������������������������������GBP������������8,430,000����������13,416,564���������������������5.40US�Treasury�Inflation�Indexed1.625%�Bond�15/01/2018�����������������������������������������USD����������16,300,000����������11,983,773���������������������4.83US�Treasury�Inflation�Indexed1.625%�Bond�15/01/2015�����������������������������������������USD����������15,000,000����������11,934,405���������������������4.81CF�Ruffer�Baker�Steel�Gold�Fund* ��������������������������GBP������������2,830,683������������8,439,682���������������������3.40Vodafone�Group�Plc��������������������������������������������������GBP������������5,050,000������������8,347,650���������������������3.36T&D�Holdings�Inc �����������������������������������������������������JPY���������������567,000������������8,313,272���������������������3.35CF�Ruffer�Japanese�Fund* ���������������������������������������GBP������������7,500,000������������7,837,500���������������������3.16Ruffer�Illiquid�Strategies�Fundof�Funds�2009�Limited* �������������������������������������������GBP������������6,725,000������������7,471,320���������������������3.01
* ������Ruffer�Illiquid�Strategies�Fund�of�Funds�2009�Limited,�CF�Ruffer�Baker�Steel�Gold�Fund�and�CF�Ruffer�Japanese�Fund�are�classedas�related�parties�as�they�share�the�same�Investment�Manager�as�the�Company.
The�market� value� of� all� related� investment� funds� are� deducted� from� the�NAV�of� the�Company� before� thecalculation�of�management�fees�on�a�monthly�basis.
RUFFER INVESTMENT COMPANY LIMITED
Annual Financial Report 14
RUFFER INVESTMENT COMPANY LIMITEDTop Ten Holdings
We�have�audited�the�financial�statements�of�Ruffer�Investment�Company�Limited�(the�“Company”)�for�the�yearended�30�June�2011�which�comprise� the�Statement�of�Financial�Position,� the�Statement�of�ComprehensiveIncome,�the�Statement�of�Changes�in�Equity,�the�Statement�of�Cash�Flows,�and�the�related�notes.�The�financialreporting�framework�that�has�been�applied�in�their�preparation�is�applicable�law�and�International�FinancialReporting�Standards.
This� report� is�made� solely� to� the� company's�members� as� a� body,� in� accordance�with� Section� 262� of�TheCompanies� (Guernsey)� Law,� 2008.� Our� audit� work� has� been� undertaken� so� that� we� might� state� to� thecompany's�members� those�matters�we�are� required� to� state� to� them� in� an�auditor’s� report� and� for�no�otherpurpose.�To�the�fullest�extent�permitted�by�law,�we�do�not�accept�or�assume�responsibility�to�anyone�other�thanthe�Company�and�the�Company's�members�as�a�body,�for�our�audit�work,�for�this�report,�or�for�the�opinionswe�have�formed.
Respective responsibilities of directors and auditor
As�explained�more�fully�in�the�Report�of�the�Directors,�the�directors�are�responsible�for�the�preparation�of�thefinancial�statements�and�for�being�satisfied�that�they�give�a�true�and�fair�view.
Our�responsibility�is�to�audit�and�express�an�opinion�on�the�financial�statements�in�accordance�with�applicablelaw�and�International�Standards�on�Auditing�(UK�and�Ireland).�These�standards�require�us�to�comply�with�theAuditing�Practices�Board’s�Ethical�Standards�for�Auditors.
Scope of the audit of the financial statements
An�audit�involves�obtaining�evidence�about�the�amounts�and�disclosures�in�the�financial�statements�sufficientto�give�reasonable�assurance�that�the�financial�statements�are�free�from�material�misstatement,�whether�causedby� fraud� or� error.� This� includes� an� assessment� of:� whether� the� accounting� policies� are� appropriate� to� thecompany's�circumstances�and�have�been�consistently�applied�and�adequately�disclosed;�the�reasonableness�ofsignificant�accounting�estimates�made�by�the�directors;�and�the�overall�presentation�of�the�financial�statements.In�addition,�we�read�all�the�financial�and�non-financial�information�in�the�annual�report�to�identify�materialinconsistencies� with� the� audited� financial� statements.� If� we� become� aware� of� any� apparent� materialmisstatements�or�inconsistencies,�we�consider�the�implications�for�our�report.
Opinion
In�our�opinion�the�financial�statements:
• �����give�a�true�and�fair�view�of�the�state�of�the�Company’s�affairs�as�at�30�June�2011�and�of�its�profit�for�theyear�then�ended;
• �����are�in�accordance�with�International�Financial�Reporting�Standards;�and
• �����have�been�prepared�in�accordance�with�the�requirements�of�The�Companies�(Guernsey)�Law,�2008.
RUFFER INVESTMENT COMPANY LIMITED
15 Annual Financial Report
RUFFER INVESTMENT COMPANY LIMITEDIndependent Auditor’s Report to the shareholders of
Ruffer Investment Company Limited
Matters on which we are required to report by exception
We�have�nothing�to�report�in�respect�of�the�following�matters�where�The�Companies�(Guernsey)�Law,�2008requires�us�to�report�to�you�if,�in�our�opinion:
• �����proper�accounting�records�have�not�been�kept�by�the�company;�or
• �����the�financial�statements�are�not�in�agreement�with�the�accounting�records;�or
• �����we�have�failed�to�obtain�all�the�information�and�explanations,�which,�to�the�best�of�our�knowledge�andbelief,�are�necessary�for�the�purposes�of�our�audit.
David�GreenMOORE STEPHENSChartered�AccountantsTown�Mills�SouthLa�Rue�Du�PreSt�Peter�PortGuernsey,�GY1�3HZ23�September 2011
RUFFER INVESTMENT COMPANY LIMITED
Annual Financial Report 16
RUFFER INVESTMENT COMPANY LIMITEDIndependent Auditor’s Report to the shareholders ofRuffer Investment Company Limited (continued)
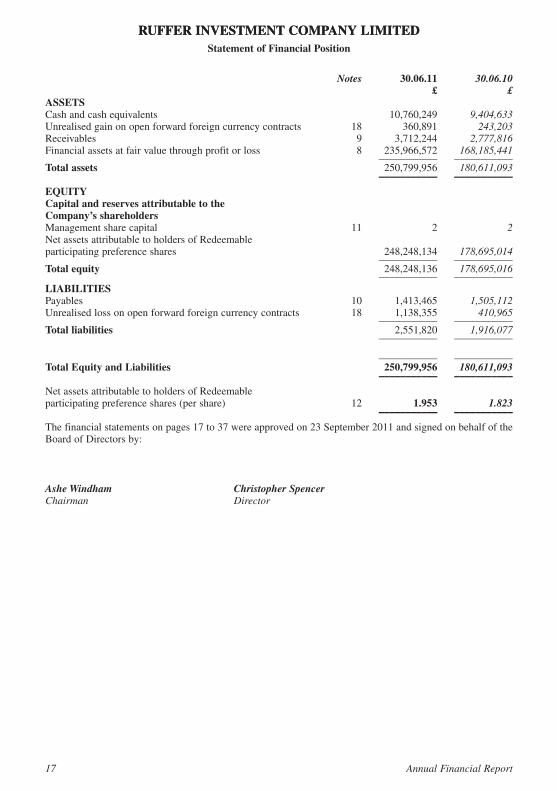
�������������������������������������������������������������������������������������������������������������Notes ��������������30.06.11 ��������������30.06.10�������������������������������������������������������������������������������������������������������������������������������������������������£ ��������������������������£ASSETS ������������������������������������������������������������������������������������������������������������������������������������Cash�and�cash�equivalents���������������������������������������������������������������������������������������10,760,249������������9,404,633Unrealised�gain�on�open�forward�foreign�currency�contracts ������������������18���������������360,891���������������243,203Receivables �������������������������������������������������������������������������������������������������9������������3,712,244������������2,777,816Financial�assets�at�fair�value�through�profit�or�loss������������������������������������8��������235,966,572��������168,185,441 ––––––––––– –––––––––––Total assets �����������������������������������������������������������������������������������������������������������250,799,956��������180,611,093 ––––––––––– –––––––––––EQUITY Capital and reserves attributable to the Company’s shareholders ����������������������������������������������������������������������������Management�share�capital ������������������������������������������������������������������������11��������������������������2��������������������������2Net�assets�attributable�to�holders�of�Redeemableparticipating�preference�shares������������������������������������������������������������������������������248,248,134��������178,695,014 ––––––––––– –––––––––––Total equity ����������������������������������������������������������������������������������������������������������248,248,136��������178,695,016 ––––––––––– –––––––––––LIABILITIESPayables ����������������������������������������������������������������������������������������������������10������������1,413,465������������1,505,112Unrealised�loss�on�open�forward�foreign�currency�contracts �������������������18������������1,138,355���������������410,965 ––––––––––– –––––––––––Total liabilities ���������������������������������������������������������������������������������������������������������2,551,820������������1,916,077 ––––––––––– –––––––––––
––––––––––– –––––––––––Total Equity and Liabilities ������������������������������������250,799,956 ��������180,611,093 ––––––––––– –––––––––––Net�assets�attributable�to�holders�of�Redeemableparticipating�preference�shares�(per�share)�����������������������������������������������12�������������������1.953 �������������������1.823 ––––––––––– –––––––––––The�financial�statements�on�pages 17 to 37 were�approved�on�23�September�2011�and�signed�on�behalf�of�theBoard�of�Directors�by:
Ashe Windham Christopher SpencerChairman Director
RUFFER INVESTMENT COMPANY LIMITED
17 Annual Financial Report
RUFFER INVESTMENT COMPANY LIMITEDStatement of Financial Position
01.07.10 to 01.07.09 to 30.06.11 30.06.10 Notes Revenue Capital Total Total £ £ £ £
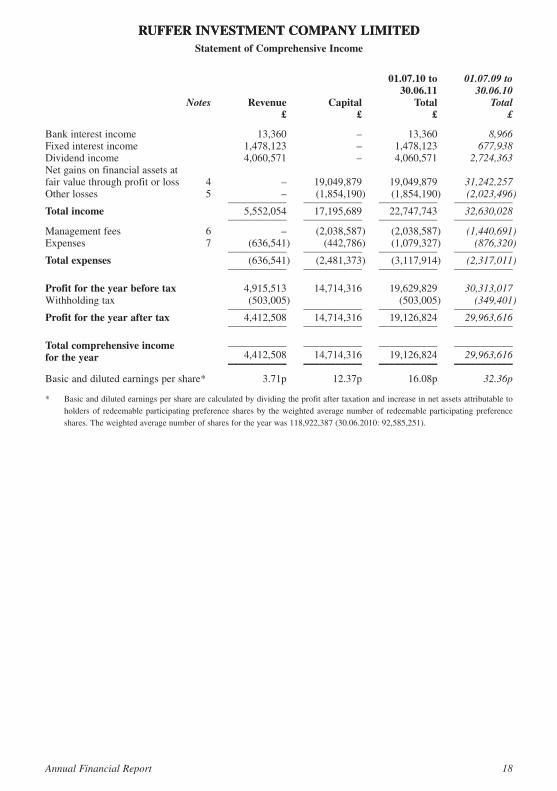
Bank�interest�income ���������������������������������������������13,360��������������������������–�����������������13,360�������������������8,966Fixed�interest�income ���������������������������������������1,478,123��������������������������–������������1,478,123���������������677,938Dividend�income�����������������������������������������������4,060,571��������������������������–������������4,060,571������������2,724,363Net�gains�on�financial�assets�atfair�value�through�profit�or�loss ���������4��������������������������–����������19,049,879����������19,049,879����������31,242,257Other�losses ����������������������������������������5��������������������������–�����������(1,854,190) ���������(1,854,190) ���������(2,023,496) ––––––––––– ––––––––––– ––––––––––– –––––––––––Total income ����������������������������������������������������5,552,054����������17,195,689����������22,747,743����������32,630,028 ––––––––––– ––––––––––– ––––––––––– –––––––––––Management�fees �������������������������������6��������������������������–�����������(2,038,587) ���������(2,038,587) ���������(1,440,691)Expenses���������������������������������������������7��������������(636,541) ������������(442,786) ���������(1,079,327) ������������(876,320) ––––––––––– ––––––––––– ––––––––––– –––––––––––Total expenses ���������������������������������������������������(636,541) ���������(2,481,373) ���������(3,117,914) ���������(2,317,011) ––––––––––– ––––––––––– ––––––––––– –––––––––––
Profit for the year before tax �������������������������4,915,513����������14,714,316����������19,629,829����������30,313,017Withholding�tax��������������������������������������������������(503,005)�����������������������������������������(503,005) ������������(349,401) ––––––––––– ––––––––––– ––––––––––– –––––––––––Profit for the year after tax ���������������������������4,412,508����������14,714,316����������19,126,824����������29,963,616 ––––––––––– ––––––––––– ––––––––––– –––––––––––
––––––––––– ––––––––––– ––––––––––– –––––––––––���������4,412,508����������14,714,316����������19,126,824����������29,963,616 ––––––––––– ––––––––––– ––––––––––– –––––––––––
Basic�and�diluted�earnings�per�share*���������������������3.71p�����������������12.37p�����������������16.08p�����������������32.36p
* ������Basic�and�diluted�earnings�per�share�are�calculated�by�dividing�the�profit�after�taxation�and�increase�in�net�assets�attributable�toholders�of� redeemable�participating�preference�shares�by� the�weighted�average�number�of� redeemable�participating�preferenceshares.�The�weighted�average�number�of�shares�for�the�year�was�118,922,387�(30.06.2010:�92,585,251).
Total comprehensive incomefor the year
RUFFER INVESTMENT COMPANY LIMITED
Annual Financial Report 18
RUFFER INVESTMENT COMPANY LIMITEDStatement of Comprehensive Income
Total Share Distributable 01.07.10 to capital reserves 30.06.11 £ £ £
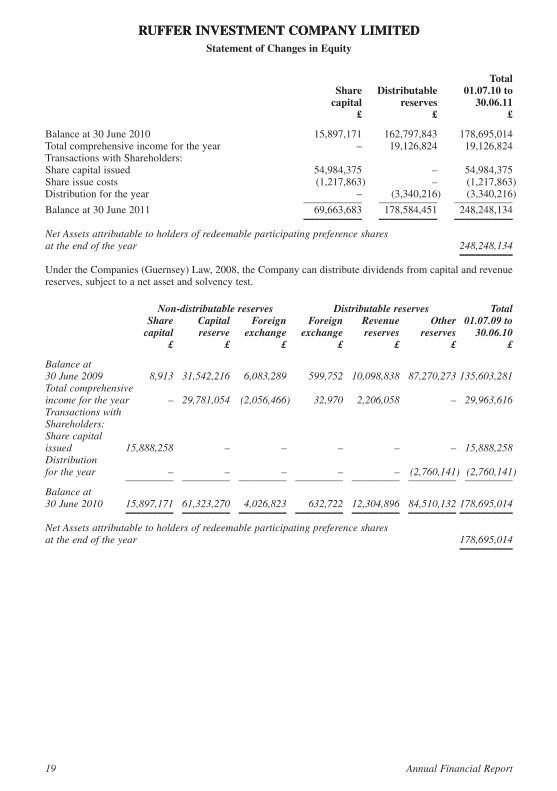
Balance�at�30�June�2010 �������������������������������������������������������������15,897,171��������162,797,843��������178,695,014Total�comprehensive�income�for�the�year���������������������������������������������������–����������19,126,824����������19,126,824Transactions�with�Shareholders:Share�capital�issued���������������������������������������������������������������������54,984,375��������������������������–����������54,984,375Share�issue�costs ��������������������������������������������������������������������������(1,217,863)�������������������������–�����������(1,217,863)Distribution�for�the�year������������������������������������������������������������������������������–�����������(3,340,216) ���������(3,340,216)�������������������������������������������������������������������������������������������������––––––––––– ––––––––––– –––––––––––Balance�at�30�June�2011 �������������������������������������������������������������69,663,683��������178,584,451��������248,248,134�������������������������������������������������������������������������������������������������––––––––––– ––––––––––– –––––––––––Net Assets attributable to holders of redeemable participating preference sharesat the end of the year 248,248,134 ––––––––––Under�the�Companies�(Guernsey)�Law,�2008,�the�Company�can�distribute�dividends�from�capital�and�revenuereserves,�subject�to�a�net�asset�and�solvency�test.
Non-distributable reserves Distributable reserves Total Share Capital Foreign Foreign Revenue Other 01.07.09 to capital reserve exchange exchange reserves reserves 30.06.10 £ £ £ £ £ £ £
Balance at30 June 2009 8,913 31,542,216 6,083,289 599,752 10,098,838 87,270,273 135,603,281Total comprehensiveincome for the year – 29,781,054 (2,056,466) 32,970 2,206,058 – 29,963,616Transactions withShareholders:Share capitalissued 15,888,258 – – – – – 15,888,258Distributionfor the year – – – – – (2,760,141) (2,760,141) ––––––––– ––––––––– ––––––––– ––––––––– ––––––––– ––––––––– –––––––––Balance at30 June 2010 15,897,171 61,323,270 4,026,823 632,722 12,304,896 84,510,132 178,695,014������������������������������–––––––––���–––––––––���–––––––––���–––––––––���–––––––––���–––––––––�––––––––––Net Assets attributable to holders of redeemable participating preference sharesat the end of the year 178,695,014 ––––––––––
RUFFER INVESTMENT COMPANY LIMITED
19 Annual Financial Report
RUFFER INVESTMENT COMPANY LIMITEDStatement of Changes in Equity
01.07.10 to 01.07.09 to 30.06.11 30.06.10 Total Total £ £
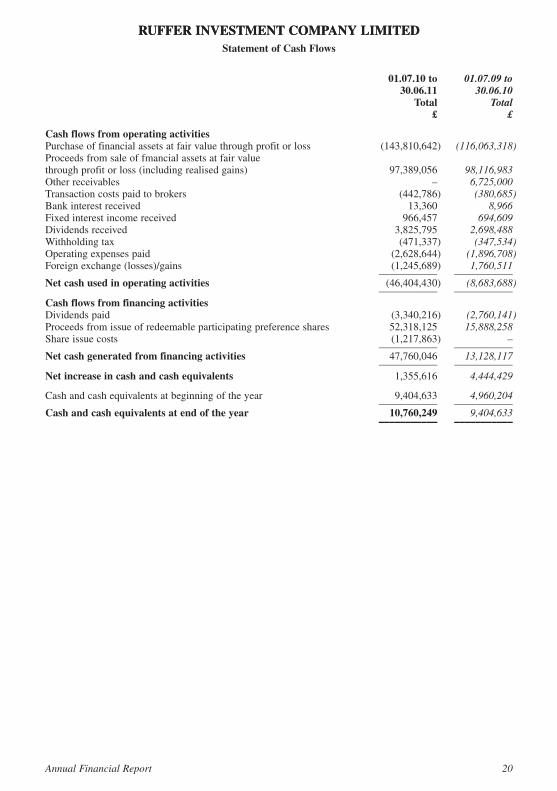
Cash flows from operating activitiesPurchase�of�financial�assets�at�fair�value�through�profit�or�loss��������������������������(143,810,642) �����(116,063,318)Proceeds�from�sale�of�fmancial�assets�at�fair�valuethrough�profit�or�loss�(including�realised�gains)�����������������������������������������������������97,389,056����������98,116,983Other�receivables ���������������������������������������������������������������������������������������������������������������������–������������6,725,000Transaction�costs�paid�to�brokers �������������������������������������������������������������������������������(442,786) ������������(380,685)Bank�interest�received ����������������������������������������������������������������������������������������������������13,360�������������������8,966Fixed�interest�income�received�������������������������������������������������������������������������������������966,457���������������694,609Dividends�received ����������������������������������������������������������������������������������������������������3,825,795������������2,698,488Withholding�tax�����������������������������������������������������������������������������������������������������������(471,337) ������������(347,534)Operating�expenses�paid ������������������������������������������������������������������������������������������(2,628,644) ���������(1,896,708)Foreign�exchange�(losses)/gains ������������������������������������������������������������������������������(1,245,689)�����������1,760,511 ––––––––––– –––––––––––Net cash used in operating activities ������������������������������������������������������������������(46,404,430) ���������(8,683,688) ––––––––––– –––––––––––Cash flows from financing activitiesDividends�paid ���������������������������������������������������������������������������������������������������������(3,340,216) ���������(2,760,141)Proceeds�from�issue�of�redeemable�participating�preference�shares ����������������������52,318,125����������15,888,258Share�issue�costs ������������������������������������������������������������������������������������������������������(1,217,863)�������������������������– ––––––––––– –––––––––––Net cash generated from financing activities������������������������������������������������������47,760,046����������13,128,117 ––––––––––– –––––––––––Net increase in cash and cash equivalents ������������������������������������������������������������1,355,616������������4,444,429
Cash�and�cash�equivalents�at�beginning�of�the�year �������������������������������������������������9,404,633������������4,960,204 ––––––––––– –––––––––––Cash and cash equivalents at end of the year ����������������������������������������������������10,760,249 ������������9,404,633 ––––––––––– –––––––––––
RUFFER INVESTMENT COMPANY LIMITED
Annual Financial Report 20
RUFFER INVESTMENT COMPANY LIMITEDStatement of Cash Flows
1. Significant accounting policies
Basis of preparation
The� financial� statements� are� prepared� in� accordance� with� International� Financial� Reporting� Standards(“IFRS”),�which�comprise�standards�and�interpretations�approved�by�the�International�Accounting�StandardsBoard�(“IASB”)�and�are�in�compliance�with�The�Companies�(Guernsey)�Law,�2008.�The�financial�statementshave�been�prepared�under�the�historical�cost�convention,�as�modified�by�the�revaluation�of�financial�assets�andfinancial�liabilities�at�fair�value�through�profit�or�loss.
This�annual�report�and�financial�statements,�covering�the�year�from�1�July�2010�to�30�June�2011,�has�beenaudited.
Standards, amendments and interpretations that are not yet effective
The�following�standards�and�interpretations,�which�have�not�been�applied�in�these�financial�statements,�werein�issue�at�the�reporting�date�but�not�yet�effective:
• �����IAS�24�(amendments)�– Related�party�disclosures�(effective�date�–�1�January�2011);
• �����IFRS�9�– Financial�instruments:�Classification�and�measurement�(effective�date�–�1�January�2013);
• �����IFRS�10�– Consolidated�Financial�Statements�(effective�date�–�1�January�2013);
• �����IFRS�11�– Joint�arrangements�(effective�date�–�1�January�2013);
• �����IFRS�12�– Disclosure�of�interest�in�other�entities�(effective�date�–�1�January�2013);
• �����IFRS�13�– Fair�value�measurement�(effective�date�–�1�January�2013);
• �����IFRIC�14�(amendments)�– Prepayments�of�a�minimum�funding�requirement�(effective�date�–�1�January2011).
The�Board�anticipate�that�the�adoption�of�these�standards�and�interpretations�in�a�future�period�will�not�have�amaterial�impact�on�the�financial�statements�of�the�Company,�other�than�IFRS�9�and�IFRS�13.�The�Company�iscurrently�evaluating�the�potential�effect�of�these�standards.
Annual�improvements�to�IFRS’s�were�issued�by�the�IASB�on�6�May�2010�and�contain�minor�amendments�tostandards�for�periods�beginning�on�or�after�1�January�2011.�No�material�changes�to�accounting�policies�areexpected�as�a�result�of�these�changes.
Financial instruments
Financial� assets� and� financial� liabilities� are� recognised� on� the�Company’s� Statement� of� Financial� Positionwhen�the�Company�becomes�a�party�to�the�contractual�provisions�of�the�instrument.
Investments assets at fair value through profit or loss (“investments”)
Purchases�and�sales�of�investments�are�recognised�on�the�trade�date�(the�date�on�which�the�Company�commitsto� purchase� or� sell� the� investment).� Investments� purchased� are� initially� recorded� at� fair� value,� being� theconsideration�given�and�excluding�transaction�or�other�dealing�costs�associated�with�the�investment.
Subsequent� to� initial� recognition,� investments� are� measured� at� fair� value.� Gains� and� losses� arising� fromchanges� in� the� fair� value� of� investments� and� gains� and� losses� on� investments� that� are� sold� are� recognisedthrough�profit�or�loss�in�the�Statement�of�Comprehensive�Income�within�net�gains�on�investments�assets�at�fairvalue�through�profit�or�loss.
RUFFER INVESTMENT COMPANY LIMITEDNotes to the Financial Statements
21 Annual Financial Report
1. Significant accounting policies (continued)
Financial instruments (continued)
Forward foreign currency contracts
Forward�foreign�currency�contracts�are�treated�as�derivative�contracts�and�as�such�are�recognised�at�fair�valueon� the� date� on�which� they� are� entered� into� and� subsequently� remeasured� at� their� fair� value.� Fair� value� isdetermined�by�rates�in�active�currency�markets.�All�derivatives�are�carried�as�assets�when�fair�value�is�positiveand�as�liabilities�when�fair�value�is�negative.�The�gain�or�loss�on�remeasurement�to�fair�value�is�recognisedimmediately�through�profit�or�loss�in�the�Statement�of�Comprehensive�Income�within�other�losses�and�gainsin�the�period�in�which�they�arise.
Other financial instruments
For�other�financial�instruments,�including�other�receivables�and�other�payables,�the�carrying�amounts�as�shownin�the�Statement�of�Financial�Position�approximate�to�fair�values�due�to�the�short�term�nature�of�these�financialinstruments.
Offsetting of financial instruments
Financial�assets�and�financial�liabilities�are�offset�and�the�net�amount�reported�in�the�Statement�of�FinancialPosition,�if�and�only�if,�there�is�a�currently�enforceable�legal�right�to�offset�the�recognised�amounts�and�thereis�an�intention�to�settle�on�a�net�basis,�or�to�realise�assets�and�settle�the�liabilities�simultaneously.
Fair value
Investments�consist�of�listed�or�quoted�equities�or�equity�related�securities,�options�and�bonds�which�are�issuedby�corporate�issuers,�supra-nationals�or�government�organisations�and�investment�in�funds.
Investments� traded� in� active�markets� are�valued�at� the� latest� available�bid�prices� ruling� at�midnight�on� thereporting�date.
Shares� in� investment� funds�are�not� listed�on�an�actively� traded�exchange�and� these�are�valued�at� the� latestestimate�of�NAV�from�the�administrator�of�the�respective�investment�funds�as�the�most�recent�price�is�the�bestestimate�of�the�amount�for�which�holdings�could�have�been�disposed�of�at�the�reporting�date.
Derecognition of financial instruments
A�financial�asset�is�derecognised�when:�(a)�the�rights�to�receive�cash�flows�from�the�asset�have�expired,�(b)�theCompany�retains�the�right�to�receive�cash�flows�from�the�asset,�but�has�assumed�an�obligation�to�pay�them�infull�without�material� delay� to� a� third� party� under� a� “pass� through� arrangement”;� or� (c)� the�Company� hastransferred� substantially� all� the� risks� and� rewards� of� the� asset,� or� has� neither� transferred� nor� retainedsubstantially�all�the�risks�and�rewards�of�the�asset,�but�has�transferred�control�of�the�asset.
A�financial�liability�is�derecognised�when�the�obligation�under�the�liability�is�discharged,�cancelled�or�expired.
Significant estimates and judgements
The�Company�makes�estimates� and�assumptions�concerning� the� future.�The� resulting�accounting�estimateswill,� by� definition,� seldom� equate� to� the� related� actual� results.�The�main� use� of� accounting� estimates� andassumptions�occurs�in�the�calculation�of�the�sensitivity�analysis�in�Note�19.
Income
Dividend� income� from� equity� investments� is� recognised� through� profit� or� loss� in� the� Statement� ofComprehensive�Income�when�the�relevant�investment�is�quoted�ex-dividend.�Investment�income�is�includedgross� of� withholding� tax.� Interest� income� is� recognised� through� profit� or� loss� in� the� Statement� ofComprehensive�Income�for�all�debt�instruments�using�the�effective�interest�rate�method.
RUFFER INVESTMENT COMPANY LIMITEDNotes to the Financial Statements (continued)
Annual Financial Report 22
1. Significant accounting policies (continued)
Expenses
Expenses�are�accounted�for�on�an�accruals�basis.�Expenses�incurred�on�the�acquisition�of�financial�assets�atfair�value�through�profit�or�loss�and�management�fees�are�charged�to�the�Statement�of�Comprehensive�Incomein�capital.�All�other�expenses�are�recognised�through�profit�or�loss�in�the�Statement�of�Comprehensive�Incomein�revenue.�In�the�previous�year�75%�of�management�fees�were�charged�to�capital�reserve�and�the�remaining25%�to�revenue.
Cash and cash equivalents
Cash�comprises�cash�in�hand�and�deemed�deposits.�Cash�equivalents�are�short-term,�highly�liquid�investmentswith�original�maturities�of�three�months�or�less�and�bank�overdrafts.
Translation of foreign currency
Items� included� in� the� Company’s� financial� statements� are� measured� using� the� currency� of� the� primaryeconomic�environment�in�which�it�operates�(“the�functional�currency”).�This�is�the�British�Pound�(“Sterling”),which� is� the� currency� in�which� its� shares� are�denominated.�The�Company�has� also� adopted�Sterling� as� itspresentation�currency.
Foreign�currency�transactions�are�translated�into�the�functional�currency�using�the�exchange�rate�prevailing�atthe�transaction�date.�Foreign�exchange�gains�and�losses�resulting�from�the�settlement�of�such�transactions�andthose� from� the� translation� at� period� end� exchange� rates� of�monetary� assets� and� liabilities� denominated� inforeign�currencies�are�recognised�in�the�Statement�of�Comprehensive�Income.
Translation�differences�on�non-monetary�items�such�as�financial�assets�held�at�fair�value�through�profit�or�lossare� reported� as� part� of� net� gains� or� losses� on� financial� assets� through� profit� or� loss� in� the� Statement� ofComprehensive�Income.
Share issue costs
Share�issue�costs�are�fully�written�off�against�the�share�capital�account�in�the�period�of�the�share�issue.
Redeemable participating preference shares
As� the� Company’s� redeemable� participating� preference� shares� are� redeemable� at� the� sole� option� of� theDirectors�they�are�required�to�be�classified�as�equity�instruments.
2. Taxation
The� Company� has� been� granted� Exempt� Status� under� the� terms� of� The� Income� Tax� (Exempt� Bodies)(Guernsey)�Ordinance,�1989�to�income�tax�in�Guernsey.�Its�liability�is�an�annual�fee�of�£600.
The�amounts�disclosed�as�taxation�in�the�Statement�of�Comprehensive�Income�relates�solely�to�withholdingtax� suffered� at� source�on� income.�Foreign� capital� gains� tax� charges� are�deducted� from� realised� investmentgains.
3. Dividends to shareholders
Dividends,�if�any,�will�be�declared�semi-annually�in�September�and�March�each�year.�A�first�interim�dividendof�1.5p�per�share�(£1,470,640)�was�declared�on�25�August�2010�and�paid�on�24�September�2010�in�respect�ofthe�period�from�1�January�2010�to�30�June�2010.�A�second�interim�dividend�of�1.5p�per�share�(£1,869,576)was�declared�on�2�March�2011�and�paid�on�25�March�2011�in�respect�of�the�period�covered�by�this�annualfinancial�report.�A�third�interim�dividend�of�1.5p�per�share�was�approved�on�23�September�2011,�also�in�respectof� the�period�covered�by�this�report.�The�financial� impact�of� the�dividend�is�not� included�in�these�financialstatements.
RUFFER INVESTMENT COMPANY LIMITEDNotes to the Financial Statements (continued)
23 Annual Financial Report
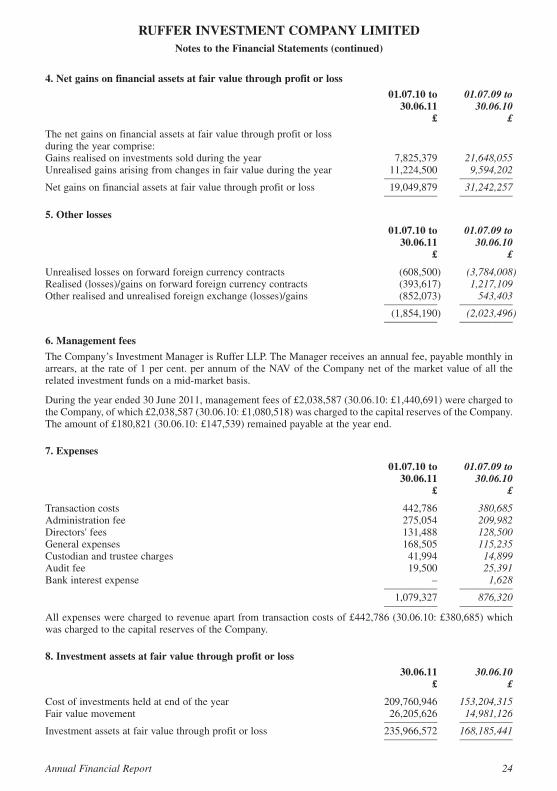
4. Net gains on financial assets at fair value through profit or loss
01.07.10 to 01.07.09 to 30.06.11 30.06.10 £ £
The�net�gains�on�financial�assets�at�fair�value�through�profit�or�loss�during�the�year�comprise:Gains�realised�on�investments�sold�during�the�year��������������������������������������������������7,825,379����������21,648,055Unrealised�gains�arising�from�changes�in�fair�value�during�the�year ���������������������11,224,500������������9,594,202�������������������������������������������������������������������������������������������������������������������������������—————��������—————Net�gains�on�financial�assets�at�fair�value�through�profit�or�loss����������������������������19,049,879����������31,242,257�������������������������������������������������������������������������������������������������������������������������������—————��������—————
5. Other losses
01.07.10 to 01.07.09 to 30.06.11 30.06.10 £ £
Unrealised�losses�on�forward�foreign�currency�contracts�������������������������������������������(608,500) ���������(3,784,008)Realised�(losses)/gains�on�forward�foreign�currency�contracts ����������������������������������(393,617)�����������1,217,109Other�realised�and�unrealised�foreign�exchange�(losses)/gains����������������������������������(852,073)��������������543,403�������������������������������������������������������������������������������������������������������������������������������—————��������—————����������������������������������������������������������������������������������������������������������������������������������(1,854,190) ���������(2,023,496)�������������������������������������������������������������������������������������������������������������������������������—————��������—————
6. Management fees
The�Company’s�Investment�Manager�is�Ruffer�LLP.�The�Manager�receives�an�annual�fee,�payable�monthly�inarrears,�at� the�rate�of�1�per�cent.�per�annum�of�the�NAV�of�the�Company�net�of� the�market�value�of�all� therelated�investment�funds�on�a�mid-market�basis.
During�the�year�ended�30�June�2011,�management�fees�of�£2,038,587�(30.06.10:�£1,440,691)�were�charged�tothe�Company,�of�which�£2,038,587�(30.06.10:�£1,080,518)�was�charged�to�the�capital�reserves�of�the�Company.The�amount�of�£180,821�(30.06.10:�£147,539)�remained�payable�at�the�year�end.
7. Expenses
01.07.10 to 01.07.09 to 30.06.11 30.06.10 £ £
Transaction�costs ����������������������������������������������������������������������������������������������������������442,786���������������380,685Administration�fee��������������������������������������������������������������������������������������������������������275,054���������������209,982Directors'�fees���������������������������������������������������������������������������������������������������������������131,488���������������128,500General�expenses����������������������������������������������������������������������������������������������������������168,505���������������115,235Custodian�and�trustee�charges����������������������������������������������������������������������������������������41,994�����������������14,899Audit�fee�������������������������������������������������������������������������������������������������������������������������19,500�����������������25,391Bank�interest�expense��������������������������������������������������������������������������������������������������������������–�������������������1,628�������������������������������������������������������������������������������������������������������������������������������—————��������—————�����������������������������������������������������������������������������������������������������������������������������������1,079,327���������������876,320�������������������������������������������������������������������������������������������������������������������������������—————��������—————All�expenses�were�charged�to�revenue�apart�from�transaction�costs�of�£442,786�(30.06.10:�£380,685)�whichwas�charged�to�the�capital�reserves�of�the�Company.
8. Investment assets at fair value through profit or loss
30.06.11 30.06.10 £ £
Cost�of�investments�held�at�end�of�the�year ����������������������������������������������������������209,760,946��������153,204,315Fair�value�movement �����������������������������������������������������������������������������������������������26,205,626����������14,981,126�������������������������������������������������������������������������������������������������������������������������������—————��������—————Investment�assets�at�fair�value�through�profit�or�loss �������������������������������������������235,966,572��������168,185,441�������������������������������������������������������������������������������������������������������������������������������—————��������—————
RUFFER INVESTMENT COMPANY LIMITEDNotes to the Financial Statements (continued)
Annual Financial Report 24
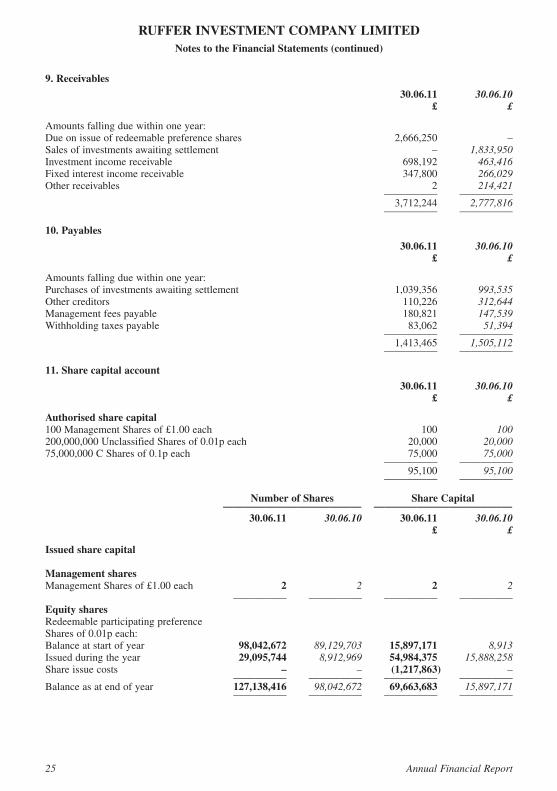
9. Receivables
30.06.11 30.06.10 £ £
Amounts�falling�due�within�one�year:Due�on�issue�of�redeemable�preference�shares ���������������������������������������������������������2,666,250��������������������������–Sales�of�investments�awaiting�settlement��������������������������������������������������������������������������������–������������1,833,950Investment�income�receivable ��������������������������������������������������������������������������������������698,192���������������463,416Fixed�interest�income�receivable����������������������������������������������������������������������������������347,800���������������266,029Other�receivables ���������������������������������������������������������������������������������������������������������������������2���������������214,421�������������������������������������������������������������������������������������������������������������������������������—————��������—————�����������������������������������������������������������������������������������������������������������������������������������3,712,244������������2,777,816�������������������������������������������������������������������������������������������������������������������������������—————��������—————
10. Payables
30.06.11 30.06.10 £ £
Amounts�falling�due�within�one�year:Purchases�of�investments�awaiting�settlement ����������������������������������������������������������1,039,356���������������993,535Other�creditors��������������������������������������������������������������������������������������������������������������110,226���������������312,644Management�fees�payable ��������������������������������������������������������������������������������������������180,821���������������147,539Withholding�taxes�payable ���������������������������������������������������������������������������������������������83,062�����������������51,394�������������������������������������������������������������������������������������������������������������������������������—————��������—————�����������������������������������������������������������������������������������������������������������������������������������1,413,465������������1,505,112�������������������������������������������������������������������������������������������������������������������������������—————��������—————
11. Share capital account
30.06.11 30.06.10 £ £
Authorised share capital100�Management�Shares�of�£1.00�each ������������������������������������������������������������������������������100����������������������100200,000,000�Unclassified�Shares�of�0.01p�each ������������������������������������������������������������20,000�����������������20,00075,000,000�C�Shares�of�0.1p�each ���������������������������������������������������������������������������������75,000�����������������75,000�������������������������������������������������������������������������������������������������������������������������������—————��������—————����������������������������������������������������������������������������������������������������������������������������������������95,100�����������������95,100�������������������������������������������������������������������������������������������������������������������������������—————��������—————
Number of Shares Share Capital ————————————— ————————————— 30.06.11 30.06.10 30.06.11 30.06.10 £ £
Issued share capital
Management sharesManagement�Shares�of�£1.00�each���������������������������������2 ��������������������������2 ��������������������������2 ��������������������������2����������������������������������������������������������������������––————��������––————��������––————��������––————Equity sharesRedeemable�participating�preferenceShares�of�0.01p�each:Balance�at�start�of�year �����������������������������������98,042,672 ����������89,129,703 ����������15,897,171 �������������������8,913Issued�during�the�year ������������������������������������29,095,744 ������������8,912,969 ����������54,984,375 ����������15,888,258Share�issue�costs �������������������������������������������������������������– ��������������������������–�����������(1,217,863)�������������������������–����������������������������������������������������������������������––————��������––————��������––————��������––————Balance�as�at�end�of�year������������������������������127,138,416 ����������98,042,672 ����������69,663,683 ����������15,897,171����������������������������������������������������������������������––————��������––————��������––————��������––————
RUFFER INVESTMENT COMPANY LIMITEDNotes to the Financial Statements (continued)
25 Annual Financial Report
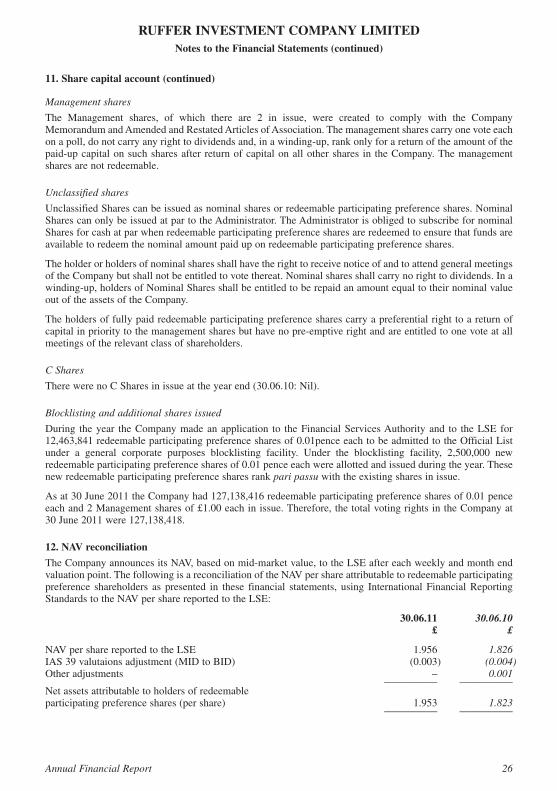
11. Share capital account (continued)
Management shares
The� Management� shares,� of� which� there� are� 2� in� issue,� were� created� to� comply� with� the� CompanyMemorandum�and�Amended�and�Restated�Articles�of�Association.�The�management�shares�carry�one�vote�eachon�a�poll,�do�not�carry�any�right�to�dividends�and,�in�a�winding-up,�rank�only�for�a�return�of�the�amount�of�thepaid-up�capital�on�such�shares�after� return�of�capital�on�all�other�shares� in� the�Company.�The�managementshares�are�not�redeemable.
Unclassified shares
Unclassified�Shares�can�be�issued�as�nominal�shares�or�redeemable�participating�preference�shares.�NominalShares�can�only�be�issued�at�par�to�the�Administrator.�The�Administrator�is�obliged�to�subscribe�for�nominalShares�for�cash�at�par�when�redeemable�participating�preference�shares�are�redeemed�to�ensure�that�funds�areavailable�to�redeem�the�nominal�amount�paid�up�on�redeemable�participating�preference�shares.
The�holder�or�holders�of�nominal�shares�shall�have�the�right�to�receive�notice�of�and�to�attend�general�meetingsof�the�Company�but�shall�not�be�entitled�to�vote�thereat.�Nominal�shares�shall�carry�no�right�to�dividends.�In�awinding-up,�holders�of�Nominal�Shares�shall�be�entitled�to�be�repaid�an�amount�equal�to�their�nominal�valueout�of�the�assets�of�the�Company.
The�holders�of�fully�paid�redeemable�participating�preference�shares�carry�a�preferential�right�to�a�return�ofcapital�in�priority�to�the�management�shares�but�have�no�pre-emptive�right�and�are�entitled�to�one�vote�at�allmeetings�of�the�relevant�class�of�shareholders.
C Shares
There�were�no�C�Shares�in�issue�at�the�year�end�(30.06.10:�Nil).
Blocklisting and additional shares issued
During� the�year� the�Company�made�an�application� to� the�Financial�Services�Authority�and� to� the�LSE� for12,463,841�redeemable�participating�preference�shares�of�0.01pence�each�to�be�admitted�to�the�Official�Listunder� a� general� corporate� purposes� blocklisting� facility.� Under� the� blocklisting� facility,� 2,500,000� newredeemable�participating�preference�shares�of�0.01�pence�each�were�allotted�and�issued�during�the�year.�Thesenew�redeemable�participating�preference�shares�rank�pari passu with�the�existing�shares�in�issue.
As�at�30�June�2011�the�Company�had�127,138,416�redeemable�participating�preference�shares�of�0.01�penceeach�and�2�Management�shares�of�£1.00�each�in�issue.�Therefore,�the�total�voting�rights�in�the�Company�at30 June�2011�were�127,138,418.
12. NAV reconciliation
The�Company�announces�its�NAV,�based�on�mid-market�value,�to�the�LSE�after�each�weekly�and�month�endvaluation�point.�The�following�is�a�reconciliation�of�the�NAV�per�share�attributable�to�redeemable�participatingpreference� shareholders� as� presented� in� these� financial� statements,� using� International� Financial�ReportingStandards�to�the�NAV�per�share�reported�to�the�LSE:
30.06.11 30.06.10 £ £
NAV�per�share�reported�to�the�LSE ���������������������������������������������������������������������������������1.956�������������������1.826IAS�39�valutaions�adjustment�(MID�to�BID) �����������������������������������������������������������������(0.003) ����������������(0.004)Other�adjustments��������������������������������������������������������������������������������������������������������������������–�������������������0.001�������������������������������������������������������������������������������������������������������������������������������—————��������—————Net�assets�attributable�to�holders�of�redeemable�participating�preference�shares�(per�share) ����������������������������������������������������������������������1.953�������������������1.823�������������������������������������������������������������������������������������������������������������������������������—————��������—————
RUFFER INVESTMENT COMPANY LIMITEDNotes to the Financial Statements (continued)
Annual Financial Report 26
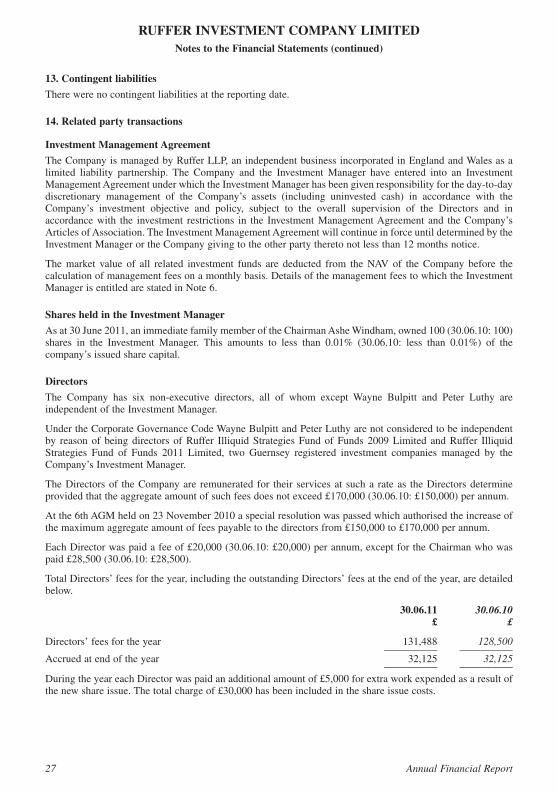
13. Contingent liabilities
There�were�no�contingent�liabilities�at�the�reporting�date.
14. Related party transactions
Investment Management Agreement
The�Company�is�managed�by�Ruffer�LLP,�an�independent�business�incorporated�in�England�and�Wales�as�alimited� liability� partnership.� The� Company� and� the� Investment�Manager� have� entered� into� an� InvestmentManagement�Agreement�under�which�the�Investment�Manager�has�been�given�responsibility�for�the�day-to-daydiscretionary� management� of� the� Company’s� assets� (including� uninvested� cash)� in� accordance� with� theCompany’s� investment� objective� and� policy,� subject� to� the� overall� supervision� of� the� Directors� and� inaccordance�with� the� investment� restrictions� in� the� Investment�Management�Agreement� and� the�Company’sArticles�of�Association.�The�Investment�Management�Agreement�will�continue�in�force�until�determined�by�theInvestment�Manager�or�the�Company�giving�to�the�other�party�thereto�not�less�than�12�months�notice.
The�market� value� of� all� related� investment� funds� are� deducted� from� the�NAV�of� the�Company� before� thecalculation�of�management�fees�on�a�monthly�basis.�Details�of�the�management�fees�to�which�the�InvestmentManager�is�entitled�are�stated�in�Note�6.
Shares held in the Investment Manager
As�at�30�June�2011,�an�immediate�family�member�of�the�Chairman�Ashe�Windham,�owned�100�(30.06.10:�100)shares� in� the� Investment� Manager.� This� amounts� to� less� than� 0.01%� (30.06.10:� less� than� 0.01%)� of� thecompany’s�issued�share�capital.
Directors
The� Company� has� six� non-executive� directors,� all� of� whom� except� Wayne� Bulpitt� and� Peter� Luthy� areindependent�of�the�Investment�Manager.
Under�the�Corporate�Governance�Code�Wayne�Bulpitt�and�Peter�Luthy�are�not�considered�to�be�independentby� reason�of� being�directors� of�Ruffer� Illiquid�Strategies�Fund�of�Funds�2009�Limited� and�Ruffer� IlliquidStrategies� Fund� of� Funds� 2011� Limited,� two� Guernsey� registered� investment� companies� managed� by� theCompany’s�Investment�Manager.
The�Directors�of� the�Company�are� remunerated� for� their� services�at� such�a� rate�as� the�Directors�determineprovided�that�the�aggregate�amount�of�such�fees�does�not�exceed�£170,000�(30.06.10:�£150,000)�per�annum.
At�the�6th�AGM�held�on�23�November�2010�a�special�resolution�was�passed�which�authorised�the�increase�ofthe�maximum�aggregate�amount�of�fees�payable�to�the�directors�from�£150,000�to�£170,000�per�annum.
Each�Director�was�paid�a�fee�of�£20,000�(30.06.10:�£20,000)�per�annum,�except�for�the�Chairman�who�waspaid�£28,500�(30.06.10:�£28,500).
Total�Directors’�fees�for�the�year,�including�the�outstanding�Directors’�fees�at�the�end�of�the�year,�are�detailedbelow.
30.06.11 30.06.10 £ £
Directors’�fees�for�the�year ������������������������������������������������������������������������������������������131,488���������������128,500�������������������������������������������������������������������������������������������������������������������������������—————��������—————Accrued�at�end�of�the�year ���������������������������������������������������������������������������������������������32,125�����������������32,125�������������������������������������������������������������������������������������������������������������������������������—————��������—————During�the�year�each�Director�was�paid�an�additional�amount�of�£5,000�for�extra�work�expended�as�a�result�ofthe�new�share�issue.�The�total�charge�of�£30,000�has�been�included�in�the�share�issue�costs.
RUFFER INVESTMENT COMPANY LIMITEDNotes to the Financial Statements (continued)
27 Annual Financial Report
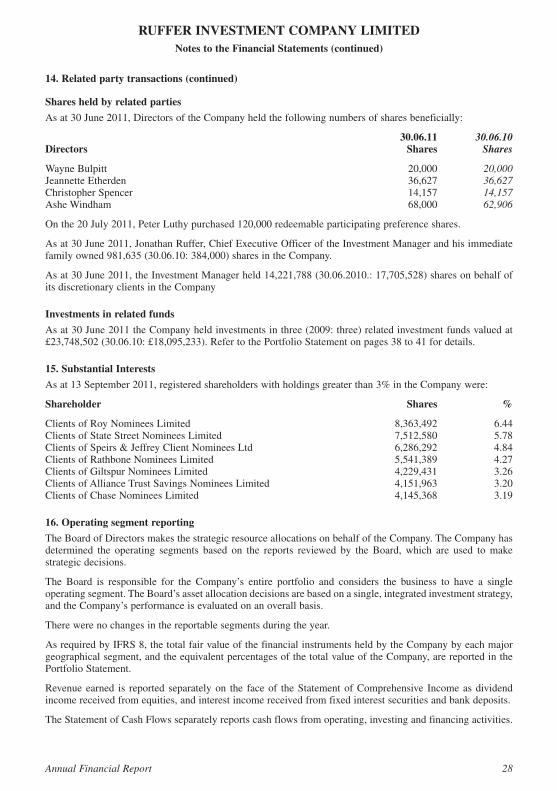
14. Related party transactions (continued)
Shares held by related parties
As�at�30�June�2011,�Directors�of�the�Company�held�the�following�numbers�of�shares�beneficially:
30.06.11 30.06.10Directors Shares Shares
Wayne�Bulpitt�����������������������������������������������������������������������������������������������������������������20,000�����������������20,000Jeannette�Etherden ���������������������������������������������������������������������������������������������������������36,627�����������������36,627Christopher�Spencer �������������������������������������������������������������������������������������������������������14,157�����������������14,157Ashe�Windham ���������������������������������������������������������������������������������������������������������������68,000�����������������62,906
On�the�20�July�2011,�Peter�Luthy�purchased�120,000�redeemable�participating�preference�shares.
As�at�30�June�2011,�Jonathan�Ruffer,�Chief�Executive�Officer�of�the�Investment�Manager�and�his�immediatefamily�owned�981,635�(30.06.10:�384,000)�shares�in�the�Company.
As�at�30�June�2011,�the�Investment�Manager�held�14,221,788�(30.06.2010.:�17,705,528)�shares�on�behalf�ofits�discretionary�clients�in�the�Company
Investments in related funds
As�at�30�June�2011�the�Company�held�investments�in�three�(2009:�three)�related�investment�funds�valued�at£23,748,502 (30.06.10:�£18,095,233).�Refer�to�the�Portfolio�Statement�on�pages 38 to 41 for�details.
15. Substantial Interests
As�at�13�September�2011,�registered�shareholders�with�holdings�greater�than�3%�in�the�Company�were:
Shareholder Shares %
Clients�of�Roy�Nominees�Limited ����������������������������������������������������������������������������8,363,492���������������������6.44Clients�of�State�Street�Nominees�Limited�����������������������������������������������������������������7,512,580���������������������5.78Clients�of�Speirs�&�Jeffrey�Client�Nominees�Ltd �����������������������������������������������������6,286,292���������������������4.84Clients�of�Rathbone�Nominees�Limited��������������������������������������������������������������������5,541,389���������������������4.27Clients�of�Giltspur�Nominees�Limited����������������������������������������������������������������������4,229,431���������������������3.26Clients�of�Alliance�Trust�Savings�Nominees�Limited�����������������������������������������������4,151,963���������������������3.20Clients�of�Chase�Nominees�Limited �������������������������������������������������������������������������4,145,368���������������������3.19
16. Operating segment reporting
The�Board�of�Directors�makes�the�strategic�resource�allocations�on�behalf�of�the�Company.�The�Company�hasdetermined� the� operating� segments� based� on� the� reports� reviewed� by� the� Board,� which� are� used� to�makestrategic�decisions.
The� Board� is� responsible� for� the� Company’s� entire� portfolio� and� considers� the� business� to� have� a� singleoperating�segment.�The�Board’s�asset�allocation�decisions�are�based�on�a�single,�integrated�investment�strategy,and�the�Company’s�performance�is�evaluated�on�an�overall�basis.
There�were�no�changes�in�the�reportable�segments�during�the�year.
As�required�by�IFRS�8,�the�total�fair�value�of�the�financial�instruments�held�by�the�Company�by�each�majorgeographical�segment,�and�the�equivalent�percentages�of�the�total�value�of�the�Company,�are�reported�in�thePortfolio�Statement.
Revenue�earned� is� reported� separately�on� the� face�of� the�Statement�of�Comprehensive� Income�as�dividendincome�received�from�equities,�and�interest�income�received�from�fixed�interest�securities�and�bank�deposits.
The�Statement�of�Cash�Flows�separately�reports�cash�flows�from�operating,�investing�and�financing�activities.
RUFFER INVESTMENT COMPANY LIMITEDNotes to the Financial Statements (continued)
Annual Financial Report 28
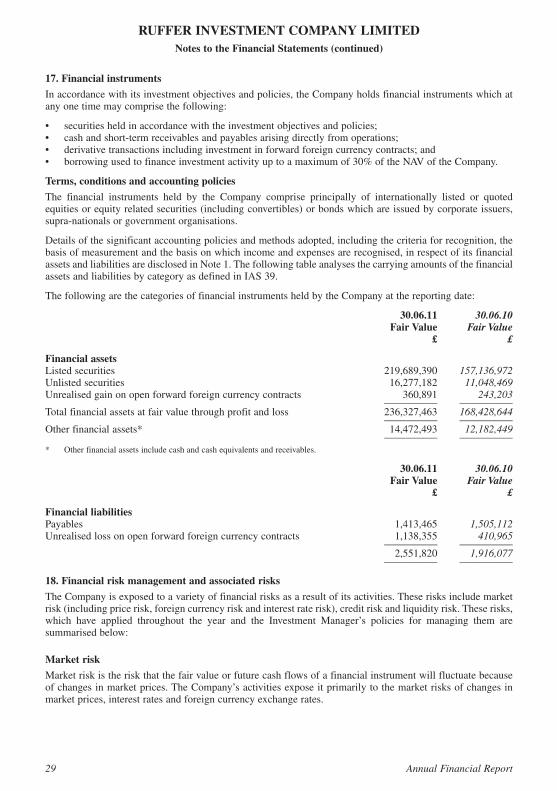
RUFFER INVESTMENT COMPANY LIMITED
17. Financial instruments
In�accordance�with�its�investment�objectives�and�policies,�the�Company�holds�financial�instruments�which�atany�one�time�may�comprise�the�following:
• �����securities�held�in�accordance�with�the�investment�objectives�and�policies;• �����cash�and�short-term�receivables�and�payables�arising�directly�from�operations;• �����derivative�transactions�including�investment�in�forward�foreign�currency�contracts;�and• �����borrowing�used�to�finance�investment�activity�up�to�a�maximum�of�30%�of�the�NAV�of�the�Company.
Terms, conditions and accounting policies
The� financial� instruments� held� by� the� Company� comprise� principally� of� internationally� listed� or� quotedequities�or�equity�related�securities�(including�convertibles)�or�bonds�which�are�issued�by�corporate�issuers,supra-nationals�or�government�organisations.
Details�of�the�significant�accounting�policies�and�methods�adopted,�including�the�criteria�for�recognition,�thebasis�of�measurement�and�the�basis�on�which�income�and�expenses�are�recognised,�in�respect�of�its�financialassets�and�liabilities�are�disclosed�in�Note�1.�The�following�table�analyses�the�carrying�amounts�of�the�financialassets�and�liabilities�by�category�as�defined�in�IAS�39.
The�following�are�the�categories�of�financial�instruments�held�by�the�Company�at�the�reporting�date:
30.06.11 30.06.10 Fair Value Fair Value £ £
Financial assetsListed�securities�����������������������������������������������������������������������������������������������������219,689,390��������157,136,972Unlisted�securities ���������������������������������������������������������������������������������������������������16,277,182����������11,048,469Unrealised�gain�on�open�forward�foreign�currency�contracts��������������������������������������360,891���������������243,203�������������������������������������������������������������������������������������������������������������������������������—————��������—————Total�financial�assets�at�fair�value�through�profit�and�loss �����������������������������������236,327,463��������168,428,644�������������������������������������������������������������������������������������������������������������������������������—————��������—————Other�financial�assets* ��������������������������������������������������������������������������������������������14,472,493����������12,182,449�������������������������������������������������������������������������������������������������������������������������������—————��������—————* ������Other�financial�assets�include�cash�and�cash�equivalents�and�receivables.
30.06.11 30.06.10 Fair Value Fair Value £ £
Financial liabilitiesPayables���������������������������������������������������������������������������������������������������������������������1,413,465������������1,505,112Unrealised�loss�on�open�forward�foreign�currency�contracts �����������������������������������1,138,355���������������410,965�������������������������������������������������������������������������������������������������������������������������������—————��������—————�����������������������������������������������������������������������������������������������������������������������������������2,551,820������������1,916,077�������������������������������������������������������������������������������������������������������������������������������—————��������—————
18. Financial risk management and associated risks
The�Company�is�exposed�to�a�variety�of�financial�risks�as�a�result�of�its�activities.�These�risks�include�marketrisk�(including�price�risk,�foreign�currency�risk�and�interest�rate�risk),�credit�risk�and�liquidity�risk.�These�risks,which� have� applied� throughout� the� year� and� the� Investment� Manager’s� policies� for� managing� them� aresummarised�below:
Market risk
Market�risk�is�the�risk�that�the�fair�value�or�future�cash�flows�of�a�financial�instrument�will�fluctuate�becauseof�changes�in�market�prices.�The�Company’s�activities�expose�it�primarily�to�the�market�risks�of�changes�inmarket�prices,�interest�rates�and�foreign�currency�exchange�rates.
Notes to the Financial Statements (continued)
29 Annual Financial Report
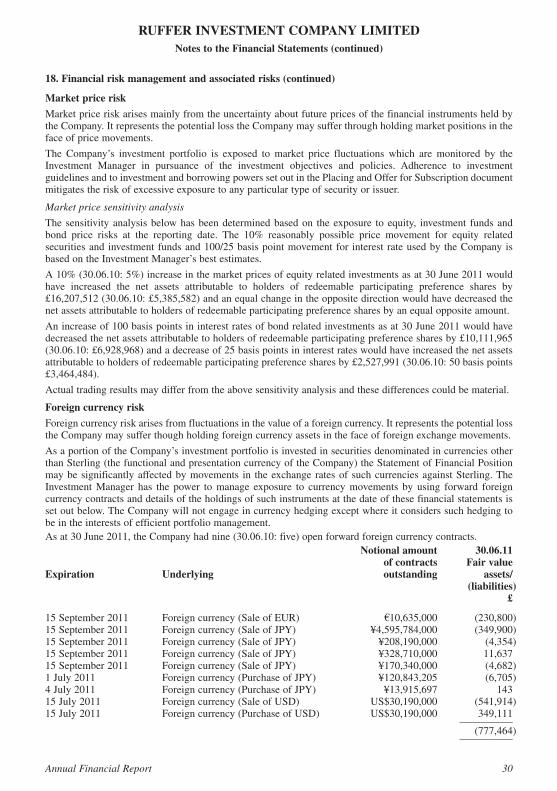
18. Financial risk management and associated risks (continued)
Market price risk
Market�price�risk�arises�mainly�from�the�uncertainty�about�future�prices�of�the�financial�instruments�held�bythe�Company.�It�represents�the�potential�loss�the�Company�may�suffer�through�holding�market�positions�in�theface�of�price�movements.
The� Company’s� investment� portfolio� is� exposed� to�market� price� fluctuations� which� are�monitored� by� theInvestment� Manager� in� pursuance� of� the� investment� objectives� and� policies.� Adherence� to� investmentguidelines�and�to�investment�and�borrowing�powers�set�out�in�the�Placing�and�Offer�for�Subscription�documentmitigates�the�risk�of�excessive�exposure�to�any�particular�type�of�security�or�issuer.
Market price sensitivity analysis
The�sensitivity�analysis�below�has�been�determined�based�on� the�exposure� to�equity,� investment� funds�andbond� price� risks� at� the� reporting� date.� The 10%� reasonably� possible� price� movement� for� equity� relatedsecurities�and�investment�funds�and�100/25 basis�point�movement�for� interest�rate�used�by�the�Company�isbased�on�the�Investment�Manager’s�best�estimates.
A�10%�(30.06.10:�5%)�increase�in�the�market�prices�of�equity�related�investments�as�at�30�June�2011�wouldhave� increased� the� net� assets� attributable� to� holders� of� redeemable� participating� preference� shares� by£16,207,512�(30.06.10:�£5,385,582)�and�an�equal�change�in�the�opposite�direction�would�have�decreased�thenet�assets�attributable�to�holders�of�redeemable�participating�preference�shares�by�an�equal�opposite�amount.
An�increase�of�100�basis�points�in�interest�rates�of�bond�related�investments�as�at�30�June�2011�would�havedecreased�the�net�assets�attributable�to�holders�of�redeemable�participating�preference�shares�by�£10,111,965(30.06.10:�£6,928,968)�and�a�decrease�of 25 basis�points�in�interest�rates�would�have�increased�the�net�assetsattributable�to�holders�of�redeemable�participating�preference�shares�by�£2,527,991 (30.06.10:�50�basis�points£3,464,484).
Actual�trading�results�may�differ�from�the�above�sensitivity�analysis�and�these�differences�could�be�material.
Foreign currency risk
Foreign�currency�risk�arises�from�fluctuations�in�the�value�of�a�foreign�currency.�It�represents�the�potential�lossthe�Company�may�suffer�though�holding�foreign�currency�assets�in�the�face�of�foreign�exchange�movements.
As�a�portion�of�the�Company’s�investment�portfolio�is�invested�in�securities�denominated�in�currencies�otherthan�Sterling�(the�functional�and�presentation�currency�of�the�Company)�the�Statement�of�Financial�Positionmay�be�significantly�affected�by�movements� in� the�exchange� rates�of�such�currencies�against�Sterling.�TheInvestment�Manager� has� the� power� to�manage� exposure� to� currency�movements� by� using� forward� foreigncurrency�contracts�and�details�of�the�holdings�of�such�instruments�at�the�date�of�these�financial�statements�isset�out�below.�The�Company�will�not�engage�in�currency�hedging�except�where�it�considers�such�hedging�tobe�in�the�interests�of�efficient�portfolio�management.As�at�30�June�2011,�the�Company�had�nine�(30.06.10:�five)�open�forward�foreign�currency�contracts. Notional amount 30.06.11 of contracts Fair valueExpiration Underlying outstanding assets/ (liabilities) £
15�September�2011 ������������Foreign�currency�(Sale�of�EUR) �������������������������������€10,635,000��������������(230,800)15�September�2011 ������������Foreign�currency�(Sale�of�JPY)����������������������������¥4,595,784,000��������������(349,900)15�September�2011 ������������Foreign�currency�(Sale�of�JPY)�������������������������������¥208,190,000������������������(4,354)15�September�2011 ������������Foreign�currency�(Sale�of�JPY)�������������������������������¥328,710,000�����������������11,63715�September�2011 ������������Foreign�currency�(Sale�of�JPY)�������������������������������¥170,340,000������������������(4,682)1�July�2011�������������������������Foreign�currency�(Purchase�of�JPY) �����������������������¥120,843,205������������������(6,705)4�July�2011�������������������������Foreign�currency�(Purchase�of�JPY) �������������������������¥13,915,697����������������������14315�July�2011�����������������������Foreign�currency�(Sale�of�USD) ��������������������������US$30,190,000��������������(541,914)15�July�2011�����������������������Foreign�currency�(Purchase�of�USD)�������������������US$30,190,000���������������349,111�����������������������������������������������������������������������������������������������������������������������������������������������������������—————�����������������������������������������������������������������������������������������������������������������������������������������������������������������(777,464)�����������������������������������������������������������������������������������������������������������������������������������������������������������—————
RUFFER INVESTMENT COMPANY LIMITEDNotes to the Financial Statements (continued)
Annual Financial Report 30
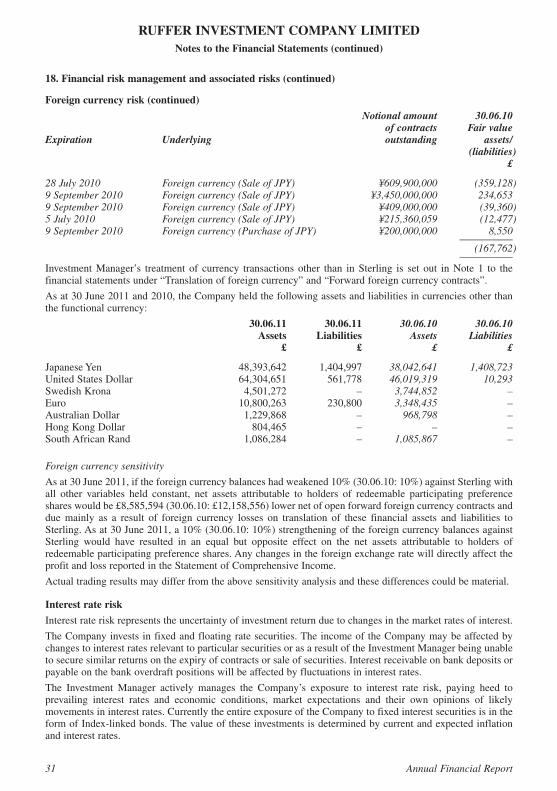
18. Financial risk management and associated risks (continued)
Foreign currency risk (continued)
Notional amount 30.06.10 of contracts Fair valueExpiration Underlying outstanding assets/ (liabilities) £
28 July 2010 Foreign currency (Sale of JPY) ¥609,900,000 (359,128)9 September 2010 Foreign currency (Sale of JPY) ¥3,450,000,000 234,6539 September 2010 Foreign currency (Sale of JPY) ¥409,000,000 (39,360)5 July 2010 Foreign currency (Sale of JPY) ¥215,360,059 (12,477)9 September 2010 Foreign currency (Purchase of JPY) ¥200,000,000 8,550�����������������������������������������������������������������������������������������������������������������������������������������������������������————— (167,762)�����������������������������������������������������������������������������������������������������������������������������������������������������������—————Investment�Manager’s� treatment� of� currency� transactions� other� than� in�Sterling� is� set� out� in�Note� 1� to� thefinancial�statements�under�“Translation�of�foreign�currency”�and�“Forward�foreign�currency�contracts”.
As�at�30�June�2011�and�2010,�the�Company�held�the�following�assets�and�liabilities�in�currencies�other�thanthe�functional�currency:
30.06.11 30.06.11 30.06.10 30.06.10 Assets Liabilities Assets Liabilities £ £ £ £
Japanese�Yen ���������������������������������������������������48,393,642������������1,404,997����������38,042,641 1,408,723United�States�Dollar ���������������������������������������64,304,651���������������561,778����������46,019,319 10,293Swedish�Krona��������������������������������������������������4,501,272��������������������������–������������3,744,852 –Euro ����������������������������������������������������������������10,800,263���������������230,800������������3,348,435 –Australian�Dollar ����������������������������������������������1,229,868��������������������������–���������������968,798 –Hong�Kong�Dollar �����������������������������������������������804,465��������������������������–��������������������������– –South�African�Rand ������������������������������������������1,086,284��������������������������–������������1,085,867 –
Foreign currency sensitivity
As�at�30�June�2011,�if�the�foreign�currency�balances�had�weakened�10%�(30.06.10:�10%)�against�Sterling�withall� other� variables� held� constant,� net� assets� attributable� to� holders� of� redeemable� participating� preferenceshares�would�be�£8,585,594�(30.06.10:�£12,158,556)�lower�net�of�open�forward�foreign�currency�contracts�anddue�mainly� as� a� result� of� foreign� currency� losses� on� translation� of� these� financial� assets� and� liabilities� toSterling.�As�at�30�June�2011,�a�10%�(30.06.10:�10%)�strengthening�of�the�foreign�currency�balances�againstSterling� would� have� resulted� in� an� equal� but� opposite� effect� on� the� net� assets� attributable� to� holders� ofredeemable�participating�preference�shares.�Any�changes�in�the�foreign�exchange�rate�will�directly�affect�theprofit�and�loss�reported�in�the�Statement�of�Comprehensive�Income.
Actual�trading�results�may�differ�from�the�above�sensitivity�analysis�and�these�differences�could�be�material.
Interest rate risk
Interest�rate�risk�represents�the�uncertainty�of�investment�return�due�to�changes�in�the�market�rates�of�interest.
The�Company�invests�in�fixed�and�floating�rate�securities.�The�income�of�the�Company�may�be�affected�bychanges�to�interest�rates�relevant�to�particular�securities�or�as�a�result�of�the�Investment�Manager�being�unableto�secure�similar�returns�on�the�expiry�of�contracts�or�sale�of�securities.�Interest�receivable�on�bank�deposits�orpayable�on�the�bank�overdraft�positions�will�be�affected�by�fluctuations�in�interest�rates.
The� Investment� Manager� actively� manages� the� Company’s� exposure� to� interest� rate� risk,� paying� heed� toprevailing� interest� rates� and� economic� conditions,� market� expectations� and� their� own� opinions� of� likelymovements�in�interest�rates.�Currently�the�entire�exposure�of�the�Company�to�fixed�interest�securities�is�in�theform�of�Index-linked�bonds.�The�value�of�these�investments�is�determined�by�current�and�expected�inflationand�interest�rates.
RUFFER INVESTMENT COMPANY LIMITEDNotes to the Financial Statements (continued)
31 Annual Financial Report
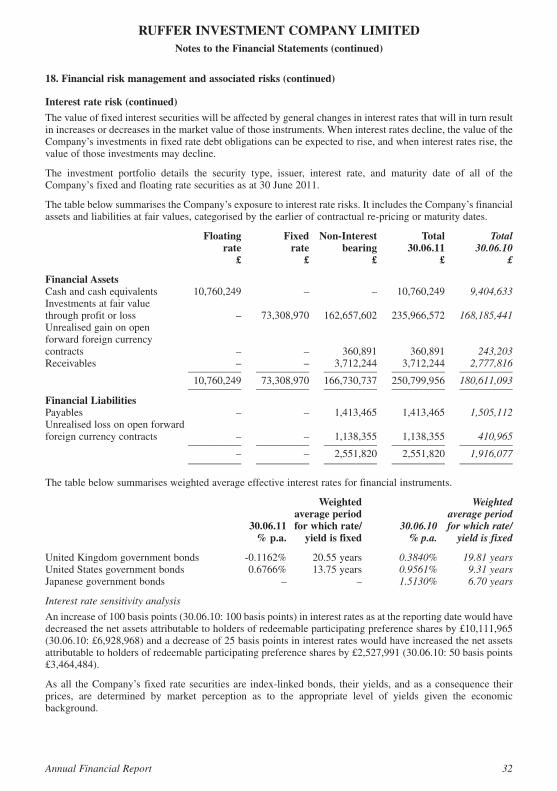
18. Financial risk management and associated risks (continued)
Interest rate risk (continued)
The�value�of�fixed�interest�securities�will�be�affected�by�general�changes�in�interest�rates�that�will�in�turn�resultin�increases�or�decreases�in�the�market�value�of�those�instruments.�When�interest�rates�decline,�the�value�of�theCompany’s�investments�in�fixed�rate�debt�obligations�can�be�expected�to�rise,�and�when�interest�rates�rise,�thevalue�of�those�investments�may�decline.
The� investment� portfolio� details� the� security� type,� issuer,� interest� rate,� and� maturity� date� of� all� of� theCompany’s�fixed�and�floating�rate�securities�as�at�30�June�2011.
The�table�below�summarises�the�Company’s�exposure�to�interest�rate�risks.�It�includes�the�Company’s�financialassets�and�liabilities�at�fair�values,�categorised�by�the�earlier�of�contractual�re-pricing�or�maturity�dates.
Floating Fixed Non-Interest Total Total rate rate bearing 30.06.11 30.06.10 £ £ £ £ £
Financial AssetsCash�and�cash�equivalents �������������10,760,249 �����������������������– �����������������������– �������10,760,249 ���������9,404,633Investments at�fair�valuethrough�profit�or�loss �������������������������������������– �������73,308,970 �����162,657,602 �����235,966,572 �����168,185,441Unrealised�gain�on�openforward�foreign�currencycontracts���������������������������������������������������������– �����������������������– ������������360,891 ������������360,891 ������������243,203Receivables ����������������������������������������������������– �����������������������– ���������3,712,244 ���������3,712,244 ���������2,777,816�����������������������������������������������������—————�����—————�����—————�����—————�����—————�������������������������������������������������������10,760,249 �������73,308,970 �����166,730,737 �����250,799,956 �����180,611,093�����������������������������������������������������—————�����—————�����—————�����—————�����—————Financial LiabilitiesPayables ���������������������������������������������������������– �����������������������– ���������1,413,465 ���������1,413,465 ���������1,505,112Unrealised�loss�on�open�forwardforeign�currency�contracts �����������������������������– �����������������������– ���������1,138,355 ���������1,138,355 ������������410,965�����������������������������������������������������—————�����—————�����—————�����—————�����—————�����������������������������������������������������������������������– �����������������������– ���������2,551,820 ���������2,551,820 ���������1,916,077�����������������������������������������������������—————�����—————�����—————�����—————�����—————
The�table�below�summarises�weighted�average�effective�interest�rates�for�financial�instruments.
Weighted Weighted average period average period 30.06.11 for which rate/ 30.06.10 for which rate/ % p.a. yield is fixed % p.a. yield is fixed
United�Kingdom�government�bonds�����������������-0.1162% ���������20.55�years��������������0.3840% 19.81 yearsUnited�States�government�bonds������������������������0.6766% ���������13.75�years��������������0.9561% 9.31 yearsJapanese�government�bonds �������������������������������������������–��������������������������–��������������1.5130% 6.70 years
Interest rate sensitivity analysis
An�increase�of�100�basis�points�(30.06.10:�100�basis�points)�in�interest�rates�as�at�the�reporting�date�would�havedecreased�the�net�assets�attributable�to�holders�of�redeemable�participating�preference�shares�by�£10,111,965(30.06.10:�£6,928,968)�and�a�decrease�of 25 basis�points�in�interest�rates�would�have�increased�the�net�assetsattributable�to�holders�of�redeemable�participating�preference�shares�by�£2,527,991 (30.06.10:�50�basis�points£3,464,484).
As�all� the�Company’s� fixed� rate� securities�are� index-linked�bonds,� their�yields,�and�as�a�consequence� theirprices,� are� determined� by� market� perception� as� to� the� appropriate� level� of� yields� given� the� economicbackground.
RUFFER INVESTMENT COMPANY LIMITEDNotes to the Financial Statements (continued)
Annual Financial Report 32
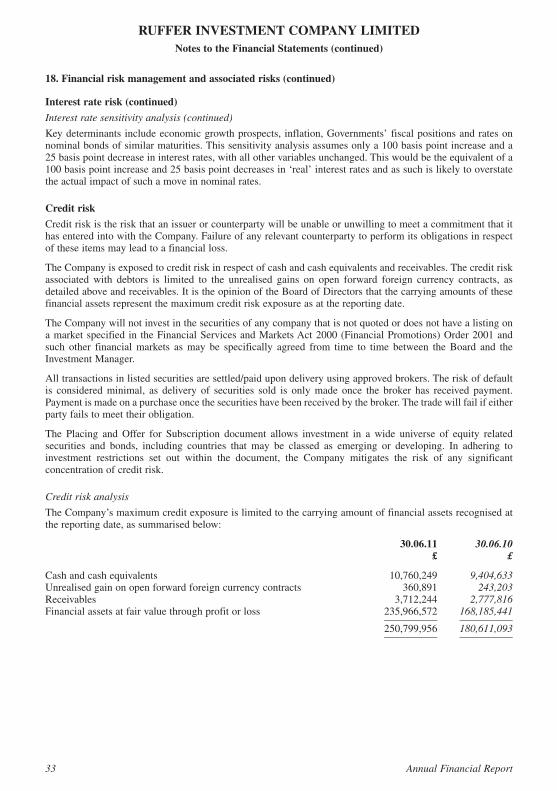
18. Financial risk management and associated risks (continued)
Interest rate risk (continued)
Interest rate sensitivity analysis (continued)
Key�determinants�include�economic�growth�prospects,� inflation,�Governments’�fiscal�positions�and�rates�onnominal�bonds�of�similar�maturities.�This�sensitivity�analysis�assumes�only�a�100�basis�point�increase�and�a25 basis�point�decrease�in�interest�rates,�with�all�other�variables�unchanged.�This�would�be�the�equivalent�of�a100�basis�point�increase�and 25 basis�point�decreases�in�‘real’�interest�rates�and�as�such�is�likely�to�overstatethe�actual�impact�of�such�a�move�in�nominal�rates.
Credit risk
Credit�risk�is�the�risk�that�an�issuer�or�counterparty�will�be�unable�or�unwilling�to�meet�a�commitment�that�ithas�entered�into�with�the�Company.�Failure�of�any�relevant�counterparty�to�perform�its�obligations�in�respectof�these�items�may�lead�to�a�financial�loss.
The�Company�is�exposed�to�credit�risk�in�respect�of�cash�and�cash�equivalents�and�receivables. The�credit�riskassociated� with� debtors� is� limited� to� the� unrealised� gains� on� open� forward� foreign� currency� contracts,� asdetailed�above�and�receivables.�It�is�the�opinion�of�the�Board�of�Directors�that�the�carrying�amounts�of�thesefinancial�assets�represent�the�maximum�credit�risk�exposure�as�at�the�reporting�date.
The�Company�will�not�invest�in�the�securities�of�any�company�that�is�not�quoted�or�does�not�have�a�listing�ona�market�specified�in� the�Financial�Services�and�Markets�Act�2000�(Financial�Promotions)�Order�2001�andsuch� other� financial�markets� as�may� be� specifically� agreed� from� time� to� time� between� the�Board� and� theInvestment�Manager.
All�transactions�in�listed�securities�are�settled/paid�upon�delivery�using�approved�brokers.�The�risk�of�defaultis� considered�minimal,� as� delivery� of� securities� sold� is� only�made� once� the� broker� has� received� payment.Payment�is�made�on�a�purchase�once�the�securities�have�been�received�by�the�broker.�The�trade�will�fail�if�eitherparty�fails�to�meet�their�obligation.
The� Placing� and�Offer� for� Subscription� document� allows� investment� in� a� wide� universe� of� equity� relatedsecurities� and� bonds,� including� countries� that� may� be� classed� as� emerging� or� developing.� In� adhering� toinvestment� restrictions� set� out� within� the� document,� the� Company� mitigates� the� risk� of� any� significantconcentration�of�credit�risk.
Credit risk analysis
The�Company’s�maximum�credit�exposure�is�limited�to�the�carrying�amount�of�financial�assets�recognised�atthe�reporting�date,�as�summarised�below:
30.06.11 30.06.10 £ £
Cash�and�cash�equivalents 10,760,249������������9,404,633Unrealised�gain�on�open�forward�foreign�currency�contracts 360,891���������������243,203Receivables 3,712,244������������2,777,816Financial�assets at�fair�value�through�profit�or�loss 235,966,572��������168,185,441
—————��������—————250,799,956��������180,611,093—————��������—————
RUFFER INVESTMENT COMPANY LIMITEDNotes to the Financial Statements (continued)
33 Annual Financial Report
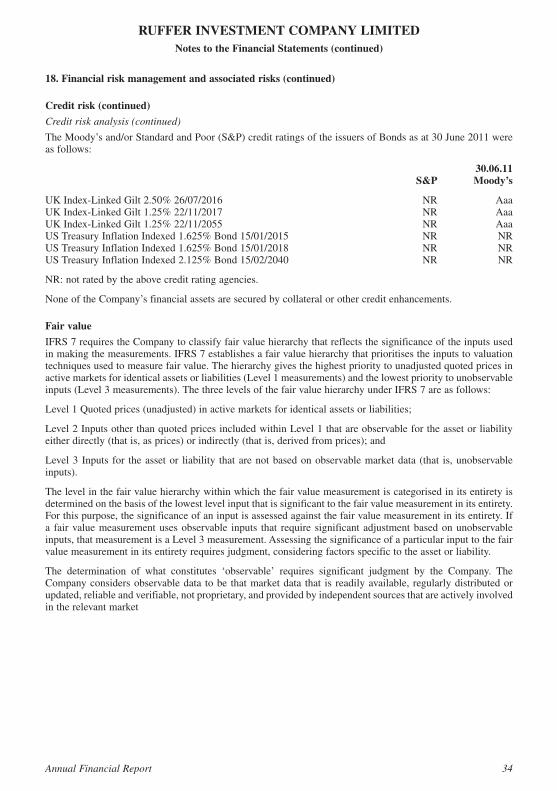
18. Financial risk management and associated risks (continued)
Credit risk (continued)
Credit risk analysis (continued)
The�Moody’s�and/or�Standard�and�Poor�(S&P)�credit�ratings�of�the�issuers�of�Bonds�as�at�30�June�2011�wereas�follows:
30.06.11 S&P Moody’s
UK�Index-Linked�Gilt�2.50%�26/07/2016 NR ���������������������AaaUK�Index-Linked�Gilt�1.25%�22/11/2017 NR ���������������������AaaUK�Index-Linked�Gilt�1.25%�22/11/2055 NR ���������������������AaaUS�Treasury�Inflation�Indexed�1.625%�Bond�15/01/2015 NR ����������������������NRUS�Treasury�Inflation�Indexed�1.625%�Bond�15/01/2018 NR ����������������������NRUS�Treasury�Inflation�Indexed�2.125%�Bond�15/02/2040 NR ����������������������NR
NR: not�rated�by�the�above�credit�rating�agencies.
None�of�the�Company’s�financial�assets�are�secured�by�collateral�or�other�credit�enhancements.
Fair value
IFRS�7�requires�the�Company�to�classify�fair�value�hierarchy�that�reflects�the�significance�of�the�inputs�usedin�making�the�measurements.�IFRS�7�establishes�a�fair�value�hierarchy�that�prioritises�the�inputs�to�valuationtechniques�used�to�measure�fair�value.�The�hierarchy�gives�the�highest�priority�to�unadjusted�quoted�prices�inactive�markets�for�identical�assets�or�liabilities�(Level�1�measurements)�and�the�lowest�priority�to�unobservableinputs�(Level�3�measurements).�The�three�levels�of�the�fair�value�hierarchy�under�IFRS�7�are�as�follows:
Level�1�Quoted�prices�(unadjusted)�in�active�markets�for�identical�assets�or�liabilities;
Level�2�Inputs�other�than�quoted�prices�included�within�Level�1�that�are�observable�for�the�asset�or�liabilityeither�directly�(that�is,�as�prices)�or�indirectly�(that�is,�derived�from�prices);�and
Level�3� Inputs� for� the�asset�or� liability� that�are�not�based�on�observable�market�data� (that� is,�unobservableinputs).
The�level�in�the�fair�value�hierarchy�within�which�the�fair�value�measurement�is�categorised�in�its�entirety�isdetermined�on�the�basis�of�the�lowest�level�input�that�is�significant�to�the�fair�value�measurement�in�its�entirety.For�this�purpose,�the�significance�of�an�input�is�assessed�against�the�fair�value�measurement�in�its�entirety.�Ifa� fair�value�measurement�uses�observable� inputs� that� require� significant�adjustment�based�on�unobservableinputs,�that�measurement�is�a�Level�3�measurement.�Assessing�the�significance�of�a�particular�input�to�the�fairvalue�measurement�in�its�entirety�requires�judgment,�considering�factors�specific�to�the�asset�or�liability.�
The� determination� of� what� constitutes� ‘observable’� requires� significant� judgment� by� the� Company.� TheCompany�considers�observable�data� to�be� that�market�data� that� is� readily�available,� regularly�distributed�orupdated,�reliable�and�verifiable,�not�proprietary,�and�provided�by�independent�sources�that�are�actively�involvedin�the�relevant�market
RUFFER INVESTMENT COMPANY LIMITEDNotes to the Financial Statements (continued)
Annual Financial Report 34
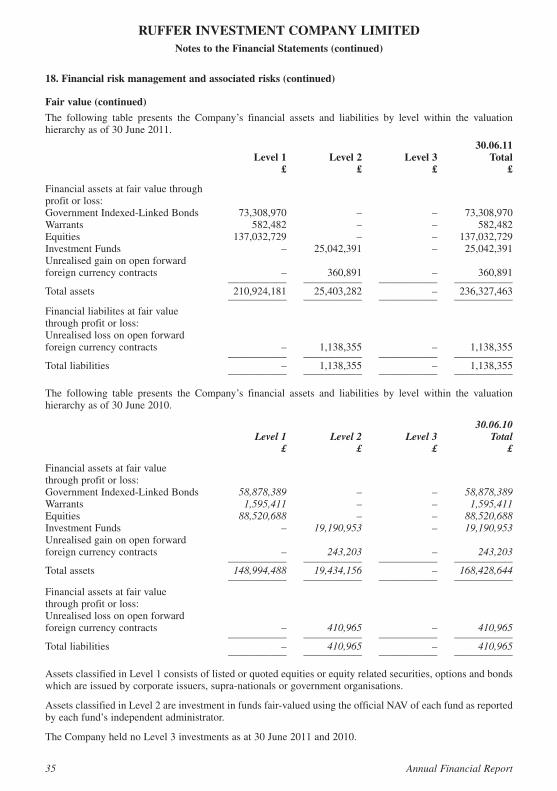
18. Financial risk management and associated risks (continued)
Fair value (continued)
The� following� table� presents� the� Company’s� financial� assets� and� liabilities� by� level� within� the� valuationhierarchy�as�of�30�June�2011.
30.06.11 Level 1 Level 2 Level 3 Total £ £ £ £
Financial�assets�at�fair�value�throughprofit�or�loss:Government�Indexed-Linked�Bonds���������������73,308,970��������������������������–��������������������������–����������73,308,970Warrants���������������������������������������������������������������582,482��������������������������–��������������������������–���������������582,482Equities ���������������������������������������������������������137,032,729��������������������������–��������������������������–��������137,032,729Investment�Funds������������������������������������������������������������–����������25,042,391��������������������������–����������25,042,391Unrealised�gain�on�open�forwardforeign�currency�contracts ����������������������������������������������–���������������360,891��������������������������–���������������360,891��������������������������������������������������������������������—————–������—————–������—————–������—————–Total�assets����������������������������������������������������210,924,181����������25,403,282��������������������������–��������236,327,463��������������������������������������������������������������������—————–������—————–������—————–������—————–Financial�liabilites�at�fair�valuethrough�profit�or�loss:Unrealised�loss�on�open�forwardforeign�currency�contracts ����������������������������������������������–������������1,138,355��������������������������–������������1,138,355��������������������������������������������������������������������—————–������—————–������—————–������—————–Total�liabilities ����������������������������������������������������������������–������������1,138,355��������������������������–������������1,138,355��������������������������������������������������������������������—————–������—————–������—————–������—————–
The� following� table� presents� the� Company’s� financial� assets� and� liabilities� by� level� within� the� valuationhierarchy�as�of�30�June�2010.
30.06.10 Level 1 Level 2 Level 3 Total £ £ £ £
Financial�assets�at�fair�valuethrough�profit�or�loss:Government�Indexed-Linked�Bonds���������������58,878,389 – – 58,878,389Warrants������������������������������������������������������������1,595,411 – – 1,595,411Equities �����������������������������������������������������������88,520,688 – – 88,520,688Investment�Funds������������������������������������������������������������– 19,190,953 – 19,190,953Unrealised�gain�on�open�forwardforeign�currency�contracts ����������������������������������������������– 243,203 – 243,203��������������������������������������������������������������������—————–������—————–������—————–������—————–Total�assets����������������������������������������������������148,994,488 19,434,156 – 168,428,644��������������������������������������������������������������������—————–������—————–������—————–������—————–Financial�assets�at�fair�valuethrough�profit�or�loss:Unrealised�loss�on�open�forwardforeign�currency�contracts ����������������������������������������������– 410,965 – 410,965��������������������������������������������������������������������—————–������—————–������—————–������—————–Total�liabilities ����������������������������������������������������������������– 410,965 – 410,965��������������������������������������������������������������������—————–������—————–������—————–������—————–
Assets�classified�in�Level�1�consists�of�listed�or�quoted�equities�or�equity�related�securities,�options�and�bondswhich�are�issued�by�corporate�issuers,�supra-nationals�or�government�organisations.
Assets�classified�in�Level�2�are�investment�in�funds�fair-valued�using�the�official�NAV�of�each�fund�as�reportedby�each�fund’s�independent�administrator.
The�Company�held�no�Level�3�investments�as�at�30�June�2011�and�2010.
RUFFER INVESTMENT COMPANY LIMITEDNotes to the Financial Statements (continued)
35 Annual Financial Report
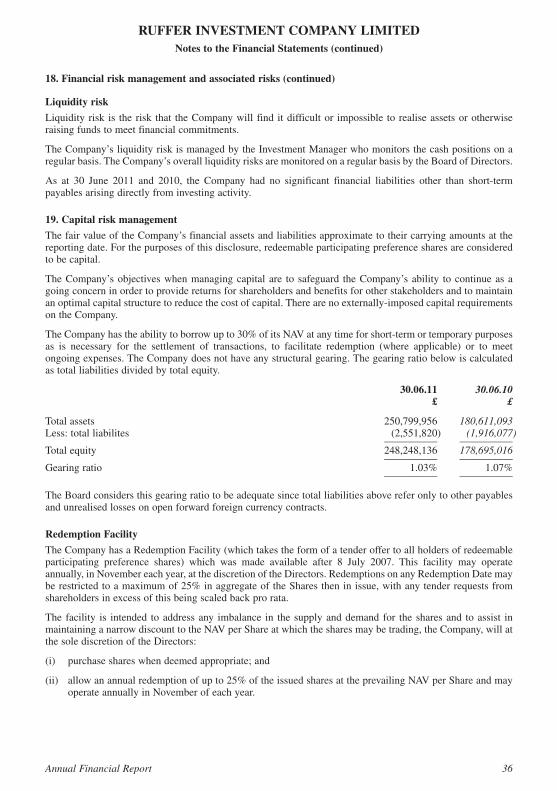
18. Financial risk management and associated risks (continued)
Liquidity risk
Liquidity�risk� is� the�risk� that� the�Company�will� find� it�difficult�or� impossible� to�realise�assets�or�otherwiseraising�funds�to�meet�financial�commitments.
The�Company’s�liquidity�risk�is�managed�by�the�Investment�Manager�who�monitors�the�cash�positions�on�aregular�basis.�The�Company’s�overall�liquidity�risks�are�monitored�on�a�regular�basis�by�the�Board�of�Directors.
As� at� 30� June� 2011� and� 2010,� the� Company� had� no� significant� financial� liabilities� other� than� short-termpayables�arising�directly�from�investing�activity.
19. Capital risk management
The�fair�value�of�the�Company’s�financial�assets�and�liabilities�approximate�to�their�carrying�amounts�at�thereporting�date.�For�the�purposes�of�this�disclosure,�redeemable�participating�preference�shares�are�consideredto�be�capital.
The�Company’s�objectives�when�managing�capital�are� to� safeguard� the�Company’s�ability� to�continue�as�agoing�concern�in�order�to�provide�returns�for�shareholders�and�benefits�for�other�stakeholders�and�to�maintainan�optimal�capital�structure�to�reduce�the�cost�of�capital.�There�are�no�externally-imposed�capital�requirementson�the�Company.
The�Company�has�the�ability�to�borrow�up�to�30%�of�its�NAV�at�any�time�for�short-term�or�temporary�purposesas� is� necessary� for� the� settlement� of� transactions,� to� facilitate� redemption� (where� applicable)� or� to� meetongoing�expenses.�The�Company�does�not�have�any�structural�gearing. The�gearing�ratio�below�is�calculatedas�total�liabilities�divided�by�total�equity.
30.06.11 30.06.10 £ £
Total�assets ������������������������������������������������������������������������������������������������������������250,799,956��������180,611,093Less:�total�liabilites ��������������������������������������������������������������������������������������������������(2,551,820) ���������(1,916,077)
—————��������—————Total�equity������������������������������������������������������������������������������������������������������������248,248,136��������178,695,016
—————��������—————Gearing�ratio �������������������������������������������������������������������������������������������������������������������1.03%������������������1.07%
—————��������—————
The�Board�considers�this�gearing�ratio�to�be�adequate�since�total�liabilities�above�refer�only�to�other�payablesand�unrealised�losses�on�open�forward�foreign�currency�contracts.
Redemption Facility
The�Company�has�a�Redemption�Facility�(which�takes�the�form�of�a�tender�offer�to�all�holders�of�redeemableparticipating� preference� shares)� which� was� made� available� after� 8� July� 2007.� This� facility� may� operateannually,�in�November�each�year,�at�the�discretion�of�the�Directors.�Redemptions�on�any�Redemption�Date�maybe�restricted�to�a�maximum�of�25%�in�aggregate�of�the�Shares�then�in�issue,�with�any�tender�requests�fromshareholders�in�excess�of�this�being�scaled�back�pro�rata.
The� facility� is� intended� to�address�any� imbalance� in� the�supply�and�demand� for� the�shares�and� to�assist� inmaintaining�a�narrow�discount�to�the�NAV�per�Share�at�which�the�shares�may�be�trading,�the�Company,�will�atthe�sole�discretion�of�the�Directors:
(i) purchase�shares�when�deemed�appropriate;�and
(ii) allow�an�annual�redemption�of�up�to�25%�of�the�issued�shares�at�the�prevailing�NAV�per�Share�and�mayoperate�annually�in�November�of�each�year.
RUFFER INVESTMENT COMPANY LIMITEDNotes to the Financial Statements (continued)
Annual Financial Report 36
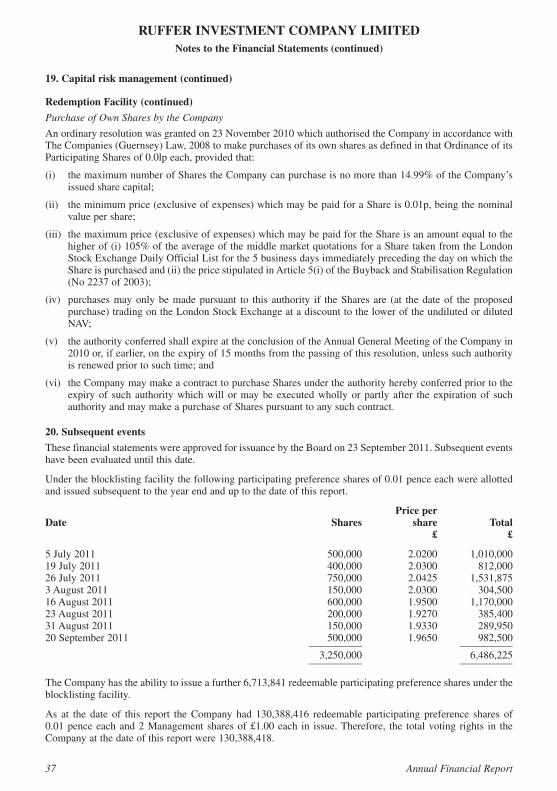
19. Capital risk management (continued)
Redemption Facility (continued)
Purchase of Own Shares by the Company
An�ordinary�resolution�was�granted�on�23�November�2010�which�authorised�the�Company�in�accordance�withThe�Companies�(Guernsey)�Law,�2008�to�make�purchases�of�its�own�shares�as�defined�in�that�Ordinance�of�itsParticipating�Shares�of�0.0lp�each,�provided�that:
(i) the�maximum�number�of�Shares�the�Company�can�purchase�is�no�more�than�14.99%�of�the�Company’sissued�share�capital;
(ii) the�minimum�price�(exclusive�of�expenses)�which�may�be�paid�for�a�Share�is�0.01p,�being�the�nominalvalue�per�share;
(iii) the�maximum�price�(exclusive�of�expenses)�which�may�be�paid�for�the�Share�is�an�amount�equal�to�thehigher�of�(i)�105%�of�the�average�of�the�middle�market�quotations�for�a�Share�taken�from�the�LondonStock�Exchange�Daily�Official�List�for�the�5�business�days�immediately�preceding�the�day�on�which�theShare�is�purchased�and�(ii)�the�price�stipulated�in�Article�5(i)�of�the�Buyback�and�Stabilisation�Regulation(No�2237�of�2003);
(iv) purchases�may�only�be�made�pursuant� to� this� authority� if� the�Shares� are� (at� the�date�of� the�proposedpurchase)�trading�on�the�London�Stock�Exchange�at�a�discount�to�the�lower�of�the�undiluted�or�dilutedNAV;
(v) the�authority�conferred�shall�expire�at�the�conclusion�of�the�Annual�General�Meeting�of�the�Company�in2010�or,�if�earlier,�on�the�expiry�of�15�months�from�the�passing�of�this�resolution,�unless�such�authorityis�renewed�prior�to�such�time;�and
(vi) the�Company�may�make�a�contract�to�purchase�Shares�under�the�authority�hereby�conferred�prior�to�theexpiry�of� such�authority�which�will� or�may�be� executed�wholly�or�partly� after� the� expiration�of� suchauthority�and�may�make�a�purchase�of�Shares�pursuant�to�any�such�contract.
20. Subsequent events
These�financial�statements�were�approved�for�issuance�by�the�Board�on�23�September�2011.�Subsequent�eventshave�been�evaluated�until�this�date.
Under�the�blocklisting�facility�the�following�participating�preference�shares�of�0.01�pence�each�were�allottedand�issued�subsequent�to�the�year�end�and�up�to�the�date�of�this�report.
Price perDate Shares share Total £ £
5�July�2011���������������������������������������������������������������������������������������500,000�����������������2.0200������������1,010,00019�July�2011�������������������������������������������������������������������������������������400,000�����������������2.0300���������������812,00026�July�2011�������������������������������������������������������������������������������������750,000�����������������2.0425������������1,531,8753�August�2011 ����������������������������������������������������������������������������������150,000�����������������2.0300���������������304,50016�August�2011 ��������������������������������������������������������������������������������600,000�����������������1.9500������������1,170,00023�August�2011 ��������������������������������������������������������������������������������200,000�����������������1.9270���������������385,40031 August�2011 ��������������������������������������������������������������������������������150,000�����������������1.9330���������������289,95020�September�2011 ��������������������������������������������������������������������������500,000�����������������1.9650���������������982,500���������������������������������������������������������������������������������������������������—————������������������������������������—————������������������������������������������������������������������������������������������ ������������3,250,000���������������������������� ������������6,486,225���������������������������������������������������������������������������������������������������—————������������������������������������—————
The�Company�has�the�ability�to�issue�a�further 6,713,841�redeemable�participating�preference�shares�under�theblocklisting�facility.
As� at� the� date� of� this� report� the�Company� had� 130,388,416� redeemable� participating� preference� shares� of0.01 pence�each�and�2�Management� shares�of�£1.00�each� in� issue.�Therefore,� the� total�voting� rights� in� theCompany�at�the�date�of�this�report�were�130,388,418.
RUFFER INVESTMENT COMPANY LIMITEDNotes to the Financial Statements (continued)
37 Annual Financial Report
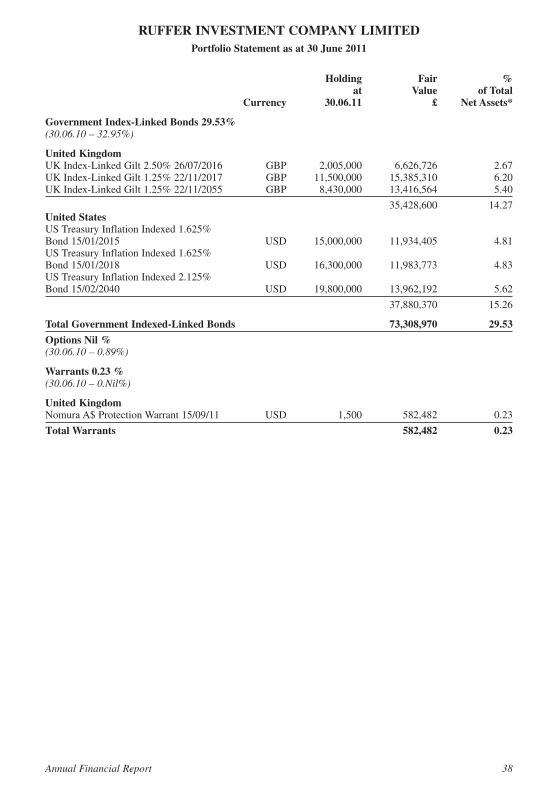
Holding Fair % at Value of Total Currency 30.06.11 £ Net Assets*
Government Index-Linked Bonds 29.53%(30.06.10 – 32.95%)
United KingdomUK�Index-Linked�Gilt�2.50%�26/07/2016����������������GBP������������2,005,000������������6,626,726���������������������2.67UK�Index-Linked�Gilt�1.25%�22/11/2017����������������GBP����������11,500,000����������15,385,310���������������������6.20UK�Index-Linked�Gilt�1.25%�22/11/2055����������������GBP������������8,430,000����������13,416,564���������������������5.40
���������������������������������������������������������������������������������������������������������������������������������35,428,600�������������������14.27United StatesUS�Treasury�Inflation�Indexed�1.625%Bond�15/01/2015 ������������������������������������������������������USD����������15,000,000����������11,934,405���������������������4.81US�Treasury�Inflation�Indexed�1.625%Bond�15/01/2018 ������������������������������������������������������USD����������16,300,000����������11,983,773���������������������4.83US�Treasury�Inflation�Indexed�2.125%Bond�15/02/2040 ������������������������������������������������������USD����������19,800,000����������13,962,192���������������������5.62
���������������������������������������������������������������������������������������������������������������������������������37,880,370�������������������15.26
Total Government Indexed-Linked Bonds 73,308,970 29.53
Options Nil %(30.06.10 – 0.89%)
Warrants 0.23 %(30.06.10 – 0.Nil%)
United KingdomNomura�A$�Protection�Warrant�15/09/11�����������������USD�������������������1,500���������������582,482���������������������0.23
Total Warrants 582,482 0.23
RUFFER INVESTMENT COMPANY LIMITEDPortfolio Statement as at 30 June 2011
Annual Financial Report 38
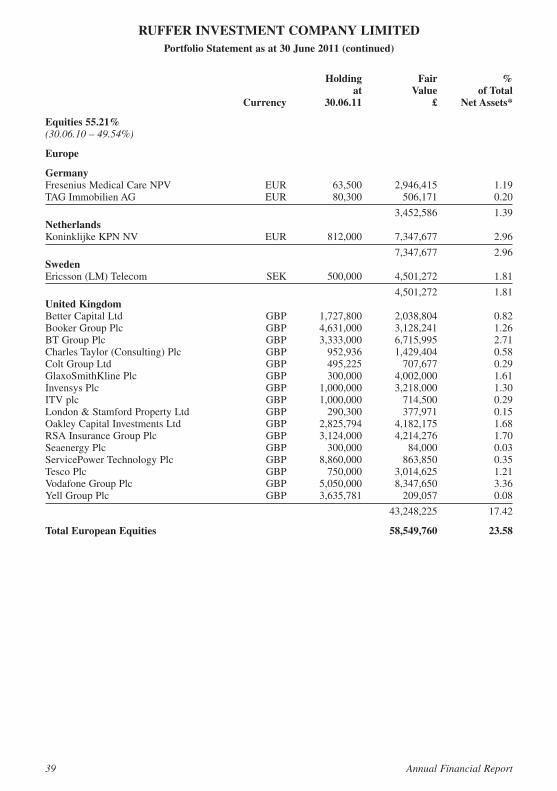
Holding Fair % at Value of Total Currency 30.06.11 £ Net Assets*
Equities 55.21%(30.06.10 – 49.54%)
Europe
GermanyFresenius�Medical�Care�NPV�����������������������������������EUR�����������������63,500������������2,946,415���������������������1.19TAG�Immobilien�AG ������������������������������������������������EUR�����������������80,300���������������506,171���������������������0.20
�����������������������������������������������������������������������������������������������������������������������������������3,452,586���������������������1.39NetherlandsKoninklijke�KPN�NV �����������������������������������������������EUR���������������812,000������������7,347,677���������������������2.96
�����������������������������������������������������������������������������������������������������������������������������������7,347,677���������������������2.96SwedenEricsson�(LM)�Telecom ��������������������������������������������SEK���������������500,000������������4,501,272���������������������1.81
�����������������������������������������������������������������������������������������������������������������������������������4,501,272���������������������1.81United KingdomBetter�Capital�Ltd �����������������������������������������������������GBP������������1,727,800������������2,038,804���������������������0.82Booker�Group�Plc �����������������������������������������������������GBP������������4,631,000������������3,128,241���������������������1.26BT�Group�Plc������������������������������������������������������������GBP������������3,333,000������������6,715,995���������������������2.71Charles�Taylor�(Consulting)�Plc �������������������������������GBP���������������952,936������������1,429,404���������������������0.58Colt�Group�Ltd����������������������������������������������������������GBP���������������495,225���������������707,677���������������������0.29GlaxoSmithKline�Plc ������������������������������������������������GBP���������������300,000������������4,002,000���������������������1.61Invensys�Plc ��������������������������������������������������������������GBP������������1,000,000������������3,218,000���������������������1.30ITV�plc����������������������������������������������������������������������GBP������������1,000,000���������������714,500���������������������0.29London�&�Stamford�Property�Ltd ����������������������������GBP���������������290,300���������������377,971���������������������0.15Oakley�Capital�Investments�Ltd �������������������������������GBP������������2,825,794������������4,182,175���������������������1.68RSA�Insurance�Group�Plc ����������������������������������������GBP������������3,124,000������������4,214,276���������������������1.70Seaenergy�Plc������������������������������������������������������������GBP���������������300,000�����������������84,000���������������������0.03ServicePower�Technology�Plc ����������������������������������GBP������������8,860,000���������������863,850���������������������0.35Tesco�Plc �������������������������������������������������������������������GBP���������������750,000������������3,014,625���������������������1.21Vodafone�Group�Plc��������������������������������������������������GBP������������5,050,000������������8,347,650���������������������3.36Yell�Group�Plc ����������������������������������������������������������GBP������������3,635,781���������������209,057���������������������0.08
���������������������������������������������������������������������������������������������������������������������������������43,248,225�������������������17.42
Total European Equities 58,549,760 23.58
RUFFER INVESTMENT COMPANY LIMITEDPortfolio Statement as at 30 June 2011 (continued)
39 Annual Financial Report
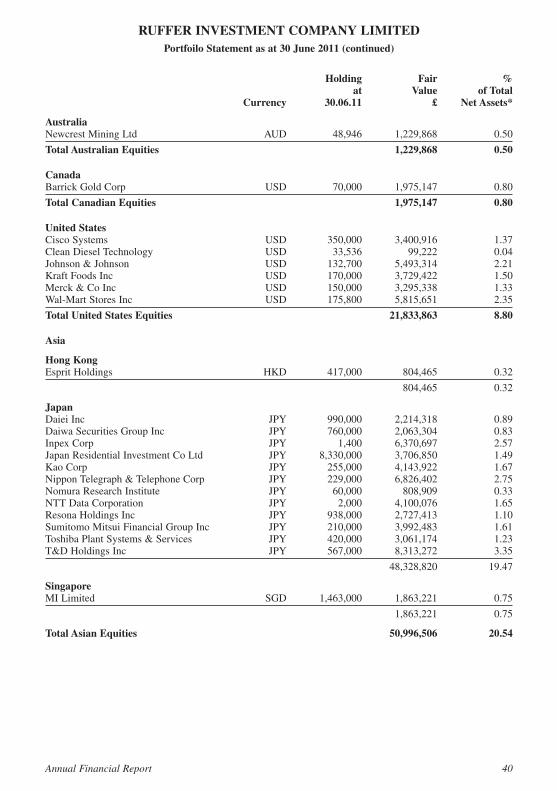
Holding Fair % at Value of Total Currency 30.06.11 £ Net Assets*
AustraliaNewcrest�Mining�Ltd �����������������������������������������������AUD�����������������48,946������������1,229,868���������������������0.50
Total Australian Equities 1,229,868 0.50
CanadaBarrick�Gold�Corp ����������������������������������������������������USD�����������������70,000������������1,975,147���������������������0.80
Total Canadian Equities 1,975,147 0.80
United StatesCisco�Systems�����������������������������������������������������������USD���������������350,000������������3,400,916���������������������1.37Clean�Diesel�Technology������������������������������������������USD�����������������33,536�����������������99,222���������������������0.04Johnson�&�Johnson���������������������������������������������������USD���������������132,700������������5,493,314���������������������2.21Kraft�Foods�Inc���������������������������������������������������������USD���������������170,000������������3,729,422���������������������1.50Merck�&�Co�Inc��������������������������������������������������������USD���������������150,000������������3,295,338���������������������1.33Wal-Mart�Stores�Inc �������������������������������������������������USD���������������175,800������������5,815,651���������������������2.35
Total United States Equities 21,833,863 8.80
Asia
Hong KongEsprit�Holdings ��������������������������������������������������������HKD���������������417,000���������������804,465���������������������0.32
��������������������������������������������������������������������������������������������������������������������������������������804,465���������������������0.32
JapanDaiei�Inc���������������������������������������������������������������������JPY���������������990,000������������2,214,318���������������������0.89Daiwa�Securities�Group�Inc���������������������������������������JPY���������������760,000������������2,063,304���������������������0.83Inpex�Corp �����������������������������������������������������������������JPY�������������������1,400������������6,370,697���������������������2.57Japan�Residential�Investment�Co�Ltd ������������������������JPY������������8,330,000������������3,706,850���������������������1.49Kao�Corp��������������������������������������������������������������������JPY���������������255,000������������4,143,922���������������������1.67Nippon�Telegraph�&�Telephone�Corp������������������������JPY���������������229,000������������6,826,402���������������������2.75Nomura�Research�Institute ����������������������������������������JPY�����������������60,000���������������808,909���������������������0.33NTT�Data�Corporation�����������������������������������������������JPY�������������������2,000������������4,100,076���������������������1.65Resona�Holdings�Inc��������������������������������������������������JPY���������������938,000������������2,727,413���������������������1.10Sumitomo�Mitsui�Financial�Group�Inc����������������������JPY���������������210,000������������3,992,483���������������������1.61Toshiba�Plant�Systems�&�Services ����������������������������JPY���������������420,000������������3,061,174���������������������1.23T&D�Holdings�Inc �����������������������������������������������������JPY���������������567,000������������8,313,272���������������������3.35
���������������������������������������������������������������������������������������������������������������������������������48,328,820�������������������19.47
SingaporeMI�Limited����������������������������������������������������������������SGD������������1,463,000������������1,863,221���������������������0.75
�����������������������������������������������������������������������������������������������������������������������������������1,863,221���������������������0.75
Total Asian Equities 50,996,506 20.54
RUFFER INVESTMENT COMPANY LIMITEDPortfoilo Statement as at 30 June 2011 (continued)
Annual Financial Report 40
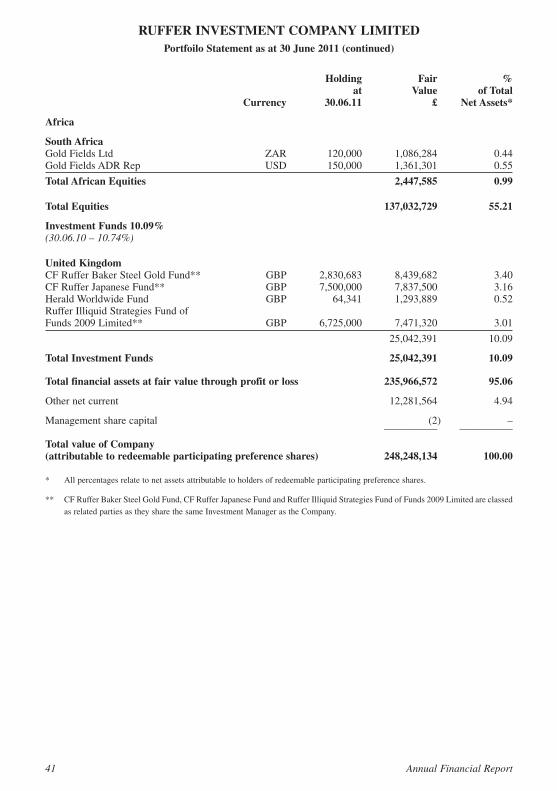
Holding Fair % at Value of Total Currency 30.06.11 £ Net Assets*
Africa
South Africa ���������������������������������������������������������������������������������������������������������������������������������������������������������Gold�Fields�Ltd���������������������������������������������������������ZAR���������������120,000������������1,086,284���������������������0.44Gold�Fields�ADR�Rep ����������������������������������������������USD���������������150,000������������1,361,301���������������������0.55
Total African Equities 2,447,585 0.99
Total Equities 137,032,729 55.21
Investment Funds 10.09%(30.06.10 – 10.74%)
United KingdomCF�Ruffer�Baker�Steel�Gold�Fund** ������������������������GBP������������2,830,683������������8,439,682���������������������3.40CF�Ruffer�Japanese�Fund** �������������������������������������GBP������������7,500,000������������7,837,500���������������������3.16Herald�Worldwide�Fund��������������������������������������������GBP�����������������64,341������������1,293,889���������������������0.52Ruffer�Illiquid�Strategies�Fund�ofFunds�2009�Limited**����������������������������������������������GBP������������6,725,000������������7,471,320���������������������3.01
���������������������������������������������������������������������������������������������������������������������������������25,042,391�������������������10.09
Total Investment Funds 25,042,391 10.09
Total financial assets at fair value through profit or loss 235,966,572 95.06
Other�net�current �����������������������������������������������������������������������������������������������������12,281,564���������������������4.94
Management�share�capital �����������������������������������������������������������������������������������������������������(2)�������������������������–—————��������—————
Total value of Company(attributable to redeemable participating preference shares) 248,248,134 100.00
* ������All�percentages�relate�to�net�assets�attributable�to�holders�of�redeemable�participating�preference�shares.
** ����CF�Ruffer�Baker�Steel�Gold�Fund,�CF�Ruffer�Japanese�Fund�and�Ruffer�Illiquid�Strategies�Fund�of�Funds�2009�Limited�are�classedas�related�parties�as�they�share�the�same�Investment�Manager�as�the�Company.
RUFFER INVESTMENT COMPANY LIMITEDPortfoilo Statement as at 30 June 2011 (continued)
41 Annual Financial Report
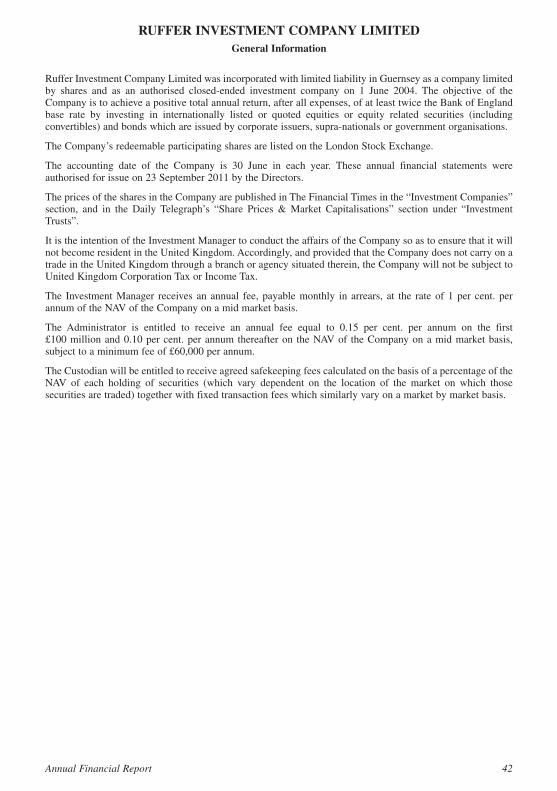
Ruffer�Investment�Company�Limited�was�incorporated�with�limited�liability�in�Guernsey�as�a�company�limitedby� shares� and� as� an� authorised� closed-ended� investment� company� on� 1� June� 2004.� The� objective� of� theCompany�is�to�achieve�a�positive�total�annual�return,�after�all�expenses,�of�at�least�twice�the�Bank�of�Englandbase� rate� by� investing� in� internationally� listed� or� quoted� equities� or� equity� related� securities� (includingconvertibles)�and�bonds�which�are�issued�by�corporate�issuers,�supra-nationals�or�government�organisations.�
The�Company’s�redeemable�participating�shares�are�listed�on�the�London�Stock�Exchange.
The� accounting� date� of� the� Company� is� 30� June� in� each� year.� These� annual� financial� statements� wereauthorised�for�issue�on�23�September�2011�by�the�Directors.
The�prices�of�the�shares�in�the�Company�are�published�in�The�Financial�Times�in�the�“Investment�Companies”section,� and� in� the� Daily� Telegraph’s� “Share� Prices� &�Market� Capitalisations”� section� under� “InvestmentTrusts”.
It�is�the�intention�of�the�Investment�Manager�to�conduct�the�affairs�of�the�Company�so�as�to�ensure�that�it�willnot�become�resident�in�the�United�Kingdom.�Accordingly,�and�provided�that�the�Company�does�not�carry�on�atrade�in�the�United�Kingdom�through�a�branch�or�agency�situated�therein,�the�Company�will�not�be�subject�toUnited�Kingdom�Corporation�Tax�or�Income�Tax.
The� Investment�Manager� receives� an� annual� fee,� payable�monthly� in� arrears,� at� the� rate�of�1�per� cent.� perannum�of�the�NAV�of�the�Company�on�a�mid�market�basis.
The� Administrator� is� entitled� to� receive� an� annual� fee� equal� to� 0.15� per� cent.� per� annum� on� the� first£100 million�and�0.10�per�cent.�per�annum�thereafter�on� the�NAV�of� the�Company�on�a�mid�market�basis,subject�to�a�minimum�fee�of�£60,000�per�annum.
The�Custodian�will�be�entitled�to�receive�agreed�safekeeping�fees�calculated�on�the�basis�of�a�percentage�of�theNAV� of� each� holding� of� securities� (which� vary� dependent� on� the� location� of� the� market� on� which� thosesecurities�are�traded)�together�with�fixed�transaction�fees�which�similarly�vary�on�a�market�by�market�basis.
RUFFER INVESTMENT COMPANY LIMITEDGeneral Information
Annual Financial Report 42
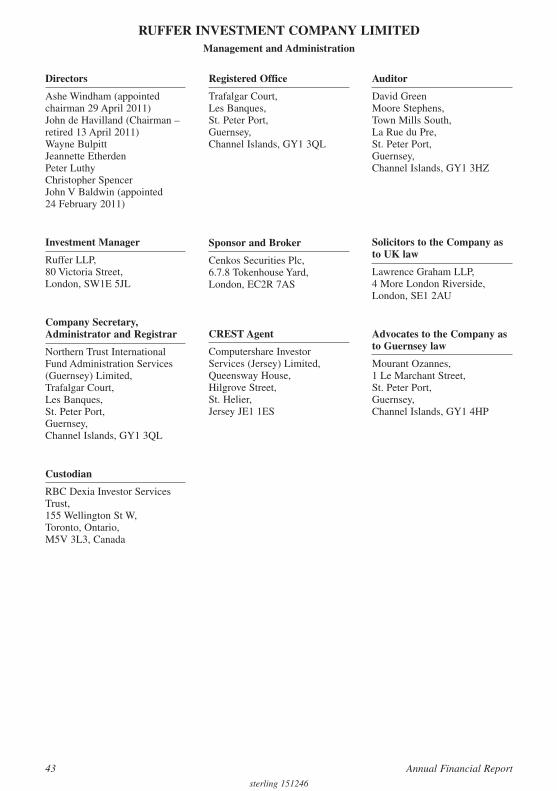
RUFFER INVESTMENT COMPANY LIMITED
Directors
Ashe�Windham�(appointedchairman�29�April�2011)John�de�Havilland�(Chairman�–retired�13�April�2011)Wayne�BulpittJeannette�EtherdenPeter�LuthyChristopher�SpencerJohn�V�Baldwin�(appointed24 February�2011)
Investment Manager
Ruffer�LLP,80�Victoria�Street,London,�SW1E�5JL
Company Secretary,Administrator and Registrar
Northern�Trust�InternationalFund�Administration�Services(Guernsey)�Limited,Trafalgar�Court,Les�Banques,St.�Peter�Port,Guernsey,Channel�Islands,�GY1�3QL
Custodian
RBC�Dexia�Investor�ServicesTrust,155�Wellington�St�W,Toronto,�Ontario,�M5V�3L3,�Canada
Registered Office
Trafalgar�Court,Les�Banques,St.�Peter�Port,Guernsey,Channel�Islands,�GY1�3QL
Sponsor and Broker
Cenkos�Securities�Plc,6.7.8�Tokenhouse�Yard,London,�EC2R�7AS
CREST Agent
Computershare�InvestorServices�(Jersey) Limited,Queensway�House,Hilgrove�Street,St.�Helier,Jersey�JE1�1ES
Auditor
David�GreenMoore�Stephens,Town�Mills�South,La�Rue�du�Pre,St.�Peter�Port,Guernsey,Channel�Islands,�GY1�3HZ
Solicitors to the Company asto UK law
Lawrence�Graham�LLP,4�More�London�Riverside,London,�SE1�2AU
Advocates to the Company asto Guernsey law
Mourant�Ozannes,1�Le�Marchant�Street,St.�Peter�Port,Guernsey,Channel�Islands,�GY1�4HP
Management and Administration
sterling 151246
43 Annual Financial Report