Embed Size (px)
Citation preview

www.FLDOE.org 1
Rule 6A-1.09422: Establishing Achievement Level Cut Scores for Florida Standards Assessments
Rule Development Workshops September 15 – 17, 2015
Vince Verges Assistant Deputy Commissioner
Accountability, Research, and Measurement
www.FLDOE.org 2
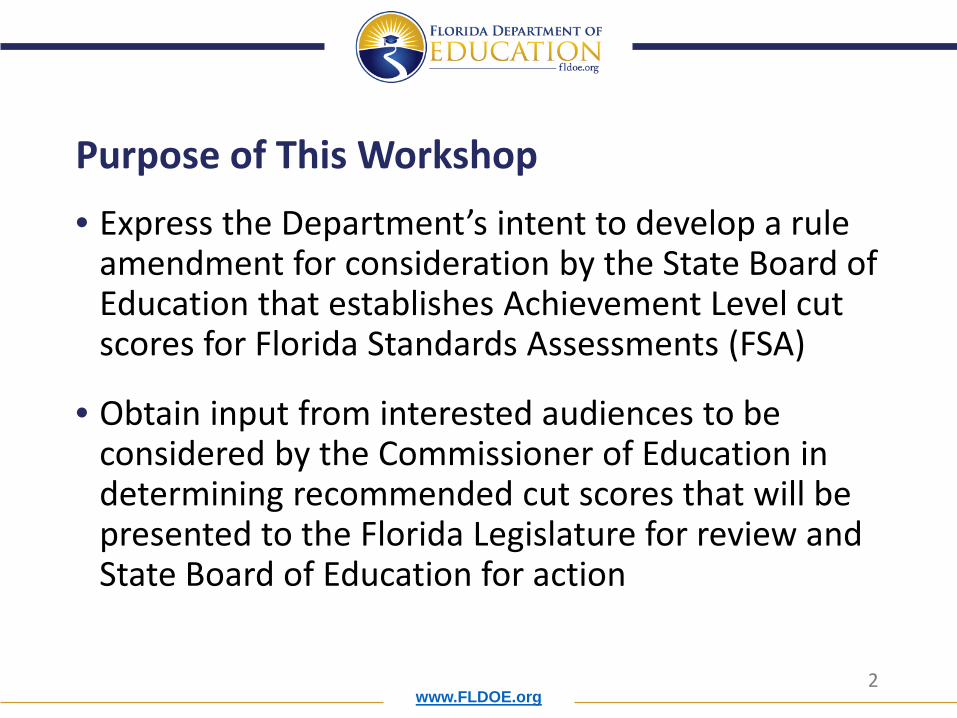
Purpose of This Workshop • Express the Department’s intent to develop a rule
amendment for consideration by the State Board of Education that establishes Achievement Level cut scores for Florida Standards Assessments (FSA)
• Obtain input from interested audiences to be considered by the Commissioner of Education in determining recommended cut scores that will be presented to the Florida Legislature for review and State Board of Education for action

www.FLDOE.org 3
Topics
• Information about FSA
• Review the achievement level cut score process
• Review the recommendations from educator and reactor panels
• Review the impact data
• Request feedback from you

www.FLDOE.org 4
Information about FSA • Assessments measure student achievement of
Florida Standards • Florida Standards may be accessed at
http://www.cpalms.org
• Implemented in spring 2015 (baseline administration)
• Transition from FCAT 2.0 Reading/Mathematics to FSA ELA/Mathematics

www.FLDOE.org 5
Information about FSA • Assessments administered:
• Grades 3-10 English Language Arts (ELA) • Grades 3-8 Mathematics • Algebra 1 EOC • Geometry EOC • Algebra 2 EOC

www.FLDOE.org 6
Information about FSA Administration Information
Grade/Subject Assessment
Session Length Number of Sessions
Grades 4–10 ELA Writing 120 Minutes 1
Grades 3–5 ELA Reading 80 Minutes 2
Grades 6–8 ELA Reading 85 Minutes 2
Grades 9–10 ELA Reading 90 Minutes 2
Grades 3–5 Mathematics 80 Minutes 2
Grades 6–8 Mathematics 60 Minutes 3
Algebra 1, Geometry, Algebra 2 EOCs
90 minutes 2

www.FLDOE.org 7
Information about FSA Administration Information
• Except for ELA Writing (one session only), all assessments are administered over two days
• Grades 4–7 ELA Writing and Grades 3–4 ELA Reading and Mathematics are administered as paper-based tests; all other assessments are computer-based.
• Paper-based accommodations are offered for eligible students.
• Students taking paper-based and computer-based tests have opportunities to access practice tests to become familiar with item types, functionality, and test mode or platform.

www.FLDOE.org 8
Why Are Standards Necessary? • To define what students should know and be able
to do • To identify clear expectations for students, parents,
and teachers • To improve teaching and learning • To develop a society able to compete in a global
economy
www.FLDOE.org 9
What Is Standard Setting? • A process of deriving levels of performance on
educational or professional assessments, by which decisions or classifications of persons will be made (Cizek, 2006)
• Test scores can be used to group students into meaningful Achievement Levels.
• Standard setting is the process whereby we “draw the lines” that separate the test scores into various Achievement Levels.
• Required when implementing new standards and new assessments

www.FLDOE.org 10
Achievement Levels
• There are five Achievement Levels • Requires the setting of four Achievement Level
cuts
Level 1 Level 5 Level 2 Level 3 Level 4 Low High
Five Achievement Levels, Four Cut Points

www.FLDOE.org 12
Standard-Setting Vocabulary • Content Standards: The content that students are expected to
know
• Achievement Levels: Levels of student achievement based on observed scale scores
• Achievement Level Descriptions (ALDs): Descriptions of the competencies associated with each level of achievement
• Cut Scores (Standards): Scores on an assessment that separate one Achievement Level from another
• Panelists (Judges/Raters): Those who participate in the standard-setting process (stakeholders, educators, professionals)
www.FLDOE.org 13
Standard-Setting Vocabulary • Feedback Data: Data provided to panelists to help them
assess the validity and reasonableness of the standards they are recommending (e.g., median/mean cut score ratings, degree of panelist agreement)
• Impact Data (Normative Feedback): Data that summarize the consequences of a proposed set of cut scores (e.g., How many students’ scores will be classified at Level 3?)
• Benchmark Data: Data that summarize Florida students’ performance on national and international standardized assessments; helps determine whether FSA achievement standards are nationally and internationally competitive.

www.FLDOE.org 14
We’ve Done This Before… 1998: • Reading and Mathematics Achievement Levels approved for grades 4, 5, 8 and 10 2001: • Reading and Mathematics Achievement Levels approved for grades 3-10 • Grade 10 FCAT Reading and Mathematics passing scores established 2011: • FCAT 2.0 Reading (grades 3-10) and Mathematics (3-8) Achievement Levels approved • Algebra 1 EOC Assessment Achievement Levels approved • Grade 10 FCAT 2.0 Reading and EOC assessment passing scores established in rule as
the minimum score in Achievement Level 3 2012: • FCAT 2.0 Science (grades 5 and 8) Achievement Levels approved • Biology 1 and Geometry EOC Assessment Achievement Levels approved 2013: • U.S. History EOC Assessment Achievement Levels approved 2014: • Civics EOC Assessment Achievement Levels approved
14
www.FLDOE.org 15
Important Dates
• Achievement Level Description (ALD) Panel: April 28–May 1
• Tallahassee, Florida • Educator Panel: August 31–September 4, 2015
• Orlando, Florida • Reactor Panel: September 10–11, 2015
• Orlando, Florida

www.FLDOE.org 16
Achievement Level Description Panel • April 28–May 1, 2015 • Four-day workshop • Forty-two panelists • Described achievement levels for content standards
by grade and subject • Specify what students in each achievement level are
expected to know and be able to do • ALDs are the link between content and achievement
standards
www.FLDOE.org 17
Standard Setting Educator Panel • August 31–September 4, 2015 • Five-day standard-setting workshop • Four rounds of standard setting • Over 300 panelists • Seventeen rooms of 16-21 panelists per room
setting standards concurrently • Recommending cut scores based primarily on content,
though impact and benchmark data is reviewed after the first two rounds of judgments

www.FLDOE.org 18
Standard Setting Reactor Panel • September 10–11, 2015 • Two-day meeting composed of
• community/education organization leaders • state university leaders • business leaders • school board members • superintendents
• Review educator panel recommended cut scores, impact data, and benchmark data
• Two rounds of judgment • 16 panelists

www.FLDOE.org 19
Educator Panel Overview • Main activities
• Table leader training • General session—overview of process • Grade/subject-specific training • Panelists did the following:
• took the test in the appropriate mode (paper or online) by grade and subject
• reviewed the content standards • reviewed achievement level descriptions • created “just barely” summary ALDs • reviewed the ordered item booklet
• Recommend four achievement standards in four rounds
www.FLDOE.org 20
Standard-Setting Method • Bookmark Method—One of a number of
approaches available for standard setting • One of the most widely used and most defensible methods • Research-based procedure • Used in many state assessment programs, including FCAT • Proven to be technically sound
Mitzel, H. C., Lewis, D. M., Patz, R. J. & Green, D. R. (2001). The Bookmark procedure: Psychological perspectives. In: G. Cizek (Ed.), Setting performance standards: Concepts, methods and perspectives. Mahwah, NJ: Erlbaum.

www.FLDOE.org 21
Standard-Setting Method – “Ordered item Booklets (OIBs)”
• Primary tool panelists used to set their cut scores • A collection of FSA test items that Florida students took
this spring. • OIBs are ordered from the easiest items to the hardest
items, based solely on Florida student performance on each item. This is not the order in which students saw the items.
• Most items were “operational”, which meant that they contributed to students’ scores.
• Some items were field test items, meaning they may appear in future FSA administrations.

www.FLDOE.org 23
Mechanics of the Bookmark Method • Initial judgment based solely on test content of the
Ordered Item Booklet (round 1) • Articulation – how cut scores appear across grades in
Grades 3-10 ELA and Grades 3-8 mathematics (round 2) • Impact data – how many students would be in each
achievement level, and how subgroups would perform based on recommended cut scores (round 3)
• Benchmarking – how students would compare on FSA vs. international assessments (round 4)
www.FLDOE.org 24
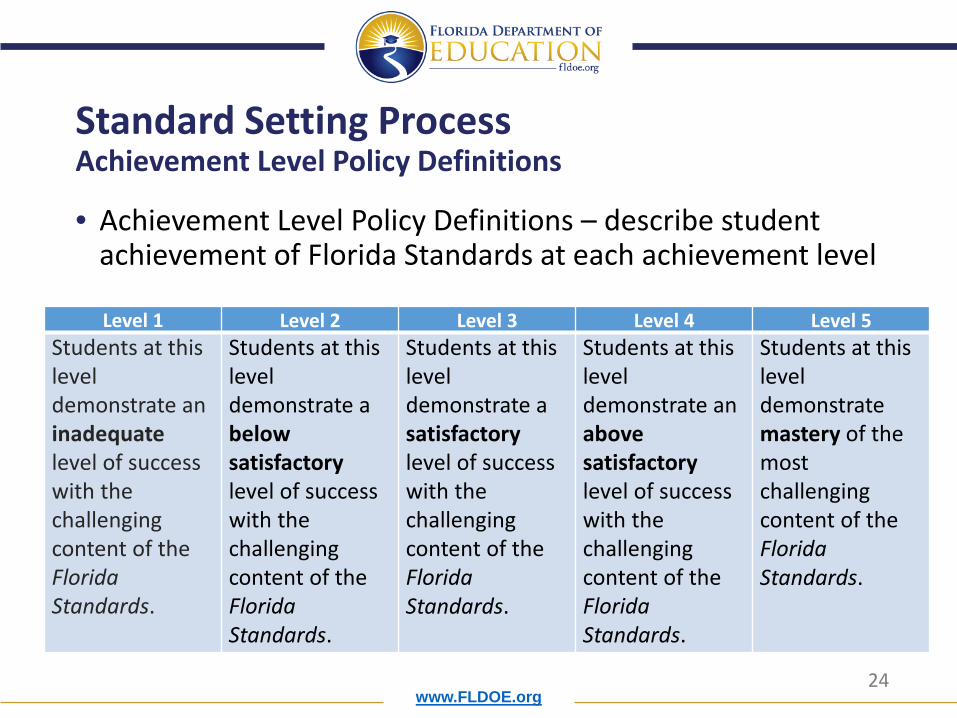
Standard Setting Process Achievement Level Policy Definitions
• Achievement Level Policy Definitions – describe student achievement of Florida Standards at each achievement level
Level 1 Level 2 Level 3 Level 4 Level 5 Students at this level demonstrate an inadequate level of success with the challenging content of the Florida Standards.
Students at this level demonstrate a below satisfactory level of success with the challenging content of the Florida Standards.
Students at this level demonstrate a satisfactory level of success with the challenging content of the Florida Standards.
Students at this level demonstrate an above satisfactory level of success with the challenging content of the Florida Standards.
Students at this level demonstrate mastery of the most challenging content of the Florida Standards.
www.FLDOE.org 25
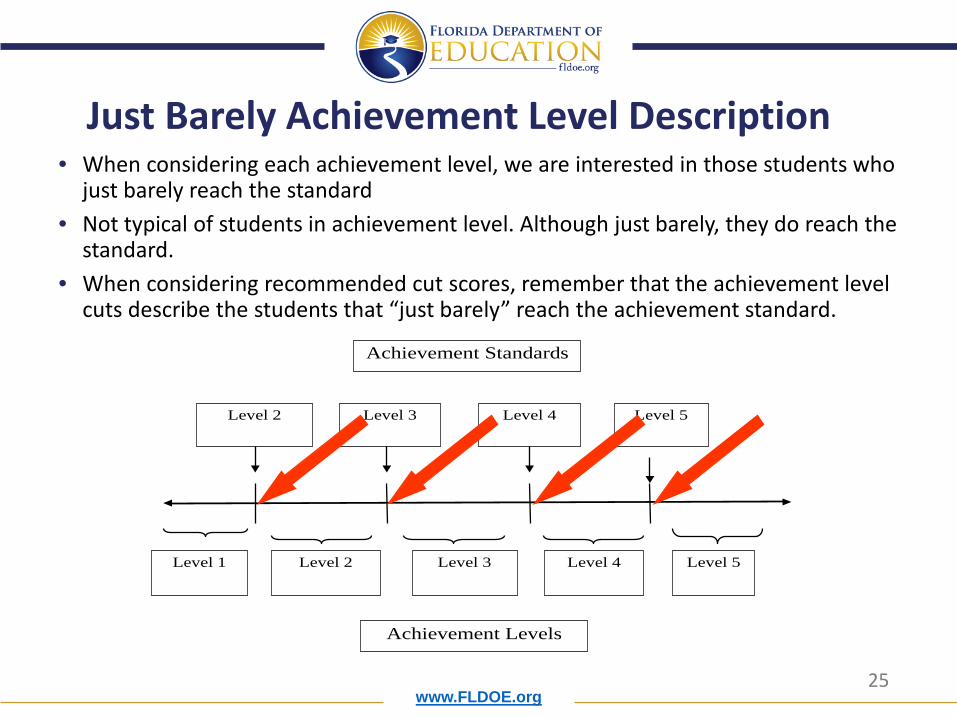
• When considering each achievement level, we are interested in those students who just barely reach the standard
• Not typical of students in achievement level. Although just barely, they do reach the standard.
• When considering recommended cut scores, remember that the achievement level cuts describe the students that “just barely” reach the achievement standard.
Just Barely Achievement Level Description
Level 2 Level 3 Level 4
Level 1 Level 2 Level 3 Level 4
Achievement Standards
Achievement Levels
Level 5
Level 5

www.FLDOE.org 26
Setting Standards Is Aspirational • Standard setting is all about what students should
know and be able to do, not about what they currently know and are able to do.
• The goal is to set standards for all students across the state.

www.FLDOE.org 27
Educator Panel Characteristics • The following slides describe relevant demographic
characteristics of Educator Panel participants • Overall • Gender • Ethnicity • District Size • Region

www.FLDOE.org 28
Educator Panelists ELA
Grade 3 4 5 6 7 8 9 10 Total
N 17 19 18 21 16 16 16 18 141
Mathematics Grade 3 4 5 6 7 8 Total
N 18 19 21 17 19 16 110
EOC Algebra1 Algebra2 Geometry Total
N 19 16 16 51

www.FLDOE.org 29
Educator Panelists – Gender (ELA)
Grade Male Female Not Provided
Total N Percent N Percent N Percent
3 17 100% 17 4 1 5% 18 95% 19 5 2 11% 15 83% 1 6% 18 6 3 14% 17 81% 1 5% 21 7 1 6% 15 94% 16 8 1 6% 14 88% 1 6% 16 9 1 6% 14 88% 1 6% 16
10 2 11% 15 83% 1 6% 18 Total 11 8% 125 89% 5 4% 141

www.FLDOE.org 30
Educator Panelists – Gender (Mathematics and EOC)
Grade/Subject
Male Female Total
N Percent N Percent 3 18 100% 18 4 3 16% 16 84% 19 5 2 10% 19 90% 21 6 4 24% 13 76% 17 7 4 21% 15 79% 19 8 4 25% 12 75% 16
Mathematics Total 17 15% 93 85% 110 Algebra 1 6 32% 13 68% 19 Algebra 2 3 19% 13 81% 16 Geometry 3 19% 13 81% 16 EOC Total 12 24% 39 76% 51

www.FLDOE.org 31
Educator Panelists – Ethnicity (ELA)
Grade White African
American Hispanic Native American Asian Other Not
Provided Total
N % N % N % N % N % N % N
3 13 76% 2 12% 2 12% 17 4 14 74% 2 11% 2 11% 1 5% 19 5 12 67% 2 11% 1 6% 2 11% 1 6% 18 6 16 76% 2 10% 2 10% 1 5% 21 7 12 75% 2 13% 2 13% 16 8 13 81% 2 13% 1 6% 16 9 14 88% 2 13% 16
10 10 56% 4 22% 1 6% 1 6% 1 6% 1 6% 18 Total 104 74% 18 13% 10 7% 3 2% 1 1% 2 1% 3 2% 141

www.FLDOE.org 32
Educator Panelists – Ethnicity (Mathematics and EOC)
Grade/ Subject
White African American Hispanic Native
American Asian Other Total
N % N % N % N % N % N % N 3 12 67% 2 11% 3 17% 1 6% 18 4 16 84% 1 5% 1 5% 1 5% 19 5 14 67% 4 19% 1 5% 1 5% 1 5% 21 6 12 71% 2 12% 2 12% 1 6% 17 7 13 68% 4 21% 2 11% 19 8 11 69% 3 19% 0% 2 13% 16
Mathematics Total 78 71% 16 15% 9 8% 4 4% 3 3% 110
Algebra 1 10 53% 5 26% 3 16% 1 5% 19 Algebra 2 12 75% 1 6% 1 6% 2 13% 16 Geometry 12 75% 2 13% 2 13% 16 EOC Total 34 67% 6 12% 6 12% 1 2 4% 2 4% 51
www.FLDOE.org 33
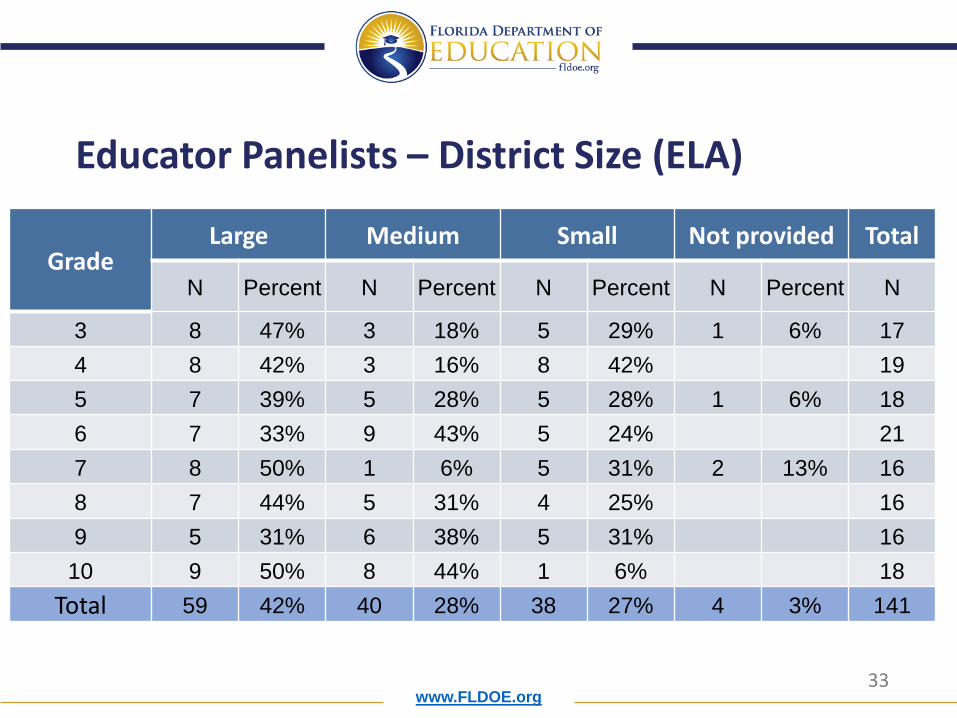
Educator Panelists – District Size (ELA)
Grade Large Medium Small Not provided Total
N Percent N Percent N Percent N Percent N
3 8 47% 3 18% 5 29% 1 6% 17 4 8 42% 3 16% 8 42% 19 5 7 39% 5 28% 5 28% 1 6% 18 6 7 33% 9 43% 5 24% 21 7 8 50% 1 6% 5 31% 2 13% 16 8 7 44% 5 31% 4 25% 16 9 5 31% 6 38% 5 31% 16
10 9 50% 8 44% 1 6% 18 Total 59 42% 40 28% 38 27% 4 3% 141

www.FLDOE.org 34
Educator Panelists – District Size (Mathematics and EOC)
Grade/ Subject
Large Medium Small Not provided Total
N Percent N Percent N Percent N Percent N
3 8 44% 5 28% 5 28% 18 4 7 37% 7 37% 4 21% 1 5% 19 5 9 43% 7 33% 5 24% 21 6 6 35% 3 18% 8 47% 17 7 9 47% 6 32% 4 21% 19 8 9 56% 2 13% 5 31% 16
Mathematics Total 48 44% 30 27% 31 28% 1 1% 110
Algebra 1 10 53% 5 26% 3 16% 1 5% 19 Algebra 2 9 56% 2 13% 5 31% 16 Geometry 6 38% 3 19% 7 44% 16 EOC Total 25 49% 10 20% 15 29% 1 2% 51

www.FLDOE.org 35
Educator Panelists – District Region (ELA)
Grade Panhandle Northeast East
Central West
Central South Not Provided Total
N % N % N % N % N % N % N
3 3 18% 2 12% 4 24% 4 24% 4 24% 17 4 3 16% 2 11% 5 26% 4 21% 5 26% 19 5 4 22% 3 17% 3 17% 4 22% 3 17% 1 6% 18 6 3 14% 2 10% 7 33% 5 24% 4 19% 21 7 1 6% 4 25% 3 19% 3 19% 5 31% 16 8 3 19% 2 13% 5 31% 3 19% 3 19% 16 9 2 13% 4 25% 3 19% 3 19% 4 25% 16 10 5 28% 3 17% 2 11% 3 17% 5 28% 18
Total 24 17% 22 16% 32 23% 29 21% 33 23% 1 1% 141
www.FLDOE.org 36
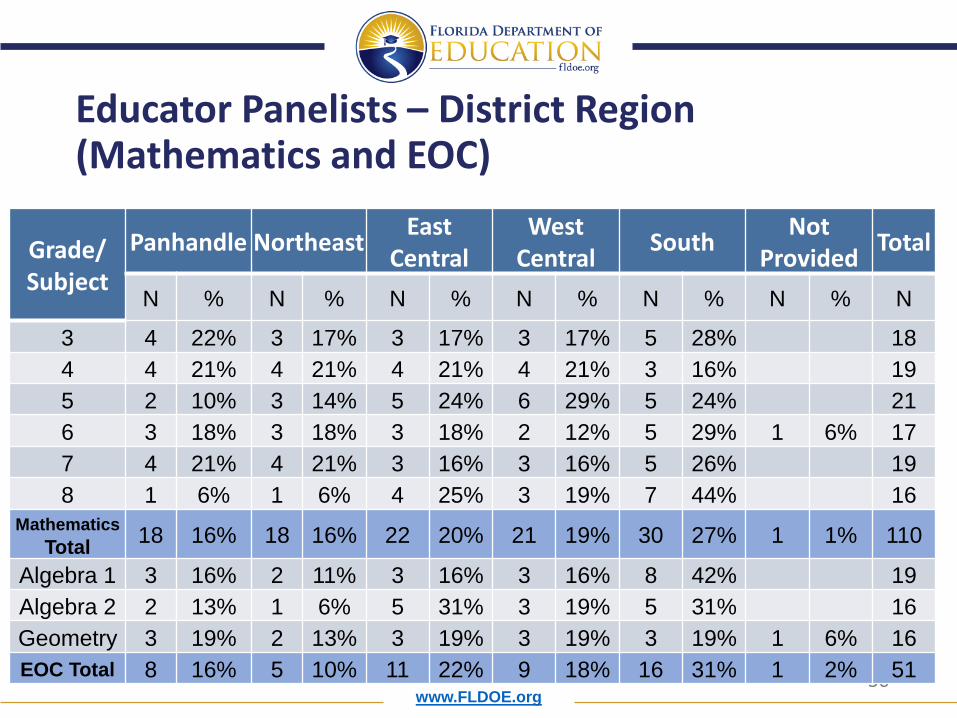
Educator Panelists – District Region (Mathematics and EOC)
Grade/ Subject
Panhandle Northeast East Central
West Central South Not
Provided Total
N % N % N % N % N % N % N
3 4 22% 3 17% 3 17% 3 17% 5 28% 18 4 4 21% 4 21% 4 21% 4 21% 3 16% 19 5 2 10% 3 14% 5 24% 6 29% 5 24% 21 6 3 18% 3 18% 3 18% 2 12% 5 29% 1 6% 17 7 4 21% 4 21% 3 16% 3 16% 5 26% 19 8 1 6% 1 6% 4 25% 3 19% 7 44% 16
Mathematics Total 18 16% 18 16% 22 20% 21 19% 30 27% 1 1% 110
Algebra 1 3 16% 2 11% 3 16% 3 16% 8 42% 19 Algebra 2 2 13% 1 6% 5 31% 3 19% 5 31% 16 Geometry 3 19% 2 13% 3 19% 3 19% 3 19% 1 6% 16 EOC Total 8 16% 5 10% 11 22% 9 18% 16 31% 1 2% 51
www.FLDOE.org 37
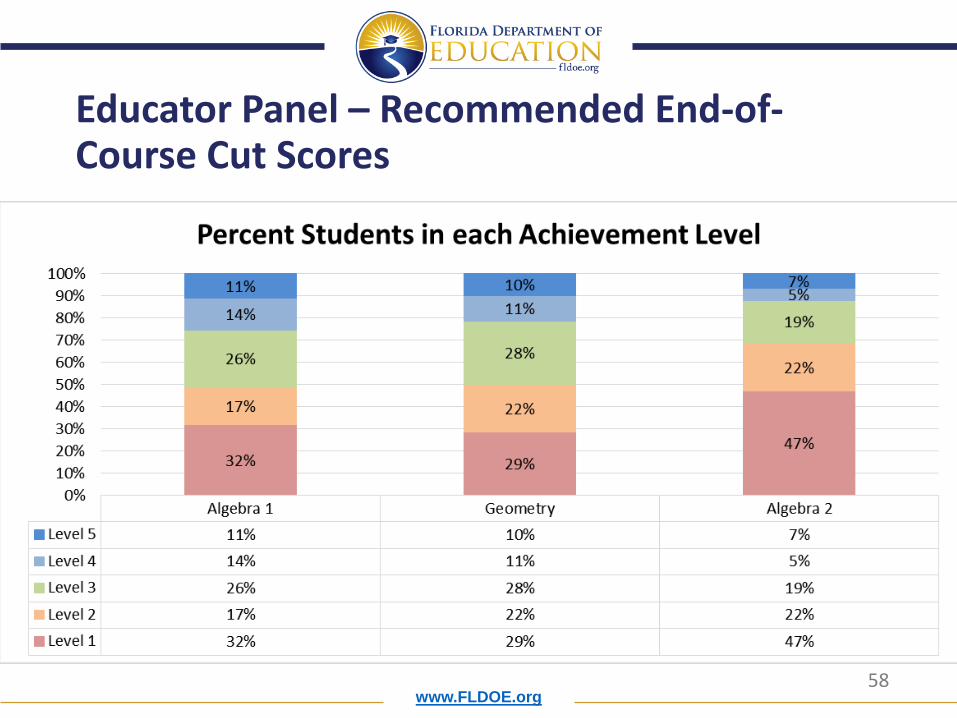
Educator Panel – Results • The slides that follow show the cut score final
recommendations made by the Educator Panel. • Impact data and benchmark data are also shown, to help
inform your own judgments. • Remember that educator panelist feedback is primarily
based on content. • Consider educator panel’s content-based recommendations
and compare recommendations to reactor panel’s recommendations, which take into consideration impact and benchmark data.

www.FLDOE.org 38
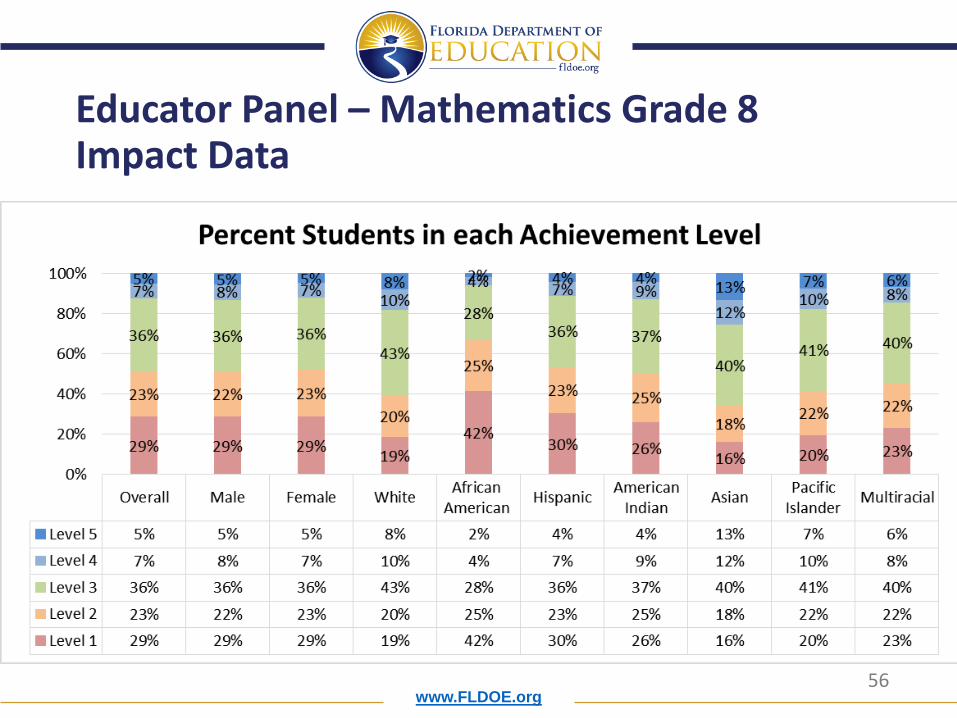
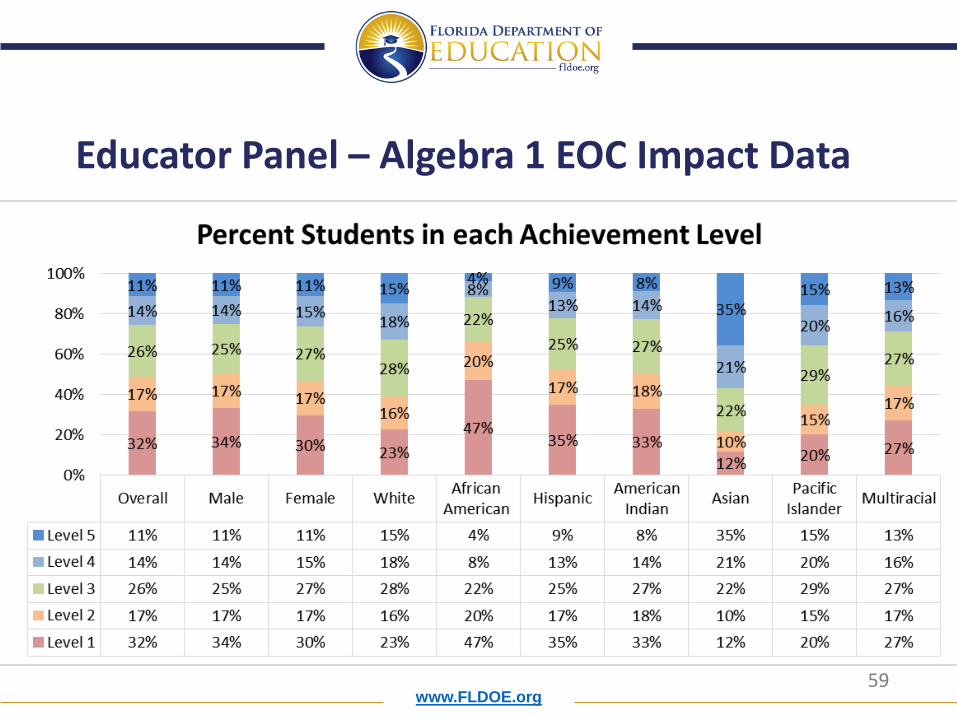
Educator Panel – Impact Data • Showed the percent of students that would reach
each achievement level in each grade and subject. • Introduced in round 3 after the panelists made
judgments across two rounds based solely on content considerations.
• Impact data used as context to inform the panelists’ recommendations but did not determine their recommendations.
• In the end, the panelists’ recommendations were content driven.

www.FLDOE.org 62
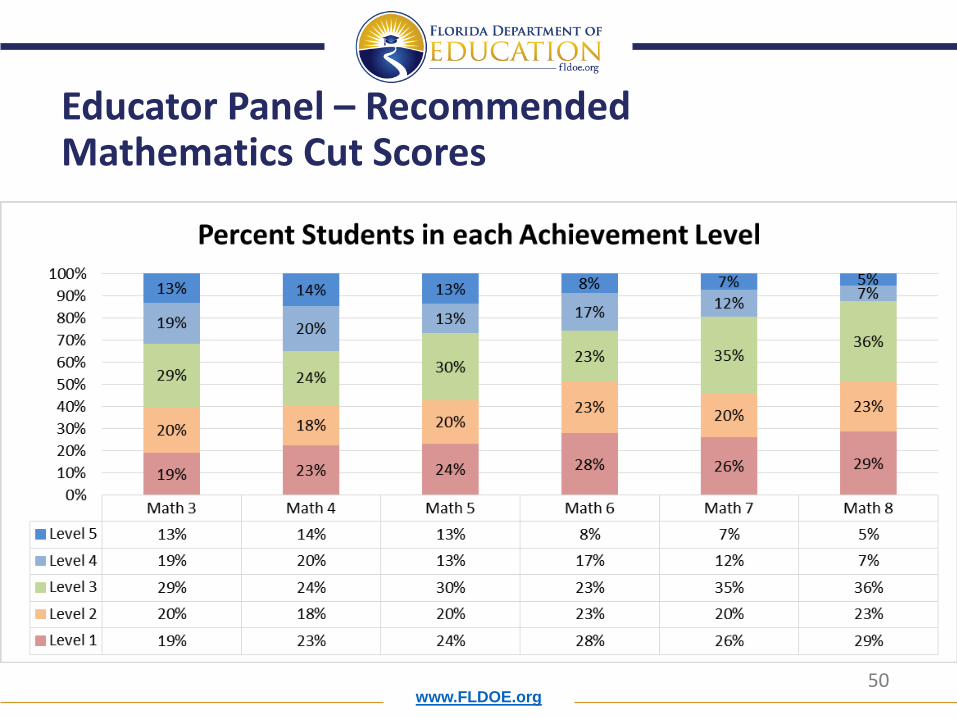
Educator Panel Recommendations – Percent of Students at or Above Each Achievement Level
Subject Grade Level 2 Level 3 Level 4 Level 5
ELA
3 75% 55% 25% 7% 4 79% 54% 27% 8% 5 80% 49% 26% 7% 6 77% 49% 28% 8% 7 76% 51% 29% 12% 8 78% 59% 31% 11% 9 74% 55% 31% 13%
10 72% 51% 29% 9%
Math/EOC
3 81% 60% 31% 13% 4 77% 59% 35% 14% 5 76% 57% 27% 13% 6 72% 49% 26% 8% 7 74% 54% 19% 7% 8 71% 49% 12% 5%
Algebra 1 68% 51% 25% 11% Geometry 71% 50% 22% 10% Algebra 2 53% 31% 12% 7%

www.FLDOE.org 63
Educator Panel – Benchmark Data • Benchmarking provided the panelists with external
referents so they could see how their recommendations compared with national and international standards.
• Benchmarking helps determine whether FSA achievement standards are nationally and internationally competitive.
• National Assessment of Educational Progress (NAEP) • Trends in International Mathematics and Science Study
(TIMSS) • Program for International Student Assessment (PISA)
www.FLDOE.org 64
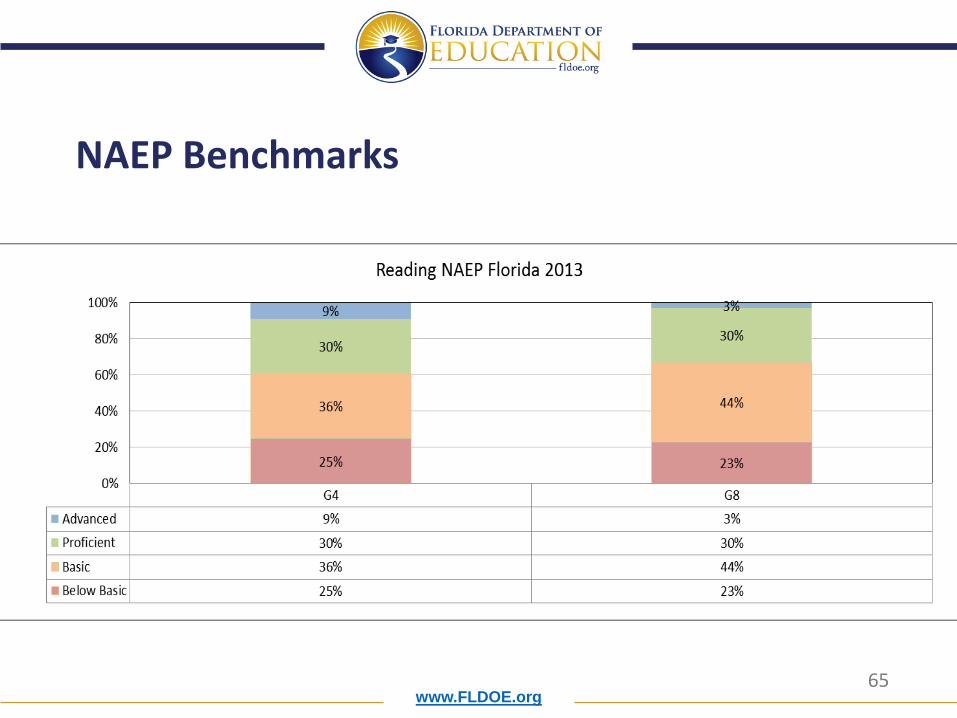
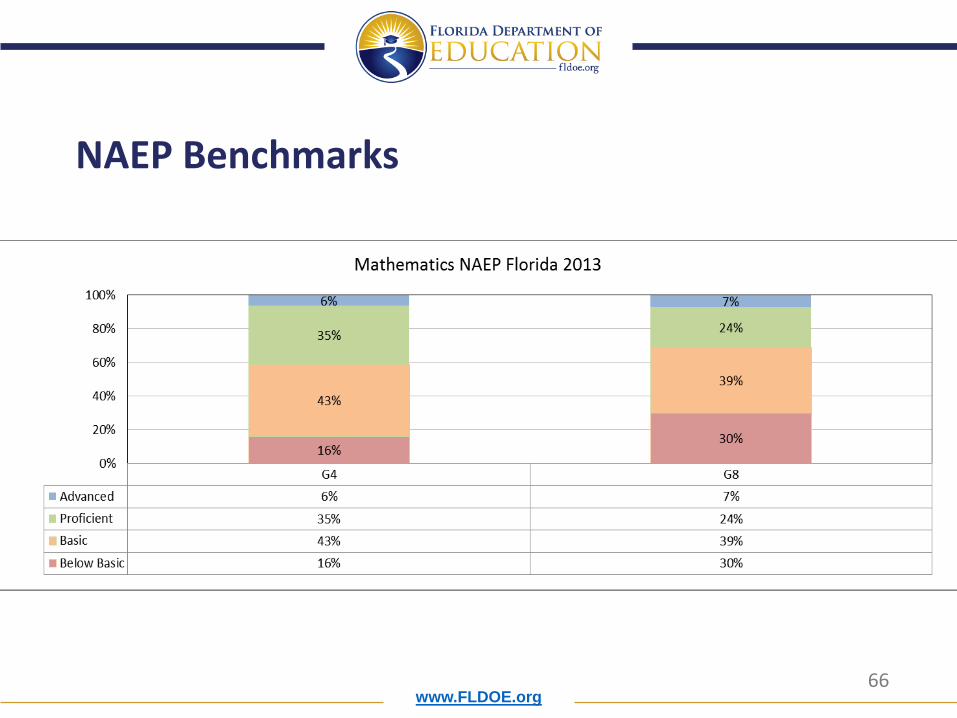
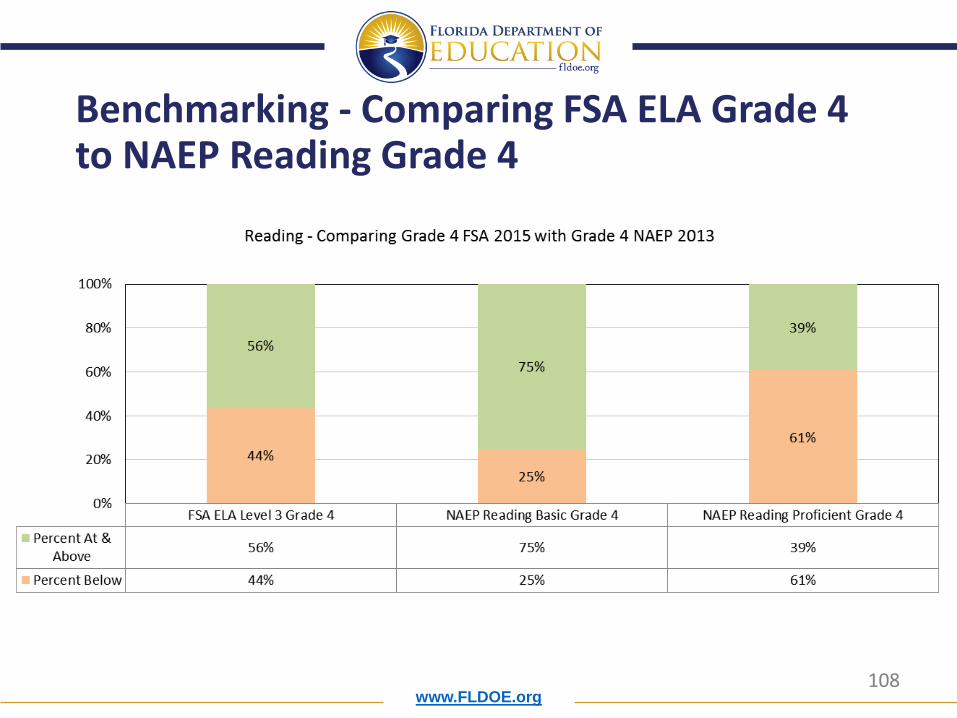
NAEP Benchmarks
• Panelists were shown Florida NAEP results from the 2013 assessment (most recent)
• Administered by the National Center for Education Statistics (NCES)
• Two-year assessment cycle • Grades 4, 8, and 12
• Grade 12 NAEP benchmark does not apply to the FSA because there is no comprehensive grade 12 FSA assessment
www.FLDOE.org 71
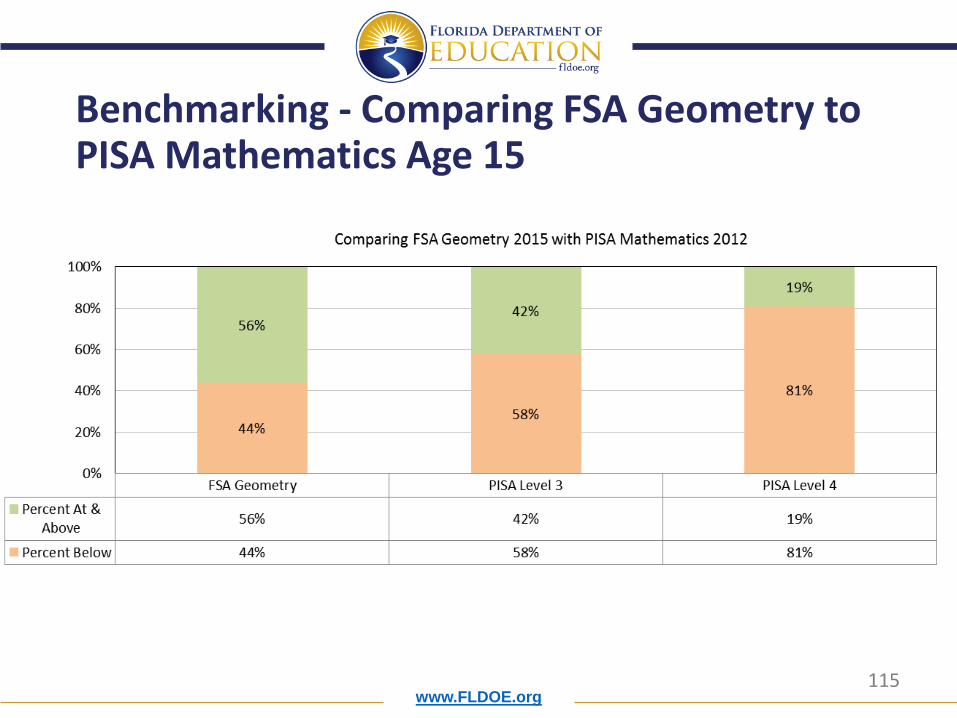
• Florida PISA results from the 2012 assessment (most recent)
• Administered by the Organization for Economic Cooperation and Development (OECD)
• Three-year cycle • Age 15 students (modal grade in the U.S. is grade 10)
PISA Benchmarks

www.FLDOE.org 74
• Florida TIMSS results from the 2011 assessment (most recent)
• Administered by the International Association for the Evaluation of Educational Achievement (IEA)
• Four-year assessment cycle • Grades 4 and 8
TIMSS Benchmarks
www.FLDOE.org 77
Reactor Panel • Differences between Educator Panel and Reactor
Panel • Educator Panel
• Comprised of individuals with content expertise • Understand expectations for Florida students • Focus on content when making recommendations
• Reactor Panel • Represent various business, community, and educational
groups; diverse perspectives • Consider policy when making recommendations • Consider consequences (impacts) when making
recommendations

www.FLDOE.org 78
• When reviewing impact data, the reactor panel considered the following questions:
• Given the description of what students should know and be able to do at each Achievement Level, are the recommendations from the Educator Panel consistent with your expectations of student achievement?
• Given the results that you see from other Florida assessments, are the impact data based on the Educator Panel’s recommendations reasonable?
Reactor Panel – Impact Data Review

www.FLDOE.org 79
• The Reactor Panel reviewed Educator Panel Recommendations with the following guidelines in mind:
• Like the Educator Panel, the Reactor Panel did not have to reach consensus • If the Reactor Panel suggested modifications, the facilitator immediately
provided new impact data using the proposed modifications • If the Reactor Panel suggested any modifications, panelists provided
written rationales for suggested changes • Reactor Panelists were informed their recommendations would be
published and considered by the general public, the Commissioner, and the State Board of Education in determining FSA achievement level cut scores
Reactor Panel – Review of Educator Panel Recommendations

www.FLDOE.org 80
Reactor Panelist Position Dr. Barbara Jenkins Superintendent, Orange
Dr. Diana Greene Superintendent, Manatee Robert Edwards Superintendent, Lafayette Marcia Andrews School Board Member, Palm Beach Mr. Terry Nichols School Board Member, Jackson Mr. Danny Gaekwad EFI Board of Directors Rev. Ron Rawls Pastor, St. Paul AME Church Dr. Manoj Chopra UCF Engineer Professor, former BOG member Dr. Ed Bonahue Provost and VP of Academic Affairs, Santa Fe College Dr. Susan Neimand Director of School of Education, Miami Dade College Mr. John Barnhill Assistant Vice President for Enrollment Management at FSU Debra Morton Volunteer Coordinator at Fruit Cove Middle School, St. Johns Dr. Maria Torres Executive Director of Federal and State Grants & English Language Learner
Programs, Collier Ronda Bourn Assistant Director of Instruction for School Programs, Northeast Florida
Education Consortium Dr. Nathan Balasubramanian
Executive Director, Strategy & Continuous Improvement, Broward
Karen Denbroeder Retired Research Assistant, FL Center for Reading Research at FSU
Reactor Panel Participants
www.FLDOE.org 81
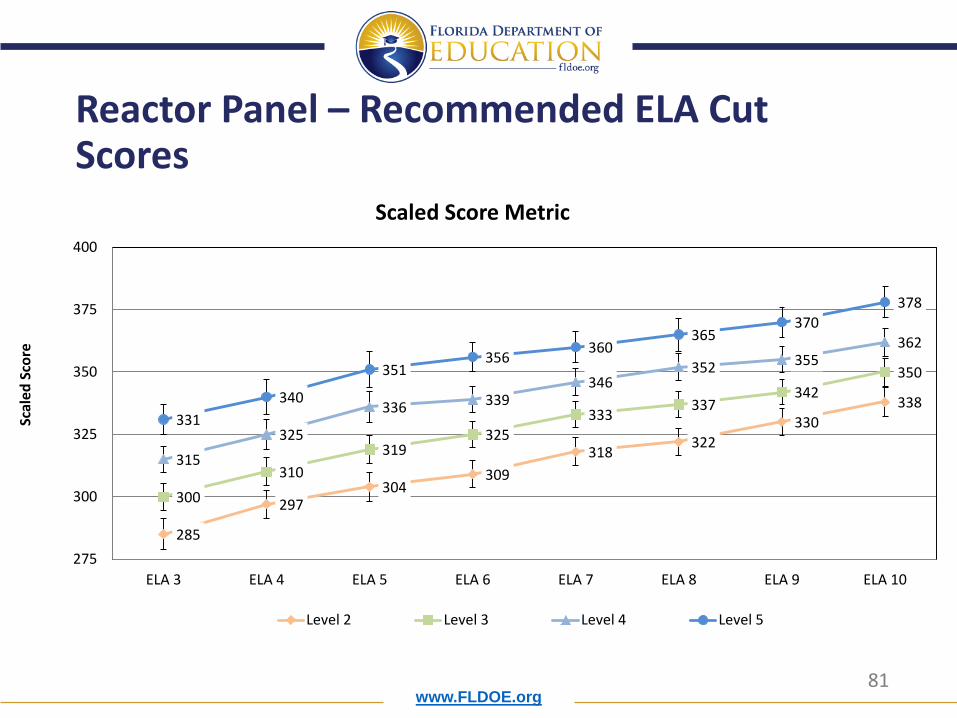
Reactor Panel – Recommended ELA Cut Scores
285
297 304
309 318 322
330 338
300 310
319 325
333 337 342
350
315 325
336 339 346
352 355 362
331 340
351 356 360
365 370
378
275
300
325
350
375
400
ELA 3 ELA 4 ELA 5 ELA 6 ELA 7 ELA 8 ELA 9 ELA 10
Scal
ed S
core
Scaled Score Metric
Level 2 Level 3 Level 4 Level 5
www.FLDOE.org 82
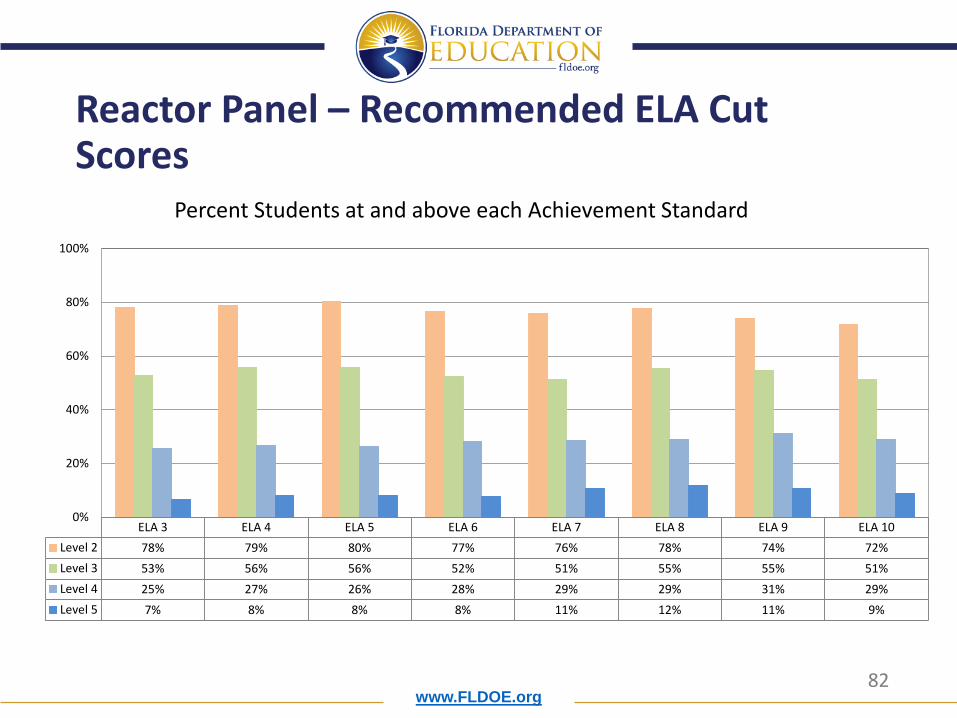
Reactor Panel – Recommended ELA Cut Scores
ELA 3 ELA 4 ELA 5 ELA 6 ELA 7 ELA 8 ELA 9 ELA 10Level 2 78% 79% 80% 77% 76% 78% 74% 72%Level 3 53% 56% 56% 52% 51% 55% 55% 51%Level 4 25% 27% 26% 28% 29% 29% 31% 29%Level 5 7% 8% 8% 8% 11% 12% 11% 9%
0%
20%
40%
60%
80%
100%
Percent Students at and above each Achievement Standard

www.FLDOE.org 83
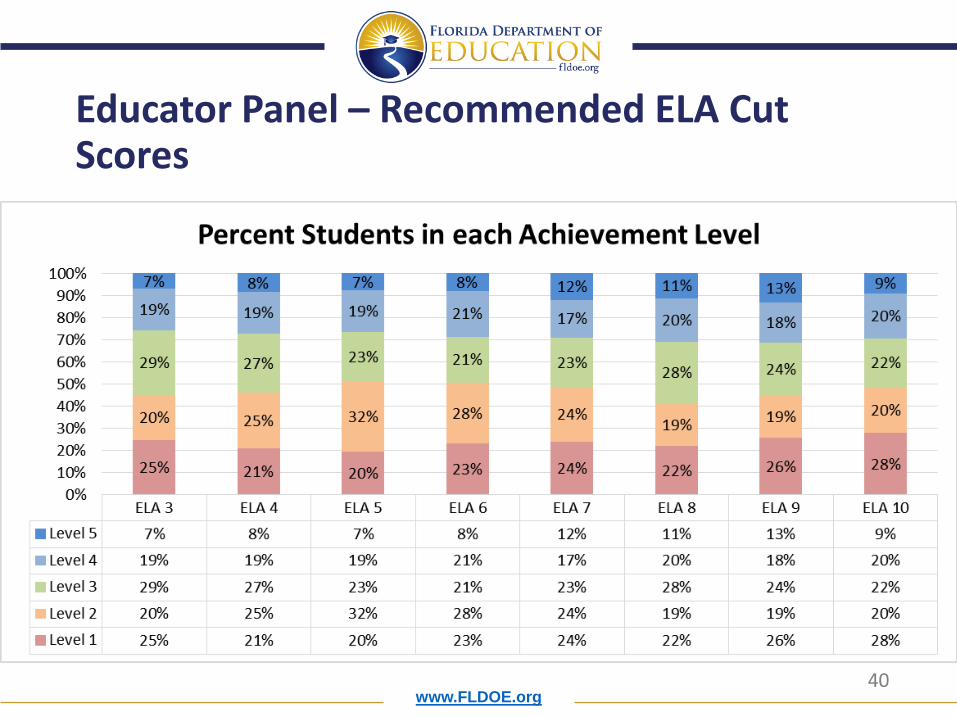
Reactor Panel – Recommended ELA Cut Scores
ELA 3 ELA 4 ELA 5 ELA 6 ELA 7 ELA 8 ELA 9 ELA 10Level 5 7% 8% 8% 8% 11% 12% 11% 9%Level 4 19% 19% 18% 21% 18% 17% 20% 20%Level 3 27% 29% 30% 24% 23% 26% 24% 22%Level 2 25% 23% 24% 24% 24% 22% 19% 20%Level 1 22% 21% 20% 23% 24% 22% 26% 28%
22% 21% 20% 23% 24% 22% 26% 28%
25% 23% 24% 24% 24% 22% 19% 20%
27% 29% 30% 24% 23% 26% 24% 22%
19% 19% 18% 21% 18% 17% 20% 20%
7% 8% 8% 8% 11% 12% 11% 9%
Percent Students in each Achievement Level

www.FLDOE.org 84
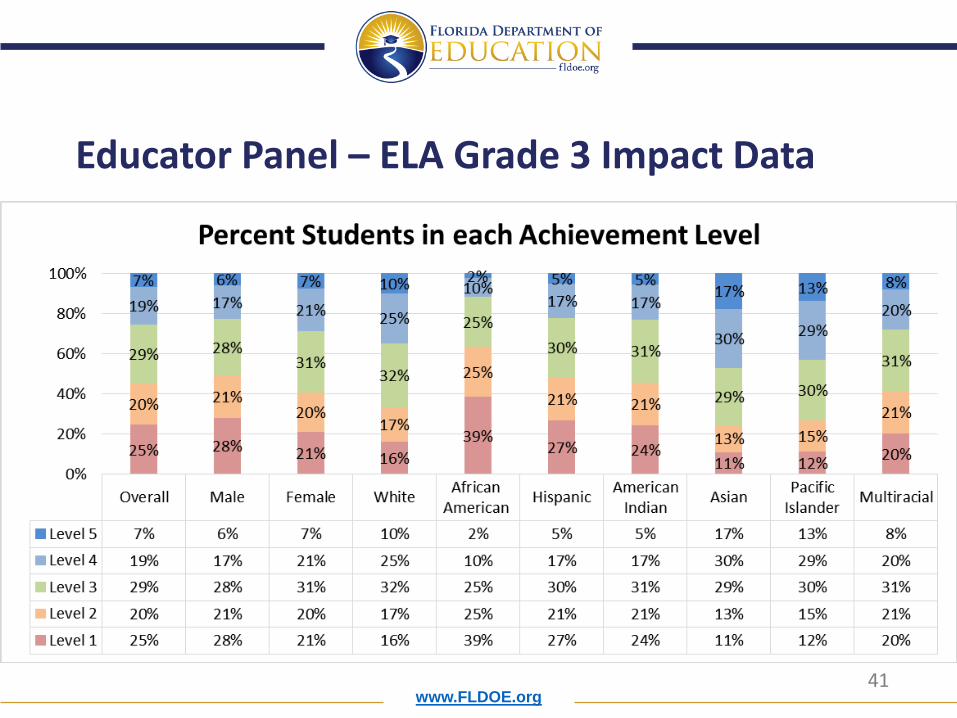
Reactor Panel – ELA Grade 3 Impact Data
Percent Students in each Achievement Level

www.FLDOE.org 85
Reactor Panel – ELA Grade 4 Impact Data Percent Students in each Achievement Level

www.FLDOE.org 86
Reactor Panel – ELA Grade 5 Impact Data Percent Students in each Achievement Level

www.FLDOE.org 87
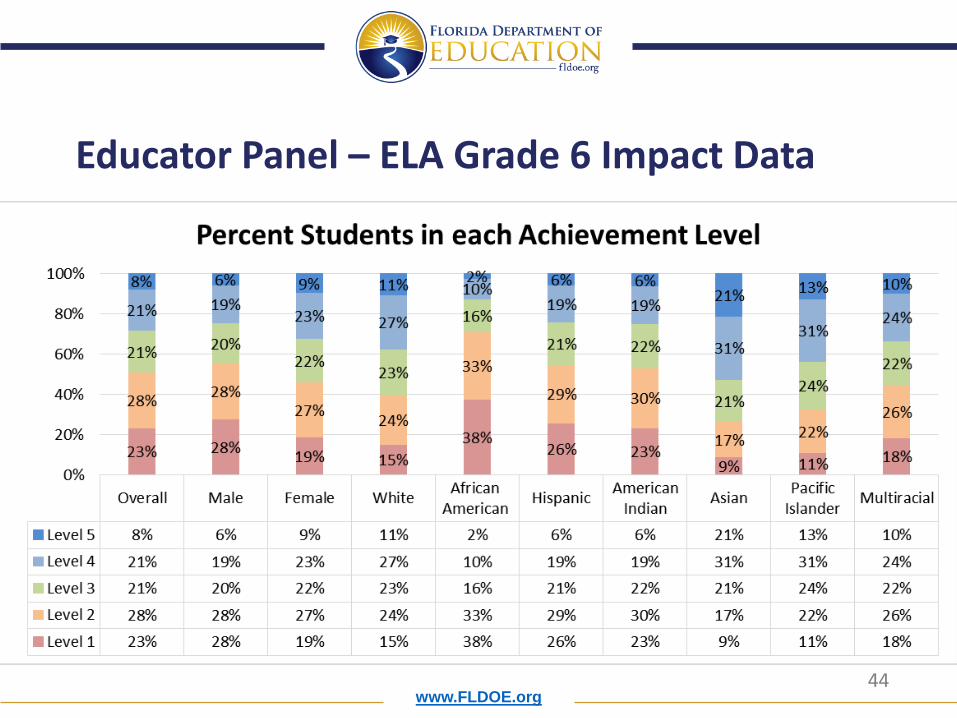
Reactor Panel – Grade 6 ELA Impact Data Percent Students in each Achievement Level
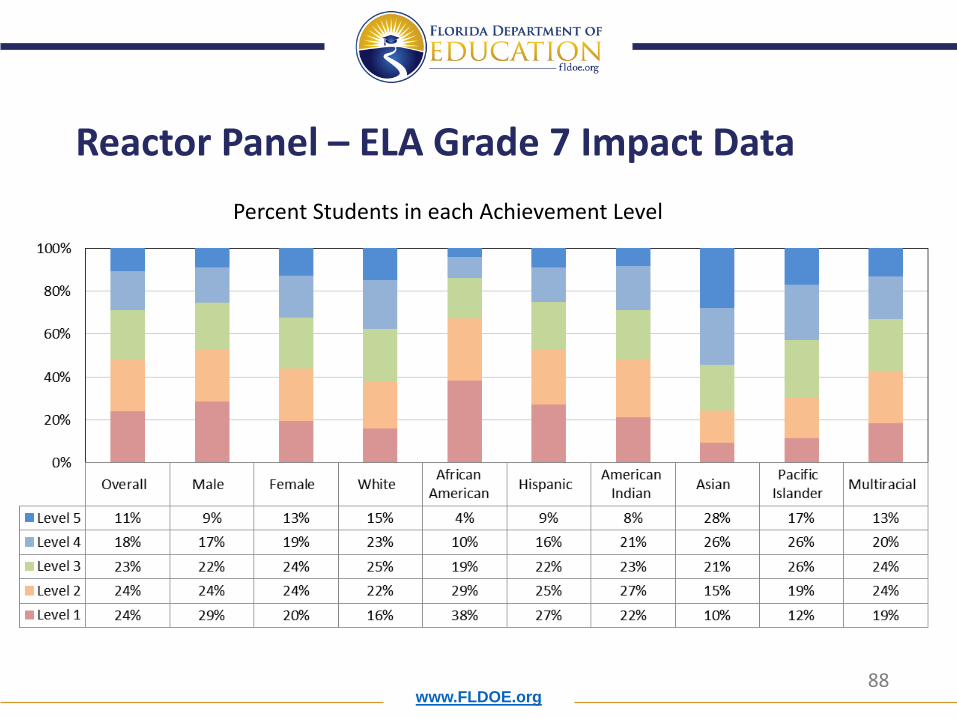
www.FLDOE.org 88
Reactor Panel – ELA Grade 7 Impact Data Percent Students in each Achievement Level

www.FLDOE.org 89
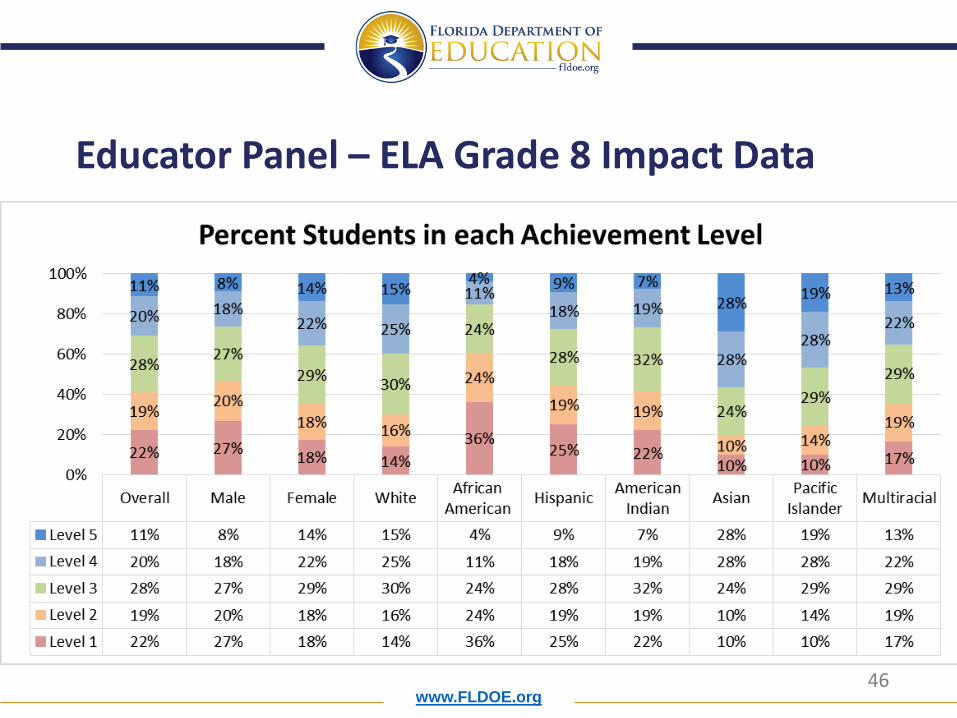
Reactor Panel – ELA Grade 8 Impact Data Percent Students in each Achievement Level
www.FLDOE.org 90
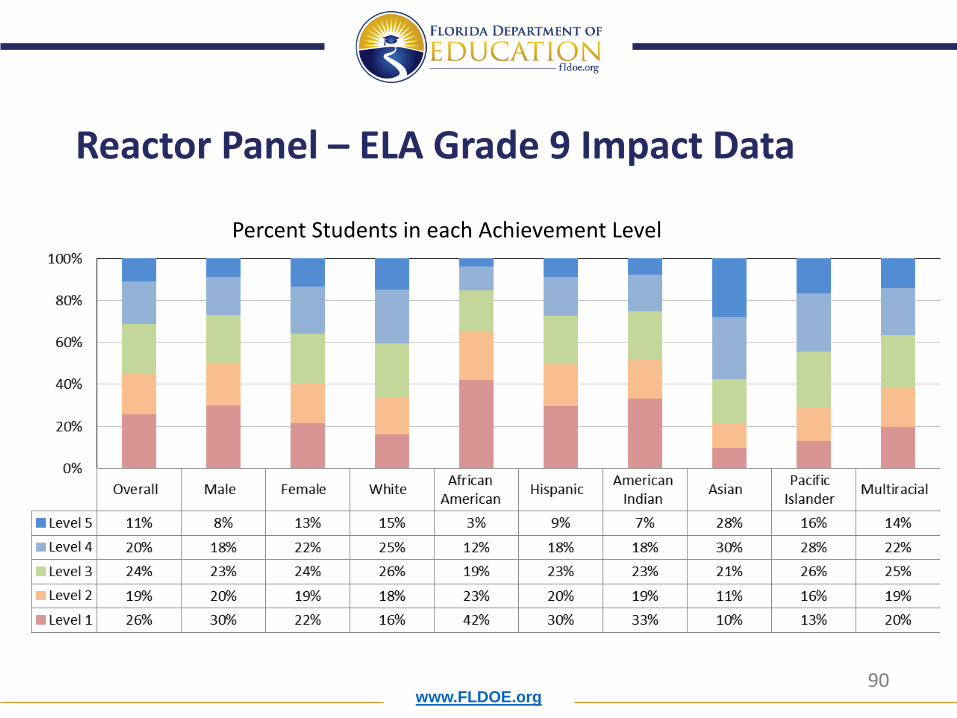
Reactor Panel – ELA Grade 9 Impact Data
Percent Students in each Achievement Level

www.FLDOE.org 91
Reactor Panel – ELA Grade 10 Impact Data Percent Students in each Achievement Level

www.FLDOE.org 92
Reactor Panel – Recommended Mathematics Cut Scores
285
299 307
312 317
322
296
309 318
325 330
337
311
323
334 341
348 356
324
337 347
356 363
368
275
300
325
350
375
400
Math 3 Math 4 Math 5 Math 6 Math 7 Math 8
Scal
ed S
core
Math - Scaled Score Metric
Level 2 Level 3 Level 4 Level 5

www.FLDOE.org 93
Reactor Panel – Recommended Mathematics Cut Scores
Math 3 Math 4 Math 5 Math 6 Math 7 Math 8Level 2 78% 77% 76% 72% 74% 71%Level 3 60% 61% 59% 50% 52% 45%Level 4 31% 35% 30% 24% 22% 14%Level 5 13% 14% 13% 8% 7% 5%
0%
20%
40%
60%
80%
100%
Percent Students at and above each Achievement Standard

www.FLDOE.org 94
Reactor Panel – Recommended FSA Mathematics Cut Scores
Math 3 Math 4 Math 5 Math 6 Math 7 Math 8Level 5 13% 14% 13% 8% 7% 5%Level 4 19% 20% 16% 16% 15% 10%Level 3 29% 26% 29% 26% 30% 30%Level 2 18% 16% 18% 21% 21% 26%Level 1 22% 23% 24% 28% 26% 29%
22% 23% 24% 28% 26% 29%
18% 16% 18% 21% 21%
26%
29% 26% 29% 26% 30%
30% 19% 20% 16%
16% 15% 10% 13% 14% 13% 8% 7% 5%
Percent Students in each Achievement Level

www.FLDOE.org 95
Reactor Panel – Mathematics Grade 3 Impact Data
Percent Students in each Achievement Level

www.FLDOE.org 96
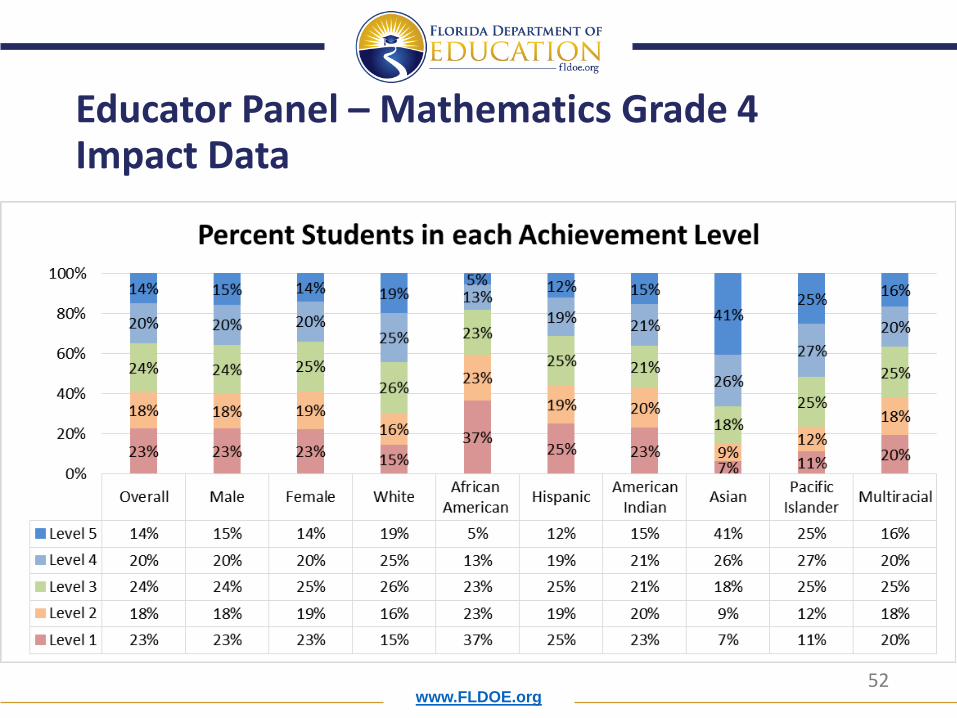
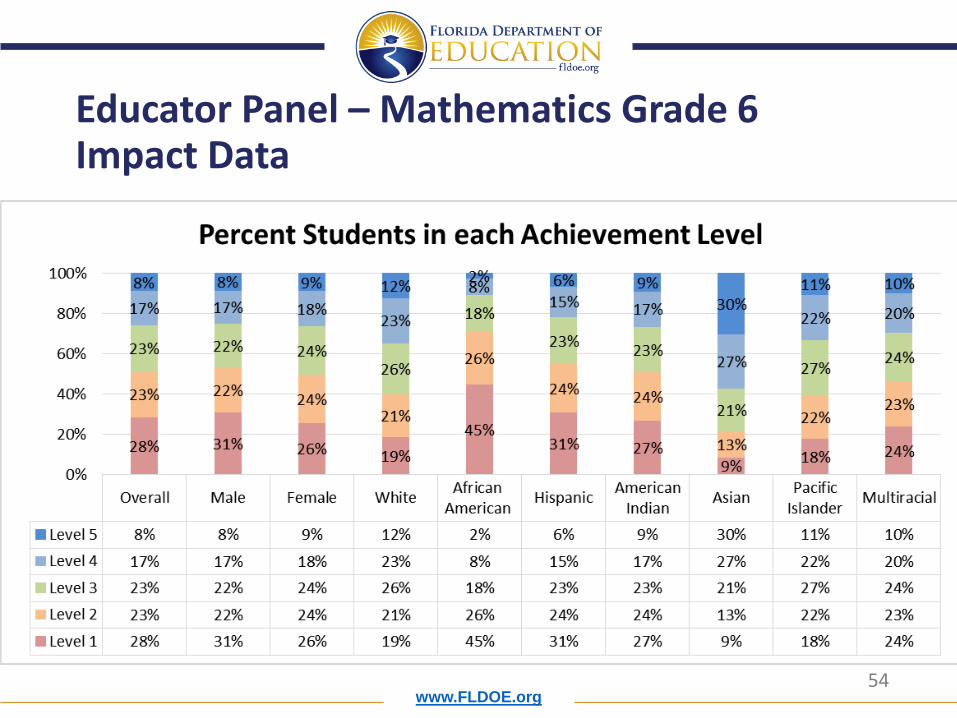
Reactor Panel – Mathematics Grade 4 Impact Data
Percent Students in each Achievement Level
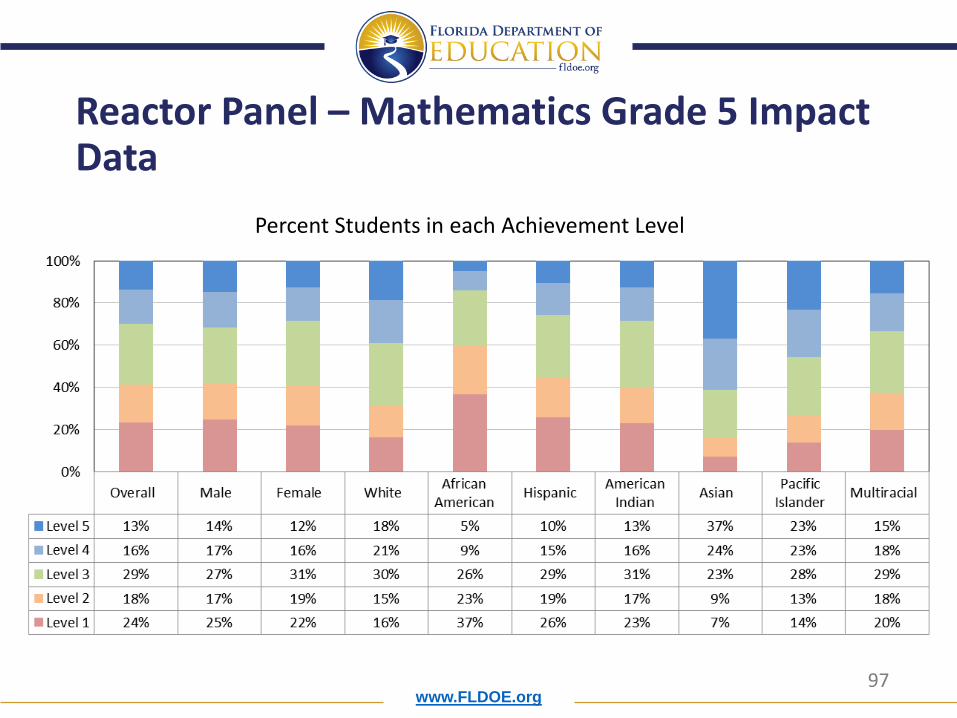
www.FLDOE.org 97
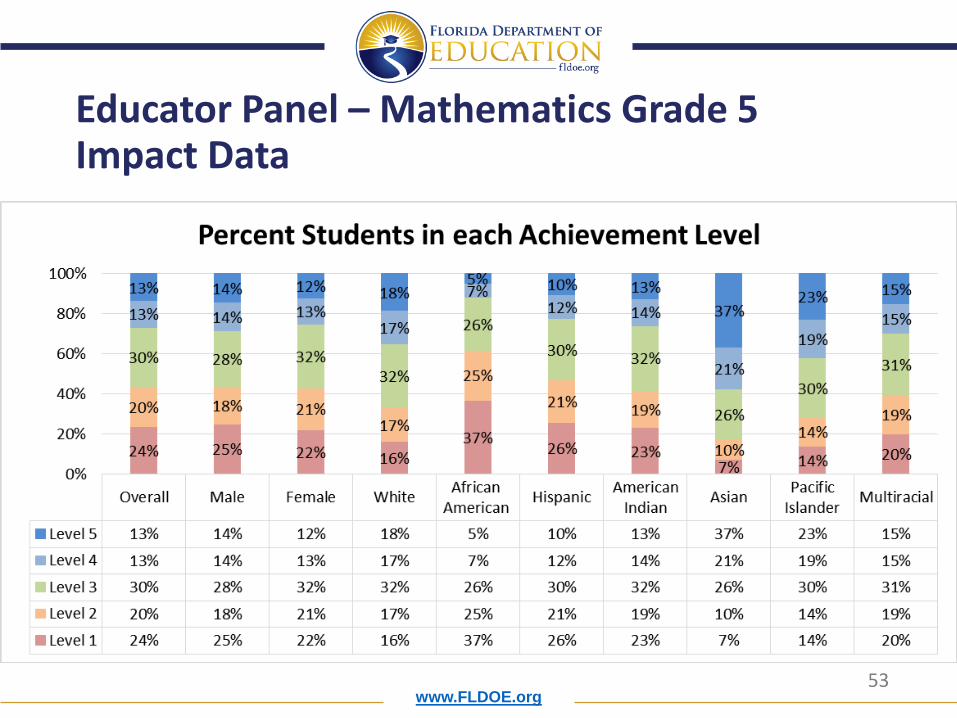
Reactor Panel – Mathematics Grade 5 Impact Data
Percent Students in each Achievement Level

www.FLDOE.org 98
Reactor Panel – Mathematics Grade 5 Impact Data
Percent Students in each Achievement Level

www.FLDOE.org 99
Reactor Panel – Mathematics Grade 7 Impact Data
Percent Students in each Achievement Level

www.FLDOE.org 100
Reactor Panel – Mathematics Grade 8 Impact Data
Percent Students in each Achievement Level

www.FLDOE.org 101
Reactor Panel – Recommended End-of-Course Cut Scores
487 486
497 494 497
509 518 521
529 532 533 537
450
500
550
Algebra 1 Geometry Algebra 2
Scal
ed S
core
EOC - Scaled Score Metric
Level 2 Level 3 Level 4 Level 5
www.FLDOE.org 102
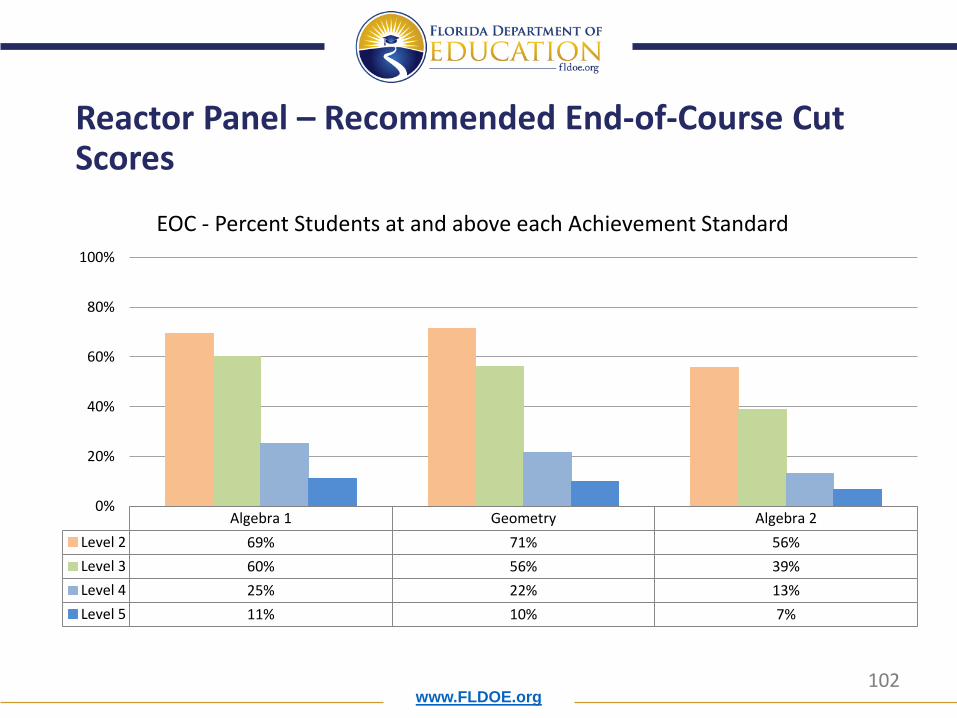
Reactor Panel – Recommended End-of-Course Cut Scores
Algebra 1 Geometry Algebra 2Level 2 69% 71% 56%Level 3 60% 56% 39%Level 4 25% 22% 13%Level 5 11% 10% 7%
0%
20%
40%
60%
80%
100%
EOC - Percent Students at and above each Achievement Standard
www.FLDOE.org 103
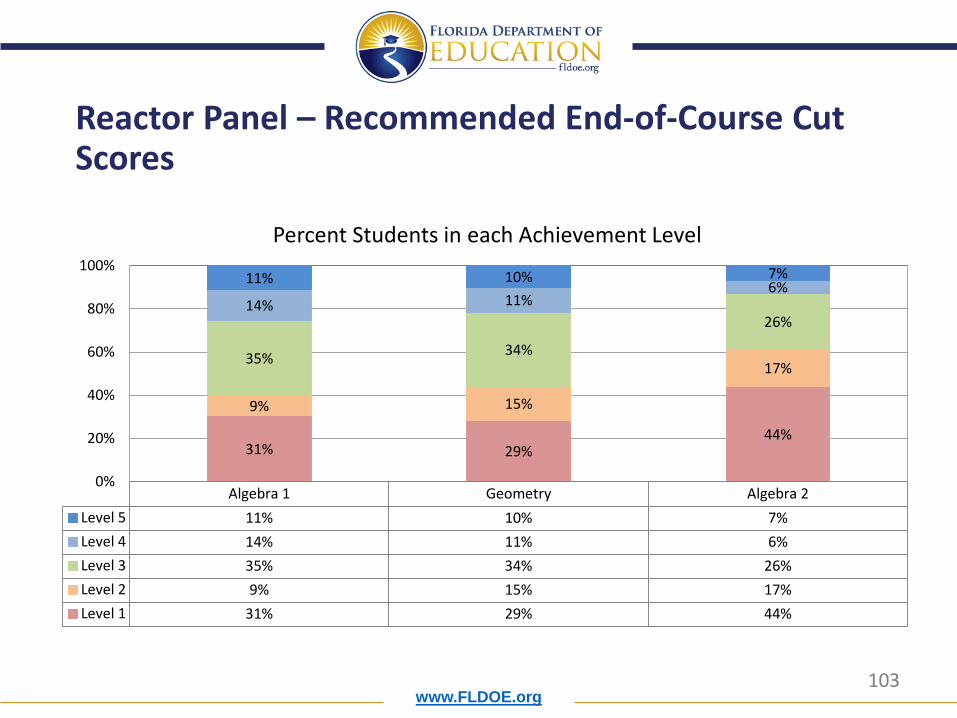
Reactor Panel – Recommended End-of-Course Cut Scores
Algebra 1 Geometry Algebra 2Level 5 11% 10% 7%Level 4 14% 11% 6%Level 3 35% 34% 26%Level 2 9% 15% 17%Level 1 31% 29% 44%
31% 29% 44%
9% 15%
17% 35% 34%
26% 14% 11%
6% 11% 10% 7%
0%
20%
40%
60%
80%
100%
Percent Students in each Achievement Level

www.FLDOE.org 104
Reactor Panel – Algebra 1 Impact Data
Percent Students at each Achievement Level

www.FLDOE.org 105
Reactor Panel – Geometry Impact Data Percent Students in each Achievement Level

www.FLDOE.org 106
Reactor Panel – Algebra 2 Impact Data
Percent Students at each Achievement Level

www.FLDOE.org 107
Reactor Panel Recommendations – Percent of Students at or Above Each Achievement Level
Subject Grade Level 2 Level 3 Level 4 Level 5
ELA
3 75% 55% 25% 7% 4 79% 54% 27% 8% 5 80% 49% 26% 7% 6 77% 49% 28% 8% 7 76% 51% 29% 12% 8 78% 59% 31% 11% 9 74% 55% 31% 13%
10 72% 51% 29% 9%
Math/EOC
3 81% 60% 31% 13% 4 77% 59% 35% 14% 5 76% 57% 27% 13% 6 72% 49% 26% 8% 7 74% 54% 19% 7% 8 71% 49% 12% 5%
Algebra 1 68% 51% 25% 11% Geometry 71% 50% 22% 10% Algebra 2 53% 31% 12% 7%
www.FLDOE.org 108
Benchmarking - Comparing FSA ELA Grade 4 to NAEP Reading Grade 4
www.FLDOE.org 109
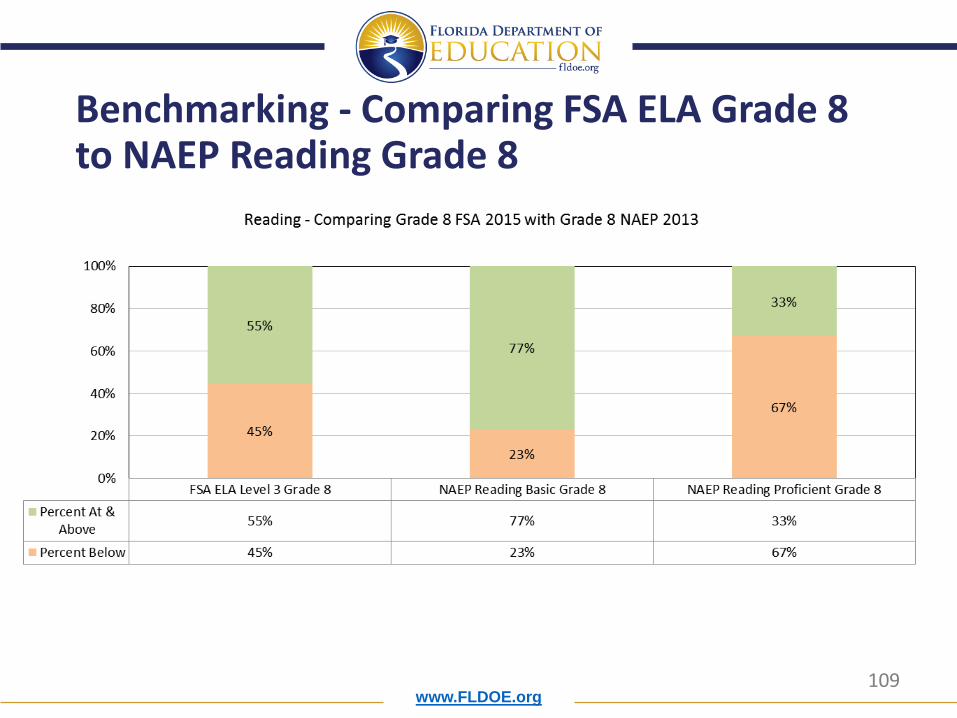
Benchmarking - Comparing FSA ELA Grade 8 to NAEP Reading Grade 8

www.FLDOE.org 110
Benchmarking - Comparing FSA Mathematics Grade 4 to NAEP Mathematics Grade 4

www.FLDOE.org 111
Benchmarking - Comparing FSA Mathematics Grade 8 to NAEP Mathematics Grade 8

www.FLDOE.org 112
Benchmarking - Comparing FSA Mathematics Grade 4 to TIMSS Mathematics Grade 4

www.FLDOE.org 113
Benchmarking - Comparing FSA Mathematics Grade 8 to TIMSS Mathematics Grade 8

www.FLDOE.org 114
Benchmarking - Comparing FSA ELA Grade 10 to PISA Reading Age 15
www.FLDOE.org 115
Benchmarking - Comparing FSA Geometry to PISA Mathematics Age 15

www.FLDOE.org 116
Pass Rate Comparisons - Educator and Reactor Panel FSA Recommendations to
FCAT 2.0

www.FLDOE.org 117
Percent 3 and Above: FCAT 2.0 Reading and FSA ELA
Grade 2011 FCAT 2.0 2014 FCAT 2.0 2015 FSA Ed. Panel
2015 FSA Reactor Panel
3 57% 57% 55% 53% 4 59% 61% 54% 56% 5 58% 61% 49% 56% 6 58% 60% 49% 52% 7 58% 57% 51% 51% 8 53% 57% 59% 55% 9 51% 53% 55% 55%
10 52% 55% 51% 51%

www.FLDOE.org 118
2011 FCAT 2.0 2014 FCAT 2.0 2015 FSA Ed. Panel (R4) 2015 FSA Reactor PanelLevel 3 & Above 57% 57% 55% 53%Below Level 3 43% 43% 45% 47%
43% 43% 45% 47%
57% 57% 55% 53%
0%
10%
20%
30%
40%
50%
60%
70%
80%
90%
100%
ELA Grade 3 FCAT 2.0 & FSA

www.FLDOE.org 119
2011 FCAT 2.0 2014 FCAT 2.0 2015 FSA Ed. Panel (R4) 2015 FSA Reactor PanelLevel 3 & Above 59% 61% 54% 56%Below Level 3 41% 39% 46% 44%
41% 39% 46% 44%
59% 61% 54% 56%
0%
10%
20%
30%
40%
50%
60%
70%
80%
90%
100%
ELA Grade 4 FCAT 2.0 & FSA
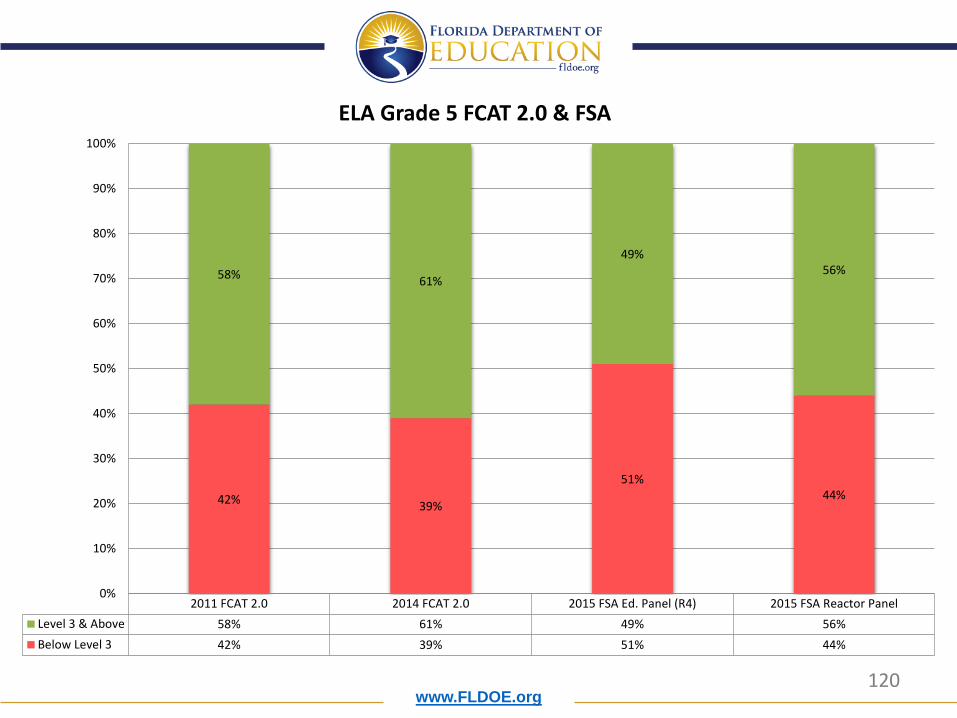
www.FLDOE.org 120
2011 FCAT 2.0 2014 FCAT 2.0 2015 FSA Ed. Panel (R4) 2015 FSA Reactor PanelLevel 3 & Above 58% 61% 49% 56%Below Level 3 42% 39% 51% 44%
42% 39%
51% 44%
58% 61%
49% 56%
0%
10%
20%
30%
40%
50%
60%
70%
80%
90%
100%
ELA Grade 5 FCAT 2.0 & FSA

www.FLDOE.org 121
2011 FCAT 2.0 2014 FCAT 2.0 2015 FSA Ed. Panel (R4) 2015 FSA Reactor PanelLevel 3 & Above 58% 60% 49% 52%Below Level 3 42% 40% 51% 48%
42% 40%
51% 48%
58% 60%
49% 52%
0%
10%
20%
30%
40%
50%
60%
70%
80%
90%
100%
ELA Grade 6 FCAT 2.0 & FSA

www.FLDOE.org 122
2011 FCAT 2.0 2014 FCAT 2.0 2015 FSA Ed. Panel (R4) 2015 FSA Reactor PanelLevel 3 & Above 58% 57% 51% 51%Below Level 3 42% 43% 49% 49%
42% 43% 49% 49%
58% 57% 51% 51%
0%
10%
20%
30%
40%
50%
60%
70%
80%
90%
100%
ELA Grade 7 FCAT 2.0 & FSA

www.FLDOE.org 123
2011 FCAT 2.0 2014 FCAT 2.0 2015 FSA Ed. Panel (R4) 2015 FSA Reactor PanelLevel 3 & Above 53% 57% 59% 55%Below Level 3 47% 43% 41% 45%
47% 43% 41%
45%
53% 57% 59%
55%
0%
10%
20%
30%
40%
50%
60%
70%
80%
90%
100%
ELA Grade 8 FCAT 2.0 & FSA

www.FLDOE.org 124
2011 FCAT 2.0 2014 FCAT 2.0 2015 FSA Ed. Panel (R4) 2015 FSA Reactor PanelLevel 3 & Above 51% 53% 55% 55%Below Level 3 49% 47% 45% 45%
49% 47% 45% 45%
51% 53% 55% 55%
0%
10%
20%
30%
40%
50%
60%
70%
80%
90%
100%
ELA Grade 9 FCAT 2.0 & FSA

www.FLDOE.org 125
2011 FCAT 2.0 2014 FCAT 2.0 2015 FSA Ed. Panel (R4) 2015 FSA Reactor PanelLevel 3 & Above 52% 55% 51% 51%Below Level 3 48% 45% 49% 49%
48% 45% 49% 49%
52% 55% 51% 51%
0%
10%
20%
30%
40%
50%
60%
70%
80%
90%
100%
ELA Grade 10 FCAT 2.0 & FSA
www.FLDOE.org 126
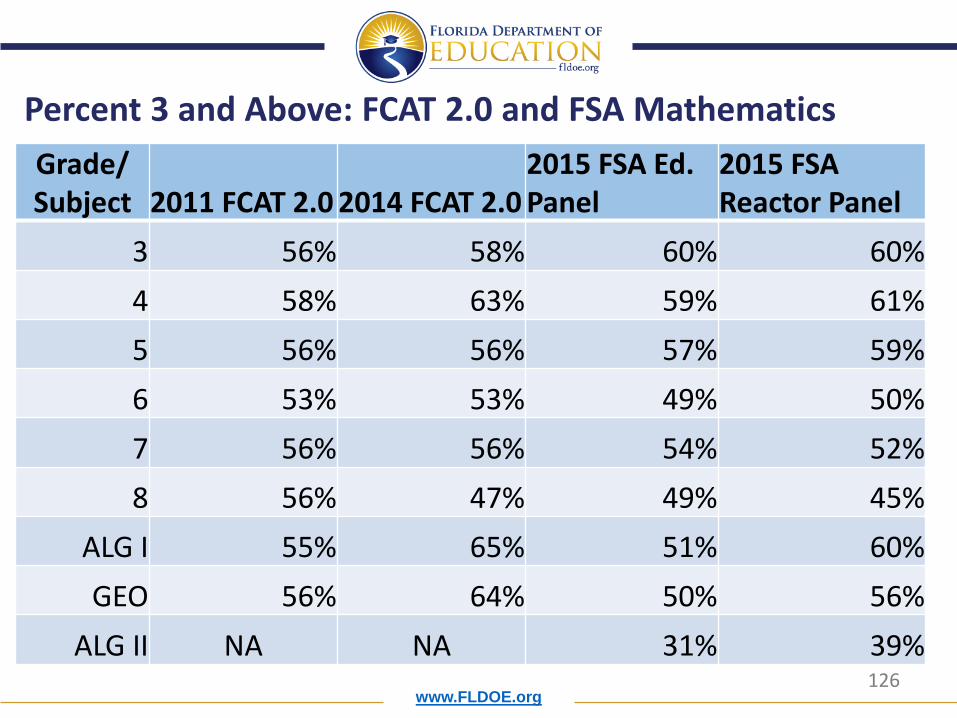
Percent 3 and Above: FCAT 2.0 and FSA Mathematics Grade/ Subject 2011 FCAT 2.0 2014 FCAT 2.0
2015 FSA Ed. Panel
2015 FSA Reactor Panel
3 56% 58% 60% 60% 4 58% 63% 59% 61% 5 56% 56% 57% 59% 6 53% 53% 49% 50% 7 56% 56% 54% 52% 8 56% 47% 49% 45%
ALG I 55% 65% 51% 60% GEO 56% 64% 50% 56%
ALG II NA NA 31% 39%
www.FLDOE.org 127
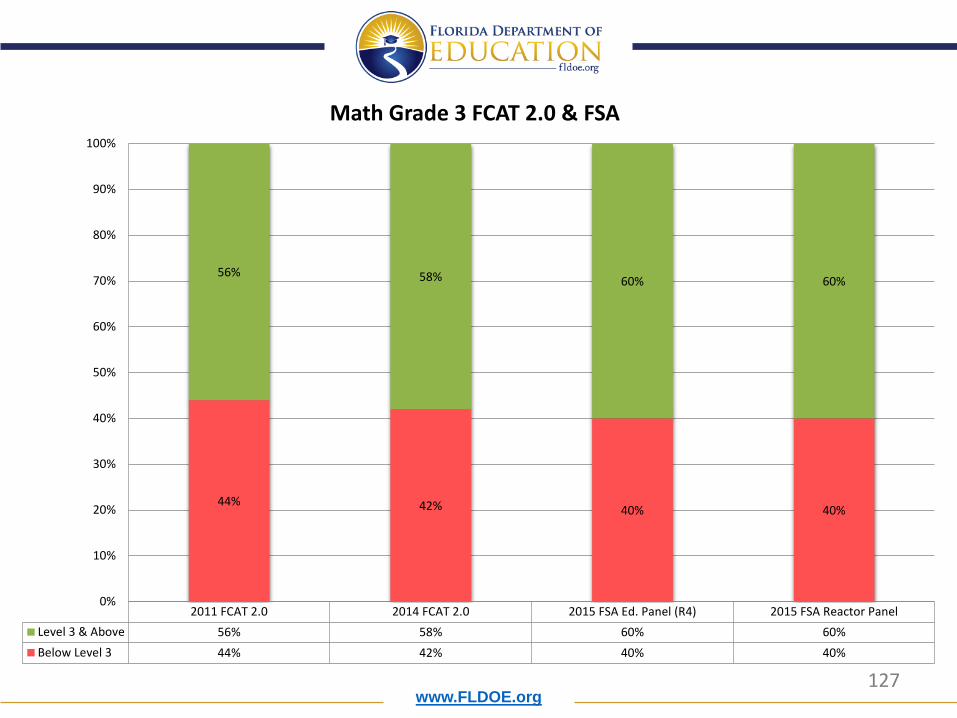
2011 FCAT 2.0 2014 FCAT 2.0 2015 FSA Ed. Panel (R4) 2015 FSA Reactor PanelLevel 3 & Above 56% 58% 60% 60%Below Level 3 44% 42% 40% 40%
44% 42% 40% 40%
56% 58% 60% 60%
0%
10%
20%
30%
40%
50%
60%
70%
80%
90%
100%
Math Grade 3 FCAT 2.0 & FSA
www.FLDOE.org 128
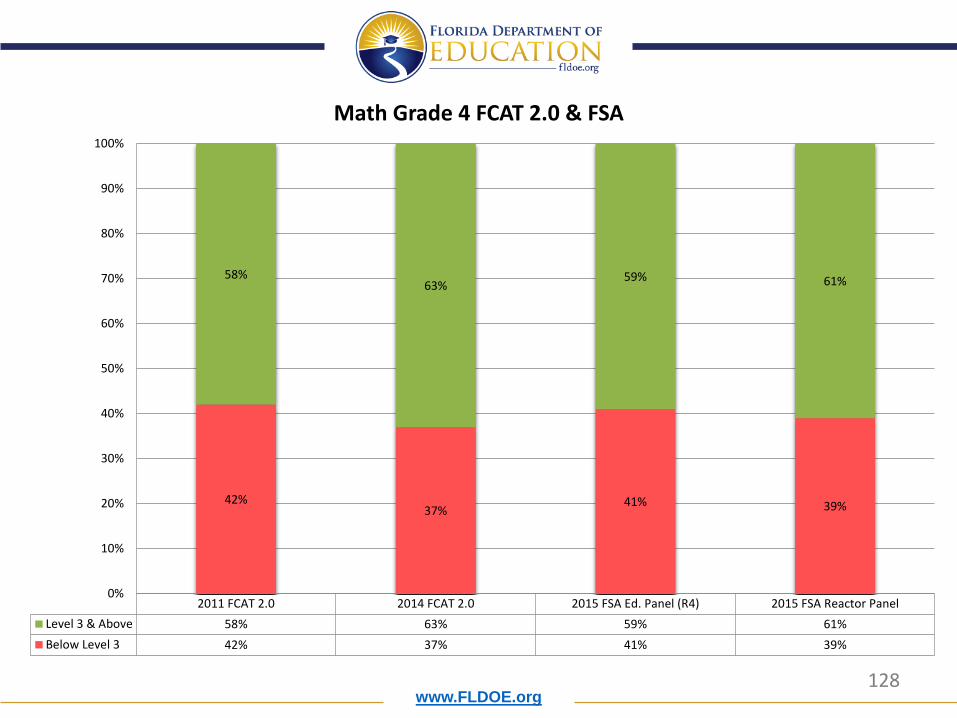
2011 FCAT 2.0 2014 FCAT 2.0 2015 FSA Ed. Panel (R4) 2015 FSA Reactor PanelLevel 3 & Above 58% 63% 59% 61%Below Level 3 42% 37% 41% 39%
42% 37%
41% 39%
58% 63%
59% 61%
0%
10%
20%
30%
40%
50%
60%
70%
80%
90%
100%
Math Grade 4 FCAT 2.0 & FSA

www.FLDOE.org 129
2011 FCAT 2.0 2014 FCAT 2.0 2015 FSA Ed. Panel (R4) 2015 FSA Reactor PanelLevel 3 & Above 56% 56% 57% 59%Below Level 3 44% 44% 43% 41%
44% 44% 43% 41%
56% 56% 57% 59%
0%
10%
20%
30%
40%
50%
60%
70%
80%
90%
100%
Math Grade 5 FCAT 2.0 & FSA
www.FLDOE.org 130
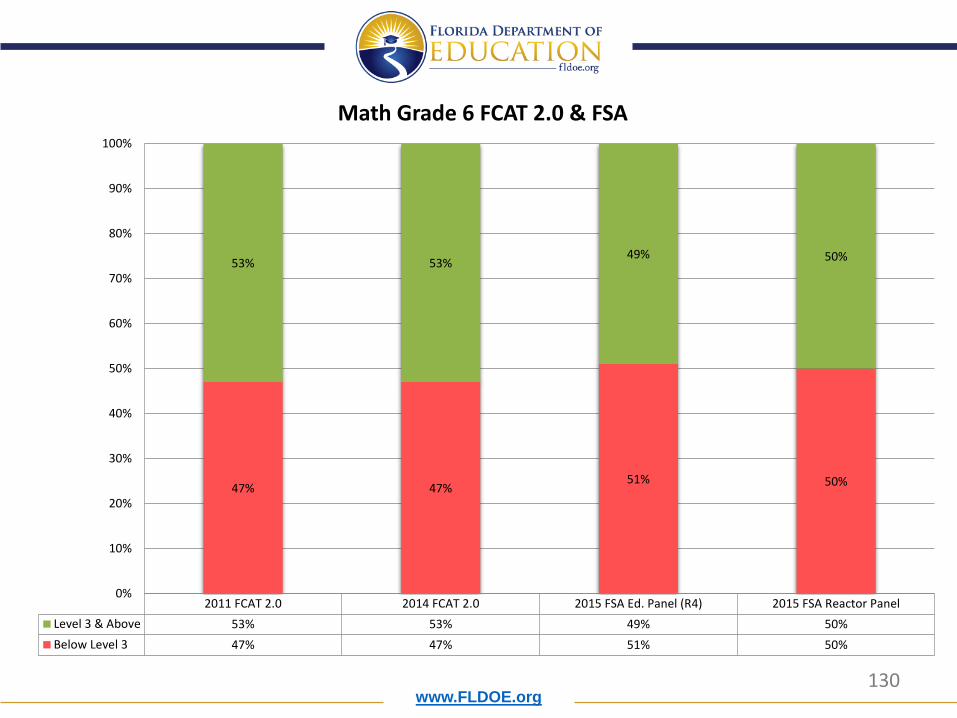
2011 FCAT 2.0 2014 FCAT 2.0 2015 FSA Ed. Panel (R4) 2015 FSA Reactor PanelLevel 3 & Above 53% 53% 49% 50%Below Level 3 47% 47% 51% 50%
47% 47% 51% 50%
53% 53% 49% 50%
0%
10%
20%
30%
40%
50%
60%
70%
80%
90%
100%
Math Grade 6 FCAT 2.0 & FSA

www.FLDOE.org 131
2011 FCAT 2.0 2014 FCAT 2.0 2015 FSA Ed. Panel (R4) 2015 FSA Reactor PanelLevel 3 & Above 56% 56% 54% 52%Below Level 3 44% 44% 46% 48%
44% 44% 46% 48%
56% 56% 54% 52%
0%
10%
20%
30%
40%
50%
60%
70%
80%
90%
100%
Math Grade 7 FCAT 2.0 & FSA

www.FLDOE.org 132
2011 FCAT 2.0 2014 FCAT 2.0 2015 FSA Ed. Panel (R4) 2015 FSA Reactor PanelLevel 3 & Above 56% 47% 49% 45%Below Level 3 44% 53% 51% 55%
44% 53% 51%
55%
56% 47% 49%
45%
0%
10%
20%
30%
40%
50%
60%
70%
80%
90%
100%
Math Grade 8 FCAT 2.0 & FSA
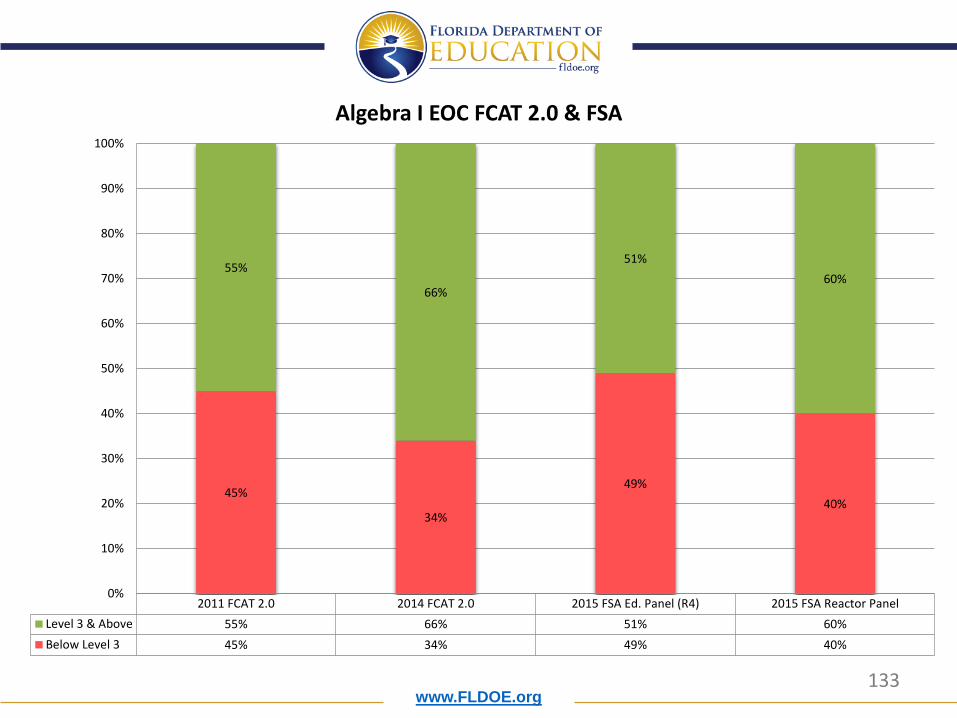
www.FLDOE.org 133
2011 FCAT 2.0 2014 FCAT 2.0 2015 FSA Ed. Panel (R4) 2015 FSA Reactor PanelLevel 3 & Above 55% 66% 51% 60%Below Level 3 45% 34% 49% 40%
45%
34%
49% 40%
55%
66%
51% 60%
0%
10%
20%
30%
40%
50%
60%
70%
80%
90%
100%
Algebra I EOC FCAT 2.0 & FSA

www.FLDOE.org 134
2012 FCAT 2.0 2014 FCAT 2.0 2015 FSA Ed. Panel (R4) 2015 FSA Reactor PanelLevel 3 & Above 56% 64% 50% 56%Below Level 3 44% 36% 50% 44%
44% 36%
50% 44%
56% 64%
50% 56%
0%
10%
20%
30%
40%
50%
60%
70%
80%
90%
100%
Geometry EOC FCAT 2.0 & FSA

www.FLDOE.org 135
• The Commissioner will consider the recommendations of the Educator Panel, the Reactor Panel, and the public workshops before making her recommendations.
• The Commissioner’s recommendations will be provided to the legislature for the statutorily-required 90 day review period.
Commissioner's Recommendation

www.FLDOE.org 136
• Draft rule including the new FSA Achievement Level cut scores will be presented to the State Board of Education for adoption in December.
• The State Board will review • Educator Panel recommendations • Reactor Panel recommendations • Public Input • Commissioner’s Recommendations
• The State Board will adopt new Achievement Level cut scores for the FSA.
State Board of Education