Embed Size (px)
Citation preview

Patient Satisfaction 1
Running Head: Patient Satisfaction
Patient Satisfaction at the Sadler Health Center Corporation
Johnathan Nieves, Marleni Milla, Alison Riehm, and Molly Foltzer
Senior Seminar in Health Studies 400
12/15/10

Patient Satisfaction 2
Abstract
Through a partnership between the Sadler Health Center Corporation (Sadler) and Dickinson
College, a patient satisfaction survey was developed and implemented to evaluate services
offered at Sadler. Students and staff collaborated to administer the anonymous patient
satisfaction survey in the Sadler waiting room over the course of five days in November of 2010.
Survey results indicate high overall patient satisfaction with services at the center and an
increased demand for dental services and appointment accessibility. The results of this survey
will be used by Sadler to determine areas of improvement and necessary future changes.

Patient Satisfaction 3
Patient Satisfaction at the Sadler Health Center Corporation
Sadler provides medical and dental services to residents of Cumberland, Perry, and
Adams County in Pennsylvania. Many of these residents are underprivileged and under-insured,
and rely solely on Sadler for healthcare and health services. The health center is able to
accommodate such patients and provides free and reduced care by means of a sliding fee scale.
Sadler’s mission is to provide “seamless, holistic, quality medical, dental and behavioral health
services and education” to the community (“Sadler Health Center Corporation,” accessed
December 12, 2010). In order to be successful in this endeavor it is necessary for Sadler to be
aware of how satisfied their patients are with the care they provide.
This project seeks to assess patient satisfaction with the services provided by Sadler by
conducting anonymous handout surveys. The data collected in this project will provide Ssadler
with a comprehensive understanding of the services they deliver, in addition to assisting them in
adapting to the changing needs of their patients. Similarly, healthcare facilities use data from
satisfaction surveys to objectively assess themselves, identify and track quality improvement
initiatives, and to meet requirements of accrediting agencies (Gribble and Haupt 2005). Such
information is crucial to the success of clinics like Sadler, a clinic that provide services to a
particularly demanding population that relies solely on their services. By administering patient
satisfaction surveys, patients are given a voice and a participatory role in their healthcare
experience. This is supported by a study conducted by Beach et al. (2005), that found that
quality of healthcare was greatly improved when patients were treated with respect and involved
in the decision making process. In particular, we hoped to gain information about how patients
felt about their quality and availability of medical or dental care, as well as their interactions with
healthcare providers.

Patient Satisfaction 4
General Methods
Subjects
The subjects in this study consisted of 143 patients, whose responses were gained through
convenience sampling. Respondents were administered surveys following a completed medical
or dental appointment.
Procedure
The survey was created to emulate aspects of the generic survey forms previously used by
Sadler, as well as combining segments of a previous study conducted by Dickinson College in
2007 and HRSA’s recommended survey format. The survey was worded in a way that was
intended to be sensitive to the varying abilities of the targeted population. Patients received a
survey tailored to the services they utilized during their appointment: there was a specific survey
for either medical or dental appointments. The survey consisted of questions regarding
satisfaction with patients’ most recent appointment, included a checklist of services used, as well
as a section for additional comments. The surveys were administered in the waiting room of the
clinic by 11 student volunteers, and were assisted by the Sadler staff. Patients were asked to
anonymously fill out a survey on site following their medical or dental appointment. After
completion of the survey each patient was entered into a drawing to win a $100 Wal-Mart gift
card.
Data
The surveys were collected from 143 participants, however, not all sections of the surveys were
completed. The portions that were incomplete were incorporated in the analysis, however, they
were labeled as missing data. SPSS™ was used to analyze and organize the data, and was used
to generate graphs and tables.

Patient Satisfaction 5
Results
Survey Demographics
The gender of the Sadler survey population was not balanced with females constituting 64 % of
respondents who supplied their gender while 27% of the participants were males (Fig. 1).
Approximately 43% of the population was between the ages of forty and sixty years of age, 29%
between nineteen and forty, 18% between sixty-one and eighty-one and 8% eighteen years or
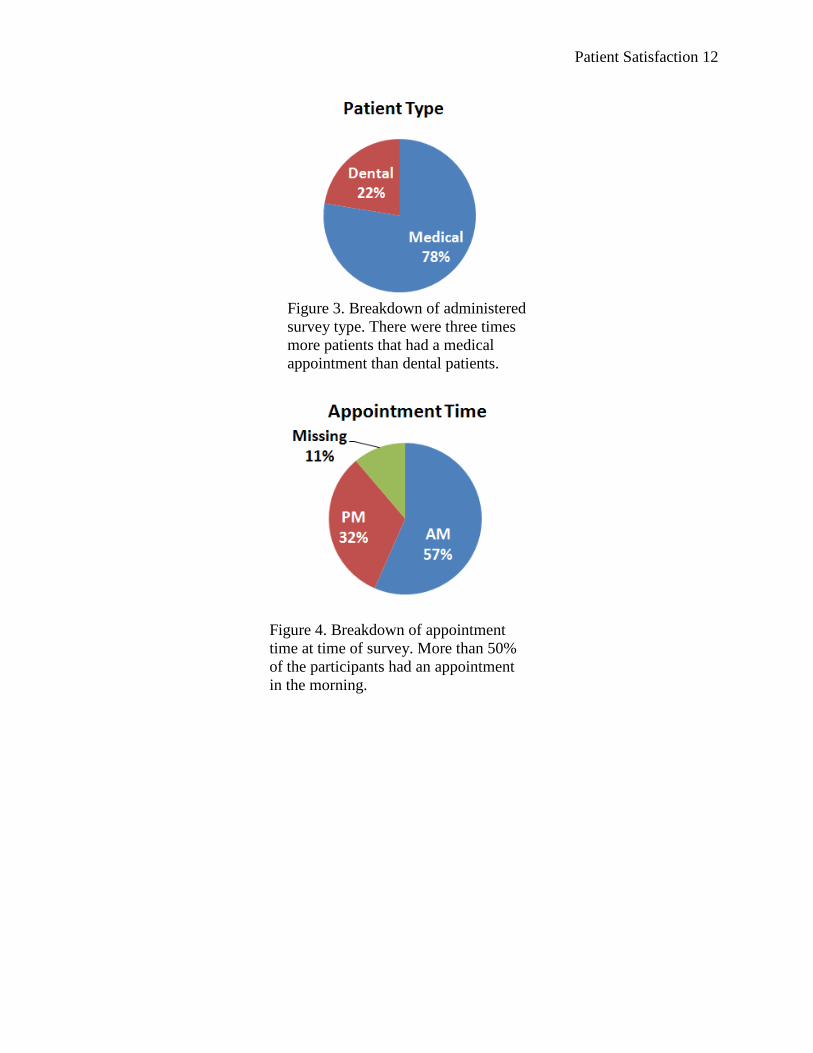
younger, and 12% did not provide their age (Fig 2.). About 78% of the patients had a medical
appointment and 22% of patients had a dental appointment (Fig 3). Approximately 57% of the
patients had their appointment in the morning, while 32% percent had their appointment in the
afternoon (Fig 4.).
Patient Relationship to Sadler
Approximately 82% of the participants answered yes when asked if it was their first time visiting
Sadler, 8% answered no, and 10% did not provide any information (Fig. 5). When asked
whether Sadler was their primary source of health care, 71% of patients responded yes, 16%
answered no, and 13% did not respond (Fig. 6).
Services Used
Of the six services offered at Sadler, 80.4% of patients had used medical services, 55.9% used
dental services, 15.4% used the Healthy Rx program, 10.5% were in the tobacco cessation
program, 4.9% had gone to health education sessions, and 2.1% had been involved in the nurse
family partnership program (Fig. 7).
Accessibility
When asked if it was easy to schedule an appointment, 81.8% of patients responded very true,
16.1% responded somewhat true, 1.4% responded not true, and 0.7% were unsure (Fig. 8).

Patient Satisfaction 6
When asked if it was easy to get to Sadler, 81.1% of patients responded very true, 14.7%
responded somewhat true, 2.8% responded not true, and 0.7% were unsure of how to respond to
the statement (Fig. 9). Approximately 50% of respondents were aware of how to file a
complaint, if necessary, 39% did not know how to file a complaint, and 11% did not answer (Fig.
10).
Staff Services
When questioned if receptionists are courteous 94% of patients responded very true, 5.6%
answered somewhat true, and 0.7% answered not true (Fig. 11). About 94% of patients
responded very true, 4.2% answered somewhat true, and 1.4% answered not true to the statement
concerning the helpfulness of receptionists (Fig. 12). With regard to medical and dental
assistants, 97.2% of patients responded very true to the courteousness of assistants (Fig. 13).
Approximately 97.9% participants responded very true, 1.4% responded somewhat true, and
0.7% responded not true towards the sentence that stated that the provider treated the patient with
respect (Fig. 14). In terms of the statement, I understood my provider, 94.4% of the patients
answered very true, 4.2% answered somewhat true, and 1.4% responded not true (Fig. 15).
When asked if a provider answered their questions 92.3% of patients answered very true, 4.9
responded somewhat true, 1.4% answered not true, and 1.4% were unsure of their response (Fig.
16). Towards the statement, I trust my provider’s ability, 83.9% of patients responded very true,
12.6% answered somewhat true, 1.4% responded not true, and 2.1% were unsure of their
responses (Fig. 17).
Preventative Measures
Approximately 88% of patients responded very true, 9.2% answered somewhat true, 4.4%
responded not true, and 1.4% were unsure towards the statement, I know what to do to get better
Patient Satisfaction 7
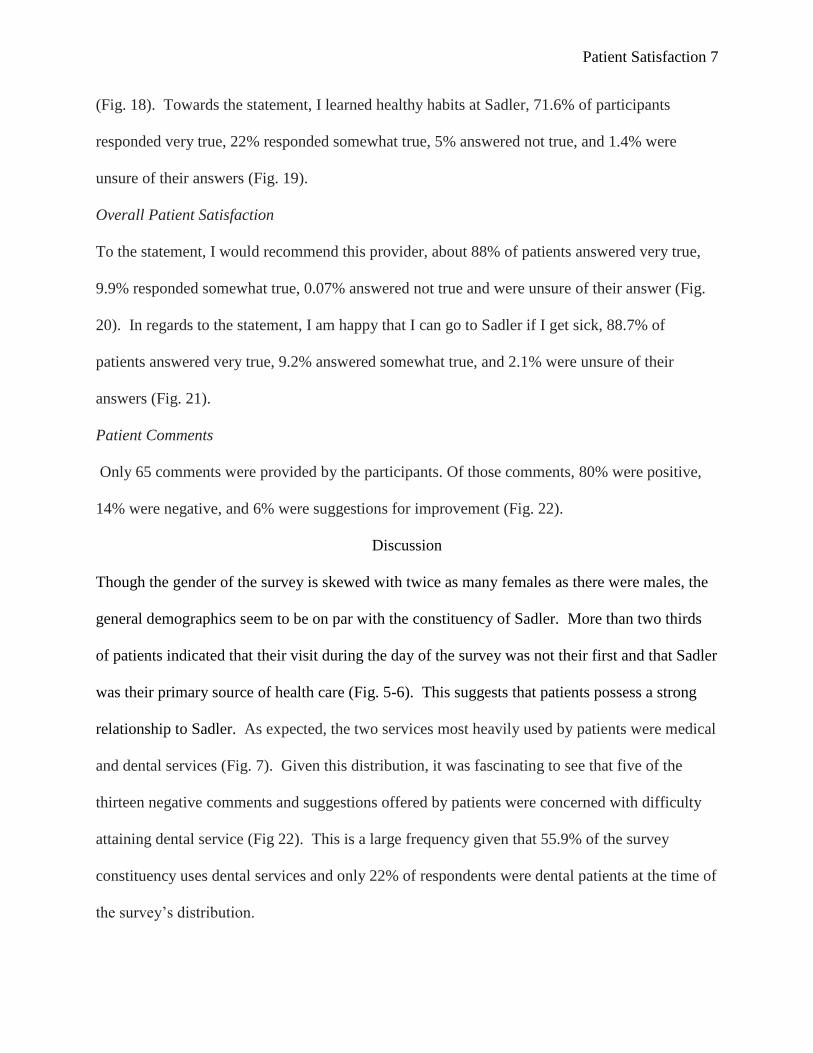
(Fig. 18). Towards the statement, I learned healthy habits at Sadler, 71.6% of participants
responded very true, 22% responded somewhat true, 5% answered not true, and 1.4% were
unsure of their answers (Fig. 19).
Overall Patient Satisfaction
To the statement, I would recommend this provider, about 88% of patients answered very true,
9.9% responded somewhat true, 0.07% answered not true and were unsure of their answer (Fig.
20). In regards to the statement, I am happy that I can go to Sadler if I get sick, 88.7% of
patients answered very true, 9.2% answered somewhat true, and 2.1% were unsure of their
answers (Fig. 21).
Patient Comments
Only 65 comments were provided by the participants. Of those comments, 80% were positive,
14% were negative, and 6% were suggestions for improvement (Fig. 22).
Discussion
Though the gender of the survey is skewed with twice as many females as there were males, the
general demographics seem to be on par with the constituency of Sadler. More than two thirds
of patients indicated that their visit during the day of the survey was not their first and that Sadler
was their primary source of health care (Fig. 5-6). This suggests that patients possess a strong
relationship to Sadler. As expected, the two services most heavily used by patients were medical
and dental services (Fig. 7). Given this distribution, it was fascinating to see that five of the
thirteen negative comments and suggestions offered by patients were concerned with difficulty
attaining dental service (Fig 22). This is a large frequency given that 55.9% of the survey
constituency uses dental services and only 22% of respondents were dental patients at the time of
the survey’s distribution.

Patient Satisfaction 8
On accessibility, appointment scheduling and transportation to Sadler received high
marks with slightly more than 80% percent of patients reporting it was easy to make an
appointment and to travel to Sadler (Fig. 9-10). This is a high percentage given the geographical
distribution of the Sadler patient base, suggesting that most patients have access to a car or live
in the nearby vicinity. There is room for significant improvement on patient education
concerning complaint filing since only fifty percent of respondents knew how to file a complaint,
if necessary. Improving access to this resource may ease patient comfort in reporting concerns
with the facilities or staff at Sadler (Fig. 10).
Support staff services and provider services received very high marks with greater than
90% of patients responding very true to six of seven statements evaluating provider and support
staff performance (Fig. 11-17). About 16% of patients, however, responded below very true to a
statement regarding their trust in their provider; interestingly enough, 26% and 13% of all males
and all females, respectively, fell into this category (Fig. 17). This suggests that male patients
tend to be less trusting of their providers than females. Overall patient satisfaction was very high
with more than 88% of patients stating they would go as far as recommending their provider to a
friend (Fig. 20). Taken together, this data suggests that patients are extremely satisfied with the
quality services available to them at Sadler.
This study possesses a few possible limitations. One such limitation may be that each
patient may have interpreted the questions in a slightly different way leading to biased results.
Another possible limitation is the length of the study. Because the study was only conducted
over the course of five days, less than one percent of the patient population was able to be
reached. Perhaps this study can be conducted again on a more long-term basis in order to reach
more patients and hopefully obtain results that accurately reflect the opinions of the entire patient
Patient Satisfaction 9
population. It is also possible that the method of sampling used in this study contributed to bias
in the results. Because patients were sampled on a convenience basis, it is possible that only
patients who had either strongly positive or strongly negative opinions about Sadler chose to
participate in the study. Perhaps this study could be conducted again using some sort of random
sampling technique to obtain participants. Another possible limitation of this study is the method
of survey delivery. It is known that participants are more likely to provide positive answers on a
survey that is given in person than one that they can mail back (Gribble, 2005). Perhaps this
study can be conducted again with the option of a take home survey. While it is possible that
less people would fill out the survey, it also likely that the results would more accurately reflect
the opinions of the patients. One final limitation is that while patients were asked to fill out the
surveys based only on that days visit, it is likely that previous experiences still influenced their
responses. This is evidenced by the fact that many of the comments from the patients referenced
past experiences at Sadler. It could be helpful to conduct a future study that included a section
inquiring about previous visits to Sadler in an attempt to separate the experiences and obtain
more accurate survey results.

Patient Satisfaction 10
References
Beach, C. M., Sugarman, J., Johnson, R.L., Arbelarez, J. J., Duggan, P., & Cooper, L. (2005). Do
Patients Treated With Dignity Report Higher Satisfaction, Adherence, and Receipt of
Preventive Care? Annals of Family Medicine. 3.
Gribble, R.K. & Haupt, C. (267). Quantitative and Qualitative Differences Between Handout and
Mailed Patient Satisfaction Surveys. Medical Care. 43, 276-281.
Harris, L., Swindle, R., Mungai, S., Weinberger, M. & Tierney, W. (1999). Measuring Patient
Satisfaction for Quality Improvement. Medical Care. 37. 1207-1213.
Sadler Health Center. (2010, December 12). Retrieved from http://sadlerhealth.org

Patient Satisfaction 11
Figures
Figure 1. Gender breakdown of
survey participants. Twice as many
females for every male, responded.
Figure 2. Age breakdown of survey
participants. Of the patients who
participated, most were between the
ages of 40-60 or 19-40.
Patient Satisfaction 12
Figure 3. Breakdown of administered
survey type. There were three times
more patients that had a medical
appointment than dental patients.
Figure 4. Breakdown of appointment
time at time of survey. More than 50%
of the participants had an appointment
in the morning.

Patient Satisfaction 13
Figure 5. Patients’ first visit to Sadler.
More than three fourths of the patients
had visited Sadler before.
Figure 6. Sadler is the Primary Health
Care Source. More than two thirds of
the patients considered Sadler their
primary health care source.

Patient Satisfaction 14
Services used
Figure 7. Services Used. Of the six services provided, medical and dental services are the
most heavily used.
Figure 8. Ease of scheduling an appointment. More than
three fourths of the patients answered very true when
asked if it was easy to make an appointment.

Patient Satisfaction 15
Figure 9. Ease of transportation. More than three fourths of
patients answered very true when asked if it was easy to get
Sadler.
Figure 10. Ease of filing a complaint. Approximately
half of the patients stated they knew how to file a
complaint, if necessary.

Patient Satisfaction 16
Figure 11. Attitudes of receptionists. More than 90% of the
receptionists thought that the receptionists were courteous.
Figure 12. Service by receptionists. More than 90% of the
patients thought that the receptionists were helpful.

Patient Satisfaction 17
Figure 13. Attitudes of medical and dental assistants.
More than 90% of the patients thought that assistants
were courteous.
Figure 14. Attitudes of providers. More than 90% of
participants believed that their provider treated them
with respect.

Patient Satisfaction 18
Figure 15. Patient understanding of providers. More than
90% of the patients understood their provider.
Figure 16. Patient perception of providers’ ability to
answer their question. More than three fourths of the
participants felt that their provider answered their
questions.

Patient Satisfaction 19
Figure 17. Patient perception of providers’ general abilities.
More than three fourths of the participants felt that their
provider answered their questions.
Figure 18. Preventative measures. More than three fourths
of the patients knew what to do to get better.

Patient Satisfaction 20
Figure 19. Healthy habits. More than two thirds of the
patients learned healthy habits at Sadler.
Figure 20. Recommendation of provider services. More
than three fourths of patients would recommend their
provider.

Patient Satisfaction 21
Figure 21. Overall Satisfaction with Sadler. More than
three fourths of the patients are happy to go to Sadler if
they get sick.
Figure 22. Patient Comments. More than three fourths of the comments provided by the patients
were positive.