Embed Size (px)
Citation preview
Running head: EFFECTIVENESS OF U.S. DIABETES CONVERSATION MAP®
1
Effectiveness of U.S. Diabetes Conversation Map® Patient Education Program in Improving
Glycemic Control
Raman Haus
University of Missouri-Kansas City
Approved May 2017 by the faculty of UMKC in partial fulfillment of the requirements for the degree of Doctor of Nursing Practice
©2017
Raman Haus All Rights Reserved
EFFECTIVENESS OF U.S. DIABETES CONVERSATION MAP®
2
Abstract
Type 2 diabetes is a chronic disease that can lead to health complications and shorten life
expectancy. The prevalence rates of type 2 diabetes continue to increase in America, leading to
an increased economic and disease burden. Lifestyle interventions can significantly improve
health outcomes. Participation in a group based diabetes self-management education program
can aid in improving adherence and improving glycemic control. The purpose of this cohort
project is to evaluate the effectiveness of an 8 week, group based education program using the
U.S. Diabetes Conversation Map® in improving follow up glycated hemoglobin levels at a
university affiliated outpatient diabetes clinic. A retrospective study was conducted with 50 adult
patients that completed an 8-week education program using the U.S. Diabetes Conversation
Map® from January 2013 to September 2016. Data was collected from patient electronic
medical records at a university affiliated outpatient diabetes clinic. Improvement in glycemic
control was measured by reduction in post intervention HbA1C levels from pre-intervention
HbA1C levels. Data was analyzed using descriptive statistics, paired t-test, significance .05 and
Pearson and Spearman correlation. The mean baseline HbA1C was 8.41 (95% confidence
interval [CI], 5.6 – 15.9 ) and decreased to 7.34 (95% CI, 4.7-11.8), p< .001. A decrease in post
intervention HbA1C was seen in 68% of the participants. Results of the study show that the U.S.
Diabetes Conversation Map® is effective in improving glycemic control.
Keywords: diabetes self-management education, U.S. Diabetes Conversation Map®,
glycated hemoglobin
EFFECTIVENESS OF U.S. DIABETES CONVERSATION MAP®
3
Effectiveness of U.S. Diabetes Conversation Map® Patient Education Program in
Improving Glycemic Control
The prevalence rate of type 2 diabetes mellitus (T2DM) continues to increase annually
(Center for Disease Control, [CDC] 2014). An estimated 29.1 million Americans are affected by
T2DM (CDC, 2014). An additional 86 million Americans have prediabetes that will result in
development of diabetes if effective risk prevention methods are not initiated (CDC, 2011). The
increasing prevalence rate of diabetes is one of the leading causes of increased mortality and
morbidity globally (Chen, Creedy, Lin, & Wollin, 2011). Diagnosis of diabetes lowers life
expectancy by up to fifteen years and is the seventh leading cause of death in America (CDC,
2014).
The development of T2DM is associated with many factors. Both genetics and the
environment play a role in the development of T2DM (Psaltopoulou, Llias, & Alevizaki, 2010).
Factors such as diet, physical activity, weight, genes, and increased insulin resistance influence
the development of T2DM (Psaltopoulou, Llias, & Alevizaki, 2010). Diagnosis of T2DM can
lead to health complications that increase mortality and morbidity and increase the economic
burden of the disease (CDC, 2014). United States Department of Health & Human Services
(DHHS) Healthy People 2020 set the goal to reduce the disease burden of T2DM and improve
the quality of life for those diagnosed with diabetes. Patient education and lifestyle management
is essential in reducing the burden of the disease and reducing the risk for complications
associated with T2DM (CDC, 2014; Beverley et al., 2013).
Diabetes self-management education (DSME) using the group based education method
has been effective in significantly improving health outcomes (Beverley et al., 2013). One of the
DSME programs is the United States Diabetes Conversation Map® (U.S. Diabetes Conversation
EFFECTIVENESS OF U.S. DIABETES CONVERSATION MAP®
4
Map®), also referred to as the American Diabetes Association Conversation Map®. This DSME
program is created by Healthy Interactions and American Diabetes Association (ADA) and
sponsored by Merck & Co (Fernandes et al., 2010).
Economic Burden
Not only does T2DM increase mortality and morbidity rates, it places an increasing
economic burden on the United States health care system. The cost of treating diagnosed T2DM
and associated complications increased from $174 billion in 2007 to $245 billion in 2012 and
continues to increase annually. (American Diabetes Association [ADA], 2013).
Local Issue
T2DM continues to increase in incidence and cause significant burden of disease both
nationally and locally (CDC, 2014). There are an estimated 320,000 people in the Kansas City
metro area diagnosed with T2DM (ADA, 2016). This number is expected to be higher because
there are many undiagnosed cases of diabetes (CDC, 2014). The American Diabetes Association
in Kansas City metro area estimates that every one out of three children born in the United States
after the year 2000 will be directly affected by T2DM (ADA, 2016). The increasing prevalence
rates locally suggest a need for effective methods to reduce the burden of the disease.
Diversity Considerations
While diabetes affects people from all ethnicities, there continues to be health disparities
for the minority populations in the United States (DHHS, 2016). Minority populations such as
Hispanics, African Americans, Asian Americans, and American Indians have an increased risk
for developing T2DM compared to Caucasians (DHHS, 2016). African Americans have the
highest risk and are 1.7 times more likely to develop diabetes than non-Hispanic Caucasians of
the same age (DHHS, 2016). The site of this project is a diabetes clinic at a university medical
EFFECTIVENESS OF U.S. DIABETES CONVERSATION MAP®
5
center which serves a diverse patient population. Patients are referred to this clinic from the
metropolitan area and outside of the city area. The clinic does accept Medicaid along with most
commercial insurances, and this allows for patients from a wide diversity of socioeconomic
statuses at the clinic.
Problem and Purpose
Problem Statement
Twenty-nine million Americans are affected by either type 1 or T2DM and this number
continues to increase annually (CDC, 2014). The majority of the people with diabetes have
T2DM (CDC, 2014). Development of diabetes is associated with adverse health outcomes such
as increased risk for cardiovascular disease and stroke, and diabetes is the leading cause of
kidney disease and adult onset of blindness (CDC, 2014). Lifestyle intervention has the greatest
impact in preventing, delaying, and reducing complications associated with diabetes (DHHS,
2016). Group based DSME is effective in significantly improving glycemic control and
improving health outcomes (Beverly et al., 2013). Because lifestyle and behavior change can
lead to improved health outcomes for those diagnosed with T2DM, there is a need for effective
patient DSME regarding managing T2DM and preventing health complications associated with
diabetes. Due to the increasing prevalence rates of T2DM, it is important to implement effective
methods to reduce the burden of the disease and improve patient outcomes.
The intended goal of group based DSME is to promote adherence to recommended
diabetes self-care and improve glycemic control (Beverly et al., 2013). The patients at the project
site diabetes clinic with a diagnosis of T2DM measured by a glycated hemoglobin (HbA1C) of
6.5% or higher are referred to the DSME which uses the U.S. Diabetes Conversation Map®.
Patients with type 1, gestational, or prediabetes also have the opportunity to participate in the
EFFECTIVENESS OF U.S. DIABETES CONVERSATION MAP®
6
DSME education program, but the majority of the participants are type 2 diabetics. The aim of
the program is to improve glycemic control through increasing knowledge about the disease and
adherence to recommended diabetes treatment. While all patients with a HbA1C of 6.5% and
higher are referred, the number of patients that participate in the group education program is low.
Results of research studies have concluded that DSME is effective in improving patient
outcomes; thus, there is a need to increase patient participation in group based DSME at the
diabetes clinic.
Purpose
The purpose of this retrospective study was to determine whether participation in a group
based diabetes patient education program using the U.S. Diabetes Conversation Map® program
improves post intervention HbA1C levels for the patients at the diabetes clinic.
Facilitators and Barriers
The main facilitators for this project were the diabetes program director, diabetes
educator, and the medical director at the clinic site. The facilitators provided this student
investigator with resources and support throughout the project course. Assistance was provided
with obtaining site and IRB approval, accessing the clinic’s electronic medical record (EMR) for
the chart review, viewing the education and resources for the 8 week U.S. Diabetes Conversation
Map® program, and participating in data collection. The medical director provided oversight of
the study as required by site IRB.
The low economic cost of implementation of this project was also a facilitator.
Participation in the 8 week diabetes group education program and access to the EMR for chart
review did not result in additional costs for this student investigator, therefore decreasing the
amount of money needed for funding and implementation of this project. In addition, the cost of
EFFECTIVENESS OF U.S. DIABETES CONVERSATION MAP®
7
professionals involved in the education program may be offset by the reimbursement from
insurance companies.
Barriers included lack of participant attendance to all sessions. Not all participants
attended all four sessions in the program. In order to obtain an accurate program evaluation, only
participants who completed all four-group education sessions were included in the analysis.
Another barrier was lack of consistency with follow up HbA1C labs. Not all participants had a
follow up HbA1C drawn following completion of the education program.
A factor that promotes sustainability is the use of study results at the project site by
healthcare providers to encourage future patients to participate in U.S. Diabetes Conversation
Map® education program. Study results can also be used to increase patient participation and
referral in primary care and internal medicine clinics throughout the organization for patients
diagnosed with prediabetes or T2DM. A factor that inhibits sustainability is patients’
unwillingness to participate in an education program despite information that participation can
improve health outcomes.
Review of Evidence
PICOT, Inquiry
In adult patients with type 2 diabetes, does participation in a 8 week group based patient
education program using the U.S. Diabetes Association Conversation Map® reduce HbA1C
levels over a 3 month period at a diabetes clinic at a university medical center?
Search Strategies
A literature search was conducted using Cumulative Index to Nursing and Allied Health
Literature (CINAHL) through EBSCO, PubMed, and Medline. Studies relevant to the clinical
inquiry were searched in the time frame of 2006 to 2016. Search terms included type 2 diabetes,
EFFECTIVENESS OF U.S. DIABETES CONVERSATION MAP®
8
diabetes self-management patient education, outcomes of diabetes self-management education,
type 2 diabetes and self-efficacy, self-care, adherence to self-care, socioeconomic impact on self-
care, positive behavior change, social support, and barriers to adherence to self-care (see
Appendix A for Definition of Terms). Thirty-two relevant studies including guidelines were
included in the literature review. There were 9 evidence level I studies, 12 evidence level II
studies, 1 evidence level III study, 5 evidence level IV studies, and 5 evidence level V studies.
Synthesis of Evidence
A variety of study designs and high level evidence original research studies were used for
the literature review. Both qualitative and quantitative studies were included in the search but the
majority of the evidence for the literature review was obtained from quantitative studies. The
studies used in the literature review directly address the inquiry. Studies included patient ages of
18 and older with a diagnosis of T2DM or prediabetes (see Appendix B for Synthesis of
Evidence Table).
Diabetes Self-Management Education
Increasing patient knowledge regarding self-care and improving self-efficacy can aid in
improving patient outcomes (Haas et al., 2013). Research supports that DSME improves patient
outcomes by increasing patient knowledge regarding the disease process, increasing knowledge
of self-care, and improving self-efficacy (Haas et al., 2013; Rise, Pellerud, Lisbeth, &
Steinsbekk). DSME is effective in increasing the participant’s knowledge regarding self-care and
improving patient outcomes by improving glycemic control (Dunkley et al., 2014).
DSME is a critical component of care for patients diagnosed with diabetes or at risk for
developing diabetes (Haas et al., 2013). Daily life long management of chronic diseases such as
diabetes can be complex and challenging for the patients (Haas et al., 2013). DSME aids in
EFFECTIVENESS OF U.S. DIABETES CONVERSATION MAP®
9
increasing knowledge regarding the disease process and evidence based methods to manage the
disease, and decreasing the rate of disease progression and risk of complications (Haas et al.,
2013).
The overall goals of DSME are to provide the patients with knowledge regarding T2DM
disease process, self-care behaviors, problem solving, becoming an active member of the
healthcare team, improving health outcomes, and quality of life (Haas et al., 2013). DSME
includes the use of a structured evidence based curriculum (Haas et al., 2013). Education is
provided in a group setting, typically weekly sessions lasting several weeks (Haas et al., 2013).
Healthy behavior change following DSME has positive health outcomes (Dunkley et al.,
2014). Dunkley et al. (2014) conducted a meta-analysis of 22 studies regarding the effects of
diabetes lifestyle education on weight loss, and the life style intervention education resulted in an
average weight loss of 2.32kg. Long, Cooper, Wareham, Griffin, & Simmons (2014) conducted a
cohort study of 867 newly diagnosed diabetic patients to determine the effects of healthy
behavior change on cardiovascular disease. Participants were followed for five years and
cardiovascular disease risk was directly related to the number of positive lifestyle interventions
made by the participants (Long et al., 2014). The risk for a cardiovascular disease event in those
who did not make any lifestyle changes was 4.17 times higher than those who made three to four
lifestyle changes was 4.17 (Long et al., 2014). Significant improvement in glycemic control is an
important benefit of DSME (Casagrande, Fradkin, Saydah, Rust, & Cowie 2013; Beverly, 2013;
Sepers et al., 2015; Liu, Min, & Brateanu, 2014).
The Utility of U.S. Diabetes Conversation Map®
The U.S. Diabetes Conversation Map® education program was created by Healthy
Interactions in partnership with American Diabetes Association and was sponsored by Merck &

EFFECTIVENESS OF U.S. DIABETES CONVERSATION MAP®
10
Co. (Fernandes et al., 2010). It is an effective DSME education program to improve self-efficacy
and improve health outcomes (Fernandes et al., 2010). The program is composed of four
education sessions each lasting two hours (Fernandes et al., 2010). Map 1 is an overview on
diabetes, feelings associated with having diabetes, and common myths about diabetes. Map 2
discusses the relationship between diabetes and food and focuses on strategies for healthy eating.
Map 3 discusses the importance of monitoring blood glucose and using it to manage diabetes.
Map 4 discusses the course of the diabetes disease process and potential long-term complications
that can occur. The last map also addresses methods to reduce risks for long term complications
(Fernandes et al., 2010).
The conversation map was created to be patient centered, give the patient the knowledge
and skills needed for diabetes self-care, and promote self-efficacy by increasing knowledge
(Reaney, Eichorst, & Gorman, 2012). The conversation map allows participants to identify
personal goals, engage in active dialogue, share personal experiences, and reflect on
psychological and environmental changes that were barriers to positive behavior change in the
past (Reaney et al., 2012). These factors increase self-efficacy and improve likelihood of positive
behavior change (Reaney et al., 2012). In a randomized control study evaluating the conversation
map, Reaney et al 2012 compared the effectiveness of the conversation map with regular care in
681 patients with type 2 diabetes. Those who received education using the conversation map had
increased satisfaction with care and higher occurrence of meeting diabetic goals (Reaney et al.,
2013).
Health Literacy
An estimated 78 million Americans have either lower than basic or basic health literacy
levels (Berkman et al, 2011). Health literacy level is defined as the individual’s ability to obtain
EFFECTIVENESS OF U.S. DIABETES CONVERSATION MAP®
11
and understand the health information being presented to make appropriate health choices
(Committee on Health Literacy, Institute of Medicine, 2004, p.32). While low literacy levels
exist in all populations, the characteristics most commonly associated with low literacy are
elderly, minority, lower socioeconomic status, English as a second language, and limited
education (Kutner, Greenberg, Jin, & Paulsen, 2006).
The ability to understand medical information presented by healthcare professionals is
especially important in chronic diseases such as T2DM because T2DM requires extensive self-
management (Berkman et al., 2011). Berkman et al (2011) conducted a systematic review to
determine the effects of low health literacy on health outcomes. Results of this review showed
that low health literacy is linked to increased hospitalizations, inability to take medications as
prescribed, decreased preventive care and screenings, and higher mortality rates. The systematic
review, which used 207 studies showed the importance of tailoring diabetes self-management
programs to the participants health literacy level (Berkman et al., 2011).
Socioeconomic Status
There are health disparities seen in individuals of lower socioeconomic status,
specifically with increased prevalence for chronic diseases (Braveman, Cubbin, Egerter,
Williams, & Pamuk, 2010). Type 2 diabetes is a chronic disease that requires significant self-
care. Lack of education and lack of resources is a barrier to positive lifestyle intervention
(Agardh, Allebeck, Hallqvist, Moradi, & Sidorchuk, 2011).
Agardh et al (2011) conducted a systematic review of 23 studies regarding the association
of type 2 diabetes incidences and socioeconomic status. Individuals with lower education levels
and lower income levels had an increased risk of developing T2DM compared to those with
higher education and income levels (Agardh et al., 2011). Factors such as decreased access to
EFFECTIVENESS OF U.S. DIABETES CONVERSATION MAP®
12
healthcare, available healthy food options, and safe places to exercise play a role in increased
risk for developing diabetes (Agardh et al., 2011).
Self-efficacy and Social Support
Self-efficacy and social support are important factor in predicting positive health
behavior change (King et al., 2010). King et al. (2010) conducted a study with 463 diabetic
adults with elevated body mass index to determine the relationship between psychological,
social, and environmental variables that influence diet, exercise, and medication compliance.
Results showed that self-efficacy, problem solving, and social-environmental support were
associated with diet choices and amount of physical activity. The authors concluded that self-
management education intervention should include methods to enhance self-efficacy and social
support to improve adherence to education and improve health outcomes.
Theory
The theory used to guide this project is the Health Belief Model. The Health Belief
Model has six constructs (see Appendix C). These include perceived susceptibility, perceived
severity, perceived benefit, perceived barriers, cues to action, and self-efficacy
(Rosenstock, Strecher & Becker, 1988). T2DM is a chronic disease that requires self-
management. Self care education programs aid in providing diabetic patients with the knowledge
to implement positive behavior change that leads to improved health outcomes. Many factors
influence whether an individual will adhere to the education and implement positive behavior
change, and these factors include the constructs in this theory. The Health Belief Model is often
used as a framework for behavior change following patient education (Champion & Skinner,
2008).
Methods
EFFECTIVENESS OF U.S. DIABETES CONVERSATION MAP®
13
IRB and Site Approval
The primary Institutional Review Board (IRB) for this project was the University of
Kansas Medical Center (KUMC). Original IRB approval was obtained on October 2016.
Modified IRB approval to increase sample size and range of dates for data collection was
obtained on 12/1/16. The relying IRB was the University of Missouri- Kansas City (UMKC).
Due to the retrospective design of this study, only data that already existed on date of IRB
approval was used for this study.
The category of submission to the primary IRB was retrospective protocol. This student
investigator had access to protected health information with patient identifiers through the EMR
but patient identifiers were not recorded for data collection. There was no intervention associated
with risk in patient harm although there was minimal risk of breach of confidentiality associated
with data collection.
Ethical Issues
The use of retrospective research design is expanding in the healthcare field
(Takahashi, Nishida, & Asai, 2012). Benefits of retrospective chart reviews include low cost,
study question can be answered in a short span of time, and patients can be followed over a long
period of time (Takahashi et al., 2012). An important factor to consider when using EMR
databases to collect data is patient privacy and protection of patient confidentiality. Data privacy
can be protected by only accessing information that is necessary for the study (Takahashi et al.,
2012). This student investigator only had access to EMR at the clinic site. Not having remote
access and avoiding printing and email of data aided in protecting patient privacy. Also, selection
bias was controlled by consecutive sampling of 50 patients who completed the patient education
program.
EFFECTIVENESS OF U.S. DIABETES CONVERSATION MAP®
14
Funding
This was a low cost project. Collection of data by the student investigator required no
cost. Cost associated with the project included dissemination of the project. UMKC Women’s
Council Graduate Assistant Fund provided funding for dissemination of project at regional
nursing conference (See appendix D for Cost Table). No conflict of interest exists.
Setting and Participants
The setting for this project was a diabetes clinic at a university medical center in the
Midwest. The project was a retrospective chart review of patients at this clinic that participated
in the diabetes patient education program using the U.S. diabetes conversation map®. Inclusion
criteria included age 18 and older, diagnosis of T2DM confirmed with HbA1C of 6.5% or
higher, participation in the education program within the time frame of January 2013 to
September 2016, pre-intervention HbA1C lab drawn prior to date of first class session, post
intervention HbA1C drawn within 2 to 7 months following date of last class session, and
completion of all four-education sessions in the program at least 3 months prior to the IRB
approval date of December 1 2016. Exclusion criteria were type 1 or gestational diabetes, age
less than 18 years, and missing one or more of the patient education sessions.
Evidence Based Practice Intervention
U.S. Diabetes Conversation Map® is an evidenced based DSME group based education
program created by Healthy Interactions and the American Diabetes Association and sponsored
by Merck & Co.(Fernandes et al., 2010). The program consists of four 3 by 5 foot maps that are
placed on the tables with participants sitting around it. The maps are set up similar to a board
game. Each map is set as a journey with a start and an end. The sessions are interactive and
encourage participants to follow along on the map. Participants are encouraged to read
EFFECTIVENESS OF U.S. DIABETES CONVERSATION MAP®
15
information located on the maps, participate in interactive games located on the maps, and share
experiences regarding the journey with diabetes. One map is used per session. Each map contains
guideline-based standards for DSME (Crawford & Wiltz, 2015). Map 1 is an overview of
diabetes and common myths associated with it, Map 2 discusses healthy eating, Map 3 focuses
on home blood glucose monitoring and use of blood sugars to manage diabetes, and Map 4
discusses long term complications associated with T2DM and methods to prevent complications
(Crawford & Wiltz, 2015).
Two cohort patient education groups form every 8 weeks at the project site. Patients have
the option of attending sessions on Wednesday mornings at the main hospital clinic site in
Kansas City, KS or Monday evenings at an Overland park, KS clinic site. If a session is missed,
participants are encouraged to make-up the session by joining the next cohort group. The two
hour long sessions had 3 to 10 participants. A maximum of 10 patients in each cohort allows for
a small group size and encourages each member to participate in discussions. Healthcare
providers refer patients at the project site to DSME. Patients can also self refer. At the first
session, participants write goals related to diabetes and lifestyle changes. At each following
session, participants are encouraged to discuss status of goals with the facilitator.
The student investigator role in this project included attending the four sessions of the
Conversation Map®, retrospective data collection from December 30, 2016 to March 1, 2017
using the project site EMR, data entry in SPSS, data analysis, and project dissemination (see
Appendix F for Timeline, Appendix G for Intervention Flow Diagram, and Appendix H for
Intervention Materials). Data collection process included reviewing the DSME attendance sheets
listing names of participants of The U.S. Diabetes Conversation Map® from sessions that
occurred from September 2016 to January 2013. The names on attendance sheets were entered
EFFECTIVENESS OF U.S. DIABETES CONVERSATION MAP®
16
into the project site EMR. Data was collected on 50 participants using consecutive sampling
starting with patients from September 2016 that met all inclusion criteria and ending with
participants from January 2013. September 2016 was selected as the starting date for data
collection in order to allow 3 month for follow up HbA1C prior to the date of IRB approval.
Change Process and EBP model
The Stetler’s model of evidence based practice was used for this project. This model has
five phases (Schaffer,Sandau, & Diedrick, 2013). Phase 1 is the preparation phase in which the
purpose and definition of the project are identified. Phase 2 is the validation phase of the
evidence. In phase III, the evidence found is critiqued and evidence to be implemented is
selected. Phase IV is implementation of the evidence to practice, and phase V is evaluation of the
implementation (Schaffer et al., 2013; See Appendix I for EBP Model)
The likelihood of sustainability is high because the results of this pilot project show that
participation in the U.S. Conversation Map® improves patient adherence to positive self-
management behavior that results in improved glycemic control. Providers can use results of this
study to increase patient participation in the U.S. Diabetes Conversation Map® education
program by showing improved outcomes at the project site.
Study Design
This project was a retrospective chart review of one cohort group. Electronic medical
record chart review was conducted on 50 patients who participated and completed all four
sessions of group patient education program using the U.S. Conversation Map®. Baseline (pre-
intervention) HbA1C levels before participation in the group based patient education program
were compared to the post intervention HbA1C following the completion of the patient
education program. The follow up 3 month HbA1C was defined as the HbA1C closest to 3
EFFECTIVENESS OF U.S. DIABETES CONVERSATION MAP®
17
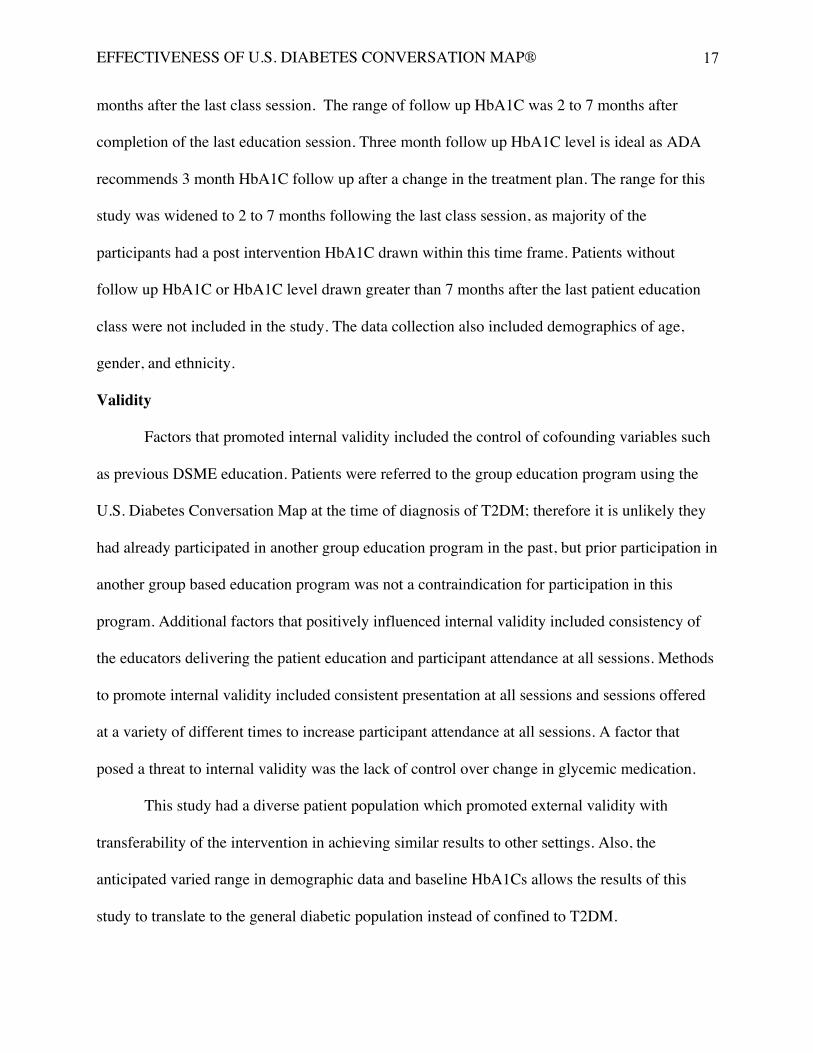
months after the last class session. The range of follow up HbA1C was 2 to 7 months after
completion of the last education session. Three month follow up HbA1C level is ideal as ADA
recommends 3 month HbA1C follow up after a change in the treatment plan. The range for this
study was widened to 2 to 7 months following the last class session, as majority of the
participants had a post intervention HbA1C drawn within this time frame. Patients without
follow up HbA1C or HbA1C level drawn greater than 7 months after the last patient education
class were not included in the study. The data collection also included demographics of age,
gender, and ethnicity.
Validity
Factors that promoted internal validity included the control of cofounding variables such
as previous DSME education. Patients were referred to the group education program using the
U.S. Diabetes Conversation Map at the time of diagnosis of T2DM; therefore it is unlikely they
had already participated in another group education program in the past, but prior participation in
another group based education program was not a contraindication for participation in this
program. Additional factors that positively influenced internal validity included consistency of
the educators delivering the patient education and participant attendance at all sessions. Methods
to promote internal validity included consistent presentation at all sessions and sessions offered
at a variety of different times to increase participant attendance at all sessions. A factor that
posed a threat to internal validity was the lack of control over change in glycemic medication.
This study had a diverse patient population which promoted external validity with
transferability of the intervention in achieving similar results to other settings. Also, the
anticipated varied range in demographic data and baseline HbA1Cs allows the results of this
study to translate to the general diabetic population instead of confined to T2DM.
EFFECTIVENESS OF U.S. DIABETES CONVERSATION MAP®
18
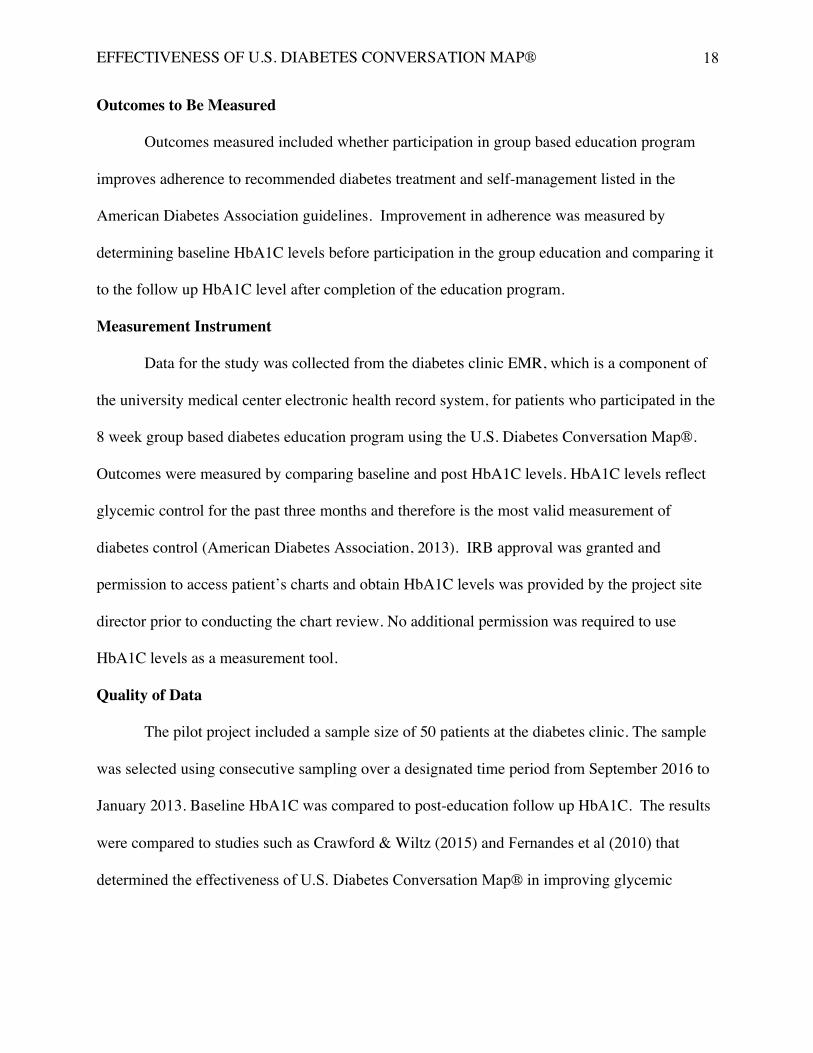
Outcomes to Be Measured
Outcomes measured included whether participation in group based education program
improves adherence to recommended diabetes treatment and self-management listed in the
American Diabetes Association guidelines. Improvement in adherence was measured by
determining baseline HbA1C levels before participation in the group education and comparing it
to the follow up HbA1C level after completion of the education program.
Measurement Instrument
Data for the study was collected from the diabetes clinic EMR, which is a component of
the university medical center electronic health record system, for patients who participated in the
8 week group based diabetes education program using the U.S. Diabetes Conversation Map®.
Outcomes were measured by comparing baseline and post HbA1C levels. HbA1C levels reflect
glycemic control for the past three months and therefore is the most valid measurement of
diabetes control (American Diabetes Association, 2013). IRB approval was granted and
permission to access patient’s charts and obtain HbA1C levels was provided by the project site
director prior to conducting the chart review. No additional permission was required to use
HbA1C levels as a measurement tool.
Quality of Data
The pilot project included a sample size of 50 patients at the diabetes clinic. The sample
was selected using consecutive sampling over a designated time period from September 2016 to
January 2013. Baseline HbA1C was compared to post-education follow up HbA1C. The results
were compared to studies such as Crawford & Wiltz (2015) and Fernandes et al (2010) that
determined the effectiveness of U.S. Diabetes Conversation Map® in improving glycemic
EFFECTIVENESS OF U.S. DIABETES CONVERSATION MAP®
19
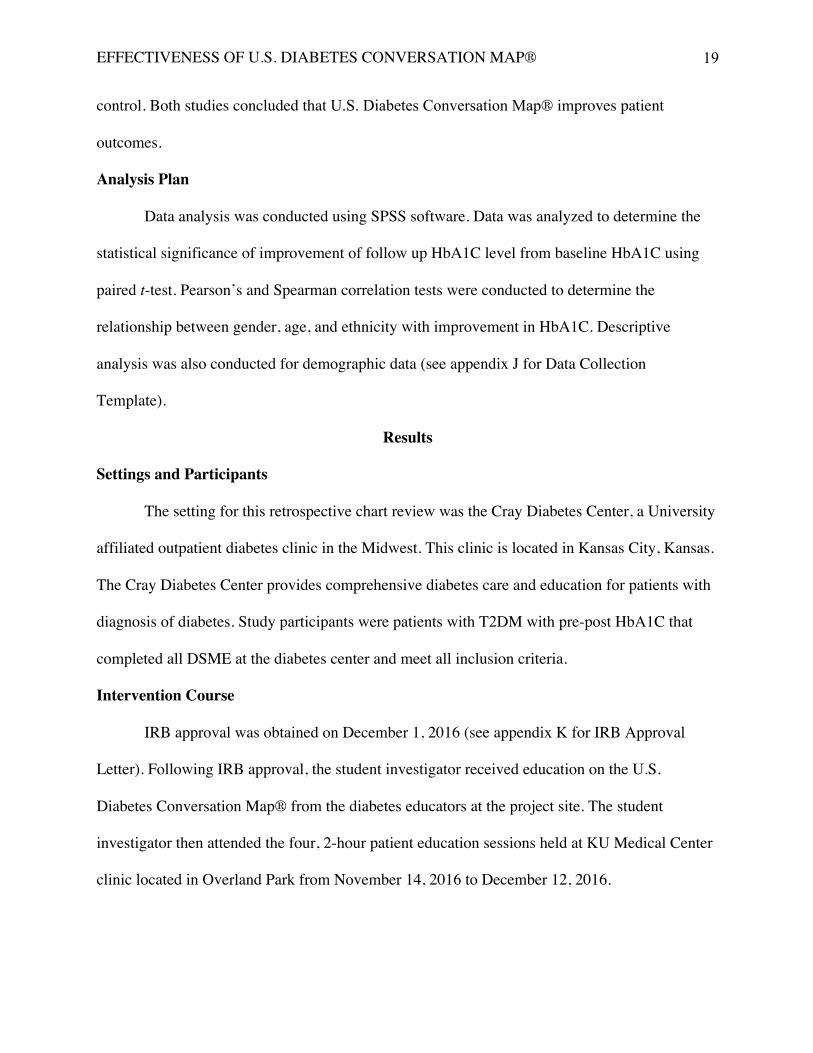
control. Both studies concluded that U.S. Diabetes Conversation Map® improves patient
outcomes.
Analysis Plan
Data analysis was conducted using SPSS software. Data was analyzed to determine the
statistical significance of improvement of follow up HbA1C level from baseline HbA1C using
paired t-test. Pearson’s and Spearman correlation tests were conducted to determine the
relationship between gender, age, and ethnicity with improvement in HbA1C. Descriptive
analysis was also conducted for demographic data (see appendix J for Data Collection
Template).
Results
Settings and Participants
The setting for this retrospective chart review was the Cray Diabetes Center, a University
affiliated outpatient diabetes clinic in the Midwest. This clinic is located in Kansas City, Kansas.
The Cray Diabetes Center provides comprehensive diabetes care and education for patients with
diagnosis of diabetes. Study participants were patients with T2DM with pre-post HbA1C that
completed all DSME at the diabetes center and meet all inclusion criteria.
Intervention Course
IRB approval was obtained on December 1, 2016 (see appendix K for IRB Approval
Letter). Following IRB approval, the student investigator received education on the U.S.
Diabetes Conversation Map® from the diabetes educators at the project site. The student
investigator then attended the four, 2-hour patient education sessions held at KU Medical Center
clinic located in Overland Park from November 14, 2016 to December 12, 2016.
EFFECTIVENESS OF U.S. DIABETES CONVERSATION MAP®
20
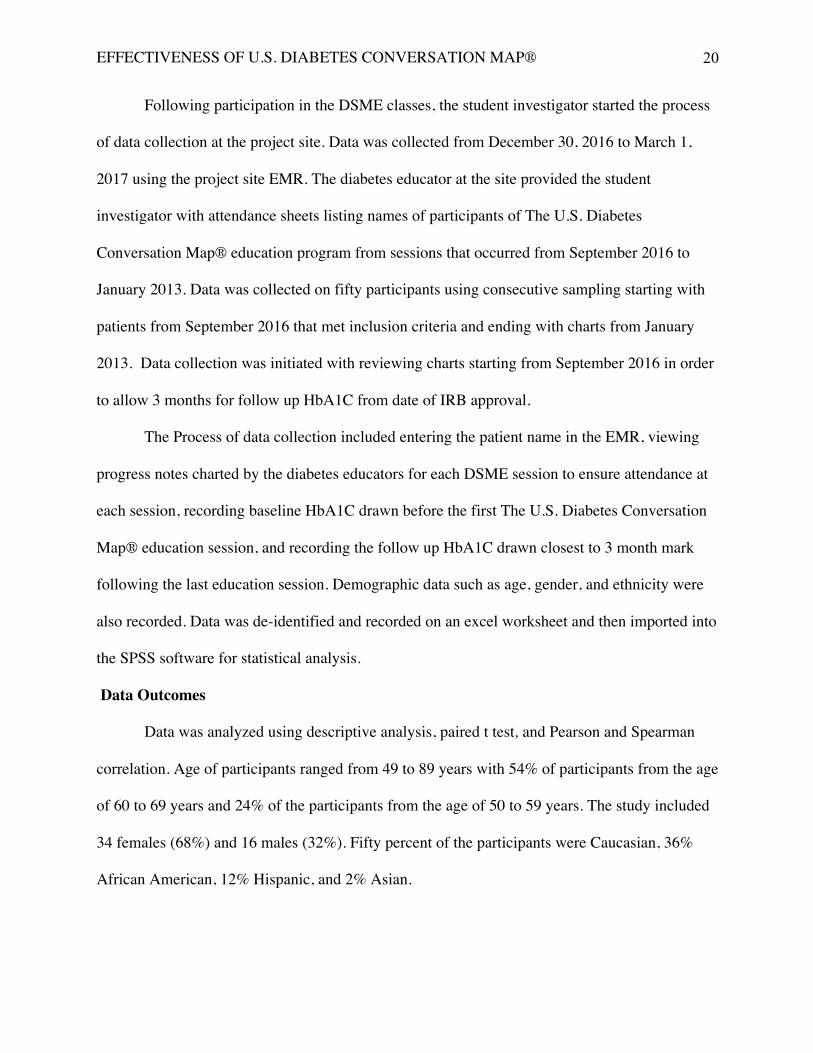
Following participation in the DSME classes, the student investigator started the process
of data collection at the project site. Data was collected from December 30, 2016 to March 1,
2017 using the project site EMR. The diabetes educator at the site provided the student
investigator with attendance sheets listing names of participants of The U.S. Diabetes
Conversation Map® education program from sessions that occurred from September 2016 to
January 2013. Data was collected on fifty participants using consecutive sampling starting with
patients from September 2016 that met inclusion criteria and ending with charts from January
2013. Data collection was initiated with reviewing charts starting from September 2016 in order
to allow 3 months for follow up HbA1C from date of IRB approval.
The Process of data collection included entering the patient name in the EMR, viewing
progress notes charted by the diabetes educators for each DSME session to ensure attendance at
each session, recording baseline HbA1C drawn before the first The U.S. Diabetes Conversation
Map® education session, and recording the follow up HbA1C drawn closest to 3 month mark
following the last education session. Demographic data such as age, gender, and ethnicity were
also recorded. Data was de-identified and recorded on an excel worksheet and then imported into
the SPSS software for statistical analysis.
Data Outcomes
Data was analyzed using descriptive analysis, paired t test, and Pearson and Spearman
correlation. Age of participants ranged from 49 to 89 years with 54% of participants from the age
of 60 to 69 years and 24% of the participants from the age of 50 to 59 years. The study included
34 females (68%) and 16 males (32%). Fifty percent of the participants were Caucasian, 36%
African American, 12% Hispanic, and 2% Asian.
EFFECTIVENESS OF U.S. DIABETES CONVERSATION MAP®
21
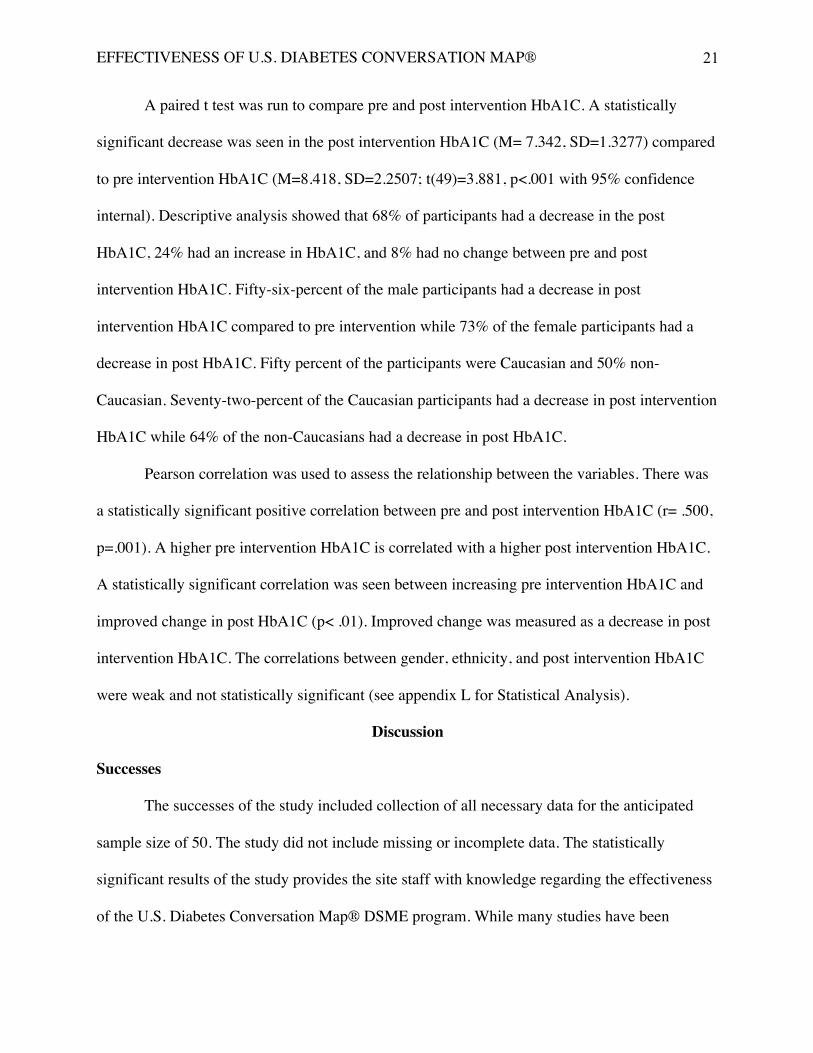
A paired t test was run to compare pre and post intervention HbA1C. A statistically
significant decrease was seen in the post intervention HbA1C (M= 7.342, SD=1.3277) compared
to pre intervention HbA1C (M=8.418, SD=2.2507; t(49)=3.881, p<.001 with 95% confidence
internal). Descriptive analysis showed that 68% of participants had a decrease in the post
HbA1C, 24% had an increase in HbA1C, and 8% had no change between pre and post
intervention HbA1C. Fifty-six-percent of the male participants had a decrease in post
intervention HbA1C compared to pre intervention while 73% of the female participants had a
decrease in post HbA1C. Fifty percent of the participants were Caucasian and 50% non-
Caucasian. Seventy-two-percent of the Caucasian participants had a decrease in post intervention
HbA1C while 64% of the non-Caucasians had a decrease in post HbA1C.
Pearson correlation was used to assess the relationship between the variables. There was
a statistically significant positive correlation between pre and post intervention HbA1C (r= .500,
p=.001). A higher pre intervention HbA1C is correlated with a higher post intervention HbA1C.
A statistically significant correlation was seen between increasing pre intervention HbA1C and
improved change in post HbA1C (p< .01). Improved change was measured as a decrease in post
intervention HbA1C. The correlations between gender, ethnicity, and post intervention HbA1C
were weak and not statistically significant (see appendix L for Statistical Analysis).
Discussion
Successes
The successes of the study included collection of all necessary data for the anticipated
sample size of 50. The study did not include missing or incomplete data. The statistically
significant results of the study provides the site staff with knowledge regarding the effectiveness
of the U.S. Diabetes Conversation Map® DSME program. While many studies have been
EFFECTIVENESS OF U.S. DIABETES CONVERSATION MAP®
22
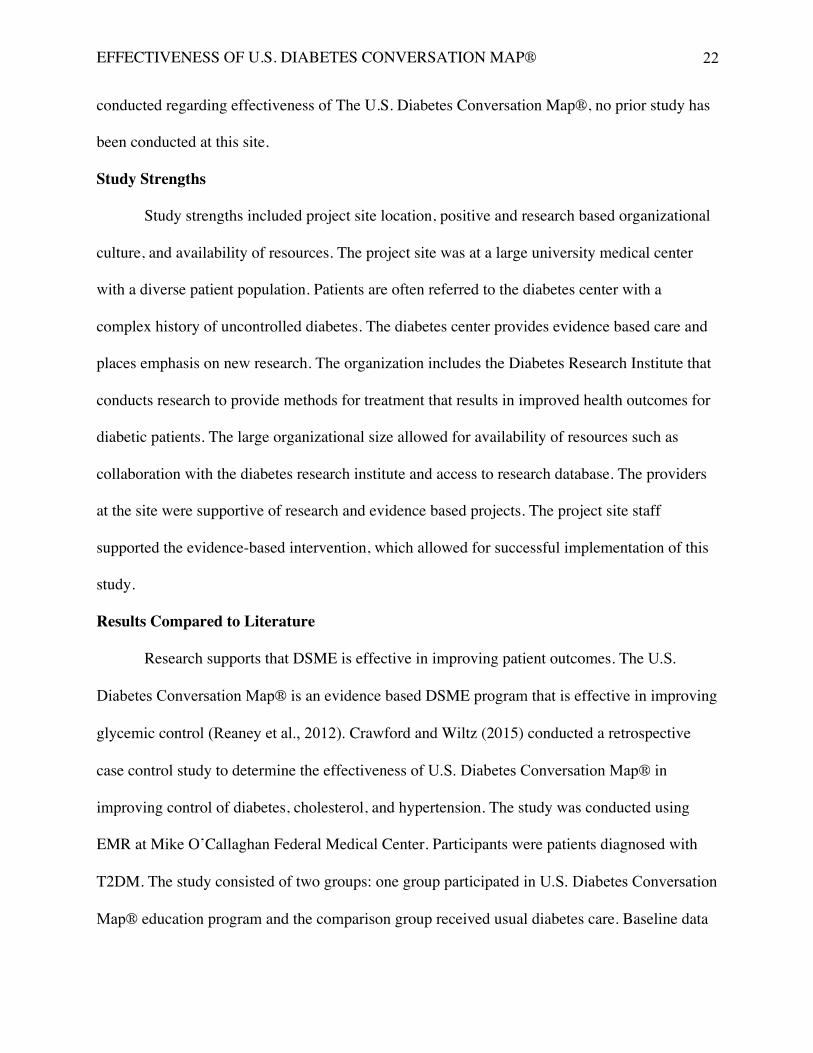
conducted regarding effectiveness of The U.S. Diabetes Conversation Map®, no prior study has
been conducted at this site.
Study Strengths
Study strengths included project site location, positive and research based organizational
culture, and availability of resources. The project site was at a large university medical center
with a diverse patient population. Patients are often referred to the diabetes center with a
complex history of uncontrolled diabetes. The diabetes center provides evidence based care and
places emphasis on new research. The organization includes the Diabetes Research Institute that
conducts research to provide methods for treatment that results in improved health outcomes for
diabetic patients. The large organizational size allowed for availability of resources such as
collaboration with the diabetes research institute and access to research database. The providers
at the site were supportive of research and evidence based projects. The project site staff
supported the evidence-based intervention, which allowed for successful implementation of this
study.
Results Compared to Literature
Research supports that DSME is effective in improving patient outcomes. The U.S.
Diabetes Conversation Map® is an evidence based DSME program that is effective in improving
glycemic control (Reaney et al., 2012). Crawford and Wiltz (2015) conducted a retrospective
case control study to determine the effectiveness of U.S. Diabetes Conversation Map® in
improving control of diabetes, cholesterol, and hypertension. The study was conducted using
EMR at Mike O’Callaghan Federal Medical Center. Participants were patients diagnosed with
T2DM. The study consisted of two groups: one group participated in U.S. Diabetes Conversation
Map® education program and the comparison group received usual diabetes care. Baseline data
EFFECTIVENESS OF U.S. DIABETES CONVERSATION MAP®
23
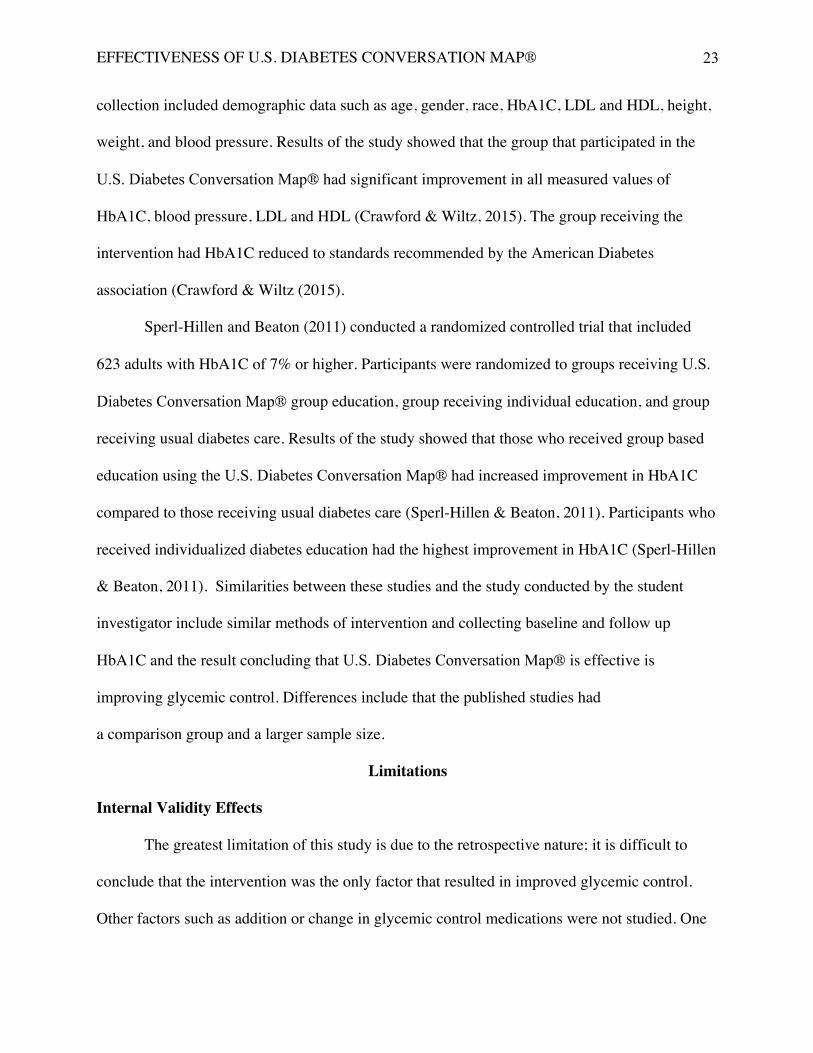
collection included demographic data such as age, gender, race, HbA1C, LDL and HDL, height,
weight, and blood pressure. Results of the study showed that the group that participated in the
U.S. Diabetes Conversation Map® had significant improvement in all measured values of
HbA1C, blood pressure, LDL and HDL (Crawford & Wiltz, 2015). The group receiving the
intervention had HbA1C reduced to standards recommended by the American Diabetes
association (Crawford & Wiltz (2015).
Sperl-Hillen and Beaton (2011) conducted a randomized controlled trial that included
623 adults with HbA1C of 7% or higher. Participants were randomized to groups receiving U.S.
Diabetes Conversation Map® group education, group receiving individual education, and group
receiving usual diabetes care. Results of the study showed that those who received group based
education using the U.S. Diabetes Conversation Map® had increased improvement in HbA1C
compared to those receiving usual diabetes care (Sperl-Hillen & Beaton, 2011). Participants who
received individualized diabetes education had the highest improvement in HbA1C (Sperl-Hillen
& Beaton, 2011). Similarities between these studies and the study conducted by the student
investigator include similar methods of intervention and collecting baseline and follow up
HbA1C and the result concluding that U.S. Diabetes Conversation Map® is effective is
improving glycemic control. Differences include that the published studies had
a comparison group and a larger sample size.
Limitations
Internal Validity Effects
The greatest limitation of this study is due to the retrospective nature; it is difficult to
conclude that the intervention was the only factor that resulted in improved glycemic control.
Other factors such as addition or change in glycemic control medications were not studied. One
EFFECTIVENESS OF U.S. DIABETES CONVERSATION MAP®
24
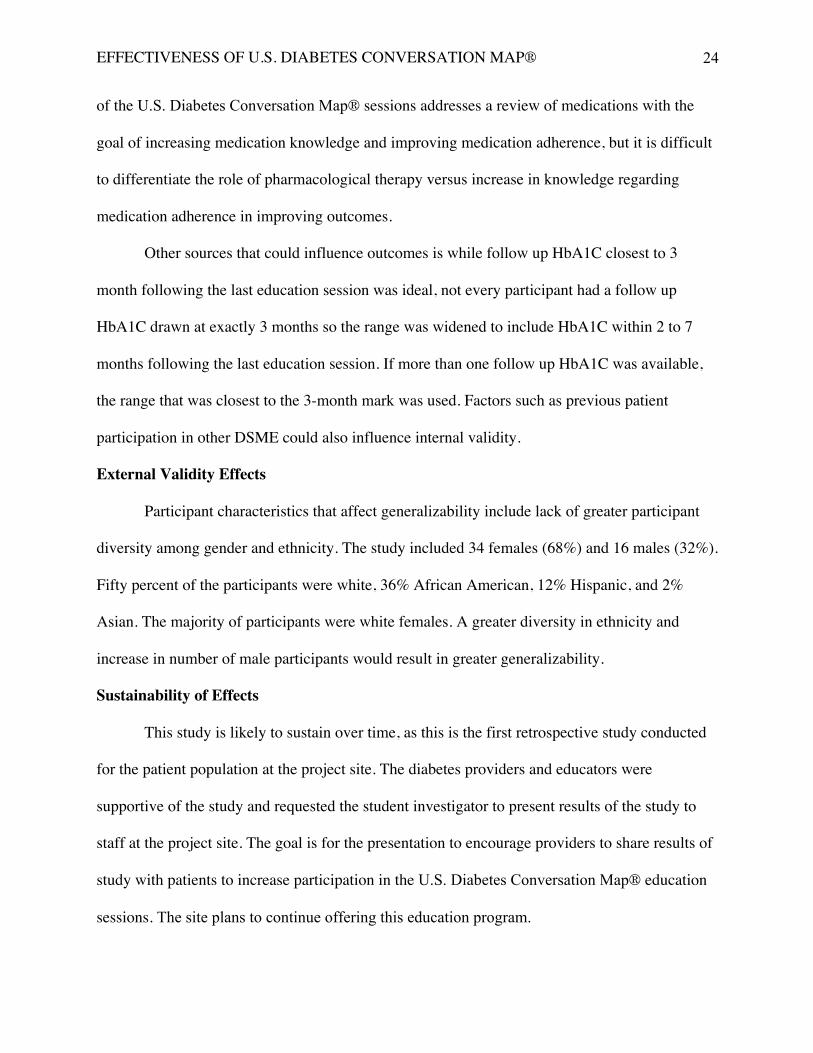
of the U.S. Diabetes Conversation Map® sessions addresses a review of medications with the
goal of increasing medication knowledge and improving medication adherence, but it is difficult
to differentiate the role of pharmacological therapy versus increase in knowledge regarding
medication adherence in improving outcomes.
Other sources that could influence outcomes is while follow up HbA1C closest to 3
month following the last education session was ideal, not every participant had a follow up
HbA1C drawn at exactly 3 months so the range was widened to include HbA1C within 2 to 7
months following the last education session. If more than one follow up HbA1C was available,
the range that was closest to the 3-month mark was used. Factors such as previous patient
participation in other DSME could also influence internal validity.
External Validity Effects
Participant characteristics that affect generalizability include lack of greater participant
diversity among gender and ethnicity. The study included 34 females (68%) and 16 males (32%).
Fifty percent of the participants were white, 36% African American, 12% Hispanic, and 2%
Asian. The majority of participants were white females. A greater diversity in ethnicity and
increase in number of male participants would result in greater generalizability.
Sustainability of Effects
This study is likely to sustain over time, as this is the first retrospective study conducted
for the patient population at the project site. The diabetes providers and educators were
supportive of the study and requested the student investigator to present results of the study to
staff at the project site. The goal is for the presentation to encourage providers to share results of
study with patients to increase participation in the U.S. Diabetes Conversation Map® education
sessions. The site plans to continue offering this education program.
EFFECTIVENESS OF U.S. DIABETES CONVERSATION MAP®
25
Efforts to Minimize Study Limitations
A major limitation included number of participants who did not complete all four
sessions or obtain follow up HbA1C. The original time frame for this retrospective study was to
review charts from 2016 to 2015 but due to number of participants who did not meet inclusion
criteria during the time frame, modified IRB approval was obtained to include charts dating back
to 2013. The time frame was widened to obtain a sample size of 50.
Interpretation
Expected and Actual Outcomes
The expected outcomes for this study were that participation in U.S. Diabetes
Conversation Map® education program would improve glycemic control. A significant
correlation was not expected between age, gender, ethnicity and improvement in follow up
HbA1C. The actual results showed significant improvement in follow up HbA1C from baseline
HbA1C. A decrease of 1.07 in follow up HbA1C was seen from baseline HbA1C. Standard
deviation of follow up HbA1C was 1.3277 compared to the 2.2507 of the baseline HbA1C. More
of the participant HbA1C was close to the mean of 7.342 for follow up HbA1C compared to the
wide variability seen in the baseline HbA1C. Sixty-eight-percent of the participants had an
improvement in follow up HbA1C shown by a decrease in HbA1C, 8% had the same result for
both baseline and follow up HbA1C and 24% had an increase in HbA1C from baseline, therefore
worsening glycemic control. As expected, no significant correlation was observed between
demographic data and improvement in HbA1C as expected.
Intervention Effectiveness
Factors that assisted with intervention effectiveness included availability of U.S. Diabetes
Conversation Map® sessions both during day and evening hours and at multiple locations. The
EFFECTIVENESS OF U.S. DIABETES CONVERSATION MAP®
26
cohort education groups started every two weeks to increase flexibility for participants. If a class
session was missed, the participant has the opportunity to join a different cohort for the missed
session. The sessions were held every other week instead of every week to allow for less
demanding time commitment. Participants are often more likely to commit to education sessions
that are two times a month instead of four times a month. U.S. Diabetes Conversation Map®
sessions can be effective in primary care, endocrinology and diabetes specialty clinics, and local
community locations such as YMCA. The program provides all the supplies required to teach the
sessions. Implementing U.S. Diabetes Conversation Map® at a site requires facilitators to attend
training sessions. No additional cost occurs to the site.
Intervention Revision
Intervention modifications that may improve outcomes are methods that promote
participation in all four sessions. During data collection, many participants were excluded from
study due to not completing all four sessions. Each session of the conversation map provides
valuable information for self-management care of diabetes. Increasing the number of days and
times classes are offered and offering classes on weekends may aid in improving patient
attendance at all 4 sessions.
Impact on Health, System, Cost, and Policy
Treatment of T2DM and associated complications is costly and results in an increased
economic burden. DSME programs such as U.S. Diabetes Conversation Map® aid in prevention,
management, and avoidance of long-term complications associated with T2DM. DSME
education is effective in reducing both the disease and economic burden of T2DM (Molsted,
Tribler, Poulsen, & Snorgaard, 2012). Participation in DSME programs results in decreased
visits to primary care providers regarding T2DM, decreased hospitalizations, and decreased risk
EFFECTIVENESS OF U.S. DIABETES CONVERSATION MAP®
27
of T2DM associated complications (Molsted et al., 2012). DSME is cost effective intervention
that can aid in decreasing the economic burden of T2DM.
A large number of research studies concluded that DSME is effective in improving
glycemic control and improving health outcomes. A standardized policy regarding implementing
DSME as part of routine care for every patient diagnosed with T2DM can be effective in
improving health outcomes and decreasing medical costs related to treatment of T2DM and
complications associated with it. There is a need for standardized polices regarding T2DM due to
the increasing prevalence rates of T2DM.
The current study was low cost. The highest cost associated with this study was for
dissemination of the project at a regional nursing conference. Funding for the conference was
provided by UMKC Women’s Council Graduate Assistant Fund. This funding was used for
conference fees and travel costs related to dissemination of project.
Conclusion
Practical Usefulness of Intervention
T2DM is a chronic disease that requires life long self-management. DSME programs aid
in increasing patient knowledge regarding the disease process and self-management education.
This retrospective chart review was conducted to determine the effectiveness of the current
DSME program using the U.S. Diabetes Conversation Map® currently utilized at the diabetes
clinic at the university medical center. The data shows significant improvement in follow up
HbA1C from baseline HbA1C following completion of this education program. This intervention
is practical due to ease and effectiveness of implementation. Increasing patient participation in
this education program can improve glycemic control by increasing patient knowledge and
improving adherence to positive behavior change.
EFFECTIVENESS OF U.S. DIABETES CONVERSATION MAP®
28
Further Study of Implementation Intervention
While short-term improvement in HbA1C following participation in the U.S. Diabetes
Conversation Map® is beneficial, long-term adherence to diabetes self-management education is
necessary for improved health outcomes. A follow up study measuring HbA1C levels at 1 year
will be beneficial in determining long term effectiveness of group based education on glycemic
control. Since factors such as changes in medication play a role in HbA1C, a study comparing
patients who receive usual diabetes care and patients who participate in U.S. Diabetes
Conversation Map® education sessions will be beneficial. Also, additional studies can be
conducted to determine barriers to adherence. Once barriers to adherence are identified,
measures can be taken to decrease barriers and promote adherence.
Dissemination
The project findings were disseminated at Eastern Nursing Research Society’s 2017
regional conference in Philadelphia on April 4, 2017 via poster presentation. The results were
also presented to the staff at the project site via poster presentation at monthly staff meeting.
Healthcare providers can utilize the findings of this project in practice to promote group based
patient education programs to improve the health of diabetic patients.
EFFECTIVENESS OF U.S. DIABETES CONVERSATION MAP®
29
References
Agardh, E., Allebeck, P., Hallqvist, J., Moradi, T., & Sidorchuk, A. (2011). Type 2 diabetes
incidence and socio-economic position: a systematic review and meta-
analysis. International Journal of Epidemiology, dyr029.
Albright, A. L., & Gregg, E. W. (2013). Preventing type 2 diabetes in communities across the
US: the National Diabetes Prevention Program. American Journal of Preventive
Medicine, 44(4), S346-S351.
American Diabetes Association. (2013). Economic costs of diabetes in the US in 2012. Diabetes
Care, 36(4), 1033-1046.
American Diabetes Assoication. (2016). Kansas City, Kansas. Alexandria, VA. Retrieved from
http://www.diabetes.org/in-my-community/local-offices/kansas-city
kansas/?referrer=https://www.google.com/ kansas/?referrer=https://www.google.com/
Berkman, N. D., Sheridan, S. L., Donahue, K. E., Halpern, D. J., & Crotty, K. (2011). Low
health literacy and health outcomes: an updated systematic review. Annals of Internal
Medicine, 155(2), 97-107.
Beverly, E. A., Fitzgerald, S. M., Brooks, K. M., Hultgren, B. A., Ganda, O. P., Munshi, M., &
Weinger, K. (2013). Impact of Reinforcement of Diabetes Self-Care on Poorly Controlled
Diabetes A Randomized Controlled Trial. The Diabetes Educator, 0145721713486837.
Bogner, H. R., Morales, K. H., de Vries, H. F., & Cappola, A. R. (2012). Integrated management
of type 2 diabetes mellitus and depression treatment to improve medication adherence: a
randomized controlled trial. The Annals of Family Medicine, 10(1), 15-22.
Braveman, P., Cubbin, C., Egerter, S., Williams, D., & Pamuk, E. (2010). Socioeconomic
EFFECTIVENESS OF U.S. DIABETES CONVERSATION MAP®
30
disparities in health in the United States: what the patterns tell us. American Journal of
Public Health, 100, S186-S196
Casagrande, S. S., Fradkin, J. E., Saydah, S. H., Rust, K. F., & Cowie, C. C. (2013). The
prevalence of meeting A1C, blood pressure, and LDL goals among people with diabetes,
1988–2010. Diabetes Care, 36(8), 2271-2279.
Centers for Disease Control and Prevention (CDC), & Centers for Disease Control and
Prevention (CDC). (2011). National diabetes fact sheet: National estimates and general
information on diabetes and pre-diabetes in the United States.
Centers for Disease Control and Prevention (2014). National Diabetes Statistics Report:
Estimates of Diabetes and Its Burden in the United States, 2014. Atlanta, GA. Retrieved
from http://www.cdc.gov/diabetes/pubs/statsreport14.htm
Champion, V. L., & Skinner, C. S. (2008). The health belief model. Health behaviour and health
education; theory, research, and practice, 45-65.
Chen, S. M., Creedy, D., Lin, H. S., & Wollin, J. (2012). Effects of motivational interviewing
intervention on self-management, psychological and glycemic outcomes in type 2
diabetes: a randomized controlled trial .International Journal of Nursing Studies, 49(6),
637-644.
Committee on Health Literacy, Institute of Medicine. (2004). In L.N. Nielson-Bohlman, A.M.
Panzer, & D. A. Kindig (Eds.), Health literacy: A prescription to end confusion.
Washington, DC: The National Academics Press.
Crawford, P., & Wiltz, S. (2015). Participation in the journey to life conversation map improves
control of hypertension, diabetes, and hypercholesterolemia. The Journal of the American
Board of Family Medicine, 28(6), 767-771
EFFECTIVENESS OF U.S. DIABETES CONVERSATION MAP®
31
Dunkley, A. J., Bodicoat, D. H., Greaves, C. J., Russell, C., Yates, T., Davies, M. J., & Khunti,
K. (2014). Diabetes prevention in the real world: effectiveness of pragmatic lifestyle
interventions for the prevention of type 2 diabetes and of the impact of adherence to
guideline recommendations a systematic review and meta-analysis. Diabetes Care, 37(4),
922-933.
Fernandes, O. D., Von Worley, A., Sperl-Hillen, J., Beaton, S. J., Lavin-Tompkins, J., &
Glasrud, P. (2010). Educator experience with the US Diabetes Conversation Map®
education program in the journey for control of diabetes: the IDEA study. Diabetes
Spectrum, 23(3), 194-198.
Gucciardi, E., DeMelo, M., Offenheim, A., Grace, S.L., & Steward, D.E. (2007). Patient factors
associated with attrition from a self-management education programme. Journal of
Evaluation in Clinical Practice, 13(6), 913-919. doi: 10.1111/j.1365-2753.2006.00773.x
Haas, L., Maryniuk, M., Beck, J., Cox, C. E., Duker, P., Edwards, L., ... & McLaughlin, S.
(2013). National standards for diabetes self-management education and support. Diabetes
Care,36 (Supplement 1), S100-S108.
Hessler, D., Fisher, L., Glasgow, R.E., Strycker, L.A., Dickinson, L.M., Arean, P.A., &
Mashariani, U. (2013). Reductions in regimen distress are associated with improved
management and glycemic control over time. Diabetes Care, 31, 142-156
King, D. K., Glasgow, R. E., Toobert, D. J., Strycker, L. A., Estabrooks, P. A., Osuna, D., &
Faber, A. J. (2010). Self-efficacy, problem solving, and social-environmental support are
associated with diabetes self-management behaviors. Diabetes Care, 33(4), 751-753.
Kutner, M., Greenburg, E., Jin, Y., & Paulsen, C. (2006). The Health Literacy of America's
EFFECTIVENESS OF U.S. DIABETES CONVERSATION MAP®
32
Adults: Results from the 2003 National Assessment of Adult Literacy. NCES 2006-
483. National Center for Education Statistics.
Liu, L., Min Jie, L., & Brateanu, A. (2014). Improved A1C and Lipid Profile in Patients Referred
to Diabetes Education Programs in a Wide Health Care Network: A Retrospective
Study. Diabetes Spectrum, 27(4), 297-303 7p.
Lorenzo, L. (2013). Partnering with patients to promote holistic diabetes management: changing
paradigms. Journal of the American Association of Nurse Practitioners, 25(7), 351-361
Long, G. H., Cooper, A. J., Wareham, N. J., Griffin, S. J., & Simmons, R. K. (2014). Healthy
behavior change and cardiovascular outcomes in newly diagnosed type 2 diabetic
patients: a cohort analysis of the ADDITION-Cambridge study. Diabetes Care, 37(6),
1712-1720
Molsted, S., Tribler, J., Poulsen, P. B., & Snorgaard, O. (2012). The effects and costs of a group-
based education programme for self-management of patients with Type 2 diabetes. A
community-based study. Health Education Research, 27(5), 804-813.
Psaltopoulou, T., Ilias, I., & Alevizaki, M. (2010). The role of diet and lifestyle in primary,
secondary, and tertiary diabetes prevention: a review of meta-analyses. The review of
Diabetic Studies: RDS, 7(1), 26.
Reaney, M., Eichorst, B., & Gorman, P. (2012). From acorns to oak trees: the development and
theoretical underpinnings of diabetes Conversation Map education tools. Diabetes
Spectrum, 25(2), 111-116.
Reaney, M., Zorzo, E. G., Golay, A., Hermanns, N., Cleall, S., Petzinger, U., & Koivisto, V.

EFFECTIVENESS OF U.S. DIABETES CONVERSATION MAP®
33
(2013). Impact of Conversation Map™ education tools versus regular care on diabetes-
related knowledge of people with type 2 diabetes: a randomized, controlled
study. Diabetes Spectrum, 26(4), 236-245.
Rise, M. B., Pellerud, A., Rygg, L. Ø., & Steinsbekk, A. (2013). Making and maintaining
lifestyle changes after participating in group based type 2 diabetes self-management
educations: a qualitative study. PLoS One, 8(5), e64009.
Rosenstock, I.M., Strecher, V.J., & Becker, M.H. (1988). Social learning theory and the health
belief model. Health Education and Behavior, 15(2), 175-183. doi:
10.1177/109019818801500203
Schaffer, M. A., Sandau, K. E., & Diedrick, L. (2013). Evidence‐based practice models for
organizational change: overview and practical applications. Journal of Advanced
Nursing, 69(5), 1197-1209.
Sepers, C. E., Fawcett, S. B., Lipman, R., Schultz, J., Colie-Akers, V., & Perez, A. (2015).
Measuring the Implementation and Effects of a Coordinated Care Model Featuring
Diabetes Self-management Education Within Four Patient-Centered Medical
Homes. Diabetes Educator, 41(3), 328-342 15p. doi:10.1177/0145721715577638
Sherr, D., & Lipman, R. D. (2015). The Diabetes Educator and the Diabetes Self-management
Education Engagement The 2015 National Practice Survey. The Diabetes
Educator, 41(5), 616-624.
Sperl-Hillen, J., Beaton, S., Fernandes, O., Von Worley, A., Vazquez-Benitez, G., Parker, E., ...
& Adams, K. (2011). Comparative effectiveness of patient education methods for type 2
diabetes: a randomized controlled trial. Archives of Internal Medicine, 171(22), 2001-
2010
EFFECTIVENESS OF U.S. DIABETES CONVERSATION MAP®
34
Swavely, D., Vorderstrasse, A., Maldonado, E., Eid, S., & Etchason, J. (2014). Implementation
and evaluation of a low health literacy and culturally sensitive diabetes education
program. Journal for Healthcare Quality, 36(6), 16-23.
Takahashi, Y., Nishida, Y., & Asai, S. (2012). Utilization of health care databases for
pharmacoepidemiology. European journal of clinical pharmacology, 68(2), 123-129.
U.S. Department of Health and Human Services. Office of Disease Prevention and Health
Promotion. (2011). Healthy People 2020. Washington, DC. Retrieved from
https://www.healthypeople.gov/2020/topics-objectives/topic/diabetes
Utz, S.W., Steeves, R.H., Wenzel, J., Hinton, I., Jones, R.A., Andrews, D. (2006). “Working
hard with it” self-management of type 2 diabetes by rural African Americans. Family and
Community Health, 29, 195-205.
Wolever, R. Q., Dreusicke, M., Fikkan, J., Hawkins, T. V., Yeung, S., Wakefield, J., ... &
Skinner, E. (2010). Integrative health coaching for patients with type 2 diabetes a
randomized clinical trial. The Diabetes Educator,36(4), 629-639.
Young, H., Miyamoto, S., Ward, D., Dharmar, M., Tang-Feldman, Y., & Berglund, L. (2014).
Sustained effects of a nurse coaching intervention via telehealth to improve health
behavior change in diabetes. Telemedicine and E-Health, 20(9), 828-834.
Zanetti, G. G., Hodniki, P. P., & de Moraes, C. (2013). Investigating telephone support as a
strategy to increase the physical activity levels of people with diabetes. Journal of
Diabetes Nursing, 18, 32-6.
EFFECTIVENESS OF U.S. DIABETES CONVERSATION MAP®
35
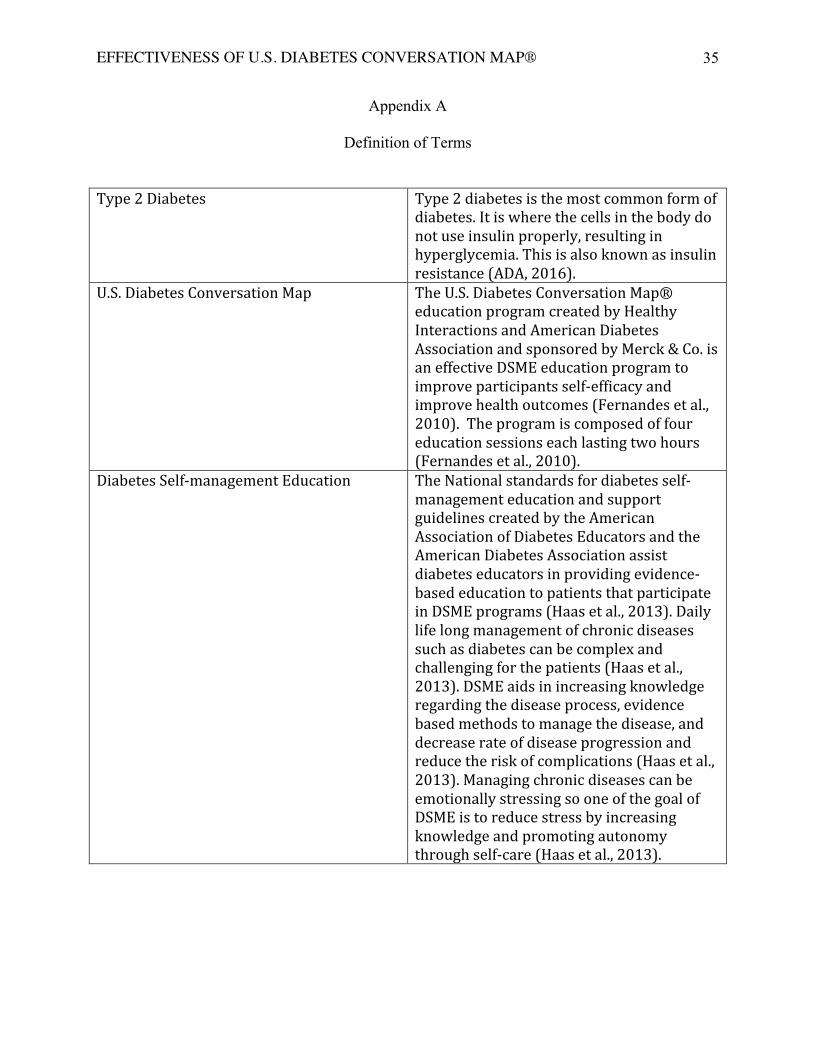
Appendix A
Definition of Terms
Type 2 Diabetes Type 2 diabetes is the most common form of diabetes. It is where the cells in the body do not use insulin properly, resulting in hyperglycemia. This is also known as insulin resistance (ADA, 2016).
U.S. Diabetes Conversation Map The U.S. Diabetes Conversation Map® education program created by Healthy Interactions and American Diabetes Association and sponsored by Merck & Co. is an effective DSME education program to improve participants self-‐efficacy and improve health outcomes (Fernandes et al., 2010). The program is composed of four education sessions each lasting two hours (Fernandes et al., 2010).
Diabetes Self-‐management Education The National standards for diabetes self-‐management education and support guidelines created by the American Association of Diabetes Educators and the American Diabetes Association assist diabetes educators in providing evidence-‐based education to patients that participate in DSME programs (Haas et al., 2013). Daily life long management of chronic diseases such as diabetes can be complex and challenging for the patients (Haas et al., 2013). DSME aids in increasing knowledge regarding the disease process, evidence based methods to manage the disease, and decrease rate of disease progression and reduce the risk of complications (Haas et al., 2013). Managing chronic diseases can be emotionally stressing so one of the goal of DSME is to reduce stress by increasing knowledge and promoting autonomy through self-‐care (Haas et al., 2013).
EFFECTIVENESS OF U.S. DIABETES CONVERSATION MAP®
36
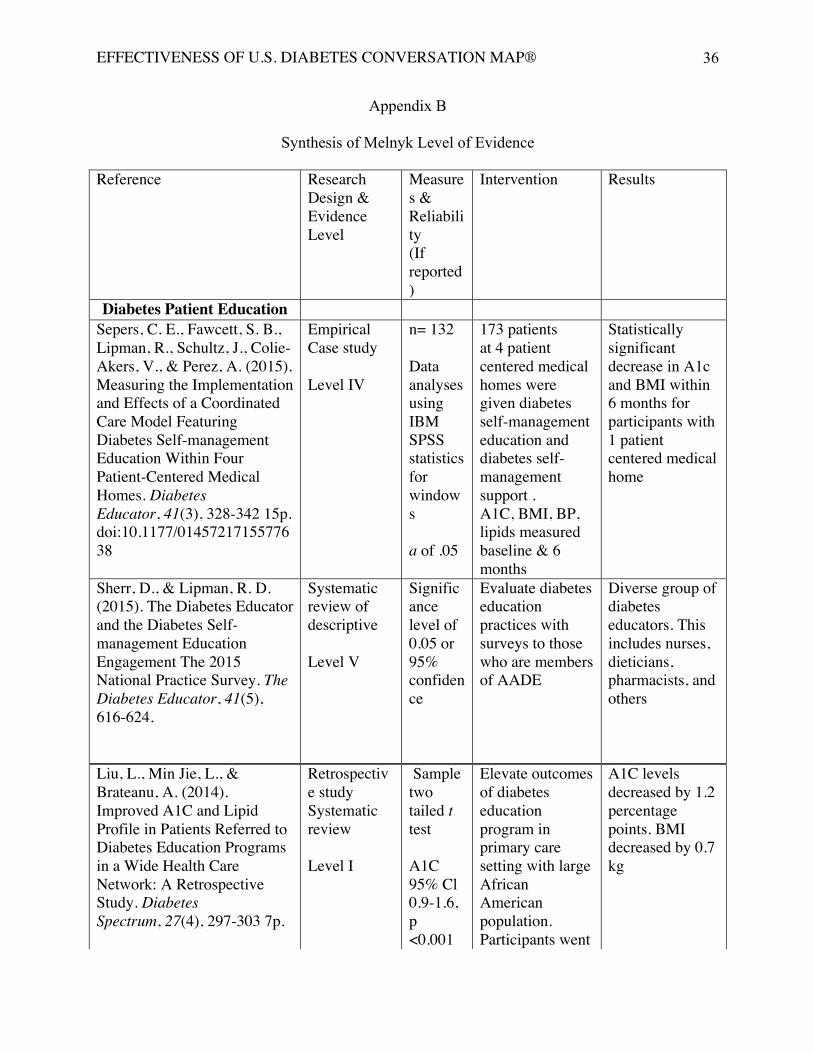
Appendix B
Synthesis of Melnyk Level of Evidence Reference
Research Design & Evidence Level
Measures & Reliability (If reported)
Intervention Results
Diabetes Patient Education Sepers, C. E., Fawcett, S. B., Lipman, R., Schultz, J., Colie-Akers, V., & Perez, A. (2015). Measuring the Implementation and Effects of a Coordinated Care Model Featuring Diabetes Self-management Education Within Four Patient-Centered Medical Homes. Diabetes Educator, 41(3), 328-342 15p. doi:10.1177/0145721715577638
Empirical Case study Level IV
n= 132 Data analyses using IBM SPSS statistics for windows a of .05
173 patients at 4 patient centered medical homes were given diabetes self-management education and diabetes self-management support . A1C, BMI, BP, lipids measured baseline & 6 months
Statistically significant decrease in A1c and BMI within 6 months for participants with 1 patient centered medical home
Sherr, D., & Lipman, R. D. (2015). The Diabetes Educator and the Diabetes Self-management Education Engagement The 2015 National Practice Survey. The Diabetes Educator, 41(5), 616-624.
Systematic review of descriptive Level V
Significance level of 0.05 or 95% confidence
Evaluate diabetes education practices with surveys to those who are members of AADE
Diverse group of diabetes educators. This includes nurses, dieticians, pharmacists, and others
Liu, L., Min Jie, L., & Brateanu, A. (2014). Improved A1C and Lipid Profile in Patients Referred to Diabetes Education Programs in a Wide Health Care Network: A Retrospective Study. Diabetes Spectrum, 27(4), 297-303 7p.
Liu, L., Min Jie, L., & Brateanu, A. (2014). Improved A1C and Lipid Profile in Patients Referred to Diabetes Education Programs in a Wide Health Care Network: A Retrospective Study. Diabetes Spectrum, 27(4), 297-303 7p.
Retrospective study Systematic review Level I
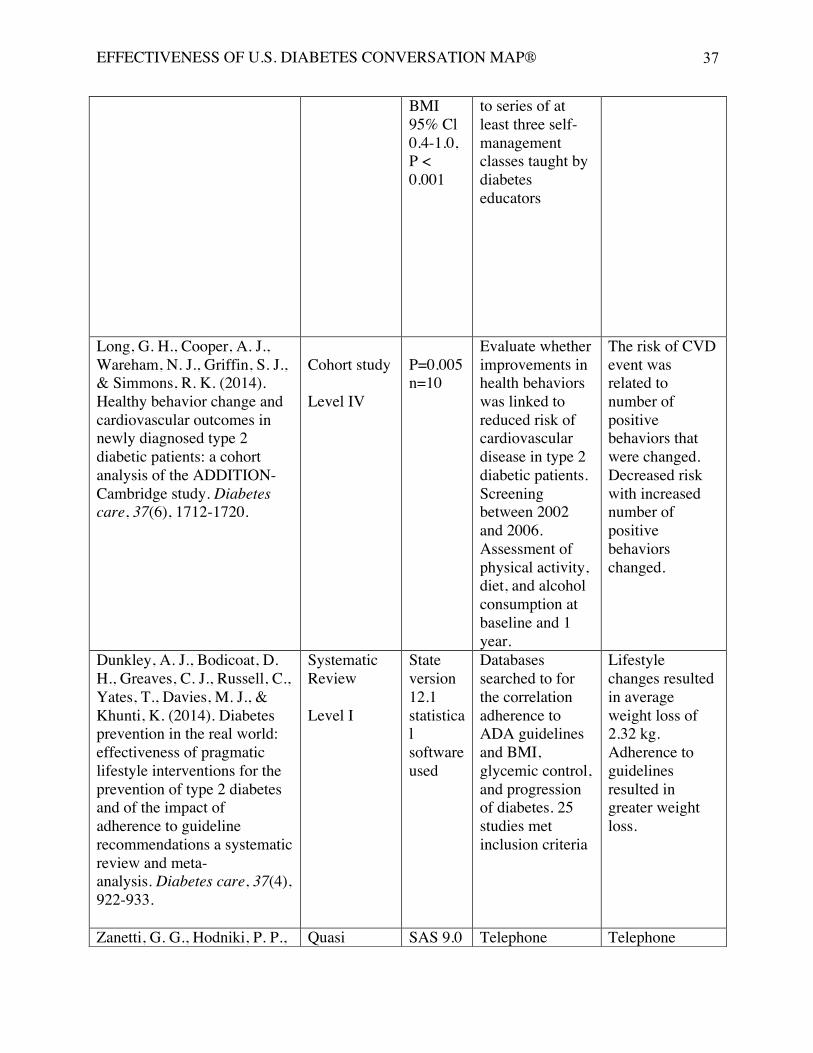
Sample two tailed t test A1C 95% Cl 0.9-1.6, p <0.001
Elevate outcomes of diabetes education program in primary care setting with large African American population. Participants went
A1C levels decreased by 1.2 percentage points. BMI decreased by 0.7 kg
EFFECTIVENESS OF U.S. DIABETES CONVERSATION MAP®
37
BMI 95% Cl 0.4-1.0, P < 0.001
to series of at least three self-management classes taught by diabetes educators
Long, G. H., Cooper, A. J., Wareham, N. J., Griffin, S. J., & Simmons, R. K. (2014). Healthy behavior change and cardiovascular outcomes in newly diagnosed type 2 diabetic patients: a cohort analysis of the ADDITION-Cambridge study. Diabetes care, 37(6), 1712-1720.
Cohort study Level IV
P=0.005 n=10
Evaluate whether improvements in health behaviors was linked to reduced risk of cardiovascular disease in type 2 diabetic patients. Screening between 2002 and 2006. Assessment of physical activity, diet, and alcohol consumption at baseline and 1 year.
The risk of CVD event was related to number of positive behaviors that were changed. Decreased risk with increased number of positive behaviors changed.
Dunkley, A. J., Bodicoat, D. H., Greaves, C. J., Russell, C., Yates, T., Davies, M. J., & Khunti, K. (2014). Diabetes prevention in the real world: effectiveness of pragmatic lifestyle interventions for the prevention of type 2 diabetes and of the impact of adherence to guideline recommendations a systematic review and meta-analysis. Diabetes care, 37(4), 922-933.
Systematic Review Level I
State version 12.1 statistical software used
Databases searched to for the correlation adherence to ADA guidelines and BMI, glycemic control, and progression of diabetes. 25 studies met inclusion criteria
Lifestyle changes resulted in average weight loss of 2.32 kg. Adherence to guidelines resulted in greater weight loss.
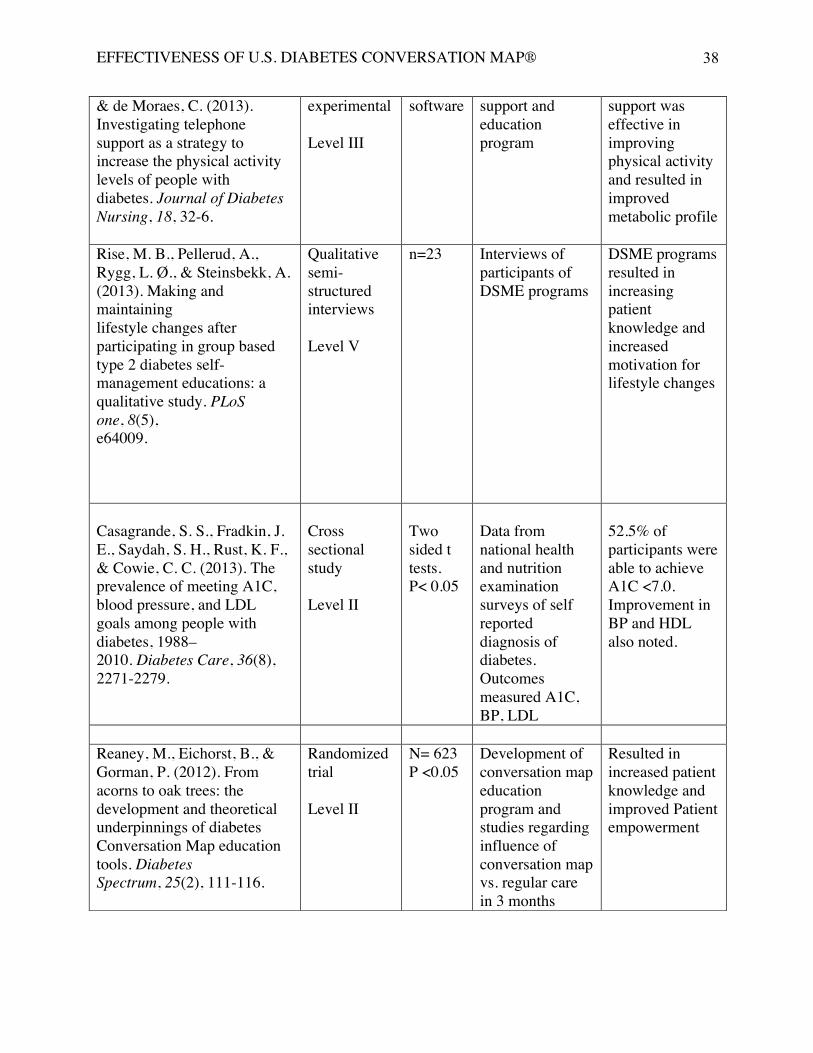
Zanetti, G. G., Hodniki, P. P., Quasi SAS 9.0 Telephone Telephone
EFFECTIVENESS OF U.S. DIABETES CONVERSATION MAP®
38
& de Moraes, C. (2013). Investigating telephone support as a strategy to increase the physical activity levels of people with diabetes. Journal of Diabetes Nursing, 18, 32-6.
experimental Level III
software support and education program
support was effective in improving physical activity and resulted in improved metabolic profile
Rise, M. B., Pellerud, A., Rygg, L. Ø., & Steinsbekk, A. (2013). Making and maintaining lifestyle changes after participating in group based type 2 diabetes self-management educations: a qualitative study. PLoS one, 8(5), e64009.
Qualitative semi-structured interviews Level V
n=23 Interviews of participants of DSME programs
DSME programs resulted in increasing patient knowledge and increased motivation for lifestyle changes
Casagrande, S. S., Fradkin, J. E., Saydah, S. H., Rust, K. F., & Cowie, C. C. (2013). The prevalence of meeting A1C, blood pressure, and LDL goals among people with diabetes, 1988–2010. Diabetes Care, 36(8), 2271-2279.
Cross sectional study Level II
Two sided t tests. P< 0.05
Data from national health and nutrition examination surveys of self reported diagnosis of diabetes. Outcomes measured A1C, BP, LDL
52.5% of participants were able to achieve A1C <7.0. Improvement in BP and HDL also noted.
Reaney, M., Eichorst, B., & Gorman, P. (2012). From acorns to oak trees: the development and theoretical underpinnings of diabetes Conversation Map education tools. Diabetes Spectrum, 25(2), 111-116.
Randomized trial Level II
N= 623 P <0.05
Development of conversation map education program and studies regarding influence of conversation map vs. regular care in 3 months
Resulted in increased patient knowledge and improved Patient empowerment
EFFECTIVENESS OF U.S. DIABETES CONVERSATION MAP®
39
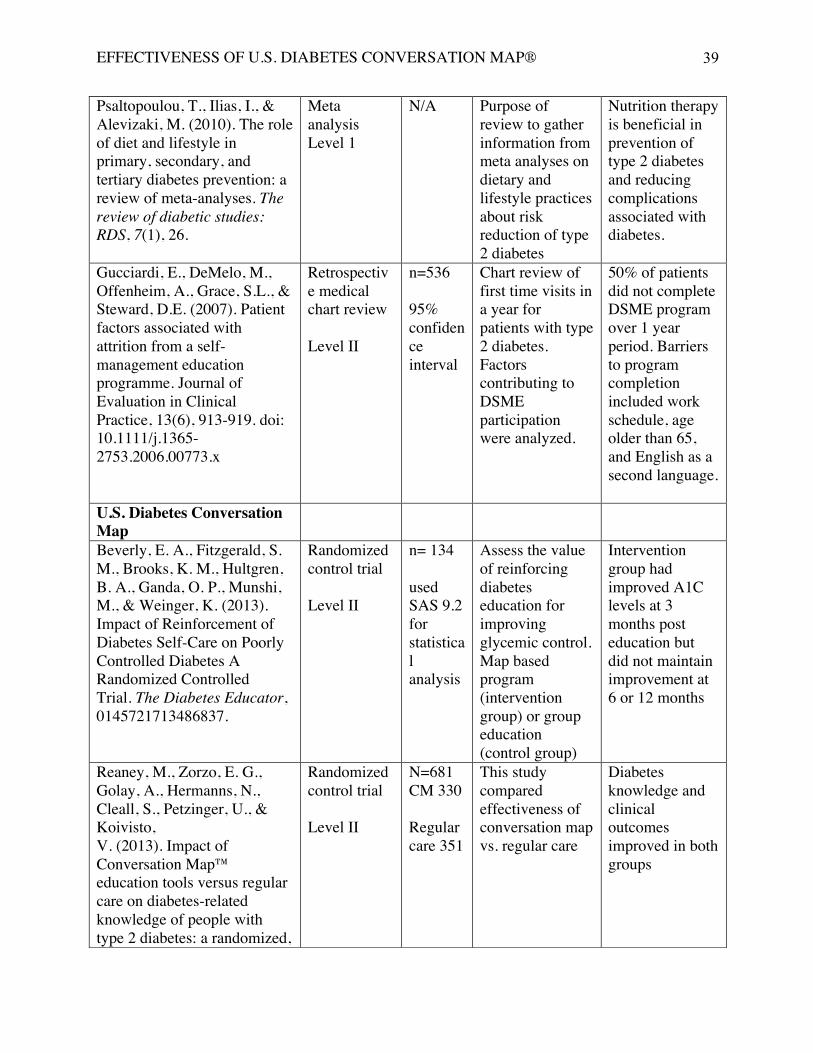
Psaltopoulou, T., Ilias, I., & Alevizaki, M. (2010). The role of diet and lifestyle in primary, secondary, and tertiary diabetes prevention: a review of meta-analyses. The review of diabetic studies: RDS, 7(1), 26.
Meta analysis Level 1
N/A Purpose of review to gather information from meta analyses on dietary and lifestyle practices about risk reduction of type 2 diabetes
Nutrition therapy is beneficial in prevention of type 2 diabetes and reducing complications associated with diabetes.
Gucciardi, E., DeMelo, M., Offenheim, A., Grace, S.L., & Steward, D.E. (2007). Patient factors associated with attrition from a self-management education programme. Journal of Evaluation in Clinical Practice, 13(6), 913-919. doi: 10.1111/j.1365-2753.2006.00773.x
Retrospective medical chart review Level II
n=536 95% confidence interval
Chart review of first time visits in a year for patients with type 2 diabetes. Factors contributing to DSME participation were analyzed.
50% of patients did not complete DSME program over 1 year period. Barriers to program completion included work schedule, age older than 65, and English as a second language.
U.S. Diabetes Conversation Map
Beverly, E. A., Fitzgerald, S. M., Brooks, K. M., Hultgren, B. A., Ganda, O. P., Munshi, M., & Weinger, K. (2013). Impact of Reinforcement of Diabetes Self-Care on Poorly Controlled Diabetes A Randomized Controlled Trial. The Diabetes Educator, 0145721713486837.
Randomized control trial Level II
n= 134 used SAS 9.2 for statistical analysis
Assess the value of reinforcing diabetes education for improving glycemic control. Map based program (intervention group) or group education (control group)
Intervention group had improved A1C levels at 3 months post education but did not maintain improvement at 6 or 12 months
Reaney, M., Zorzo, E. G., Golay, A., Hermanns, N., Cleall, S., Petzinger, U., & Koivisto, V. (2013). Impact of Conversation Map™ education tools versus regular care on diabetes-related knowledge of people with type 2 diabetes: a randomized,
Randomized control trial Level II
N=681 CM 330 Regular care 351
This study compared effectiveness of conversation map vs. regular care
Diabetes knowledge and clinical outcomes improved in both groups
EFFECTIVENESS OF U.S. DIABETES CONVERSATION MAP®
40
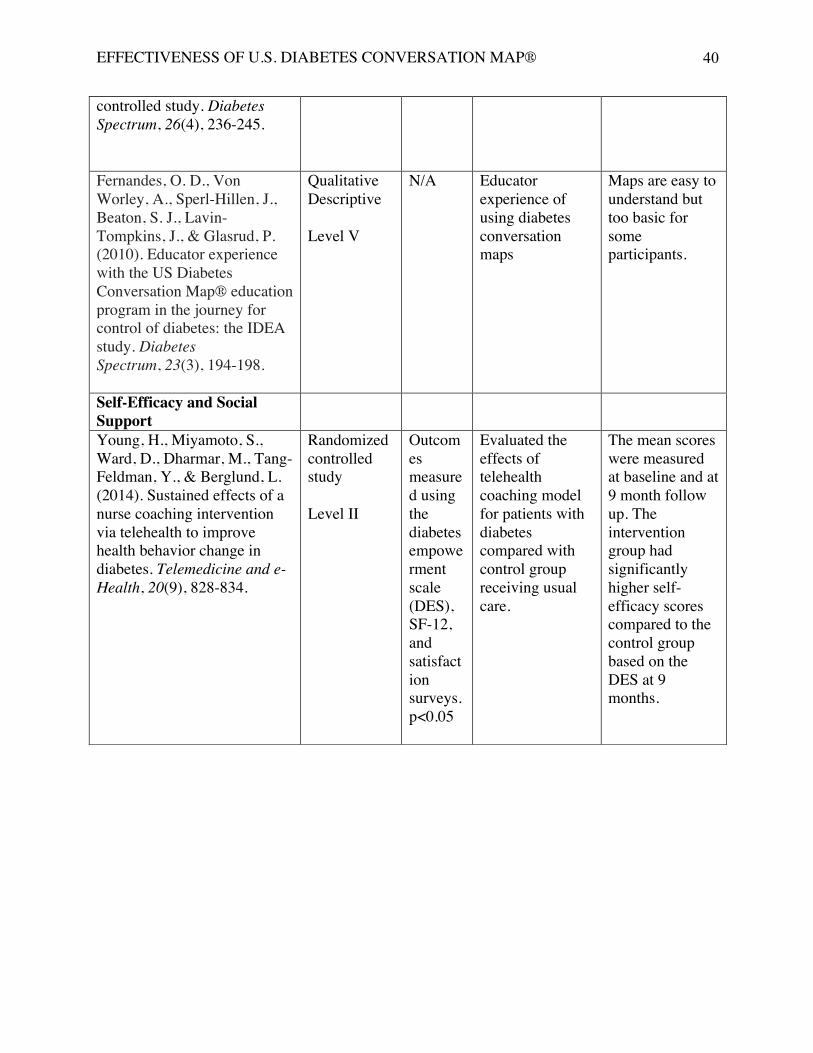
controlled study. Diabetes Spectrum, 26(4), 236-245.
Fernandes, O. D., Von Worley, A., Sperl-Hillen, J., Beaton, S. J., Lavin-Tompkins, J., & Glasrud, P. (2010). Educator experience with the US Diabetes Conversation Map® education program in the journey for control of diabetes: the IDEA study. Diabetes Spectrum, 23(3), 194-198.
Qualitative Descriptive Level V
N/A Educator experience of using diabetes conversation maps
Maps are easy to understand but too basic for some participants.
Self-Efficacy and Social Support
Young, H., Miyamoto, S., Ward, D., Dharmar, M., Tang-Feldman, Y., & Berglund, L. (2014). Sustained effects of a nurse coaching intervention via telehealth to improve health behavior change in diabetes. Telemedicine and e-Health, 20(9), 828-834.
Randomized controlled study Level II
Outcomes measured using the diabetes empowerment scale (DES), SF-12, and satisfaction surveys. p<0.05
Evaluated the effects of telehealth coaching model for patients with diabetes compared with control group receiving usual care.
The mean scores were measured at baseline and at 9 month follow up. The intervention group had significantly higher self-efficacy scores compared to the control group based on the DES at 9 months.
EFFECTIVENESS OF U.S. DIABETES CONVERSATION MAP®
41
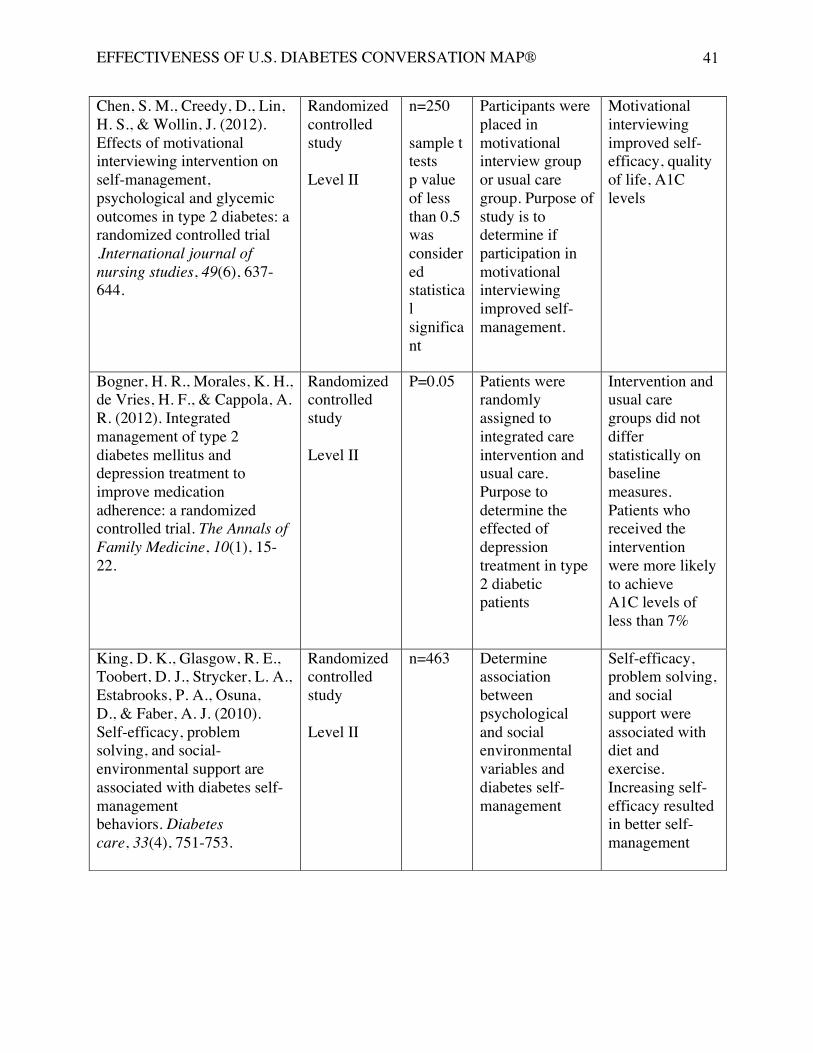
Chen, S. M., Creedy, D., Lin, H. S., & Wollin, J. (2012). Effects of motivational interviewing intervention on self-management, psychological and glycemic outcomes in type 2 diabetes: a randomized controlled trial .International journal of nursing studies, 49(6), 637-644.
Randomized controlled study Level II
n=250 sample t tests p value of less than 0.5 was considered statistical significant
Participants were placed in motivational interview group or usual care group. Purpose of study is to determine if participation in motivational interviewing improved self-management.
Motivational interviewing improved self-efficacy, quality of life, A1C levels
Bogner, H. R., Morales, K. H., de Vries, H. F., & Cappola, A. R. (2012). Integrated management of type 2 diabetes mellitus and depression treatment to improve medication adherence: a randomized controlled trial. The Annals of Family Medicine, 10(1), 15-22.
Randomized controlled study Level II
P=0.05 Patients were randomly assigned to integrated care intervention and usual care. Purpose to determine the effected of depression treatment in type 2 diabetic patients
Intervention and usual care groups did not differ statistically on baseline measures. Patients who received the intervention were more likely to achieve A1C levels of less than 7%
King, D. K., Glasgow, R. E., Toobert, D. J., Strycker, L. A., Estabrooks, P. A., Osuna, D., & Faber, A. J. (2010). Self-efficacy, problem solving, and social-environmental support are associated with diabetes self-management behaviors. Diabetes care, 33(4), 751-753.
Randomized controlled study Level II
n=463
Determine association between psychological and social environmental variables and diabetes self-management
Self-efficacy, problem solving, and social support were associated with diet and exercise. Increasing self-efficacy resulted in better self-management
EFFECTIVENESS OF U.S. DIABETES CONVERSATION MAP®
42
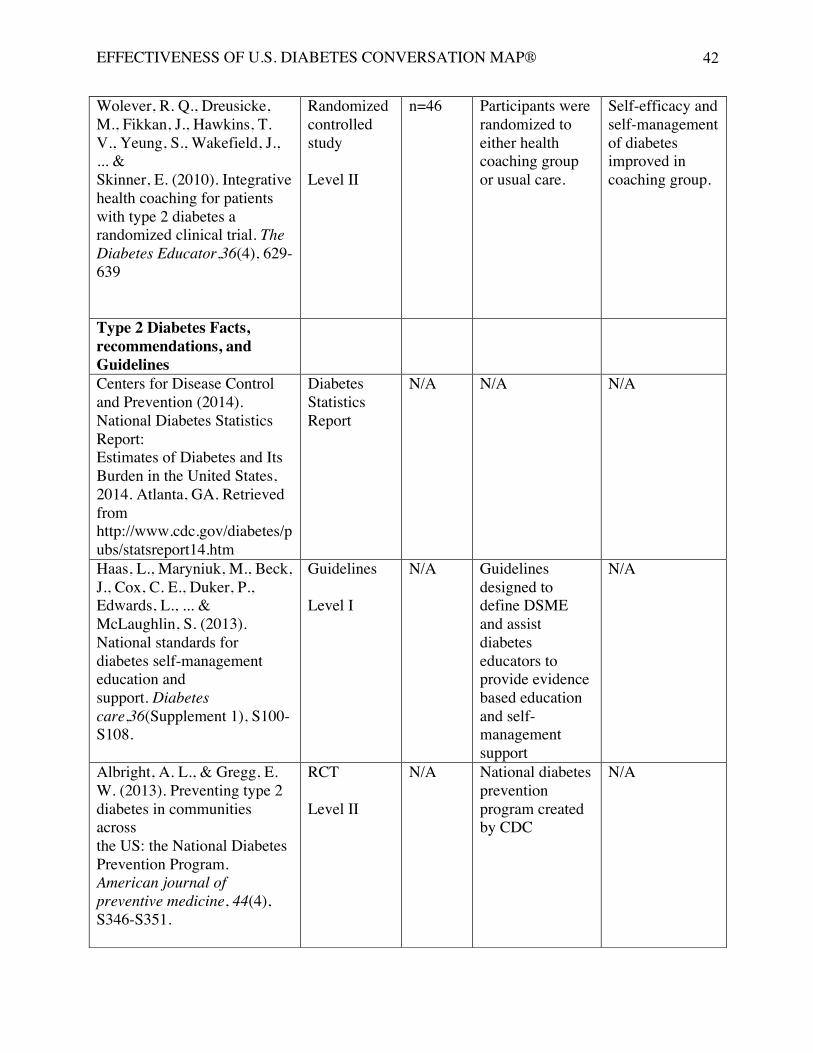
Wolever, R. Q., Dreusicke, M., Fikkan, J., Hawkins, T. V., Yeung, S., Wakefield, J., ... & Skinner, E. (2010). Integrative health coaching for patients with type 2 diabetes a randomized clinical trial. The Diabetes Educator,36(4), 629-639
Randomized controlled study Level II
n=46 Participants were randomized to either health coaching group or usual care.
Self-efficacy and self-management of diabetes improved in coaching group.
Type 2 Diabetes Facts, recommendations, and Guidelines
Centers for Disease Control and Prevention (2014). National Diabetes Statistics Report: Estimates of Diabetes and Its Burden in the United States, 2014. Atlanta, GA. Retrieved from http://www.cdc.gov/diabetes/pubs/statsreport14.htm
Diabetes Statistics Report
N/A N/A N/A
Haas, L., Maryniuk, M., Beck, J., Cox, C. E., Duker, P., Edwards, L., ... & McLaughlin, S. (2013). National standards for diabetes self-management education and support. Diabetes care,36(Supplement 1), S100-S108.
Guidelines Level I
N/A Guidelines designed to define DSME and assist diabetes educators to provide evidence based education and self-management support
N/A
Albright, A. L., & Gregg, E. W. (2013). Preventing type 2 diabetes in communities across the US: the National Diabetes Prevention Program. American journal of preventive medicine, 44(4), S346-S351.
RCT Level II
N/A National diabetes prevention program created by CDC
N/A
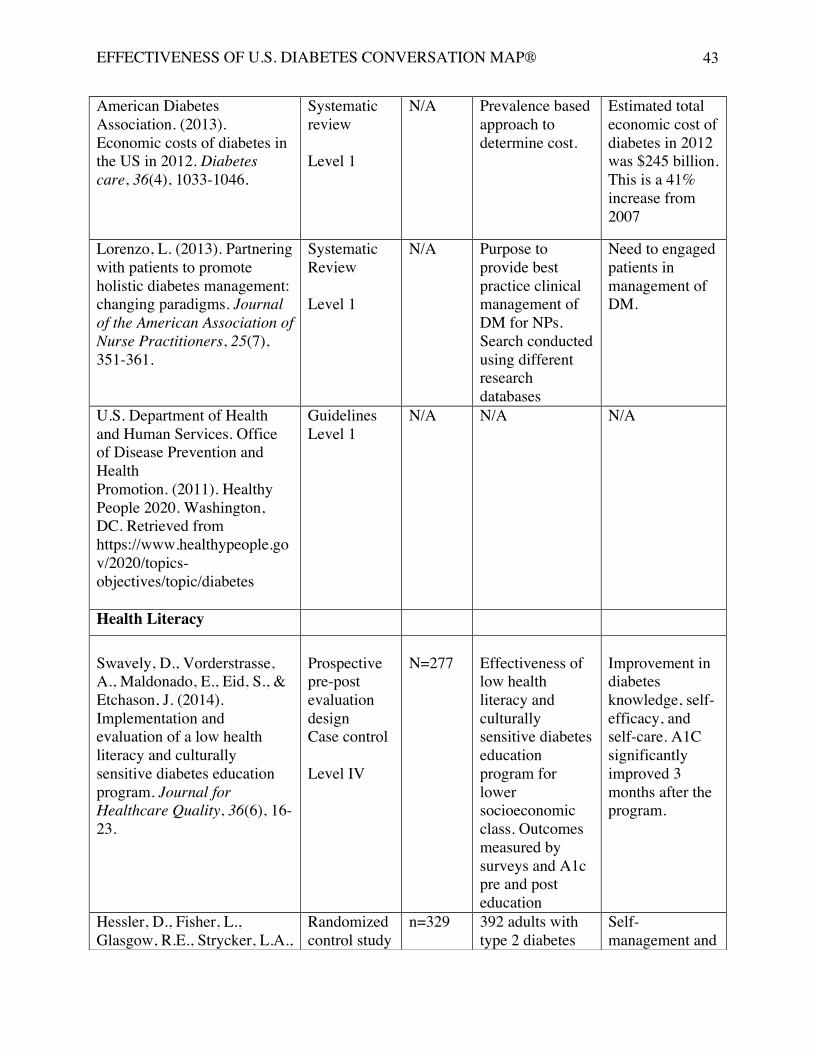
EFFECTIVENESS OF U.S. DIABETES CONVERSATION MAP®
43
American Diabetes Association. (2013). Economic costs of diabetes in the US in 2012. Diabetes care, 36(4), 1033-1046.
Systematic review Level 1
N/A Prevalence based approach to determine cost.
Estimated total economic cost of diabetes in 2012 was $245 billion. This is a 41% increase from 2007
Lorenzo, L. (2013). Partnering with patients to promote holistic diabetes management: changing paradigms. Journal of the American Association of Nurse Practitioners, 25(7), 351-361.
Systematic Review Level 1
N/A Purpose to provide best practice clinical management of DM for NPs. Search conducted using different research databases
Need to engaged patients in management of DM.
U.S. Department of Health and Human Services. Office of Disease Prevention and Health Promotion. (2011). Healthy People 2020. Washington, DC. Retrieved from https://www.healthypeople.gov/2020/topics-objectives/topic/diabetes
Guidelines Level 1
N/A N/A N/A
Health Literacy Swavely, D., Vorderstrasse, A., Maldonado, E., Eid, S., & Etchason, J. (2014). Implementation and evaluation of a low health literacy and culturally sensitive diabetes education program. Journal for Healthcare Quality, 36(6), 16-23.
Prospective pre-post evaluation design Case control Level IV
N=277
Effectiveness of low health literacy and culturally sensitive diabetes education program for lower socioeconomic class. Outcomes measured by surveys and A1c pre and post education
Improvement in diabetes knowledge, self-efficacy, and self-care. A1C significantly improved 3 months after the program.
Hessler, D., Fisher, L., Glasgow, R.E., Strycker, L.A.,
Randomized control study
n=329
392 adults with type 2 diabetes
Self-management and
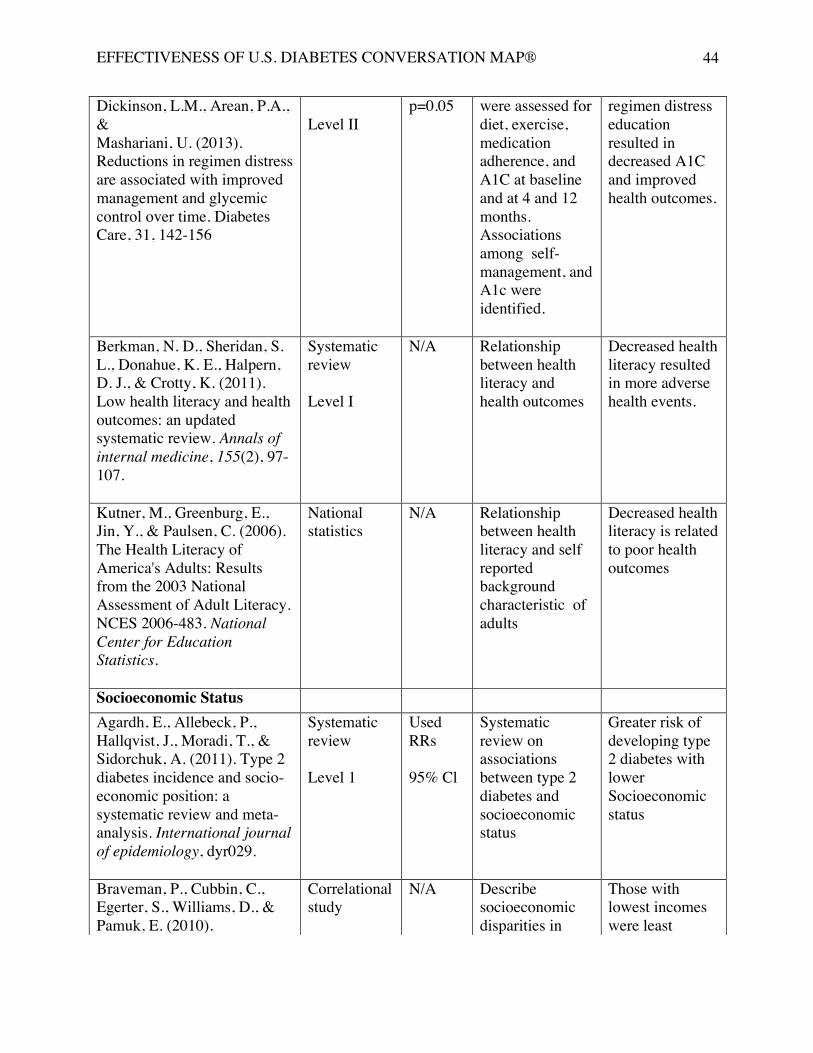
EFFECTIVENESS OF U.S. DIABETES CONVERSATION MAP®
44
Dickinson, L.M., Arean, P.A., & Mashariani, U. (2013). Reductions in regimen distress are associated with improved management and glycemic control over time. Diabetes Care, 31, 142-156
Level II
p=0.05 were assessed for diet, exercise, medication adherence, and A1C at baseline and at 4 and 12 months. Associations among self-management, and A1c were identified.
regimen distress education resulted in decreased A1C and improved health outcomes.
Berkman, N. D., Sheridan, S. L., Donahue, K. E., Halpern, D. J., & Crotty, K. (2011). Low health literacy and health outcomes: an updated systematic review. Annals of internal medicine, 155(2), 97-107.
Systematic review Level I
N/A Relationship between health literacy and health outcomes
Decreased health literacy resulted in more adverse health events.
Kutner, M., Greenburg, E., Jin, Y., & Paulsen, C. (2006). The Health Literacy of America's Adults: Results from the 2003 National Assessment of Adult Literacy. NCES 2006-483. National Center for Education Statistics.
National statistics
N/A Relationship between health literacy and self reported background characteristic of adults
Decreased health literacy is related to poor health outcomes
Socioeconomic Status Agardh, E., Allebeck, P., Hallqvist, J., Moradi, T., & Sidorchuk, A. (2011). Type 2 diabetes incidence and socio-economic position: a systematic review and meta-analysis. International journal of epidemiology, dyr029.
Systematic review Level 1
Used RRs 95% Cl
Systematic review on associations between type 2 diabetes and socioeconomic status
Greater risk of developing type 2 diabetes with lower Socioeconomic status
Braveman, P., Cubbin, C., Egerter, S., Williams, D., & Pamuk, E. (2010).
Correlational study
N/A Describe socioeconomic disparities in
Those with lowest incomes were least
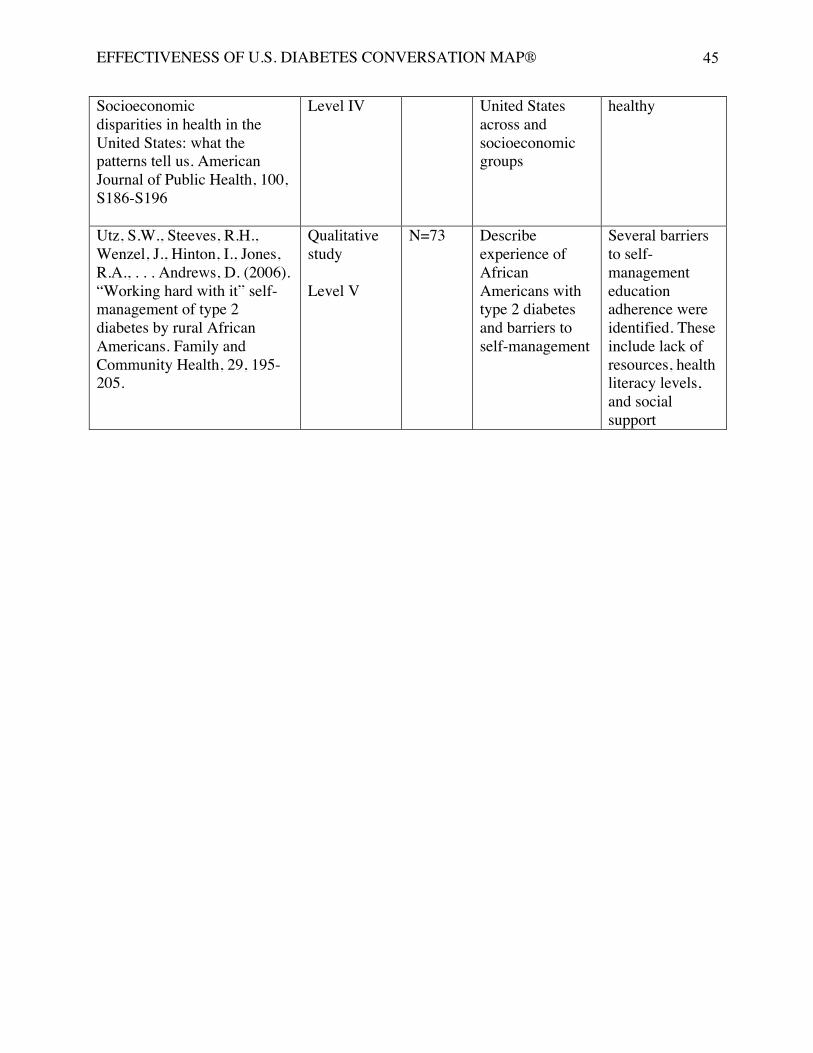
EFFECTIVENESS OF U.S. DIABETES CONVERSATION MAP®
45
Socioeconomic disparities in health in the United States: what the patterns tell us. American Journal of Public Health, 100, S186-S196
Level IV United States across and socioeconomic groups
healthy
Utz, S.W., Steeves, R.H., Wenzel, J., Hinton, I., Jones, R.A., . . . Andrews, D. (2006). “Working hard with it” self-management of type 2 diabetes by rural African Americans. Family and Community Health, 29, 195-205.
Qualitative study Level V
N=73 Describe experience of African Americans with type 2 diabetes and barriers to self-management
Several barriers to self-management education adherence were identified. These include lack of resources, health literacy levels, and social support
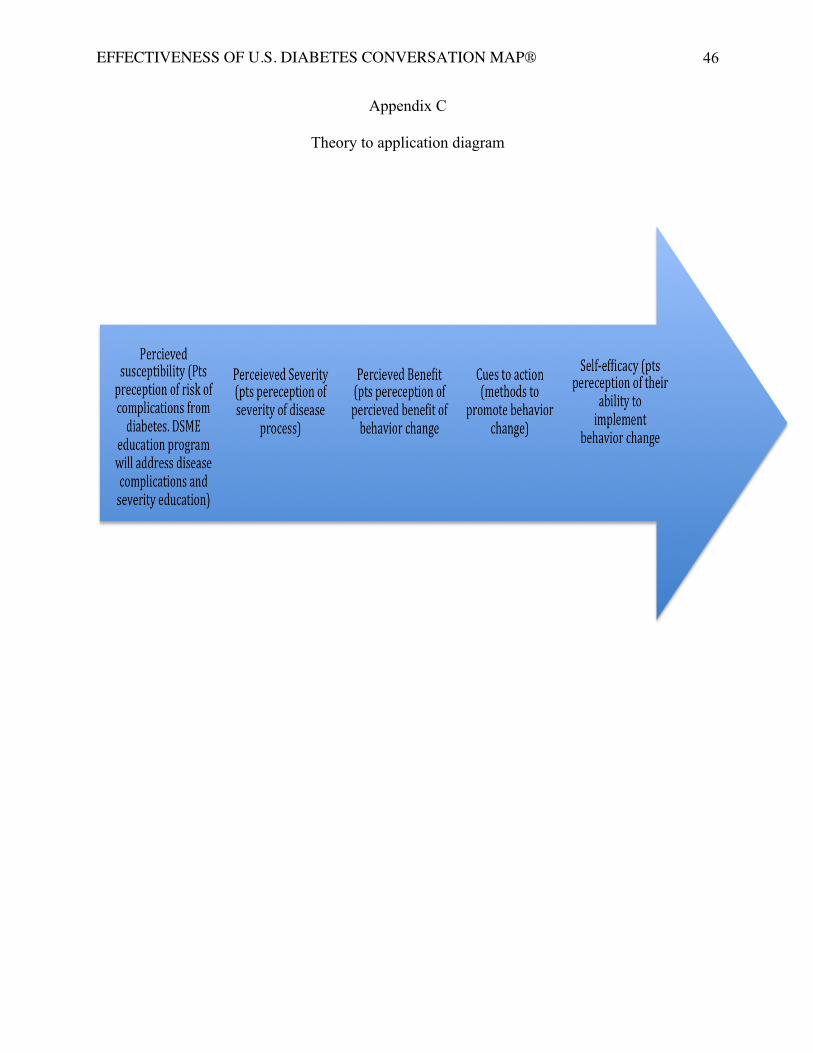
EFFECTIVENESS OF U.S. DIABETES CONVERSATION MAP®
46
Appendix C
Theory to application diagram
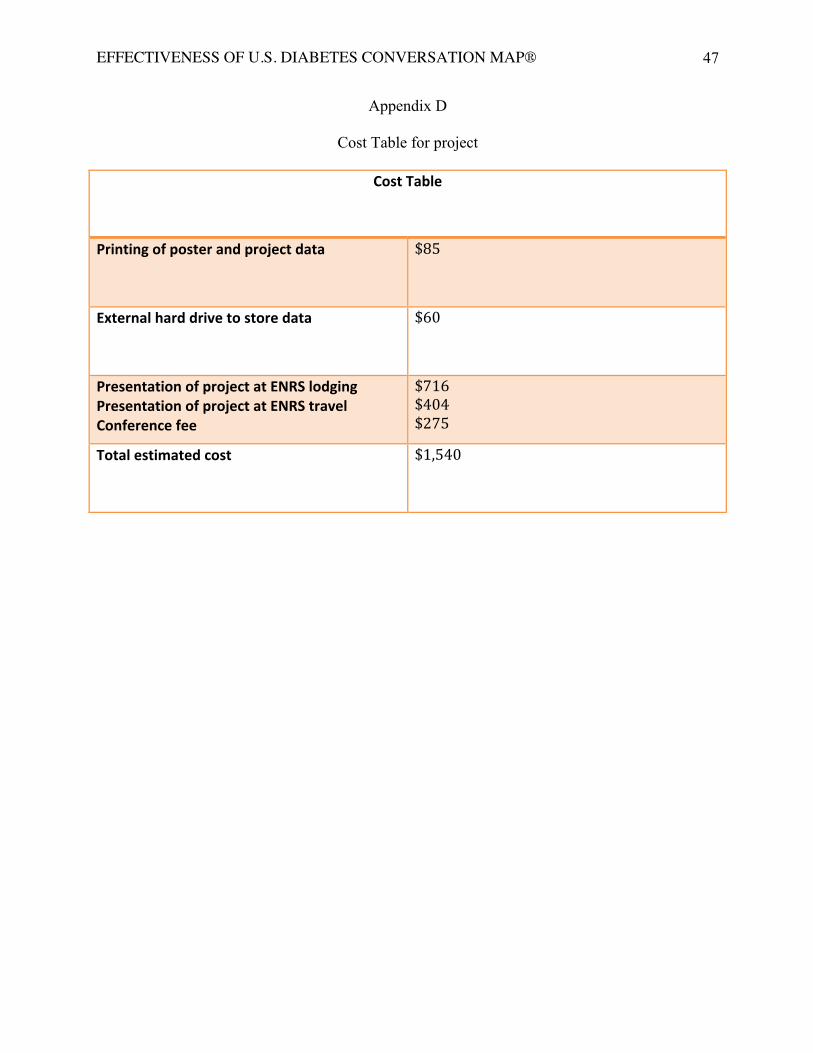
EFFECTIVENESS OF U.S. DIABETES CONVERSATION MAP®
47
Appendix D
Cost Table for project
Cost Table
Printing of poster and project data $85
External hard drive to store data $60
Presentation of project at ENRS lodging Presentation of project at ENRS travel Conference fee
$716 $404 $275
Total estimated cost $1,540
EFFECTIVENESS OF U.S. DIABETES CONVERSATION MAP®
48
Appendix E
Recruitment Materials
This student investigators DNP project is a retrospective chart review of the most recent 35
participants of the U.S. Diabetes Conversation Map from diabetes education at Cray Diabetes clinic
at KU Medical Center that meet all inclusion criteria. Inclusion criteria includes participation in
program within the last year (from date of IRB approval), diagnosis of T2DM confirmed with A1C
of 6.5% or higher, age 18 and older, and attendance to all four-education sessions in the program.
Exclusion criteria are type 1 or gestational diabetes, age less than 18 years, missing one or more of
the patient education sessions. Since this is a retrospective chart review, participants will not be
recruited and formal consent in not required as patient-identifying information will not be used.
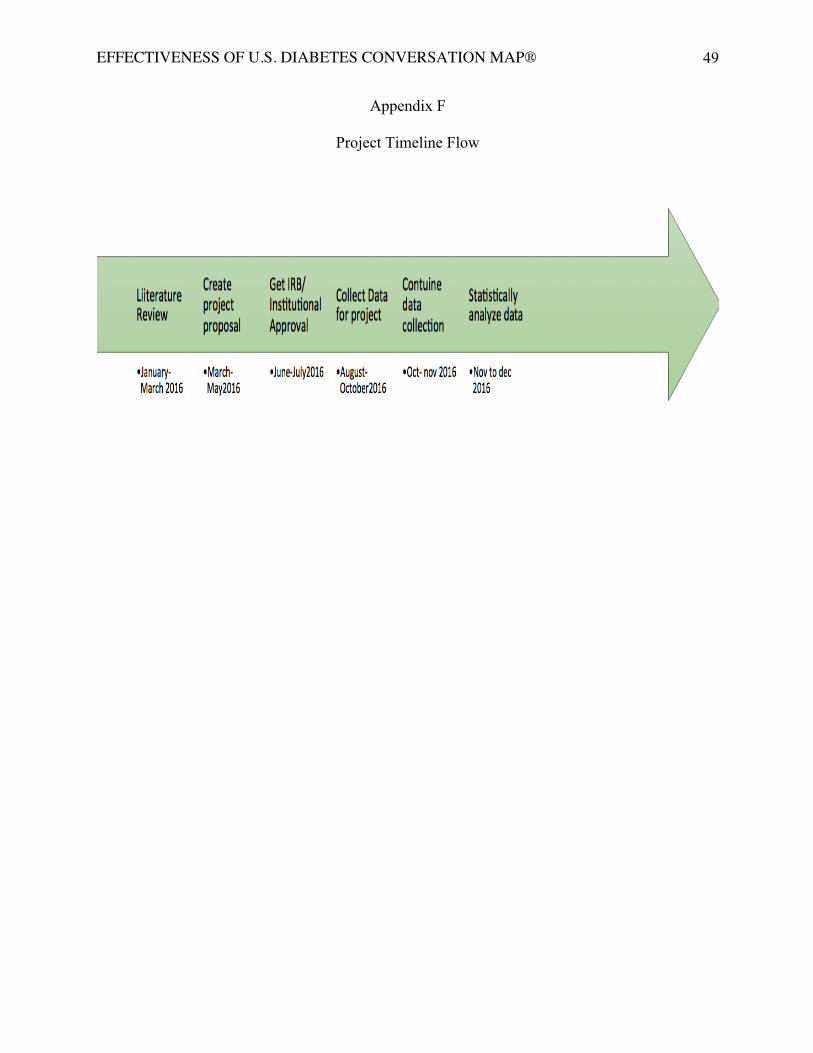
EFFECTIVENESS OF U.S. DIABETES CONVERSATION MAP®
49
Appendix F
Project Timeline Flow
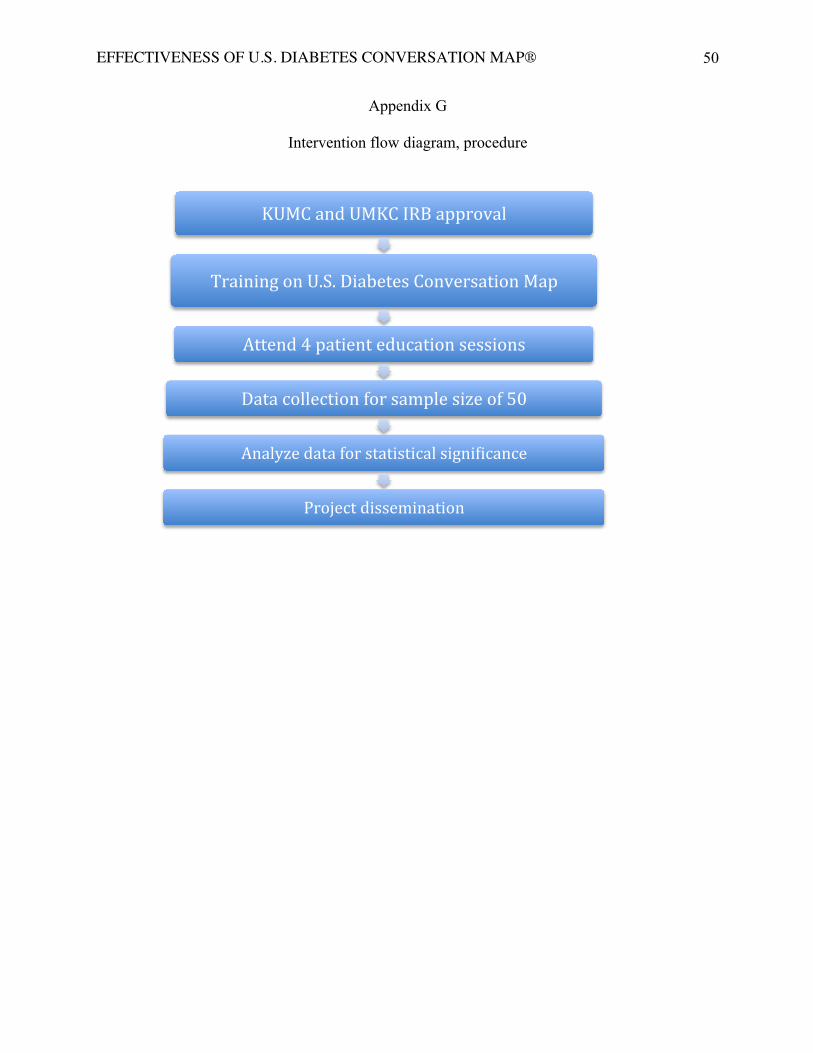
EFFECTIVENESS OF U.S. DIABETES CONVERSATION MAP®
50
Appendix G
Intervention flow diagram, procedure
KUMC and UMKC IRB approval
Training on U.S. Diabetes Conversation Map
Attend 4 patient education sessions
Data collection for sample size of 50
Analyze data for statistical signiZicance
Project dissemination
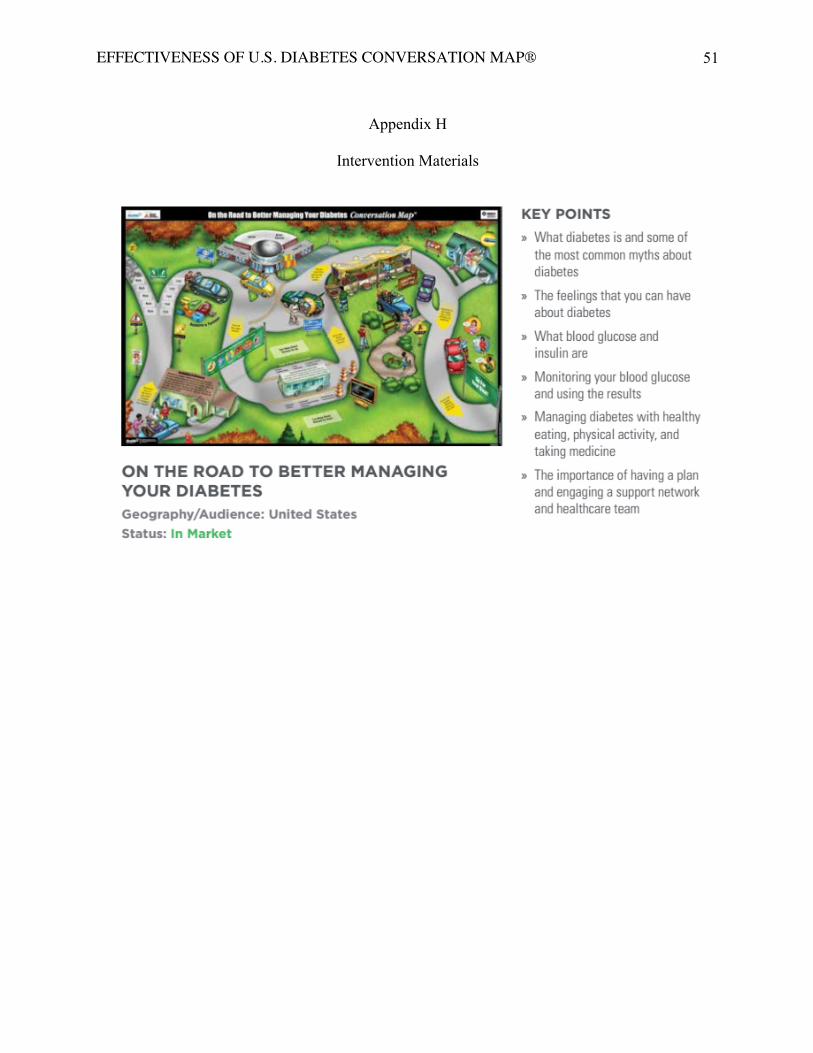
EFFECTIVENESS OF U.S. DIABETES CONVERSATION MAP®
51
Appendix H
Intervention Materials
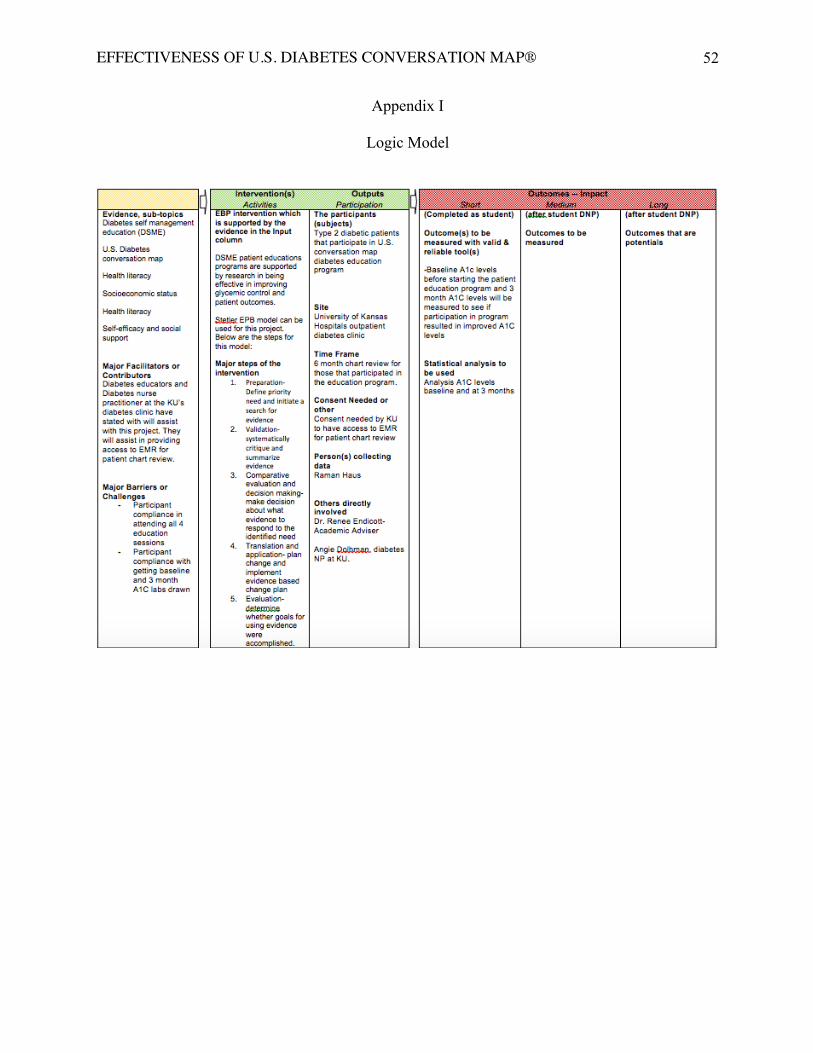
EFFECTIVENESS OF U.S. DIABETES CONVERSATION MAP®
52
Appendix I
Logic Model
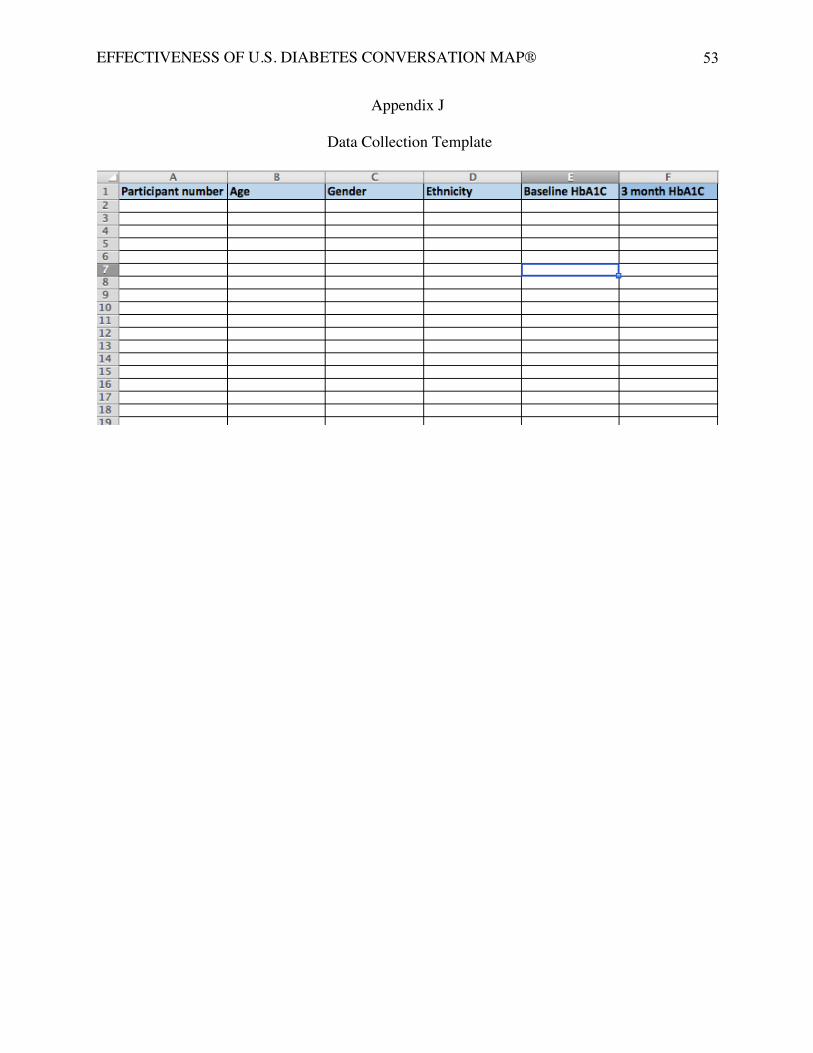
EFFECTIVENESS OF U.S. DIABETES CONVERSATION MAP®
53
Appendix J
Data Collection Template
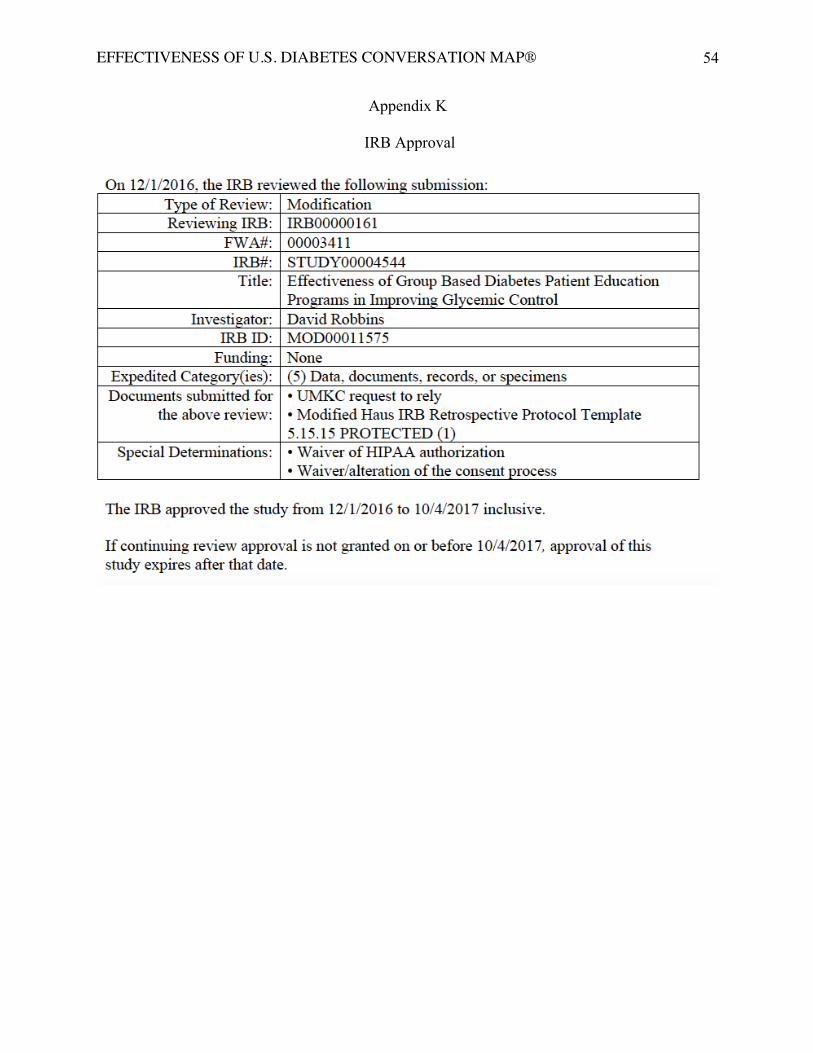
EFFECTIVENESS OF U.S. DIABETES CONVERSATION MAP®
54
Appendix K
IRB Approval
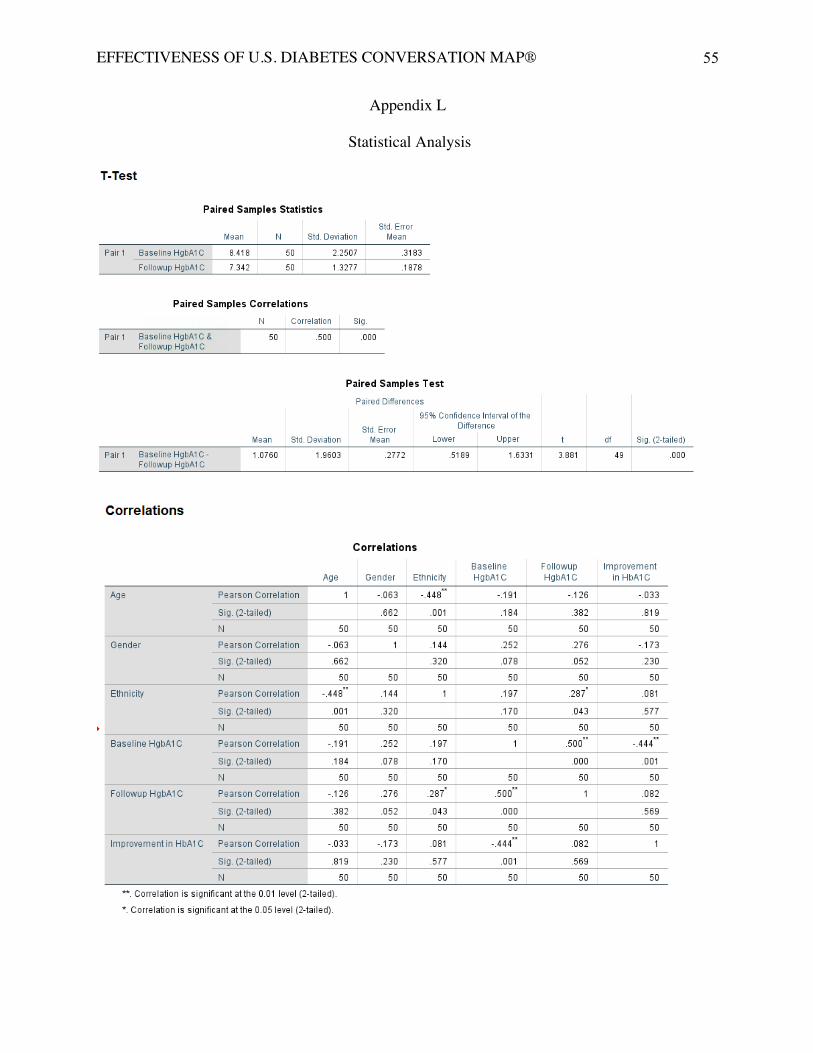
EFFECTIVENESS OF U.S. DIABETES CONVERSATION MAP®
55
Appendix L
Statistical Analysis
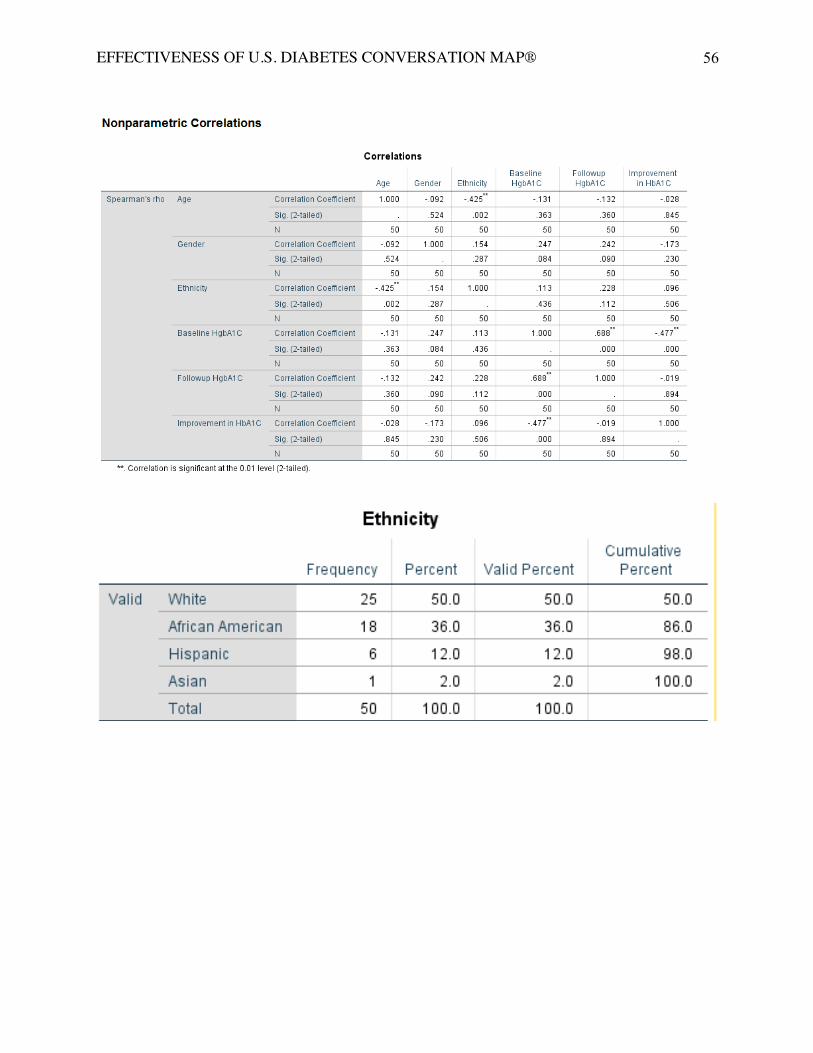
EFFECTIVENESS OF U.S. DIABETES CONVERSATION MAP®
56
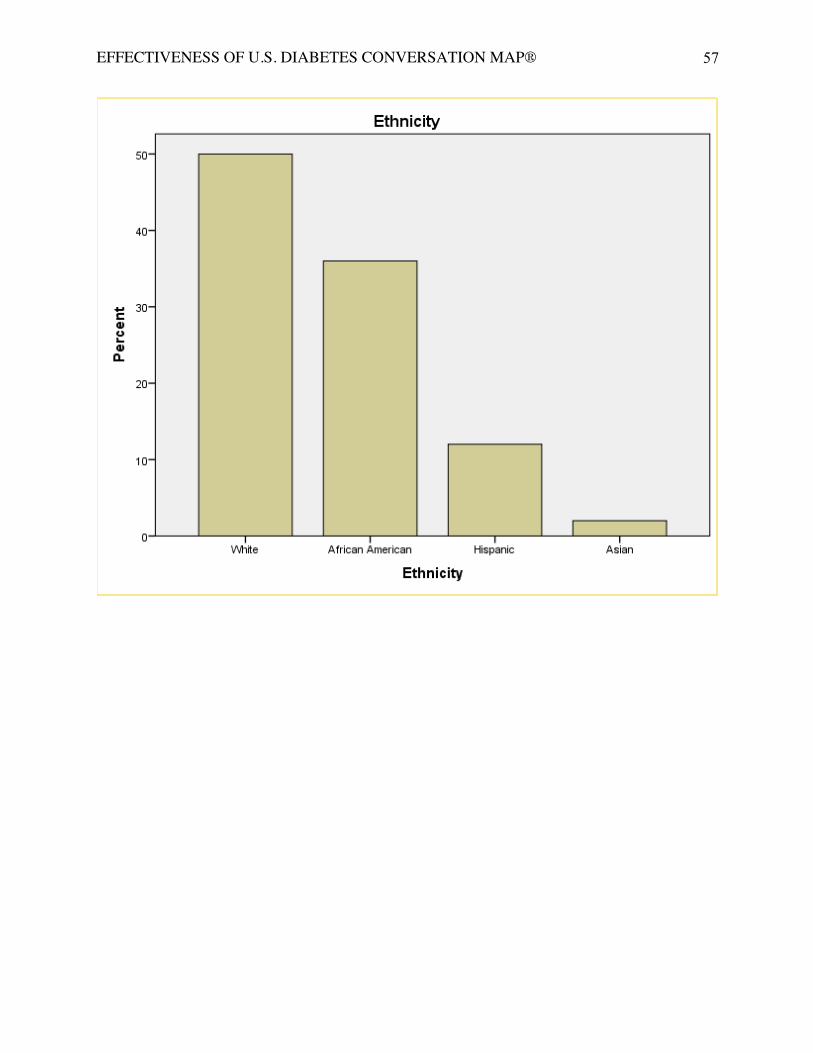
EFFECTIVENESS OF U.S. DIABETES CONVERSATION MAP®
57
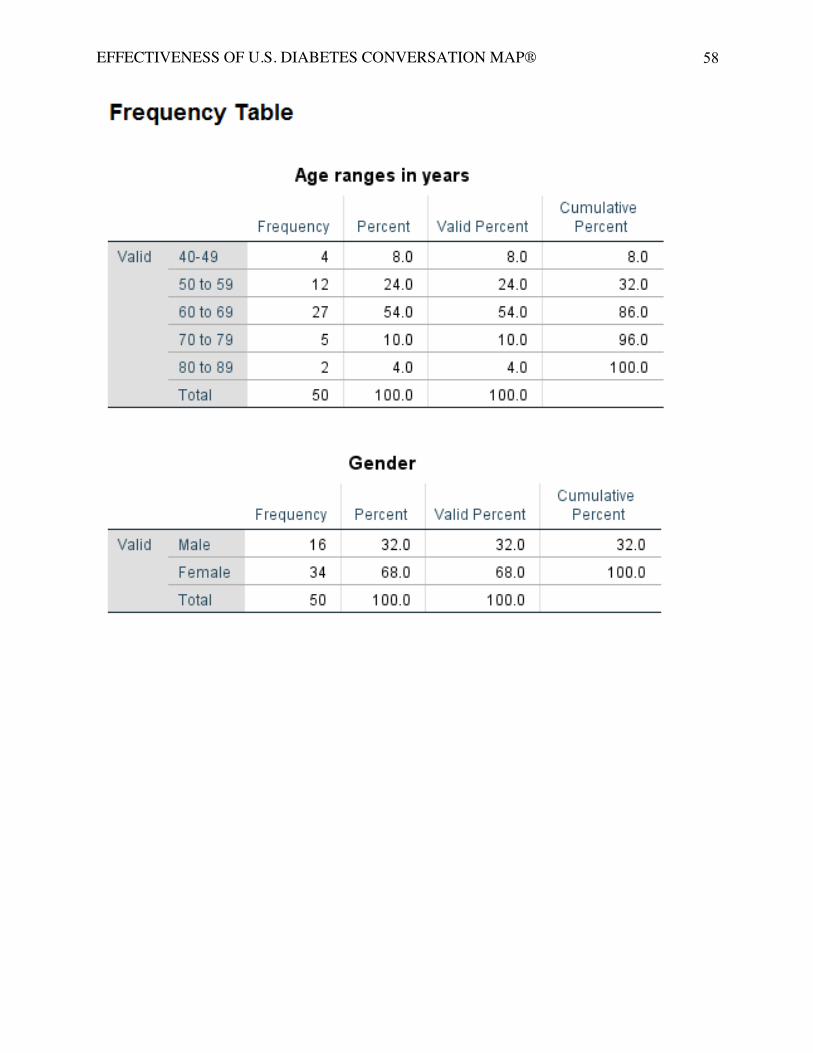
EFFECTIVENESS OF U.S. DIABETES CONVERSATION MAP®
58
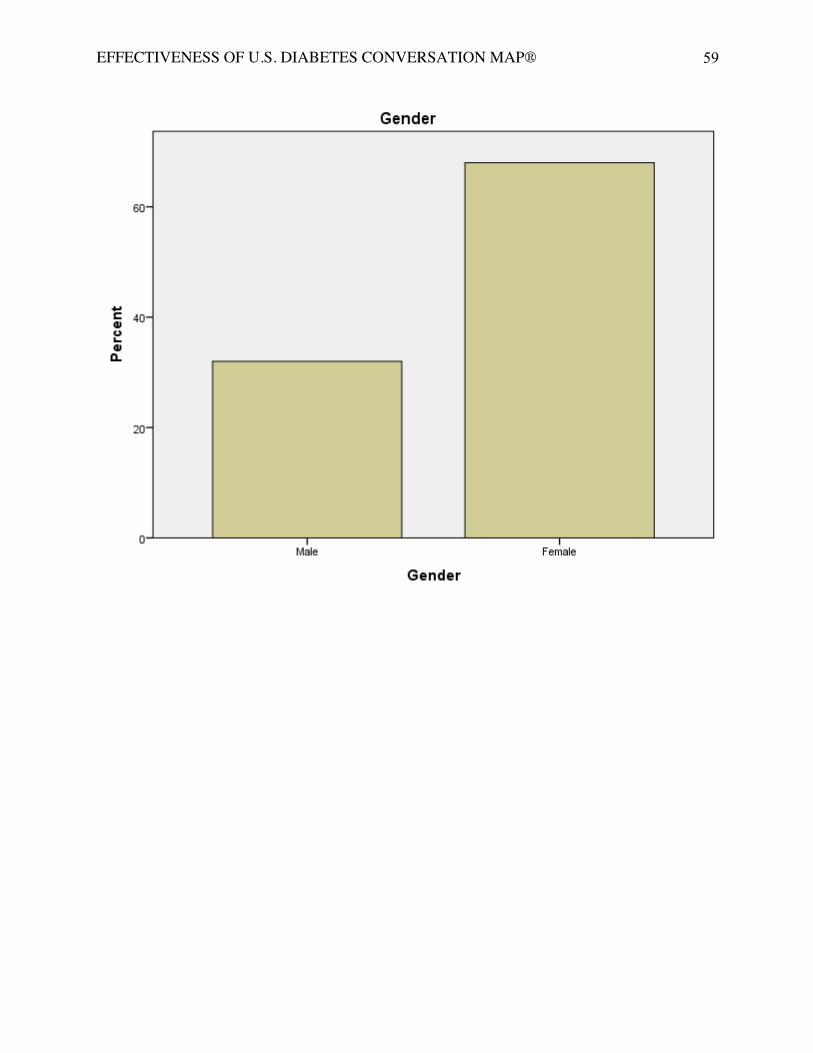
EFFECTIVENESS OF U.S. DIABETES CONVERSATION MAP®
59
EFFECTIVENESS OF U.S. DIABETES CONVERSATION MAP®
60
Appendix L
Project Proposal Approval


![researchonline.lshtm.ac.uk · Web view[word count 4267] Running head: Challenges evaluating Ebola Vaccine Effectiveness. Keywords: Ebola, Modeling and Simulation, Phase 3 design,](https://img.pdfslide.net/doc/110x75/5fabb9c6878c4113e4019a9c/web-view-word-count-4267-running-head-challenges-evaluating-ebola-vaccine-effectiveness.jpg)