Embed Size (px)
Citation preview
Running head: Meta-Analysis of the RSES
The Structure of the Rosenberg Self-Esteem Scale: A Cross-Cultural Meta-Analysis
Timo Gnambs1, Anna Scharl1, and Ulrich Schroeders2
1 Leibniz Institute for Educational Trajectories
2 Psychological Assessment, University of Kassel
Author Note
In this paper, we make use of data of the LISS (Longitudinal Internet Studies for the
Social Sciences) panel administered by CentERdata (Tilburg University, The Netherlands)
through its MESS project funded by the Netherlands Organization for Scientific Research.
Moreover, this paper also uses data from the National Educational Panel Study (NEPS):
Starting Cohort Grade 5, doi:10.5157/NEPS:SC3:6.0.0; Starting Cohort Grade 9,
doi:10.5157/NEPS:SC4:7.0.0; Starting Cohort First-Year Students,
doi:10.5157/NEPS:SC5:8.0.0; Starting Cohort Adults, doi:10.5157/NEPS:SC6:7.0.0. From
2008 to 2013, NEPS data was collected as part of the Framework Program for the Promotion
of Empirical Educational Research funded by the German Federal Ministry of Education and
Research (BMBF). As of 2014, NEPS is carried out by the Leibniz Institute for Educational
Trajectories (LIfBi) at the University of Bamberg in cooperation with a nationwide network.
Correspondence concerning this article should be addressed to Timo Gnambs, Leibniz
Institute for Educational Trajectories, Wilhelmsplatz 3, 96047 Bamberg, Germany, E-mail:
Accepted for publication in the Zeitschrift für Psychologie / Journal of Psychology.

META-ANALYSIS OF THE RSES 2
Abstract
The Rosenberg Self-Esteem Scale (RSES; Rosenberg, 1965) intends to measure a
single dominant factor representing global self-esteem. However, several studies identified
some form of multidimensionality for the RSES. Therefore, we examined the factor structure
of the RSES with a fixed-effects meta-analytic structural equation modeling approach
including 113 independent samples (N = 140,671). A confirmatory bifactor model with
specific factors for positively and negatively worded items and a general self-esteem factor
fitted best. However, the general factor captured most of the explained common variance in
the RSES, whereas the specific factors accounted for less than 15%. The general factor
loadings were invariant across samples from the United States and other highly individualistic
countries, but lower for less individualistic countries. Thus, although the RSES essentially
represents a unidimensional scale, cross-cultural comparisons might not be justified because
the cultural background of the respondents affects the interpretation of the items.
Keywords: self-esteem, factor analysis, wording effect, meta-analysis, measurement
invariance
META-ANALYSIS OF THE RSES 3
The Structure of the Rosenberg Self-Esteem Scale: A Cross-Cultural Meta-Analysis
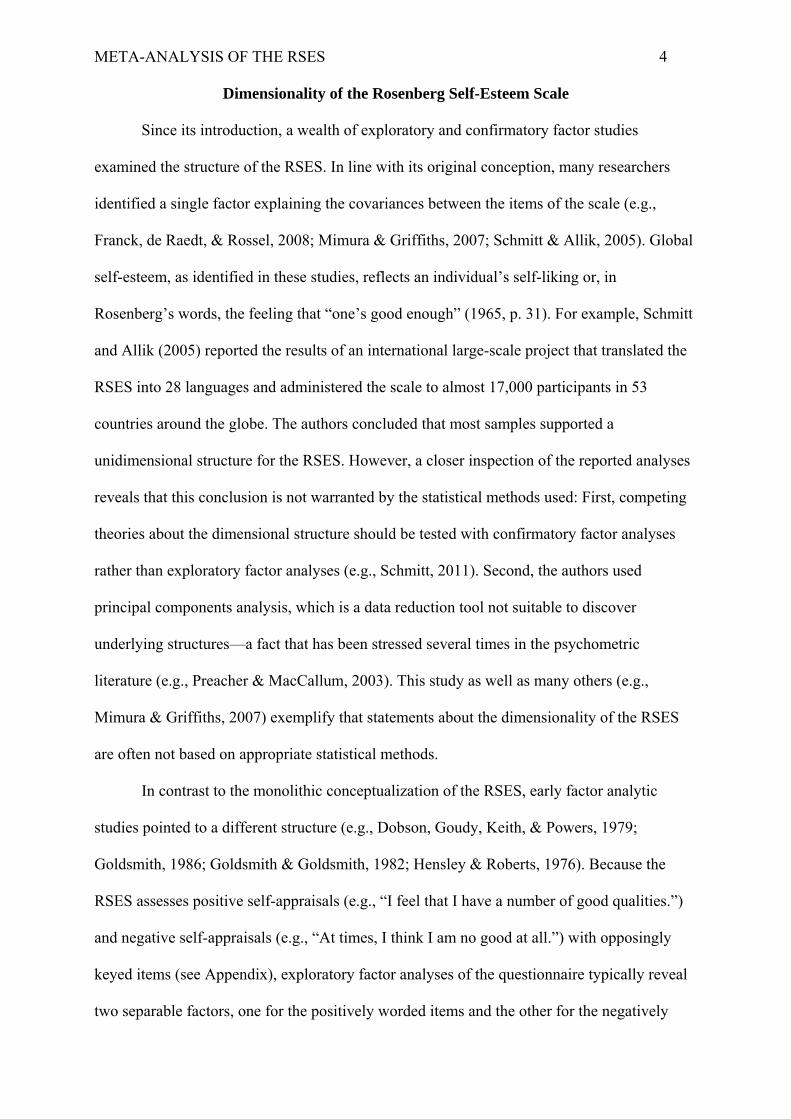
More than 50 years of research and hundreds of empirical studies failed to solve the
dispute surrounding the dimensionality of the Rosenberg Self-Esteem Scale (RSES).
Originally, Rosenberg (1965) considered self-esteem a unitary construct reflecting individual
differences in the evaluation of one’s self-worth and self-respect. In empirical studies,
however, several researchers highlighted the need to acknowledge between one to four
secondary dimensions, in addition to general self-esteem, to properly model responses to the
RSES (e.g., Alessandri, Vecchione, Eisenberg, & Łaguna, 2015; Donnellan, Ackerman, &
Brecheen, 2016; Tafarodi & Milne, 2002; Urbán, Szigeti, Kökönyei, & Demetrovics, 2014).
Within the last decades the structural ambiguity of the RSES led to a form of “beauty contest”
(Reise, Kim, Mansolf, & Widaman, 2016, p. 819) of factor analytic studies designed to
explore the structure of the RSES in diverse samples. Although strict unidimensionality is
hard to achieve for many psychological self-report scales (Reise, Moore, & Haviland, 2010),
pronounced multidimensionality poses a frequently neglected problem for applied researchers
using composite scores. In this instance, simple sum scores across all items can bias person
estimates, because they reflect a blend of different latent traits. Further difficulties arise if the
identified factor structure depends on important moderating influences such as respondents’
cognitive abilities (Marsh, 1996) or their cultural affiliation (Song, Cai, Brown, & Grimm,
2011; Supple, Su, Plunkett, Peterson, & Bush, 2013). Group comparisons that are based on
instruments lacking measurement invariance can result in seriously biased (if not wrong)
conclusions (see Chen, 2008; Kuha & Moustaki, 2015). Therefore, we present a meta-analytic
summary on the factor structure of the RSES to evaluate whether the RSES scores reflect a
single trait or a composite of different traits. Moreover, we explore the cross-cultural
measurement invariance of the scale between culturally diverse countries from America,
Europe, and Asia.
META-ANALYSIS OF THE RSES 4
Dimensionality of the Rosenberg Self-Esteem Scale
Since its introduction, a wealth of exploratory and confirmatory factor studies
examined the structure of the RSES. In line with its original conception, many researchers
identified a single factor explaining the covariances between the items of the scale (e.g.,
Franck, de Raedt, & Rossel, 2008; Mimura & Griffiths, 2007; Schmitt & Allik, 2005). Global
self-esteem, as identified in these studies, reflects an individual’s self-liking or, in
Rosenberg’s words, the feeling that “one’s good enough” (1965, p. 31). For example, Schmitt
and Allik (2005) reported the results of an international large-scale project that translated the
RSES into 28 languages and administered the scale to almost 17,000 participants in 53
countries around the globe. The authors concluded that most samples supported a
unidimensional structure for the RSES. However, a closer inspection of the reported analyses
reveals that this conclusion is not warranted by the statistical methods used: First, competing
theories about the dimensional structure should be tested with confirmatory factor analyses
rather than exploratory factor analyses (e.g., Schmitt, 2011). Second, the authors used
principal components analysis, which is a data reduction tool not suitable to discover
underlying structures—a fact that has been stressed several times in the psychometric
literature (e.g., Preacher & MacCallum, 2003). This study as well as many others (e.g.,
Mimura & Griffiths, 2007) exemplify that statements about the dimensionality of the RSES
are often not based on appropriate statistical methods.
In contrast to the monolithic conceptualization of the RSES, early factor analytic
studies pointed to a different structure (e.g., Dobson, Goudy, Keith, & Powers, 1979;
Goldsmith, 1986; Goldsmith & Goldsmith, 1982; Hensley & Roberts, 1976). Because the
RSES assesses positive self-appraisals (e.g., “I feel that I have a number of good qualities.”)
and negative self-appraisals (e.g., “At times, I think I am no good at all.”) with opposingly
keyed items (see Appendix), exploratory factor analyses of the questionnaire typically reveal
two separable factors, one for the positively worded items and the other for the negatively
META-ANALYSIS OF THE RSES 5
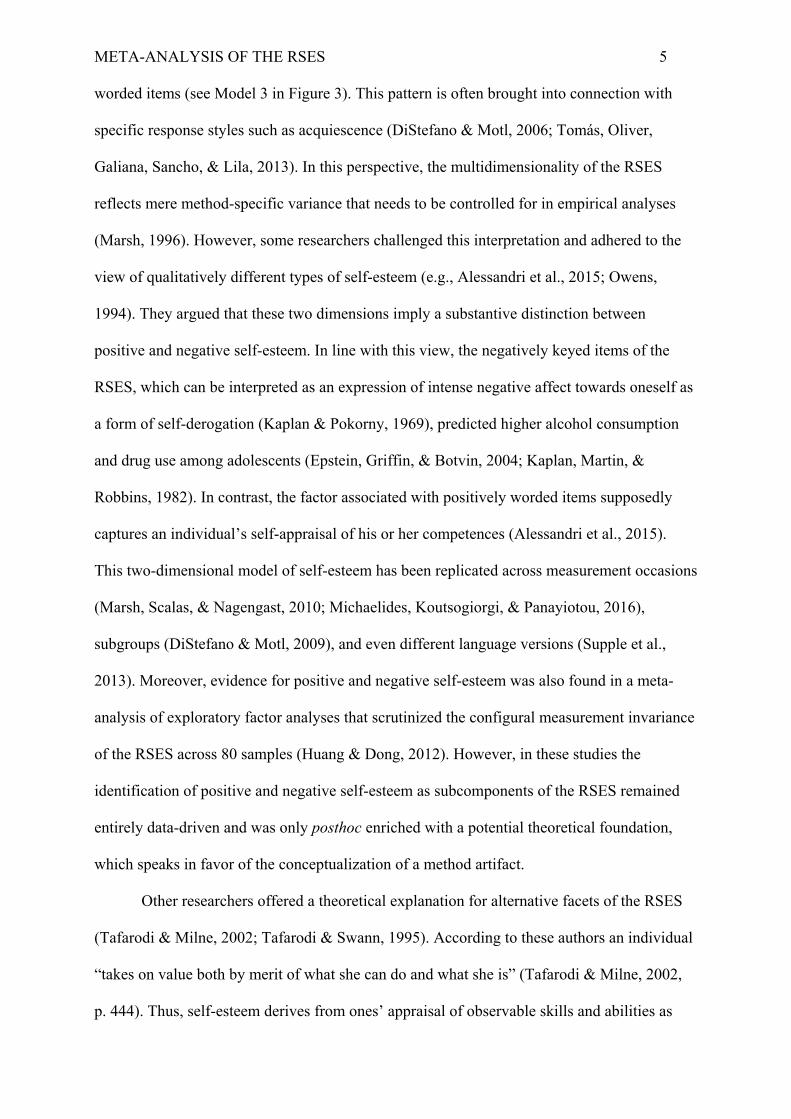
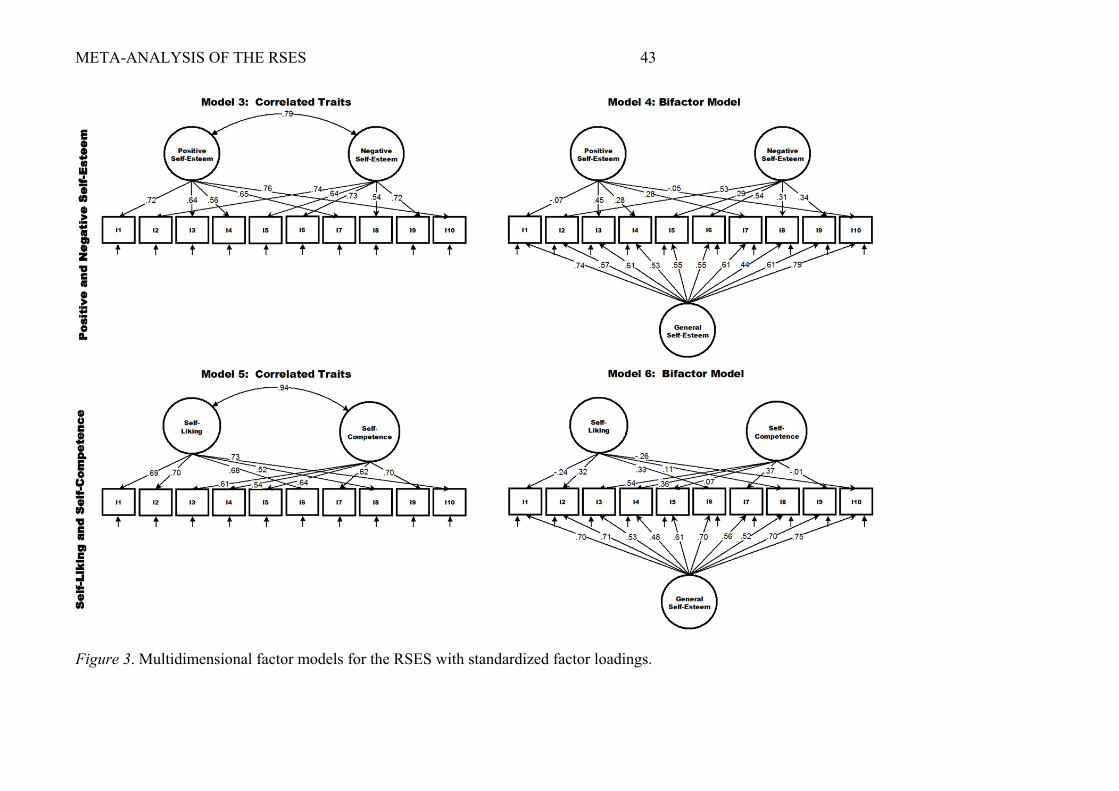
worded items (see Model 3 in Figure 3). This pattern is often brought into connection with
specific response styles such as acquiescence (DiStefano & Motl, 2006; Tomás, Oliver,
Galiana, Sancho, & Lila, 2013). In this perspective, the multidimensionality of the RSES
reflects mere method-specific variance that needs to be controlled for in empirical analyses
(Marsh, 1996). However, some researchers challenged this interpretation and adhered to the
view of qualitatively different types of self-esteem (e.g., Alessandri et al., 2015; Owens,
1994). They argued that these two dimensions imply a substantive distinction between
positive and negative self-esteem. In line with this view, the negatively keyed items of the
RSES, which can be interpreted as an expression of intense negative affect towards oneself as
a form of self-derogation (Kaplan & Pokorny, 1969), predicted higher alcohol consumption
and drug use among adolescents (Epstein, Griffin, & Botvin, 2004; Kaplan, Martin, &
Robbins, 1982). In contrast, the factor associated with positively worded items supposedly
captures an individual’s self-appraisal of his or her competences (Alessandri et al., 2015).
This two-dimensional model of self-esteem has been replicated across measurement occasions
(Marsh, Scalas, & Nagengast, 2010; Michaelides, Koutsogiorgi, & Panayiotou, 2016),
subgroups (DiStefano & Motl, 2009), and even different language versions (Supple et al.,
2013). Moreover, evidence for positive and negative self-esteem was also found in a meta-
analysis of exploratory factor analyses that scrutinized the configural measurement invariance
of the RSES across 80 samples (Huang & Dong, 2012). However, in these studies the
identification of positive and negative self-esteem as subcomponents of the RSES remained
entirely data-driven and was only posthoc enriched with a potential theoretical foundation,
which speaks in favor of the conceptualization of a method artifact.
Other researchers offered a theoretical explanation for alternative facets of the RSES
(Tafarodi & Milne, 2002; Tafarodi & Swann, 1995). According to these authors an individual
“takes on value both by merit of what she can do and what she is” (Tafarodi & Milne, 2002,
p. 444). Thus, self-esteem derives from ones’ appraisal of observable skills and abilities as
META-ANALYSIS OF THE RSES 6
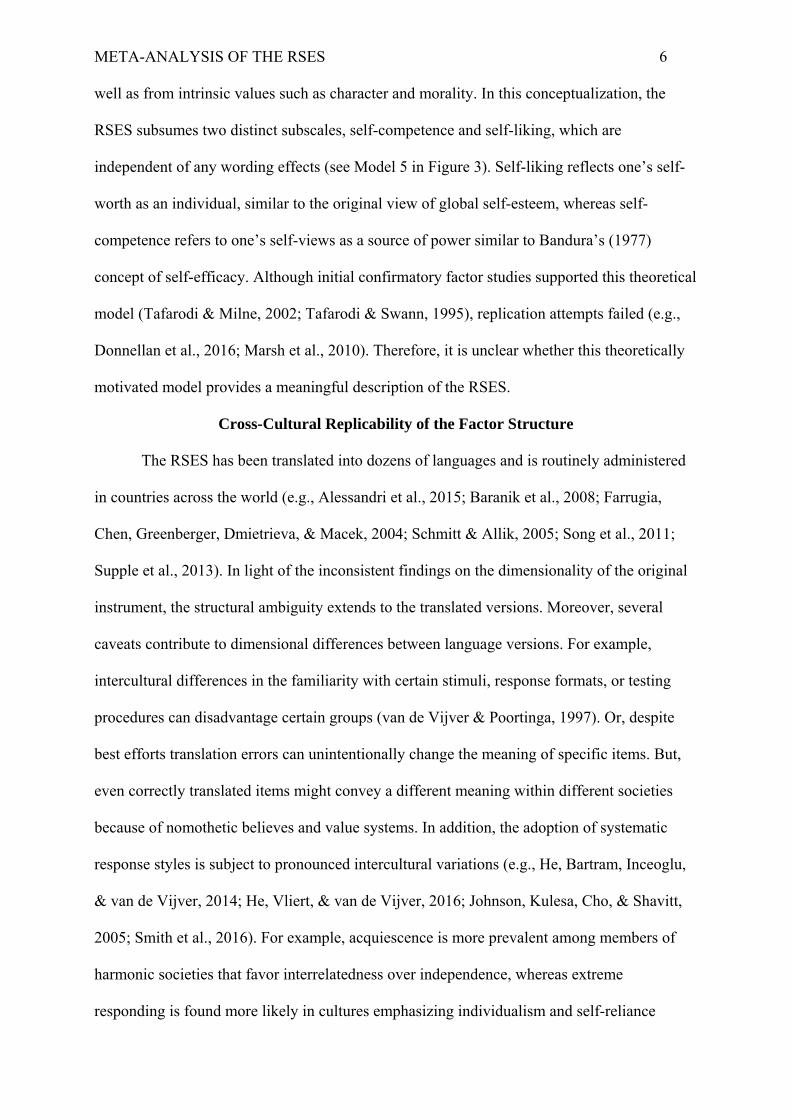
well as from intrinsic values such as character and morality. In this conceptualization, the
RSES subsumes two distinct subscales, self-competence and self-liking, which are
independent of any wording effects (see Model 5 in Figure 3). Self-liking reflects one’s self-
worth as an individual, similar to the original view of global self-esteem, whereas self-
competence refers to one’s self-views as a source of power similar to Bandura’s (1977)
concept of self-efficacy. Although initial confirmatory factor studies supported this theoretical
model (Tafarodi & Milne, 2002; Tafarodi & Swann, 1995), replication attempts failed (e.g.,
Donnellan et al., 2016; Marsh et al., 2010). Therefore, it is unclear whether this theoretically
motivated model provides a meaningful description of the RSES.
Cross-Cultural Replicability of the Factor Structure
The RSES has been translated into dozens of languages and is routinely administered
in countries across the world (e.g., Alessandri et al., 2015; Baranik et al., 2008; Farrugia,
Chen, Greenberger, Dmietrieva, & Macek, 2004; Schmitt & Allik, 2005; Song et al., 2011;
Supple et al., 2013). In light of the inconsistent findings on the dimensionality of the original
instrument, the structural ambiguity extends to the translated versions. Moreover, several
caveats contribute to dimensional differences between language versions. For example,
intercultural differences in the familiarity with certain stimuli, response formats, or testing
procedures can disadvantage certain groups (van de Vijver & Poortinga, 1997). Or, despite
best efforts translation errors can unintentionally change the meaning of specific items. But,
even correctly translated items might convey a different meaning within different societies
because of nomothetic believes and value systems. In addition, the adoption of systematic
response styles is subject to pronounced intercultural variations (e.g., He, Bartram, Inceoglu,
& van de Vijver, 2014; He, Vliert, & van de Vijver, 2016; Johnson, Kulesa, Cho, & Shavitt,
2005; Smith et al., 2016). For example, acquiescence is more prevalent among members of
harmonic societies that favor interrelatedness over independence, whereas extreme
responding is found more likely in cultures emphasizing individualism and self-reliance
META-ANALYSIS OF THE RSES 7
(Johnson et al., 2005; Smith et al., 2016). Thus, intercultural differences in response styles can
contribute to factorial differences in psychological measures. Regarding the RSES, several
cross-cultural studies examined its measurement across cultural groups: For example,
Farrugia and colleagues (2004) demonstrated strict measurement invariance for a
bidimensional model of the RSES across four adolescent samples from China, Czech
Republic, Korea, and the USA. However, this result was only achieved after removing a
noninvariant item (“I wish I could have more respect for myself.”) due to extremely low
factor loadings in the non-US samples. This finding was also replicated in a study comparing
US immigrants with European, Latino, Armenian, and Iranian background (Supple et al.,
2013). Short of the previously identified item, the RSES exhibited strong measurement
invariance across the ethnic groups. However, other analyses revealed more severe cross-
cultural differences: For two samples of US and Chinese college students only three items
were fully measurement invariant (Song et al., 2011). Rather, the two groups used the scale
very differently (see Baranik et al., 2008, for similar results). Thus, frequently observed
cultural differences in self-esteem between Western and Eastern countries might be spurious
effects from differential item functioning associated with cultural values.
Present Study
In response to the ongoing controversy regarding the structure of the RSES, we
scrutinized the dimensionality of the RSES in a meta-analytic structural equation modeling
(MASEM; Cheung, 2014) framework. We conducted a systematic literature research to
retrieve studies reporting on the dimensionality of the RSES. In contrast to Huang and Dong’s
(2012) meta-analysis that simply aggregated the number of times two items exhibited their
strongest loading on the same factor across multiple exploratory factor analyses, we estimated
a pooled variance-covariance-matrix on an item-level (cf. Gnambs & Staufenbiel, 2016). This
allowed us to derive an overall evaluation of the scale’s internal structure by investigating the
configural model of the RSES (i.e., the number of factors) along with information on the size
META-ANALYSIS OF THE RSES 8
of the factor loadings (i.e., metric information). Moreover, we compared the different
competing measurement models described in the literature. Given overwhelming evidence of
secondary dimensions in the RSES (e.g., Alessandri et al., 2015; Marsh et al., 2010;
Michaelides et al., 2016), we expected a worse fit of a single factor model as compared to
models that also acknowledge different subdimensions of self-esteem (Hypothesis 1). Because
several studies failed to identify self-liking and self-competence as subcomponents of self-
esteem (e.g., Donnellan et al., 2016; Marsh et al., 2010), we expected more support for
positive and negative self-esteem in the RSES (Hypothesis 2). In order to capture the
multidimensionality in presence of a strong overarching self-esteem factor, we also relied on
bifactor models (Brunner, Nagy, & Wilhelm, 2012; Reise, 2012) that used each item as an
indicator of a general dimension (i.e., global self-esteem) and an orthogonal specific factor
(e.g., for negatively worded items). This allowed us retaining the goal of measuring a single
trait common to all items and estimating the proportion of common variance explained by
general self-esteem. Because bifactor models include less constraints than comparable
correlated trait models (Reise, 2012), we expected better support for a bifactor structure of the
RSES (Hypothesis 3). Finally, we explored the cross-cultural measurement invariance of the
RSES by comparing its factor structure across samples from highly individualistic countries
(e.g., USA, Germany) to those from less individualistic societies (e.g., China, Indonesia).
Individualism refers to the degree of autonomy and self-actualization people in a given
society strive for as compared to an emphasis of interrelatedness and group cohesion
(Hofstede, Hofstede, & Minkov, 2010). Because expressions of overly positive self-views
(i.e., self-enhancement) are typically seen as less appropriate among members of less
individualistic societies (Heine, Lehman,Markus, & Kitayama, 1999; Markus & Kiatayama,
1991), we expected cultural individualism to affect the loading structure of the RSES.
However, short of item 8 that seems to convey a different meaning in Asian cultures (see
META-ANALYSIS OF THE RSES 9
Farruggia et al., 2004), we had no a priori hypotheses regarding the degree of measurement
invariance across societies.
Method
Meta-Analytic Database
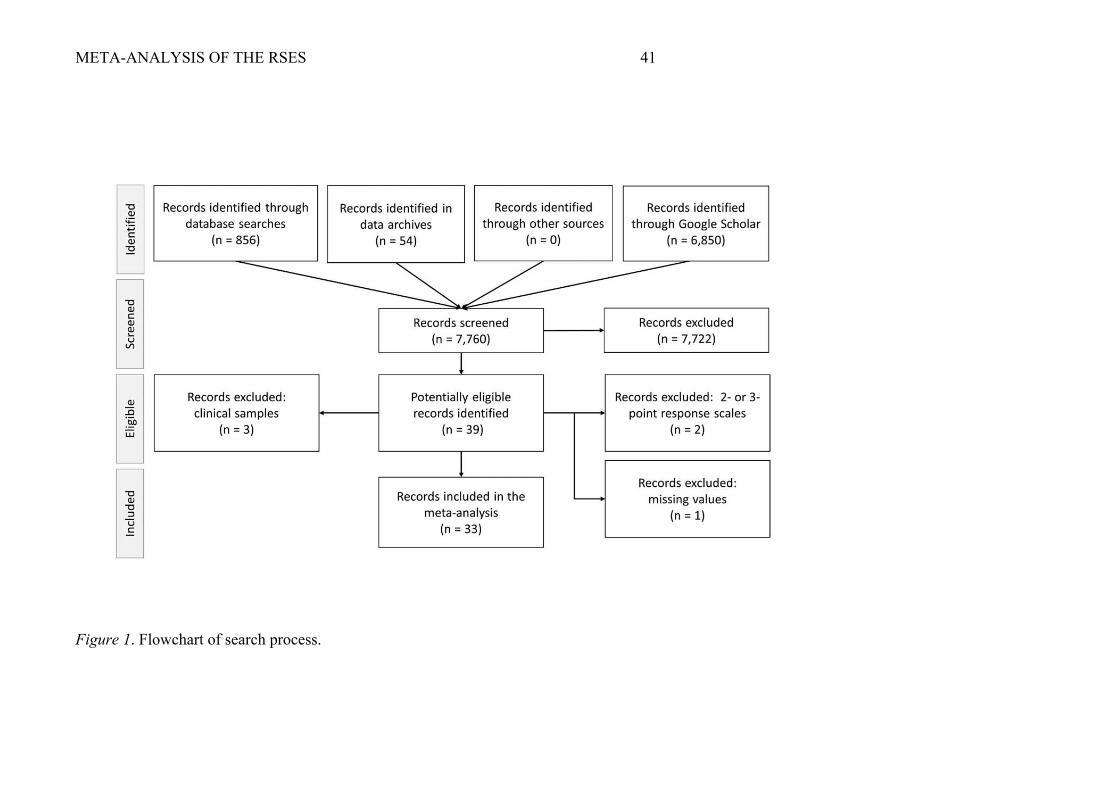
The search for primary studies reporting on the factor structure of the RSES included
major scientific databases (ERIC, PsycINFO, Psyndex, Medline), public data archives
(GESIS data catalogue, ICPSR data archive, UK data archive), and Google Scholar.
Additional studies derived from the references of all identified articles (“rolling snowball
method”). In January 2017, we identified 7,760 potentially relevant journal articles and data
archives using the Boolean expression Rosenberg self-esteem AND (factor analysis OR factor
structure OR principal component analysis). After reviewing the title and the abstracts of
these results, we retained all studies that met the following criteria: (a) In the study the
original 10 item version of the RSES was administered, (b) the questionnaire employed at
least four response options (in order to implement linear factor analyses in subsequent
analyses, see Rhemtulla, Brosseau-Liard, & Savalei, 2012), and (c) the loading pattern from
an exploratory factor analysis or the full covariance matrix between all items was reported. In
case, the raw data of a study was available, we calculated the respective covariance matrix. If
oblique factor rotations were used, we only considered studies that also reported the
respective factor correlations. Moreover, the analyses were limited to (d) samples including
healthy individuals without mental disorders. This literature search and screening process
resulted in 34 eligible studies for our meta-analysis that reported on 113 independent samples
(see Figure 1).
Coding Process
In a coding protocol (available in the online data repository, see below), we defined all
relevant information to be extracted from each publication and gave guidelines concerning the
range of potential values for each variable. Since covariance matrices on an item-level were
META-ANALYSIS OF THE RSES 10
rarely reported, loading patterns from exploratory factor analyses were the focal statistics. In
case different factor solutions for one and the same sample were available, we used the factor
loading pattern with the largest number of factors. Additionally, descriptive information was
collected on the sample (e.g., sample size, country, mean age, percentage of female
participants), the publication (e.g., publication year), and the reported factor analysis (e.g.,
factor analytic method, type of rotation). All studies were coded by the first author. To
evaluate the coding process two thirds of the studies were independently coded a second time
by the second author. Intercoder agreement was quantified using two-way intraclass
coefficients (ICC; Shrout & Fleiss, 1979) which indicate strong agreement for values
exceeding .70 and excellent agreement for values greater than .90 (LeBreton & Senter, 2008).
The intercoder reliabilities were generally high (approaching 1); for example, for the factor
loadings the ICC was .99, 95% CI [.99, .99].
Meta-Analytic Procedure
Effect size. The zero-order Pearson product moment correlations between the 10 items
of the RSES were used as effect sizes. Ten samples reported the respective correlation
matrices, whereas 26 samples provided raw data that allowed the calculation of these
correlations. The remaining 77 samples reported factor pattern matrices that were used to
reproduce the item-level correlations (Gnambs & Staufenbiel, 2016). One study (Rojas-
Barahona, Zegers, & Förster, 2009) neglected to report the full factor loading pattern and
excluded small loadings falling below .40. In this case, a value of 0 was imputed for the
missing factor loadings, because Monte Carlo simulations indicated that this approach results
in unbiased estimates of meta-analytic factor patterns (Gnambs & Staufenbiel, 2016).
Meta-analytic factor analyses. The correlation matrices were pooled across samples
using a recent development in MASEM (Cheung, 2014), that allows for the meta-analytic
integration of correlation matrices and factor loading structures from exploratory factor
analyses (see Gnambs & Staufenbiel, 2016). More precisely, for each item pair of the RSES
META-ANALYSIS OF THE RSES 11
the correlations were pooled using a fixed-effects model with a generalized least square
estimator (Becker, 1992). Sampling error was accounted for by weighting each individual
correlation using the sample size. The derived pooled correlation matrix for the RSES was
used as input for confirmatory factor analyses with a maximum likelihood estimator. A series
of simulation studies indicated that this meta-analytic procedure precisely recovers the
population factor structure of an instrument (Gnambs & Staufenbiel, 2016). Multiple criteria
were used to evaluate the fit of competing factor models (see Figures 2 and 3). In line with
conventional standards (see Schermelleh-Engel, Moosbrugger, & Müller, 2003) models with
a Comparative Fit Index (CFI) ≥ .95, a Root Mean Square Error of Approximation (RMSEA)
≤ .08, and a Standardized Root Mean Square Residual (SRMR) ≤ .10 were interpreted as
“acceptable” and models with CFI ≥ .97, RMSEA ≤ .05, and SRMR ≤ .05 as “good” fitting.
Moderator analyses. Cross-cultural measurement invariance was evaluated within the
well-established framework of multi-group confirmatory factor analysis (Wicherts & von
Dolan, 2010). First, each country was allotted the respective individualism score from
Minkov et al. (2017) that reflects the relative standing of each country on the respective
cultural dimension. Then, the samples were divided at the mean individualism score (M = 0)
into two groups (low versus high). Because various factors (e.g., language, economic
conditions, political systems) can contribute to cross-country differences, samples from the
United States as an example of a highly individualistic country formed a third group. The
latter was used as homogenous reference to gauge the robustness of the identified factor
patterns. We expected negligible differences between the US samples and samples from other
highly individualistic countries, whereas both groups should show similar differences in
comparison to samples from less individualistic countries. Subsequently, we reestimated the
pooled correlation matrices and fitted the factor models to the correlation matrices within each
group. Different steps of invariance of the measurement models can be tested, by applying
increasingly restrictive constraints across groups. Because of the large sample size and the
META-ANALYSIS OF THE RSES 12
excessive power of statistical tests in the current case, measurement invariance was evaluated
based on differences in practical fit indices (Marsh, Nagengast & Morin, 2013). To this end,
simulation studies indicated that differences in CFI less than .002 between two hierarchical
nested models, indicate essential measurement invariance (Meade, Johnson, & Braddy, 2008;
Khojasteh & Lo, 2015). Moreover, differences in factor loadings between groups less than .10
are considered negligible (cf. Saris, Satorra, & van der Feld, 2009)1.
Sensitivity analyses. The robustness of the identified factor structure was evaluated
by subjecting the samples with complete correlation matrices (n = 36) to a random-effects
meta-analysis (Cheung & Chan, 2005; Jak, 2015). Therefore, the pooled correlation matrix
was estimated using a multivariate approach with a weighted least square estimator.
Subsequently, we repeated the factor analyses using the asymptotic covariance matrix derived
in the previous step as weight matrix for the factor models. Simulation studies indicated that
this two-step approach is superior to univariate meta-analyses and more precisely recovers
population effects (Cheung & Chan, 2005). However, as of yet, it cannot accommodate
correlations reproduced from factor patterns.
Examined Factor Models for the RSES
We tested a series of structural models for the RSES that have been frequently applied
in the literature (see Figures 2 and 3). If not stated otherwise, factor loadings and residual
variances were freely estimated, whereas the latent factor variances were fixed to 1 for
identification purposes. Moreover, the residual variances for all items were uncorrelated.
Model 1: Single factor model. A single common factor was assumed to explain the
covariances between the RSES items (see Figure 2). This model corresponds to the original
construction rationale of the scale (Rosenberg, 1965) and implicitly guided most applied
research that derived simple sum scores from the RSES items.
Model 2: Acquiescence model. Self-reports are frequently distorted by systematic
response styles such as acquiescence, that is, interindividual differences in the tendency to
META-ANALYSIS OF THE RSES 13
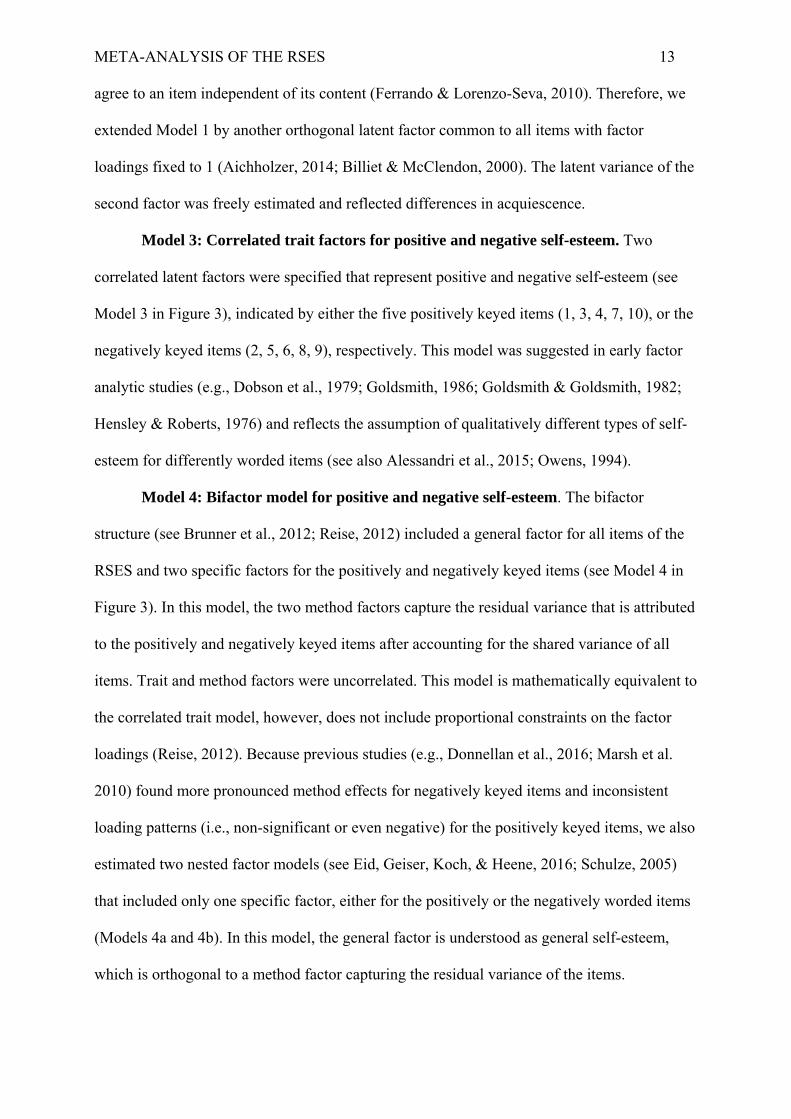
agree to an item independent of its content (Ferrando & Lorenzo-Seva, 2010). Therefore, we
extended Model 1 by another orthogonal latent factor common to all items with factor
loadings fixed to 1 (Aichholzer, 2014; Billiet & McClendon, 2000). The latent variance of the
second factor was freely estimated and reflected differences in acquiescence.
Model 3: Correlated trait factors for positive and negative self-esteem. Two
correlated latent factors were specified that represent positive and negative self-esteem (see
Model 3 in Figure 3), indicated by either the five positively keyed items (1, 3, 4, 7, 10), or the
negatively keyed items (2, 5, 6, 8, 9), respectively. This model was suggested in early factor
analytic studies (e.g., Dobson et al., 1979; Goldsmith, 1986; Goldsmith & Goldsmith, 1982;
Hensley & Roberts, 1976) and reflects the assumption of qualitatively different types of self-
esteem for differently worded items (see also Alessandri et al., 2015; Owens, 1994).
Model 4: Bifactor model for positive and negative self-esteem. The bifactor
structure (see Brunner et al., 2012; Reise, 2012) included a general factor for all items of the
RSES and two specific factors for the positively and negatively keyed items (see Model 4 in
Figure 3). In this model, the two method factors capture the residual variance that is attributed
to the positively and negatively keyed items after accounting for the shared variance of all
items. Trait and method factors were uncorrelated. This model is mathematically equivalent to
the correlated trait model, however, does not include proportional constraints on the factor
loadings (Reise, 2012). Because previous studies (e.g., Donnellan et al., 2016; Marsh et al.
2010) found more pronounced method effects for negatively keyed items and inconsistent
loading patterns (i.e., non-significant or even negative) for the positively keyed items, we also
estimated two nested factor models (see Eid, Geiser, Koch, & Heene, 2016; Schulze, 2005)
that included only one specific factor, either for the positively or the negatively worded items
(Models 4a and 4b). In this model, the general factor is understood as general self-esteem,
which is orthogonal to a method factor capturing the residual variance of the items.
META-ANALYSIS OF THE RSES 14
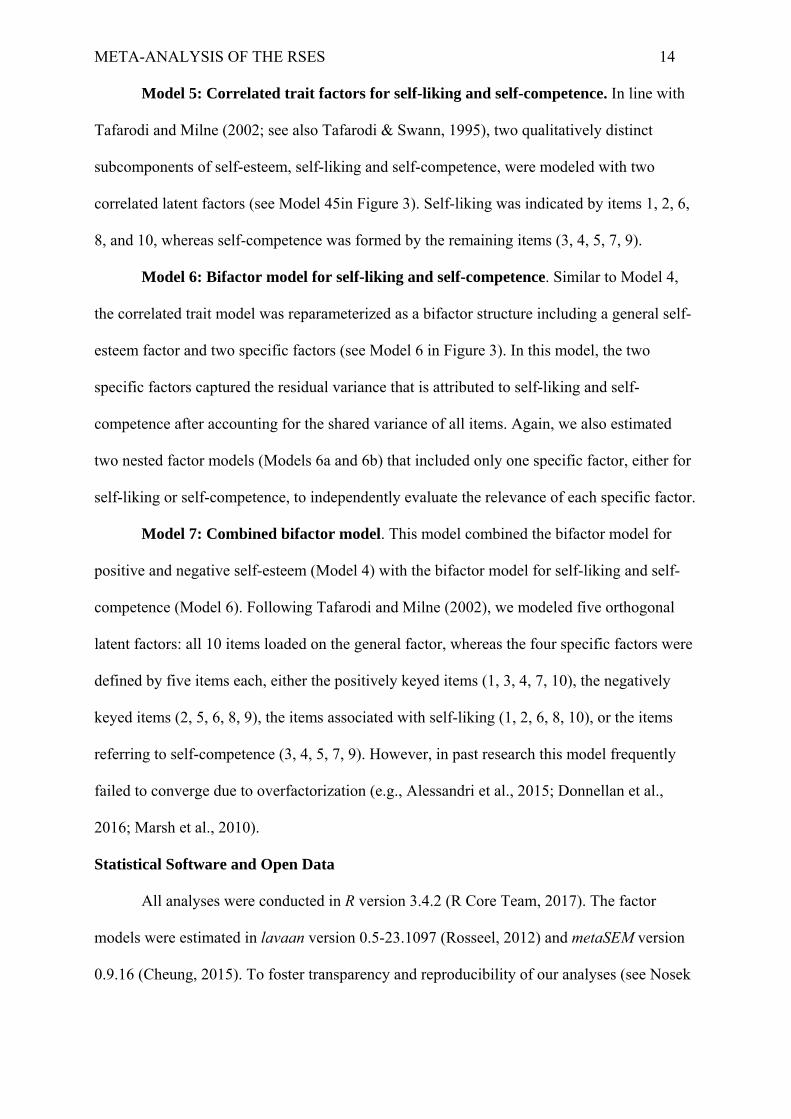
Model 5: Correlated trait factors for self-liking and self-competence. In line with
Tafarodi and Milne (2002; see also Tafarodi & Swann, 1995), two qualitatively distinct
subcomponents of self-esteem, self-liking and self-competence, were modeled with two
correlated latent factors (see Model 45in Figure 3). Self-liking was indicated by items 1, 2, 6,
8, and 10, whereas self-competence was formed by the remaining items (3, 4, 5, 7, 9).
Model 6: Bifactor model for self-liking and self-competence. Similar to Model 4,
the correlated trait model was reparameterized as a bifactor structure including a general self-
esteem factor and two specific factors (see Model 6 in Figure 3). In this model, the two
specific factors captured the residual variance that is attributed to self-liking and self-
competence after accounting for the shared variance of all items. Again, we also estimated
two nested factor models (Models 6a and 6b) that included only one specific factor, either for
self-liking or self-competence, to independently evaluate the relevance of each specific factor.
Model 7: Combined bifactor model. This model combined the bifactor model for
positive and negative self-esteem (Model 4) with the bifactor model for self-liking and self-
competence (Model 6). Following Tafarodi and Milne (2002), we modeled five orthogonal
latent factors: all 10 items loaded on the general factor, whereas the four specific factors were
defined by five items each, either the positively keyed items (1, 3, 4, 7, 10), the negatively
keyed items (2, 5, 6, 8, 9), the items associated with self-liking (1, 2, 6, 8, 10), or the items
referring to self-competence (3, 4, 5, 7, 9). However, in past research this model frequently
failed to converge due to overfactorization (e.g., Alessandri et al., 2015; Donnellan et al.,
2016; Marsh et al., 2010).
Statistical Software and Open Data
All analyses were conducted in R version 3.4.2 (R Core Team, 2017). The factor
models were estimated in lavaan version 0.5-23.1097 (Rosseel, 2012) and metaSEM version
0.9.16 (Cheung, 2015). To foster transparency and reproducibility of our analyses (see Nosek
META-ANALYSIS OF THE RSES 15
et al., 2015), we provide all coded data and the R scripts in an online repository of the Open
Science Framework: https://osf.io/uwfsp.
Results
Study Characteristics
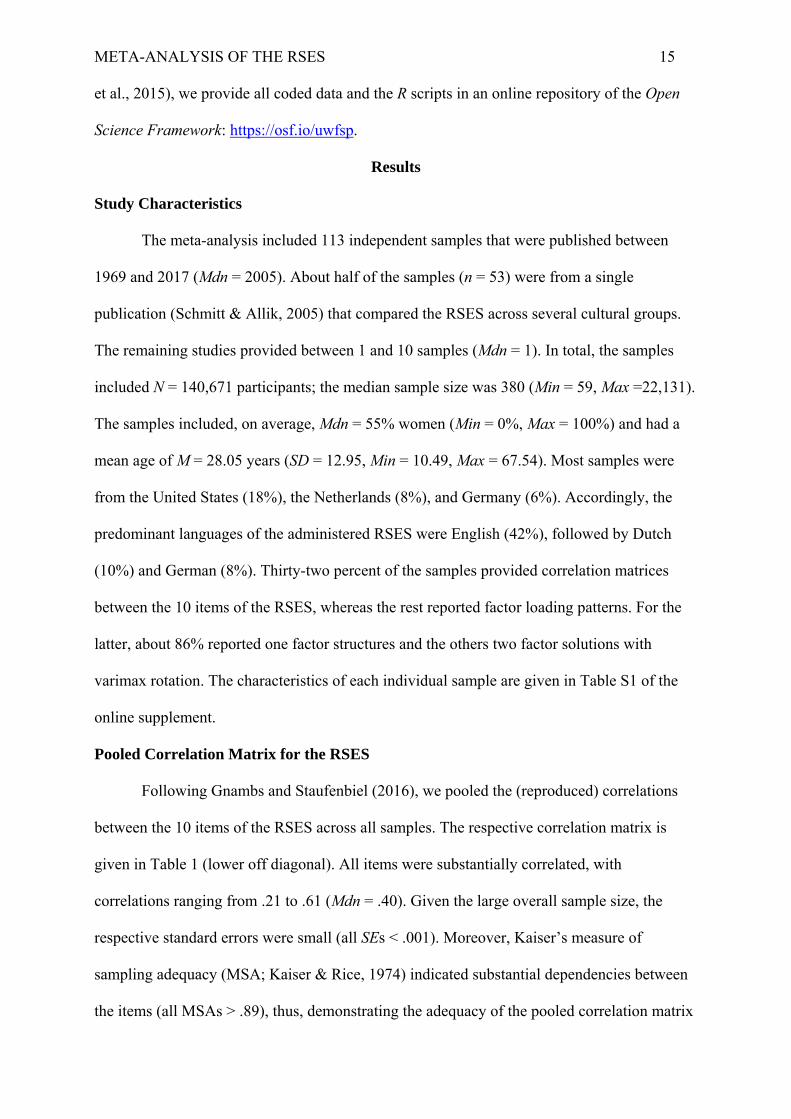
The meta-analysis included 113 independent samples that were published between
1969 and 2017 (Mdn = 2005). About half of the samples (n = 53) were from a single
publication (Schmitt & Allik, 2005) that compared the RSES across several cultural groups.
The remaining studies provided between 1 and 10 samples (Mdn = 1). In total, the samples
included N = 140,671 participants; the median sample size was 380 (Min = 59, Max =22,131).
The samples included, on average, Mdn = 55% women (Min = 0%, Max = 100%) and had a
mean age of M = 28.05 years (SD = 12.95, Min = 10.49, Max = 67.54). Most samples were
from the United States (18%), the Netherlands (8%), and Germany (6%). Accordingly, the
predominant languages of the administered RSES were English (42%), followed by Dutch
(10%) and German (8%). Thirty-two percent of the samples provided correlation matrices
between the 10 items of the RSES, whereas the rest reported factor loading patterns. For the
latter, about 86% reported one factor structures and the others two factor solutions with
varimax rotation. The characteristics of each individual sample are given in Table S1 of the
online supplement.
Pooled Correlation Matrix for the RSES
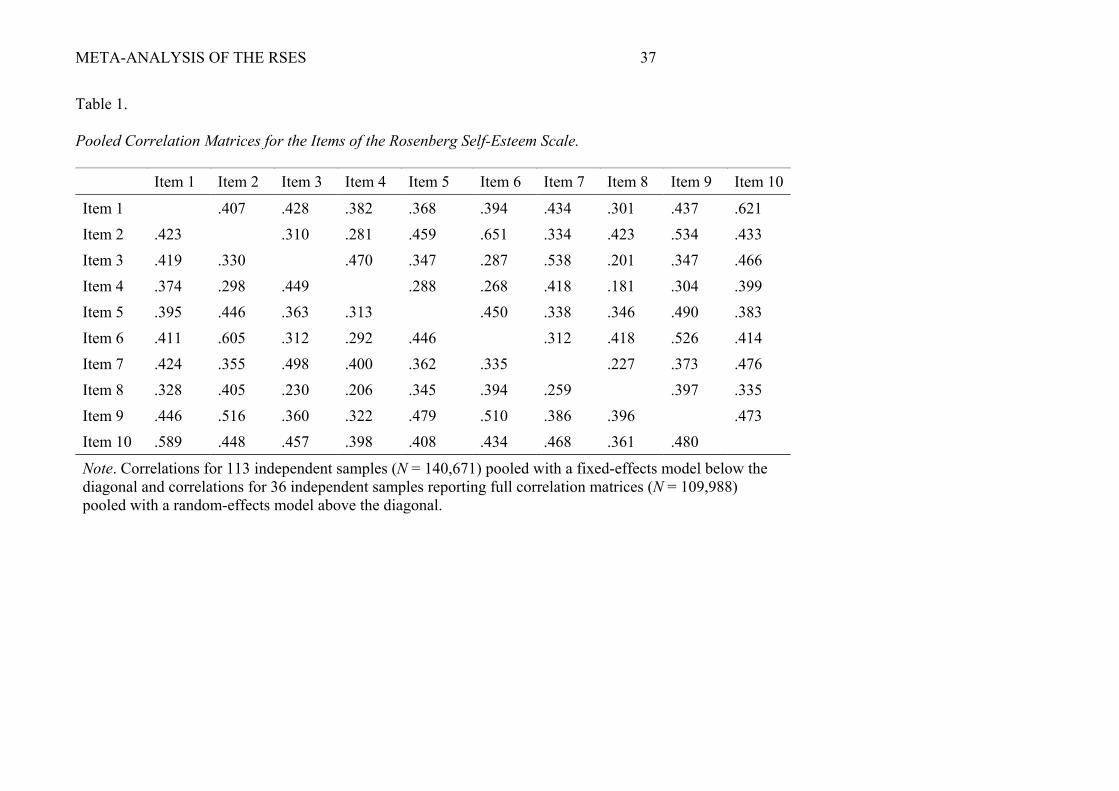
Following Gnambs and Staufenbiel (2016), we pooled the (reproduced) correlations
between the 10 items of the RSES across all samples. The respective correlation matrix is
given in Table 1 (lower off diagonal). All items were substantially correlated, with
correlations ranging from .21 to .61 (Mdn = .40). Given the large overall sample size, the
respective standard errors were small (all SEs < .001). Moreover, Kaiser’s measure of
sampling adequacy (MSA; Kaiser & Rice, 1974) indicated substantial dependencies between
the items (all MSAs > .89), thus, demonstrating the adequacy of the pooled correlation matrix

META-ANALYSIS OF THE RSES 16
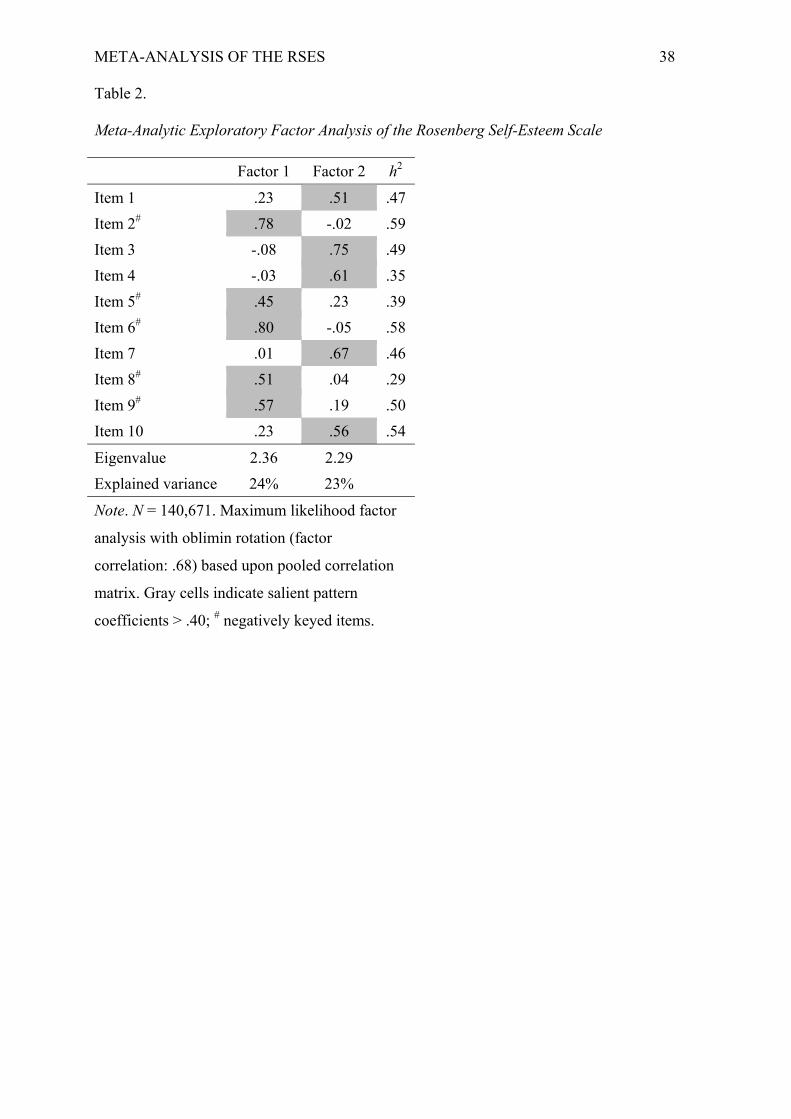
for further factor analytic examinations. The eigenvalues of the first two unrotated factors
exceeded 1 (λ1 = 4.61 and λ2 = 1.10), whereas the third did not (λ3 = 0.68). Accordingly, we
conducted an exploratory maximum likelihood factor analysis with oblimin rotation that
extracted two factors (see Table 2). These factors closely mirrored the correlated trait model
for positive and negative self-esteem (see Model 2 in Figure 3). The five negatively worded
items had salient loadings on one factor, Mdn(|λ|) = .57 (Min = .45, Max = .80), whereas the
positively worded items primarily loaded on the second factor, Mdn(|λ|) = .61 (Min = .51,
Max = .75). All cross-loadings were small, Mdn(|λ|) = .07 (Min = .01, Max = .23). Because the
two factors were substantially correlated (r = .68), the covariances between the RSES items
were at least partially attributable to a common factor.
Evaluation of Structural Models for the RSES
Given the correlated factor structure, we examined to what degree the item variances
could be explained by a general factor underlying all 10 items of the RSES. To this end, we
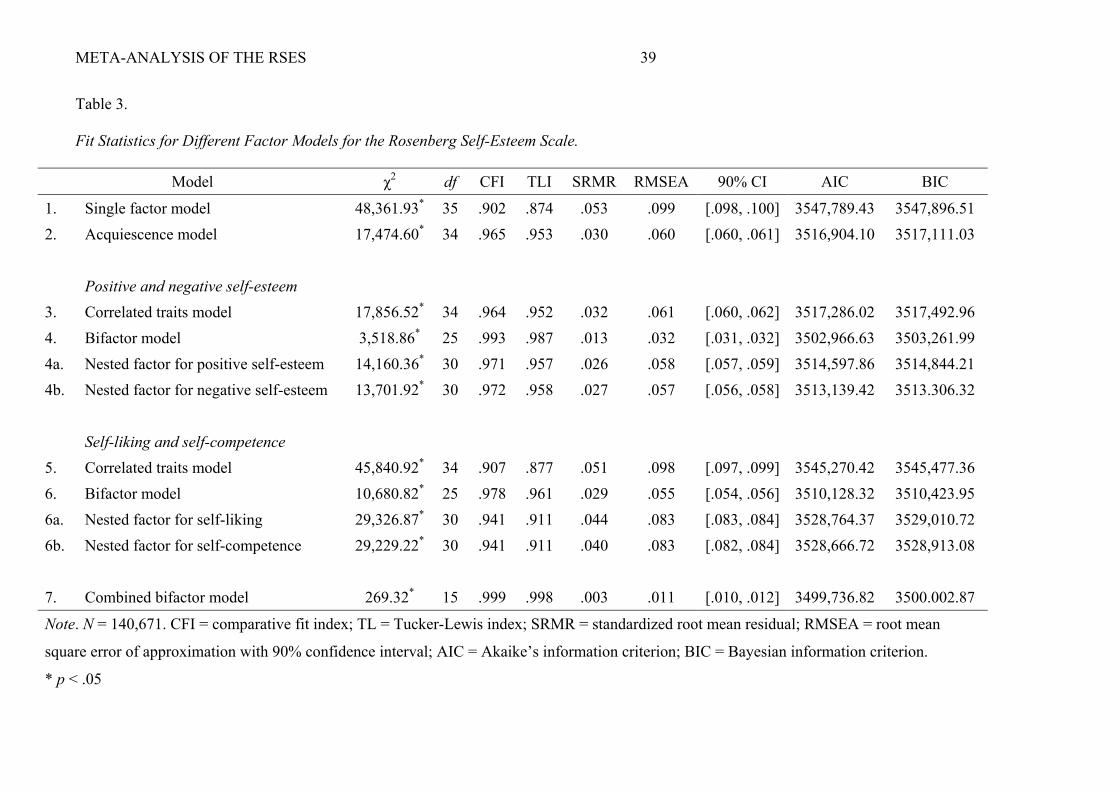
fitted 11 different structural models to the pooled correlation matrix. The fit statistics in Table
3 highlight several notable results. First, the single factor model (see Figure 2) exhibited a
rather inferior fit: CFI = .90, TLI = .87, and RMSEA = .10. This is in line with our
exploratory analyses and the prevalent factor analytic literature on the RSES (e.g., Donnellan
et al., 2016; Marsh et al., 2010; Michaelides et al., 2016). Second, although modeling an
acquiescence factor improved the model fit (CFI = .97, TLI = .95, RMSEA = .06), the latent
variance was rather small (Var = 0.049). The acquiescence factor explained less than five
percent of the common variance (ECV; Rodriguez, Reise, & Haviland, 2016). Third, all
multidimensional models for wording effects outperformed respective models for self-liking
and self-competence. Thus, there was more support for negative and positive self-esteem than
for Tafarodi’s self-esteem facets (Tafarodi & Milne; 2002; Tafarodi & Swann, 1995). Finally,
Model 7 with specific factors for wording effects, self-liking, self-competence, and a general
self-esteem factor showed the best fit in terms of the information criteria. However, the
META-ANALYSIS OF THE RSES 17
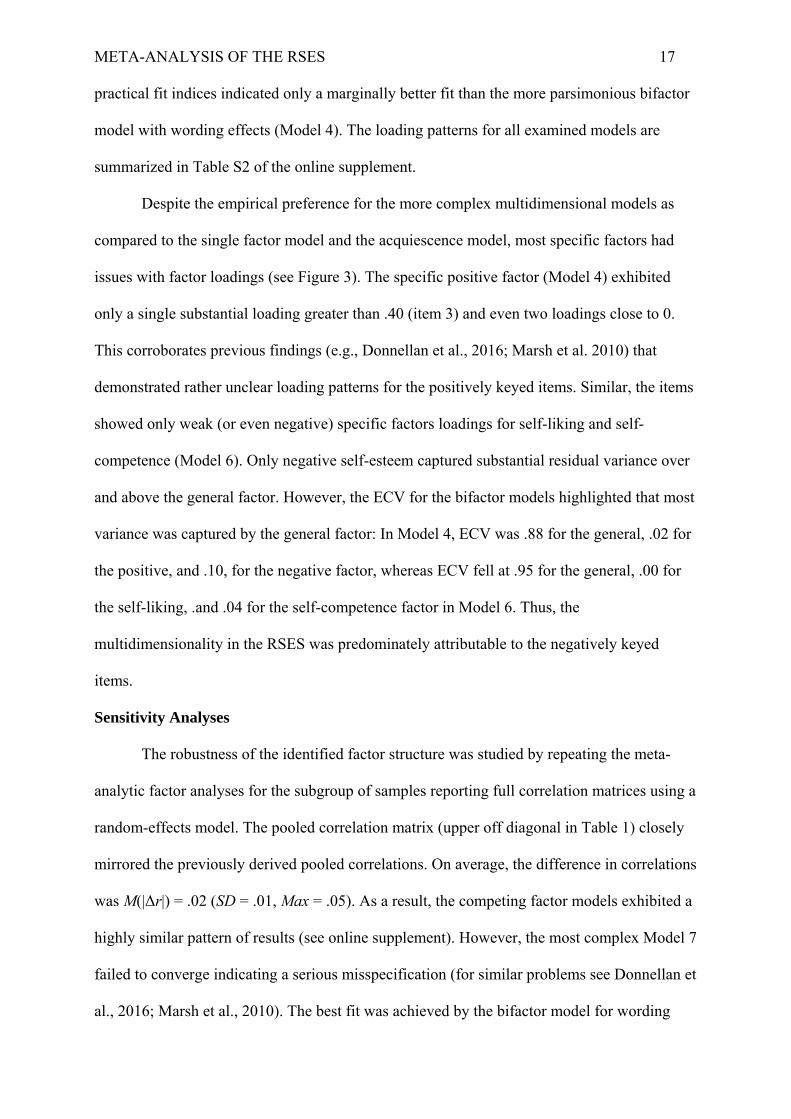
practical fit indices indicated only a marginally better fit than the more parsimonious bifactor
model with wording effects (Model 4). The loading patterns for all examined models are
summarized in Table S2 of the online supplement.
Despite the empirical preference for the more complex multidimensional models as
compared to the single factor model and the acquiescence model, most specific factors had
issues with factor loadings (see Figure 3). The specific positive factor (Model 4) exhibited
only a single substantial loading greater than .40 (item 3) and even two loadings close to 0.
This corroborates previous findings (e.g., Donnellan et al., 2016; Marsh et al. 2010) that
demonstrated rather unclear loading patterns for the positively keyed items. Similar, the items
showed only weak (or even negative) specific factors loadings for self-liking and self-
competence (Model 6). Only negative self-esteem captured substantial residual variance over
and above the general factor. However, the ECV for the bifactor models highlighted that most
variance was captured by the general factor: In Model 4, ECV was .88 for the general, .02 for
the positive, and .10, for the negative factor, whereas ECV fell at .95 for the general, .00 for
the self-liking, .and .04 for the self-competence factor in Model 6. Thus, the
multidimensionality in the RSES was predominately attributable to the negatively keyed
items.
Sensitivity Analyses
The robustness of the identified factor structure was studied by repeating the meta-
analytic factor analyses for the subgroup of samples reporting full correlation matrices using a
random-effects model. The pooled correlation matrix (upper off diagonal in Table 1) closely
mirrored the previously derived pooled correlations. On average, the difference in correlations
was M(|Δr|) = .02 (SD = .01, Max = .05). As a result, the competing factor models exhibited a
highly similar pattern of results (see online supplement). However, the most complex Model 7
failed to converge indicating a serious misspecification (for similar problems see Donnellan et
al., 2016; Marsh et al., 2010). The best fit was achieved by the bifactor model for wording

META-ANALYSIS OF THE RSES 18
effects (Model 4). Again, the general factor explained most of the common variance (ECV =
.84) as compared to the specific factors (ECV = .03 and .13).
Because the number of response options can affect factor analytic results (Beauducel
& Herzberg, 2006; Rhemtulla et al., 2012), we compared samples administering four- versus
five-point response scales. Multi-group modeling of the bifactor structure for positive and
negative self-esteem (Model 4), showed metric measurement invariance for the general factor
(ΔCFI = .003, ΔSRMR = .020). Moreover, the difference in factor loadings between the two
groups was small, M(Δβ) = .05. Thus, the response format had a negligible effect on our
results.
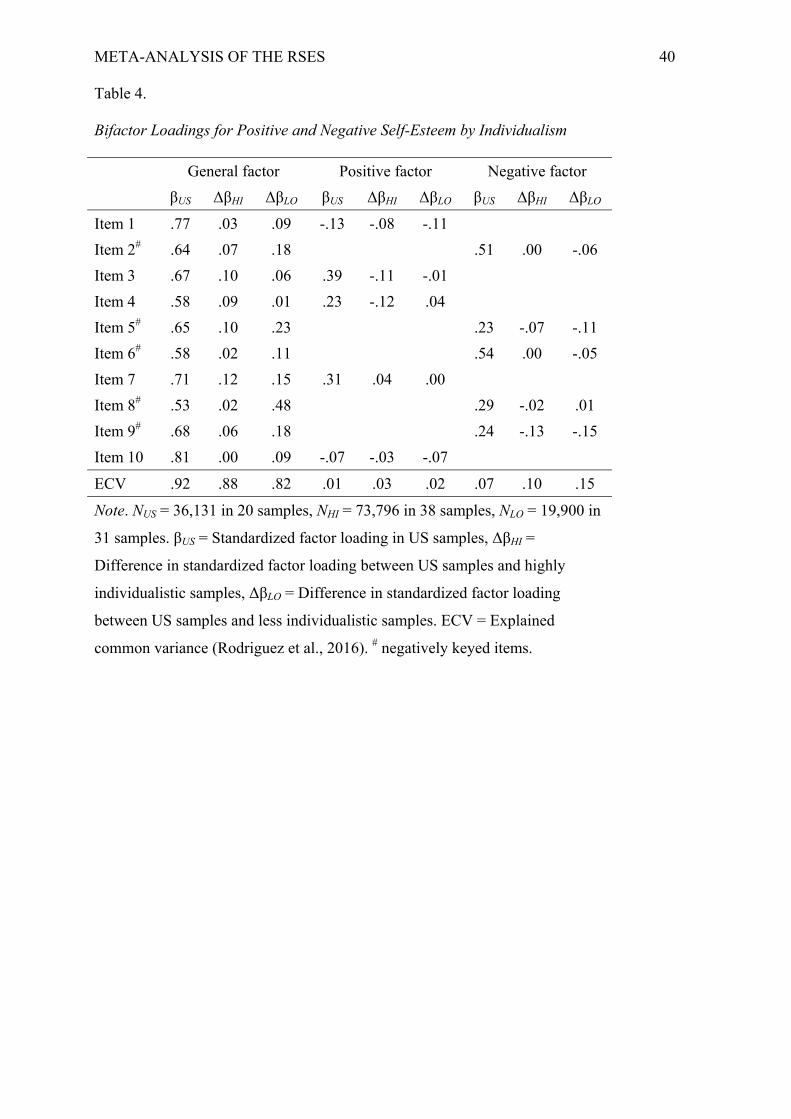
Cross-Cultural Measurement Invariance
From the United States, 20 independent samples (total N = 36,131) were available,
whereas 38 samples (total N = 73,796) and 31 samples (total N = 19,900) stemmed from
highly and less individualistic countries. An unconstrained multi-group model for these
groups resulted in an excellent fit of the bifactor model for positive and negative self-esteem
(Model 4), χ2(df = 75) = 3,918, CFI = .992, TLI = .986, SRMR = .014, RMSEA = .034.
Equality constraints on the general factor loadings across all three groups lead to a noticeably
decline in fit (ΔCFI = .007, ΔSRMR = .038), whereas respective constraints that were limited
to the United States and highly individualistic countries showed a comparable fit (ΔCFI =
.002, ΔSRMR = .020). Thus, in less individualistic countries the general factor loadings were,
on average, M(Δβ) = .16 smaller than in the United States (see Table 4). Particularly,
negatively worded items exhibited smaller loadings M(Δβ) = .24 and to a lesser degree also
positively worded items, M(Δβ) = .08. Item 8 even showed a general factor loading around 0.
As a consequence, the common variance explained by the general factor was higher in the
United States (ECV = .92) and other individualistic countries (ECV = .88) as compared to less
individualistic countries (ECV = .82). At the same time, ECV for the negative factor showed a
reversed pattern with values of .07, .10, and .15 for the three groups.
META-ANALYSIS OF THE RSES 19
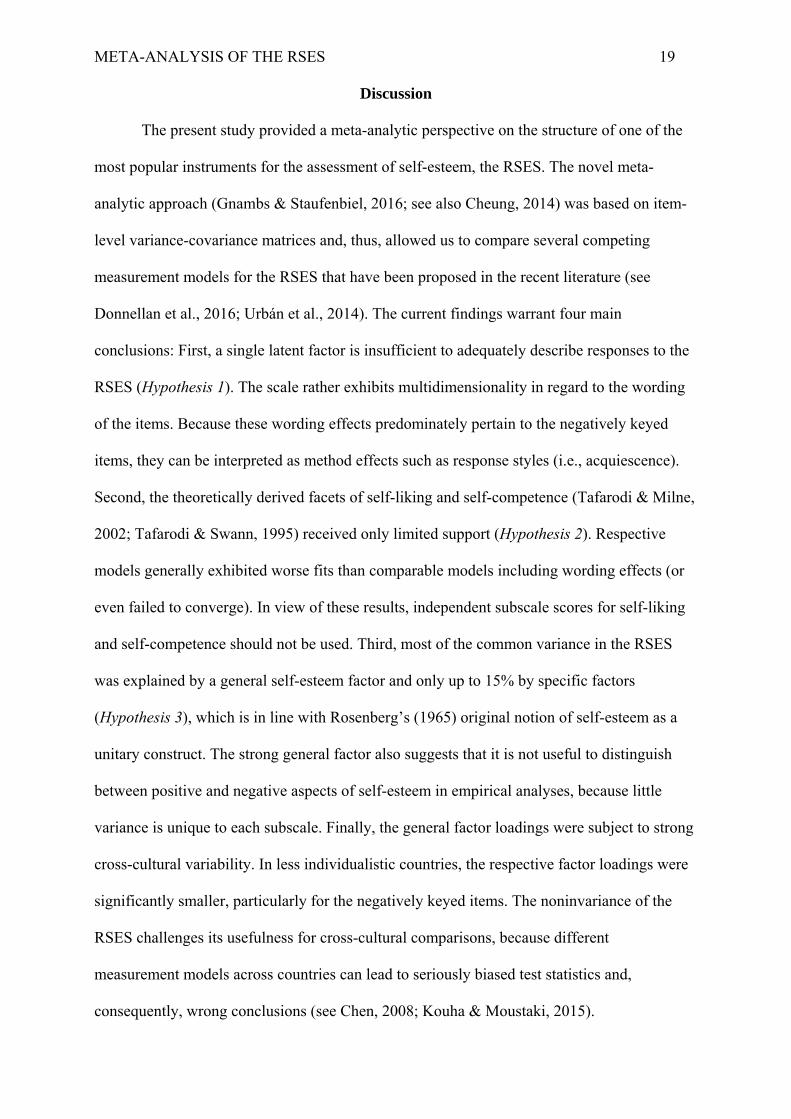
Discussion
The present study provided a meta-analytic perspective on the structure of one of the
most popular instruments for the assessment of self-esteem, the RSES. The novel meta-
analytic approach (Gnambs & Staufenbiel, 2016; see also Cheung, 2014) was based on item-
level variance-covariance matrices and, thus, allowed us to compare several competing
measurement models for the RSES that have been proposed in the recent literature (see
Donnellan et al., 2016; Urbán et al., 2014). The current findings warrant four main
conclusions: First, a single latent factor is insufficient to adequately describe responses to the
RSES (Hypothesis 1). The scale rather exhibits multidimensionality in regard to the wording
of the items. Because these wording effects predominately pertain to the negatively keyed
items, they can be interpreted as method effects such as response styles (i.e., acquiescence).
Second, the theoretically derived facets of self-liking and self-competence (Tafarodi & Milne,
2002; Tafarodi & Swann, 1995) received only limited support (Hypothesis 2). Respective
models generally exhibited worse fits than comparable models including wording effects (or
even failed to converge). In view of these results, independent subscale scores for self-liking
and self-competence should not be used. Third, most of the common variance in the RSES
was explained by a general self-esteem factor and only up to 15% by specific factors
(Hypothesis 3), which is in line with Rosenberg’s (1965) original notion of self-esteem as a
unitary construct. The strong general factor also suggests that it is not useful to distinguish
between positive and negative aspects of self-esteem in empirical analyses, because little
variance is unique to each subscale. Finally, the general factor loadings were subject to strong
cross-cultural variability. In less individualistic countries, the respective factor loadings were
significantly smaller, particularly for the negatively keyed items. The noninvariance of the
RSES challenges its usefulness for cross-cultural comparisons, because different
measurement models across countries can lead to seriously biased test statistics and,
consequently, wrong conclusions (see Chen, 2008; Kouha & Moustaki, 2015).
META-ANALYSIS OF THE RSES 20
What are the practical implications of these results for the measurement of self-
esteem? Although the RSES is not strictly unidimensional, secondary dimensions only have a
modest impact on the item responses and, thus, introduce a seemingly small bias in composite
scores of the RSES. In fact, there are authors arguing that the validity of the general self-
esteem factor seems hardly to be affected in case wording effects are not controlled for
(Donnellan et al., 2016). More troublesome is the lack of cross-cultural measurement
invariance. If members of different cultural groups (i.e., individualistic versus collectivistic)
interpret items of the RSES differently, the resulting scale scores cannot be meaningfully
compared (van de Vijver & Poortinga, 1997). Particularly, negatively worded items exhibited
smaller loadings on the general self-esteem factor among members of less as compared to
highly individualistic societies. These results fall in line with an international large-scale
administration of the RSES (Schmitt & Allik, 2005) that found negatively worded items to be
interpreted differently across cultural heterogeneous groups. Moreover, items referring to
pride and respect exhibited significantly lower loadings on the general self-esteem factor.
Presumably, these concepts convey a different meaning in less individualistic societies.
Whereas pride of one’s accomplishments might reflect a healthy form of self-confidence in
individualistic countries such as the United States, it might be conceived as presumptuous and
arrogant in societies valuing modesty (Wu, 2008). Thus, out of modesty people from less
individualistic countries might be unwilling to emphasize their self-worth. Although the
reasons for the observed noninvariance remain speculative, the bottom line is that cross-
cultural research with the RSES might unjustifiably align incomparable concepts, unless
measurement invariance has been explicitly corroborated for the countries at hand.
Finally, we want to acknowledge some limitations in our study that might open
avenues for future research. Meta-analytic conclusions can only be as good as the quality of
the included primary studies. For example, intense random responding in some samples
(Huang & Bowling, 2015) or different assessment contexts (see also Gnambs & Kaspar, 2015,
META-ANALYSIS OF THE RSES 21
2017) might have distorted the reported effect sizes and, consequently, biased the meta-
analytic factor models. Similar, splitting continuous moderators into qualitatively distinct
groups is associated with several methodological problems (see MacCallum et al., 2002).
Therefore, the present results should be replicated with individual-participant data, preferably
from representative large-scale assessments (cf. Cheung & Jak, 2016; Kaufman, Reips, &
Merki, 2016), that allow for an appropriate modeling of moderated factor structures (see
Klein & Moosbrugger, 2000; Molenaar, Dolan, Wicherts, & van der Maas, 2010). However,
we also think that the adopted meta-analytic approach provides excellent possibilities to
aggregate inconsistent results. MASEM allows scrutinizing the heterogeneity of published
studies in search for potential moderators. Accordingly, we think that it is now time to
abandon simple factor analytic research on the RSES in yet another sample and, rather, move
on to identify moderating influences that explain why the scale exhibits, for example, strong
wording effects in some samples and not in others (cf. Gnambs & Schroeders, 2017; Marsh,
1996). In addition, it seems important to evaluate under what circumstances neglecting to
model secondary factors, in fact, does not lead to substantial bias in applied settings. Finally,
we hope to see more research tackling the problem of measurement invariance in the
assessment of non-cognitive abilities (van de Vijver & He, 2016), particularly for the coherent
measurement of self-esteem across culturally diverse groups. There is ample evidence that
cross-group comparisons may be severely distorted (Chen, 2008; Kouha & Moustaki, 2015),
unless measurement equivalence has been corroborated for the samples at hand. Therefore,
we hope that the presented results will stimulate further research on the measurement of self-
esteem across different cultures and societies.
META-ANALYSIS OF THE RSES 22
References
Aichholzer, J. (2014). Random intercept EFA of personality scales. Journal of Research in
Personality, 53, 1-4. doi:10.1016/j.jrp.2014.07.001
Alessandri, G., Vecchione, M., Eisenberg, N., & Łaguna, M. (2015). On the factor structure
of the Rosenberg (1965) General Self-Esteem Scale. Psychological Assessment, 27, 621-
635. doi:10.1037/pas0000073
*Bagley, C., Bolitho, F., & Bertrand, L. (1997). Norms and construct validity of the
Rosenberg self-esteem scale in Canadian high school populations: Implications for
counseling. Canadian Journal of Counseling, 31, 82-92.
Bandura, A. (1977). Self-efficacy toward a unifying theory of behavioral change. Psychology
Review, 84, 191-215. doi:10.1037/0033-295X.84.2.191
Baranik, L. E., Meade, A. W., Lakey, C. E., Lance, C. E., Hu, C., Hua, W., & Michalos, A.
(2008). Examining the differential item functioning of the Rosenberg Self�Esteem
Scale across eight countries. Journal of Applied Social Psychology, 38, 1867-1904.
doi:10.1111/j.1559-1816.2008.00372.x
Beauducel, A., & Herzberg, P. Y. (2006). On the performance of maximum likelihood versus
means and variance adjusted weighted least squares estimation in CFA. Structural
Equation Modeling, 13, 186-203. doi:10.1207/s15328007sem1302_2
Becker, B. J. (1992). Using results from replicated studies to estimate linear models. Journal
of Educational Statistics, 17, 341-362. doi:10.3102/10769986017004341
Billiet, J. B., & McClendon, M. J. (2000). Modeling acquiescence in measurement models for
two balanced sets of items. Structural Equation Modeling, 7, 608-628.
doi:10.1207/S15328007SEM0704_5
*Blossfeld, H.-P., Roßbach, H.-G, & von Maurice, J. (Eds.) (2011). Education as a lifelong
process - The German National Educational Panel Study (NEPS). [Special Issue]
Zeitschrift für Erziehungswissenschaft, 14. Retrieved from http://www.neps-data.de
META-ANALYSIS OF THE RSES 23
Brunner, M., Nagy, G., & Wilhelm, O. (2012). A tutorial on hierarchically structured
constructs. Journal of Personality, 80, 796-846. doi:10.1111/j.1467-
6494.2011.00749.x
*Carmines, E. G., & Zeller, R. A. (1979). Reliability and Validity Assessment. Beverly Hills,
CA: Sage University Press.
*CentERdata. (2008). Longitudinal Internet Studies for the Social Sciences [computer file].
Tilburg, Netherlands: Tilburg University [distributor]. Retrieved from
http://www.lissdata.nl
*Chao, R. C.-L., Vidacovich, C., & Green, K. E. (2017). Rasch analysis of the Rosenberg
self-esteem scale with African Americans. Psychological Assessment, 29, 329-342.
doi:10.1037/pas0000347
Chen, F. F. (2008). What happens if we compare chopsticks with forks? The impact of
making inappropriate comparisons in cross-cultural research. Journal of Personality
and Social Psychology, 95, 1005-1018. doi:10.1037/a0013193
Cheung, M. W. L. (2014). Fixed-and random-effects meta-analytic structural equation
modeling: Examples and analyses in R. Behavior Research Methods, 46, 29-40.
doi:10.3758/s13428-013-0361-y
Cheung, M. W. L. (2015). metaSEM: An R package for meta-analysis using structural
equation modeling. Frontiers in Psychology, 5, 1521. doi:10.3389/fpsyg.2014.01521
Cheung, M. W. L., & Chan, W. (2005). Meta-analytic structural equation modeling: a two-
stage approach. Psychological Methods, 10, 40-64. doi:10.1037/1082-989X.10.1.40
Cheung, M. W. L., & Jak, S. (2016). Analyzing big data in psychology: a split/analyze/meta-
analyze approach. Frontiers in Psychology, 7. doi:10.3389/fpsyg.2016.00738
DiStefano, C., & Motl, R. W. (2006). Further investigating method effects associated with
negatively worded items on self-report surveys. Structural Equation Modeling, 13,
440-464. doi:10.1207/s15328007sem1303_6
META-ANALYSIS OF THE RSES 24
DiStefano, C., & Motl, R. W. (2009). Self-esteem and method effects associated with
negatively worded items: Investigating factorial invariance by sex. Structural
Equation Modeling, 16, 134-146. doi:10.1080/10705510802565403
*Dobson, C., Goudy, W. J., Keith, P. M., & Powers, E. (1979). Further analyses of
Rosenberg’s self-esteem scale. Psychological Reports, 44, 639, 641.
doi:10.2466/pr0.1979.44.2.639
*Donnellan, M. B., Ackerman, R. A., & Brecheen, C. (2016). Extending structural analyses of
the Rosenberg self-esteem scale to consider criterion-related validity: Can composite
self-esteem scores be good enough? Journal of Personality Assessment, 98, 169-177,
doi:10.1080/00223891.2015.1058268
Dorans, N. J., & Holland, P. W. (1993). DIF detection and description: Mantel-Haenszel and
standardization. In P. W. Hollan d& H. Wainer (Eds.), Differential item functioning
(pp. 35-66). Mahwah, NJ: Erlbaum.
Eid, M., Geiser, C., Koch, T., & Heene, M. (2016). Anomalous results in g-factor models:
Explanations and alternatives. Psychological Methods. Advance online publication.
doi:10.1037/met0000083
Epstein, J. A., Griffin, K. W., & Botvin, G. J. (2004). Efficacy, self-derogation, and alcohol
use among inner-city adolescents: Gender matters. Journal of Youth and Adolescence,
33, 159-166. doi:10.1023/B:JOYO.0000013427.31960.c6
*Farid, M. F., & Akhtar, M. (2013). Self-esteem of secondary school students in Pakistan.
Middle-East Journal of Scientific Research, 14, 1325-1330.
Farruggia, S. P., Chen, C., Greenberger, E., Dmitrieva, J., & Macek, P. (2004). Adolescent
self-esteem in cross-cultural perspective: Testing measurement equivalence and a
mediation model. Journal of Cross-Cultural Psychology, 35, 719-733.
doi:10.1177/0022022104270114
META-ANALYSIS OF THE RSES 25
Ferrando, P. J., & Lorenzo‐Seva, U. (2010). Acquiescence as a source of bias and model and
person misfit: A theoretical and empirical analysis. British Journal of Mathematical
and Statistical Psychology, 63, 427-448. doi:10.1348/000711009X470740
*Franck, E., de Raedt, R., Barbez, C., & Rosseel, Y. (2008). Psychometric properties of the
Dutch Rosenberg self-esteem scale. Psychologica Belgica, 48, 25-35. doi:10.5334/pb-
48-1-25
Gnambs, T., & Kaspar, K. (2015). Disclosure of sensitive behaviors across self-administered
survey modes: A meta-analysis. Behavior Research Methods, 47, 1237-1259.
doi:10.3758/s13428-014-0533-4
Gnambs, T., & Kaspar, K. (2017). Socially desirable responding in web-based questionnaires:
A meta-analytic review of the candor hypothesis. Assessment, 24, 746-762.
doi:10.1177/1073191115624547
*Gnambs, T., & Schroeders, U. (2017). Cognitive Abilities Explain Wording Effects in the
Rosenberg Self-Esteem Scale. Manuscript submitted for publication.
Gnambs, T., & Staufenbiel, T. (2016). Parameter accuracy in meta-analyses of factor
structures. Research Synthesis Methods, 7, 168-186. doi:10.1002/jrsm.1190
*Goldsmith, R. E. (1986). Personality and adaptive-innovative problem solving. Journal of
Social Behavior and Personality, 1, 95-106.
*Goldsmith, R. E., & Goldsmith, E. B. (1982). Dogmatism and self-esteem: Further evidence.
Psychological Reports, 51, 289-290. doi:10.2466/pr0.1982.51.1.289
*Gray-Little, B., Williams, V. S. L., Hancock, T. D. (1997). An item response theory analysis
of the Rosenberg self-esteem scale. Personality and Social Psychology Bulletin, 23,
443-451. doi:10.1177/0146167297235001
He, J., Bartram, D., Inceoglu, I., & van de Vijver, F. J. (2014). Response styles and
personality traits: A multilevel analysis. Journal of Cross-Cultural Psychology, 45,
1028-1045. doi:10.1177/0022022114534773
META-ANALYSIS OF THE RSES 26
He, J., Vliert, E., & Vijver, F. J. (2016). Extreme response style as a cultural response to
climato�economic deprivation. International Journal of Psychology. Advance online
publication. doi:10.1002/ijop.12287
*Hensley, W. E. (1977). Differences between males and females on Rosenburg scale of self-
esteem. Psychological Reports, 41, 829-830. doi:10.2466/pr0.1977.41.3.829
*Hensley, W. E., & Roberts, M. K. (1976). Dimensions of Rosenburg’s self-esteem scale.
Psychological Reports, 38, 583-584. doi:10.2466/pr0.1976.38.2.583
*Hesketh, T., Lu, L., & Dong, Z. X. (2012). Impact of high sex ratios on urban and rural
China, 2009-2010 [computer file]. Colchester, Essex: UK Data Archive [distributor].
doi:10.5255/UKDA-SN-7107-1
Huang, C., & Dong, N. (2012). Factor structures of the Rosenberg Self-Esteem Scale: A
meta-analysis of pattern matrices. European Journal of Psychological Assessment, 28,
132-138. doi:10.1027/1015-5759/a000101
Huang, J. L., Liu, M., & Bowling, N. A. (2015). Insufficient effort responding: Examining an
insidious confound in survey data. Journal of Applied Psychology, 100, 828-845.
doi:10.1037/a0038510
Hofstede, G., Hofstede, G. J., & Minkov, M. (2010). Cultures and Organizations. New York,
NY: McGraw Hill.
Jak, S. (2015). Meta-analytic structural equation modelling. Berlin, Germany: Springer.
Johnson, T., Kulesa, P., Cho, Y. I., & Shavitt, S. (2005). The relation between culture and
response styles: Evidence from 19 countries. Journal of Cross-Cultural Psychology,
36, 264-277. doi:10.1177/0022022104272905
Kaplan, H. B., Martin, S. S., & Robbins, C. (1982). Application of a general theory of deviant
behavior: Self-derogation and adolescent drug use. Journal of Health and Social
Behavior, 23, 274-294. doi:10.2307/2136487
META-ANALYSIS OF THE RSES 27
*Kaplan, H. B., & Pokorny, A. D. (1969). Self-derogation and psychological adjustment.
Journal of Nervous and Mental Disease, 149, 421-434. doi:10.1097/00005053-
196911000-00006
Kaiser, H. F., & Rice, J. (1974). Little jiffy, mark IV. Educational and Psychological
Measurement, 34, 111.117. doi:10.1177/001316447403400115
Kaufmann, E., Reips, U. D., & Merki, K. M. (2016). Avoiding methodological biases in
meta-analysis. Zeitschrift für Psychologie, 224, 157-167. oi:10.1027/2151-
2604/a000251
Khojasteh, K., & Lo,W.-J. (2015). Investigating the sensitivity of goodness-of-fit indices to
detect measurement invariance in a bifactor model. Structural Equation Modeling, 22,
531-541. doi:10.1080/10705511.2014.937791
Kuha, J., & Moustaki, I. (2015). Non-equivalence of measurement in latent variable modeling
of multi group data: a sensitivity analysis. Psychological Methods, 20, 523-536.
doi:10.1037/met0000031
Klein, A., & Moosbrugger, H. (2000). Maximum likelihood estimation of latent interaction
effects with the LMS method. Psychometrika, 65, 457-474. doi:10.1007/BF02296338
LeBreton, J. M., & Senter, J. L. (2008). Answers to 20 questions about interrater reliability
and interrater agreement. Organizational Research Methods, 11, 815-852.
doi:10.1177/1094428106296642
MacCallum, R. C., Zhang, S., Preacher, K. J., & Rucker, D. D. (2002). On the practice of
dichotomization of quantitative variables. Psychological Methods, 7, 19-40.
doi:10.1037/1082-989X.7.1.19
Marsh, H. W. (1996). Positive and negative global self-esteem: A substantively meaningful
distinction or artifactors? Journal of Personality and Social Psychology, 70, 810-9.
doi:10.1037/0022-3514.70.4.810
META-ANALYSIS OF THE RSES 28
Marsh, H. W., Nagengast, B., & Morin, A. J. (2013). Measurement invariance of Big-Five
factors over the life span: ESEM tests of gender, age, plasticity, maturity, and la dolce
vita effects. Developmental Psychology, 49, 1194-1218. doi:10.1037/a0026913
Marsh, H. W., Scalas, L. F., & Nagengast, B. (2010). Longitudinal tests of competing factor
structures for the Rosenberg Self-Esteem Scale: Traits, ephemeral artifacts, and stable
response styles. Psychological Assessment, 22, 366-381. doi:10.1037/a0019225
Meade, A. W., Johnson, E. C., & Braddy, P. W. (2008). Power and sensitivity of alternative
fit indices in tests of measurement invariance. Journal of Applied Psychology, 93, 568-
592. doi:10.1037/0021-9010.93.3.568
*Meurer, S. T., Luft, C. B., Benedetti, T. R., & Mazo, G. Z. (2012). Validade de construto e
consistência interna da escala deautoestima de Rosenberg para uma população de
idososbrasileiros praticantes de atividades físicas [Construct validity and reliability in
Rosenberg’s self-steem scale for Brazilian older adults who practice physical
activities]. Motricidade, 8, 5-15. doi:10.6063/motricidade.8(4).1548
Michaelides, M. P., Koutsogiorgi, C., & Panayiotou, G. (2016). Method effects on an
adaptation of the Rosenberg self-esteem scale in Greek and the role of personality
traits. Journal of Personality Assessment, 98, 178-188.
doi:10.1080/00223891.2015.1089248
*Mimura, C., & Griffiths, P. (2007). A Japanese version of the Rosenberg self-esteem scale:
Translation and equivalence assessment. Journal of Psychosomatic Research, 62, 589-
594. doi:10.1016/j.jpsychores.2006.11.004
Minkov, M., Minkov, M., Dutt, P., Dutt, P., Schachner, M., Schachner, M., ... & Jandosova, J.
(2017). A revision of Hofstede’s individualism-collectivism dimension: a new national
index from a 56-country study. Cross Cultural & Strategic Management, 24, 386-404.
doi:10.1108/CCSM-11-2016-019
META-ANALYSIS OF THE RSES 29
*Mlačić, B., Milas, G., & Kratohvil, A. (2007). Adolescent personality and self-esteem – An
analysis of self-report and parental-ratings. Društvena istraživanja-Časopis za opća
društvena pitanja, 1, 213-236.
Molenaar, D., Dolan, C. V., Wicherts, J. M., & van der Maas, H. L. (2010). Modeling
differentiation of cognitive abilities within the higher-order factor model using
moderated factor analysis. Intelligence, 38, 611-624. doi:10.1016/j.intell.2010.09.002
Nosek, B. A., Alter, G., Banks, G. C., Borsboom, D., Bowman, S. D., Breckler, S. J., …
Yarkoni, T. (2015). Promoting an open research culture. Science, 348(6242), 1420-
1422. doi:10.1126/science.aab2374
*O’Brien, E. J. (1985). Global self-esteem scales: Unidimensional or multidimensional?
Psychological Reports, 57, 383-389. doi:10.2466/pr0.1985.57.2.383
*Open Psychology Data (2014). Answers to the Rosenberg Self-Esteem Scale. Retrieved from
http://personality-testing.info/_rawdata/
Owens, T. J. (1994). Two dimensions of self-esteem: Reciprocal effects of positive self-worth
and self-deprecation on adolescent problems. American Sociological Review, 59, 391-
407. doi:10.2307/2095940
*Portes, A., & Rumbaut, R. G. (2012). Children of Immigrants Longitudinal Study (CILS),
1991-2006. ICPSR20520-v2. Ann Arbor, MI: Inter-university Consortium for Political
and Social Research [distributor]. doi:10.3886/ICPSR20520.v2
Preacher, K. J., & MacCallum, R. C. (2003). Repairing Tom Swift's electric factor analysis
machine. Understanding Statistics, 2, 13-43. doi:10.1207/S15328031US0201_02
*Pullmann, H., & Allik, J. (2000). The Rosenberg self-esteem scale: its dimensionality,
stability and personality correlates in Estonian. Personality and Individual Differences,
28, 701-715. doi:10.1016/S0191-8869(99)00132-4
R Core Team (2017). R: A language and environment for statistical computing. R Foundation
for Statistical Computing, Vienna, Austria. URLhttps://www.R-project.org/.
META-ANALYSIS OF THE RSES 30
Reise, S. P. (2012): The rediscovery of bifactor measurement models. Multivariate
Behavioral Research, 47, 667-696. doi:10.1080/00273171.2012.715555
Reise, S. P., Moore, T. M., & Haviland, M. G. (2010). Bifactor models and rotations:
Exploring the extent to which multidimensional data yield univocal scale scores.
Journal of Personality Assessment, 92, 544-559. doi:10.1080/00223891.2010.496477
Reise, S. P., Kim, D. S., Mansolf, M., & Widaman, K. F. (2016). Is the bifactor model a better
model or Ii it just better at modeling implausible responses? Application of iteratively
reweighted least squares to the Rosenberg Self-Esteem Scale. Multivariate Behavioral
Research, 51, 818-838. doi:10.1080/00273171.2016.1243461
Rhemtulla, M., Brosseau-Liard, P. É., & Savalei, V. (2012). When can categorical variables
be treated as continuous? A comparison of robust continuous and categorical SEM
estimation methods under suboptimal conditions. Psychological Methods, 17, 354-
373. doi:10.1037/a0029315
Rodriguez, A., Reise, S. P., & Haviland, M. G. (2016). Evaluating bifactor models:
Calculating and interpreting statistical indices. Psychological Methods, 21, 137-150.
doi:10.1037/met0000045.
*Rojas-Barahona, C. A., Zegers, B., & Förster, C. A. (2009). La escala de autoestima de
Rosenberg:Validación para Chile en una muestrade jóvenes adultos, adultosy adultos
mayors [Rosenberg self-esteem scale: Validation in a representative sample of Chilean
adults]. Revista Médica de Chile, 137, 791-800. doi:10.4067/S0034-
98872009000600009
Rosenberg, M. (1965). Society and the adolescent self-image. Princeton, NJ: Princeton
University Press.
Rosseel, Y. (2012). lavaan: An R package for structural equation modeling. Journal of
Statistical Software, 48, 1-36. doi:10.18637/jss.v048.i02
META-ANALYSIS OF THE RSES 31
Saris, W. E., Satorra, A., & van der Veld, W. (2009). Testing structural equation models or
detection of misspecifications? Structural Equation Modeling, 16, 561-582.
doi:10.1080/10705510903203433
*Sarkova, M., Nagyova, I., Katreniakova, Z., Geckova, A. M., Orosova, O., van Dijk, J. P., &
van den Heufel, W. (2006). Psychometric evaluation of the General Health
Questionnaire-12 and Rosenberg self-esteem scale in Hungarian and Slovak early
adolescents. Studia Psychologica, 48, 69–79.
Schermelleh-Engel, K., Moosbrugger, H., & Müller, H. (2003). Evaluating the fit of structural
equation models: Test of significance and descriptive goodness-of-fit measures.
Methods of Psychological Research Online, 8, 23-74.
*Schmitt, D. P., & Allik, J. (2005). Simultaneous administration of the Rosenberg self-esteem
scale in 53 nations: Exploring the universal and culture-specific features of global self-
esteem. Journal of Personality and Social Psychology, 89, 623-642.
doi:10.1037/0022-3514.89.4.623
Schmitt, T. A. (2011). Current methodological considerations in exploratory and confirmatory
factor analysis. Journal of Psychoeducational Assessment, 29, 304-321.
doi:10.1177/0734282911406653
Schulze, R. (2005). Modeling structures of intelligence. In O. Wilhelm & R. W. Engle (Eds.),
Handbook of understanding and measuring intelligence (pp. 241-263). Thousand
Oaks, CA: Sage Publications.
*Shahani, C., Dipboye, R. L., & Phillips, A. P. (1990). Global self-esteem as a correlate of
work-related attitudes: A question of dimensionality. Journal of Personality
Assessment, 54, 276-288. doi:10.1207/s15327752jpa5401&2_26
Shrout, P. E., & Fleiss, J. L. (1979). Intraclass correlations: Uses in assessing rater reliability.
Psychological Bulletin, 86, 420-428. doi:10.1037/0033-2909.86.2.420
META-ANALYSIS OF THE RSES 32
*Sinclair, S. J., Blais, M. A., Gansler, D. A., Sanderber, E., Bistis, K., & LoCicero, A. (2010).
Psychometric properties of the Rosenberg self-esteem scale: Overall and across
demographic groups living within the United States. Evaluation and the Health
Professions, 33, 56-80. doi:10.1177/0163278709356187
Smith, P. B., Vignoles, V. L., Becker, M., Owe, E., Easterbrook, M. J., Brown, R., ... & Yuki,
M. (2016). Individual and culture-level components of survey response styles: A
multi-level analysis using cultural models of selfhood. International Journal of
Psychology, 51, 453-463. doi:10.1002/ijop.12293
Song, H., Cai, H., Brown, J. D., & Grimm, K. J. (2011). Differential item functioning of the
Rosenberg Self‐Esteem Scale in the US and China: Measurement bias matters. Asian
Journal of Social Psychology, 14, 176-188. doi:10.1111/j.1467-839X.2011.01347.x
Supple, A. J., Su, J., Plunkett, S. W., Peterson, G. W., & Bush, K. R. (2013). Factor structure
of the Rosenberg Self-Esteem Scale. Journal of Cross-Cultural Psychology, 44, 748-
764. doi:10.1177/0022022112468942
Tafarodi, R. W., & Milne, A. B. (2002). Decomposing global self�esteem. Journal of
Personality, 70, 443-484. doi: 10.1111/1467-6494.05017
Tafarodi, R. W., & Swann Jr, W. B. (1995). Self-linking and self-competence as dimensions
of global self-esteem: initial validation of a measure. Journal of Personality
Assessment, 65, 322-342. doi:10.1207/s15327752jpa6502_8
Tomás, J. M., Oliver, A., Galiana, L., Sancho, P., & Lila, M. (2013). Explaining method
effects associated with negatively worded items in trait and state global and domain-
specific self-esteem scales. Structural Equation Modeling, 20, 299-313.
doi:10.1080/10705511.2013.769394
Urbán, R., Szigeti, R., Kökönyei, G., & Demetrovics, Z. (2014). Global self-esteem and
method effects: Competing factor structures, longitudinal invariance, and response
META-ANALYSIS OF THE RSES 33
styles in adolescents. Behavior Research Methods, 46, 488-498. doi:10.3758/s13428-
013-0391-5
*Vasconcelos-Raposo, J., Fernandes, H. M., Teixeira, C. M., & Bertelli, R. (2012). Factorial
validity and invariance of the Rosenberg self-esteem scale among Portuguese
youngsters. Social Indicators Research, 105, 482-498. doi:10.1007/s11205-011-9782-
0
van de Vijver, F. J. R., & He, J. (2016). Bias assessment and prevention in noncognitive
outcome measures in context assessments. In S. Kuger, E. Klieme, N. Jude, & D.
Kaplan (Eds.), Assessing Contexts of Learning (pp. 229-253). Berlin, Germany:
Springer. doi:10.1007/978-3-319-45357-6_9
van de Vijver, F. J. R., & Poortinga, Y. H. (1997). Towards an integrated analysis of bias in
cross-cultural assessment. European Journal of Psychological Assessment, 13, 29-37.
doi:10.1027/1015-5759.13.1.29
*Welsh Assembly Government, Social Research Division. (2011). National Survey for Wales,
2009-2010: Pilot Study [computer file]. Colchester, Essex: UK Data Archive
[distributor]. doi:10.5255/UKDA-SN-6720-1
*Whiteside-Mansell, L., & Corwyn, R. F. (2003). Mean and covariance structure analyses:
An examination of the Rosenberg self-esteem scale among adolescents and adults.
Educational and Psychological Measurement, 63, 163-173.
doi:10.1177/0013164402239323
Wicherts, J. M., & Dolan, C. V. (2010). Measurement invariance in confirmatory factor
analysis: An illustration using IQ test performance of minorities. Educational
Measurement: Issues and Practice, 29, 39-47. doi:10.1111/j.1745-3992.2010.00182.x
Wu, C.-H. (2008). An examination of the wording effect in the Rosenberg Self-Esteem Scale
among culturally Chinese people. Journal of Social Psychology, 148, 535-551.
doi:10.3200/SOCP.148.5.535-552
META-ANALYSIS OF THE RSES 34
*Yaacob, M. J. (2006). Validity and reliability study of Rosenberg self-esteem scale in
Seremban school children. Malaysian Journal of Psychiatry, 15, 35-39.
References marked with an asterisk were included in the meta-analysis.
META-ANALYSIS OF THE RSES 35
Footnotes
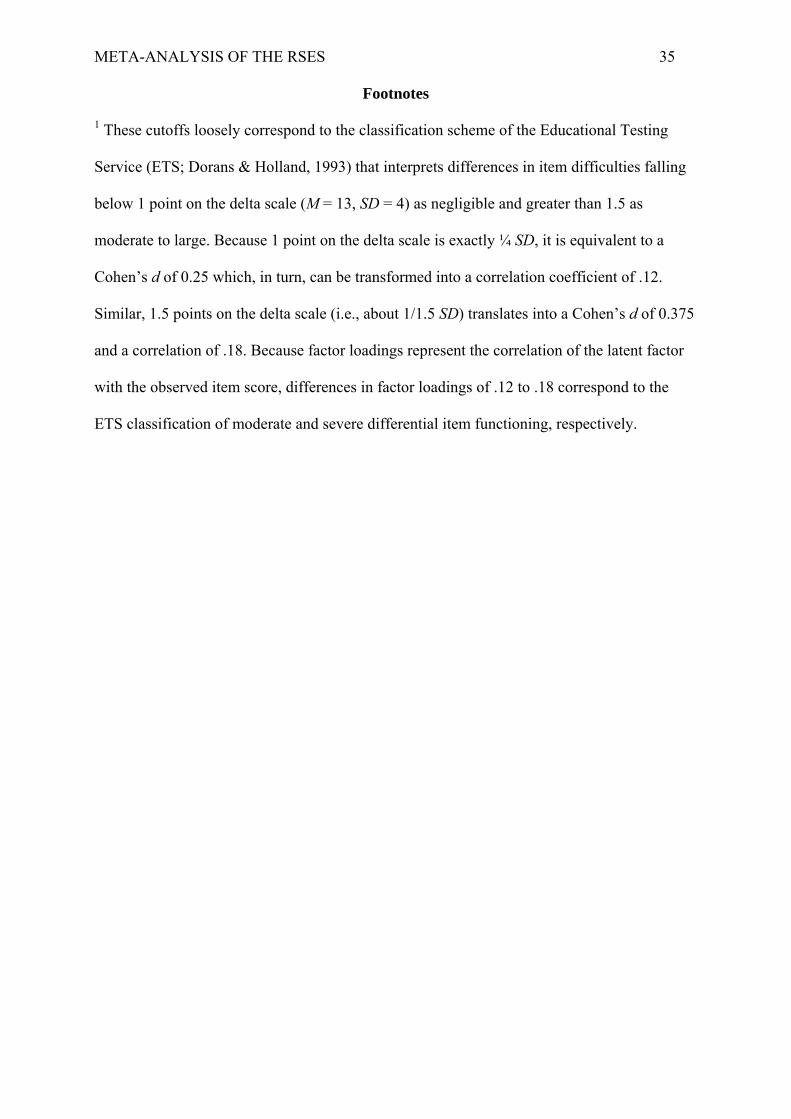
1 These cutoffs loosely correspond to the classification scheme of the Educational Testing
Service (ETS; Dorans & Holland, 1993) that interprets differences in item difficulties falling
below 1 point on the delta scale (M = 13, SD = 4) as negligible and greater than 1.5 as
moderate to large. Because 1 point on the delta scale is exactly ¼ SD, it is equivalent to a
Cohen’s d of 0.25 which, in turn, can be transformed into a correlation coefficient of .12.
Similar, 1.5 points on the delta scale (i.e., about 1/1.5 SD) translates into a Cohen’s d of 0.375
and a correlation of .18. Because factor loadings represent the correlation of the latent factor
with the observed item score, differences in factor loadings of .12 to .18 correspond to the
ETS classification of moderate and severe differential item functioning, respectively.
META-ANALYSIS OF THE RSES 36
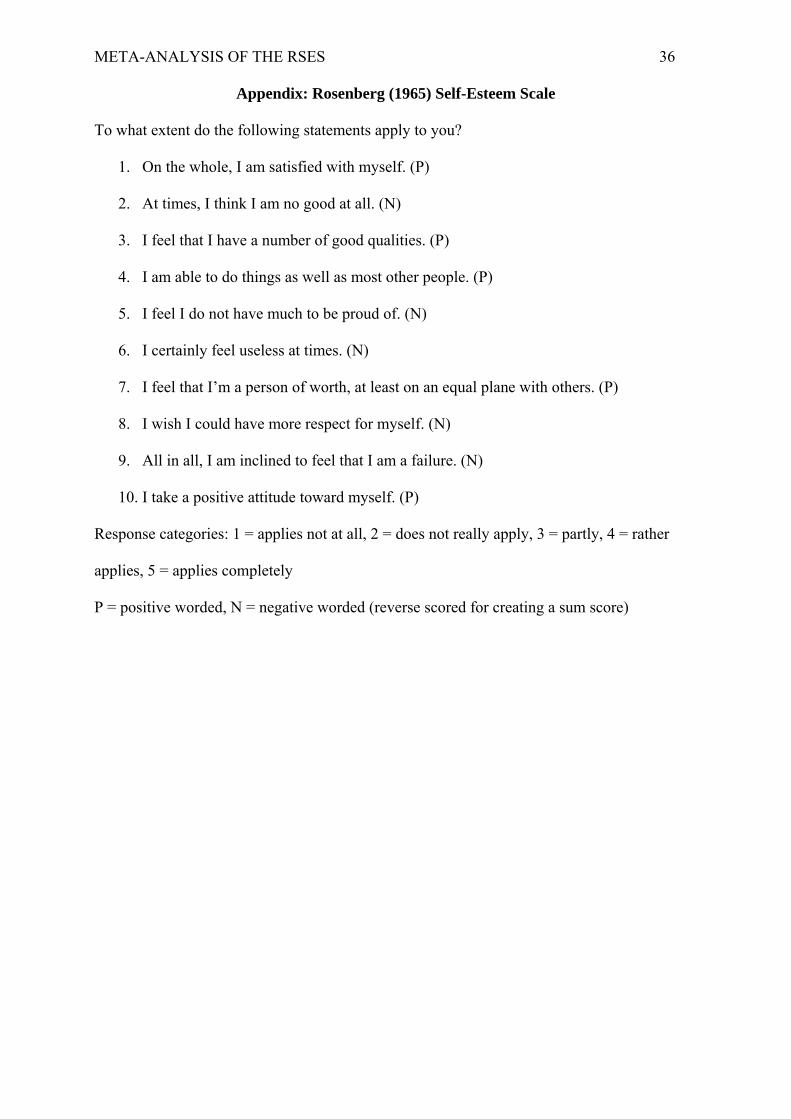
Appendix: Rosenberg (1965) Self-Esteem Scale
To what extent do the following statements apply to you?
1. On the whole, I am satisfied with myself. (P)
2. At times, I think I am no good at all. (N)
3. I feel that I have a number of good qualities. (P)
4. I am able to do things as well as most other people. (P)
5. I feel I do not have much to be proud of. (N)
6. I certainly feel useless at times. (N)
7. I feel that I’m a person of worth, at least on an equal plane with others. (P)
8. I wish I could have more respect for myself. (N)
9. All in all, I am inclined to feel that I am a failure. (N)
10. I take a positive attitude toward myself. (P)
Response categories: 1 = applies not at all, 2 = does not really apply, 3 = partly, 4 = rather
applies, 5 = applies completely
P = positive worded, N = negative worded (reverse scored for creating a sum score)
META-ANALYSIS OF THE RSES 37
Table 1.
Pooled Correlation Matrices for the Items of the Rosenberg Self-Esteem Scale.
Item 1 Item 2 Item 3 Item 4 Item 5 Item 6 Item 7 Item 8 Item 9 Item 10
Item 1 .407 .428 .382 .368 .394 .434 .301 .437 .621
Item 2 .423 .310 .281 .459 .651 .334 .423 .534 .433
Item 3 .419 .330 .470 .347 .287 .538 .201 .347 .466
Item 4 .374 .298 .449 .288 .268 .418 .181 .304 .399
Item 5 .395 .446 .363 .313 .450 .338 .346 .490 .383
Item 6 .411 .605 .312 .292 .446 .312 .418 .526 .414
Item 7 .424 .355 .498 .400 .362 .335 .227 .373 .476
Item 8 .328 .405 .230 .206 .345 .394 .259 .397 .335
Item 9 .446 .516 .360 .322 .479 .510 .386 .396 .473
Item 10 .589 .448 .457 .398 .408 .434 .468 .361 .480
Note. Correlations for 113 independent samples (N = 140,671) pooled with a fixed-effects model below the diagonal and correlations for 36 independent samples reporting full correlation matrices (N = 109,988) pooled with a random-effects model above the diagonal.
META-ANALYSIS OF THE RSES 38
Table 2.
Meta-Analytic Exploratory Factor Analysis of the Rosenberg Self-Esteem Scale
Factor 1 Factor 2 h2
Item 1 .23 .51 .47
Item 2# .78 -.02 .59
Item 3 -.08 .75 .49
Item 4 -.03 .61 .35
Item 5# .45 .23 .39
Item 6# .80 -.05 .58
Item 7 .01 .67 .46
Item 8# .51 .04 .29
Item 9# .57 .19 .50
Item 10 .23 .56 .54
Eigenvalue 2.36 2.29
Explained variance 24% 23%
Note. N = 140,671. Maximum likelihood factor
analysis with oblimin rotation (factor
correlation: .68) based upon pooled correlation
matrix. Gray cells indicate salient pattern
coefficients > .40; # negatively keyed items.
META-ANALYSIS OF THE RSES 39
Table 3.
Fit Statistics for Different Factor Models for the Rosenberg Self-Esteem Scale.
Model χ2 df CFI TLI SRMR RMSEA 90% CI AIC BIC
1. Single factor model 48,361.93* 35 .902 .874 .053 .099 [.098, .100] 3547,789.43 3547,896.51
2. Acquiescence model 17,474.60* 34 .965 .953 .030 .060 [.060, .061] 3516,904.10 3517,111.03
Positive and negative self-esteem
3. Correlated traits model 17,856.52* 34 .964 .952 .032 .061 [.060, .062] 3517,286.02 3517,492.96
4. Bifactor model 3,518.86* 25 .993 .987 .013 .032 [.031, .032] 3502,966.63 3503,261.99
4a. Nested factor for positive self-esteem 14,160.36* 30 .971 .957 .026 .058 [.057, .059] 3514,597.86 3514,844.21
4b. Nested factor for negative self-esteem 13,701.92* 30 .972 .958 .027 .057 [.056, .058] 3513,139.42 3513.306.32
Self-liking and self-competence
5. Correlated traits model 45,840.92* 34 .907 .877 .051 .098 [.097, .099] 3545,270.42 3545,477.36
6. Bifactor model 10,680.82* 25 .978 .961 .029 .055 [.054, .056] 3510,128.32 3510,423.95
6a. Nested factor for self-liking 29,326.87* 30 .941 .911 .044 .083 [.083, .084] 3528,764.37 3529,010.72
6b. Nested factor for self-competence 29,229.22* 30 .941 .911 .040 .083 [.082, .084] 3528,666.72 3528,913.08
7. Combined bifactor model 269.32* 15 .999 .998 .003 .011 [.010, .012] 3499,736.82 3500.002.87
Note. N = 140,671. CFI = comparative fit index; TL = Tucker-Lewis index; SRMR = standardized root mean residual; RMSEA = root mean
square error of approximation with 90% confidence interval; AIC = Akaike’s information criterion; BIC = Bayesian information criterion.
* p < .05
META-ANALYSIS OF THE RSES 40
Table 4.
Bifactor Loadings for Positive and Negative Self-Esteem by Individualism
General factor Positive factor Negative factor
βUS ΔβHI ΔβLO βUS ΔβHI ΔβLO βUS ΔβHI ΔβLO
Item 1 .77 .03 .09 -.13 -.08 -.11
Item 2# .64 .07 .18 .51 .00 -.06
Item 3 .67 .10 .06 .39 -.11 -.01
Item 4 .58 .09 .01 .23 -.12 .04
Item 5# .65 .10 .23 .23 -.07 -.11
Item 6# .58 .02 .11 .54 .00 -.05
Item 7 .71 .12 .15 .31 .04 .00
Item 8# .53 .02 .48 .29 -.02 .01
Item 9# .68 .06 .18 .24 -.13 -.15
Item 10 .81 .00 .09 -.07 -.03 -.07
ECV .92 .88 .82 .01 .03 .02 .07 .10 .15
Note. NUS = 36,131 in 20 samples, NHI = 73,796 in 38 samples, NLO = 19,900 in
31 samples. βUS = Standardized factor loading in US samples, ΔβHI =
Difference in standardized factor loading between US samples and highly
individualistic samples, ΔβLO = Difference in standardized factor loading
between US samples and less individualistic samples. ECV = Explained
common variance (Rodriguez et al., 2016). # negatively keyed items.
META-ANALYSIS OF THE RSES 41
Figure 1. Flowchart of search process.
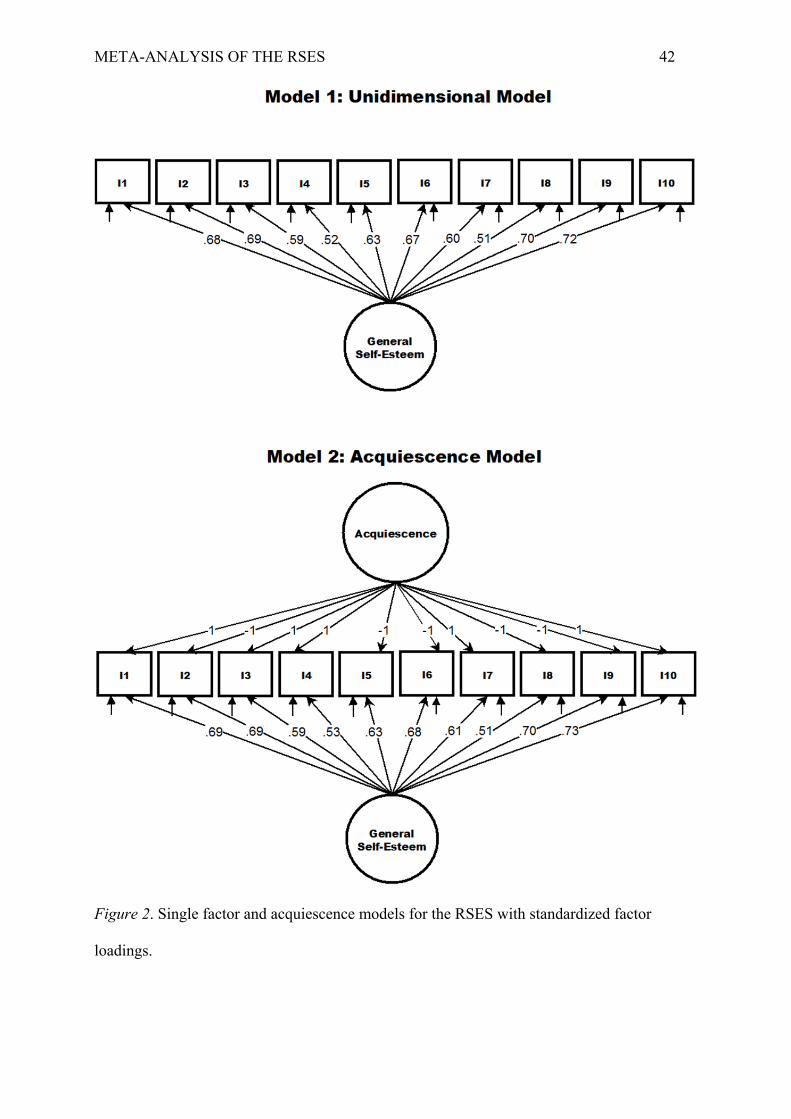
META-ANALYSIS OF THE RSES 42
Figure 2. Single factor and acquiescence models for the RSES with standardized factor
loadings.
META-ANALYSIS OF THE RSES 43
Figure 3. Multidimensional factor models for the RSES with standardized factor loadings.

Running head: Meta-Analysis of the RSES (Supplement)
Online Supplement for
“The Structure of the Rosenberg Self-Esteem Scale: A Cross-Cultural Meta-Analysis”
List of Tables
Table S1: Overview of samples in meta-analytic database
Table S2: Loading patterns for different structural models of the RSES
Table S3: Fit statistics for different factor models for the RSES based on the random-effects
two-step MASEM
List of Figures
Figure S1: Single factor model for the RSES with standardized factor loadings based on the
random-effects two-step MASEM
Figure S2: Multidimensional factor models for the RSES with standardized factor loadings
based on the random-effects two-step MASEM
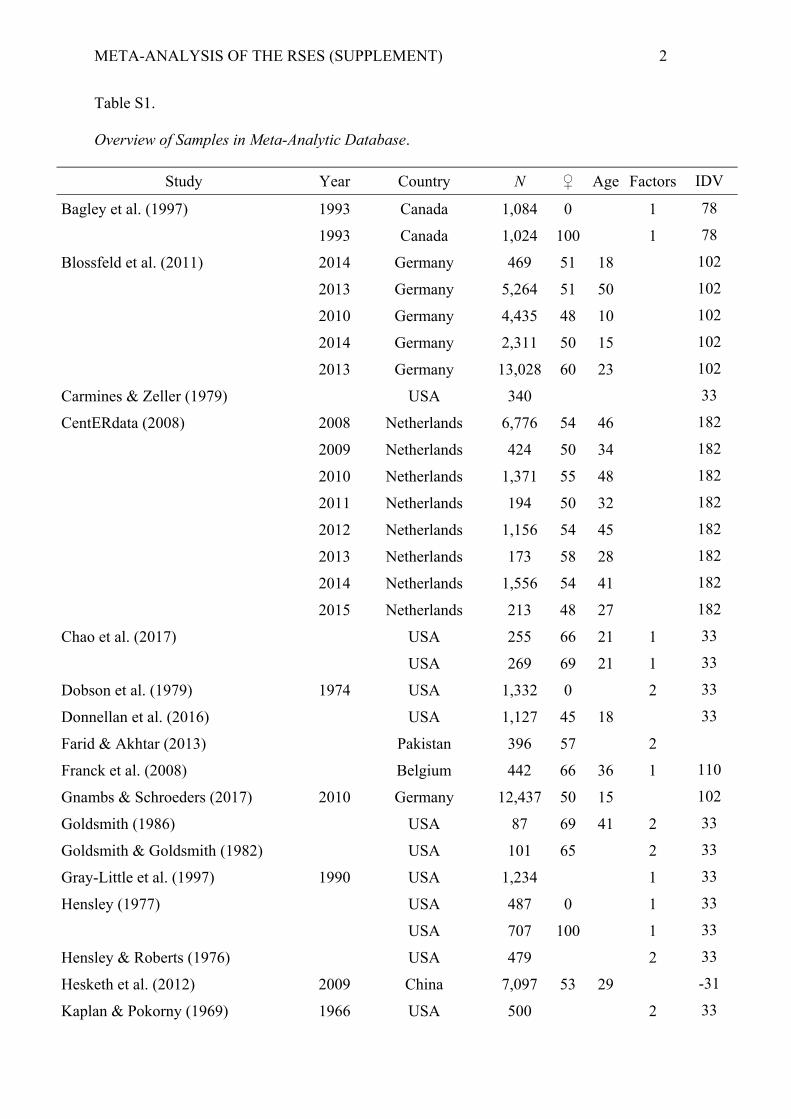
META-ANALYSIS OF THE RSES (SUPPLEMENT) 2
Table S1.
Overview of Samples in Meta-Analytic Database.
Study Year Country N ♀ Age Factors IDV
Bagley et al. (1997) 1993 Canada 1,084 0 1 78
1993 Canada 1,024 100 1 78
Blossfeld et al. (2011) 2014 Germany 469 51 18 102
2013 Germany 5,264 51 50 102
2010 Germany 4,435 48 10 102
2014 Germany 2,311 50 15 102
2013 Germany 13,028 60 23 102
Carmines & Zeller (1979) USA 340 33
CentERdata (2008) 2008 Netherlands 6,776 54 46 182
2009 Netherlands 424 50 34 182
2010 Netherlands 1,371 55 48 182
2011 Netherlands 194 50 32 182
2012 Netherlands 1,156 54 45 182
2013 Netherlands 173 58 28 182
2014 Netherlands 1,556 54 41 182
2015 Netherlands 213 48 27 182
Chao et al. (2017) USA 255 66 21 1 33
USA 269 69 21 1 33
Dobson et al. (1979) 1974 USA 1,332 0 2 33
Donnellan et al. (2016) USA 1,127 45 18 33
Farid & Akhtar (2013) Pakistan 396 57 2
Franck et al. (2008) Belgium 442 66 36 1 110
Gnambs & Schroeders (2017) 2010 Germany 12,437 50 15 102
Goldsmith (1986) USA 87 69 41 2 33
Goldsmith & Goldsmith (1982) USA 101 65 2 33
Gray-Little et al. (1997) 1990 USA 1,234 1 33
Hensley (1977) USA 487 0 1 33
USA 707 100 1 33
Hensley & Roberts (1976) USA 479 2 33
Hesketh et al. (2012) 2009 China 7,097 53 29 -31
Kaplan & Pokorny (1969) 1966 USA 500 2 33
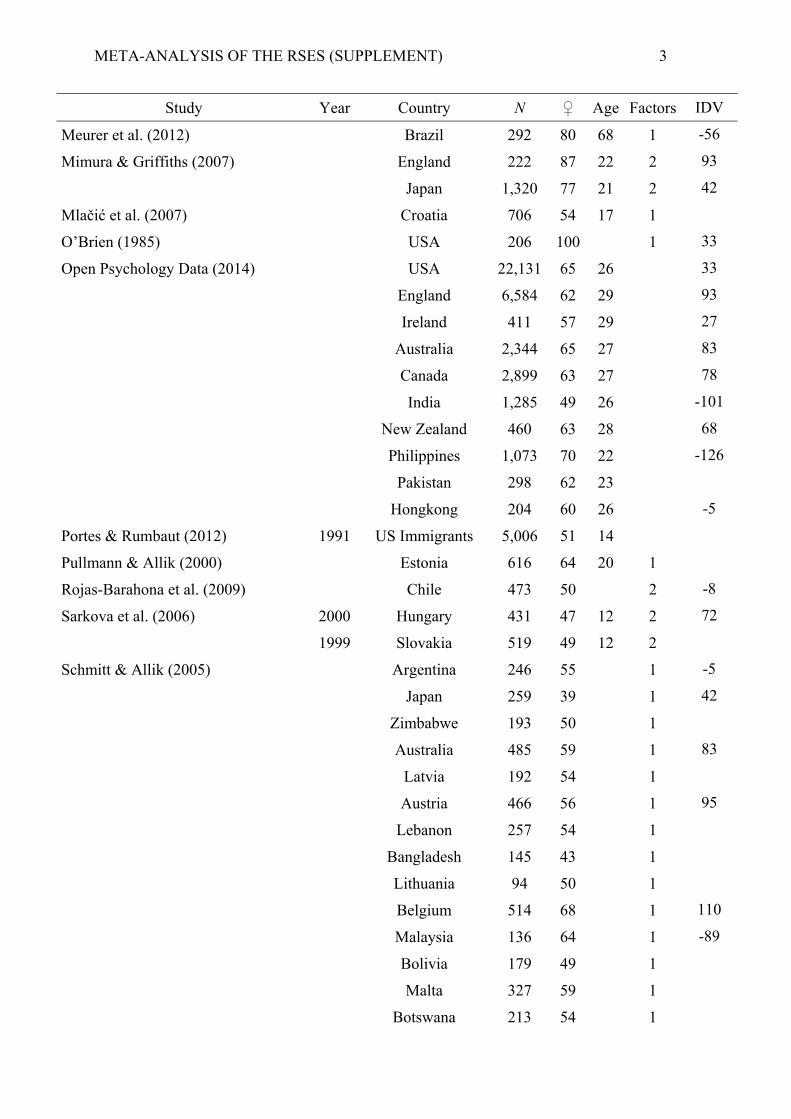
META-ANALYSIS OF THE RSES (SUPPLEMENT) 3
Study Year Country N ♀ Age Factors IDV
Meurer et al. (2012) Brazil 292 80 68 1 -56
Mimura & Griffiths (2007) England 222 87 22 2 93
Japan 1,320 77 21 2 42
Mlačić et al. (2007) Croatia 706 54 17 1
O’Brien (1985) USA 206 100 1 33
Open Psychology Data (2014) USA 22,131 65 26 33
England 6,584 62 29 93
Ireland 411 57 29 27
Australia 2,344 65 27 83
Canada 2,899 63 27 78
India 1,285 49 26 -101
New Zealand 460 63 28 68
Philippines 1,073 70 22 -126
Pakistan 298 62 23
Hongkong 204 60 26 -5
Portes & Rumbaut (2012) 1991 US Immigrants 5,006 51 14
Pullmann & Allik (2000) Estonia 616 64 20 1
Rojas-Barahona et al. (2009) Chile 473 50 2 -8
Sarkova et al. (2006) 2000 Hungary 431 47 12 2 72
1999 Slovakia 519 49 12 2
Schmitt & Allik (2005) Argentina 246 55 1 -5
Japan 259 39 1 42
Zimbabwe 193 50 1
Australia 485 59 1 83
Latvia 192 54 1
Austria 466 56 1 95
Lebanon 257 54 1
Bangladesh 145 43 1
Lithuania 94 50 1
Belgium 514 68 1 110
Malaysia 136 64 1 -89
Bolivia 179 49 1
Malta 327 59 1
Botswana 213 54 1
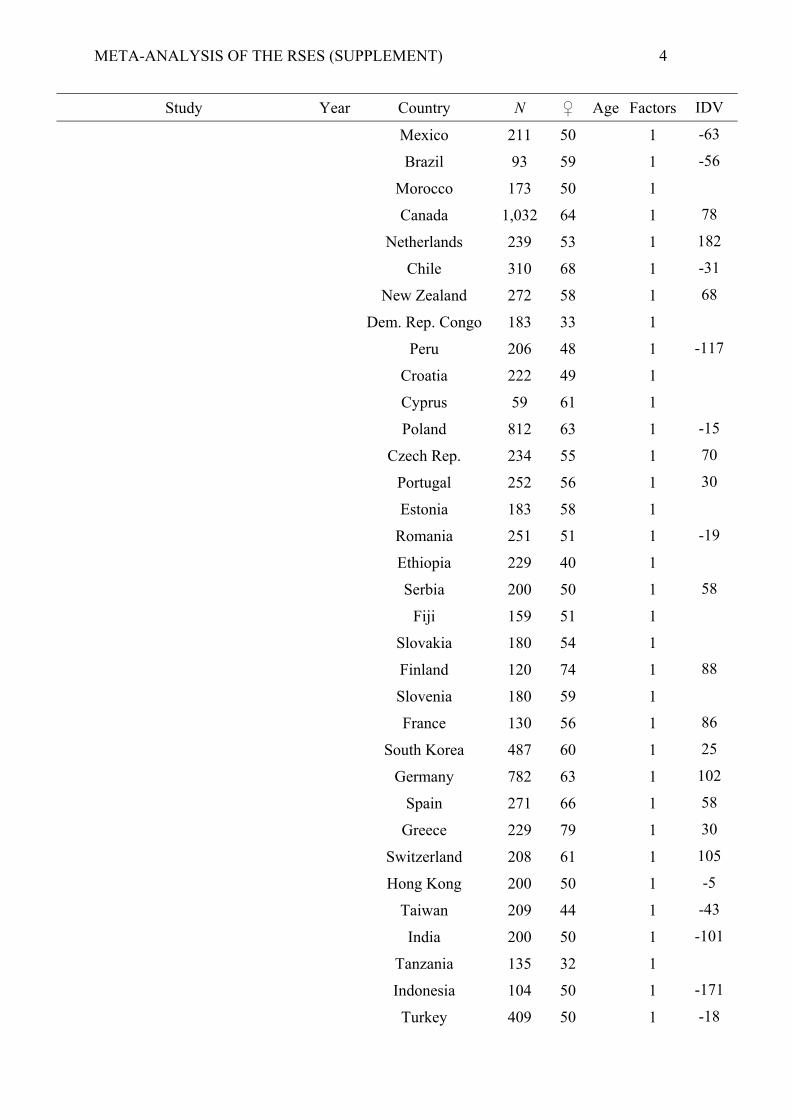
META-ANALYSIS OF THE RSES (SUPPLEMENT) 4
Study Year Country N ♀ Age Factors IDV
Mexico 211 50 1 -63
Brazil 93 59 1 -56
Morocco 173 50 1
Canada 1,032 64 1 78
Netherlands 239 53 1 182
Chile 310 68 1 -31
New Zealand 272 58 1 68
Dem. Rep. Congo 183 33 1
Peru 206 48 1 -117
Croatia 222 49 1
Cyprus 59 61 1
Poland 812 63 1 -15
Czech Rep. 234 55 1 70
Portugal 252 56 1 30
Estonia 183 58 1
Romania 251 51 1 -19
Ethiopia 229 40 1
Serbia 200 50 1 58
Fiji 159 51 1
Slovakia 180 54 1
Finland 120 74 1 88
Slovenia 180 59 1
France 130 56 1 86
South Korea 487 60 1 25
Germany 782 63 1 102
Spain 271 66 1 58
Greece 229 79 1 30
Switzerland 208 61 1 105
Hong Kong 200 50 1 -5
Taiwan 209 44 1 -43
India 200 50 1 -101
Tanzania 135 32 1
Indonesia 104 50 1 -171
Turkey 409 50 1 -18
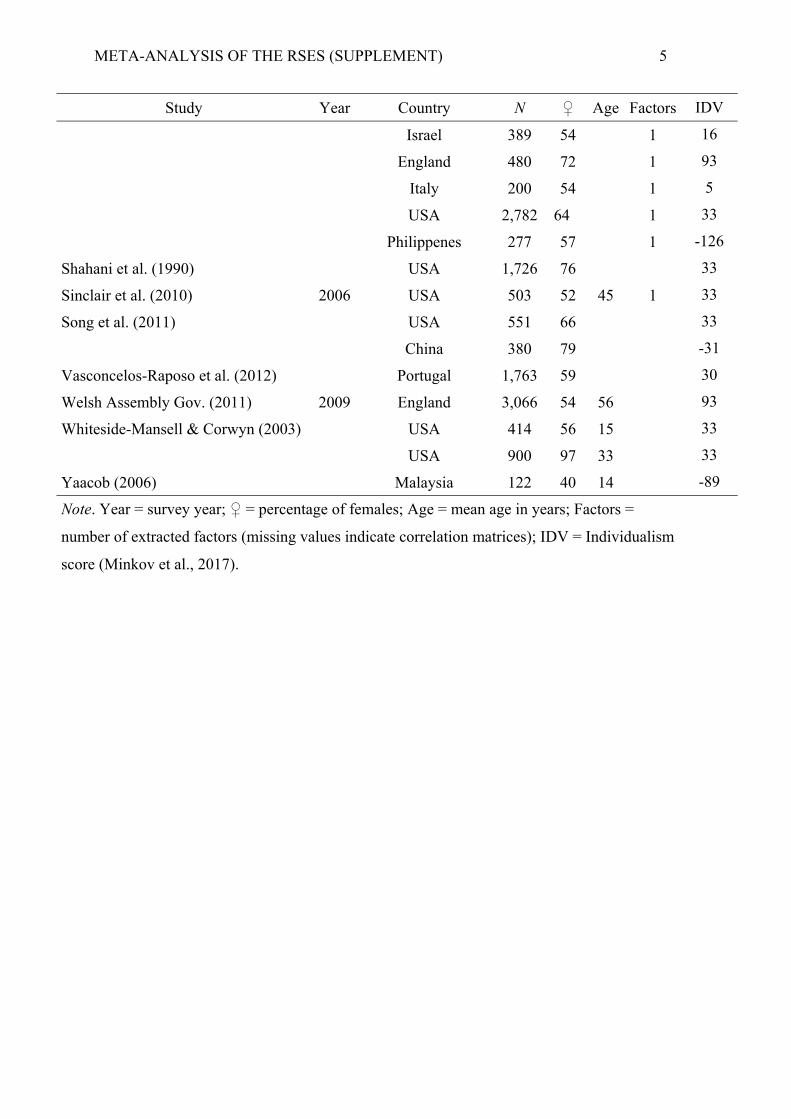
META-ANALYSIS OF THE RSES (SUPPLEMENT) 5
Study Year Country N ♀ Age Factors IDV
Israel 389 54 1 16
England 480 72 1 93
Italy 200 54 1 5
USA 2,782 64 1 33
Philippenes 277 57 1 -126
Shahani et al. (1990) USA 1,726 76 33
Sinclair et al. (2010) 2006 USA 503 52 45 1 33
Song et al. (2011) USA 551 66 33
China 380 79 -31
Vasconcelos-Raposo et al. (2012) Portugal 1,763 59 30
Welsh Assembly Gov. (2011) 2009 England 3,066 54 56 93
Whiteside-Mansell & Corwyn (2003) USA 414 56 15 33
USA 900 97 33 33
Yaacob (2006) Malaysia 122 40 14 -89
Note. Year = survey year; ♀ = percentage of females; Age = mean age in years; Factors =
number of extracted factors (missing values indicate correlation matrices); IDV = Individualism
score (Minkov et al., 2017).
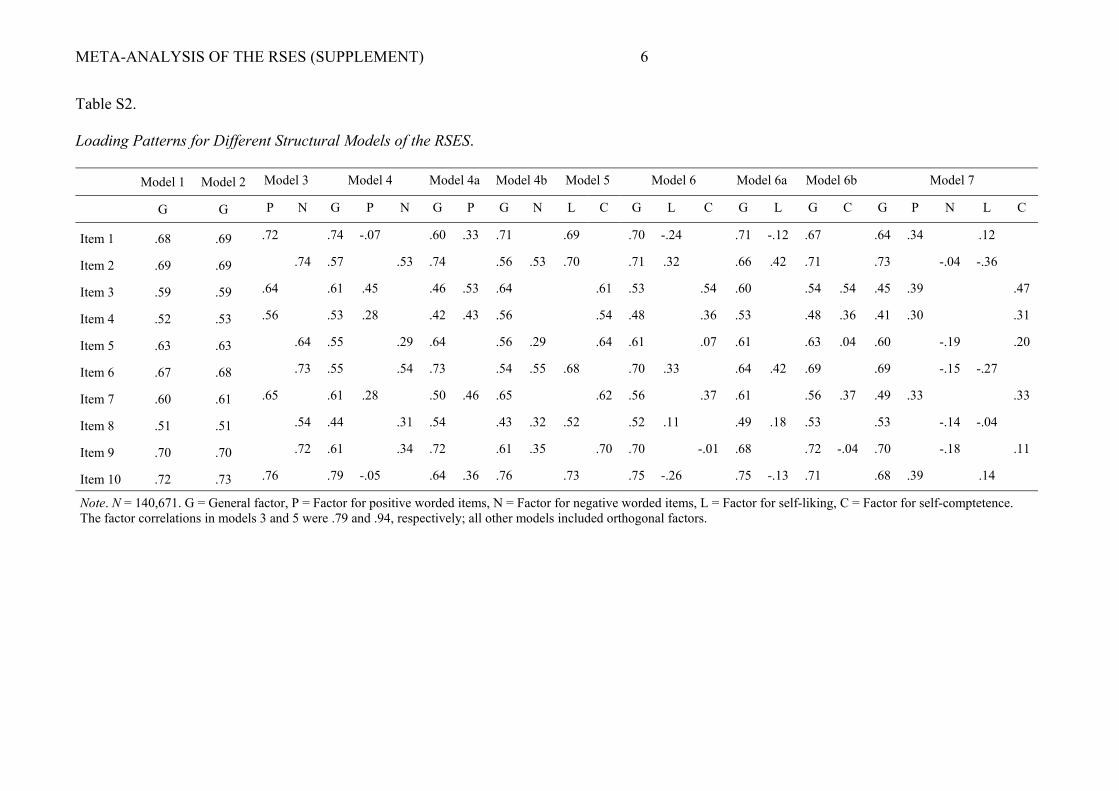
META-ANALYSIS OF THE RSES (SUPPLEMENT) 6
Table S2.
Loading Patterns for Different Structural Models of the RSES.
Model 1 Model 2 Model 3 Model 4 Model 4a Model 4b Model 5 Model 6 Model 6a Model 6b Model 7
G G P N G P N G P G N L C G L C G L G C G P N L C
Item 1 .68 .69 .72 .74 -.07 .60 .33 .71 .69 .70 -.24 .71 -.12 .67 .64 .34 .12
Item 2 .69 .69 .74 .57 .53 .74 .56 .53 .70 .71 .32 .66 .42 .71 .73 -.04 -.36
Item 3 .59 .59 .64 .61 .45 .46 .53 .64 .61 .53 .54 .60 .54 .54 .45 .39 .47
Item 4 .52 .53 .56 .53 .28 .42 .43 .56 .54 .48 .36 .53 .48 .36 .41 .30 .31
Item 5 .63 .63 .64 .55 .29 .64 .56 .29 .64 .61 .07 .61 .63 .04 .60 -.19 .20
Item 6 .67 .68 .73 .55 .54 .73 .54 .55 .68 .70 .33 .64 .42 .69 .69 -.15 -.27
Item 7 .60 .61 .65 .61 .28 .50 .46 .65 .62 .56 .37 .61 .56 .37 .49 .33 .33
Item 8 .51 .51 .54 .44 .31 .54 .43 .32 .52 .52 .11 .49 .18 .53 .53 -.14 -.04
Item 9 .70 .70 .72 .61 .34 .72 .61 .35 .70 .70 -.01 .68 .72 -.04 .70 -.18 .11
Item 10 .72 .73 .76 .79 -.05 .64 .36 .76 .73 .75 -.26 .75 -.13 .71 .68 .39 .14
Note. N = 140,671. G = General factor, P = Factor for positive worded items, N = Factor for negative worded items, L = Factor for self-liking, C = Factor for self-comptetence. The factor correlations in models 3 and 5 were .79 and .94, respectively; all other models included orthogonal factors.
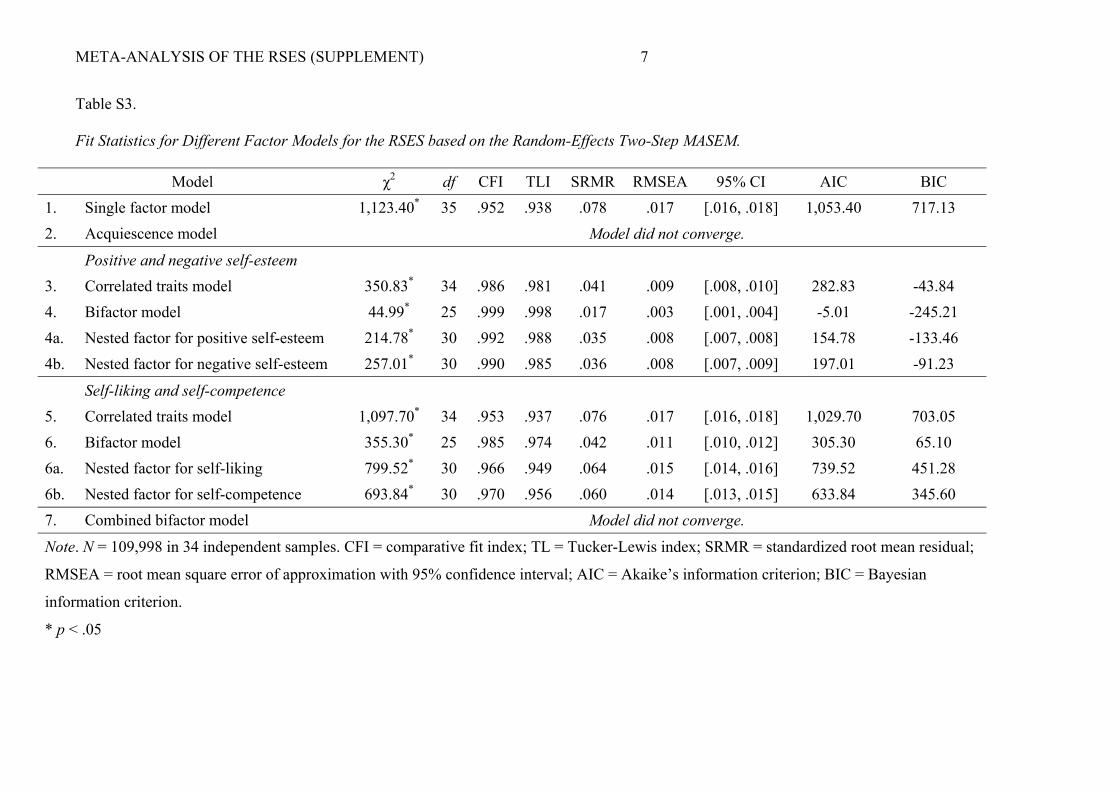
META-ANALYSIS OF THE RSES (SUPPLEMENT) 7
Table S3.
Fit Statistics for Different Factor Models for the RSES based on the Random-Effects Two-Step MASEM.
Model χ2 df CFI TLI SRMR RMSEA 95% CI AIC BIC
1. Single factor model 1,123.40* 35 .952 .938 .078 .017 [.016, .018] 1,053.40 717.13
2. Acquiescence model Model did not converge.
Positive and negative self-esteem
3. Correlated traits model 350.83* 34 .986 .981 .041 .009 [.008, .010] 282.83 -43.84
4. Bifactor model 44.99* 25 .999 .998 .017 .003 [.001, .004] -5.01 -245.21
4a. Nested factor for positive self-esteem 214.78* 30 .992 .988 .035 .008 [.007, .008] 154.78 -133.46
4b. Nested factor for negative self-esteem 257.01* 30 .990 .985 .036 .008 [.007, .009] 197.01 -91.23
Self-liking and self-competence
5. Correlated traits model 1,097.70* 34 .953 .937 .076 .017 [.016, .018] 1,029.70 703.05
6. Bifactor model 355.30* 25 .985 .974 .042 .011 [.010, .012] 305.30 65.10
6a. Nested factor for self-liking 799.52* 30 .966 .949 .064 .015 [.014, .016] 739.52 451.28
6b. Nested factor for self-competence 693.84* 30 .970 .956 .060 .014 [.013, .015] 633.84 345.60
7. Combined bifactor model Model did not converge.
Note. N = 109,998 in 34 independent samples. CFI = comparative fit index; TL = Tucker-Lewis index; SRMR = standardized root mean residual;
RMSEA = root mean square error of approximation with 95% confidence interval; AIC = Akaike’s information criterion; BIC = Bayesian
information criterion.
* p < .05
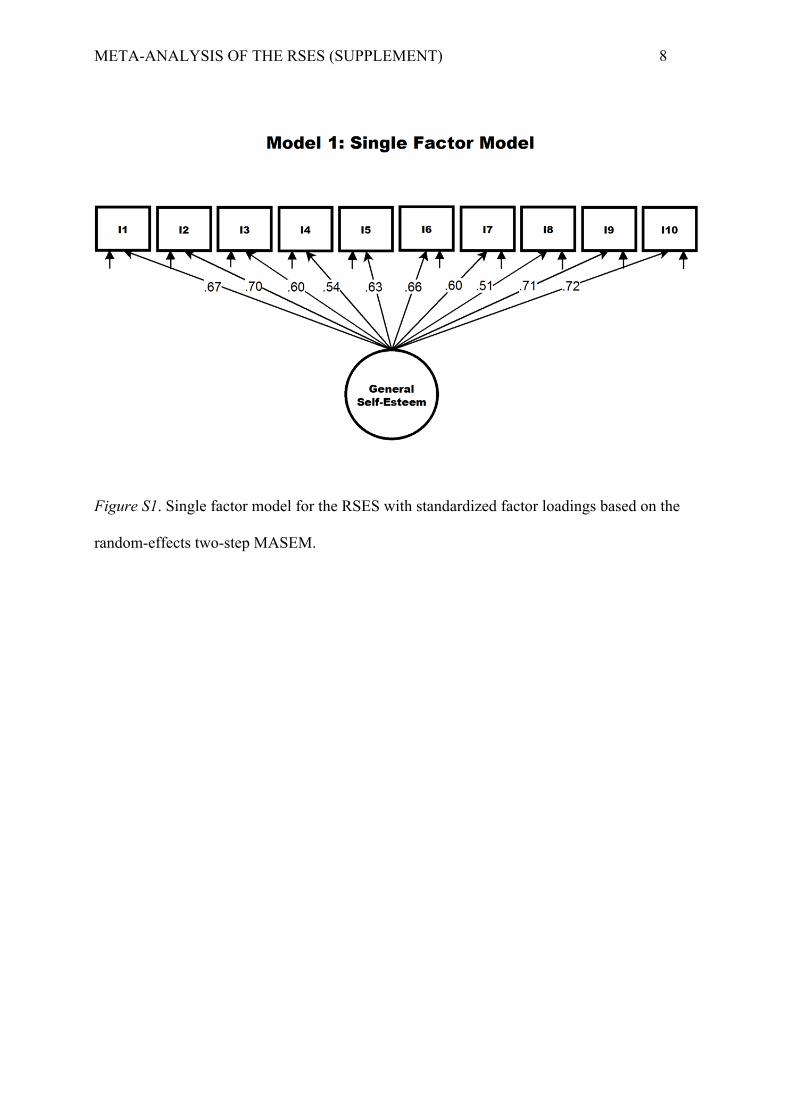
META-ANALYSIS OF THE RSES (SUPPLEMENT) 8
Figure S1. Single factor model for the RSES with standardized factor loadings based on the
random-effects two-step MASEM.
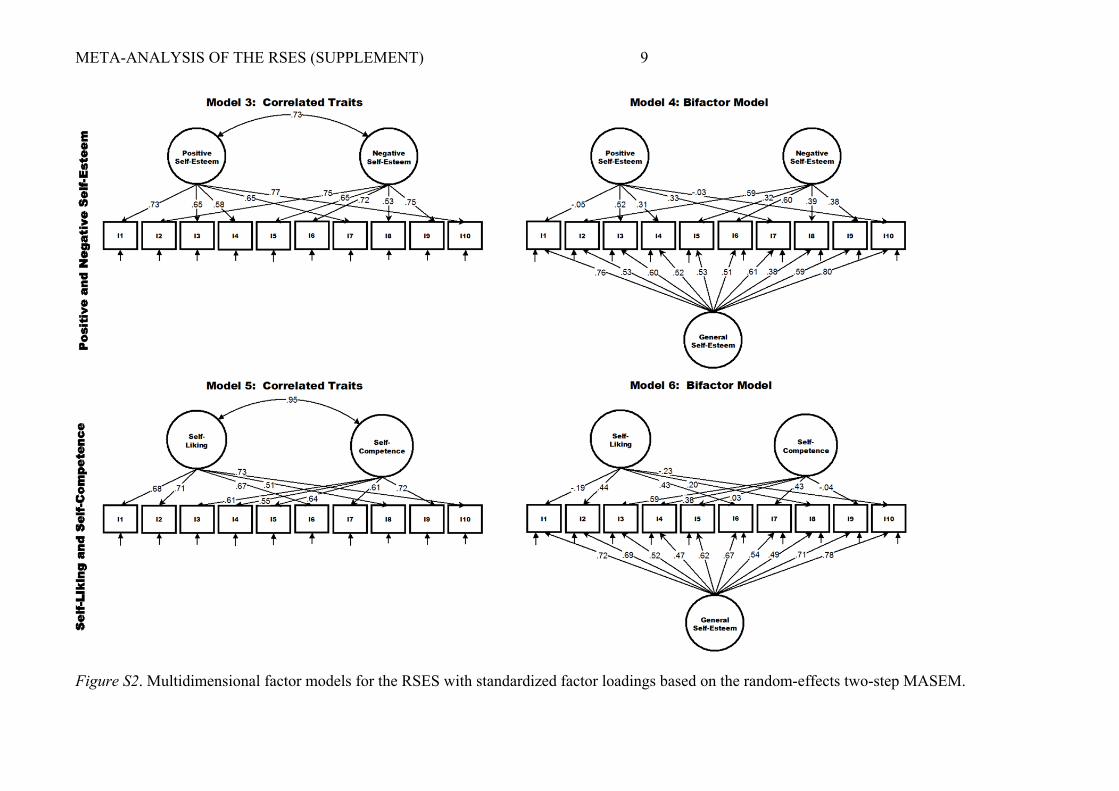
META-ANALYSIS OF THE RSES (SUPPLEMENT) 9
Figure S2. Multidimensional factor models for the RSES with standardized factor loadings based on the random-effects two-step MASEM.


![DRAFT RSES- NWRA REGIONAL FLOOD RISK ASSESSMENT (RFRA) · Regional Flood Risk Appraisal [IBE1549-F01] 3 1.2 RFRA INTEGRATION WITH THE RSES Increased flood risk as a result of land](https://img.pdfslide.net/doc/110x75/5e58c67a0425ec4f9c670372/draft-rses-nwra-regional-flood-risk-assessment-rfra-regional-flood-risk-appraisal.jpg)