Embed Size (px)
Citation preview
Acc
epte
d A
rtic
leNew and Improved: Does FDI Boost Production
Complexity in Host Countries?
Running Title: Does FDI Boost Production Complexity?
Beata S. Javorcik, Alessia Lo Turco, Daniela Maggioni*
Abstract
This paper examines the relationship between the presence of foreign affiliates and product upgrad-
ing by Turkish manufacturing firms. The analysis suggests that Turkish firms in sectors and regions
more likely to supply foreign affiliates tend to introduce more complex products, where complexity
is captured using a measure developed by Hausmann and Hidalgo (2009). This finding is robust to
controlling for omitted variables, sample selection and potential simultaneity bias. It is also in line
with the view that inflows of foreign direct investment stimulate upgrading of indigenous production
capabilities in host countries.
JEL: F23, D22, L20
Keywords: Product Innovation, FDI, Production Upgrading, Backward Linkages, Turkey
*Corresponding Author: Beata Javorcik, Department of Economics, Manor Road Building, Manor Road, Oxford OX1 3UQ,United Kingdom. Email: [email protected]. We thank Giorgio Barba Navaretti, Italo Colantone, Matthijs DeZwaan, Massimo Del Gatto, Rachel Griffith, Maria Luisa Mancusi, Bruno Merlevede, an anonymous referee and participantsof the INFER Workshop on "Regions, Firms and FDI", XXI DEGIT Conference, 18th ETSG Conference, XI ISGEP Workshopas well as seminars participants at Centro Studi Luca d’Agliano and the University of Pescara for their useful comments andsuggestions. We are particularly grateful to Paolo Fabbricatore from Indesit Company and Emre Adinc from Pfizer for providingvaluable information on their companies’ cooperation with local suppliers in Turkey. The data used in this work are from theForeign Trada Data, the Annual Business Statistics and the Production Surveys provided by Turkish Statistical Office (TurkStat).The analysis has been conducted at the Microdata Research Centre of TurkStat in accordance with the law on the statisticalconfidentiality and personal data protection. The results and the opinions expressed in this article are those of the authorsand do not represent the official statistics. We are grateful to Bülent Tungul, Mahmut Öztürk, Kenan Orhan and Erdal Yildirimfrom TurkStat for their help with foreign trade data. We also thank Sabit Cengiz Ceylan, Ferhat Irmak, Vedat Metin, OguzhanTürkoglu and Ülkü Ünsal from the dissemination department.
This article has been accepted for publication and undergone full peer review but has not been through the copyediting, typesetting, pagination and proofreading process, which may lead to differences between this version and the Version of Record. Please cite this article as doi: 10.1111/ecoj.12530 This article is protected by copyright. All rights reserved.

Acc
epte
d A
rtic
leThe academic debate on the process of economic development has recently focused on whether
countries’ specialisation matters for their future growth pattern (Lucas, 1988; Hausmann et al., 2007).
Although a large literature has investigated the drivers of the national production structure at the
macro level, little is known about the determinants of product upgrading at the micro level. As aggre-
gate production is the result of micro-level choices and behaviours of individual firms, it is important
to understand what allows firms to upgrade their production by introducing more sophisticated prod-
ucts or improving the existing ones.
Innovation and product upgrading in developing countries may be hindered by appropriability
issues. In an influential paper, Hausmann and Rodrik (2003) argued that a firm that attempts to in-
troduce a new product into the country faces uncertainty about the underlying cost structure of the
economy. If the project is successful, other firms learn that the product in question can be profitably
produced and follow the incumbent’s footsteps. In this way, the returns to the pioneer investor’s cost
discovery become socialised. If the incumbent fails, the losses remain private. This knowledge exter-
nality means that investment levels in cost discovery are suboptimal.
This paper argues that inflows of foreign direct investment (FDI) may stimulate product upgrading
in the host country. Multinational enterprises (MNEs) are creators of innovation, being responsible
for the majority of global R&D spending (UNCTAD, 2003). The vast experience gathered from op-
erating around the globe may mean that MNEs possess superior knowledge on the suitability of the
host country as the production location for a particular product. Moreover, there is evidence sug-
gesting that MNEs transfer knowledge to their foreign affiliates (Arnold and Javorcik, 2009) and that
foreign affiliates are more likely to introduce new products than their indigenous competitors (Bram-
billa, 2009; Guadalupe et al., 2012). By directly engaging in cost discovery in host countries, MNEs
may also stimulate subsequent innovation by domestic rivals.1 Furthermore, MNEs may provide lo-
cal producers with better inputs, thus facilitating product innovation. Finally, they might encourage
and support their local suppliers’ efforts to develop new inputs and to improve the existing ones.2 By
sharing product information and production-related know-how, MNEs may lower the costs of inno-
1For instance, in a World Bank survey, 24% of local firms in the Czech Republic and 15% in Latvia reported that they havelearned about the availability of new technologies by observing MNEs operating in their country and sector (Javorcik, 2008).
2According to the Business Environment and Enterprise Performance Survey conducted jointly by the World Bank and theEuropean Bank for Reconstruction and Development in 25 transition countries, 41.8% of suppliers to MNEs received pressurefrom their customers to develop new products or services. The corresponding figure for non-suppliers was only 36.8% (Godartand Görg, 2013). According to the same data source, the corresponding figures for the Turkish sample were 90% for domesticsuppliers to MNEs and 80% for non-suppliers.
This article is protected by copyright. All rights reserved.
Acc
epte
d A
rtic
levation and product upgrading on the part of the local suppliers. In sum, inflows of FDI into the same,
upstream or downstream sector may facilitate product upgrading by domestic firms.
Our analysis is based on firm-product level data available from the Turkish Statistical Office for
the period 2006-2009. We examine the link between the sophistication of new products introduced
by Turkish firms and the presence of foreign affiliates in the same industry as well as in the input
providing (upstream) and input sourcing (downstream) industries in the same region.
Turkey represents a suitable setting for our analysis. It is one of the few countries that have trans-
formed their productive structure dramatically in the last decades (Hidalgo, 2009). It has also expe-
rienced a spectacular surge in FDI inflows during the 2000s. Being an emerging economy, Turkey is
likely to have been significantly affected by the knowledge transfer taking place through FDI inflows.
Finally, the large size of the country and the availability of information on the location of individual
plants belonging to each firm allow us to exploit the geographical dimension of the data.
The object of our analysis is the sophistication level of products newly introduced by Turkish firms.
We capture product sophistication using a measure proposed by Hausmann and Hidalgo (2009) who
relate the concept of complexity to the extent and exclusivity of capabilities needed to produce a
given product. These capabilities, which are neither directly observable nor measurable, are inferred
by jointly exploiting information on the prevalence of a given product in the countries’ export baskets
and export diversification of countries that export it.3
The existing literature investigating the determinants of product upgrading tends to equate up-
grading with an increase in unit values (Hallak, 2006; Manova and Zhang, 2012; Harding and Javorcik,
2012; Bas and Strauss-Kahn, 2015). Unit values are highly imperfect as (in addition to reflecting qual-
ity) they may be capturing production costs, market power, or noise due to both aggregation and
measurement error.4 A notable exception is the work of Khandelwal (2010) and Khandelwal et al.
(2013) who estimate quality by exploiting information on unit values and quantities, based on the
insight that higher quality products are those with higher market shares conditional on price. In all
these studies, the concept of quality refers to product differentiation, vertical in the former case and
also horizontal in the latter case and is measured within strictly defined products. In contrast, the
3In the paper, we use the words "complexity" and "sophistication" interchangeably.4Hallak and Schott (2011) develop a method for decomposing countries’ observed export prices into quality versus quality-
adjusted components under the assumption that, holding observed export prices constant, countries with trade surpluses offerhigher quality than countries running trade deficits. They find that observed unit value ratios can be a poor approximation forrelative quality differences.
This article is protected by copyright. All rights reserved.
Acc
epte
d A
rtic
leaim of the Hausmann and Hidalgo (2009) indicator is to rank products according to the sophistica-
tion of their production process. Although this measure can still in part capture a higher quality level
of products (when higher quality translates into a higher number of capabilities needed in the pro-
duction process), its scope is wider since it allows to compare products that may be very different in
terms of use and cannot be compared in terms of quality in its traditional sense. Moreover, our focus
on the complexity indicator is related to our interest in examining the impact of FDI on the develop-
ment of firms’ new and exclusive production skills and their ability to combine them in new and more
sophisticated and less ubiquitous goods.
We investigate the impact of FDI in the same, upstream and downstream sectors. However, our
main explanatory variable of interest is the presence of multinational firms in the downstream (input
sourcing) sectors, since we expect FDI in input-sourcing sectors to serve as the primary channel of
knowledge transfer to host countries (see Javorcik, 2004; Havranek and Irsova, 2011). Indeed, FDI in
the same and the upstream sectors will never turn out to matter in the analysis. FDI variables are
defined at the level of NUTS2 Turkish regions,5 based on the assumption that physical proximity both
increases the likelihood of engaging in contractual relationships and eases the technology and knowl-
edge transfers from foreign affiliates to domestic firms. We control for unobservable heterogeneity by
including region-year and industry-year fixed effects.
Our focus on new products means that we need to address the possible selection bias resulting
from the fact that only some Turkish producers choose to introduce new products. Our approach
thus relies on the estimation of a Heckman selection model. In the selection equation we model the
determinants of introduction of a new product, and in the outcome equation we focus on the deter-
minants of the complexity of the newly introduced product(s). As the exclusion restriction, we use the
lag of industry concentration at the regional level (excluding the firm in question). We believe that in-
dustry concentration should be closely linked to the probability of product innovation, as highlighted
by the existing literature (Nickell, 1996; Blundell et al., 1999), but should not affect the sophistication
of newly introduced products.
We find that while the presence of foreign affiliates does not affect the likelihood of a new product
being introduced, it does affect the complexity of new products. More specifically, sophistication of
the products newly introduced by domestic firms is positively correlated with the presence of MNEs
5NUTS stands for Nomenclature of Territorial Units for Statistics.
This article is protected by copyright. All rights reserved.
Acc
epte
d A
rtic
lein the downstream sectors (i.e., sectors which the innovating Turkish firms are likely to supply). This
finding is consistent with the view that interactions between MNEs and their Turkish suppliers may
boost the latter’s ability to upgrade their production structure. The existence of a positive relationship
between the presence of foreign affiliates and increasing sophistication of Turkish manufacturers in
the supplying industries is also corroborated when we investigate the change in the overall complexity
of the firm’s portfolio of products and account for unobservable firm-level heterogeneity.
Although we control for region-year and industry-year fixed effects, it is possible that some un-
observables varying at the industry-region-year level could be affecting our findings or that MNEs
may anticipate local firms’ ability to expand their production into more complex goods and therefore
MNEs locate in those areas. To address these possibilities, we show that our results are robust to us-
ing the instrumental variable (IV) approach. The starting point for our first instrument is the view
that Turkey is an attractive destination for FDI thanks it to its low wages and customs union with the
European Union (EU), which means, however, that Turkey is in direct competition for FDI with East-
ern European members of the EU, particularly the largest one, Poland. To build our instrument we
utilise information on industry-specific FDI stocks found in Poland. Also, anticipating that less devel-
oped regions within Turkey may be less attractive to foreign investors, we identify such regions using
information on the pre-sample (2005) level of Socio-Economic Development Index from the Turkish
State Planning Organization. Our first instrument is, then, an interaction between the logged stock
of FDI received by Poland in a given sector in a given year and an indicator variable denoting un-
derdeveloped regions of Turkey in the pre-sample period. This instrument captures two push factors
(competition from Poland and regional backwardness), so we expect it to bear a negative sign in the
first stage regressions. The second instrument captures the distribution of global supply of FDI across
sectors by using the logged stock of outward FDI from OECD countries disaggregated by investor
country, sector and year. Since the existing literature has documented the negative effects of infor-
mation asymmetries on capital flows (Portes et al., 2001; Portes and Rey, 2005; Gelos and Wei, 2005)
and has shown that they are particularly strong for FDI (Daude and Fratzscher, 2008), we weight the
stock of FDI by newspaper exports from a given Turkish region to a given country in the pre-sample
year. Thus, our instrument is the weighted average of outward FDI stocks of OECD countries in a
given industry where the weights proxy for the information flows between each Turkish region and a
This article is protected by copyright. All rights reserved.
Acc
epte
d A
rtic
legiven source country. The IV results confirm the main message of the paper by showing a positive re-
lationship between the presence of foreign affiliates and increasing sophistication of products newly
introduced by Turkish firms in the supplying industries.6
In the final exercise, we allow for heterogeneous effects on different types of Turkish firms. The
analysis suggests that multinational customers represent a convergence force. The most beneficial
effects stemming from their presence are absorbed by indigenous innovators that are smaller and
endowed with a lower pre-existing sophistication level. This is consistent with the view that MNEs
tend to do business with multiple suppliers in order to avoid excessive reliance on a single source of
inputs.
Throughout the analysis, we do not find a statistically significant impact of MNE presence in the
same or in the input providing industry on product upgrading by Turkish firms. This is consistent
with our priors that contacts between MNEs and their local suppliers are the main channel through
which knowledge spillovers from FDI take place. As expected, such spillovers are associated with FDI
inflows from high income countries rather than FDI inflows in general.
As for the other possible margins of adjustments, we do not find a statistically significant effect
of foreign presence on entry or exit rates of Turkish firms in the same, upstream or downstream in-
dustries. Also, Turkish firms that do not introduce new products do not seem to disproportionately
expand the production volume of their relatively more complex existing products as a result of FDI in-
flows. All of this evidence suggests that FDI inflows stimulate upgrading of the host country’s produc-
tion structure primarily by encouraging product upgrading among innovating firms in the supplying
sectors.
Our work is related to two strands of the economic literature. First, we contribute to the literature
investigating the role of FDI in stimulating economic growth (Borensztein et al., 1998; Alfaro et al.,
2004) and transformation of the production and export structure. Recent work has shown that multi-
nationals’ activity affects the quality and the sophistication of exports in the host countries (Harding
and Javorcik, 2012; Swenson and Chen, 2014), though other studies (Wang and Wei, 2010) have failed
to find such a relationship. However, the exact channel through which this phenomenon may be tak-
ing place still needs to be investigated in detail. On the one hand, multinationals could themselves
produce more technology- and knowledge-intensive goods and could initiate production of goods
6Our results are robust to using alternative instruments which we describe in detail in section 3.3.
This article is protected by copyright. All rights reserved.
Acc
epte
d A
rtic
lethat have not been produced before in host countries, thus directly contributing to the sophistication
of the country’s production structure. On the other hand, their presence could encourage local firms
to introduce more sophisticated goods. Knowing which channel is at work matters hugely for policy.
Our results give support to the latter channel.7
Second, we contribute to the extensive literature on FDI spillovers. To date, this literature has
almost exclusively focused on the link between the presence of foreign affiliates and the total fac-
tor productivity of domestic firms (Aitken and Harrison, 1999; Javorcik, 2004; Goerg and Greenaway,
2004; Havranek and Irsova, 2011).8 By considering another outcome, the sophistication of newly in-
troduced products, we help shed light on the complex ways through which FDI inflows affect the host
economy.
Our findings matter for policy. Rodrik (2006a) states that enhancing an economy’s productive ca-
pabilities over an increasing range of manufactured goods is an integral part of economic develop-
ment. As he puts it "The first order of business in development is to learn how to do new things, not
to focus on what one already does well." (p. 5). Based on the findings of Hausmann et al. (2007), he fur-
ther argues that countries promoting exports of more sophisticated goods grow faster. He concludes
that, although the sophistication of a country’s exports is determined in part by its overall produc-
tive capacity and its human capital endowment at a point in time, policy also matters. Viewed from
this perspective, the results of our study suggest that attracting FDI inflows can stimulate economic
growth by facilitating upgrading of the country’s productive capabilities. And, thus, they suggest there
is room for investment promotion activities, an inexpensive policy that is quite effective in a develop-
ing country context (see Harding and Javorcik, 2011).9
This paper is structured as follows: the next section introduces the background for our analysis
and briefly discusses anecdotal evidence related to our research question; section 2 presents the data
sources and discusses measurement issues; section 3 lays out the empirical model and discusses es-
timation issues; section 4 summarises the conclusions.
7The former channel is not the focus of our study, though we do include some descriptive evidence suggesting superiorproduct sophistication of foreign affiliates relative to Turkish firms.
8The notable exceptions include the work of Branstetter (2006) who focused on knowledge flows reflected in patent cita-tions, and the work of Griffith et al. (2006) who focused on inventors working for a firm’s foreign subsidiaries as a conduit ofknowledge transfer.
9Under some circumstances, inflows of FDI may have a negative impact on the host country welfare. For instance, a theo-retical contribution by Lin and Saggi (2007) shows that exclusivity contracts preventing MNE suppliers to supply the domesticrivals of MNEs will result in a welfare loss for the host country. Similarly, Carluccio and Fally (2013) show that technologicalincompatibilities between foreign and domestic technologies limit the welfare gains from FDI inflows but this negative effectcan be compensated by domestic technology adoption.
This article is protected by copyright. All rights reserved.
Acc
epte
d A
rtic
le1 Background and Anecdotal Evidence
In the 1980s, after about 20 years of import substitution, Turkey moved to an outward-oriented de-
velopment strategy based on liberalising capital account, attracting FDI and promoting exports. Lib-
eralisation policies and important investments in telecommunications infrastructure created a more
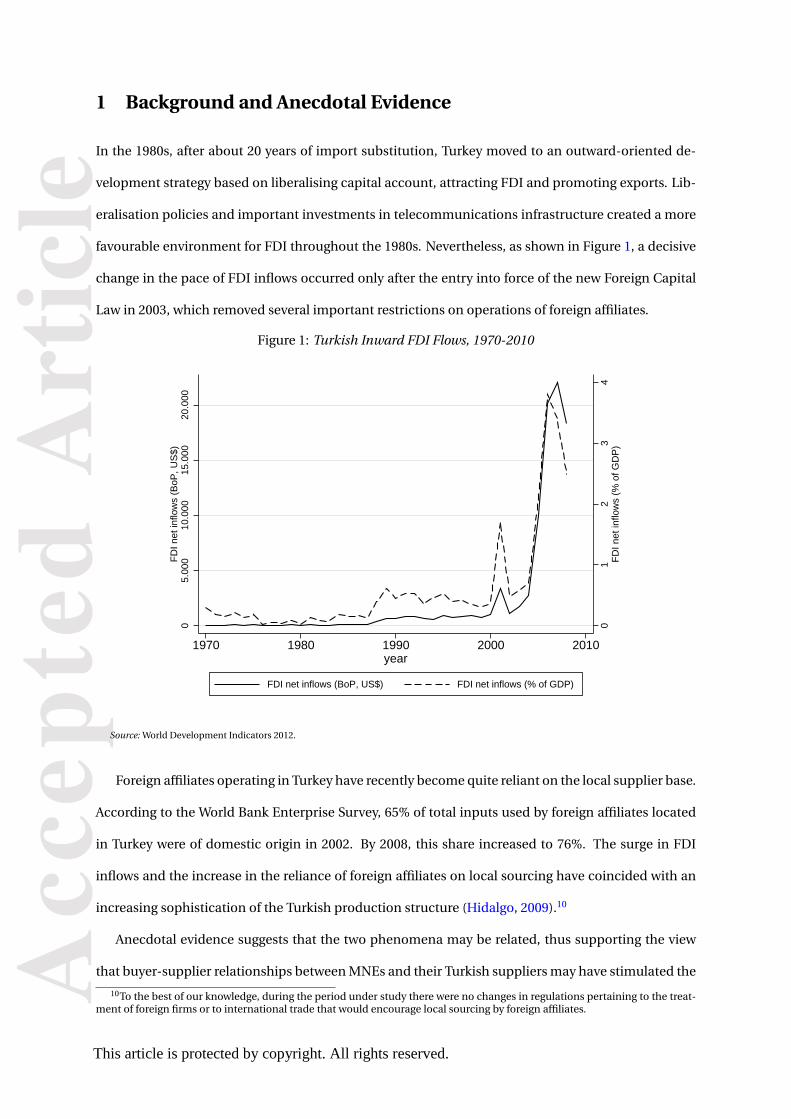
favourable environment for FDI throughout the 1980s. Nevertheless, as shown in Figure 1, a decisive
change in the pace of FDI inflows occurred only after the entry into force of the new Foreign Capital
Law in 2003, which removed several important restrictions on operations of foreign affiliates.
Figure 1: Turkish Inward FDI Flows, 1970-2010
01
23
4F
DI n
et in
flow
s (%
of G
DP
)
05.
000
10.0
0015
.000
20.0
00F
DI n
et in
flow
s (B
oP, U
S$)
1970 1980 1990 2000 2010year
FDI net inflows (BoP, US$) FDI net inflows (% of GDP)
Source: World Development Indicators 2012.
Foreign affiliates operating in Turkey have recently become quite reliant on the local supplier base.
According to the World Bank Enterprise Survey, 65% of total inputs used by foreign affiliates located
in Turkey were of domestic origin in 2002. By 2008, this share increased to 76%. The surge in FDI
inflows and the increase in the reliance of foreign affiliates on local sourcing have coincided with an
increasing sophistication of the Turkish production structure (Hidalgo, 2009).10
Anecdotal evidence suggests that the two phenomena may be related, thus supporting the view
that buyer-supplier relationships between MNEs and their Turkish suppliers may have stimulated the
10To the best of our knowledge, during the period under study there were no changes in regulations pertaining to the treat-ment of foreign firms or to international trade that would encourage local sourcing by foreign affiliates.
This article is protected by copyright. All rights reserved.

Acc
epte
d A
rtic
letransformation of the Turkish manufacturing sector. Consider the case of Indesit Turkey.11 Indesit is
an Italian white good producer - recently acquired by Whirlpool - active in Turkey since the 1990s. Its
plant located in Manisa produces refrigerators. Although initially Indesit entered Turkey primarily to
save on labour costs, over time Indesit has increased its reliance on the Turkish supplier base. In the
beginning of its operations in Turkey, Indesit imported most of the components needed for produc-
tion of the final products. Now Indesit sources locally almost all of the main components, and more
than half of its supplier base is currently located in Turkey, mostly in the same industrial district as its
Manisa plant. Geographical proximity to suppliers is indeed crucial for keeping down the transport
costs and allowing for a more efficacious collaboration with the suppliers. Indesit regularly conducts
audits of its suppliers. It also helps suppliers with starting production. The vast pool of engineering
know-how and experience stemming from previous experiences of working with local suppliers in
other parts of the world is shared with Turkish business partners.
Indesit’s relationship with a stainless steel sheet pressing (SSSP) company located in Manisa is an
example of how foreign affiliates stimulate upgrading of production complexity in their local suppli-
ers.12 In 2012, Indesit built a new plant producing washing machines. To become a supplier of this
new plant, the SSSP company purchased new presses and automated its production process. This
allowed it to start producing a new and more sophisticated product, increase efficiency and the pro-
duction volume. The SSSP company became the only Turkish supplier of Indesit capable of producing
a flange of a washing machine basket which is a steel component with deep drawing illustrated in Fig-
ure A.1 in the online Appendix. The flange is not a new component for Indesit. Indesit sources flanges
from Italy and Poland for its plants in Italy, Poland and Russia. However, this type of a flange had not
been previously sourced by Indesit from Turkey.
The complexity of steel components with deep drawing is not uniform and strictly depends on
their aesthetic and physical characteristics.13 Stainless steel components like a flange need to be pro-
duced with no aesthetic defects by 800-1000 tons presses. The component’s drawings are statistically
controlled to allow for a correct assembly with the rest of the washing machine basket. They also
need to withstand a 1000-1400 revolutions per minute stress while remaining within a certain range
11This information is based on the interview one of the authors conducted with the company’s Sourcing Manager on De-cember 3, 2014.
12The name of the company has been omitted during the interview because of confidentiality reasons.13As illustrated in Figure A.1, the flange of a washing machine basket is a much more complex product than a sink. The
sink’s complexity in turn exceeds that of a pot scourer.
This article is protected by copyright. All rights reserved.
Acc
epte
d A
rtic
leof vibration and noisiness.
Besides investing in automation, the SSSP company introduced new control and maintenance
tools and processes. It is also currently collaborating with Indesit on a system to improve the primary
input usage by employing scraps. Indesit has shared essential tacit knowledge, information processes,
instructions and control procedures with the SSSP company, thus stimulating and supporting the
supplier’s complexity upgrading.
Similar anecdotal evidence can be found in other sectors.14 For instance, Pfizer, a pharmaceutical
company active in Turkey since the late 1950s, has also developed a large network of local suppliers.
Two years ago a Turkish logistics company, which is a partner of Pfizer, invested into new cold-chain
logistics systems in order to increase the volume of its business with Pfizer. Thanks to this additional
investment and to the know-how it had received from Pfizer on the cold-chain logistic requirements
needed to comply with the Pfizer Quality Management system, the supplier has widened its portfolio
of services and has been able to strengthen and stabilise its contractual relationship with Pfizer.
Another example is represented by an on-going Pfizer’s project aiming to upgrade a product it uses
in its transportation system. The current supplier cannot meet the additional requirements but an-
other Turkish firm is willing to make the necessary investment in highly complex machines in order to
become a Pfizer’s supplier. This investment is very costly, especially when compared to the supplier’s
regular operational equipment.
Motivated by this anecdotal evidence, in what follows we formally examine the relationship be-
tween the presence of foreign affiliates and the complexity of products newly introduced by Turkish
firms in the supplying industries. Although we also test for the link between the presence of FDI in
the same and the upstream sector, these will turn out not to play a statistically significant role.
The focus on product innovation in Turkey is motivated by our interest in shedding light on the
country’s manufacturing evolution. It is supported by Figure A.2 in the online Appendix. Here, Panel
A shows the spatial distribution of industrial production in Turkey in the year 2005 and documents an
important divide between the laggard Eastern regions and the industrial Western ones, in line with
the evidence from Table A.1. More noteworthy, Panel B and C in the figure reveal that new products
are an important driver of regional industrial growth, especially in the laggard Eastern regions. These
14This information has been obtained by means of email interviews conducted by one of the authors with a Pfizer managerin October/November 2014.
This article is protected by copyright. All rights reserved.
Acc
epte
d A
rtic
lepatterns are in line with the view that new products represent an important factor behind the indus-
trial evolution of Turkey.
2 Data Sources and Measurement Issues
2.1 Data Sources
Our sample covers all manufacturing firms with more than 20 employees operating in Turkey in the
period 2006-2009. It was created by merging the Structural Business Statistics (SBS) with the Turkish
Annual Industrial Product Statistics (AIPS). Both data sources are available from the Turkish National
Statistical Office. The former source provides information on a wide number of firm characteristics,
while the latter allows for the identification of each firm’s product scope and newly introduced prod-
ucts.
We use the SBS to retrieve information on firms’ output, input costs, employment and foreign
ownership. Turkstat provides information on foreign ownership from 2006 onwards. We follow the
OECD definition and classify as domestic those firms whose foreign capital asset share is lower than
10% (OECD, 2008). Unlike many similar data sources from other countries, the SBS contains infor-
mation on a firm’s plants, including the number of plants, location of each plant (NUTS2 region), its
employment, turnover and NACE sector.15 We use the SBS to build proxies for the presence of foreign
affiliates in each region-sector combination.
From the AIPS we get information on firms’ products 10-digit PRODTR classification).16 For each
product, we know its code, volume of production, value of production and sales for the years 2006-
2009 for all manufacturing firms with more than 20 employees. We identify new products starting
from 2006 on the basis of firms’ product baskets. Our analysis is performed on the sample of domes-
tically owned manufacturing firms.17
Tables A.1 and A.2 in the online Appendix describe the sectoral and regional distributions of all
15NACE is the statistical classification of economic activities in the European Union.16The PRODTR is a national product classification whose first 6 digits correspond to CPA (Classification of Products by
Activity) codes and which includes about 3,700 different products.17We exclude from our analysis firms operating in NACE sector 16 (Manufacture of tobacco products) and 23 (Manufacture
of coke, refined petroleum products and nuclear fuel) because of the nature of the activities they perform. We also drop sector25 "Rubber and Plastics" because of suspected mis-measurement of foreign presence. This sector represents less than 5% ofthe original sample. Including this sector in the analysis would not affect the significance of the results and the main insightsof the analysis. We trim the top and the bottom percentile of the size and the productivity distributions, though not doing sowould not affect the conclusions of our study.
This article is protected by copyright. All rights reserved.
Acc
epte
d A
rtic
lefirms and of innovators (i.e., firms introducing new products) in our sample. In terms of the sec-
toral distribution, firms are mainly concentrated in traditional comparative advantage sectors, such
as, Food (NACE 15), Textiles (NACE 17), and Apparel (NACE 18). They are also well represented in
Non-Metallic Mineral Products (NACE 26), Metal Products (NACE 28), and Machinery and Equipment
(NACE 29). As for the geographical distribution (Table A.1), we find that Istanbul accounts for about
43% of all firms in our sample and Izmir, Bursa and Ankara account for a further 23% of the total num-
ber of firms. This is consistent with the country’s development stage and indicates that the relatively
recently developed manufacturing sector is quite concentrated in a few regions. Turning to the im-
portance of product innovators, as visible in the tables, they constitute a non-negligible share of firms
across all regions and sectors, and their distribution across both dimensions mimics the distribution
observed for the full sample.
To create a measure of product sophistication we apply the Hausmann and Hidalgo (2009) ap-
proach to the BACI database compiled by CEPII (Gaulier and Zignago, 2010). This database includes
bilateral export flows at the 6-digit Harmonised System (HS) level (1996 version). We use the informa-
tion for year 2002. To match firm-product-level production data from Turkstat with the product-level
information obtained from BACI, we first converted 6-digit HS codes into the CPA classification codes
by means of the HS-CPA correspondence table provided by the Eurostat. Then, we constructed a har-
monised classification that is slightly more aggregated than the CPA classification (we refer to it as
HCPA). Although the CPA classifies 1,390 distinct products, the HCPA classification contains 1,297
products of which 1,030 are actually produced in Turkey. Hereafter, a product code refers to a product
as defined in the HCPA classification.
2.2 Measuring Product Complexity
We measure the sophistication of Turkish firms’ production by means of the complexity indicator
proposed by Hausmann and Hidalgo (2009). Before we explain the measure in detail, it is helpful to
illustrate it with an analogy mentioned by Hausmann and Hidalgo (2009) and Felipe et al. (2012).
Imagine that a country is represented by a bucket of Lego pieces with each piece representing the
capabilities available in the country. The set of products (i.e., Lego models) a country can produce
depends on the kind, diversity, and exclusiveness of the Lego pieces in the bucket. A Lego bucket that
This article is protected by copyright. All rights reserved.
Acc
epte
d A
rtic
lecontains pieces that can only be used to build a toy bicycle probably does not contain the pieces to
create a toy car. However, a Lego bucket that contains pieces that can build a toy car may also have
the necessary pieces needed to build a toy bicycle.
While two Lego buckets may be capable of building the same number of models, these may be
completely different sets of models. Thus, determining the complexity of an economy by looking at
the products it produces amounts to determining the “diversity and exclusivity” of the pieces in a
Lego bucket by simply looking at the Lego models it can build.
Hausmann and Hidalgo (2009) start from the assumption that the bipartite - country-product -
network of world trade originates from a larger tripartite network. This tripartite network links coun-
tries to the capabilities they are endowed with and products to the capabilities they require in their
production process. Hence, capabilities are the unobserved network nodes connecting countries to
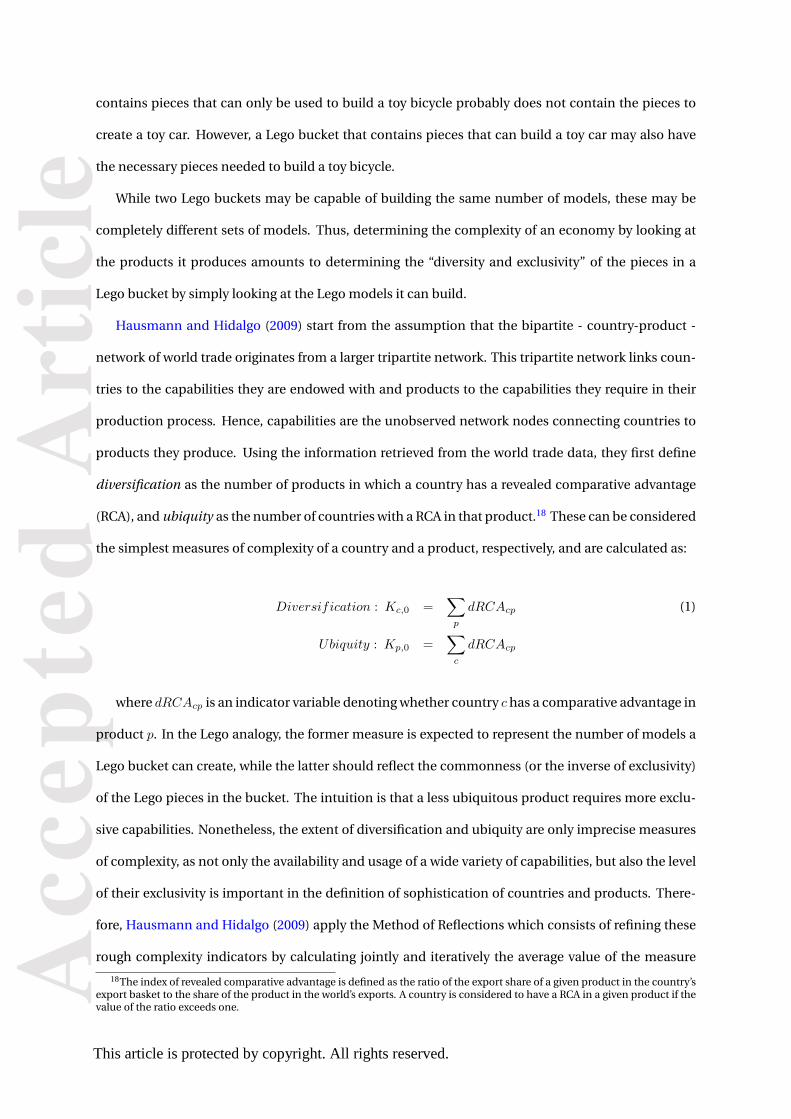
products they produce. Using the information retrieved from the world trade data, they first define
diversification as the number of products in which a country has a revealed comparative advantage
(RCA), and ubiquity as the number of countries with a RCA in that product.18 These can be considered
the simplest measures of complexity of a country and a product, respectively, and are calculated as:
Diversification : Kc,0 =∑p
dRCAcp (1)
Ubiquity : Kp,0 =∑c
dRCAcp
where dRCAcp is an indicator variable denoting whether country c has a comparative advantage in
product p. In the Lego analogy, the former measure is expected to represent the number of models a
Lego bucket can create, while the latter should reflect the commonness (or the inverse of exclusivity)
of the Lego pieces in the bucket. The intuition is that a less ubiquitous product requires more exclu-
sive capabilities. Nonetheless, the extent of diversification and ubiquity are only imprecise measures
of complexity, as not only the availability and usage of a wide variety of capabilities, but also the level
of their exclusivity is important in the definition of sophistication of countries and products. There-
fore, Hausmann and Hidalgo (2009) apply the Method of Reflections which consists of refining these
rough complexity indicators by calculating jointly and iteratively the average value of the measure
18The index of revealed comparative advantage is defined as the ratio of the export share of a given product in the country’sexport basket to the share of the product in the world’s exports. A country is considered to have a RCA in a given product if thevalue of the ratio exceeds one.
This article is protected by copyright. All rights reserved.
Acc
epte
d A
rtic
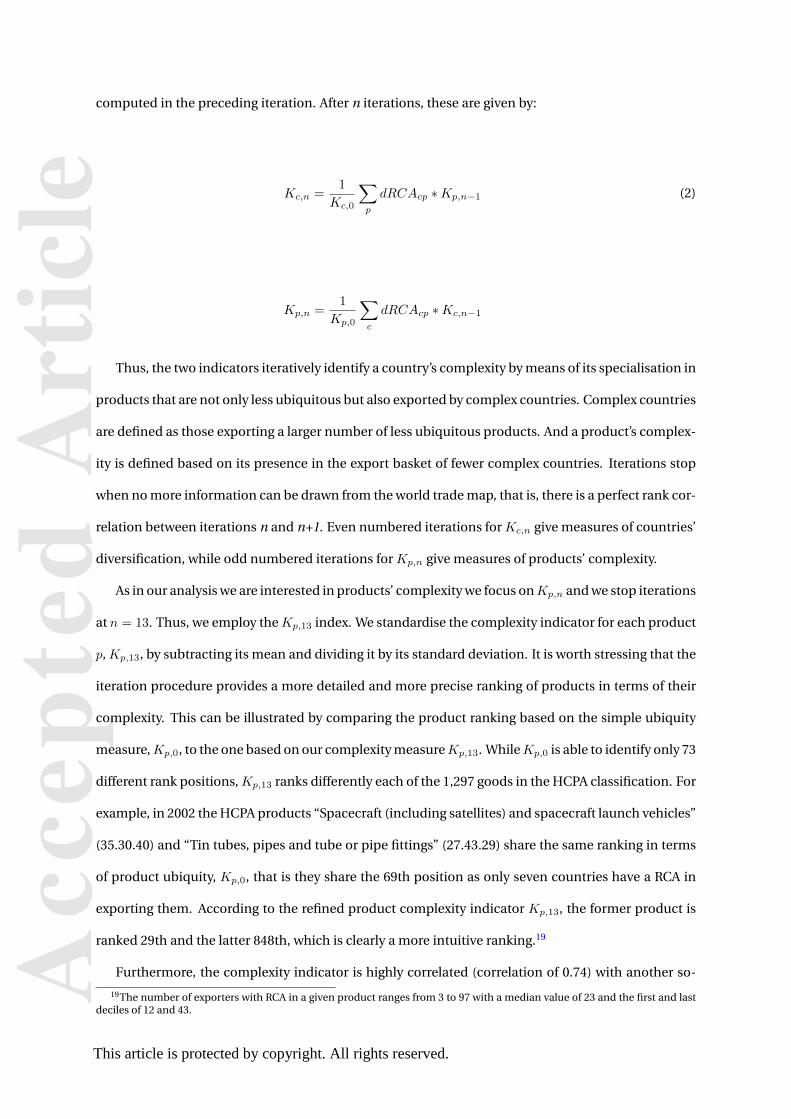
lecomputed in the preceding iteration. After n iterations, these are given by:
Kc,n =1
Kc,0
∑p
dRCAcp ∗Kp,n−1 (2)
Kp,n =1
Kp,0
∑c
dRCAcp ∗Kc,n−1
Thus, the two indicators iteratively identify a country’s complexity by means of its specialisation in
products that are not only less ubiquitous but also exported by complex countries. Complex countries
are defined as those exporting a larger number of less ubiquitous products. And a product’s complex-
ity is defined based on its presence in the export basket of fewer complex countries. Iterations stop
when no more information can be drawn from the world trade map, that is, there is a perfect rank cor-
relation between iterations n and n+1. Even numbered iterations forKc,n give measures of countries’
diversification, while odd numbered iterations for Kp,n give measures of products’ complexity.
As in our analysis we are interested in products’ complexity we focus onKp,n and we stop iterations
at n = 13. Thus, we employ theKp,13 index. We standardise the complexity indicator for each product
p,Kp,13, by subtracting its mean and dividing it by its standard deviation. It is worth stressing that the
iteration procedure provides a more detailed and more precise ranking of products in terms of their
complexity. This can be illustrated by comparing the product ranking based on the simple ubiquity
measure,Kp,0, to the one based on our complexity measureKp,13. WhileKp,0 is able to identify only 73
different rank positions,Kp,13 ranks differently each of the 1,297 goods in the HCPA classification. For
example, in 2002 the HCPA products “Spacecraft (including satellites) and spacecraft launch vehicles”
(35.30.40) and “Tin tubes, pipes and tube or pipe fittings” (27.43.29) share the same ranking in terms
of product ubiquity, Kp,0, that is they share the 69th position as only seven countries have a RCA in
exporting them. According to the refined product complexity indicator Kp,13, the former product is
ranked 29th and the latter 848th, which is clearly a more intuitive ranking.19
Furthermore, the complexity indicator is highly correlated (correlation of 0.74) with another so-
19The number of exporters with RCA in a given product ranges from 3 to 97 with a median value of 23 and the first and lastdeciles of 12 and 43.
This article is protected by copyright. All rights reserved.
Acc
epte
d A
rtic
lephistication indicator used in literature, the PRODY index (Hausmann et al., 2007). The latter relates
a product’s complexity to the average income level of its exporters, by weighing each country’s in-
come with its RCA index in the product. Indeed, after removing the information on per capita income,
PRODY collapses toKp,1. This implies that the PRODY indicator relies more on the structure of the
network connecting countries to the products they export than on the income of countries. This sug-
gests that the explanatory power that this measure of sophistication and its country level counterpart,
EXPY , have demonstrated (Rodrik, 2006b; Hausmann et al., 2007) stems from the information on the
diversification of countries and on the ubiquity of products (Hidalgo, 2009). Both diversification and
ubiquity are exploited in our product complexity indicator.
Finally, going back to our anecdotal evidence, it is interesting to notice that the washing machine
component (flange), which corresponds to the HCPA 29.54.42, has a complexity level ofKp,13 = 1.034,
which is higher than the complexity level of another - relatively simpler - steel product with deep
drawing, namely a sink (HCPA 28.75.11) whose complexity level is Kp,13 = 0.529. Finally, both prod-
ucts are more complex than other stainless steel products which do not require deep drawing, such as
pot scourers (HCPA 28.75.12) whose complexity level is Kp,13 = −0.197. See Figure A.1 in the online
Appendix.
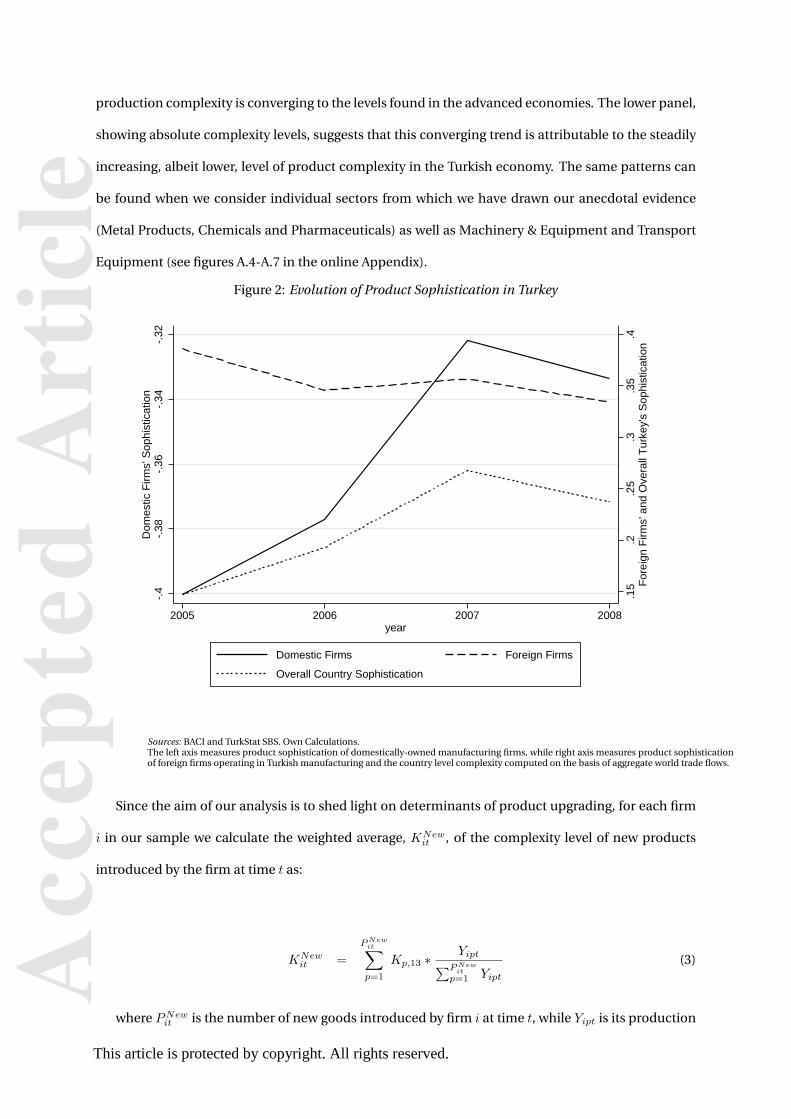
Figure 2 contrasts the evolution of Turkish firms’ average production complexity (left axis) with the
path of foreign firms’ average complexity (right axis) and with the overall production sophistication
in Turkish manufacturing (right axis).20 More specifically, we aggregate production of domestic firms
at the product level. We do the same for foreign firms. Then, we calculate the weighted average of
the complexity of products produced by domestic and foreign firms, respectively. The country-level
complexity indicator is computed on the basis of aggregate trade flows. The picture shows the supe-
rior product sophistication level of foreign firms vis-a-vis the domestic ones. The latter, nonetheless,
experience a significant upgrading of their product sophistication which drives the overall pattern
observed for the Turkish manufacturing sector.
Figure A.3 in the online Appendix contrasts the evolution of country-level complexity measures
for Turkey, the US and the EU15 during 2004-8 (defined as described in footnote 20). The upper panel
of the figure plots Turkey’s complexity relative to that of the US and the EU and shows that Turkey’s
20 Country level production complexity for Turkey refer to Kc,20, which is computed on the basis of equation 2 by exploitingBACI trade data. We stop iterations at n = 20, when no more information can be gathered from the world trade network, that isthere is a perfect rank correlation between iterations 20 and 21.
This article is protected by copyright. All rights reserved.
Acc
epte
d A
rtic
leproduction complexity is converging to the levels found in the advanced economies. The lower panel,
showing absolute complexity levels, suggests that this converging trend is attributable to the steadily
increasing, albeit lower, level of product complexity in the Turkish economy. The same patterns can
be found when we consider individual sectors from which we have drawn our anecdotal evidence
(Metal Products, Chemicals and Pharmaceuticals) as well as Machinery & Equipment and Transport
Equipment (see figures A.4-A.7 in the online Appendix).
Figure 2: Evolution of Product Sophistication in Turkey
.15
.2.2
5.3
.35
.4F
orei
gn F
irms'
and
Ove
rall
Tur
key'
s S
ophi
stic
atio
n
-.4
-.38
-.36
-.34
-.32
Dom
estic
Firm
s' S
ophi
stic
atio
n
2005 2006 2007 2008year
Domestic Firms Foreign Firms
Overall Country Sophistication
Sources: BACI and TurkStat SBS. Own Calculations.The left axis measures product sophistication of domestically-owned manufacturing firms, while right axis measures product sophisticationof foreign firms operating in Turkish manufacturing and the country level complexity computed on the basis of aggregate world trade flows.
Since the aim of our analysis is to shed light on determinants of product upgrading, for each firm
i in our sample we calculate the weighted average, KNewit , of the complexity level of new products
introduced by the firm at time t as:
KNewit =
PNewit∑p=1
Kp,13 ∗Yipt∑PNewitp=1 Yipt
(3)
where PNewit is the number of new goods introduced by firm i at time t, while Yipt is its production
This article is protected by copyright. All rights reserved.
Acc
epte
d A
rtic
levalue of good p.21 Similarly, by considering all products produced by the firm in year t we obtain the
weighted average of the complexity level of the firm’s product basket, KAllit .
2.3 Measuring FDI Spillovers
To capture the impact of foreign firms’ presence on the sophistication of products newly introduced
by Turkish firms, we use the standard proxies for horizontal and vertical spillovers employed by the
literature (see, e.g., Javorcik (2004)). We compute these proxies at the region-sector-year level, thus ex-
ploiting both regional and cross-industry variation in the presence of foreign owned firms over time.
Regions are defined at the NUTS2 level, with a total of 26 regions, whereas sectors are defined at the
2-digit NACE level, with a total of 19 manufacturing sectors.
Our spillovers proxies are compiled based on the information on foreign owned firms with more
than 20 employees, their sector of activity, location and output available from the SBS.22 A proxy for
horizontal (intra-industry) spillovers in sector j and region r at time t is defined as the average foreign
equity share, ForeignShare, in firms in the sector-region cell weighted by each firm i′s share in the
cell’s output in a given year:
Horizontal FDIjrt =
∑Njrt
i=1 Yit ∗ ForeignShareit∑Njrt
i=1 Yit(4)
with Njrt indicating the number of firms in region r which are active in sector j and year t, and
Yit denotes the output of firm i in year t. Since we consider the regional dimension, in order to build
our spillover indicator we employ plant-level information on output and we attribute to each foreign
plant the corresponding foreign equity share declared at the firm level.23
To create a proxy for the foreign presence in downstream (input sourcing) and upstream (input
supplying) sectors, and thus investigate potential vertical spillovers, we combine theHorizontal FDI
indicator in equation 4 with the national Input-Output table (for domestic production) for Turkey
21Our baseline results are robust to using a simple average or the maximum level of complexity.22Since the SBS collect information for just a rotating sample of firms with fewer than 20 employees, we focus on the popula-
tion of firms with more than 20 employees. We believe that the exclusion of small firms from the calculation does not representa severe problem due to the small share of output accounted for by this part of firms’ population and due to the evidence thatmost of foreign owned firms are large.
23We also compute weights on the basis of firms’ employment shares and we test the robustness of our findings to the useof spillover measures based on employment.
This article is protected by copyright. All rights reserved.
Acc
epte
d A
rtic
lein the year 2002. We, then, build the following proxies for spillovers through backward and forward
linkages, respectively:
Downstream FDIjrt =
∑Ss=1,s6=j HorizontalFDIsrt ∗ Salesjs∑T
s=1 Salesjs(5)
Upstream FDIjrt =
∑Ss=1,s6=j HorizontalFDIsrt ∗ Purchasesjs∑T
s=1 Purchasesjs(6)
where Salesjs and Purchasesjs are respectively the total sales and purchases of sector j to/from a
manufacturing sector s. 1, .., S denote the manufacturing sectors, while S, .., T denote the remaining
non-manufacturing sectors. Sector j is a firm’s main sector of activity. Note that in order to sepa-
rate intra-industry and inter-industry effects, we exclude sourcing and supplying relationships taking
place within the sector.
Figures A.8 and A.9 in the online Appendix show the evolution ofHorizontal FDI,DownstreamFDI
and Upstream FDI variables by region and sector, respectively. We can observe the existence of a
large variation across regions, across sectors and across time in the presence of foreign multination-
als. Although the highest shares of foreign output are recorded in the country’s most industrialised
regions, e.g. Istanbul, Ankara, Izmir and Manisa, foreign presence is also non-negligible in less de-
veloped Eastern regions, such as Malatya and Mardin. Foreign firms are responsible for a significant
share of output (more than 10%) in Chemicals (24), Metal Products (28), Electrical Appliances (31)
and Motor Vehicles (34). Their presence is also considerable (7% of total output) in more traditional
sectors, where Turkey enjoys comparative advantage, such as Food (15) and Clothing (18). Signifi-
cant variation is also visible, albeit to a lesser extent, in the presence of foreign firms in upstream and
downstream industries.
To get a sense of the correlation between the spillover variables and the firms’ sophistication level
of new products, KNew, as well as of the existing ones, KAll, Table 1 reports the value of complexity
indicators by quartile of spillovers’ measures. As firms may have plants in more than one region, for
each firm we take the simple average of the above spillover proxies across all regions of operation.
This article is protected by copyright. All rights reserved.
Acc
epte
d A
rtic
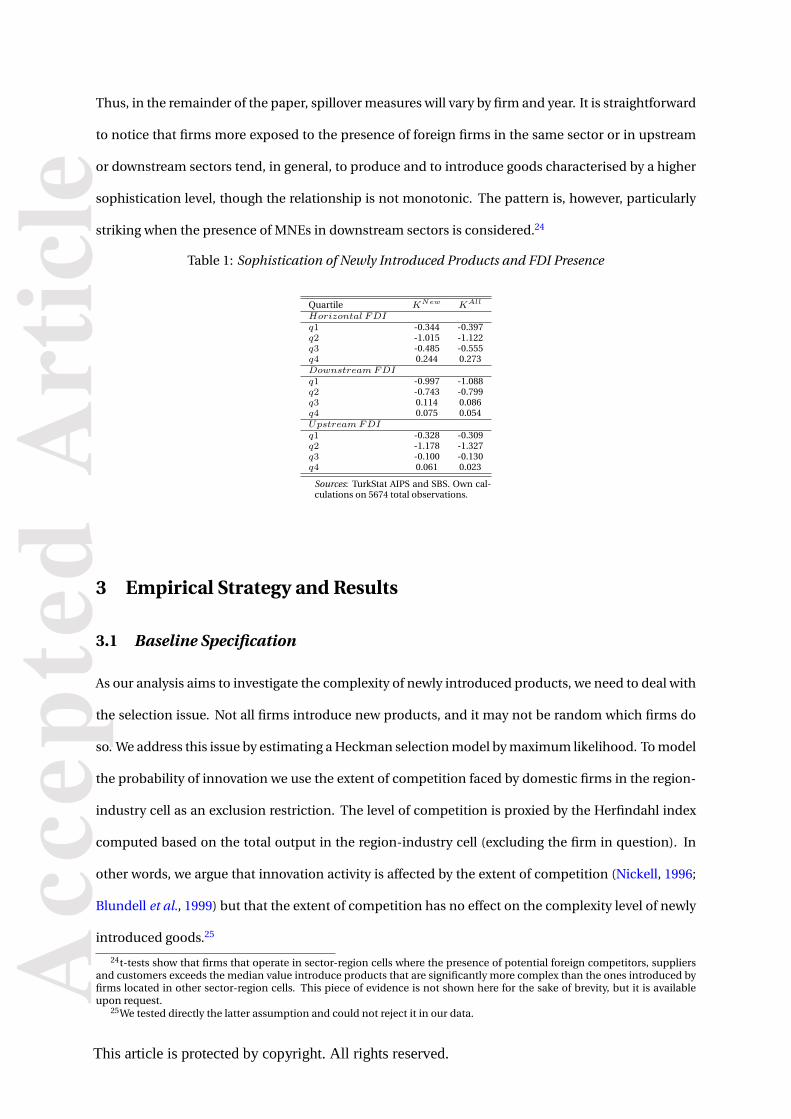
leThus, in the remainder of the paper, spillover measures will vary by firm and year. It is straightforward
to notice that firms more exposed to the presence of foreign firms in the same sector or in upstream
or downstream sectors tend, in general, to produce and to introduce goods characterised by a higher
sophistication level, though the relationship is not monotonic. The pattern is, however, particularly
striking when the presence of MNEs in downstream sectors is considered.24
Table 1: Sophistication of Newly Introduced Products and FDI Presence
Quartile KNew KAll
Horizontal FDIq1 -0.344 -0.397q2 -1.015 -1.122q3 -0.485 -0.555q4 0.244 0.273DownstreamFDIq1 -0.997 -1.088q2 -0.743 -0.799q3 0.114 0.086q4 0.075 0.054UpstreamFDIq1 -0.328 -0.309q2 -1.178 -1.327q3 -0.100 -0.130q4 0.061 0.023
Sources: TurkStat AIPS and SBS. Own cal-culations on 5674 total observations.
3 Empirical Strategy and Results
3.1 Baseline Specification
As our analysis aims to investigate the complexity of newly introduced products, we need to deal with
the selection issue. Not all firms introduce new products, and it may not be random which firms do
so. We address this issue by estimating a Heckman selection model by maximum likelihood. To model
the probability of innovation we use the extent of competition faced by domestic firms in the region-
industry cell as an exclusion restriction. The level of competition is proxied by the Herfindahl index
computed based on the total output in the region-industry cell (excluding the firm in question). In
other words, we argue that innovation activity is affected by the extent of competition (Nickell, 1996;
Blundell et al., 1999) but that the extent of competition has no effect on the complexity level of newly
introduced goods.25
24t-tests show that firms that operate in sector-region cells where the presence of potential foreign competitors, suppliersand customers exceeds the median value introduce products that are significantly more complex than the ones introduced byfirms located in other sector-region cells. This piece of evidence is not shown here for the sake of brevity, but it is availableupon request.
25We tested directly the latter assumption and could not reject it in our data.
This article is protected by copyright. All rights reserved.
Acc
epte
d A
rtic
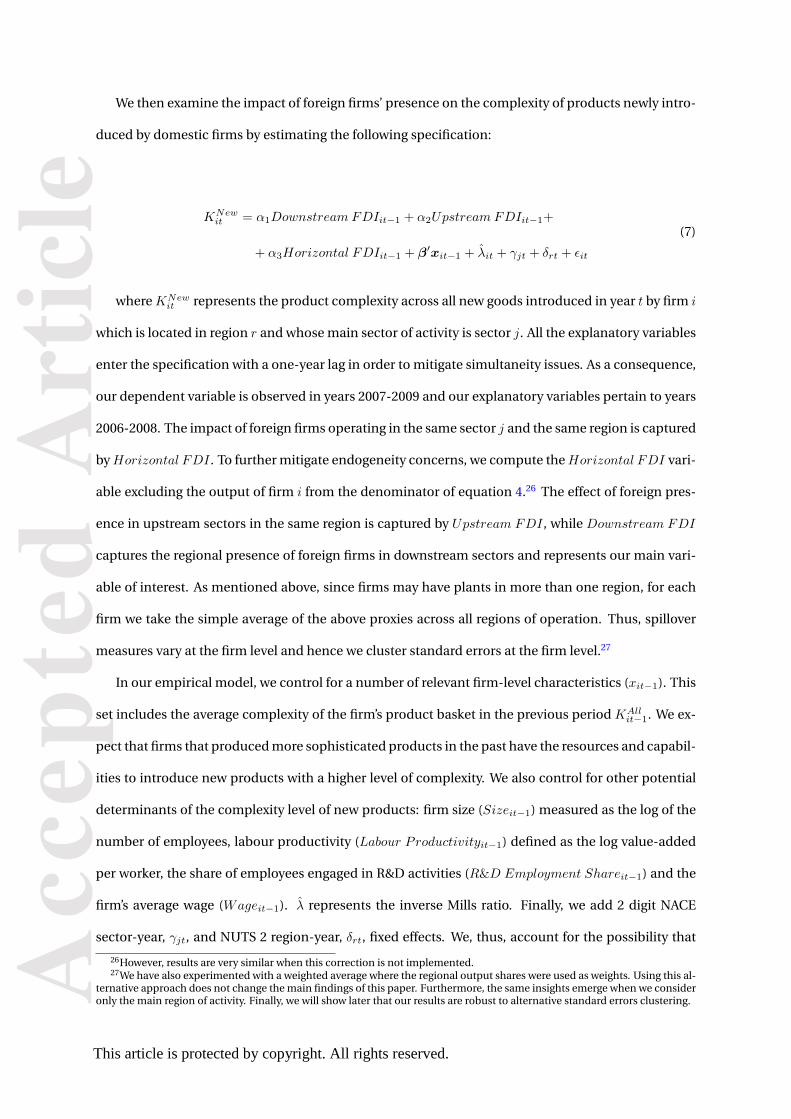
leWe then examine the impact of foreign firms’ presence on the complexity of products newly intro-
duced by domestic firms by estimating the following specification:
KNewit = α1Downstream FDIit−1 + α2Upstream FDIit−1+
+ α3Horizontal FDIit−1 + β′xit−1 + λit + γjt + δrt + εit
(7)
whereKNewit represents the product complexity across all new goods introduced in year t by firm i
which is located in region r and whose main sector of activity is sector j. All the explanatory variables
enter the specification with a one-year lag in order to mitigate simultaneity issues. As a consequence,
our dependent variable is observed in years 2007-2009 and our explanatory variables pertain to years
2006-2008. The impact of foreign firms operating in the same sector j and the same region is captured
byHorizontal FDI. To further mitigate endogeneity concerns, we compute theHorizontal FDI vari-
able excluding the output of firm i from the denominator of equation 4.26 The effect of foreign pres-
ence in upstream sectors in the same region is captured by Upstream FDI, while Downstream FDI
captures the regional presence of foreign firms in downstream sectors and represents our main vari-
able of interest. As mentioned above, since firms may have plants in more than one region, for each
firm we take the simple average of the above proxies across all regions of operation. Thus, spillover
measures vary at the firm level and hence we cluster standard errors at the firm level.27
In our empirical model, we control for a number of relevant firm-level characteristics (xit−1). This
set includes the average complexity of the firm’s product basket in the previous period KAllit−1. We ex-
pect that firms that produced more sophisticated products in the past have the resources and capabil-
ities to introduce new products with a higher level of complexity. We also control for other potential
determinants of the complexity level of new products: firm size (Sizeit−1) measured as the log of the
number of employees, labour productivity (Labour Productivityit−1) defined as the log value-added
per worker, the share of employees engaged in R&D activities (R&D Employment Shareit−1) and the
firm’s average wage (Wageit−1). λ represents the inverse Mills ratio. Finally, we add 2 digit NACE
sector-year, γjt, and NUTS 2 region-year, δrt, fixed effects. We, thus, account for the possibility that
26However, results are very similar when this correction is not implemented.27We have also experimented with a weighted average where the regional output shares were used as weights. Using this al-
ternative approach does not change the main findings of this paper. Furthermore, the same insights emerge when we consideronly the main region of activity. Finally, we will show later that our results are robust to alternative standard errors clustering.
This article is protected by copyright. All rights reserved.
Acc
epte
d A
rtic
lemultinationals choose specific sectors and specific regions when entering Turkey because of their
attractiveness. Sector-year and region-year fixed effects also account for time-varying shocks such
as regional and sectoral demand shocks. Table A.3 in the online Appendix presents the descriptive
statistics for our complexity measures and explanatory variables.
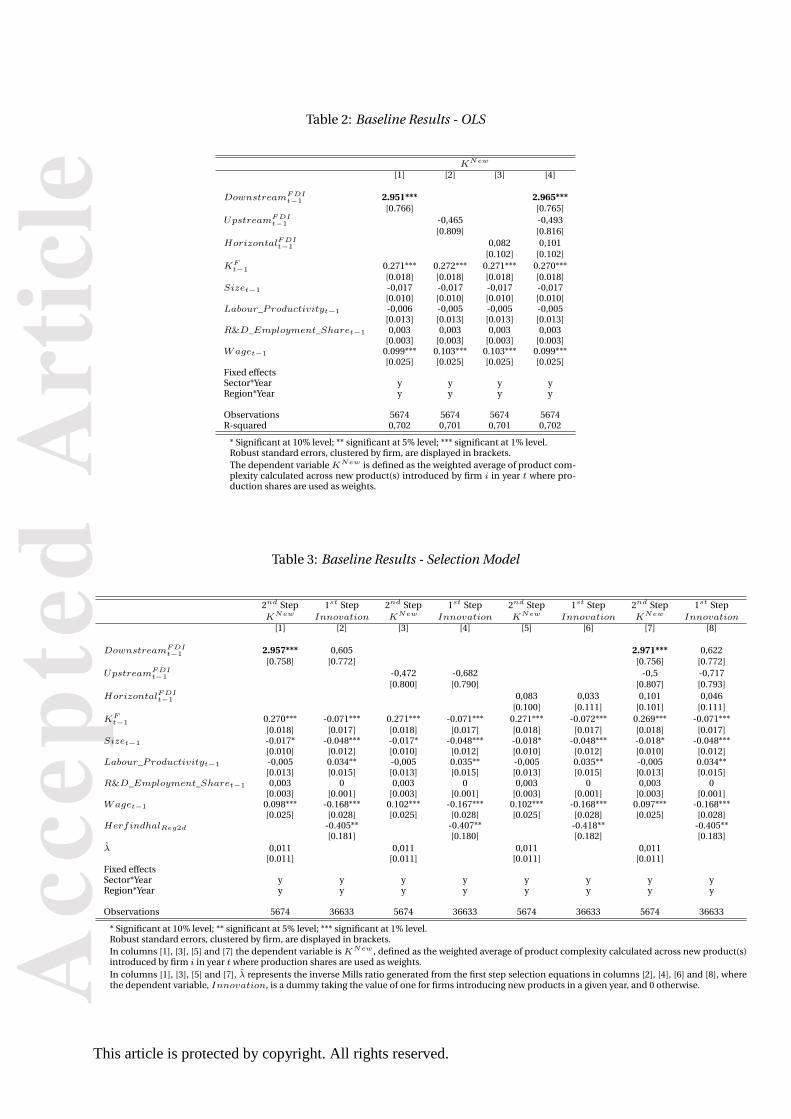
Before we implement the above model, we want to establish a benchmark by estimating an OLS
version of specification (7) (ignoring the the inverse Mills ratio λ) on the subsample of innovating
firms. This will give us some basis against which we will compare our findings from the selection
model. The estimation results are presented in Table 2. The proxies for FDI presence first enter one by
one and then all together. The results suggest a positive relationship between the foreign presence in
the downstream sectors and the complexity of new products introduced by Turkish firms. This is true
when Downstream FDI enters the specification by itself as well as in the full specification. This find-
ing is consistent with Turkish firms benefiting from their relationships with multinational customers
and these benefits manifesting themselves in the sophistication of their new products. Foreign pres-
ence in the same or the upstream sectors does not appear to be significantly related to the complexity
of new products introduced by Turkish firms. Among firm-level controls, only the past sophistica-
tion of the production structure and the firms’ average wage appear to be statistically significant. As
expected, both variables are positively correlated with the complexity of new products.28
The main message emerging from the OLS estimates is confirmed by the results of the Heckman
selection model presented in Table 3. In the first step, we model the probability of introducing a
new product, while the second step focuses on the factors determining the sophistication of newly
introduced products. The estimated coefficients of interest and their significance levels remain vir-
tually unchanged relative to the OLS. The selection term, λ , is never statistically significant. Thus,
the results suggest that selection bias does not seem to be a serious issue in our model. As far as
the exclusion restriction is concerned, the concentration level in the region-sector bears a negative
and statistically significant coefficient, thus corroborating part of the literature suggesting a positive
impact of competition on innovation (Nickell, 1996; Blundell et al., 1999).
We find that, while the presence of foreign affiliates in the downstream (input buying) sectors
is positively correlated with the sophistication of new products, it does not seem to affect the firm’s
28Note that past sophistication pertains to all products produced by the firm in t− 1, while the dependent variable pertainsonly to the newly introduced products.
This article is protected by copyright. All rights reserved.
Acc
epte
d A
rtic
lepropensity to introduce a new product. This is true in both specifications presented. The link between
the FDI presence in downstream sectors and new product complexity is statistically significant at the
one percent level in both specifications. FDI presence in the same or the upstream sector does not
seem to matter in either stage.
Moving on to the firm level controls, new products tend to be introduced by firms with a less com-
plex production structure, smaller firms and firms paying lower wages. The past firm complexity turns
out to be very relevant in driving the level of complexity of new products, while labour productivity
does not seem to affect the sophistication of new products. Higher wages are also positively associ-
ated with the complexity of newly introduced goods. In other words, we confirm the evidence from
the OLS estimation.
Is the estimated effect economically meaningful? Taking as a reference point the results from col-
umn 7 of Table 3, our evidence implies that a 10 percentage point increase in foreign presence in
downstream sectors is associated with an increase in the average complexity of newly introduced
products by 0.297. This corresponds to about 30% of the standard deviation in our sample. Contin-
uing with the example of steel components, this estimate implies moving about half of the way from
the production of pot scourers to producing stainless steel products with deep drawing, such as stain-
less sinks. An increase of about 17 percentage points in FDI in downstream sectors, instead, would be
necessary in order to move from the production of stainless sinks to the production of the washing
machine flanges.
3.2 Robustness Checks
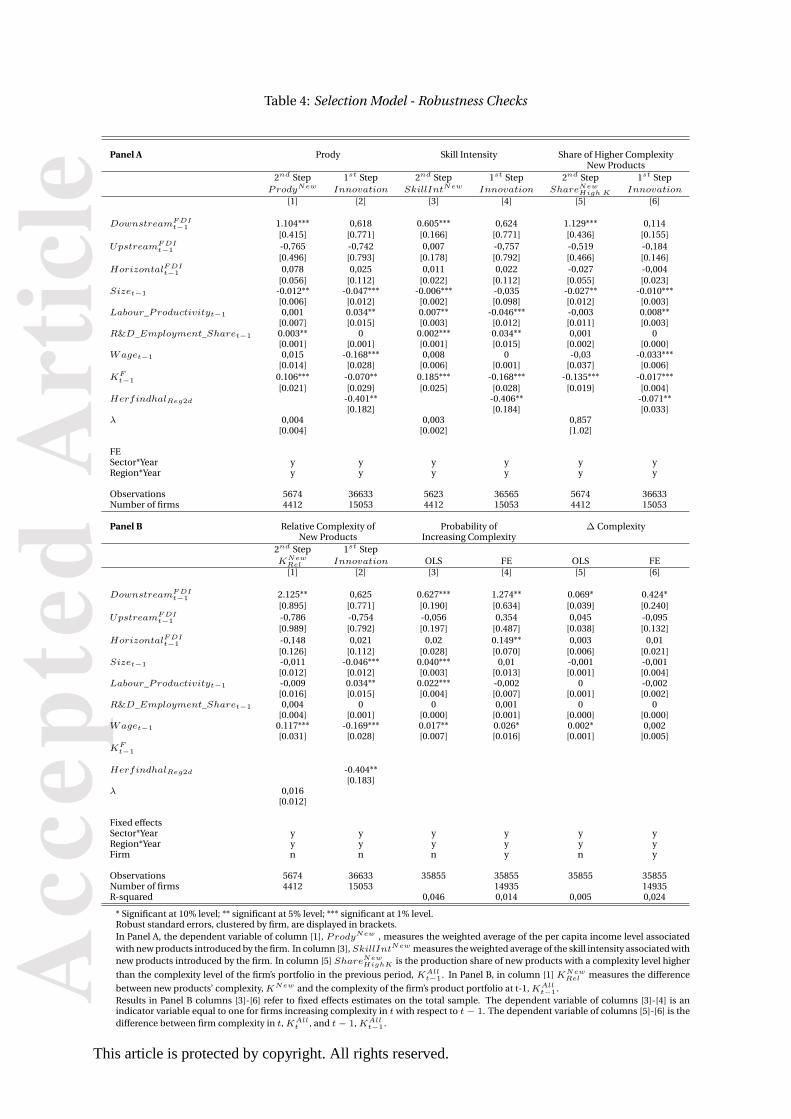
We subject our findings to a plethora of robustness checks. First, we show that our results are not af-
fected by using a different definition of the dependent variable. In columns 1-2 of Panel A of Table 4,
we replace our complexity measure with the well-known measure called PRODY developed by Haus-
mann et al. (2007) and confirm our main conclusions. This is not surprising because our preferred
measure and PRODY are highly correlated and lead to a similar ranking of products (as explained in
subsection 2.2), even if the iteration procedure used to create the preferred measure is more convinc-
ing. In columns 3-4 of Panel A, we use the skilled-labour-intensity of the newly introduced products
(SkillIntNew). This measure was developed by Ma et al. (2014) and available from one of the authors’
This article is protected by copyright. All rights reserved.
Acc
epte
d A
rtic
leTable 2: Baseline Results - OLS
KNew
[1] [2] [3] [4]
DownstreamFDIt−1 2.951*** 2.965***
[0.766] [0.765]UpstreamFDI
t−1 -0,465 -0,493[0.809] [0.816]
HorizontalFDIt−1 0,082 0,101
[0.102] [0.102]KF
t−1 0.271*** 0.272*** 0.271*** 0.270***[0.018] [0.018] [0.018] [0.018]
Sizet−1 -0,017 -0,017 -0,017 -0,017[0.010] [0.010] [0.010] [0.010]
Labour_Productivityt−1 -0,006 -0,005 -0,005 -0,005[0.013] [0.013] [0.013] [0.013]
R&D_Employment_Sharet−1 0,003 0,003 0,003 0,003[0.003] [0.003] [0.003] [0.003]
Waget−1 0.099*** 0.103*** 0.103*** 0.099***[0.025] [0.025] [0.025] [0.025]
Fixed effectsSector*Year y y y yRegion*Year y y y y
Observations 5674 5674 5674 5674R-squared 0,702 0,701 0,701 0,702
* Significant at 10% level; ** significant at 5% level; *** significant at 1% level.Robust standard errors, clustered by firm, are displayed in brackets.The dependent variableKNew is defined as the weighted average of product com-plexity calculated across new product(s) introduced by firm i in year t where pro-duction shares are used as weights.
Table 3: Baseline Results - Selection Model
2nd Step 1st Step 2nd Step 1st Step 2nd Step 1st Step 2nd Step 1st StepKNew Innovation KNew Innovation KNew Innovation KNew Innovation
[1] [2] [3] [4] [5] [6] [7] [8]
DownstreamFDIt−1 2.957*** 0,605 2.971*** 0,622
[0.758] [0.772] [0.756] [0.772]UpstreamFDI
t−1 -0,472 -0,682 -0,5 -0,717[0.800] [0.790] [0.807] [0.793]
HorizontalFDIt−1 0,083 0,033 0,101 0,046
[0.100] [0.111] [0.101] [0.111]KF
t−1 0.270*** -0.071*** 0.271*** -0.071*** 0.271*** -0.072*** 0.269*** -0.071***[0.018] [0.017] [0.018] [0.017] [0.018] [0.017] [0.018] [0.017]
Sizet−1 -0.017* -0.048*** -0.017* -0.048*** -0.018* -0.048*** -0.018* -0.048***[0.010] [0.012] [0.010] [0.012] [0.010] [0.012] [0.010] [0.012]
Labour_Productivityt−1 -0,005 0.034** -0,005 0.035** -0,005 0.035** -0,005 0.034**[0.013] [0.015] [0.013] [0.015] [0.013] [0.015] [0.013] [0.015]
R&D_Employment_Sharet−1 0,003 0 0,003 0 0,003 0 0,003 0[0.003] [0.001] [0.003] [0.001] [0.003] [0.001] [0.003] [0.001]
Waget−1 0.098*** -0.168*** 0.102*** -0.167*** 0.102*** -0.168*** 0.097*** -0.168***[0.025] [0.028] [0.025] [0.028] [0.025] [0.028] [0.025] [0.028]
HerfindhalReg2d -0.405** -0.407** -0.418** -0.405**[0.181] [0.180] [0.182] [0.183]
λ 0,011 0,011 0,011 0,011[0.011] [0.011] [0.011] [0.011]
Fixed effectsSector*Year y y y y y y y yRegion*Year y y y y y y y y
Observations 5674 36633 5674 36633 5674 36633 5674 36633
* Significant at 10% level; ** significant at 5% level; *** significant at 1% level.Robust standard errors, clustered by firm, are displayed in brackets.In columns [1], [3], [5] and [7] the dependent variable isKNew , defined as the weighted average of product complexity calculated across new product(s)introduced by firm i in year twhere production shares are used as weights.In columns [1], [3], [5] and [7], λ represents the inverse Mills ratio generated from the first step selection equations in columns [2], [4], [6] and [8], wherethe dependent variable, Innovation, is a dummy taking the value of one for firms introducing new products in a given year, and 0 otherwise.
This article is protected by copyright. All rights reserved.
Acc
epte
d A
rtic
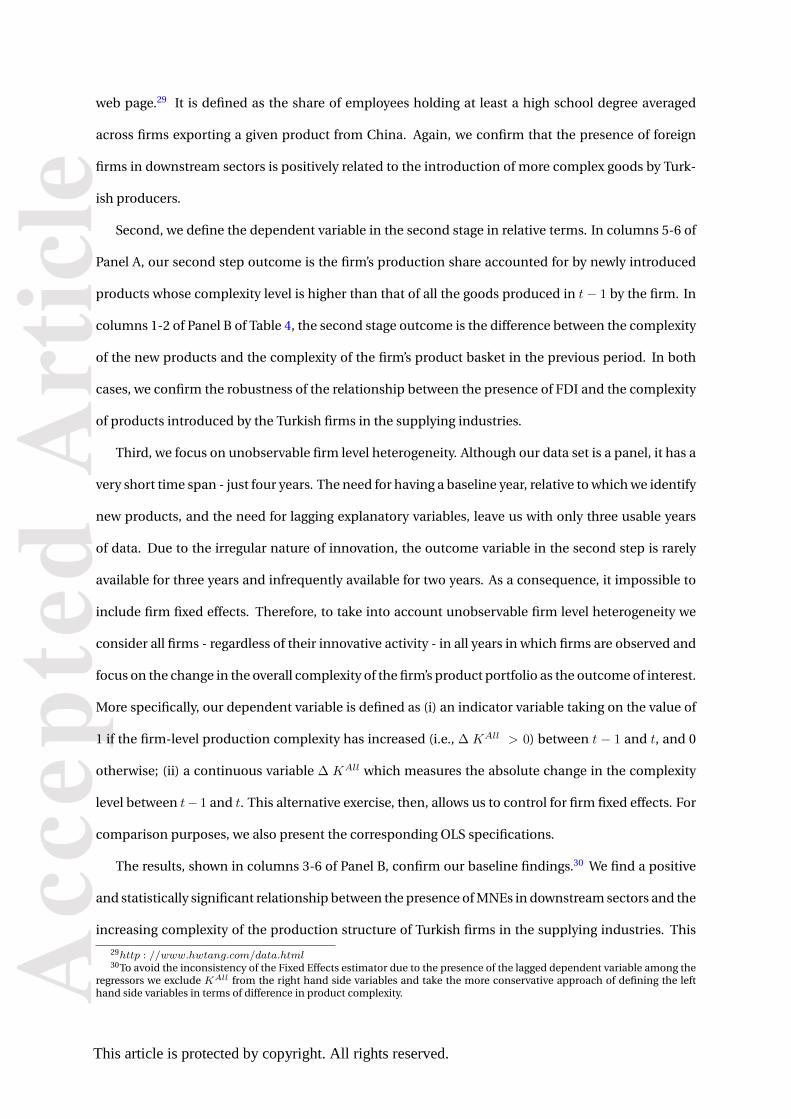
leweb page.29 It is defined as the share of employees holding at least a high school degree averaged
across firms exporting a given product from China. Again, we confirm that the presence of foreign
firms in downstream sectors is positively related to the introduction of more complex goods by Turk-
ish producers.
Second, we define the dependent variable in the second stage in relative terms. In columns 5-6 of
Panel A, our second step outcome is the firm’s production share accounted for by newly introduced
products whose complexity level is higher than that of all the goods produced in t − 1 by the firm. In
columns 1-2 of Panel B of Table 4, the second stage outcome is the difference between the complexity
of the new products and the complexity of the firm’s product basket in the previous period. In both
cases, we confirm the robustness of the relationship between the presence of FDI and the complexity
of products introduced by the Turkish firms in the supplying industries.
Third, we focus on unobservable firm level heterogeneity. Although our data set is a panel, it has a
very short time span - just four years. The need for having a baseline year, relative to which we identify
new products, and the need for lagging explanatory variables, leave us with only three usable years
of data. Due to the irregular nature of innovation, the outcome variable in the second step is rarely
available for three years and infrequently available for two years. As a consequence, it impossible to
include firm fixed effects. Therefore, to take into account unobservable firm level heterogeneity we
consider all firms - regardless of their innovative activity - in all years in which firms are observed and
focus on the change in the overall complexity of the firm’s product portfolio as the outcome of interest.
More specifically, our dependent variable is defined as (i) an indicator variable taking on the value of
1 if the firm-level production complexity has increased (i.e., ∆ KAll > 0) between t − 1 and t, and 0
otherwise; (ii) a continuous variable ∆ KAll which measures the absolute change in the complexity
level between t− 1 and t. This alternative exercise, then, allows us to control for firm fixed effects. For
comparison purposes, we also present the corresponding OLS specifications.
The results, shown in columns 3-6 of Panel B, confirm our baseline findings.30 We find a positive
and statistically significant relationship between the presence of MNEs in downstream sectors and the
increasing complexity of the production structure of Turkish firms in the supplying industries. This
29http : //www.hwtang.com/data.html30To avoid the inconsistency of the Fixed Effects estimator due to the presence of the lagged dependent variable among the
regressors we exclude KAll from the right hand side variables and take the more conservative approach of defining the lefthand side variables in terms of difference in product complexity.
This article is protected by copyright. All rights reserved.
Acc
epte
d A
rtic
lerelationship is statistically significant in all specifications, both in the OLS and the fixed effects model.
Thus these robustness checks confirm our baseline findings, while taking into account unobservable
firm heterogeneity.
A further set of robustness checks is presented in Table A.4 in the online Appendix. First, we show
that our results are confirmed when we define proxies for FDI presence based on employment (rather
than output) shares (column 1). Second, we redefine innovation as introduction of new products
which (in total) account for a significant share of the firm’s total production. We use the threshold of
3%, which corresponds to approximately the 25th percentile of the distribution. When compared to
the original definition of innovators, the new definition excludes relatively large firms that produce
many products (column 2). Using this alternative definition does not affect our findings. Next, we
present the results from a cross-sectional analysis (column 3). In this exercise, we define the firm’s
probability of introducing a new product on a 3-year-long interval (2007-2009). The complexity of
new products is then measured as an average over the same period. The explanatory variables pertain
to the pre-sample year, 2006. Again, we find that the presence of MNEs stimulates product upgrading
by Turkish firms in the supplying industries. Further, we consider only single-region firms and use
spillover proxies that vary at the region-sector level (column 4) as opposed to the firm-level measures
used in the baseline analysis. In this specification, we cluster standard errors at the region-sector
level. The estimated coefficient on FDI in downstream sectors is slightly higher, thus hinting at a
possible downward bias stemming from averaging spillover measures across a firm’s locations.
In the baseline model, we cluster standard errors at the firm level because our spillover proxies
are averages across all regions where a firm owns facilities. Thus, the spillover measures are firm spe-
cific variables. In columns 5 and 6, we show that our results are robust to clustering standard errors
at the region-sector level. When we do so, the variable of interest remains statistically significant at
the one percent level. Furthermore, we show that our results are robust to the inclusion of additional
covariates which vary at the region-sector-time level, such as value added (V Arjt−1), labour produc-
tivity (LPrjt−1), output (Outputrjt−1), and employment (Emprjt−1) (columns 7-10). Finally, our re-
sults remain unchanged if we control for the firm being an importer, Importerit−1, or an exporter,
Exporterit−1, at t-1 (column 11).
This article is protected by copyright. All rights reserved.
Acc
epte
d A
rtic
leTable 4: Selection Model - Robustness Checks
Panel A Prody Skill Intensity Share of Higher ComplexityNew Products
2nd Step 1st Step 2nd Step 1st Step 2nd Step 1st StepProdyNew Innovation SkillIntNew Innovation ShareNew
High K Innovation
[1] [2] [3] [4] [5] [6]
DownstreamFDIt−1 1.104*** 0,618 0.605*** 0,624 1.129*** 0,114
[0.415] [0.771] [0.166] [0.771] [0.436] [0.155]UpstreamFDI
t−1 -0,765 -0,742 0,007 -0,757 -0,519 -0,184[0.496] [0.793] [0.178] [0.792] [0.466] [0.146]
HorizontalFDIt−1 0,078 0,025 0,011 0,022 -0,027 -0,004
[0.056] [0.112] [0.022] [0.112] [0.055] [0.023]Sizet−1 -0.012** -0.047*** -0.006*** -0,035 -0.027** -0.010***
[0.006] [0.012] [0.002] [0.098] [0.012] [0.003]Labour_Productivityt−1 0,001 0.034** 0.007** -0.046*** -0,003 0.008**
[0.007] [0.015] [0.003] [0.012] [0.011] [0.003]R&D_Employment_Sharet−1 0.003** 0 0.002*** 0.034** 0,001 0
[0.001] [0.001] [0.001] [0.015] [0.002] [0.000]Waget−1 0,015 -0.168*** 0,008 0 -0,03 -0.033***
[0.014] [0.028] [0.006] [0.001] [0.037] [0.006]KF
t−1 0.106*** -0.070** 0.185*** -0.168*** -0.135*** -0.017***[0.021] [0.029] [0.025] [0.028] [0.019] [0.004]
HerfindhalReg2d -0.401** -0.406** -0.071**[0.182] [0.184] [0.033]
λ 0,004 0,003 0,857[0.004] [0.002] [1.02]
FESector*Year y y y y y yRegion*Year y y y y y y
Observations 5674 36633 5623 36565 5674 36633Number of firms 4412 15053 4412 15053 4412 15053
Panel B Relative Complexity of Probability of ∆ ComplexityNew Products Increasing Complexity
2nd Step 1st StepKNew
Rel Innovation OLS FE OLS FE[1] [2] [3] [4] [5] [6]
DownstreamFDIt−1 2.125** 0,625 0.627*** 1.274** 0.069* 0.424*
[0.895] [0.771] [0.190] [0.634] [0.039] [0.240]UpstreamFDI
t−1 -0,786 -0,754 -0,056 0,354 0,045 -0,095[0.989] [0.792] [0.197] [0.487] [0.038] [0.132]
HorizontalFDIt−1 -0,148 0,021 0,02 0.149** 0,003 0,01
[0.126] [0.112] [0.028] [0.070] [0.006] [0.021]Sizet−1 -0,011 -0.046*** 0.040*** 0,01 -0,001 -0,001
[0.012] [0.012] [0.003] [0.013] [0.001] [0.004]Labour_Productivityt−1 -0,009 0.034** 0.022*** -0,002 0 -0,002
[0.016] [0.015] [0.004] [0.007] [0.001] [0.002]R&D_Employment_Sharet−1 0,004 0 0 0,001 0 0
[0.004] [0.001] [0.000] [0.001] [0.000] [0.000]Waget−1 0.117*** -0.169*** 0.017** 0.026* 0.002* 0,002
[0.031] [0.028] [0.007] [0.016] [0.001] [0.005]KF
t−1
HerfindhalReg2d -0.404**[0.183]
λ 0,016[0.012]
Fixed effectsSector*Year y y y y y yRegion*Year y y y y y yFirm n n n y n y
Observations 5674 36633 35855 35855 35855 35855Number of firms 4412 15053 14935 14935R-squared 0,046 0,014 0,005 0,024
* Significant at 10% level; ** significant at 5% level; *** significant at 1% level.Robust standard errors, clustered by firm, are displayed in brackets.In Panel A, the dependent variable of column [1], ProdyNew , measures the weighted average of the per capita income level associatedwith new products introduced by the firm. In column [3],SkillIntNew measures the weighted average of the skill intensity associated withnew products introduced by the firm. In column [5] ShareNew
HighK is the production share of new products with a complexity level higher
than the complexity level of the firm’s portfolio in the previous period, KAllt−1. In Panel B, in column [1] KNew
Rel measures the difference
between new products’ complexity,KNew and the complexity of the firm’s product portfolio at t-1,KAllt−1.
Results in Panel B columns [3]-[6] refer to fixed effects estimates on the total sample. The dependent variable of columns [3]-[4] is anindicator variable equal to one for firms increasing complexity in t with respect to t − 1. The dependent variable of columns [5]-[6] is thedifference between firm complexity in t,KAll
t , and t− 1,KAllt−1.
This article is protected by copyright. All rights reserved.
Acc
epte
d A
rtic
le3.3 Instrumental Variable Approach
One may be concerned that the location of foreign affiliates in Turkey is chosen strategically based
on future expectations of sourcing options, thus introducing a reverse causality problem. We believe
that this is unlikely to be the case in practice as this would require foreign investors to possess very
detailed information, they are unlikely to have. Moreover, we believe that this concern is mitigated
by the inclusion of region-year and sector-year fixed effects as well as by the use of lagged proxies
for MNE presence. Nonetheless, we take this potential concern seriously and implement an IV ap-
proach by instrumenting for the three spillover proxies. As we have found no evidence of a bias due to
firms self selecting into introduction of new products, we will apply the IV approach just to the model
explaining the complexity of newly introduced products. Our IV strategy is based on alternatively
combining the following four variables:
Instrument 1: Turkey is an attractive destination for FDI thanks it to its low wages and customs
union with the EU. This means, however, that Turkey is in direct competition for FDI with Eastern
European members of the EU, particularly the largest one, Poland, which, like Turkey, has access
to the sea and lies on the East-West transit routes. To build our instrument we utilise information
on industry-specific FDI stocks found in Poland in 2006-2008 (thus matching the time coverage of
our analysis) which are retrieved from the Wiener Institut für Internationale Wirtschaftsvergleiche
(WIIW) FDI Database.31
Furthermore, not all regions within Turkey are equally appealing to foreign investors. To capture
the regional variation of the foreign presence in Turkey, we anticipate that less developed areas may
be less attractive to foreign investors. We identify such regions using information on the pre-sample
(2005) level of Socio-Economic Development Index (SEDI) from the Turkish State Planning Organiza-
tion (now Ministry of Development). We create a dummy for underdeveloped 2-digit NUTS regions,
which are defined as those including at least one 3-digit NUTS province with the SEDI level below the
median.
Our first instrument for Horizontal FDI is, then, an interaction between the logged stock of FDI
received by Poland in a given 2-digit NACE sector in given year and an indicator variable denoting un-
31We focus on stocks because flows tend to be lumpy, and thus stocks better capture the sectoral composition of FDI.
This article is protected by copyright. All rights reserved.
Acc
epte
d A
rtic
lederdeveloped regions of Turkey in the pre-sample period. This instrument varies by region, industry
and year. In the case of Downstream FDI and Upstream FDI, the instrument is combined with the
appropriate input-output coefficients (as in equations 5 and 6 above). This instrument captures two
push factors (competition from Poland and regional backwardness), so we expect it to bear a negative
sign in the first stage regressions.
Instrument 2: Our second instrument also uses the logged volume of FDI stocks received by Poland.
This sector-year-specific variable is then interacted with the log of the squared distance from each
region to the nearest transport gateway which allows to capture the regional dimension. The intuition
behind this instrument is that sectors competing for FDI with Poland are likely to receive less FDI,
especially in those regions located farther away from transport gateways. The distance to the closest
gateway is defined as the distance to the capital of the Turkish region hosting the gateway.
The instrument varies by region, sector and year. Since the instrument captures push factors
(competition from Poland and remoteness), we expect it to bear a negative sign in the first stage re-
gressions. We use this instrument as an alternative to the first instrument.
Instrument 3: The third instrument captures the distribution of global supply of FDI across sectors by
focusing on the logged stock of outward FDI from OECD countries disaggregated by investor country,
2-digit NACE sector and year. We use this information for 2006-2008.
Since the existing literature has documented the negative effects of information asymmetries on
capital flows (Portes et al., 2001; Portes and Rey, 2005; Gelos and Wei, 2005) and shown that it is par-
ticularly strong for FDI (Daude and Fratzscher, 2008), we weight the stock of FDI by a proxy capturing
information flows between a given Turkish region and the rest of the world.
Following Daude and Fratzscher (2008), as our proxy we use the value of exports of newspapers
from a given region to a given destination in a pre-sample year (2004). The information on trade
in newspapers comes from the Turkish Statistical Office (TurkStat) and is expressed in thousands of
US dollars. We use export flows for HS 6-digit code 490210 “Newspapers, journals and periodicals,
whether or not illustrated or containing advertising material, appearing at least four times a week.”
For each Turkish region, we calculate the share of newspapers exports going to a particular OECD
This article is protected by copyright. All rights reserved.

Acc
epte
d A
rtic
ledestination country and use it to weight outward FDI stocks reported by the OECD. For instance, to
create the instrument relevant to Horizontal FDI variable for electrical machinery sector located in
the Istanbul region in a given year, we weight the outward FDI stock in the machinery sector origi-
nating from an OECD country c in the same year using the share of newspapers exports going from
the Istanbul region to country c in Istanbul’s total exports of newspapers to OECD countries in the
pre-sample period as the weight. Then, we sum over all the OECD countries. Put differently, our in-
strument is the weighted average of outward FDI stocks of OECD countries in a given industry where
the weights proxy for the information flows between each Turkish region and the given source coun-
try. The instrument varies by region, sector and year. Since the instrument captures the global supply
of FDI and a factor facilitating information flows, we would expect it to be positively correlated with
FDI entry.
Instrument 4: Our final instrument is based on the belief that it might be easier for Turkey to attract
FDI from countries with whom it has signed double taxation treaties and from countries with whom
information asymmetries are lower. Furthermore, the ability of Turkey to attract FDI may be affected
by the effectiveness of investment promotion efforts performed by other countries.
We use information on how long Turkey has had a double taxation treaty with country c in a given
year, if at all. We create a weighted sum of the treaty duration in years using as weights regional
newspapers exports to country c (defined above). We then divide this measure by a proxy for global
competition for FDI in a given sector.
To capture global competition for FDI in a given sector we take advantage of the fact that, ac-
cording to investment promotion professionals, targeting particular sectors in investment promotion
efforts is considered to be best practice since it is a more effective strategy than trying to attract FDI
across the board (Loewendahl, 2001; Proksch, 2004). We create a sector-specific variable capturing
the number of countries in the world considering a given sector as a priority sector in their invest-
ment promotion efforts. This variable is defined at the 2-digit NACE sector and pertains to 2004, a
pre-sample year. It has been obtained from the 2005 World Bank Census of Investment Promotion
Agencies.32
32For more information on the Census, see Harding and Javorcik (2011). According to the data, Turkey did not engage insector targeting in its own investment promotion efforts.
This article is protected by copyright. All rights reserved.
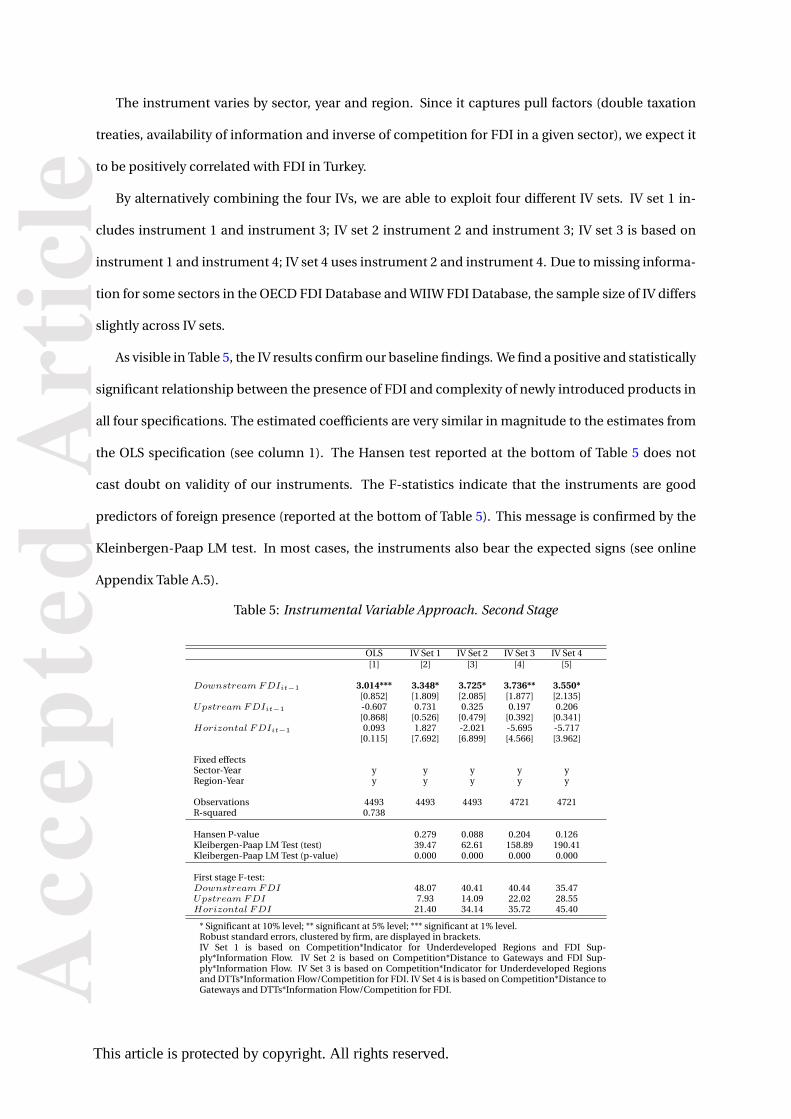
Acc
epte
d A
rtic
leThe instrument varies by sector, year and region. Since it captures pull factors (double taxation
treaties, availability of information and inverse of competition for FDI in a given sector), we expect it
to be positively correlated with FDI in Turkey.
By alternatively combining the four IVs, we are able to exploit four different IV sets. IV set 1 in-
cludes instrument 1 and instrument 3; IV set 2 instrument 2 and instrument 3; IV set 3 is based on
instrument 1 and instrument 4; IV set 4 uses instrument 2 and instrument 4. Due to missing informa-
tion for some sectors in the OECD FDI Database and WIIW FDI Database, the sample size of IV differs
slightly across IV sets.
As visible in Table 5, the IV results confirm our baseline findings. We find a positive and statistically
significant relationship between the presence of FDI and complexity of newly introduced products in
all four specifications. The estimated coefficients are very similar in magnitude to the estimates from
the OLS specification (see column 1). The Hansen test reported at the bottom of Table 5 does not
cast doubt on validity of our instruments. The F-statistics indicate that the instruments are good
predictors of foreign presence (reported at the bottom of Table 5). This message is confirmed by the
Kleinbergen-Paap LM test. In most cases, the instruments also bear the expected signs (see online
Appendix Table A.5).
Table 5: Instrumental Variable Approach. Second Stage
OLS IV Set 1 IV Set 2 IV Set 3 IV Set 4[1] [2] [3] [4] [5]
DownstreamFDIit−1 3.014*** 3.348* 3.725* 3.736** 3.550*[0.852] [1.809] [2.085] [1.877] [2.135]
UpstreamFDIit−1 -0.607 0.731 0.325 0.197 0.206[0.868] [0.526] [0.479] [0.392] [0.341]
Horizontal FDIit−1 0.093 1.827 -2.021 -5.695 -5.717[0.115] [7.692] [6.899] [4.566] [3.962]
Fixed effectsSector-Year y y y y yRegion-Year y y y y y
Observations 4493 4493 4493 4721 4721R-squared 0.738
Hansen P-value 0.279 0.088 0.204 0.126Kleibergen-Paap LM Test (test) 39.47 62.61 158.89 190.41Kleibergen-Paap LM Test (p-value) 0.000 0.000 0.000 0.000
First stage F-test:DownstreamFDI 48.07 40.41 40.44 35.47UpstreamFDI 7.93 14.09 22.02 28.55Horizontal FDI 21.40 34.14 35.72 45.40
* Significant at 10% level; ** significant at 5% level; *** significant at 1% level.Robust standard errors, clustered by firm, are displayed in brackets.IV Set 1 is based on Competition*Indicator for Underdeveloped Regions and FDI Sup-ply*Information Flow. IV Set 2 is based on Competition*Distance to Gateways and FDI Sup-ply*Information Flow. IV Set 3 is based on Competition*Indicator for Underdeveloped Regionsand DTTs*Information Flow/Competition for FDI. IV Set 4 is is based on Competition*Distance toGateways and DTTs*Information Flow/Competition for FDI.
This article is protected by copyright. All rights reserved.
Acc
epte
d A
rtic
leTo summarise, our findings are consistent with a scenario (depicted in our anecdotal evidence)
where MNCs actively help Turkish firms to upgrade their production structure by providing them with
product blueprints and designs, helping Turkish firms improve their quality control systems by pro-
viding training for Turkish employees or sending own experts to the Turkish firm, supplying Turkish
firms with information about suitable or perhaps superior inputs, etc. They are also consistent with
a scenario where MNCs advertise their willingness to purchase an input with given technical specifi-
cations and stipulate the percentage of faulty parts per million (a commonly used measure of quality)
they are willing to accept and possibly specify exactly what inputs should be used to produce it. In
both cases, there is an information flow between MNCs and Turkish producers. In the former case, we
would refer to it as “real” knowledge spillovers, while in the latter case we would call them pecuniary
spillovers. Although the case for “real” knowledge spillovers is supported by our anecdotal evidence,
we cannot discard the possibility that our result is driven by the other type of externality. Nonetheless,
what really matters from the policy perspective is that such knowledge transfers take place.
3.4 Additional Margins of Adjustment
The evidence provided so far suggests that FDI inflows can lead to upgrading of the host country
production structure by stimulating introduction of new products with a higher level of complexity.
It is conceivable, however, that a similar adjustment could take place along other margins as well.
Therefore, in additional exercises (not reported here), we have considered several other possibilities.
First, it seems plausible that the presence of FDI could stimulate entry of new suppliers in the
upstream sectors by creating an additional market for the relevant inputs. However, it is also possible
to find scenarios when MNE entry can have the opposite effect. If, for instance, MNE production
replaces production previously undertaken by local firms and if MNEs are more reliant on imports,
then entry of MNEs may translate into a smaller market for local firms in the supplying sectors and
thus may lead to firm exit in those sectors. We have investigated this possibility by examining the
relationship between the number of entering (or exiting) firms in each industry-region-year cell and
the presence of foreign affiliates in the same, upstream and downstream industry. We controlled for
the lagged number of firms in a given industry-region-year cell, their output and employment as well
as for the concentration ratio (Herfindahl index). We did not find a statistically significant relationship
This article is protected by copyright. All rights reserved.
Acc
epte
d A
rtic
lebetween FDI and entry (or exit) of Turkish firms in the same, upstream or downstream industry. The
analysis of firm-level exit decision has led to similar results.
Second, it is possible that greater demand for more complex inputs resulting from MNE entry
could lead to a larger scale of production of existing complex products. We investigated this possibil-
ity by focusing on non-innovators, that is firms that do not introduce new products throughout the
period considered, and relating the change of complexity of their production structure to the pres-
ence of MNEs. As before, we measured complexity of the production structure using the weighted
average of the complexity of all products produced with the production shares serving as weights. We
also controlled for unobservable firm heterogeneity. We did not find a statistically significant relation-
ship betweenDownstreamFDI and production complexity change. In contrast, when we focused on
innovators (namely, firms in our sample, that is, firms which introduced at least one new product dur-
ing the time frame considered), we found a positive and statistically significant relationship between
the two variables.
Finally, we investigated whether there exists a relationship between the complexity range of a firm’s
production portfolio (defined as the difference in complexity level between the most and the least
sophisticated product produced) and MNE presence. No statistically significant relationship was de-
tected.
Based on all these pieces of evidence, we conclude that stimulating introduction of more complex
products is the main channel through which FDI inflows have affected the production structure in
Turkey.
3.5 Allowing for Heterogeneous Effects of Foreign Presence in Downstream Sectors
In Table A.6 in the online Appendix, we allow for heterogenous effects of foreign presence in down-
stream sectors on product sophistication depending on domestic firms’ pre-existing characteristics
and on the nationality of foreign investors.
The indigenous firms’ pre-existing complexity and productivity Benefits that indigenous firms en-
joy from their interactions with foreign investors could depend on their existing capabilities. On the
one hand, domestic players with greater absorptive capacity may be better positioned to take advan-
tage of knowledge spillovers. On the other hand, larger benefits may accrue to firms with a larger
This article is protected by copyright. All rights reserved.
Acc
epte
d A
rtic
leneed for external support and aid in the process of production upgrading. Which of these effects
dominates is an empirical question. To shed light on this issue we extend our baseline specification
(equation 7) by adding the interaction between spillovers from foreign customers,Downstream FDI,
and a dummy denoting domestic firms with a pre-existing sophistication level,KAllit−1, above the sam-
ple median. The results, presented in the first column of Table A.6, suggest that firms with a lower
initial level of product sophistication derive greater benefits from FDI presence in downstream sec-
tors. These benefits are roughly three times higher in magnitude than the benefits accruing to more
sophisticated firms. In other words, the presence of multinationals seems to contribute to the con-
vergence of sophistication among firms, at least among innovators.33
Whereas the pre-existing firm complexity level appears to shape the magnitude of the spillover
effect, firms’ pre-existing labour productivity levels do not seem to matter for the way spillovers from
FDI in downstream sectors operate. As visible in column 2 of Table A.6, the coefficient on the interac-
tion term between spillovers from foreign customers and a dummy denoting domestic firms with the
above median labour productivity level does not appear to be statistically significant.
The firm size Next, we test for the possible moderating role of another dimension of firm hetero-
geneity: the firm size. We interact the downstream FDI measure with a dummy denoting firms with
the number of employees above the median in the sample (42 employees, see column 3) or above
100 employees (see column 4). The estimated coefficients on the interaction terms are negative and
statistically significant, thus suggesting that vertical linkages with foreign affiliates tend to stimulate
complexity upgrading among smaller firms in the supplying sectors.
Should we be surprised by the findings suggesting that less sophisticated and smaller firms tend
to be more affected by the presence of foreign affiliates in downstream sectors? We should not. When
making a decision from whom to source inputs multinationals weigh several factors: (i) ability to
deliver a product of a sufficient quality in a timely manner; (ii) price; (iii) desire to create a diversified
supplier base to avoid the risk of losing access to inputs due to a shock to a specific supplier and to
keep some bargaining power vis-à-vis the largest suppliers. Point (iii) offers one reason why it makes
sense for multinationals to source from smaller suppliers in addition to making purchases from the
33Further results, not shown here for the sake of brevity, reveal that the presence of foreign producers in downstream sectorshelps domestic Turkish firms to close the gap with respect to the leader firm in their same region and sector of activity.
This article is protected by copyright. All rights reserved.
Acc
epte
d A
rtic
lelarge established one.34
FDI country origin So far, we have assumed that knowledge spillovers from foreign affiliates are
independent of their country of origin. It is possible, however, that multinationals from high and
low income economies are characterised by different levels of technological sophistication and, thus,
present different potential to serve as a source of knowledge externalities. We examine this hypothe-
sis by exploiting the information on investor countries available in our data. We split foreign spillover
proxies into two groups according to the foreign investor’s origin: high income and low income coun-
try.35 We expect that spillovers from high income countries play a more relevant role in stimulating
the production upgrading of Turkish firms. This indeed appears to be the case. The results in column
5 of Table A.6 suggest that the positive link between the foreign presence in downstream sector and
product upgrading is driven by MNEs from high income countries. FDI from low income countries
does not appear to exert a statistically significant effect.
4 Conclusions
Governments of developing countries and emerging markets often strive to find policies to stimulate
upgrading of the national production structure. This paper argues that attracting inflows of foreign
direct investment can help them achieve this goal.
We examine whether multinational activity can boost the sophistication of the host country’s pro-
duction structure. More specifically, we use firm-product level data from the Turkish manufacturing
sector for the period 2006-9 to study the link between the complexity of products newly introduced
by Turkish firms and the regional presence of foreign affiliates in the input sourcing sectors. We find
evidence consistent with interactions between multinational firms and their Turkish suppliers facili-
tating product upgrading by the latter group. The effects seem to be more pronounced for smaller and
less sophisticated Turkish firms. They are also primarily driven by multinationals from industrialised
countries. Consistent with the broad conclusions of the FDI spillover literature, we find no evidence
34Wal-Mart’s sourcing decision in Mexico illustrate this point very nicely: “By exercising its bargaining power, it [Wal-Mart]squeezed profit margins among the major brands, offering them higher volumes in return. It also engaged the most efficientsmall-scale local producers as suppliers of store brands, thereby creating for itself a residual source of SDS [soaps, detergentsand surfactants] products that could be used in bargaining with the major (multinational) branded suppliers.” (Javorcik et al.,2008).
35Countries’ income level is from the 2011 World Bank classification.
This article is protected by copyright. All rights reserved.

Acc
epte
d A
rtic
leof the impact of FDI presence in the same or upstream sectors.
Our analysis supports the view that attracting inflows of FDI may serve as a catalyst for upgrading
the national production structure in an emerging economy. They also suggest that FDI can be a force
for intra-national convergence as smaller and less sophisticated firm appear to benefit more from
knowledge brought by foreign investors.
Beata Javorcik, University of Oxford and CEPR
Alessia Lo Turco, Universita Politecnica delle Marche
Daniela Maggioni, Universita Ca’ Foscari Venezia
This article is protected by copyright. All rights reserved.

Acc
epte
d A
rtic
leReferences
Aitken, B.J. and Harrison, A.E. (1999). ‘Do domestic firms benefit from direct foreign investment? evi-
dence from venezuela’, American Economic Review, vol. 89(3), pp. 605–618.
Alfaro, L., Chanda, A., Kalemli-Ozcan, S. and Sayek, S. (2004). ‘FDI and economic growth: the role of
local financial markets’, Journal of International Economics, vol. 64(1), pp. 89–112.
Arnold, J.M. and Javorcik, B.S. (2009). ‘Gifted kids or pushy parents? foreign direct investment and
plant productivity in indonesia’, Journal of International Economics, vol. 79(1), pp. 42–53.
Bas, M. and Strauss-Kahn, V. (2015). ‘Input trade liberalization, export prices and quality upgrading’,
Journal of International Economics, vol. 95(2), pp. 250–262.
Blundell, R., Griffith, R. and van Reenen, J. (1999). ‘Market share, market value and innovation in a
panel of British manufacturing firms’, Review of Economic Studies, vol. 66(3), pp. 529–54.
Borensztein, E., De Gregorio, J. and Lee, J.W. (1998). ‘How does foreign investment affect economic
growth?’, Journal of International Economics, vol. 45(1), pp. 115–135.
Brambilla, I. (2009). ‘Multinationals, technology, and the introduction of varieties of goods’, Journal of
International Economics, vol. 79(1), pp. 89 – 101.
Branstetter, L. (2006). ‘Is foreign direct investment a channel of knowledge spillovers? Evidence from
Japan’s FDI in the United States’, Journal of International Economics, vol. 68(2), pp. 325–344.
Carluccio, J. and Fally, T. (2013). ‘Foreign entry and spillovers with technological incompatibilities in
the supply chain’, Journal of International Economics, vol. 90(1), pp. 123–135.
Daude, C. and Fratzscher, M. (2008). ‘The pecking order of cross-border investment’, Journal of Inter-
national Economics, vol. 74(1), pp. 94 – 119.
Felipe, J., Kumar, U., Abdon, A. and Bacate, M. (2012). ‘Product complexity and economic develop-
ment’, Structural Change and Economic Dynamics, vol. 23(1), pp. 36 – 68.
Gaulier, G. and Zignago, S. (2010). ‘BACI: international trade database at the product-Level. The 1994-
2007 version’, CEPII.
This article is protected by copyright. All rights reserved.

Acc
epte
d A
rtic
leGelos, G. and Wei, S.J. (2005). ‘Transparency and international portfolio holdings’, Journal of Finance,
vol. 60(6), pp. 2987 – 3020.
Godart, O. and Görg, H. (2013). ‘Suppliers of multinationals and the forced linkage effect: evidence
from firm level data’, Journal of Economic Behavior and Organization, vol. 94, pp. 393–404.
Goerg, H. and Greenaway, D. (2004). ‘Much ado about nothing? do domestic firms really benefit from
foreign direct investment?’, World Bank Research Observer, vol. 19(2), pp. 171–197.
Griffith, R., Harrison, R. and Reenen, J.V. (2006). ‘How special is the special relationship? Using the
impact of U.S. R&D spillovers on U.K. firms as a test of technology sourcing’, American Economic
Review, vol. 96(5), pp. 1859–1875.
Guadalupe, M., Kuzmina, O. and Thomas, C. (2012). ‘Innovation and foreign ownership’, American
Economic Review, vol. 102(7), pp. 3594–3627.
Hallak, J.C. (2006). ‘Product quality and the direction of trade’, Journal of International Economics,
vol. 68(4), pp. 238–265.
Hallak, J.C. and Schott, P. (2011). ‘Estimating cross-country differences in product quality’, Quarterly
Journal of Economics, vol. 126(1), pp. 417–474.
Harding, T. and Javorcik, B.S. (2011). ‘Roll out the red carpet and they will come: investment promo-
tion and FDI inflows’, Economic Journal, vol. 121(557), pp. 1445–1476.
Harding, T. and Javorcik, B.S. (2012). ‘Foreign direct investment and export upgrading’, The Review of
Economics and Statistics, vol. 94(4), pp. 964–980.
Hausmann, R. and Hidalgo, C.A. (2009). ‘The building blocks of economic complexity’, Proc. Natl.
Acad. Sci., vol. 106, pp. 10570–10575.
Hausmann, R., Hwang, J. and Rodrik, D. (2007). ‘What you export matters’, Journal of Economic
Growth, vol. 12(1), pp. 1–25.
Hausmann, R. and Rodrik, D. (2003). ‘Economic development as self discovery’, Journal of Develop-
ment Economics, vol. 72(2), pp. 603–633.
This article is protected by copyright. All rights reserved.
Acc
epte
d A
rtic
leHavranek, T. and Irsova, Z. (2011). ‘Estimating vertical spillovers from FDI: Why results vary and what
the true effect is’, Journal of International Economics, vol. 85(2), pp. 234–244.
Hidalgo, C. (2009). ‘The dynamics of economic complexity and the product space over a 42 year pe-
riod’, Center for International Development, Harvard University.
Javorcik, B. (2008). ‘Can survey evidence shed light on spillovers from foreign direct investment?’,
World Bank Research Observer, vol. 23, pp. 139–159.
Javorcik, B., Wolfgang, K. and Tybout, J. (2008). ‘Openness and industrial response in a Wal-Mart
world: a case study of Mexican soaps, detergents and surfactant producers’, The World Economy,
vol. 31(12), pp. 1558–1580.
Javorcik, B.S. (2004). ‘Does foreign direct investment increase the productivity of domestic firms? In
search of spillovers through backward linkages’, American Economic Review, vol. 94(3), pp. 605–627.
Khandelwal, A. (2010). ‘The long and short (of) quality ladders’, Review of Economic Studies, vol. 77(4),
pp. 1450–1476.
Khandelwal, A., Schott, P. and Wei, S.J. (2013). ‘Trade liberalization and embedded institutional re-
form: evidence from Chinese exporters’, American Economic Review, vol. 103(6), pp. 2169–2195.
Lin, P. and Saggi, K. (2007). ‘Multinational firms, exclusivity, and backward linkages’, Journal of Inter-
national Economics, vol. 71(1), pp. 206–220.
Loewendahl, H. (2001). ‘A framework for FDI promotion’, Transnational Corporations, vol. 10(1), pp.
1–42.
Lucas, R.J. (1988). ‘On the mechanics of economic development’, Journal of Monetary Economics,
vol. 22(1), pp. 3–42.
Ma, Y., Tang, H. and Zhang, Y. (2014). ‘Factor intensity, product switching, and productivity: evidence
from Chinese exporters’, Journal of International Economics, vol. 92(2), pp. 349–362.
Manova, K. and Zhang, Z. (2012). ‘Export prices across firms and destinations’, Quarterly Journal of
Economics, vol. 127(1), pp. 379–436.
This article is protected by copyright. All rights reserved.
Acc
epte
d A
rtic
leNickell, S.J. (1996). ‘Competition and corporate performance’, Journal of Political Economy, vol.
104(4), pp. 724–46.
OECD (2008). ‘Oecd benchmark definition of foreign direct investment’, OECD.
Portes, R. and Rey, H. (2005). ‘The determinants of cross-border equity flows’, Journal of International
Economics, vol. 60(6), pp. 2987 – 3020.
Portes, R., Rey, H. and Oh, Y. (2001). ‘Information and capital flows: the determinants of transactions
in financial assets’, European Economic Review, vol. 45(4-6), pp. 783 – 796.
Proksch, M. (2004). ‘Selected issues on promotion and attraction of foreign direct investment in least
developed countries and economies in transition’, Investment Promotion and Enterprise Develop-
ment Bulletin for Asia and the Pacific, vol. 2, pp. 1–17.
Rodrik, D. (2006a). ‘Industrial development: stylized facts and policies’, Kennedy School of Govern-
ment.
Rodrik, D. (2006b). ‘What’s so special about China’s exports?’, China & World Economy, vol. 14(5), pp.
1–19.
Swenson, D.L. and Chen, H. (2014). ‘Multinational exposure and the quality of new chinese exports’,
Oxford Bulletin of Economics and Statistics, vol. 76(1), ISSN 1468-0084.
UNCTAD (2003). ‘Fdi policies for development: national and international perspectives’, United Na-
tions Conference on Trade and Development.
Wang, Z. and Wei, S.J. (2010). ‘What Accounts for the Rising Sophistication of China’s Exports?’, in
(China’s Growing Role in World Trade pp. 63–104, NBER Chapters, National Bureau of Economic
Research, Inc.
This article is protected by copyright. All rights reserved.