Embed Size (px)
Citation preview

1
The County of Hawaii and the State of Hawaii Department of Commerce and Consumer Affairs – Cable Television Division
Hawaii Island
Document Date
January 29, 2015
Version: Final
RURAL COMMUNICATIONS TECHNOLOGY COMPARISON REPORT
2
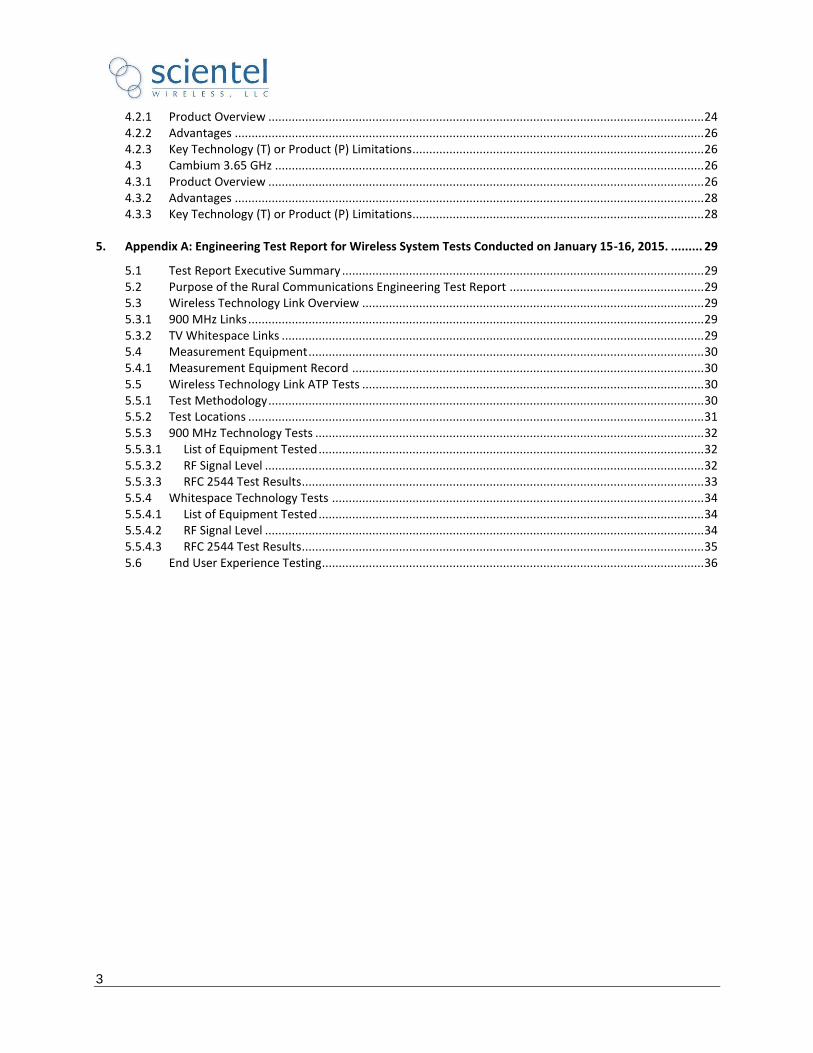
Table of Contents
Contents
1. Executive Summary ....................................................................................................................................... 4
2. Wireless Technologies ................................................................................................................................... 5
3. Coverage PREDICTIONS ................................................................................................................................. 5
3.1 Legend ..................................................................................................................................................... 5 3.2 Kea’au Police Station ............................................................................................................................... 6 3.2.1 TV Whitespace Coverage Map ................................................................................................................. 6 3.2.2 900MHz Coverage Map ........................................................................................................................... 7 3.2.3 3.65 GHz Coverage Map .......................................................................................................................... 7 3.3 Volcano Village......................................................................................................................................... 8 3.3.1 TV Whitespace Coverage Map ................................................................................................................. 8 3.3.2 900MHz Coverage Map ........................................................................................................................... 9 3.3.3 3.65 GHz Coverage Map .......................................................................................................................... 9 3.4 Hamakua Health Center ......................................................................................................................... 10 3.4.1 TV Whitespace Coverage Map ............................................................................................................... 10 3.4.2 900MHz Coverage Map ......................................................................................................................... 11 3.4.3 3.65 GHz Coverage Map ........................................................................................................................ 11 3.5 Kaloko .................................................................................................................................................... 12 3.5.1 TV Whitespace Coverage Map ............................................................................................................... 12 3.5.2 900MHz Coverage Map ......................................................................................................................... 13 3.5.3 3.65 GHz Coverage Map ........................................................................................................................ 13 3.6 Ohia Mill/Milolii ..................................................................................................................................... 14 3.6.1 TV Whitespace Coverage Map ............................................................................................................... 14 3.6.2 900MHz Coverage Map ......................................................................................................................... 15 3.6.3 3.65 GHz Coverage Map ........................................................................................................................ 16 3.7 Paauilo ................................................................................................................................................... 17 3.7.1 TV Whitespace Coverage Map ............................................................................................................... 17 3.7.2 900MHz Coverage Map ......................................................................................................................... 18 3.7.3 3.65 GHz Coverage Map ........................................................................................................................ 18 3.8 Pahoa ..................................................................................................................................................... 19 3.8.1 TV Whitespace Coverage Map ............................................................................................................... 19 3.8.2 900MHz Coverage Map ......................................................................................................................... 20 3.8.3 3.65 GHz Coverage Map ........................................................................................................................ 20 3.9 Wood Valley/Pahala .............................................................................................................................. 21 3.9.1 TV Whitespace Coverage Map ............................................................................................................... 21 3.9.2 900MHz Coverage Map ......................................................................................................................... 22 3.9.3 3.65 GHz Coverage Map ........................................................................................................................ 22
4. Wireless Technology Overview .................................................................................................................... 23
4.1 Ubiquiti 900 MHz ................................................................................................................................... 23 4.1.1 Product Overview .................................................................................................................................. 23 4.1.2 Advantages ............................................................................................................................................ 24 4.1.3 Key Technology (T) or Product (P) Limitations ....................................................................................... 24 4.2 Carlson RuralConnect TV Whitespace ................................................................................................... 24
3
4.2.1 Product Overview .................................................................................................................................. 24 4.2.2 Advantages ............................................................................................................................................ 26 4.2.3 Key Technology (T) or Product (P) Limitations ....................................................................................... 26 4.3 Cambium 3.65 GHz ................................................................................................................................ 26 4.3.1 Product Overview .................................................................................................................................. 26 4.3.2 Advantages ............................................................................................................................................ 28 4.3.3 Key Technology (T) or Product (P) Limitations ....................................................................................... 28
5. Appendix A: Engineering Test Report for Wireless System Tests Conducted on January 15-16, 2015. ......... 29
5.1 Test Report Executive Summary ............................................................................................................ 29 5.2 Purpose of the Rural Communications Engineering Test Report .......................................................... 29 5.3 Wireless Technology Link Overview ...................................................................................................... 29 5.3.1 900 MHz Links ........................................................................................................................................ 29 5.3.2 TV Whitespace Links .............................................................................................................................. 29 5.4 Measurement Equipment ...................................................................................................................... 30 5.4.1 Measurement Equipment Record ......................................................................................................... 30 5.5 Wireless Technology Link ATP Tests ...................................................................................................... 30 5.5.1 Test Methodology .................................................................................................................................. 30 5.5.2 Test Locations ........................................................................................................................................ 31 5.5.3 900 MHz Technology Tests .................................................................................................................... 32 5.5.3.1 List of Equipment Tested ................................................................................................................... 32 5.5.3.2 RF Signal Level ................................................................................................................................... 32 5.5.3.3 RFC 2544 Test Results ........................................................................................................................ 33 5.5.4 Whitespace Technology Tests ............................................................................................................... 34 5.5.4.1 List of Equipment Tested ................................................................................................................... 34 5.5.4.2 RF Signal Level ................................................................................................................................... 34 5.5.4.3 RFC 2544 Test Results ........................................................................................................................ 35 5.6 End User Experience Testing.................................................................................................................. 36
4
1. EXECUTIVE SUMMARY
This report results from the partnership between the County of Hawaii and the Cable Television Division of the State of Hawaii, Department of Commerce and Consumer Affairs (DCCA), to examine the potential use of several identified wireless technologies to extend broadband service to unserved areas on Hawaii Island. The three identified technologies are TV Whitespace, unlicensed 900MHz and 3.65 GHz. Specifically, this report compares the coverage predictions and the hardware and software features for each technology. This document is intended to serve as a resource report that may be used for planning purposes to extend broadband service, using wireless technologies, to unserved areas across the State where wireline internet connectivity is not available. Section 3 of this report contains coverage predictions for each of the three technologies from eight identified base station locations across Hawaii Island. These locations selected by DCCA are unserved and present various terrain challenges and tree densities. Section 4 of this report provides a technology overview for each of the three technologies. This includes a product review and a summary of key features and limitations of each technology. Appendix A of this report, “Engineering Test Report for Wireless System Tests Conducted on January 15-16, 2015”, provides the results of engineering tests performed with TV Whitespace and unlicensed 900MHz equipment for various link distances, link types (e.g., Full Line of Sight, Near-Line of Sight, and Non-Line of Sight), and equipment settings, on Hawaii Island. Tests were performed to measure speed, signal strength, signal quality, and end user broadband experience. The testing was performed on January 15 and 26, 2015, at the West Hawaii Civic Center.
5
2. WIRELESS TECHNOLOGIES Scientel Wireless, at the request of the County of Hawaii and the State of Hawaii Department of Commerce and Consumer Affairs, Cable Television Division, has prepared coverage maps for eight locations, for each of three types of wireless technologies (TV Whitespace, 900 MHz and 3.65 GHz), and has performed engineering testing for two types of wireless technologies (TV Whitespace and 900 MHz). Refer to Appendix A, “Engineering Test Report for Wireless System Tests Conducted on January 15-16, 2015.” Carlson Wireless’s Rural Connect solution was used in the coverage predictions, product and technology overview, and testing of TV Whitespace technology. Ubiquiti Networks Rocket M900 solution was used in the coverage predictions, product and technology overview, and testing of 900 MHz technology. Cambium Networks PMP450 3.65 GHz solution was used in the coverage predictions and product and technology overview of 3.65 GHz technology (this solution was not part of the engineering testing scope). Each technology consists of a central Base Station and one or more remote CPEs (Customer Premise Equipment). The Base Station connects to the provider’s internet backbone and CPEs connect to Customer’s Laptop or PC via an Ethernet cable.
3. COVERAGE PREDICTIONS Scientel Wireless has run multiple coverage predictions for the proposed eight Base Station locations on Hawaii Island: Kea’au Police Station, Volcano Village, Hamakua Health Center, Kaloko, Ohia Mill/Milolii, Paauilo, Pahoa, and Wood Valley/Pahala. Most of the coverage predictions are done for a Base Station with Directional antenna towards the area of interest. All of the predictions are done using EDX Wireless’s radio coverage prediction software, Signal Pro. Here are a few of the pertinent parameters used in coverage predictions:
1 arc second terrain data from United States Geological Survey (USGS)
30m resolution Clutter data from USGS
4/3 k factor
Remote CPE height of 9m
3.1 Legend
Receive Signal Levels - The following colours represent different predicted receive signal levels at the remote station. Note that for receive signal levels, a lower negative number is stronger (better) than a higher negative number.
Green = areas with receive signal levels of -70dBm and stronger
Yellow = areas with receive signal levels of -80dBm and stronger
Red = areas with receive signal levels of -90dBm and stronger
Blue = areas with receive signal levels below -90dBm
Scaling - provided on each map. Coordinates – are in decimal degrees.
6
3.2 Kea’au Police Station
For this location the coverage predictions are based on a base station height of 90 ft. located at the Kea’au Police station tower at the GPS co-ordinates Latitude:19.620969, Longitude: -155.039797. Here are each of the coverage predictions for this location.
3.2.1 TV Whitespace Coverage Map
The map below shows the coverage prediction for Carlson Wireless Rural Connect using Carlson’s 10.6dBi 120-180 degree directional antenna, at azimuth of 176 degrees towards Orchidland and Eden Roc Estates
7
3.2.2 900MHz Coverage Map
The map below shows the coverage prediction for Ubiquiti Networks Rocket M900 using Ubiquiti’s 13dBi 120 degree directional antenna, at azimuth of 176 degrees towards Orchidland and Eden Roc Estates.
3.2.3 3.65 GHz Coverage Map
The map below shows the coverage prediction for Cambium Networks PMP450 Cluster with four 90 degree 17dBi directional antennae for a 5MHz channel use.
8
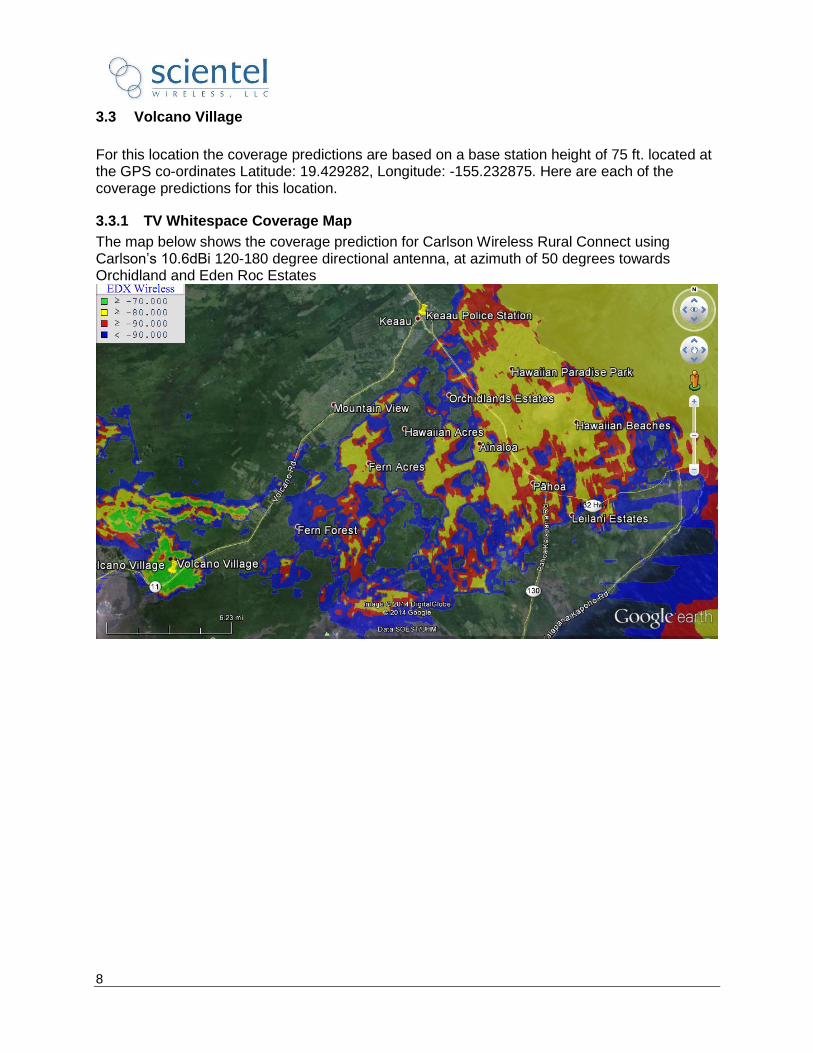
3.3 Volcano Village
For this location the coverage predictions are based on a base station height of 75 ft. located at the GPS co-ordinates Latitude: 19.429282, Longitude: -155.232875. Here are each of the coverage predictions for this location.
3.3.1 TV Whitespace Coverage Map
The map below shows the coverage prediction for Carlson Wireless Rural Connect using Carlson’s 10.6dBi 120-180 degree directional antenna, at azimuth of 50 degrees towards Orchidland and Eden Roc Estates
9
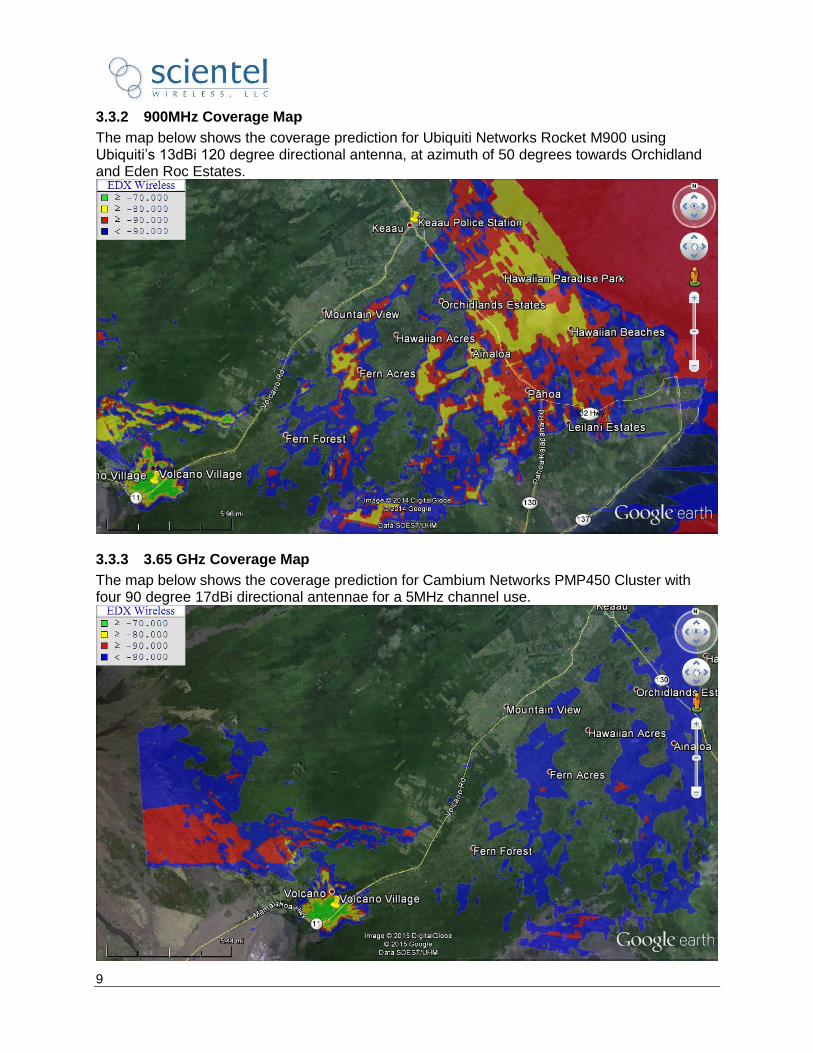
3.3.2 900MHz Coverage Map
The map below shows the coverage prediction for Ubiquiti Networks Rocket M900 using Ubiquiti’s 13dBi 120 degree directional antenna, at azimuth of 50 degrees towards Orchidland and Eden Roc Estates.
3.3.3 3.65 GHz Coverage Map
The map below shows the coverage prediction for Cambium Networks PMP450 Cluster with four 90 degree 17dBi directional antennae for a 5MHz channel use.
10
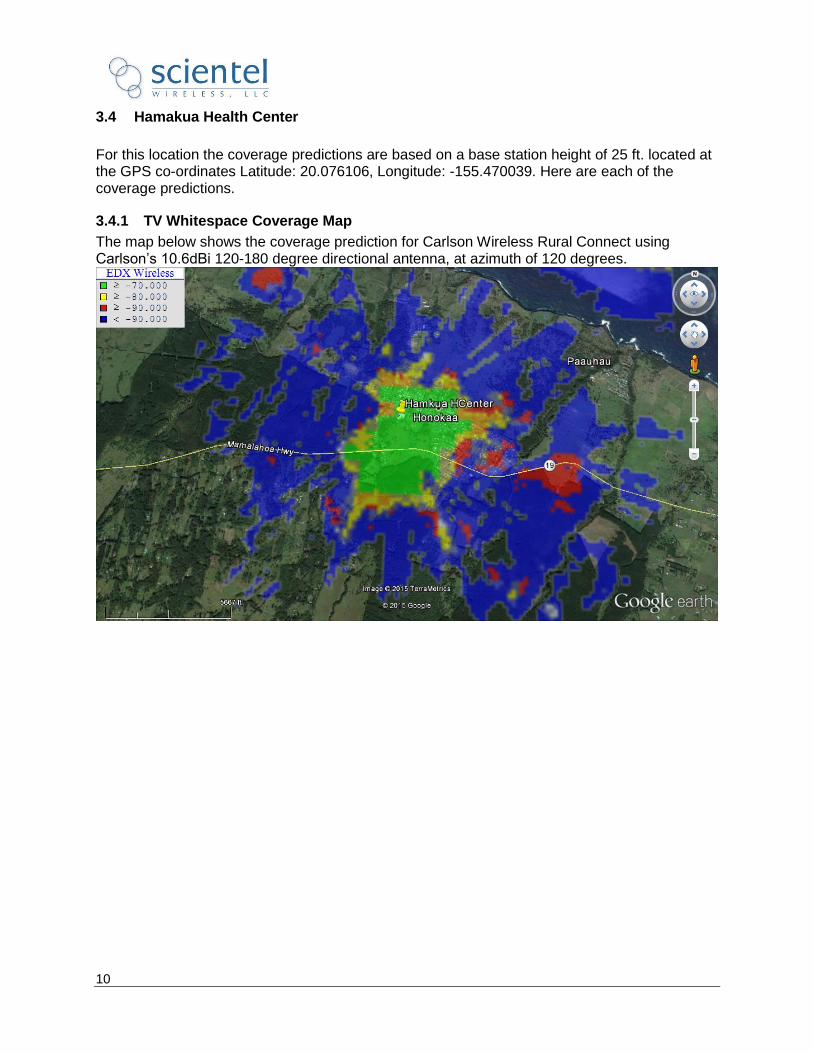
3.4 Hamakua Health Center
For this location the coverage predictions are based on a base station height of 25 ft. located at the GPS co-ordinates Latitude: 20.076106, Longitude: -155.470039. Here are each of the coverage predictions.
3.4.1 TV Whitespace Coverage Map
The map below shows the coverage prediction for Carlson Wireless Rural Connect using Carlson’s 10.6dBi 120-180 degree directional antenna, at azimuth of 120 degrees.
11
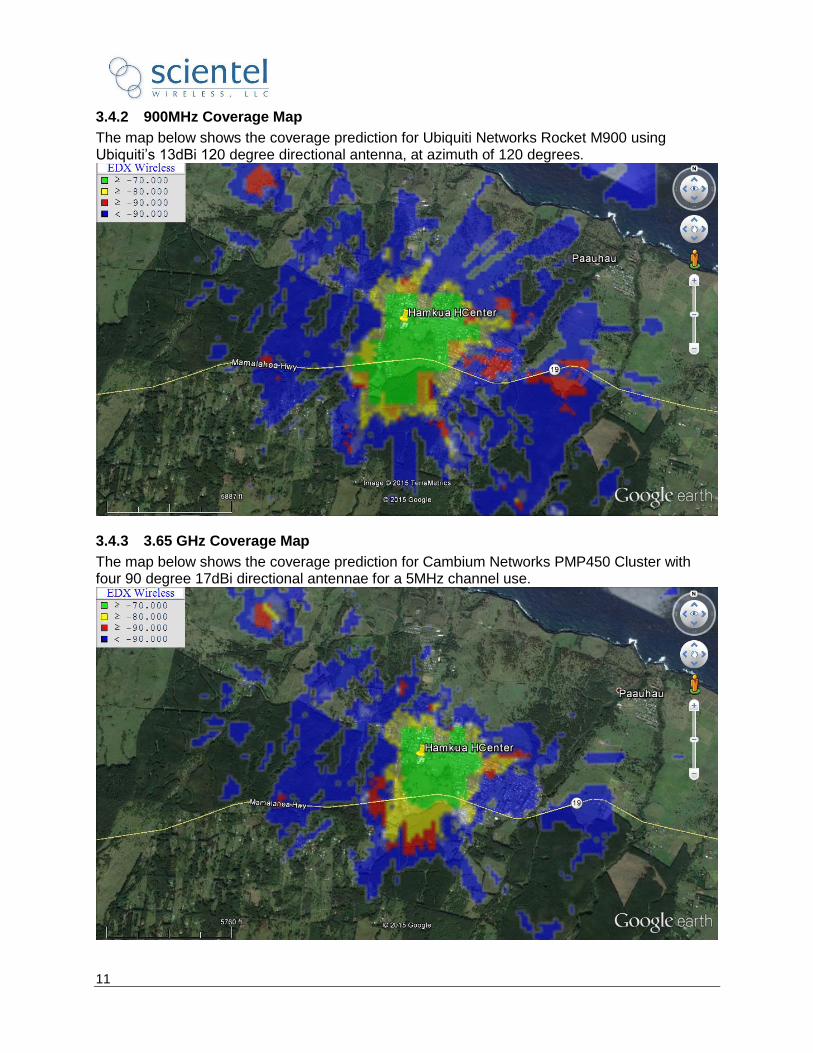
3.4.2 900MHz Coverage Map
The map below shows the coverage prediction for Ubiquiti Networks Rocket M900 using Ubiquiti’s 13dBi 120 degree directional antenna, at azimuth of 120 degrees.
3.4.3 3.65 GHz Coverage Map
The map below shows the coverage prediction for Cambium Networks PMP450 Cluster with four 90 degree 17dBi directional antennae for a 5MHz channel use.
12
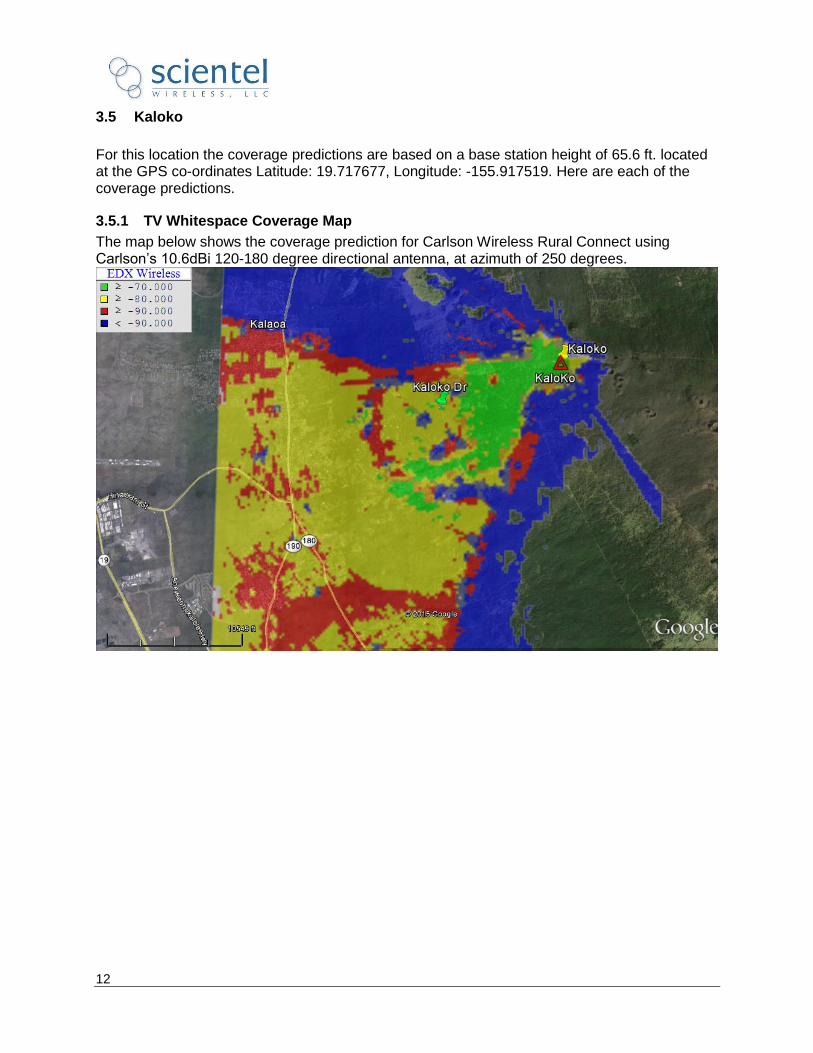
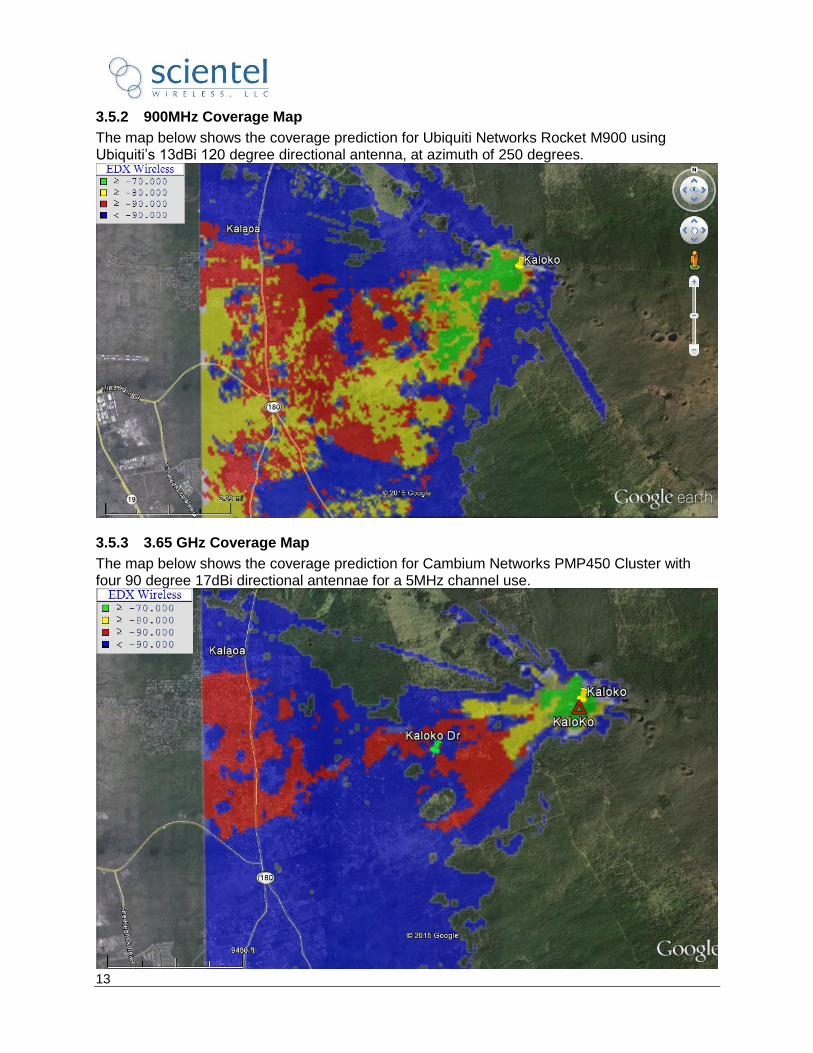
3.5 Kaloko
For this location the coverage predictions are based on a base station height of 65.6 ft. located at the GPS co-ordinates Latitude: 19.717677, Longitude: -155.917519. Here are each of the coverage predictions.
3.5.1 TV Whitespace Coverage Map
The map below shows the coverage prediction for Carlson Wireless Rural Connect using Carlson’s 10.6dBi 120-180 degree directional antenna, at azimuth of 250 degrees.
13
3.5.2 900MHz Coverage Map
The map below shows the coverage prediction for Ubiquiti Networks Rocket M900 using Ubiquiti’s 13dBi 120 degree directional antenna, at azimuth of 250 degrees.
3.5.3 3.65 GHz Coverage Map
The map below shows the coverage prediction for Cambium Networks PMP450 Cluster with four 90 degree 17dBi directional antennae for a 5MHz channel use.
14
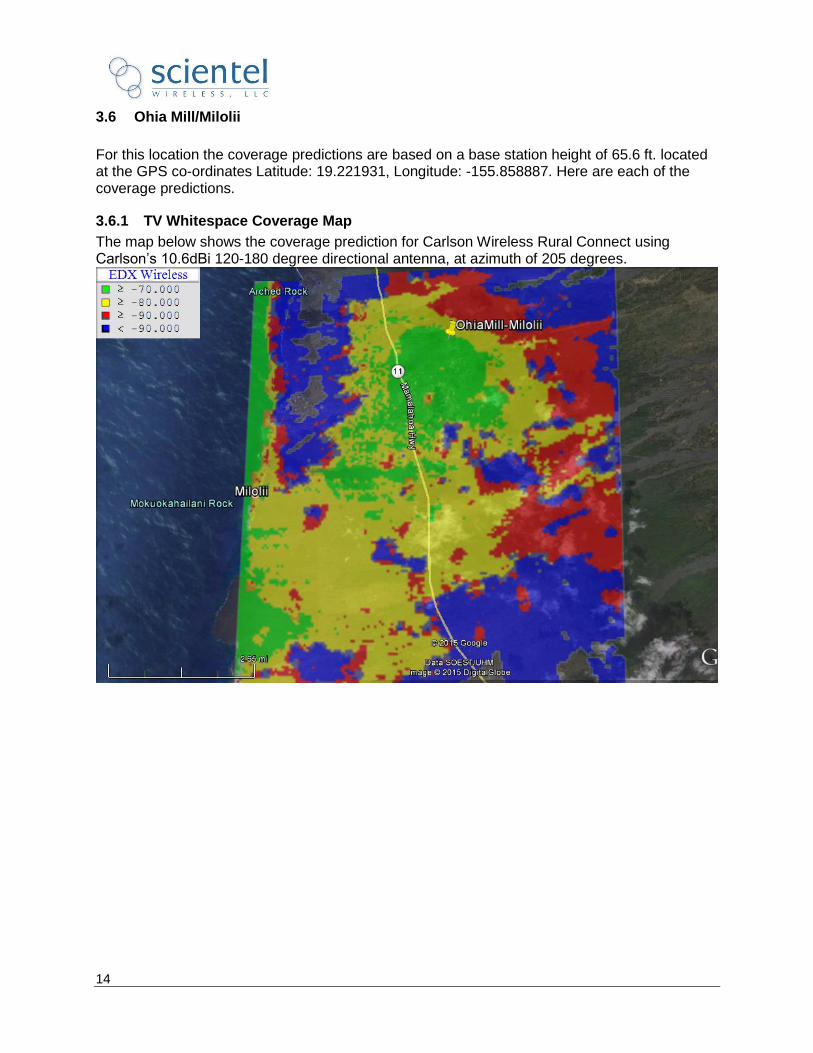
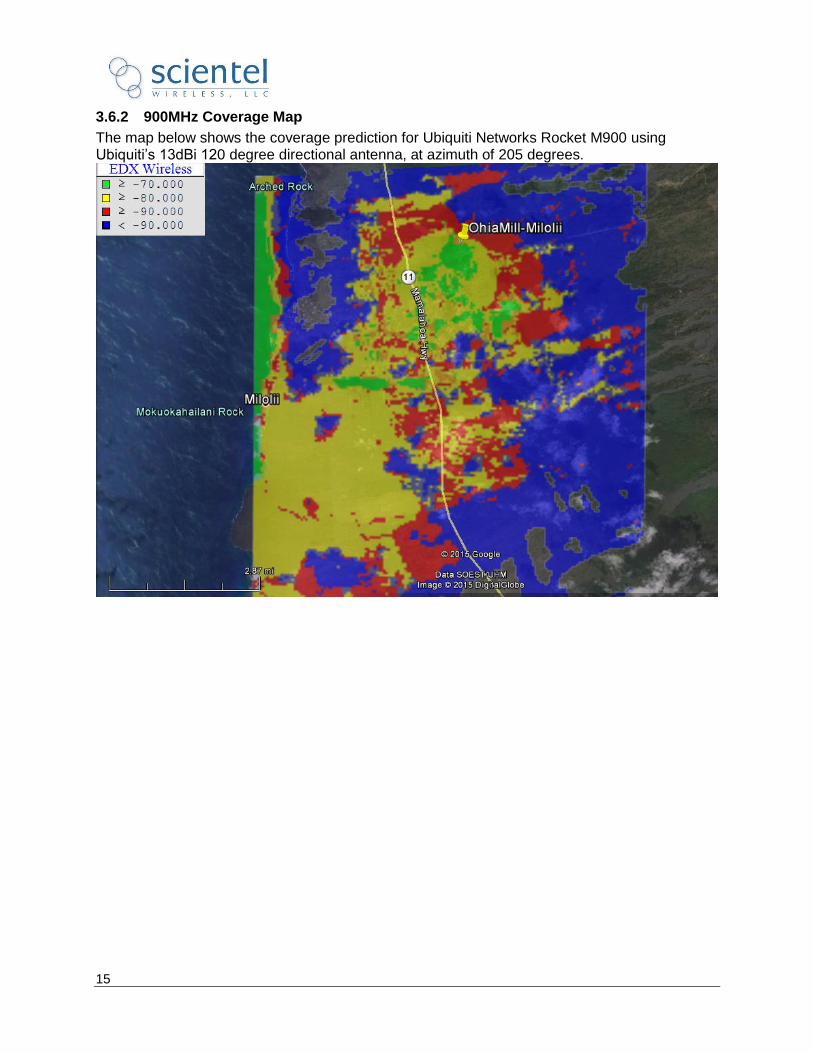
3.6 Ohia Mill/Milolii
For this location the coverage predictions are based on a base station height of 65.6 ft. located at the GPS co-ordinates Latitude: 19.221931, Longitude: -155.858887. Here are each of the coverage predictions.
3.6.1 TV Whitespace Coverage Map
The map below shows the coverage prediction for Carlson Wireless Rural Connect using Carlson’s 10.6dBi 120-180 degree directional antenna, at azimuth of 205 degrees.
15
3.6.2 900MHz Coverage Map
The map below shows the coverage prediction for Ubiquiti Networks Rocket M900 using Ubiquiti’s 13dBi 120 degree directional antenna, at azimuth of 205 degrees.
16
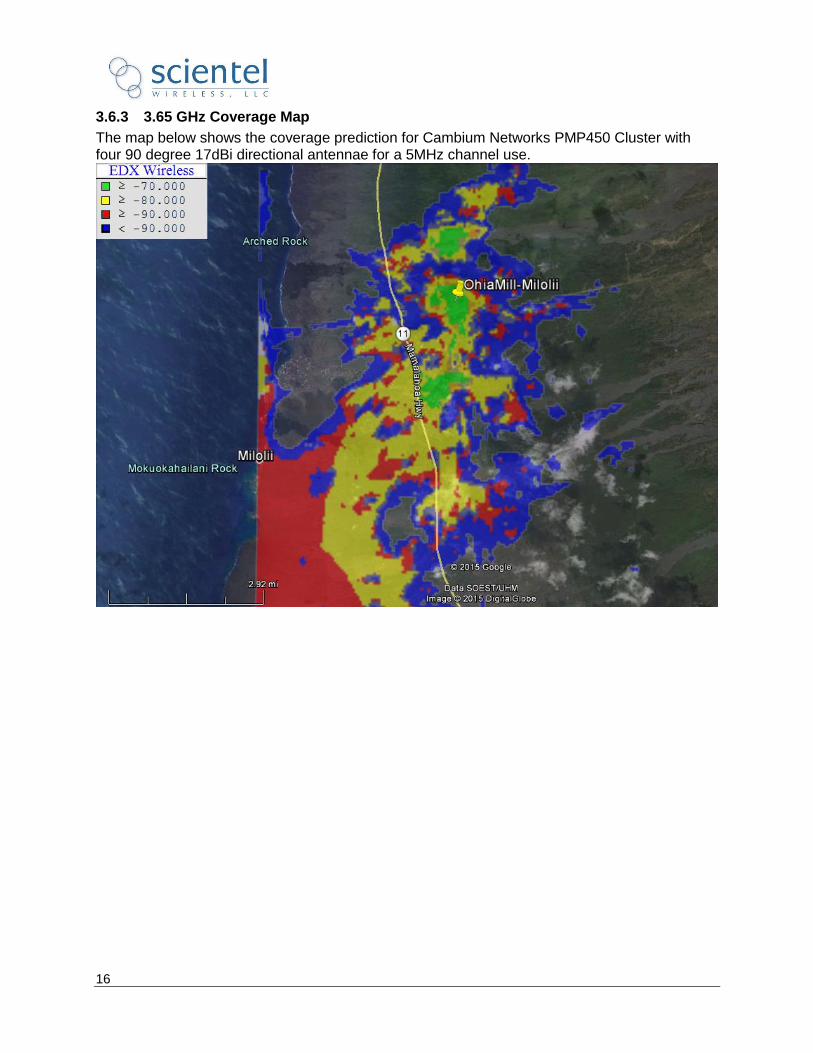
3.6.3 3.65 GHz Coverage Map
The map below shows the coverage prediction for Cambium Networks PMP450 Cluster with four 90 degree 17dBi directional antennae for a 5MHz channel use.
17
3.7 Paauilo
For this location the coverage predictions are based on a base station height of 98.4 ft. located at the GPS co-ordinates Latitude: 20.049225, Longitude: -155.398781. Here are each of the coverage predictions.
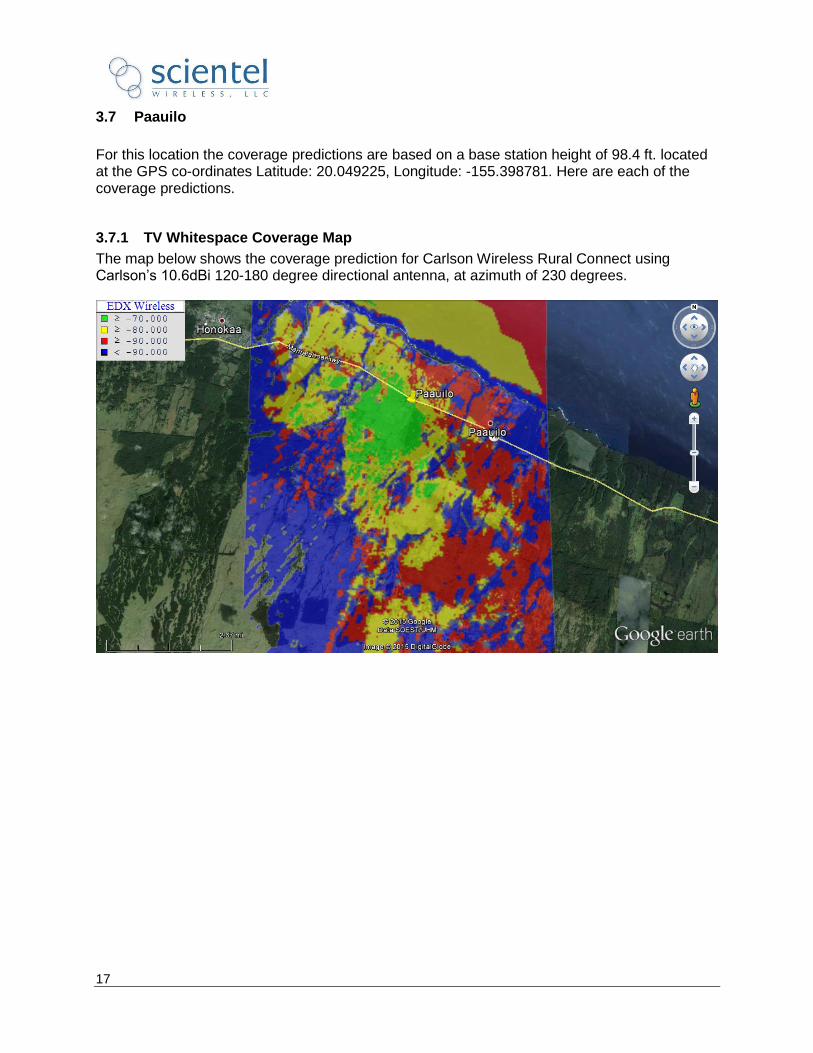
3.7.1 TV Whitespace Coverage Map
The map below shows the coverage prediction for Carlson Wireless Rural Connect using Carlson’s 10.6dBi 120-180 degree directional antenna, at azimuth of 230 degrees.
18
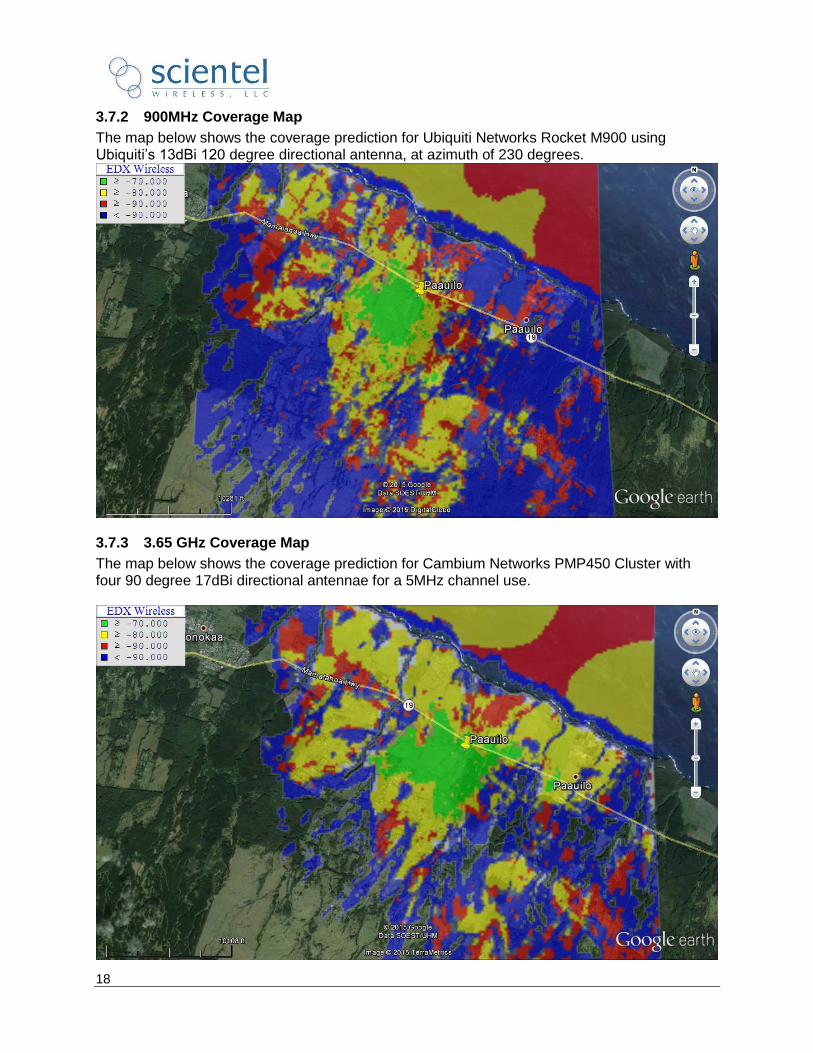
3.7.2 900MHz Coverage Map
The map below shows the coverage prediction for Ubiquiti Networks Rocket M900 using Ubiquiti’s 13dBi 120 degree directional antenna, at azimuth of 230 degrees.
3.7.3 3.65 GHz Coverage Map
The map below shows the coverage prediction for Cambium Networks PMP450 Cluster with four 90 degree 17dBi directional antennae for a 5MHz channel use.
19
3.8 Pahoa
For this location the coverage predictions are based on a base station height of 28 ft. located at the GPS co-ordinates Latitude: 19.412822, Longitude: -154.954738. Here are each of the coverage predictions.
3.8.1 TV Whitespace Coverage Map
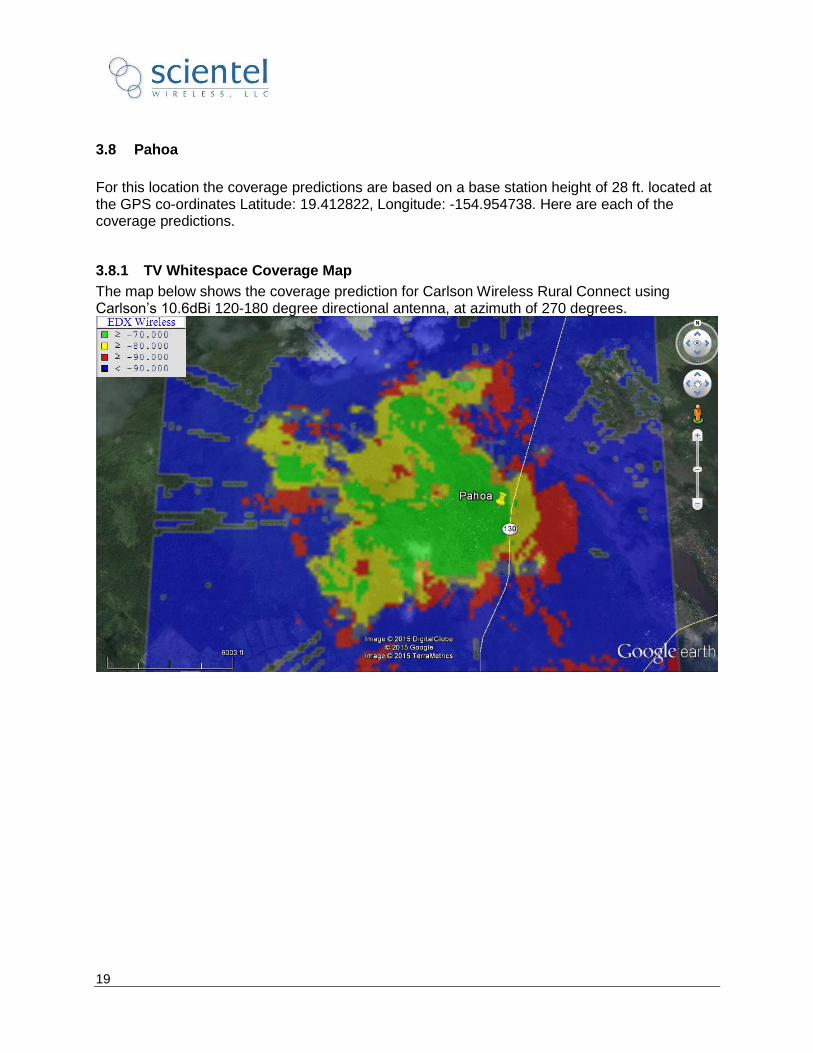
The map below shows the coverage prediction for Carlson Wireless Rural Connect using Carlson’s 10.6dBi 120-180 degree directional antenna, at azimuth of 270 degrees.
20
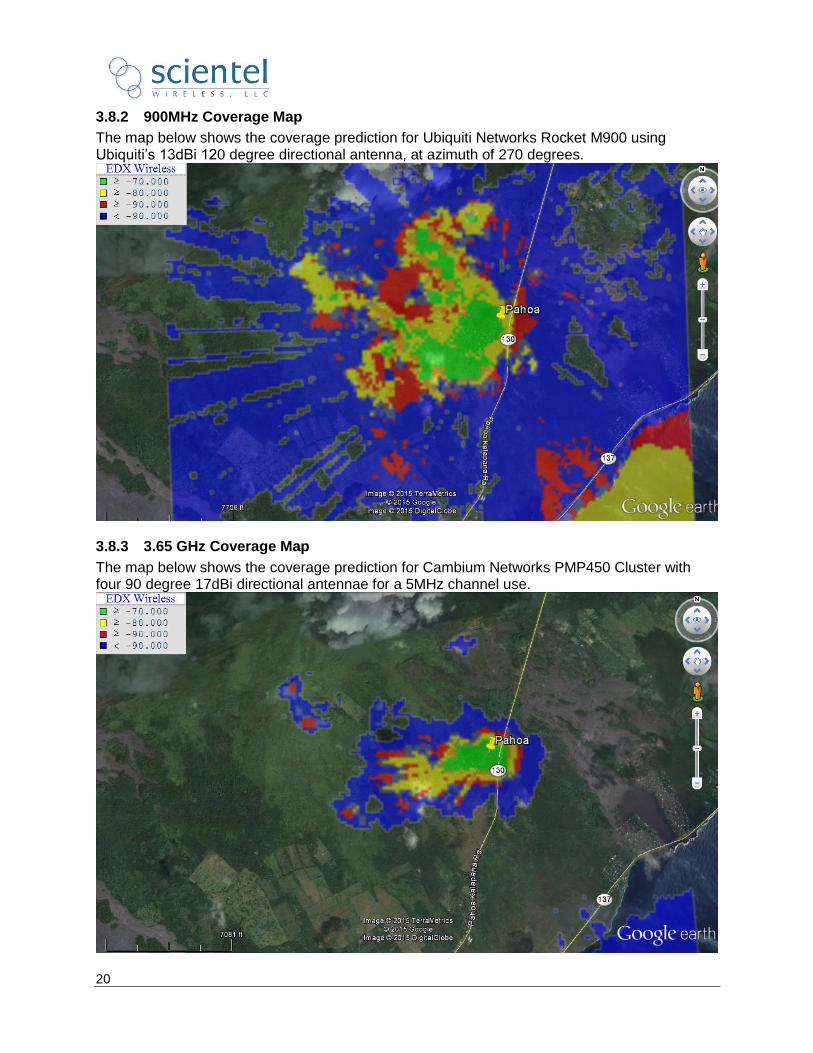
3.8.2 900MHz Coverage Map
The map below shows the coverage prediction for Ubiquiti Networks Rocket M900 using Ubiquiti’s 13dBi 120 degree directional antenna, at azimuth of 270 degrees.
3.8.3 3.65 GHz Coverage Map
The map below shows the coverage prediction for Cambium Networks PMP450 Cluster with four 90 degree 17dBi directional antennae for a 5MHz channel use.
21
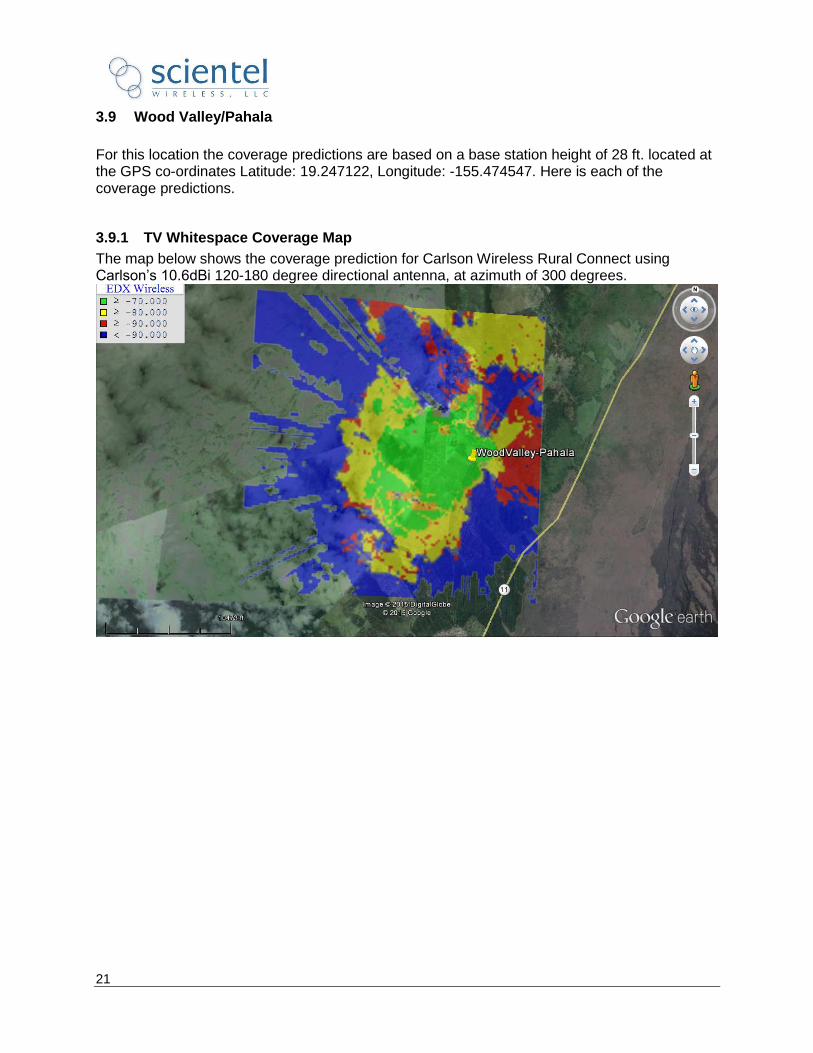
3.9 Wood Valley/Pahala
For this location the coverage predictions are based on a base station height of 28 ft. located at the GPS co-ordinates Latitude: 19.247122, Longitude: -155.474547. Here is each of the coverage predictions.
3.9.1 TV Whitespace Coverage Map
The map below shows the coverage prediction for Carlson Wireless Rural Connect using Carlson’s 10.6dBi 120-180 degree directional antenna, at azimuth of 300 degrees.
22
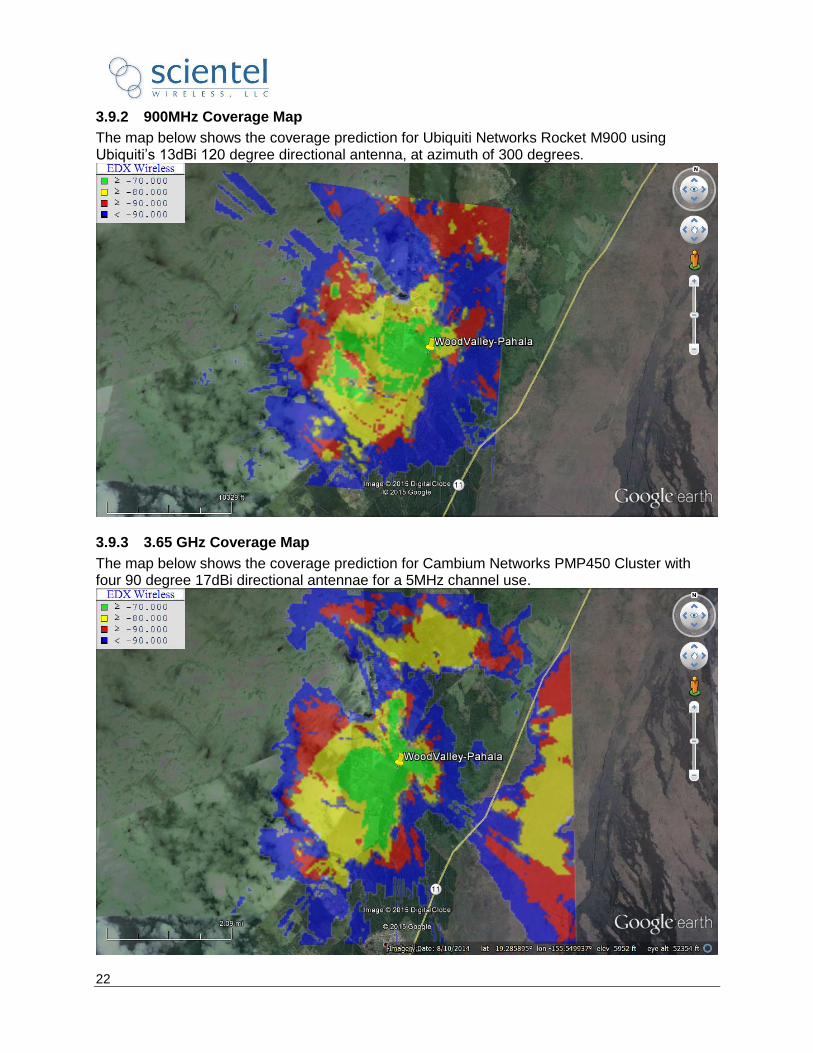
3.9.2 900MHz Coverage Map
The map below shows the coverage prediction for Ubiquiti Networks Rocket M900 using Ubiquiti’s 13dBi 120 degree directional antenna, at azimuth of 300 degrees.
3.9.3 3.65 GHz Coverage Map
The map below shows the coverage prediction for Cambium Networks PMP450 Cluster with four 90 degree 17dBi directional antennae for a 5MHz channel use.
23
4. WIRELESS TECHNOLOGY OVERVIEW
4.1 Ubiquiti 900 MHz
4.1.1 Product Overview
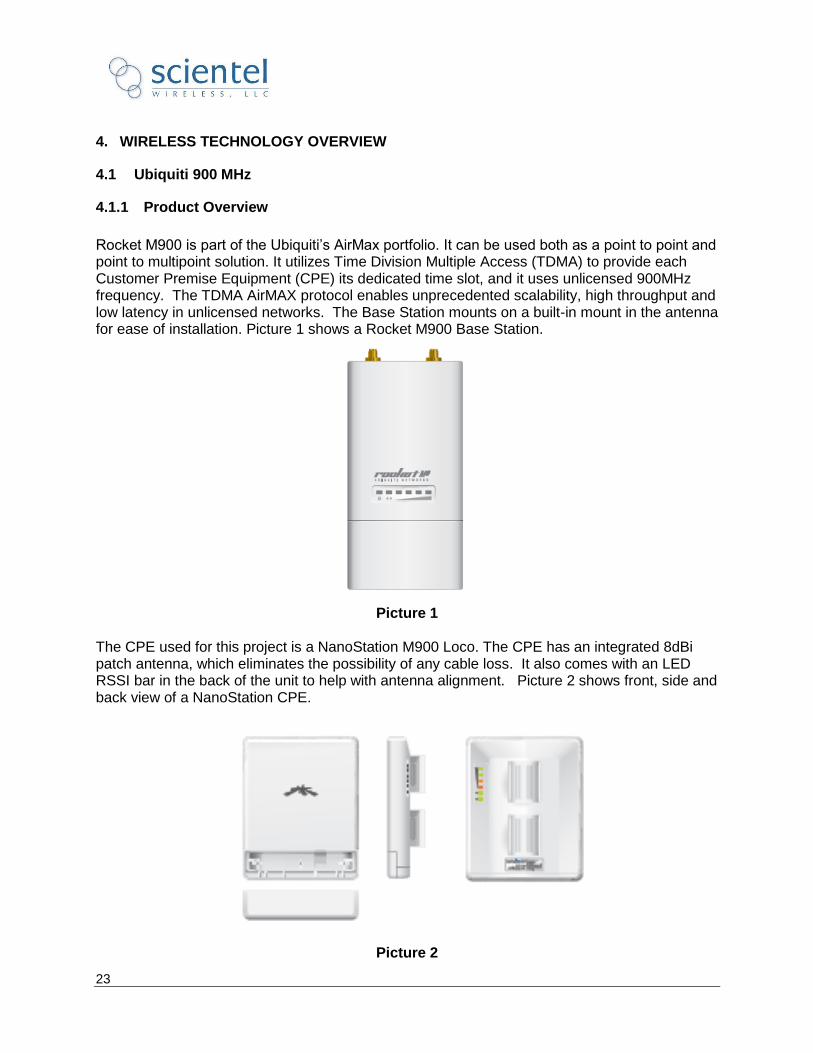
Rocket M900 is part of the Ubiquiti’s AirMax portfolio. It can be used both as a point to point and point to multipoint solution. It utilizes Time Division Multiple Access (TDMA) to provide each Customer Premise Equipment (CPE) its dedicated time slot, and it uses unlicensed 900MHz frequency. The TDMA AirMAX protocol enables unprecedented scalability, high throughput and low latency in unlicensed networks. The Base Station mounts on a built-in mount in the antenna for ease of installation. Picture 1 shows a Rocket M900 Base Station.
Picture 1
The CPE used for this project is a NanoStation M900 Loco. The CPE has an integrated 8dBi patch antenna, which eliminates the possibility of any cable loss. It also comes with an LED RSSI bar in the back of the unit to help with antenna alignment. Picture 2 shows front, side and back view of a NanoStation CPE.
Picture 2
24
Once powered up, the CPE actively scans the available channels and displays a list of all of available Base Stations along with their respective Received Signal Strength Indicator (RSSI) levels. The System User can select the Base Station with best RSSI and connect to it. CPE connects to customer’s laptop or PC via Ethernet cable and Ubiquiti’s Power over Ethernet (PoE) injector.
4.1.2 Advantages
User has flexibility of using a 3MHz or 5MHz or 8MHz or 10MHz or 20MHz wide channel
of operation
Supports 2X2 Multiple Input and Multiple Output (MIMO). MIMO increases the Radio
Frequency (RF) link robustness in harsh environments and increases overall throughput.
Supports modulations up to 64 QAM (Quadrature Amplitude Modulation)
Supports Adaptive Modulation, where if the User sets to “Auto” mode, each CPE will
dynamically select the optimal modulation scheme based on the RF link quality.
Separate Graphical User Interface (GUI) for both AP and CPE
Flexibility to program the radio output power and IP address for both the Base Station
and CPE from GUI. User has the option of selecting either Static or DHCP IP address
scheme. If User selects Static, User has to provide an IP address for the device. If User
selects DHCP, then device will look for DHCP server to assign a dynamic IP address
Base Station and CPE GUI has Inbuilt Spectrum Analyzer, which can be used to identify
cleaner frequency channels
GUI has statistical reporting capabilities on various performance metrics such as uptime,
signal levels, data rates, packet errors, etc.
Supports 10/100BaseT Ethernet Interface
CPE has integrated antenna, hence eliminating any coaxial cable losses
Supports basic Wi-Fi Multimedia (WMM) Quality of Service (QoS) to prioritize voice and
video traffic over other traffic
4.1.3 Key Technology (T) or Product (P) Limitations
(T) Utilizes unlicensed 900MHz, which could increase susceptibility to external
interference.
(T) Increased free space path loss at 900MHz as compared to TVWS systems which
operate at lower frequencies.
(T) Only 26MHz of total spectrum available
(P) There is no provision for Global Positioning System synchronization between
collocated base stations
Refer to Appendix A for engineering test results using this product and technology.
4.2 Carlson RuralConnect TV Whitespace
4.2.1 Product Overview
Carlson’s RuralConnect system operates in TV Whitespace frequencies (470MHz to 698MHz in US). TV White Spaces (TVWS) frequencies are made available for unlicensed use at locations
25
where the spectrum is not being used by licensed services, such as television broadcasting. In order to utilize this unlicensed spectrum band, TV Band Devices (TVBD) must communicate via the Internet with a Spectrum Management Database (SMDB) to obtain a list of allowable channels and ensure incumbent users are protected. Carlson’s system checks the connection to SMDB every hour and pulls a new list of allowable channels on daily basis. A SMDB, in this case Spectrum Bridge, provides the radio with a list of available channels based on Base Station’s location information entered during initial product configuration and registration. The available channels may vary, depending on TVBD device type and location. The Carlson base station consists of a base station controller, a base station radio, and an antenna. The Carlson base station requires constant connectivity to the internet as part of FCC requirements for unlicensed operation. Picture 3 shows the Carlson Base Station.
Picture 3 The CPE consists of a radio connected to an antenna. The CPE connects to the Customer’s laptop or PC via Ethernet cable and Carlson’s Power over Ethernet injector. The CPE connects to its antenna via a RG-6 coaxial cable. It is recommended that the distances between the Base Station/CPE Radio and their respective antennas should be kept at a minimum, in order to achieve minimal loss of RF energy over the coaxial cable. Picture 4 shows a Carlson RuralConnect CPE.
Picture 4
26
4.2.2 Advantages
RuralConnect operates in a clean channel designated by a Spectrum Management
Database in an otherwise licensed spectrum, so there is very little likelihood of external
interference
Free space path loss for TVWS frequencies is lowest, because it operates in the lowest
frequency band as compared to 900MHz and 3.65MHz frequencies. This also results in
a better propagation in the same terrain as compared to 900MHz and 3.65GHz systems.
Wider Spectrum (220MHz) available as compared to 26MHz in 900 MHz and 50MHz in
3.65GHz
Base Station GUI reports signal level and Signal to Noise Ratio (SNR) for different
registered CPEs
Supports 10/100BaseT Ethernet Interface
4.2.3 Key Technology (T) or Product (P) Limitations
(T) Does not provide flexibility of user-selectable channel size. Channel bandwidth is
fixed at 6MHz wide
(P) No MIMO capabilities
(P) Supports modulations only up to 16QAM and no “Auto” mode. User must select one
scheme for each CPE at time of installation
(P) Adaptive modulation feature doesn’t work in the current firmware so the User must
select a static modulation for CPE’s based on the signal level and Signal to Noise Ratio
(SNR)
(P) There is no GUI for CPEs, everything has to be done via Base Station GUI
(P) User cannot adjust the transmit power in the field via the Base Station GUI
(P) A Dynamic Host Configuration Protocol (DHCP) server is required for the Base
Station to pull a dynamic IP address. The only way to assign a static IP address is by
contacting Carlson Technical Support
(P) CPE does not have an integrated antenna, so there is possibility of losses from the
coaxial cable connecting CPE to antenna
(P) Does not support any kind of QoS
(P) All troubleshooting must be done remotely by Carlson Technicians directly
connected to the radios
(P) All logs are encoded with proprietary software and need to be decoded by a Carlson
Wireless Technician.
Refer to Appendix A for engineering test results using this product and technology.
4.3 Cambium 3.65 GHz
4.3.1 Product Overview
The Cambium 3.65 GHz PMP450 operates in the licensed spectrum and supports an Effective Isotropic Radiated Power (EIRP) of 36dBm in US for 5MHz channel size. A typical Cambium Point to Multipoint (PMP) solution comprises of 1 to 6 Access Points equipped with 60/90degree antennas, a cluster management module (CMM) to provide GPS synchronization, and a Subscriber Module (SM) at the remote end. The Cambium PMP450 can support up to 125Mbps
27
per Access Point (AP). The AP takes power over Ethernet from Cambium’s power injector and has a 10/100/1000baseT Ethernet interface. Picture 5 shows a Cambium PMP450 Access Point.
Picture 5
An Access Point can work in a standalone mode or synchronized mode if there are other APs collocated. In standalone mode there is no requirement for a CMM, as the AP provides a synchronization pulse to all of the associated SMs. In synchronized mode there are multiple APs collocated and a CMM provides a GPS sync pulse to each of the APs. Having a CMM at every cluster (usually 4 to 6 APs) to cover 360 degrees helps mitigate any self-interference and also makes it possible to re-use the same channel for collocated APs pointing in opposite directions, hence using fewer channels.
Picture 6
Every AP is assigned a frequency channel and a color code which is used as a unique identifier. An AP and SM use TDD (Time Division Duplex) to communicate on the same frequency channel. Each SM is allotted its own time slot to communicate with the AP. Cambium PMP450 SM (Picture 6) has an 8dbi integrated patch antenna and requires Power over Ethernet (PoE) using Cambium’s PoE Injector. The antenna on the SM is integrated, hence there is no cable loss. Once the SM is powered it scans through the pre-selected frequencies for the band of
28
operation and registers to the AP with a matching color code. After a SM is registered with an Access Point it transmits and receives during its allocated transmit and receive slots. A Cambium Subscriber Module is connected to customer PC/Laptop via Ethernet cable and Cambium’s PoE injector.
4.3.2 Advantages
User has flexibility of selecting a 5MHz or 10MHz or 20MHz wide channel size.
Supports 2X2 MIMO. MIMO increases the Radio Frequency (RF) link robustness in
harsh environments and increases overall throughput.
Supports modulations up to 256QAM
Supports Adaptive Modulation where AP and SM automatically adjust modulation being
used for communication based on the RF link quality
Separate GUI for both AP and SM
Flexibility to program the radio output power for APs and IP address (for both AP and
SM) from GUI. User has the option of selecting either Static or DHCP IP address
scheme. If User selects Static, User has to provide an IP address for the device. If User
selects DHCP, then device will look for DHCP server to assign a dynamic IP address
GUI for AP and GUI for SM have an Inbuilt Spectrum Analyzer, which can be used to
identify cleaner frequency channels
GUI has statistical reporting capabilities on various performance metrics such as uptime,
signal levels, SNR, Channel Bandwidth, Channel Frequency, etc.
Supports 10/100/1000 BaseT Ethernet Interface
Utilizes GPS Synchronization to avoid self-interference and enable efficient use of
frequency spectrum via frequency reuse
SM has integrated antenna, hence eliminating any coaxial cable losses
Supports Diffserv Quality of Service (QOS). It is a standard for prioritizing the traffic on
the network; for example, voice and video traffic should have higher priority as compared
to regular data traffic
4.3.3 Key Technology (T) or Product (P) Limitations
(T) 3.65GHz has highest free space path loss as compared to 900MHz and TVWS
which operate at lower frequencies.
(T) Only 50MHz of total spectrum available
29
5. APPENDIX A: ENGINEERING TEST REPORT FOR WIRELESS SYSTEM TESTS CONDUCTED ON JANUARY 15-16, 2015.
5.1 Test Report Executive Summary
This Engineering Test Report contains data collected by Scientel Wireless during the Engineering Tests conducted on Hawaii Island on January 15 (Day 1) and January 16 (Day 2), 2015. The tests were conducted at the County of Hawaii’s West Hawaii Civic Center.
5.2 Purpose of the Rural Communications Engineering Test Report
The purpose of this Engineering Test Report is to test and document the performance of the two technologies (whitespace and 900MHz) chosen for this pilot system in the engineering test environment located on Hawaii Island.
5.3 Wireless Technology Link Overview
5.3.1 900 MHz Links
Description: The following Ubiquiti 900MHz 2x2 AirMax MIMO BaseStation were tested as part of the DCCA’s Rural and Under Served (RUS) system.
Basestation Site
Test Location Frequency
(MHz)
Southwest corner of
Building A
19 40’ 23.21”N, 156 0’ 13.61” W
Channel 4/7 Freq: 907MHz/917MHz
5.3.2 TV Whitespace Links
Description: The following Carlson Wireless Time Division Duplex (TDD) Whitespace Rural Connect Base Station will be tested as part of the DCCA’s RUS system.
Base Station Site
Test Location Frequency
(MHz)
Southwest corner of
Building A
19 40’ 23.21”N, 156 0’ 13.61” W
503 MHz
30
5.4 Measurement Equipment
5.4.1 Measurement Equipment Record
The following table has the record of measurement equipment used to conduct the tests in this report.
Throughput Tester JDSU HST3000 Bit Error Rate Tester JDSU HST3000
Internet Test Site speedtest.charter.com
5.5 Wireless Technology Link ATP Tests
5.5.1 Test Methodology
Tests will be completed by attaching a piece of test equipment to the base station, and then connecting a second piece of test equipment to the CPE. This will allow for an accurate and isolated test of the technology link.
31
5.5.2 Test Locations
CPE Test Locations Selected
Location Latitude Longitude Approximate Distance from BaseStation
Parking Lot 19°40'23.99"N 156° 0'16.37"W .06mi
CPE Location 1 19°40’21.38”N 156° 0’24.49”W .20mi
CPE Location 2 19°40’18.04”N 156° 0’43.38”W .55mi
CPE Location 3 19°40’10.37”N 156° 1’13.14”W 1.12mi
CPE Location 4 19°40’ 27.83”N 155° 59’ 53.22”W .38mi
CPE Location 5 19°40’ 24.09”N 156° 0’ 0.24”W .24mi
32
5.5.3 900 MHz Technology Tests
5.5.3.1 List of Equipment Tested
All equipment for the test is listed below. Unit model numbers, serial numbers, and firmware version are documented in the respective tables. These tables detail the information regarding the major assemblies delivered.
900 MHz Radio Base Station Information
Model Number Serial Number Firmware Version
NanoStation Rocket M900 6872510E60C0 XM v5.5.8
900 MHz Radio CPE Information
Location Model Number Serial Number Firmware Version
Parking Lot NanoStation Loco M900 6872510EFFF8 XM v5.5.8
CPE Location 1 NanoStation Loco M900 6872510EFFF8 XM v5.5.8
CPE Location 2 NanoStation Loco M900 6872510EFFF8 XM v5.5.8
CPE Location 3 NanoStation Loco M900 6872510EFFF8 XM v5.5.8
CPE Location 4 NanoStation Loco M900 6872510EFFF8 XM v5.5.8
CPE Location 5 NanoStation Loco M900 6872510EFFF8 XM v5.5.8
5.5.3.2 RF Signal Level
The purpose of these tests is to verify the 900 MHz link’s RF characteristics. The Receive Signal Level (RSL) value and Signal Quality were recorded from the 900MHz GUI and supplemental data was taken by the Customer with a Spectrum Analyzer (SA), Anritsu MS2711D Portable Unit.
CPE Location RSSI Value Off GUI Supplemental RSSI Measured by Customer
SA LOS Type
Parking Lot(1)
-28db, -37db, -45db, -
41db -30db, -37db, -45db, -41db Full
CPE Location 1 -45db -45db Near
CPE Location 2 -69db NA(2)
Non
CPE Location 3 -52db -45db Full
CPE Location 4 -77db NA(2)
Non
CPE Location 5 -34db NA(2)
Full (1)
RSSI value updated per test scenario with power changes/modulation changes (2)
Did not do testing at these locations the 2nd
day
33
5.5.3.3 RFC 2544 Test Results
Step 1: Connect the test equipment to the base station, and to the CPE. Step 2: Run RFC 2544 test between the two pieces of test equipment.
CPE Location Downlink
Throughput (Mbps) Uplink
Throughput (Mbps)
Avg. Jitter Peak Latency
Parking Lot 2.98 Mbps 2.98 Mbps 5.54 ms 69.93 ms
CPE Location 1 2.04 Mbps 2.04 Mbps 6.36 ms 835.14 ms
CPE Location 2 1.01 Mbps 1.01 Mbps 15.01 ms 83.87 ms
CPE Location 3 3.02 Mbps 3.02 Mbps 4.6 ms 141.55 ms
CPE Location 4 NA(1)
NA(1)
NA(1)
NA(1)
CPE Location 5 4.84 Mbps 4.84 Mbps 4.46 ms 1320.39 ms
Note: All test results were recorded using a 1518byte packet size (1)
Unable to maintain a stable enough connection at this location to complete test
34
5.5.4 Whitespace Technology Tests
5.5.4.1 List of Equipment Tested
All equipment for the test is listed below. Unit model numbers, serial numbers, and firmware version are documented in the respective tables. These tables detail the information regarding the major assemblies delivered.
Whitespace Base Station Information
Model Number Serial Number Firmware Version
OPA-RC2-B5 58877513-f1ad-4186-b790-2fc514c1b6a4
Built on 15 Nov 2014 at 01:17
Whitespace CPE Information
Location Model Number Serial Number Firmware Version
Parking Lot OPA-RC2-CPE f45d7c65-2c4f-4cc7-
98e5-badf157a677f Built on 15 Nov 2014 at 01:17
CPE Location 1 OPA-RC2-CPE f45d7c65-2c4f-4cc7-
98e5-badf157a677f Built on 15 Nov 2014 at 01:17
CPE Location 2 OPA-RC2-CPE f45d7c65-2c4f-4cc7-
98e5-badf157a677f Built on 15 Nov 2014 at 01:17
CPE Location 3 OPA-RC2-CPE f45d7c65-2c4f-4cc7-
98e5-badf157a677f Built on 15 Nov 2014 at 01:17
CPE Location 4 OPA-RC2-CPE f45d7c65-2c4f-4cc7-
98e5-badf157a677f Built on 15 Nov 2014 at 01:17
CPE Location 5 OPA-RC2-CPE f45d7c65-2c4f-4cc7-
98e5-badf157a677f Built on 15 Nov 2014 at 01:17
5.5.4.2 RF Signal Level
The purpose of these tests is to verify the TV Whitespace link’s RF characteristics. The RSL value and Signal Quality were recorded from the TV Whitespace GUI.
CPE Location RSSI Value Off GUI Line of Sight (LOS) Type
Parking Lot NA(1)
Full
CPE Location 1 NA(1)
Near
CPE Location 2 NA(1)
Non
CPE Location 3 NA(1)
Full
CPE Location 4 NA(1)
Non
CPE Location 5 NA(1)
Full (1)
Unable to log into the CPEs to view the Receive Signal Strength Indicator (RSSI) value during testing.
35
5.5.4.3 RFC 2544 Test Results
Step 1: Connect the test equipment to the base station, and to the CPE. Step 2: Run RFC 2544 test between the two pieces of test equipment.
CPE Location Downlink
Throughput (Mbps) Uplink
Throughput (Mbps)
Jitter Latency
CPE Location 1 NA(1) NA
(1) NA(1) NA
(1)
CPE Location 2 NA(1) NA
(1) NA(1) NA
(1)
CPE Location 3 NA(1) NA
(1) NA(1) NA
(1)
CPE Location 4 NA(1) NA
(1) NA(1) NA
(1)
CPE Location 5 NA(1) NA
(1) NA(1) NA
(1)
(1) Unable to perform RFC 2544 tests since the multicast messaging required by the JDSU test sets was
unable to pass through the RF link on the Carlson Wireless equipment.
36
5.6 End User Experience Testing
All tests were performed using speedtest.charter.com. Note that for all tests, only one location, with only one CPE, is communicating to the base station at a time. Iperf is a test application that measures downlink throughput of the link between a laptop connected to the Access Point Radio and a laptop connected to the CPE (CPE). For the TVWS equipment, bandwidth is fixed at 6MHz and the modulation scheme for each CPE must be selected by the user. For the 900 MHz equipment, bandwidth options ranged from 5 MHz to 20 MHz and the modulation scheme for each CPE can be selected by the user or set to “Auto”.
CPE Location Technology Test
# Downlink
Throughput (Mbps)
Uplink Throughput
(Mbps)
Latency Jitter
PC direct to Customer’s Internet feed at the Base Station Location
NA
Day 1
1 6.55 Mbps 0.76 Mbps 90 ms 11 ms
2 6.55 Mbps 0.79 Mbps 92 ms 11 ms
3
6.55 Mbps 0.79 Mbps 90 ms 10 ms
37
CPE Location Technology Test
#
Downlink Throughput
(Mbps)
Uplink Throughput
(Mbps)
Latency Jitter
CPE Location -- Parking Lot
(Full LOS)
900 MHz (Auto @ 8MHz
bandwidth)
Day 2
1 4.47 Mbps .77 Mbps 96 ms 16 ms
2 4.53 Mbps .80 Mbps 92 ms 29 ms
Avg. 4.50 0.79 94 23
Iperf 12.5 Mbps Downlink Throughput
900 MHz (Auto @ 20MHz
bandwidth)
Day 2
1 4.23 Mbps 0.79 Mbps 93 ms 4 ms
2 4.86 Mbps 0.79 Mbps 91 ms 8 ms
3 4.67 Mbps 0.77 Mbps 92 ms 5 ms
Avg. 4.59 0.78 92 6
Iperf 10 Mbps Downlink Throughput
900 MHz (16QAM @
8MHz bandwidth)
Day 2
1 5.93 Mbps 0.77 Mbps 98 ms 5 ms
2 4.7 Mbps 0.82 Mbps 91 ms 5 ms
3 6.19 Mbps 0.79 Mbps 92 ms 14 ms
Avg. 5.61 0.79 94 8
Iperf 6.8 Mbps Downlink Throughput
TVWS (16QAM @
6MHz bandwidth)
Day 2
1 5.12 Mbps 0.74 Mbps 200 ms 9 ms
2 5.15 Mbps 0.75 Mbps 199 ms 17 ms
3 4.16 Mbps 0.76 Mbps 199 ms 20 ms
Avg. 4.81 0.75 199 15
38
CPE Location Technology Test
# Downlink
Throughput (Mbps)
Uplink Throughput
(Mbps)
Latency Jitter
CPE Location 1
(Near-LOS)
900 MHz (Auto @ 8MHz
bandwidth)
Day 1
1 4.04 Mbps 0.77 Mbps 107 ms 18 ms
2 4.2 Mbps 0.78 Mbps 102 ms 32 ms
3 4.32 Mbps 0.78 Mbps 102 ms 39 ms
Avg. 4.19 0.78 104 30
900 MHz (Auto @ 8MHz
bandwidth)
Day 2
1 4.29 Mbps .78 Mbps 92 ms 9 ms
2 5.61 Mbps .70 Mbps 92 ms 7ms
3 4.36 Mbps .78 Mbps 95 ms 8ms
Avg. 4.75 .75 93 8
900 MHz (16QAM @
8MHz bandwidth)
Day 2
1 3.48 Mbps .79 Mbps 93 ms 14 ms
2 4.03 Mbps .79 Mbps 96 ms 7 ms
3 4.37 Mbps .77 Mbps 93 ms 9 ms
Avg. 3.96 .78 94 10
TVWS (16QAM @
6MHz bandwidth)
Day 1
1 5.17 Mbps 0.77 Mbps 199 ms 7 ms
2 3.86 Mbps 0.73 Mbps 199 ms 14 ms
3 6.24 Mbps 0.75 Mbps 199 ms 14 ms
Avg. 5.09 0.75 199 12
TVWS (16QAM @
6MHz bandwidth)
Day 2
1 5.94 Mbps 0.77 Mbps 198 ms 6 ms
2 6.23 Mbps 0.75 Mbps 198 ms 9 ms
3 5.51 Mbps 0.77 Mbps 199 ms 7 ms
Avg. 5.89 0.76 198 7
39
CPE Location Technology Test
# Downlink
Throughput (Mbps)
Uplink Throughput
(Mbps)
Latency Jitter
CPE Location 2
(Non-LOS)
900 MHz (Auto @ 8MHz
bandwidth)
Day 1
1 2.34 Mbps 0.78 Mbps 116 ms 14 ms
2 2.59 Mbps 0.76 Mbps 102 ms 29 ms
3 2.18 Mbps 0.79 Mbps 117 Ms 18 ms
Avg. 2.37 0.78 112 20
TVWS (16QAM1/2,
16QAM, QPSK @
6MHz bandwidth)
Days 1,2
1 NA* NA* NA* NA*
2 NA* NA* NA* NA*
3 NA* NA* NA* NA*
Avg.
NA* NA* NA* NA*
TVWS (BPSK1/2 @ 6MHz
bandwidth)
Day 1
1 0.78 Mbps 0.73 Mbps 200 ms 29 ms
2 0.84 Mbps 0.68 Mbps 200 ms 18 ms
3 0.8 Mbps 0.7 Mbps 223 ms 23 ms
Avg. 0.81 0.70 208 23
TVWS (BPSK @
6MHz bandwidth)
Day 2
1 1.59 Mbps 0.72 Mbps 200 ms 19 ms
2 1.41 Mbps 0.74 Mbps 197 ms 20 ms
3 1.62 Mbps 0.74 Mbps 198 ms 41 ms
Avg. 1.54 0.73 198 27
TVWS (QPSK1/2@
6MHz bandwidth)
Day 2
1 2.20 Mbps 0.75 Mbps 196 ms 9 ms
2 2.19 Mbps 0.77 Mbps 198 ms 6 ms
3 2.29 Mbps 0.76 Mbps 198 ms 6 ms
Avg. 2.23 0.76 197 7
( * ) – For these modulation settings, the TVWS CPE could not connect to the Internet via the Base Station.
40
CPE Location Technology Test
# Downlink
Throughput (Mbps)
Uplink Throughput
(Mbps)
Latency Jitter
CPE Location 3
(Full LOS)
900 MHz (Auto @ 8MHz
bandwidth)
Day 1
1 4.79 Mbps 0.77 Mbps 102 ms 32 ms
2 4.52 Mbps 0.77 Mbps 96 ms 27 ms
3 4.22 Mbps 0.77 Mbps 96 ms 20 ms
Avg. 4.51 0.77 98 26
900 MHz Auto @ 8MHz
bandwidth)
Day 2
1 5.37 Mbps 0.78 Mbps 95 ms 12 ms
2 5.88 Mbps 0.76 Mbps 94 ms 16 ms
3 4.57 Mbps 0.80 Mbps 92 ms 10 ms
Avg. 5.27 0.78 94 13
Iperf 4.0 Mbps Downlink Throughput
900 MHz (16QAM @
8MHz bandwidth)
Day 2
1 4.71 Mbps 0.79 Mbps 94 ms 16 ms
2 5.29 Mbps 0.77 Mbps 101 ms 16 ms
3 5.27 Mbps 0.76 Mbps 98 ms 11 ms
Avg. 5.09 0.77 98 14
Iperf 1.7 Mbps Downlink Throughput
TVWS (16QAM @
6MHz bandwidth)
Day 1
1 3.78 Mbps 0.74 Mbps 199 ms 24 ms
2 2.91 Mbps 0.77 Mbps 199 ms 6 ms
3 2.21 Mbps 0.73 Mbps 198 ms
did not measure
Avg. 2.97 0.75 198 15
TVWS (16QAM @
6MHz bandwidth)
Day 2
1 4.83 Mbps 0.77 Mbps 199 ms 4 ms
2 5.07 Mbps 0.78 Mbps 200 ms 8 ms
3 5.18 Mbps 0.76 Mbps 199 ms 17 ms
Avg. 5.03 0.77 199 9
41
CPE Location Technology Test
# Downlink
Throughput (Mbps)
Uplink Throughput
(Mbps)
Latency Jitter
CPE Location 4
(Non-LOS)
900 MHz (Auto @ 8MHz
bandwidth)
Day 1
1 0.71 Mbps 0.69 Mbps 107 ms
did not measure
2 0.82 Mbps 0.73 Mbps 112 ms 38 ms
3 0.81 Mbps 0.73 Mbps 106 ms 26 ms
Avg. 0.78 0.72 108 32
TVWS (16QAM @
6MHz bandwidth)
Day 1
1 NA* NA* NA* NA*
2 NA* NA* NA* NA*
3 NA* NA* NA* NA*
Avg. NA* NA* NA* NA*
TVWS (BPSK1/2 @ 6MHz
bandwidth)
Day 1
1 0.83 Mbps 0.73 Mbps 196 ms 24 ms
2 0.82 Mbps 0.72 Mbps 199 ms 31 ms
3 0.85 Mbps 0.73 Mbps 200 ms 19 ms
Avg. 0.83 0.73 198 25
TVWS (16QAM1/2
@ 6MHz bandwidth)
Day 2
1 4.64 Mbps 0.76 Mbps 198 ms 1 ms
2 4.62 Mbps 0.75 Mbps 198 ms 4 ms
3 4.67 Mbps 0.71 Mbps 200 ms 22 ms
Avg. 4.64 0.74 199 9
TVWS (16QAM3/4
@ 6MHz bandwidth)
Day 2
1 3.20 Mbps 0.72 Mbps 198 ms 17 ms
2 1.83 Mbps 0.76 Mbps 198 ms 40 ms
3 .63 Mbps 0.44 Mbps 199 ms 73 ms
Avg. 1.89 0.64 198 43
TVWS (QPSK @
6MHz bandwidth)
Day 2
1 4.63 Mbps 0.73 Mbps 199 ms 1 ms
2 3.89 Mbps 0.74 Mbps 200 ms 17 ms
3 3.87 Mbps 0.75 Mbps 199 ms 6 ms
4 4.24 Mbps 0.76 Mbps 199 ms 1 ms
Avg. 4.16 0.75 199 6
( * ) – For these modulation settings, the TVWS CPE could not connect to the Internet via the Base Station.
42
CPE Location Technology Test # Downlink
Throughput (Mbps)
Uplink Throughput
(Mbps) Latency Jitter
CPE Location 5 (Full LOS)
900 MHz (Auto @ 8MHz
bandwidth) Day 1
1 5.84 Mbps 0.78 Mbps 94 ms 21 ms
2 5.52 Mbps 0.71 Mbps 106 ms 13 ms
3 5.49 Mbps 0.76 Mbps 101 ms 5 ms
Avg. 5.62 0.75 100 13
TVWS (16QAM @
6MHz bandwidth)
Day 1
1 3.4 Mbps 0.74 Mbps 198 ms 11 ms
2 2.17 Mbps 0.76 Mbps 200 ms 1 ms
3 1.74 Mbps 0.77 Mbps 198 ms 6 ms
4 3.86 Mbps 0.76 Mbps 196 ms 15 ms
5 3.33 Mbps 0.77 Mbps 200 ms 17 ms
6 2.84 Mbps 0.77 Mbps 197 ms 6 ms
7 4.47 Mbps 0.74 Mbps 200 ms 12 ms
Avg. 3.12 0.76 198 10
TVWS (16QAM @
6MHz bandwidth)
Day 2
1 6.43 Mbps 0.74 Mbps 199 ms 7 ms
2 5.40 Mbps 0.75 Mbps 198 ms 1 ms
3 6.07 Mbps 0.76 Mbps 200 ms 1 ms
Avg. 5.97 0.75 199 3
TVWS (16QAM1/2
@ 6MHz bandwidth)
Day 2
1 4.67 Mbps 0.77 Mbps 198 ms 10 ms
2 4.51 Mbps 0.78 Mbps 199 ms 12 ms
3 4.67 Mbps 0.76 Mbps 199 ms 6 ms
Avg. 4.62 0.77 199 9