Embed Size (px)
Citation preview

Rural Lands Issues Paper:
FARM HOLDINGS AND LAND USE
CGRC Rural Lands Strategy
FARM HOLDINGS AND LAND USE
Finalised October 2018
This report was prepared by Michael Ryan (Riverina Agriconsultants)
supported by Daris Olsauskas (In2Planning)
© Cootamundra-Gundagai Regional Council

Contents
FARM HOLDINGS AND LAND USE ......................................................................................................... 1
1. Executive Summary ....................................................................................................................... 1
2. Introduction .................................................................................................................................. 2
3. Land Use ........................................................................................................................................ 5
4. Value and Type of Agricultural Commodities Produced ............................................................... 8
5. Land Capability ............................................................................................................................ 11
6. Soils ............................................................................................................................................. 14
7. Rainfall ........................................................................................................................................ 16
8. Landholdings ............................................................................................................................... 17
9. References .................................................................................................................................. 23
Figure 1: CGRC LGA ........................................................................................................................... 2
Figure 2 Land Use ............................................................................................................................. 7
Figure 3: Land Capability ................................................................................................................. 11
Figure 4: Prime Agricultural Land .................................................................................................... 13
Figure 5: Soil Types .......................................................................................................................... 14
Figure 6: Average Annual Rainfall .................................................................................................... 16
Figure 7: Landholdings ..................................................................................................................... 17
Figure 8: Landholdings by size ......................................................................................................... 19
Table 1: Area by Rural Zone (ha) ...................................................................................................... 5
Table 2: Land Use ............................................................................................................................. 5
Table 3: Livestock Production .......................................................................................................... 8
Table 4: Crop Production .................................................................................................................. 9
Table 5: Land Capability ................................................................................................................. 12
Table 6: Soil Types .......................................................................................................................... 15
Table 7: RU1 Zone Landholdings Analysis ...................................................................................... 20
Graph 1: Proportion of Landholdings size by number RU1 ............................................................. 21
Graph 2: Proportion of Landholdings by Area RU1 ......................................................................... 21

CGRC Farm Holdings and Rural Land Use Issues Paper 1
1. Executive Summary Just over 96% of the Cootamundra-Gundagai Regional Council Local Government Area (LGA) is zoned
rural, the majority of which is zoned RU1 Primary Production. Cropping including wheat, canola and
hay (at 40%) and pastures for cattle and sheep (at 50%) comprise the majority of the land use. About
4% of the rural land is zoned RU3 Forestry. Intensive land use comprises less than 0.5% of the land
use.
The value of agricultural commodities produced in the LGA in 2011 was $103M, 60% of which was
livestock products with the balance from cropping.
The topography, soils and rainfall vary across the LGA. Land capability is correlated to these
biophysical resources.
Landholdings across the LGA do not exhibit any clear spatial patterns. On land zoned RU1 there are
1,165 holdings with an average size of 304ha.

CGRC Farm Holdings and Rural Land Use Issues Paper 2
2. Introduction Cootamundra-Gundagai Regional Council is the merged local government area of former
Cootamundra and Gundagai Shires. The two towns of Cootamundra and Gundagai are the main
population centres with a number of villages and rural communities also serving as residential
options. All of these residential areas have strong existing and historical connections to the
surrounding rural lands and the architecture and wealth of the towns in particular are directly
attributable to the agricultural industry.
The total land area is 398,141.7 hectares, home to 11,141 people (ABS, 2016). Agriculture, Forestry
and Fishing is the largest employment industry, employing 15.3% of employed persons.
Manufacturing (which includes agricultural value add industries) is a close second, employing 10.6%
of employed persons (Census Time Series Profile, 2011).
In 2011 the combined value of agricultural commodities produced from the Cootamundra-Gundagai
Regional Council Local Government Area was $103 million, however this figure does not capture
other agricultural outputs such as agritourism, local markets, events and so on.
Figure 1: CGRC LGA

CGRC Farm Holdings and Rural Land Use Issues Paper 3
Rural Lands Strategy Background
The merger of Gundagai Shire Council and Cootamundra Shire Council as Cootamundra-Gundagai
Regional Council has stimulated the need for new planning instruments and policies; in particular a
Local Environment Plan and Development Control Plan which cover the regional council area. A
strategy to deal specifically with the rural lands of CGRC is proposed which aims to analyse
agricultural trends and opportunities for the area. This strategy will help to update mapping for the
new Local Environmental Plan while also providing rationale and reasoning for zoning and minimum
lot sizes in rural areas.
Rural land is often neglected from a planning perspective due to more pressing planning needs in
larger centres, however agricultural land often has a disproportionate impact on residential and
economic activity when compared to development in a town, with intensive feedlots, quarries,
landfills, etc. Furthermore, agricultural activities themselves such as piggeries, vineyards, feedlots
and so on have a long-term impact on the use and viability of the site and surrounding lands. Through
the strategic planning process, controls and principles of development can be placed on agricultural
land to ensure the viability of the land into perpetuity as well as providing opportunities for emerging
and new agricultural enterprises to establish in the area.
The two former shires have varied terrain and soil quality which makes formulating one course of
action or plan for rural land difficult. However, this should be viewed as an opportunity which will
make Cootamundra-Gundagai Regional Council more attractive and marketable to residents, visitors
and prospective residents as a wide variation of agricultural pursuits can be explored in this single
local government area.
It is Council’s intention that the Rural Lands Strategy serves not only as a land use planning document,
but as a plan for economic success and growth through the shared identity of agriculture. This
leverages off what Cootamundra-Gundagai Regional Council does best (agriculture), connections to
logistic hubs and routes as well as capitalising on changing recreation and tourism trends.

CGRC Farm Holdings and Rural Land Use Issues Paper 4
Purpose of the Issues Papers
The Issues Papers are integral to the success of the Rural Lands Strategy as they are background
documents based on research and science; analysing trends elsewhere and juxtaposing this with the
situation within Cootamundra-Gundagai Regional Council.
There are ten Issues Papers which will be produced with the community having shaped not only the
overarching theme of each paper, but also having identified a number of existing constraints and
opportunities to be investigated. Based on the findings of the Issues Papers and workshops during
the “listening” phase, a directions paper will be produced which will list key directions for the Rural
Lands Strategy.
Co
nfi
rmat
ion
Initial Information & Engagement
Sessions
Dat
a G
ath
erin
g
Agricultural Land Mapping
& Issues Papers
List
enin
g
Workshops & Information
SessionsW
her
e W
e're
Go
ing Directions
Paper
Ver
ific
atio
n
Draft Strategy & Exhibition
Act
ion
Rea
dy
Adoption by Council &
State Endorsement
CGRC Farm Holdings and Rural Land Use Issues Paper 5
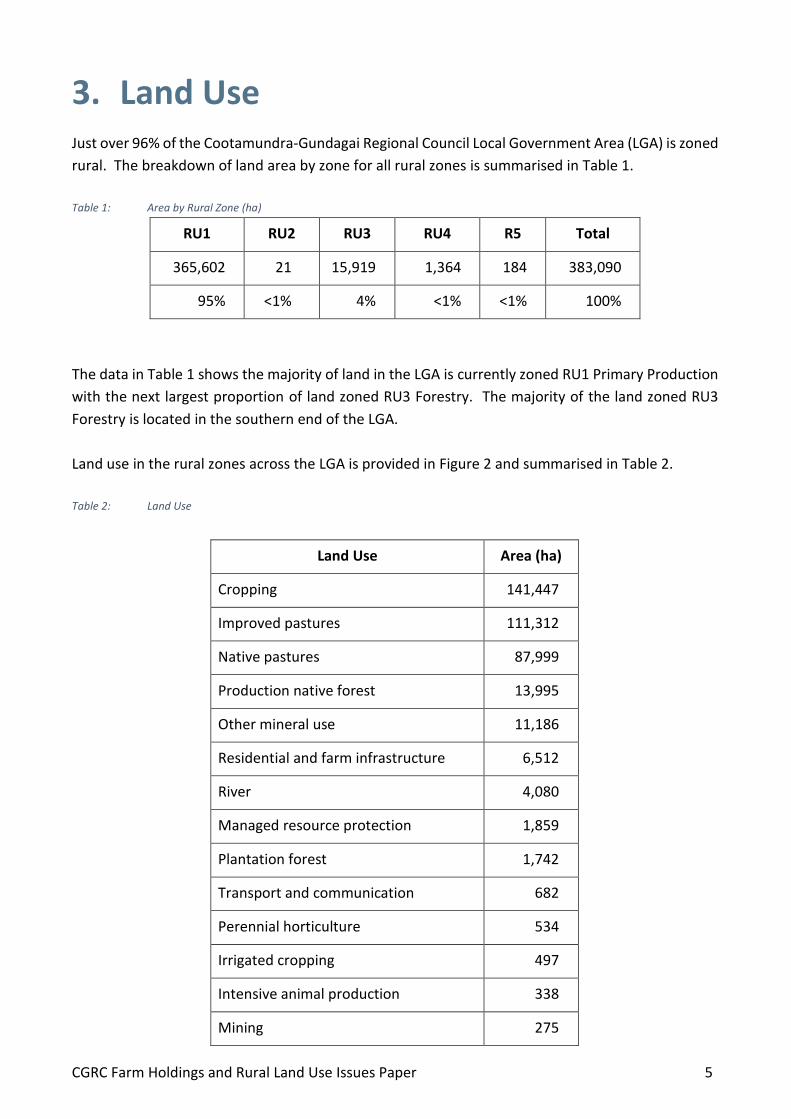
3. Land Use Just over 96% of the Cootamundra-Gundagai Regional Council Local Government Area (LGA) is zoned
rural. The breakdown of land area by zone for all rural zones is summarised in Table 1.
Table 1: Area by Rural Zone (ha)
RU1 RU2 RU3 RU4 R5 Total
365,602 21 15,919 1,364 184 383,090
95% <1% 4% <1% <1% 100%
The data in Table 1 shows the majority of land in the LGA is currently zoned RU1 Primary Production
with the next largest proportion of land zoned RU3 Forestry. The majority of the land zoned RU3
Forestry is located in the southern end of the LGA.
Land use in the rural zones across the LGA is provided in Figure 2 and summarised in Table 2.
Table 2: Land Use
Land Use Area (ha)
Cropping 141,447
Improved pastures 111,312
Native pastures 87,999
Production native forest 13,995
Other mineral use 11,186
Residential and farm infrastructure 6,512
River 4,080
Managed resource protection 1,859
Plantation forest 1,742
Transport and communication 682
Perennial horticulture 534
Irrigated cropping 497
Intensive animal production 338
Mining 275

CGRC Farm Holdings and Rural Land Use Issues Paper 6
Source: http://www.agriculture.gov.au/abares/aclump/land-use/alum-classification
The data in Table 2 and Figure 2 is based on the rural zones depicted in Table 1 only. All other zones
within the LGA are identified in Figure 2 as white. The data in Table 2 and Figure 2 indicates:
▪ Just under 40% of the land is used for cropping, the majority of which is located in the northern
half and south western side of the LGA;
▪ Just over 50% of the land is used for pastures supporting grazing enterprises, the majority found
in the southern portion of the LGA;
▪ Just under 60% of the pastures are improved pastures and the balance are native pastures;
▪ 4% of the LGA is private or plantation forestry;
▪ Intensive land use including irrigation, horticulture and animal feedlots makes up less than 0.5%
of the land use; and
▪ Cropping and pastures make up nearly 90% of the land use depicted in Table 2 and Figure 2. It is
likely areas depicted as cropping would also be used for grazing, and some of the areas depicted
as pastures would also be used for cropping. At a minimum the improved pastures and cropping
area, considered to be arable, is 66% of the area depicted in Table 2 and Figure 2.
Irrigation perennial cropping 181
Reservoir/dam 162
Services 92
Marsh/wetland 76
Intensive horticulture 19
Manufacturing and industrial 15
Seasonal horticulture 6
Waste treatment 4
Nature conservation 3
Utilities 1
Total 383,016

CGRC Farm Holdings and Rural Land Use Issues Paper 7
Figure 2: Land Use
Source: http://www.agriculture.gov.au/abares/aclump/land-use/alum-classification

CGRC Farm Holdings and Rural Land Use Issues Paper 8
4. Value and Type of Agricultural
Commodities Produced According to the Australian Bureau of Statistics (ABS) Agricultural Census, 20111 data, the value of
agricultural commodities produced in the LGA in 2011 was estimated at $103M. This information is
summarised in Table 4 and Table 3.
The value of livestock products, and livestock numbers2 in LGA in 2011 is provided in Table 3.
Table 3: Livestock Production
Crop Value $ No. of Head
Wool 18,127,061
Milk 1,770,557 1,176
Eggs 886,791 17,325
Meat
Sheep 15,910,885 623,389
Beef Cattle 23,475,566 81,579
Poultry 312,943
Pigs 67,747 198
Goats 29,884 1,823
Total $60,581,435
The data in Table 3 indicates:
▪ Livestock products provided just under 60% of the total value of agricultural commodities
produced in the LGA in 2011;
▪ Cattle provided just under 40% of the value of livestock products produced;
▪ Wool provided 30% of the value of livestock products produced;
1 Australian Bureau of Statistics (n.d.), 7503.0 – Value of Agricultural Commodities Produced, Australia 2010-11, 2018, Retrieved from
http://www.abs.gov.au/AUSSTATS/[email protected]/DetailsPage/7503.02010-11?OpenDocument 2 Australian Bureau of Statistics (n.d.), 7121.0 Value of Agricultural Commodities Produced, Australia, 2010-11, 2018, Retrieved from
http://abs.gov.au/AUSSTATS/[email protected]/DetailsPage/7121.02010-11?OpenDocument

CGRC Farm Holdings and Rural Land Use Issues Paper 9
▪ Sheep meat provided just over 25% of the value of commodities produced; and
▪ Milk and eggs provided just under 5% of the value of livestock products produced.
Furthermore, the data in Table 3 was based on the former boundaries of the Cootamundra and
Gundagai LGAs. From this data:
▪ Sheep and pigs are spread relatively evenly between the two former LGA areas;
▪ Nearly 75% of the beef cattle are located in the former Gundagai LGA;
▪ Nearly all dairy cows are located in the former Cootamundra LGA; and
▪ 82% of the poultry and goats are located in the former Cootamundra LGA.
Crop production in the LGA in 2011 based on the ABS agricultural census3 and 4 is provided in Table 4.
Table 4: Crop Production
Crop Value $ Area (ha) Tonnes
Barley 720,087 1,350 3,735
Oats 660,797 2,458 3,325
Triticale 1,394,217 2,935 8,416
Wheat 20,159,737 24,475 30,621
Other cereal 495,407 1,448 2,144
Canola 9,454,133 9,876 19,090
Lupins 999,434 1,366 3,437
Other crops 29,257
Hay 5,316,884 5,336 23,779
Wine grapes 527,909 350 1,738
Fruit and nuts 2,491,280 140 227
Total 42,249,142 49,734
3 Australian Bureau of Statistics (n.d.), 7503.0 – Value of Agricultural Commodities Produced, Australia 2010-11, 2018, Retrieved from
http://www.abs.gov.au/AUSSTATS/[email protected]/DetailsPage/7503.02010-11?OpenDocument 4 Australian Bureau of Statistics (n.d.), Value of Agricultural Commodities Produced, Australia, 2010-11, Catalogue No. 7503.0, Canberra
http://abs.gov.au/AUSSTATS/[email protected]/DetailsPage/7121.02010-11?OpenDocument

CGRC Farm Holdings and Rural Land Use Issues Paper 10
The data in Table 4 indicates:
▪ Crops contributed to just over 40% of the value of commodities produced;
▪ Wheat comprised nearly 50% of the value and area of crops produced;
▪ Canola comprised about 20% of the value and area of crops produced;
▪ The predominant cropping system is winter cereals rotated with oilseeds (canola), legumes
(lupins) and (most likely) pastures;
▪ Hay comprised nearly 15% of the value and 10% of the area of crops produced; and
▪ Wine grapes, fruit and nuts provided just under 10% of the value of crops produced and comprises 1% of the total area in Table 4.
Furthermore, the data in Table 4 was based the former boundaries of the Cootamundra and
Gundagai LGAs. From this data:
▪ About 85% of all crop production is carried out in the former Cootamundra LGA;
▪ Hay and fodder crop areas of production are similar in each former LGA;
▪ Most of the fruit and nut trees are in the former Cootamundra LGA; and
▪ Nearly all the wine grapes are produced in the former Gundagai LGA.

CGRC Farm Holdings and Rural Land Use Issues Paper 11
5. Land Capability Land capability for land zoned rural in the LGA is depicted in Figure 3 and summarised in Table 5.
This data is based on Emery, KA 1988 using a land classification system of Class 1 to Class 8, with
Class 1 being capable of most agricultural land uses and Class 8 being land not suitable for agriculture.
Figure 3: Land Capability
Source: https://data.bioregionalassessments.gov.au/datastore/dataset/08cacd00-81e9-4fec-8a68-c9f047bb13c8

CGRC Farm Holdings and Rural Land Use Issues Paper 12
Table 5: Land Capability
Class Area
(Ha) Suitable for Limitations Land Use Suitability Land Use Examples
Class 1 2,289 Regular cultivation Very slight to
negligible
Suitable for most rural
land use
Horticulture, intensive
cropping & grazing
Class 2 62,846 Regular cultivation Slight but significant Capable of a wide range of
land uses
Intensive cropping, grazing &
forestry
Class 3 53,092 Regular cultivation Moderate Capable of most land uses Cropping, grazing & forestry
Class 4 85,131 Grazing with occasional
cultivation
Moderate to severe Capable of a range of land
uses
Cropping, grazing & forestry
Class 5 30,446 Grazing with occasional
cultivation
Severe Capable of some land uses Grazing & forestry
Class 6 99,369 Grazing with no
cultivation
Very severe Capable of a limited range
of land uses
Grazing & forestry
Class 7 44,748 Other Extremely severe May be suitable for
commercial plantations
Commercial plantations &
biodiversity habitat
Class 8 1,442 Other Extremely severe Non-farming only Cliffs, quarries and billabongs
State Forest 3,563
Total 382,926
The data in Figure 3 and Table 5 indicates:
▪ 31% of rural land in the LGA is classified as Class 1, 2 or 3. This land is suitable for regular
cultivation and can be considered to be prime agricultural land. The majority of this land is
located in the north of the LGA, and along the main waterways in the central and southern
portions of the LGA (refer to Figure 4);
▪ 56% of rural land in the LGA is classified as Class 4, 5 or 6 which is interspersed throughout the
LGA, less so to the north. This land is best suited to grazing with Classes 4 and 5 also suitable for
occasional cropping; and
▪ 13% of the land zoned rural in the LGA is Class 7, 8 or State Forest. There is a correlation between
Class 7 land and local topographic and landscape features including either native vegetation
and/or ridge tops on grazed land.
Prime agricultural land in the LGA is depicted in Figure 4.

CGRC Farm Holdings and Rural Land Use Issues Paper 13
Figure 4: Prime Agricultural Land
There is a distinct correlation between prime agricultural land (Figure 4) and agricultural land use
(Figure 2) with the majority (if not all) of prime agricultural land being used for cropping. It is likely
a significant proportion of farms in the LGA with significant cropping enterprises also have livestock
enterprises, a system known as mixed farming. The correlation between prime agricultural land and
cropping land use indicates cropping is a dominant agricultural land use. Across the LGA it can be
assumed those landscapes suited to cropping are being cropped.

CGRC Farm Holdings and Rural Land Use Issues Paper 14
6. Soils Soil types for land zoned Rural in the LGA are depicted in Figure 5 and summarised in Table 6.
Figure 5: Soil Types
Source: http://www.asris.csiro.au/themes/Atlas.html

CGRC Farm Holdings and Rural Land Use Issues Paper 15
Table 6: Soil Types
Soil Type Area (ha)
Hilly with some steep hilly red soils 119,064
Irregularly stepped, rolling red earths and yellow mottled soils 91,053
Undulating to rolling and hilly red soils and yellow mottled 32,920
Undulating to rolling red earths and red soils 30,104
River terraces and flood plains, dark loamy soils 25,379
Undulating plateau red and yellow earths 22,582
Plains – red soils 18,904
Narrow flood plains and terraces, brown soils 17,070
River flood plains and terraces yellow mottled soils 8,160
Rolling to nearly flat red earths 6,140
Hills and/or undulating ridges, red soils 4,351
Strongly undulating to hilly country, red soils and red earths 3,007
Rolling to steep hilly red soils and yellow mottled soils 1,828
Hilly to mountainous yellow soils red soils shallow grey-brown sandy soils
yellow mottled soils 1,252
Undulating to rolling yellow mottled soils, red and yellow 612
Sugarloaf country generally conical hills of red soils 591
Total 383,017
The data in Figure 5 and Table 6 indicates:
▪ Just over 30% of the rural land in the LGA is hilly to steep hilly red soils;
▪ Just under 25% of the rural land in the LGA is rolling red earths and yellow mottled soils;
▪ Nearly 40% of the land zoned rural in the LGA comprises six soil types each covering between 4%
and 9% of the total land area;
▪ A further eight soil types cover 7% of the land zoned rural in the LGA; and
▪ There is a correlation between soil type (Figure 5), land use (Figure 2) and land capability (Figure
3).
CGRC Farm Holdings and Rural Land Use Issues Paper 16
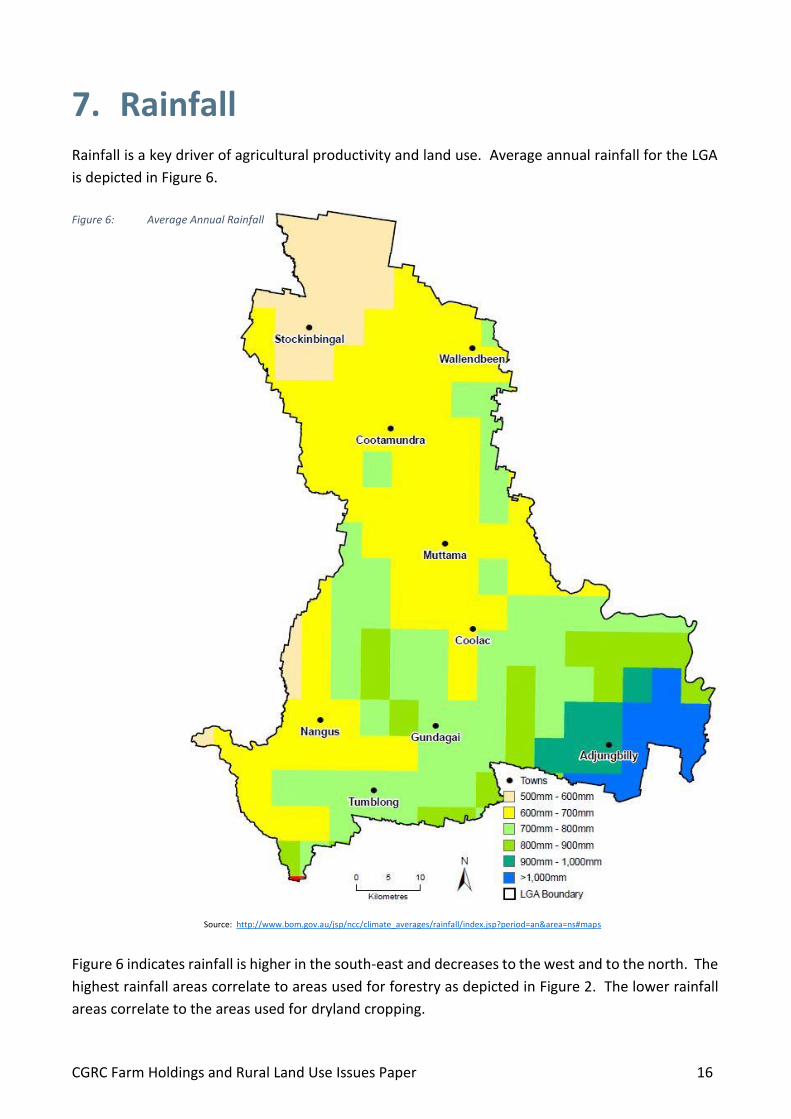
7. Rainfall Rainfall is a key driver of agricultural productivity and land use. Average annual rainfall for the LGA
is depicted in Figure 6.
Figure 6: Average Annual Rainfall
Source: http://www.bom.gov.au/jsp/ncc/climate_averages/rainfall/index.jsp?period=an&area=ns#maps
Figure 6 indicates rainfall is higher in the south-east and decreases to the west and to the north. The
highest rainfall areas correlate to areas used for forestry as depicted in Figure 2. The lower rainfall
areas correlate to the areas used for dryland cropping.

CGRC Farm Holdings and Rural Land Use Issues Paper 17
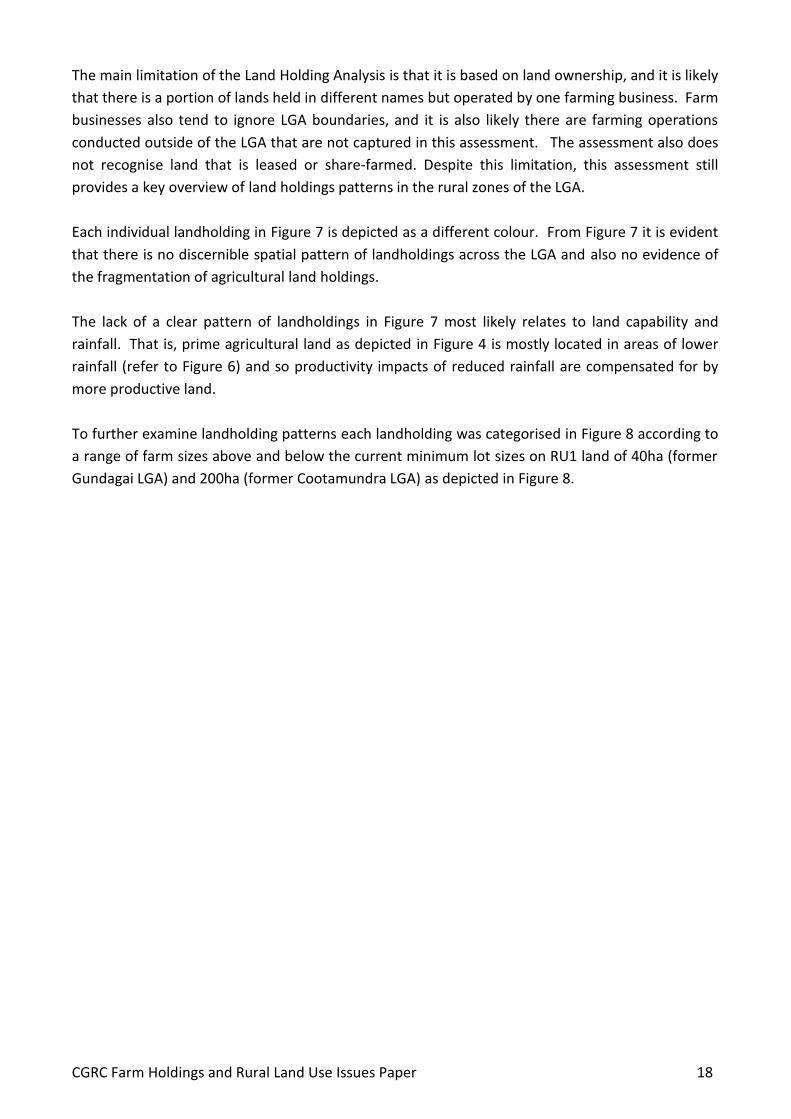
8. Landholdings To identify the spatial distribution of land holdings zoned rural in the LGA, Council’s cadastre
database was interpreted to create a landholdings map in Figure 7. Each landholding in Figure 7 is
depicted as a different colour.
Figure 7: Landholdings
CGRC Farm Holdings and Rural Land Use Issues Paper 18
The main limitation of the Land Holding Analysis is that it is based on land ownership, and it is likely
that there is a portion of lands held in different names but operated by one farming business. Farm
businesses also tend to ignore LGA boundaries, and it is also likely there are farming operations
conducted outside of the LGA that are not captured in this assessment. The assessment also does
not recognise land that is leased or share-farmed. Despite this limitation, this assessment still
provides a key overview of land holdings patterns in the rural zones of the LGA.
Each individual landholding in Figure 7 is depicted as a different colour. From Figure 7 it is evident
that there is no discernible spatial pattern of landholdings across the LGA and also no evidence of
the fragmentation of agricultural land holdings.
The lack of a clear pattern of landholdings in Figure 7 most likely relates to land capability and
rainfall. That is, prime agricultural land as depicted in Figure 4 is mostly located in areas of lower
rainfall (refer to Figure 6) and so productivity impacts of reduced rainfall are compensated for by
more productive land.
To further examine landholding patterns each landholding was categorised in Figure 8 according to
a range of farm sizes above and below the current minimum lot sizes on RU1 land of 40ha (former
Gundagai LGA) and 200ha (former Cootamundra LGA) as depicted in Figure 8.

CGRC Farm Holdings and Rural Land Use Issues Paper 19
Figure 8: Landholdings by size
The data presented in Figure 8 for land zoned RU1 has been summarised in Table 7. All holdings less
than 5ha were assumed to be essentially large lot residential, crown land5 or concessional lots and
excluded from the assessment.
5 Land referred to as Crown Land in this instance may also be land owned by Council, State or Federal Government entity, church or other community groups.

CGRC Farm Holdings and Rural Land Use Issues Paper 20
Table 7: RU1 Zone Landholdings Analysis
Holding Size
(ha)
No. of
Holdings
Proportion
of Holdings Area (ha)
Proportion
of Area
Average
Size (ha)
Median
Size (ha)
5 – 40 404 35% 6,700 2% 17 15
40 – 80 135 12% 7,584 2% 56 52
80 – 200 172 15% 23,242 7% 135 84
200 – 400 171 15% 49,278 14% 228 282
400 – 800 170 15% 94,807 27% 558 545
800 – 1,200 57 5% 56,059 16% 983 963
>1,200 56 5% 116,597 33% 2,082 1,769
Total 1,165 354,268 304 109
Both average and median size for each holding size range is provided to show variance within the
datasets. The average is the total area divided by the number of holdings and tends to be skewed
by larger holdings, hence is usually greater than the median. The median is the mid-point of each
dataset. Once the median is identified half the dataset will be greater than the median and half the
dataset will be less. The median farm size (Figure 8) is 109ha, so 50% of farms are larger than 109ha
and 50% of farms are less than 109ha.
The following conclusions can be made using the data from Table 7:
▪ The average holding size is 304ha and median holding size is 109ha;
▪ There are 1,165 holdings covering an area of 354,268ha which is 97% of the RU1 zone. The
balance of the area is either held in holdings less than 5ha, has incomplete ownership details, or
is Crown Land;
▪ There are 761 holdings larger than 40ha, covering 98% of the area, with an average size of 457ha
and a median size of 264ha;
▪ There are 539 holdings less than 80ha which is 46% of the total holdings covering 4% of the area;
▪ There are 711 holdings less than 200ha which is 61% of the total holdings covering 11% of the
area;
▪ There are 478 holdings ranging from 40ha to 400ha in size covering 23% of the area and with an
average size of 168ha and a median size of 142ha;
▪ There are 283 holdings larger than 400ha covering 75% of the RU1 zone in the LGA, with an
average area of 945ha and a median size of 664ha;

CGRC Farm Holdings and Rural Land Use Issues Paper 21
0%
5%
10%
15%
20%
25%
30%
35%
40%
5-40 40-80 80-200 200-400 400-800 800-1200 >1200
Gundagai Cootamundra
▪ The large number of landholdings less than 80ha indicates that the minimum lot size of 40ha may
result in undesirable impacts on fragmentation of agricultural lands; and
▪ There are 454 holdings larger than 200ha, covering 89% (316,742ha) of the RU1 zone in the LGA
with an average size of 698ha and a median size of 479ha.
It is not possible to ascertain what holding sizes presented in Table 7 are being used for commercial
agriculture or rural living purposes. As the data in Table 7 is based on holdings larger than 5ha it is
likely all holdings presented in Table 7 are being used for some form of agriculture. However, some
assumptions can be made relating landholding size, landownership and available ABS data.
To investigate trends in land ownership between the two former LGAs the proportion of landholdings
by area and number in Table 7 by each of the former LGAs is depicted in Graph 1.
Graph 1: Proportion of Landholdings size by number RU1
The data in Graph 1 indicates there is no significant difference in the number of landholders in each
former LGA for each of the landholding category sizes in Table 7.
Graph 2: Proportion of Landholdings by Area RU1
0%
5%
10%
15%
20%
25%
30%
35%
40%
5-40 40-80 80-200 200-400 400-800 800-1200 >1200
Gundagai Cootamundra

CGRC Farm Holdings and Rural Land Use Issues Paper 22
The data in Graph 2 indicates no difference in the total area of landholdings 200ha or less with the
former Cootamundra LGA having the larger area in landholdings of 200ha to 1,200ha and the former
Gundagai LGA having a larger area of landholdings more than 1,200ha. This pattern most likely
reflects the larger holdings in the former Gundagai LGA and the grazing enterprises located in the
south of the LGA.
The data in Table 7 indicates nearly 90% of the area in the RU1 zone is occupied by holdings 200ha
or larger. The ABS 2011 agricultural census data6 listed the total area of holdings as 306,513ha with
429 holdings at an average size of 714ha. This is similar to the number of holdings larger than 200ha
of 454ha at 316,742ha with an average size of 698ha (refer to Table 7).
Therefore, it can be assumed the commercial farm size is generally larger than 200ha for the
predominant land uses - grazing and cropping - which comprise 90% of the rural land uses (refer to
Table 2).
Figure 2 indicates the majority of the areas used for cropping in the LGA are located in the north,
central and south-west portions of the LGA. The ABS agricultural census data addressed in Section 3
noted the majority of crop production occurs in the former Cootamundra LGA. The cropping system
is a winter cereal system produced in rotation with oilseeds, legumes and pastures. The landholdings
pattern in Figure 8 indicates the majority of enterprises in the cropping areas are 200ha or larger.
The dominant land use in the areas identified as Class 4, 5, 6 and 7 in Figure 3 is grazing. The
landholdings pattern in Figure 8 indicates the majority of grazing enterprises are 200ha or larger.
The existing pattern of landholdings is one indicator of the current size required for commercial
cropping and grazing enterprises which are the predominant forms of agriculture in the LGA (ie on
land areas greater than 200ha).
Industry trends and land ownership patterns are likely to support these assumptions as the current
trend for cropping and grazing farm enterprises is to increase in size and scale to address, but not
limited to, opportunities for diversification, changes in farm management, farm succession planning
as well as responding to changing terms of trade.
Apart from cropping and grazing, for example, intensive farming enterprises such as feedlots, wine
grapes, nuts and fruit have been identified to make up less than 0.5% of total rural land area. It has
been assumed for this analysis that decisions about the location of these enterprises are likely to be
influenced by other factors other than just land size given the average holding size of 714ha based
on ABS data.
6 Australian Bureau of Statistics (n.d.), 7121.0 Value of Agricultural Commodities Produced, Australia, 2010-11, 2018, Retrieved from
http://abs.gov.au/AUSSTATS/[email protected]/DetailsPage/7121.02010-11?OpenDocument

CGRC Farm Holdings and Rural Land Use Issues Paper 23
9. References 7503.0 Value of Agricultural Commodities Produced Australia. 2010-11. (n.d). Retrieved from
http://www.abs.gov.au/AUSSTATS/[email protected]/DetailsPage/7503.02010-11?OpenDocument
7121.0 – Agricultural Commodities, Australia, 2010-11. (n.d). Retrieved from
http://abs.gov.au/AUSSTATS/[email protected]/DetailsPage/7121.02010-11?OpenDocument
Australian Climate Averages – Rainfall (Climatology 1961-1990). (2018). Retrieved from
http://www.bom.gov.au/jsp/ncc/climate_averages/rainfall/index.jsp?period=an&area=ns#maps
A S R I S – Atlas of Australian Soils. Retrieved from
http://www.asris.csiro.au/themes/Atlas.html
Land use management Australian Land Use and Management Classification Version 8 (October
2016). Retrieved from http://www.agriculture.gov.au/abares/aclump/land-use/alum-classification
Emery, K.A. (1988). Land and Soil Mapping of NSW. NSW Land and Water Conservation.
Land and Soil Capability mapping of NSW. Bioregional Assessment Source Dataset, 2013 Retrieved
from
https://data.bioregionalassessments.gov.au/datastore/dataset/08cacd00-81e9-4fec-8a68-
c9f047bb13c8