Embed Size (px)
Citation preview
Demographic Research a free, expedited, online journal of peer-reviewed research and commentary in the population sciences published by the Max Planck Institute for Demographic Research Konrad-Zuse Str. 1, D-18057 Rostock · GERMANY www.demographic-research.org
DEMOGRAPHIC RESEARCH VOLUME 26, ARTICLE 24, PAGES 661-700 PUBLISHED 27 JUNE 2012 http://www.demographic-research.org/Volumes/Vol26/24/ DOI: 10.4054/DemRes.2012.26.24 Research Article
Rural livelihoods and access to natural capital: Differences between migrants and non-migrants in Madagascar
Raphael J. Nawrotzki Lori M. Hunter
Thomas W. Dickinson
This publication is part of the Special Collection on “Spatial Demography”, organized by Guest Editor Stephen A. Matthews. © 2012 Raphael J. Nawrotzki, Lori M. Hunter & Thomas W. Dickinson. This open-access work is published under the terms of the Creative Commons Attribution NonCommercial License 2.0 Germany, which permits use, reproduction & distribution in any medium for non-commercial purposes, provided the original author(s) and source are given credit. See http:// creativecommons.org/licenses/by-nc/2.0/de/

Table of Contents
1 Introduction 662 2 Background 663 2.1 The sustainable livelihoods framework 663 2.2 Migrant/non-migrant differentials in livelihood assets 665 2.2.1 Financial capital 665 2.2.2 Human capital 665 2.2.3 Physical capital 666 2.2.4 Social capital 666 2.3 Natural capital: Our analytical focus 666 3 Methods 668 3.1 Data 668 3.2 Measures 668 3.2.1 Dependent variables 668 3.2.2 Independent variables 672 3.2.3 Control variables 675 3.3 Estimation strategy 675 4 Results 677 4.1 Sample overview and summary statistics 677 4.2 Additive models 678 4.3 Cross-level interactions 682 5 Discussion and conclusions 686 6 Acknowledgments 689 References 690 Appendix 699
Demographic Research: Volume 26, Article 24 Research Article
http://www.demographic-research.org 661
Rural livelihoods and access to natural capital: Differences between migrants and non-migrants in Madagascar
Raphael J. Nawrotzki1
Lori M. Hunter2
Thomas W. Dickinson3
Abstract
BACKGROUND Although natural resources play a central role in rural livelihoods across the globe, little research has explored the relationship between migration and natural capital use, particularly in combination with other livelihood capitals (i.e., human, social, financial, and physical).
OBJECTIVE Grounded in the rural livelihood framework, this paper explores the association between the livelihood capital availability, especially natural capital, for migrants and non-migrants in rural Madagascar. METHODS Data from the 2008/2009 Demographic and Health Survey is used in combination with satellite imagery of vegetation coverage (Normalized Difference Vegetation Index, NDVI) to proxy natural resources. Hierarchical multilevel models allow for inclusion of cross-level interactions between migrant status and proximate natural resources as determinants of the status of livelihood assets. RESULTS Three key findings emerge. First, higher levels of proximate natural resources are associated with greater financial, human, and social capital for both migrants and non-migrants. Second, migrants have, on average, greater financial, physical, human, and
1 Direct all correspondence to Raphael Nawrotzki, Institute of Behavioral Science, CU Population Center, University of Colorado, Boulder, UCB 483, C435B, 4th Floor, 1440 15th Street, Boulder, CO 80302; E-mail: [email protected]. 2 Institute of Behavioral Science, CU Population Center, University of Colorado, Boulder. 3 Institute of Behavioral Science, Computing and Research Services, University of Colorado, Boulder.
Nawrotzki, Hunter & Dickinson: Differences between migrants and non-migrants in Madagascar
http://www.demographic-research.org 662
social capital than non-migrants, and urban-to-rural migrants do exceptionally well in all capital asset categories. Third, migrants residing in areas with higher levels of natural capital tend to have significantly higher levels of human capital (education).
CONCLUSION Although we cannot examine livelihood strategies per se, the results suggest variation in livelihood potential among migrants and non-migrants in rural Madagascar, with migrants tending to have greater capital assets. In addition, access to natural resources is a central livelihood strategy.
1. Introduction
Migration scholars have offered substantial insight into factors that shape migrant well-being, including gender (Abrego 2009), race and ethnicity (Adelman, Tsao, and Tolnay 2006), social networks (Bastia 2007), and employment status (Rabe 2011). Yet although natural resources play a central role in rural livelihoods in many regions across the globe, little research has explored the relationship between migration and the use of natural capital, particularly in combination with the variety of other livelihood capitals (i.e., human, social, financial, and physical).
This paper begins to fill this gap by asking: does access to livelihood capitals, particularly natural capital, differ between migrants and non-migrants in rural regions of Madagascar? We draw conceptually on the “Sustainable Livelihoods” framework (Carney et al. 1999) and, although we do not study livelihood strategies per se, garnering insight into the distribution of various capitals sheds light on livelihood potential. In addition, better understanding of gaps and/or distinctions in capital assets across population groups may be useful in the development of livelihood-enhancing programs. Finally, although substantial research has explored differentials between migrants and non-migrants in origin areas (e.g., Qin 2010) – and the factors that may ‘select’ an individual into migration (e.g., Lindstrom and Ramirez 2010) – far less is known about distinctions between these groups in destination regions. Our paper thus provides a valuable contribution to fill this void.
Madagascar is in many regards typical of nations in sub-Saharan Africa. Poverty is a major issue, in part because of socioeconomic and sociopolitical conditions such as the “lack of local savings, outdated economic and social infrastructure, [and] very unequal and arbitrary application of rules nationwide” (AEO 2007:323). Madagascar’s GDP is comparable to those of many East African countries: on average, the private tertiary sector based on the tourist industry contributes most (49.5%), followed by the
Demographic Research: Volume 26, Article 24
http://www.demographic-research.org 663
primary sector, mainly agricultural production (28.3%). A weak industrial secondary sector (16%) is heavily dependent on coffee and spice exports (AEO 2007). In this socioeconomic climate households struggle daily and draw on strategies such as migration and natural resource extraction to diversify livelihoods (Casse et al. 2004, Cripps 2009).
This article is organized as follows. First, we review the Sustainable Livelihoods framework for conceptual guidance. We then highlight existing literature on migrant/non-migrant differentials in livelihood capital assets – human, financial, physical, and social. A subsequent literature section offers a more detailed review of the role of natural capital in rural livelihoods, particularly as we might anticipate distinctions between migrants and non-migrants. We then discuss our data and methods, and present results. Finally, the conclusion offers overarching statements regarding livelihoods, migration, and natural capital, as well as policy recommendations.
2. Background
2.1 The sustainable livelihoods framework
Rural households often pursue diverse livelihood strategies, including farming, herding, off-farm employment, and the exploitation of natural resources through hunting, fishing, and gathering. The “Sustainable Livelihood” (SL) framework was designed as a conceptual tool to reflect this variety (de Sherbinin et al. 2008). The SL framework, developed and enhanced by a variety of international agencies such as the UK Department for International Development (DFID), CARE, Oxfam, and the United Nations Development Program (UNDP), has been used to guide programs for poverty alleviation (Carney et al. 1999). The framework’s origin can be traced back to the work of Chambers and Conway (1991:6), who explained that a:
livelihood comprises the capabilities, assets (stores, resources, claims and access), and activities required for a means of living: a livelihood is sustainable which can cope with and recover from stress and shocks, maintain or enhance its capabilities and assets, and provide sustainable livelihood opportunities for the next generation; and which contributes net benefits to other livelihoods at the local and global levels and in the long and short term. Central to the framework is the understanding that the relative availability of
various “capital assets” shapes the livelihood options of rural households in developing
Nawrotzki, Hunter & Dickinson: Differences between migrants and non-migrants in Madagascar
http://www.demographic-research.org 664
countries. These assets include financial, physical, human, social, and natural capital as outlined below (Carney et al. 1999).
• Financial capital represents the financial resources available to individuals and households (e.g., savings, supplies of credit, regular remittances or pensions) that provide opportunity for the pursuit of different livelihood options.
• Physical capital represents the basic infrastructure (transport, shelter, water, energy, and communications) and the production equipment and means enabling the pursuit of various livelihood strategies.
• Human capital comprises the skills, knowledge, and ability to labor central to various livelihood pursuits.
• Social capital includes the social resources, such as networks, group memberships, and trust relationships, upon which individuals and households draw.
• Natural capital includes access to land, water, and wildlife, from which households engage in agricultural pursuits and/or resource collection for both sustenance and income generation.
Rural households often combine a number of livelihood activities to meet
subsistence needs, such as agricultural crop production, wage labor, or forest product collection. Of course, the household’s access to different livelihood capitals and opportunities will shape the potential mix of activities (Ellis 1998; Bryceson 2002).
The SL framework is well suited to examining population-environment interactions (de Sherbinin et al. 2008; Massey, Axinn, and Ghimire 2010), since population dynamics (e.g., migration) are often reciprocally related to livelihood strategies, which are themselves directly or indirectly affected by local environments.4 For instance, access to natural capital may facilitate improvements to other livelihood assets such as financial capital – for example, income generation through baskets woven with locally collected reeds (Pereira, Shackleton, and Shackleton 2006).
4 Livelihood options and strategies are also clearly shaped by structural, macro-level factors. These include the sociopolitical context, which encompasses laws, policies, institutions, and governance (Mahdi, Shivakoti, and Schmidt-Vogt 2009), cultural factors (status of women, value of children, spiritual connection to the land), economic factors (national and global markets), and global changes affecting the local environment (desertification, flooding, sea level rise) (de Sherbinin et al. 2008). Given our cross-sectional and micro-level approach, the analyses presented here do not incorporate such broad-scale factors.
Demographic Research: Volume 26, Article 24
http://www.demographic-research.org 665
2.2 Migrant/non-migrant differentials in livelihood assets
Early in the development of the Sustainable Livelihoods framework, migration was recognized as an important means of livelihood diversification (Chambers and Conway 1991). In particular, out-migration is a livelihood strategy sometimes practiced in response to the insecurity and unpredictability of agricultural activities. Farmers, or members of farming families, may leave their village seasonally or permanently to earn additional income elsewhere or to seek new lands for agricultural production and animal husbandry (Kull, Ibrahim, and Meredith 2007; Mahdi, Shivakoti, and Schmidt-Vogt 2009). But the propensity to migrate is not randomly distributed, and those who do decide to migrate may differ from others within their chosen destination regions, as explored below.
2.2.1 Financial capital
Migration requires capital, so migrants are typically not the poorest of the poor (Brown and Bean 2006). Indeed, Mberu (2006) observed that migrants have higher living standards (a reflection of financial capital) than non-migrants, primarily due to selectivity into migration status by education and occupation. Even so, other researchers report evidence that severe poverty may also drive out-migration as a last resort (Ezra 2001). Within this study, given high levels of impoverishment in rural Madagascar, we anticipate migrants to possess relatively higher levels of financial capital as compared to the non-migrants resident in destination regions.
2.2.2 Human capital
Related to financial capital, migrants tend to be better educated than their non-migrant peers (Lindstrom and Ramirez 2010), a fact that has been well established in the demographic literature for decades (Browning and Feindt 1969, Takenaka and Pren 2010). Based on this literature we anticipate migrants to possess higher levels of human capital (education) relative to rural non-migrants, since they bring personal characteristics to their destinations such as educational level garnered in origin areas.
Nawrotzki, Hunter & Dickinson: Differences between migrants and non-migrants in Madagascar
http://www.demographic-research.org 666
2.2.3 Physical capital
Takenaka and Pren (2010) point out that physical capital such as a home or production assets can either deter migration (owners have greater investment in origin areas) or facilitate migration (assets can be mortgaged or used to generate income to finance a move). These contrasting tendencies can be explained by different migration theories (Bohra and Massey 2009). According to conventional economic theory, physical capital assets mitigate the costs of migration and thus raise the probability of out-migration (Massey et al. 1998). The new economic theory, on the other hand, argues that households move in order to self-finance asset acquisition, so that ownership of these assets (e.g., business, truck, harvesting equipment) is associated with lower probability of migration (see Massey and Espinosa 1997). In the context of rural Madagascar we anticipate that non-migrants who have resided longer in the study areas will have acquired relatively higher levels of physical capital as compared to migrant newcomers.
2.2.4 Social capital
Social networks play a critical role in shaping migration. Those who have a spouse, immediate family member, or other relatives with migratory experience are significantly more likely to migrate than those without such ties (Fussell and Massey 2004), suggesting stronger social networks in regions chosen as destinations. In addition, migrant networks connect non-migrants in places of origin to current migrants at places of destination, thereby reducing the costs and increasing the expected benefits of migration, and make departure more likely (Massey 1990). Such networks further the social capital of migrants in their places of arrival.
Although a newly arrived migrant may initially not be as well connected as local residents, his or her social capital can be expected to increase over time. Research has shown rapid social integration of migrants in the host-society through the formation of social ties, as measured by intermarriage rates (Jimenez 2011). Still, given the importance of length of residence to the generation and maintenance of social capital, we anticipate rural non-migrants to have higher levels of local social capital than migrants within destination regions.
2.3 Natural capital: Our analytical focus
Madagascar is renowned for its biological diversity (Dufils 2003). Roughly 80% of the nation’s residents live in biologically diverse rural areas and rely heavily on forest
Demographic Research: Volume 26, Article 24
http://www.demographic-research.org 667
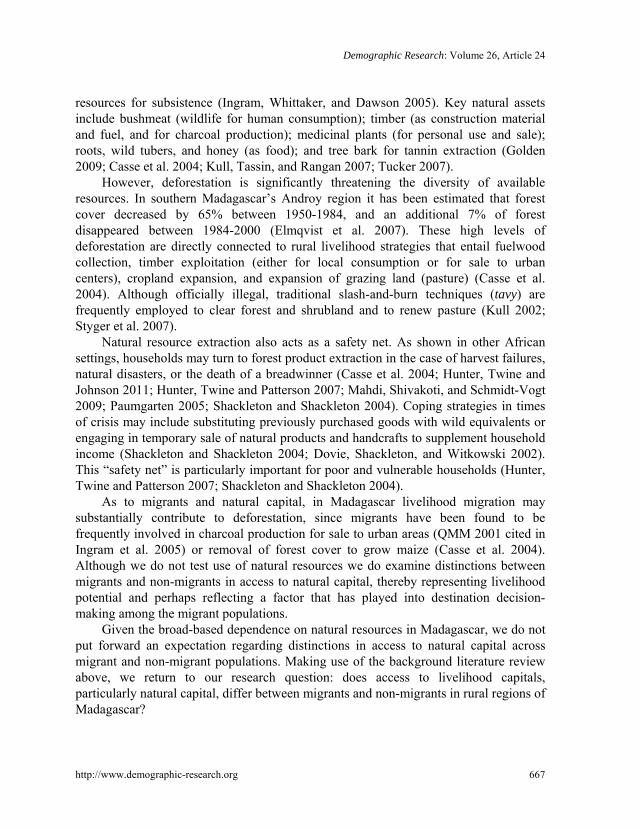
resources for subsistence (Ingram, Whittaker, and Dawson 2005). Key natural assets include bushmeat (wildlife for human consumption); timber (as construction material and fuel, and for charcoal production); medicinal plants (for personal use and sale); roots, wild tubers, and honey (as food); and tree bark for tannin extraction (Golden 2009; Casse et al. 2004; Kull, Tassin, and Rangan 2007; Tucker 2007).
However, deforestation is significantly threatening the diversity of available resources. In southern Madagascar’s Androy region it has been estimated that forest cover decreased by 65% between 1950-1984, and an additional 7% of forest disappeared between 1984-2000 (Elmqvist et al. 2007). These high levels of deforestation are directly connected to rural livelihood strategies that entail fuelwood collection, timber exploitation (either for local consumption or for sale to urban centers), cropland expansion, and expansion of grazing land (pasture) (Casse et al. 2004). Although officially illegal, traditional slash-and-burn techniques (tavy) are frequently employed to clear forest and shrubland and to renew pasture (Kull 2002; Styger et al. 2007).
Natural resource extraction also acts as a safety net. As shown in other African settings, households may turn to forest product extraction in the case of harvest failures, natural disasters, or the death of a breadwinner (Casse et al. 2004; Hunter, Twine and Johnson 2011; Hunter, Twine and Patterson 2007; Mahdi, Shivakoti, and Schmidt-Vogt 2009; Paumgarten 2005; Shackleton and Shackleton 2004). Coping strategies in times of crisis may include substituting previously purchased goods with wild equivalents or engaging in temporary sale of natural products and handcrafts to supplement household income (Shackleton and Shackleton 2004; Dovie, Shackleton, and Witkowski 2002). This “safety net” is particularly important for poor and vulnerable households (Hunter, Twine and Patterson 2007; Shackleton and Shackleton 2004).
As to migrants and natural capital, in Madagascar livelihood migration may substantially contribute to deforestation, since migrants have been found to be frequently involved in charcoal production for sale to urban areas (QMM 2001 cited in Ingram et al. 2005) or removal of forest cover to grow maize (Casse et al. 2004). Although we do not test use of natural resources we do examine distinctions between migrants and non-migrants in access to natural capital, thereby representing livelihood potential and perhaps reflecting a factor that has played into destination decision-making among the migrant populations.
Given the broad-based dependence on natural resources in Madagascar, we do not put forward an expectation regarding distinctions in access to natural capital across migrant and non-migrant populations. Making use of the background literature review above, we return to our research question: does access to livelihood capitals, particularly natural capital, differ between migrants and non-migrants in rural regions of Madagascar?
Nawrotzki, Hunter & Dickinson: Differences between migrants and non-migrants in Madagascar
http://www.demographic-research.org 668
3. Methods
3.1 Data
We use the 2008-2009 Madagascar Demographic and Health Survey (DHS). The DHS, a standardized survey administered in 84 countries, collects a wide variety of socio-demographic and health information and has been described as one of “the largest, coordinated social science research efforts in history” (Morgan and Hagewen 2006). The DHS’s analytical foci are fertility, family planning, and maternal and child health, and therefore its sample predominantly includes women and men of reproductive age. This targeted sample, in combination with the lack of consistent residence history data, has minimized the use of the DHS for migration research (an exception is Islam and Azad’s [2008] work using data from Bangladesh). However, the Madagascar DHS data, collected by Madagascar’s Institut National de la Statistique (INSTAT), are an exception and are well suited for our research purposes since they include some residence history information and are also geo-referenced, allowing spatial information on vegetation cover to be appended to the social data.
Given our focus on natural capital within rural livelihoods, we limit our analysis to DHS respondents within Madagascar’s rural areas (about 70% of the total population). The DHS uses a stratified two-stage cluster sampling design in which the primary sampling unit (PSU) in stage 1 and the households in stage 2 are randomly selected. The DHS then administers its two main survey instruments: a household schedule and an individual questionnaire. The household schedule provides a list of household members from which eligible individuals are selected (DHS 1996). Eligible individuals comprise all women of reproductive age in the household. The DHS also collects information about men of reproductive age from every other sampled household, resulting in a somewhat smaller male sample. We combined these two samples to investigate overall patterns of migrant/non-migrant differences in capital asset status, with a focus on natural capital.
3.2 Measures
3.2.1 Dependent variables
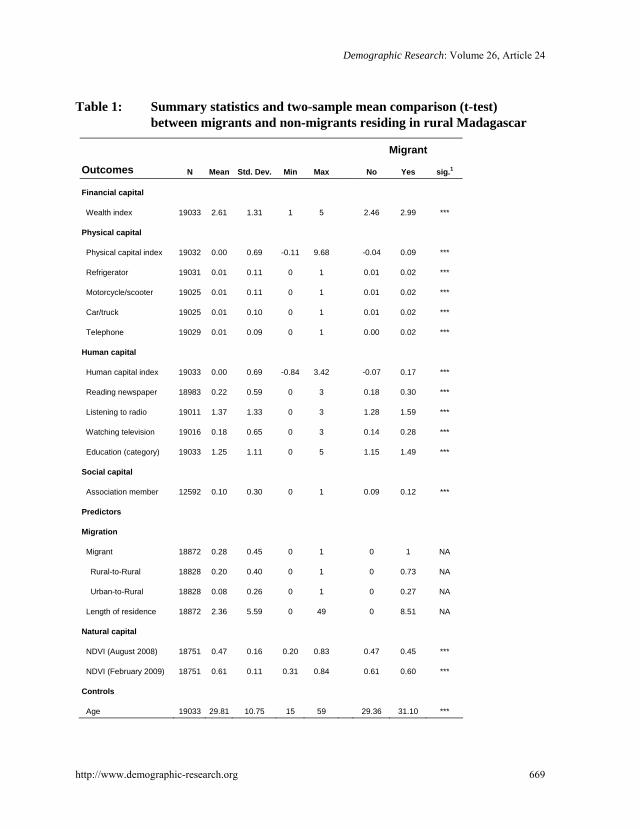
We created a number of measures to reflect financial, physical, human, social, and natural capital. In Table 1 we report frequencies and group-mean comparisons (t-test) between migrants and non-migrants for rural areas. This allows for an overall appraisal of variation between migrants and non-migrants across regions.
Demographic Research: Volume 26, Article 24
http://www.demographic-research.org 669
Table 1: Summary statistics and two-sample mean comparison (t-test) between migrants and non-migrants residing in rural Madagascar
Migrant
Outcomes N Mean Std. Dev. Min Max
No Yes sig.1
Financial capital
Wealth index 19033 2.61 1.31 1 5
2.46 2.99 ***
Physical capital
Physical capital index 19032 0.00 0.69 -0.11 9.68
-0.04 0.09 ***
Refrigerator 19031 0.01 0.11 0 1
0.01 0.02 ***
Motorcycle/scooter 19025 0.01 0.11 0 1
0.01 0.02 ***
Car/truck 19025 0.01 0.10 0 1
0.01 0.02 ***
Telephone 19029 0.01 0.09 0 1
0.00 0.02 ***
Human capital
Human capital index 19033 0.00 0.69 -0.84 3.42
-0.07 0.17 ***
Reading newspaper 18983 0.22 0.59 0 3
0.18 0.30 ***
Listening to radio 19011 1.37 1.33 0 3
1.28 1.59 ***
Watching television 19016 0.18 0.65 0 3
0.14 0.28 ***
Education (category) 19033 1.25 1.11 0 5
1.15 1.49 ***
Social capital
Association member 12592 0.10 0.30 0 1
0.09 0.12 ***
Predictors
Migration
Migrant 18872 0.28 0.45 0 1
0 1 NA
Rural-to-Rural 18828 0.20 0.40 0 1
0 0.73 NA
Urban-to-Rural 18828 0.08 0.26 0 1
0 0.27 NA
Length of residence 18872 2.36 5.59 0 49
0 8.51 NA
Natural capital
NDVI (August 2008) 18751 0.47 0.16 0.20 0.83
0.47 0.45 ***
NDVI (February 2009) 18751 0.61 0.11 0.31 0.84
0.61 0.60 ***
Controls
Age 19033 29.81 10.75 15 59
29.36 31.10 ***
Nawrotzki, Hunter & Dickinson: Differences between migrants and non-migrants in Madagascar
http://www.demographic-research.org 670
Table 1: (Continued)
Migrant
Outcomes N Mean Std. Dev. Min Max
No Yes sig.1
Male 19033 0.34 0.47 0 1
0.37 0.25 ***
Married 19033 0.70 0.46 0 1
0.65 0.81 ***
Religious 19030 0.70 0.46 0 1
0.66 0.79 ***
Not working 19031 0.10 0.30 0 1
0.10 0.09
Professional/Supervisor 19031 0.02 0.15 0 1
0.01 0.05 ***
Service worker 19031 0.05 0.22 0 1
0.04 0.09 ***
Skilled manual worker 19031 0.81 0.39 0 1
0.84 0.75 ***
Unskilled worker 19031 0.02 0.13 0 1
0.01 0.03 ***
Household size 19033 5.86 2.77 1 22
6.00 5.45 ***
No. children (< 5years) 19033 1.12 1.05 0 7
1.14 1.07 ***
Development index 19033 0.00 0.46 -0.56 1.89
-0.04 0.12 *** 1 Significance level refers to p-values, calculated based on group mean comparison (t-test) *<.05; **<.01; ***<.001 Source: Demographic and Health Survey for Madagascar 2008/2009
Financial capital. The DHS does not collect information on household
consumption or income. However, it provides a wealth index that categorizes people as poorest=1, poorer=2, middle=3, richer=4, and richest=5.5 In many less developed countries (LDCs) monetary income is difficult to measure, since many individuals are self-employed, involved in seasonal and/or other temporary labor arrangements, and/or involved in home production for which the financial cost of goods sold or produced is less relevant. Household wealth, in contrast, represents a more permanent measure of economic status and has been used by other studies as a proxy for income or consumption/expenditure measures (Gwatkin et al. 2007).
Physical capital. In the Sustainable Livelihoods framework, physical capital includes (1) productive assets that can be used as tools, and (2) communal assets, such as access to roads or local infrastructure (de Sherbinin et al. 2008). Unfortunately, the
5 The wealth index is a weighted measure based on items reflecting economic status. It includes variables such as quality of housing structure, quality of toilet facility, availability of electricity, vehicle and assets ownership (e.g., radio, television, and telephone), whether there is a domestic servant, and whether the household owns agricultural land (Rutstein and Johnson 2004). The wealth index is sometimes considered problematic in distinguishing within geographical regions (rural/urban). However, investigating the index distribution used here revealed sufficient variation for our rural sample.
Demographic Research: Volume 26, Article 24
http://www.demographic-research.org 671
DHS does not collect data on communal assets, and thus we restrict our physical capital measure to productive assets. On the basis of face validity and statistical evidence from an exploratory factor analysis, we use four items to create a physical capital scale.6 Motorcycles, as well as cars and trucks, allow access to distant resources that can then be sold (Quiroz-Carranza and Orellana 2010); telephones assist in selling or buying goods, and/or in other entrepreneurial endeavors; refrigerators allow small businesses to store and sell perishable materials (e.g., food items, medicine). The standardized scale shows a Cronbach’s alpha reliability of .626.
Human capital. Educational attainment is a common measure of human capital (Saenz and Morales 2006), given its importance in securing employment. Education also facilitates negotiation through the socio-cultural environment and offers skills to manage scarce resources. We measure educational attainment through a categorical variable ranging from no education=0 to higher education=5.7 In addition to formal education, reading newspapers, listening to radio, or watching television provides individuals with valuable information about weather, shifts in markets, and new ideas or innovative production techniques. Thus, we include frequency measures for these factors in the human capital scale. The standardized scale shows an alpha reliability of .640.
Social capital. Social capital has been defined by Brown and Bean (2006:358) as “the repertoire of resources such as information, material assistance, and social support that flow through ties to kin, to community, and to institutions.” Social capital is enhanced as the number and intensity of social ties between a focal individual and other persons increase (Hagan 1998). To measure social capital we use a variable for association membership (1=member), based on the assumption that organizational members likely have larger social networks on which to draw during difficult times.8 Organization membership has been used by other authors as a proxy for social capital (Mutenje et al. 2010). Unfortunately, this measure is only available for the female sample. We recognize that relying on a single, dichotomous measure is not ideal, and therefore our findings regarding social capital should be evaluated with caution.
6 The possession of a car/truck, motorcycle, refrigerator, and telephone was used to construct this scale. All four items were coded 1 if available to the household. We included these four variables, together with nine additional items reflecting economic status (e.g., possession of television, radio, and electricity), in an exploratory factor analysis. Using the rotated factor matrix with a threshold of .40 shows that the four physical capital items load separately on the second factor. 7 Madagascar’s school enrollment rate for children age 11-14 is below the sub-Saharan average and one of the lowest rates in the world (AEO 2007). 8 The question (item s831) in the French questionnaire was worded “Est-ce que vous êtes un membre d’une association quelconque?” with answer options yes and no.
Nawrotzki, Hunter & Dickinson: Differences between migrants and non-migrants in Madagascar
http://www.demographic-research.org 672
3.2.2 Independent variables
Migration variables. A central variable of interest is migration status. We follow the demographic approach of examining migration as an individual behavior, recognizing its social embeddedness in a household-level decision-making process (Stark 1991). The DHS survey collects basic information on current residence (rural/urban), years spent at current residence, and type of residence (rural/urban) before the most recent migration.9 Using this information we constructed three migration measures following Islam and Azad (2008). First, a simple dummy variable “migrant” reflects whether a person has migrated to the current place of residence (coded 1) or has lived there since birth (coded 0). We then used information about location characteristics of origin and destination (rural/urban) to create a set of dummy variables representing different migration streams. Since we restricted our sample to rural areas, only urban-to-rural and rural-to-rural migration streams are examined. We expect to see substantial differences in access to livelihood assets between these two migration streams, since migrants with long periods of residence in urban origins bring with them to their rural destinations the experiences, behaviors, and attitudes acquired while living and working in urban areas (White and Lindstrom 2006). On the one hand these skills, knowledge, and experiences can provide urban-rural migrants with a competitive advantage in entrepreneurial endeavors, resulting in higher levels of financial and physical capital. On the other hand the cultural and status difference between former city dwellers and the local population might inhibit the development of social capital. However, only a quarter (27%) of all migrants originated in urban areas. Three-quarters (73%) have moved from a rural origin to another rural destination, a demographic phenomenon identified in some portions of Africa and South America (Henry, Schoumaker and Beauchemin 2004, Barbieri and Carr 2005).
The third migration variable, “length of residence” (LOR), reflects time spent at the current destination.10 This variable reflects the potential for migrant adaptation and assimilation (Adeola 2009; Wang and Lo 2005; St-Hilaire 2002). On average migrants in our sample have lived 8.5 years at their current residence.
Normalized Difference Vegetation Index (NDVI). We derived measures of natural resource availability from the normalized difference vegetation index (NDVI), calculated from daily satellite-based observations. NDVI is a relative measure of biomass and is often used to show impacts of environmental change on vegetative health and abundance (Roerink et al. 2003; Wang, Rich, and Price 2003; Zhou et al.
9 The DHS defines cities and towns as urban and the countryside as rural. 10 LOR was created using a multiplicative term “count x migrant,” where “count” is a continuous variable that has values from 1 to 50 for the years since the most recent move, and is 0 for all non-movers. Interacting this variable with the dummy variable “migrant” results in a term that measures the effect of time since the last move for migrants only.
Demographic Research: Volume 26, Article 24
http://www.demographic-research.org 673
2003). Vegetation indices such as NDVI exploit vegetation’s reflectance of near-infrared light and absorption of red light. In healthy plant tissue chlorophyll absorbs red light and mesophyll tissues scatter near-infrared light; the NDVI is the difference between the values in the red and near-infrared bands divided by the sum of these same values (Tucker 1979). NDVI values thus range from -1 to +1, with actively growing green vegetation exhibiting strong positive values. Low NDVI values (approximately 0.1 and below) indicate water and barren or developed land covers; moderately positive values (0.2 to 0.3) may correspond to shrublands and grasslands. In general, vegetation biomass and productivity are positively correlated with NDVI (Foody et al. 2001; Mutanga and Skidmore 2004; Wang et al. 2004). These characteristics make NDVI a particularly good measure for the environmental scarcity we expect to see in Madagascar because of deforestation; and, indeed, NDVI has been used for research in Madagascar to measure forest cover changes in relation to social institutional context (Elmqvist et al. 2007).
The NDVI was calculated from data collected by the MODIS/Terra sensor, averaged over 16-day intervals to reduce the effects of cloud cover, corrected to reduce atmospheric effects, masked to indicate pixel reliability (e.g., where water or clouds make the image unreadable), and processed and validated for geometric accuracy. We obtained images from the MODIS/Terra Vegetation Indices dataset (16-Day L3 Global 500m SIN Grid, MOD13A1), provided by the Land Processes Distributed Active Archive Center (LP DAAC) of the U.S. Geological Survey (USGS) Earth Resources Observation and Science (EROS) Center (LPDAAC 2011).
Madagascar is influenced alternatively by dry trade-wind conditions in winter (May-September) and monsoon-driven tropical storms in summer (December-March) (Jury 2003). Fuelwood collection is intensified during the low agricultural season, from mid-August to the end of October and again from February to March (Randriamanarivo 1997, cited in Casse et al. 2004). Therefore we analyzed NDVI data for August 2008 (winter) and February 2009 (summer) to capture the effect of vegetation during times of higher forest resource dependency for both seasons.
The DHS data do not provide geographic location of individual households, which would allow construction of a precise measure of household-specific natural resource access. Instead, location is recorded at the center of a geographical cluster, a small settlement such as a rural village (Montana and Spencer 2004). For each of the 445 cluster points we created buffer zones to calculate mean NDVI at a range of distances surrounding each point. Geospatial Modelling Environment (GME) software version 0.5.3 Beta, developed by Hawthorne L. Beyer (Spatial Ecology LLC), was used to calculate the NDVI means for buffer zones.
We generated a variety of buffers, circling each sample point at intervals from 2 to 20 kilometers. We then investigated the influence of buffer zone radius size on the

Nawrotzki, Hunter & Dickinson: Differences between migrants and non-migrants in Madagascar
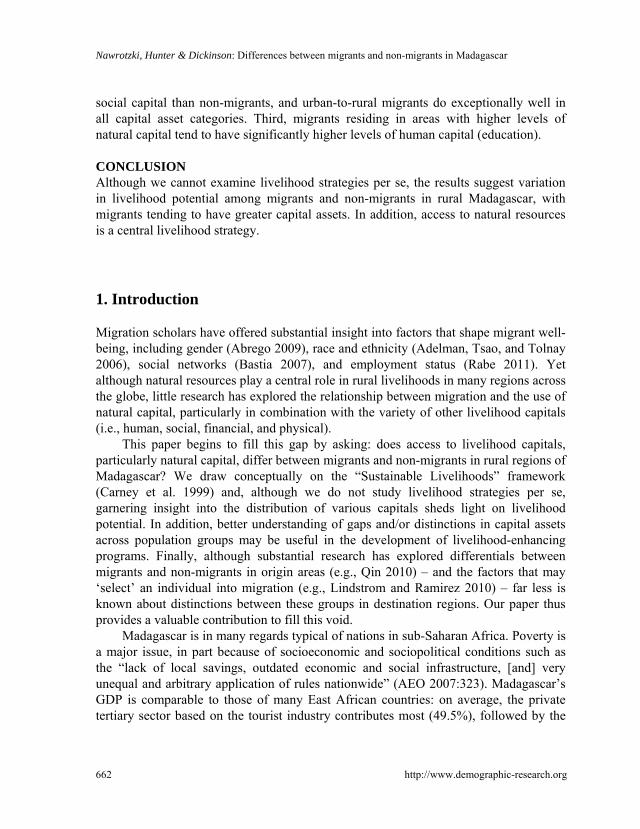
estimates by repeatedly running a fully adjusted multivariate model predicting financial capital, including a different buffer zone radius at each time (see Appendix Table A1). Although we observed a slight increase in the effect size for larger buffer radii, we based our decision for the final buffer size primarily on theoretical considerations. For instance, the literature on natural resource extraction suggests that individuals typically walk about 4 km from their settlement to collect firewood (Quiroz-Carranza and Orellana 2010). In addition, DHS uses a “Geo-Scrambling” method for confidentiality reasons, which randomly adds a position error between 0 and 5 kilometers to the coordinates of each sampling point (DHS 2011). Thus, we chose to use a 10-kilometer buffer (6.21 miles) for the subsequent analyses to account for both the position error and the average walking distance (5 km + 4 km = 9 km). Figure 1 shows NDVI measures and the location of the different cluster points in Madagascar for both seasons.
Figure 1: Map of Madagascar colored according to greenness (NDVI) during
winter (August 2008) and summer (February 2009)
Notes: Cluster-points for which the mean NDVI values were calculated are shown as dots.
http://www.demographic-research.org 674
Demographic Research: Volume 26, Article 24
http://www.demographic-research.org 675
3.2.3 Control variables
As noted above, the DHS was designed to explore fertility behavior and maternal health issues and is restricted to individuals of reproductive age (DHS 2008). Thus the included control variable for age ranges from 15 to 49 for females and from 15 to 59 for males. A dichotomous predictor differentiates between males (coded 1) and females (coded 0). Since men are interviewed in only about half of all households they contribute a third (34%) of the cases.
A dummy variable for marital status is also used, with categories 1=married and 0=other (including divorced, single, widowed). A dummy for religiosity was coded 1 if an individual claimed any religious affiliation. In addition, a set of dummy variables reflect a person’s occupation status, grouped into 5 distinct categories (1=professionals [including supervisor, administrators, business directors]; 2=service worker [includes working in shops and markets]; 3=skilled manual worker [agriculture, forestry, fishing, transportation, and industry]; 4=unskilled worker, with not working as reference category. Further, we include variables for household size and number of young children as controls.
Finally, it might be argued that NDVI measures development, modernization, or industrialization, rather than access to natural resources. To control for this alternative explanation we used a number of variables as proxies for development, such as the quality of cooking fuel; the quality of floor, wall, and roof material of the housing unit; access to piped water; quality of toilet facility; access to electricity; and possession of a radio and television. These nine items were used to construct a standardized “development scale” (Cronbach’s alpha reliability of .76), which was then aggregated at the cluster level.
3.3 Estimation strategy
The Madagascar DHS data show a distinct hierarchical structure. In our rural sample 19,033 individuals (level-1) are nested within 11,260 households (level-2), while these households are nested within 445 geographical clusters (level-3). The hierarchical structure warrants a multilevel modeling approach (Subramanian et al. 2009, Gelman and Hill 2007), and the three aggregation levels would suggest a three-level model. However, the group size at the household-level poses challenges to this approach since each higher order group should contain at least five units to guarantee unbiased estimates (Clarke 2008, Maas and Hox 2005). In our sample only one individual was interviewed in over half of the households (53%). This large number of households with single representation defies the separation of the individual-level (level-1) variance
Nawrotzki, Hunter & Dickinson: Differences between migrants and non-migrants in Madagascar
component from the household-level (level-2) variance component, which frequently prevents model convergence (Clarke and Wheaton 2007).
The predominant approach to reducing observation sparseness is to use cluster analysis with the goal of combining level-2 groups with larger aggregates based on socio-demographic similarity or/and geographic proximity (Béland et al. 2002, Cutrona et al. 2000, Buka et al. 2003). In this way clustering reduces the number of level-2 groups and increases the average group size. We follow this approach conceptually, but rather than creating artificial clusters we make use of a pre-existing DHS measure, which clusters households within “ultimate area units” (UAU). We use this measure as our level-2 identifier, resulting in 445 cluster-level groups with an average group size of 43 individuals - ideal conditions for a multilevel analysis (Maas and Hox 2005, Clarke and Wheaton 2007).
Using UAU clusters as the second level is important for two reasons. First, one of our main predictors, NDVI, operates at this aggregation level. Second, the Intraclass Correlation Coefficient (ICC) statistic indicates that a substantial amount of variation (>20%) in our outcome variables lies between clusters.11 In the case of ICC values above 20%, ordinary least squares regression yields biased estimates and multilevel modeling becomes the preferred method (Clarke and Wheaton 2007).
In our two-level models we allow both the intercept and the slope to vary across the 445 geographical clusters to capture heterogeneity across units. This adjusts for clustering, different sample sizes for level-1 and level-2 units, heteroscedastic error terms, and varying numbers of cases within level-2 units. The model can be described by a list of equations.
Level 1: ijzijzjijjijjjij rXXXY +++++= ββββ ...22110 (1) Level 2: jjj uW 001000 * ++= γγβ jjj uW 111101 * ++= γγβ The level-1 component of the model is similar to a standard OLS multivariate
regression model with β0 as the intercept, β1-z the regression coefficients for individual-level variables X1-z (age, marital status, etc.), and rij the traditional individual-level error term. However, the j subscript indicates that a different level-1 model is estimated for each of the j level-2 units (clusters). In other words, each geographical cluster may have a different average level of financial, physical, human, or social capital (β0j) and a
11 For financial capital 54%, for physical capital 20%, for human capital 45%, and for social capital 24% of the variation occurs at the cluster level. To calculate the ICC for social capital we use a threshold approach, which treats the level-1 variation as having a variance of a standard logistic distribution amounting to a value of 3.29 (Snijders and Bosker 1999).
http://www.demographic-research.org 676

Demographic Research: Volume 26, Article 24
http://www.demographic-research.org 677
different effect of migration on these capitals (β1j). Thus, the intercept β0j and the slope β1j of migration (X1ij) were allowed to vary across level-2 units (geographical clusters).
The level-2 model component indicates how each of the level-1 parameters is a function of level-2 predictors and variability. β0j is the level-1 intercept in level-2 unit j; γ00 is the mean value of the level-1 dependent variable, controlling for NDVI as level-2 predictor; γ01 is the effect (slope) of the level-2 predictor; and u0j is the error, or unmodeled variability, for unit j. The interpretation of the second equation is similar, but here the level-2 effect on the slope of X1ij (migration) is modeled. β1j is the level-1 slope in level-2 unit j; γ10 is the mean value of the level-1 slope, controlling for the level-2 predictor W (NDVI); γ11 is the effect of the level-2 predictor W (NDVI); and u1j is the error for unit j (Luke 2004).
Instead of using a system of equations to specify the multilevel model, the level-2 parts of the model can be substituted into the level-1 equation. This single prediction equation of the multilevel model (not shown) is used by MLwiN 2.24 software (Rasbash et al. 2009), which we employed. We ran MLwiN in STATA 11 (StataCorp LP, College Station, Texas) by using the macro runmlwin (Leckie and Charlton 2011).
We first used simple additive multilevel models with all types of livelihood capitals, including NDVI as a measure of natural capital. These models are random intercept models in which the constant is allowed to vary across geographical units. However, the NDVI measure was not included in this analysis for its own sake: rather, we were interested in whether the difference between migrants and non-migrants in livelihood assets varies with the greenness of a particular area. For this purpose we employed random-slope, random-intercept models allowing cross-level interactions between the three migration variables and the greenness scale (Migrant x NDVI, LOR x NDVI, Rural-to-Rural x NDVI, Urban-to-Rural x NDVI). In addition to the variation of the constant, these models allowed the slope (effect size) of the migration measures to vary across geographical units. To provide a meaningful coefficient interpretation for the cross-level interaction, we specified a different parameterization by grand mean centering of NDVI.
4. Results
4.1 Sample overview and summary statistics
Madagascar is one of the world’s poorest countries (UN 2003), with a per capita gross domestic product (GDP) of $918 in 2007 (Heston, Summers, and Aten 2009). This overall poverty is reflected in our data. In rural Madagascar 82% of households use non-durable material such as earth/sand/dung or bamboo mats as floor material, 69% of
Nawrotzki, Hunter & Dickinson: Differences between migrants and non-migrants in Madagascar
http://www.demographic-research.org 678
homes have walls made of palm branches or dirt, and 57% have no toilet facility. The vast majority of respondents obtain water from rivers, springs, and wells, with fewer than 1% having access to piped water in the homestead.
Since our main concern was to explore the asset difference between migrants and non-migrants, the first step in our analysis was to use ordinary group-mean comparison (t-tests) (see Table 1). Migrants exhibit significantly higher access to all capital assets. As examples, migrants score significantly higher on the wealth index than their non-migrant counterparts, and also higher on all physical capital items, including refrigerators, motorcycles, trucks, and telephones. A similar picture is revealed for human capital, with migrants having above-average educational levels, reading newspapers more frequently, listening more to radio, and watching more TV. Female migrants appear better connected through association membership, perhaps because migration is often facilitated by an extended social network (Curran 2002; White and Lindstrom 2006). Interestingly, migrants tend to live in areas with slightly lower natural capital in the form of vegetation coverage, which might be the consequence of resource extraction (Durbin, Bernard, and Fenn 2003; Virah-Sawmy 2009); although our data do not allow investigation of such temporal shifts.
4.2 Additive models
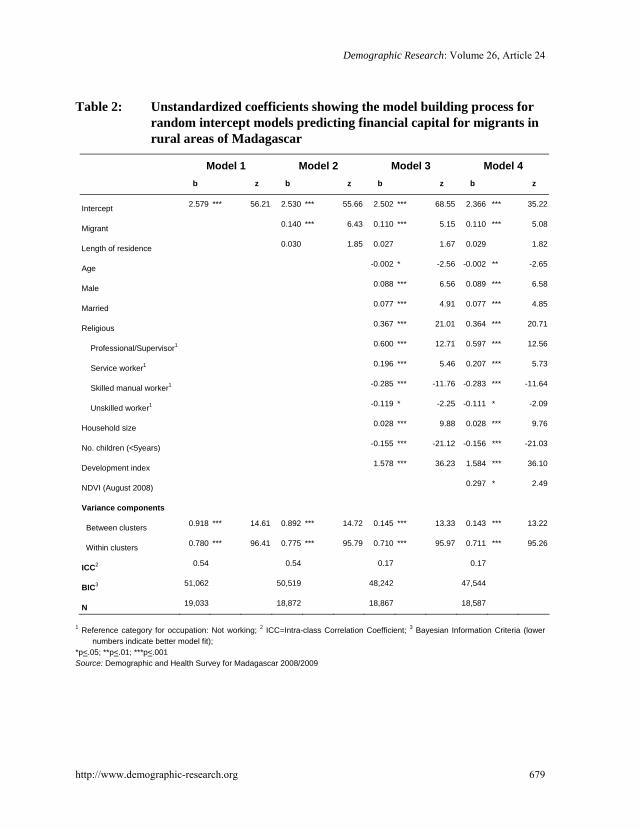
We constructed separate models for each of the four livelihood asset scales. The model building procedure includes running a null-model (Model 1), followed by a stepwise addition of the migration variables (Model 2), level-1 control variables (Model 3), and finally NDVI and “development” as level-2 predictors (Model 4).12 Because of space limitations we show the model-building process for financial capital only (see Table 2 below).
12 Given the values for the variance inflation factor (VIF) statistic, we were able to confirm that multicollinearity is of no concern, even if NDVI and “development” are included at the same time.
Demographic Research: Volume 26, Article 24
http://www.demographic-research.org 679
Table 2: Unstandardized coefficients showing the model building process for random intercept models predicting financial capital for migrants in rural areas of Madagascar
Model 1 Model 2 Model 3 Model 4
b z b z b z b z
Intercept 2.579 *** 56.21 2.530 *** 55.66 2.502 *** 68.55 2.366 *** 35.22
Migrant 0.140 *** 6.43 0.110 *** 5.15 0.110 *** 5.08
Length of residence 0.030 1.85 0.027 1.67 0.029 1.82
Age -0.002 * -2.56 -0.002 ** -2.65
Male 0.088 *** 6.56 0.089 *** 6.58
Married 0.077 *** 4.91 0.077 *** 4.85
Religious 0.367 *** 21.01 0.364 *** 20.71
Professional/Supervisor1 0.600 *** 12.71 0.597 *** 12.56
Service worker1 0.196 *** 5.46 0.207 *** 5.73
Skilled manual worker1 -0.285 *** -11.76 -0.283 *** -11.64
Unskilled worker1 -0.119 * -2.25 -0.111 * -2.09
Household size 0.028 *** 9.88 0.028 *** 9.76
No. children (<5years) -0.155 *** -21.12 -0.156 *** -21.03
Development index 1.578 *** 36.23 1.584 *** 36.10
NDVI (August 2008) 0.297 * 2.49
Variance components
Between clusters 0.918 *** 14.61 0.892 *** 14.72 0.145 *** 13.33 0.143 *** 13.22
Within clusters 0.780 *** 96.41 0.775 *** 95.79 0.710 *** 95.97 0.711 *** 95.26
ICC2 0.54 0.54 0.17 0.17
BIC3 51,062 50,519 48,242 47,544
N 19,033 18,872 18,867 18,587
1 Reference category for occupation: Not working; 2 ICC=Intra-class Correlation Coefficient; 3 Bayesian Information Criteria (lower numbers indicate better model fit);
*p<.05; **p<.01; ***p<.001 Source: Demographic and Health Survey for Madagascar 2008/2009
Nawrotzki, Hunter & Dickinson: Differences between migrants and non-migrants in Madagascar
http://www.demographic-research.org 680
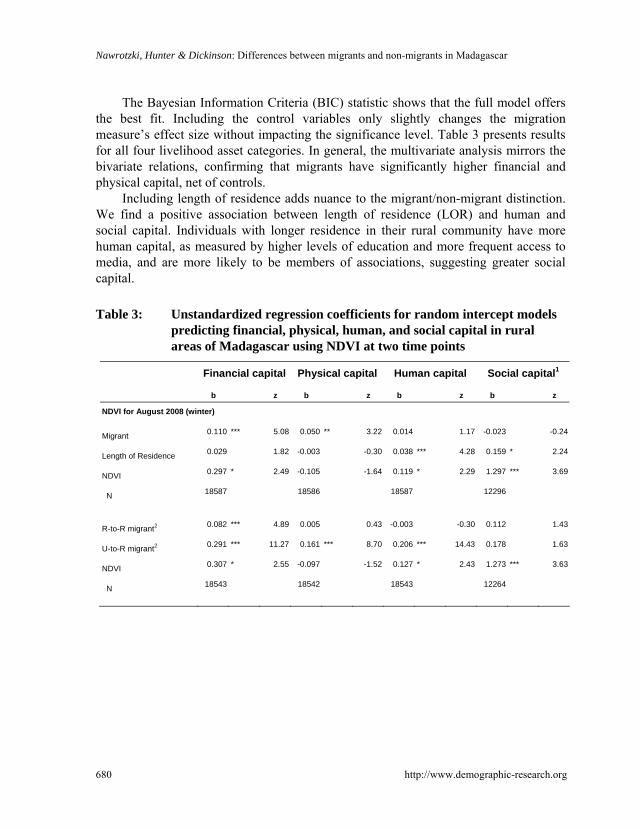
The Bayesian Information Criteria (BIC) statistic shows that the full model offers the best fit. Including the control variables only slightly changes the migration measure’s effect size without impacting the significance level. Table 3 presents results for all four livelihood asset categories. In general, the multivariate analysis mirrors the bivariate relations, confirming that migrants have significantly higher financial and physical capital, net of controls.
Including length of residence adds nuance to the migrant/non-migrant distinction. We find a positive association between length of residence (LOR) and human and social capital. Individuals with longer residence in their rural community have more human capital, as measured by higher levels of education and more frequent access to media, and are more likely to be members of associations, suggesting greater social capital.
Table 3: Unstandardized regression coefficients for random intercept models
predicting financial, physical, human, and social capital in rural areas of Madagascar using NDVI at two time points
Financial capital Physical capital Human capital Social capital1
b z b z b z b z
NDVI for August 2008 (winter)
Migrant 0.110 *** 5.08 0.050 ** 3.22 0.014 1.17 -0.023 -0.24
Length of Residence 0.029 1.82 -0.003 -0.30 0.038 *** 4.28 0.159 * 2.24
NDVI 0.297 * 2.49 -0.105 -1.64 0.119 * 2.29 1.297 *** 3.69
N 18587 18586 18587 12296
R-to-R migrant2 0.082 *** 4.89 0.005 0.43 -0.003 -0.30 0.112 1.43
U-to-R migrant2 0.291 *** 11.27 0.161 *** 8.70 0.206 *** 14.43 0.178 1.63
NDVI 0.307 * 2.55 -0.097 -1.52 0.127 * 2.43 1.273 *** 3.63
N 18543 18542 18543 12264
Demographic Research: Volume 26, Article 24
http://www.demographic-research.org 681
Table 3: (Continued)
Financial capital Physical capital Human capital Social capital1
b z b z b z b z NDVI for February 2009 (summer)
Migrant 0.110 *** 5.09 0.050 ** 3.22 0.014 1.18 -0.025 -0.25
Length of Residence 0.029 1.81 -0.003 -0.29 0.038 *** 4.27 0.157 * 2.23
NDVI 0.834 *** 5.11 -0.121 -1.34 0.323 *** 4.53 2.157 *** 4.22
N 18587 18586 18587 12296
R-to-R migrant2 0.082 *** 4.87 0.005 0.45 -0.003 -0.34 0.107 1.37
U-to-R migrant2 0.292 *** 11.32 0.161 *** 8.70 0.206 *** 14.49 0.179 1.64
NDVI 0.862 *** 5.24 -0.099 -1.10 0.349 *** 4.87 2.151 *** 4.21
N 18543 18542 18543 12264
All models control for age, marital status, occupation, religion, number of children age<5years, household size, gender, and
development; 1 Logistic multilevel models were used to estimate social capital. This measure is only available for females;2 R-to-R = rural-to-rural migration, U-to-R = urban-to-rural migration. The reference group for this set of dummy variables was non-migrants;
*p<.05; **p<.01; ***p<.001 Source: Demographic and Health Survey for Madagascar 2008/2009
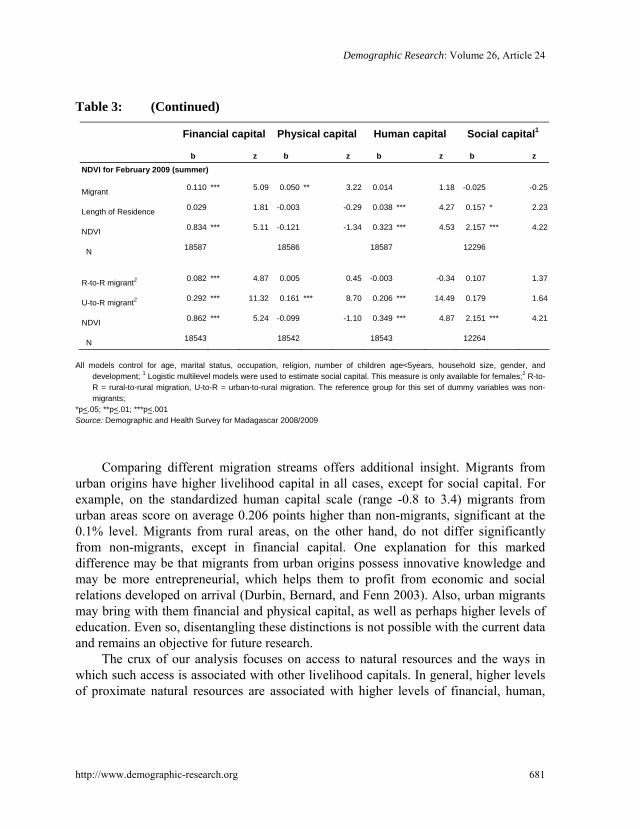
Comparing different migration streams offers additional insight. Migrants from
urban origins have higher livelihood capital in all cases, except for social capital. For example, on the standardized human capital scale (range -0.8 to 3.4) migrants from urban areas score on average 0.206 points higher than non-migrants, significant at the 0.1% level. Migrants from rural areas, on the other hand, do not differ significantly from non-migrants, except in financial capital. One explanation for this marked difference may be that migrants from urban origins possess innovative knowledge and may be more entrepreneurial, which helps them to profit from economic and social relations developed on arrival (Durbin, Bernard, and Fenn 2003). Also, urban migrants may bring with them financial and physical capital, as well as perhaps higher levels of education. Even so, disentangling these distinctions is not possible with the current data and remains an objective for future research.
The crux of our analysis focuses on access to natural resources and the ways in which such access is associated with other livelihood capitals. In general, higher levels of proximate natural resources are associated with higher levels of financial, human,
Nawrotzki, Hunter & Dickinson: Differences between migrants and non-migrants in Madagascar
http://www.demographic-research.org 682
and social capital.13 Regarding social capital, we can speculate that, in more remote ‘green’ areas, associations function as a traditional form of insurance system in the absence of formal institutions. For example, Dercon et al. (2006) observed that in traditional communities of Ethiopia and Tanzania indigenous associations are highly important because of their risk-sharing function. These associations’ main focus is to pay for funerals, but they also provide insurance against harvest failure, illness, fire, destruction of one’s house, and death of cattle, and they sometimes provide members with short-term loans. Regarding financial capital, households in areas of dense vegetation cover may garner income/wealth by selling natural resources and/or products made from them (e.g., selling of marula beer or palm brushes; Shackleton and Shackleton 2004). As for human capital, individuals in our study site may be able to use “forest resources in order to finance education” and thus transform natural capital to human capital (de Sherbinin et al. 2008:40). An interesting observation is that the positive association between natural capital and financial, human, and social capital is substantially stronger during the summer (February 2009). In most cases the effect size doubles when comparing the coefficients of NDVI for the winter with the summer season. This result confirms findings by Timko, Waeber, and Kozak (2010) regarding the importance of seasonality for natural resource extraction – and provides some evidence that natural capital may be fueling generation of other forms of livelihood capital. Again, though, definitive causal interpretation is beyond our data.
4.3 Cross-level interactions
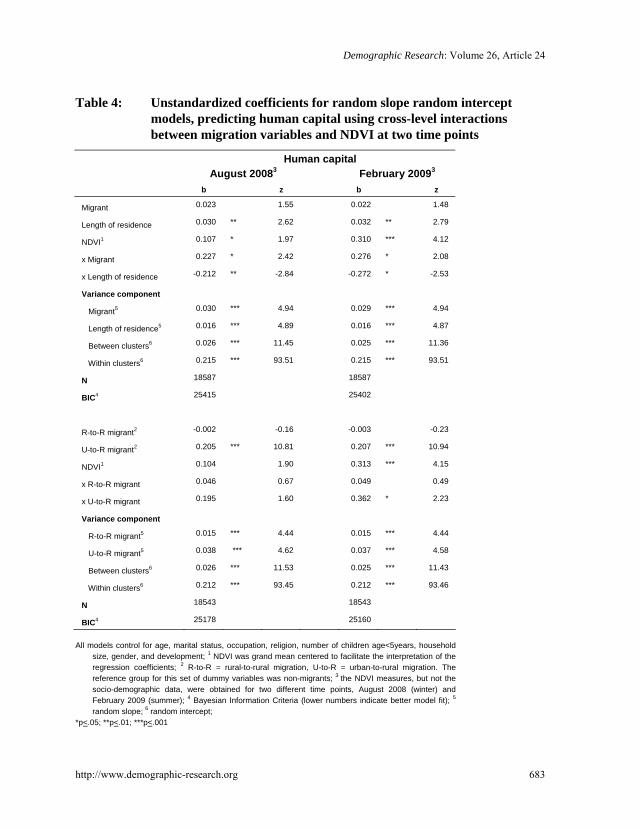
To investigate variation in the association between natural capital and other livelihood capitals across migrants and non-migrants, we included cross-level interactions between migration measures and NDVI in all models. For financial, physical, and social capital, these interactions were not significant. Therefore the difference between migrants and non-migrants with regard to these livelihood assets does not vary with the ‘greenness’ of the particular area. However, there were significant cross-level interactions for the models predicting human capital.
Table 4 shows that the human-capital difference between migrants and non-migrants is small for average green locations (NDVI=.47) as of August 2008. However, the interaction term indicates this difference is far greater for higher values of NDVI. A graphic visualization helps to describe this relationship (see Figure 2).
13 To investigate the influence of extreme values we re-estimated the financial capital model by omitting cases with values on the NDVI (August 2008) variable in the 1% and 99% percentiles. The NDVI effect size slightly decreased from b=.297 (z=2.49) to b=.273 (z=2.14) but remained significant. Therefore our findings are not influenced by natural capital outliers.
Demographic Research: Volume 26, Article 24
http://www.demographic-research.org 683
Table 4: Unstandardized coefficients for random slope random intercept models, predicting human capital using cross-level interactions between migration variables and NDVI at two time points
Human capital August 20083 February 20093 b z b z
Migrant 0.023 1.55 0.022 1.48
Length of residence 0.030 ** 2.62 0.032 ** 2.79
NDVI1 0.107 * 1.97 0.310 *** 4.12
x Migrant 0.227 * 2.42 0.276 * 2.08
x Length of residence -0.212 ** -2.84 -0.272 * -2.53
Variance component
Migrant5 0.030 *** 4.94 0.029 *** 4.94
Length of residence5 0.016 *** 4.89 0.016 *** 4.87
Between clusters6 0.026 *** 11.45 0.025 *** 11.36
Within clusters6 0.215 *** 93.51 0.215 *** 93.51
N 18587 18587
BIC4 25415 25402
R-to-R migrant2 -0.002 -0.16 -0.003 -0.23
U-to-R migrant2 0.205 *** 10.81 0.207 *** 10.94
NDVI1 0.104 1.90 0.313 *** 4.15
x R-to-R migrant 0.046 0.67 0.049 0.49
x U-to-R migrant 0.195 1.60 0.362 * 2.23
Variance component
R-to-R migrant5 0.015 *** 4.44 0.015 *** 4.44
U-to-R migrant5 0.038 *** 4.62 0.037 *** 4.58
Between clusters6 0.026 *** 11.53 0.025 *** 11.43
Within clusters6 0.212 *** 93.45 0.212 *** 93.46
N 18543 18543
BIC4 25178 25160
All models control for age, marital status, occupation, religion, number of children age<5years, household
size, gender, and development; 1 NDVI was grand mean centered to facilitate the interpretation of the regression coefficients; 2 R-to-R = rural-to-rural migration, U-to-R = urban-to-rural migration. The reference group for this set of dummy variables was non-migrants; 3 the NDVI measures, but not the socio-demographic data, were obtained for two different time points, August 2008 (winter) and February 2009 (summer); 4 Bayesian Information Criteria (lower numbers indicate better model fit); 5 random slope; 6 random intercept;
*p<.05; **p<.01; ***p<.001
Nawrotzki, Hunter & Dickinson: Differences between migrants and non-migrants in Madagascar
Source: Demographic and Health Survey for Madagascar 2008/2009
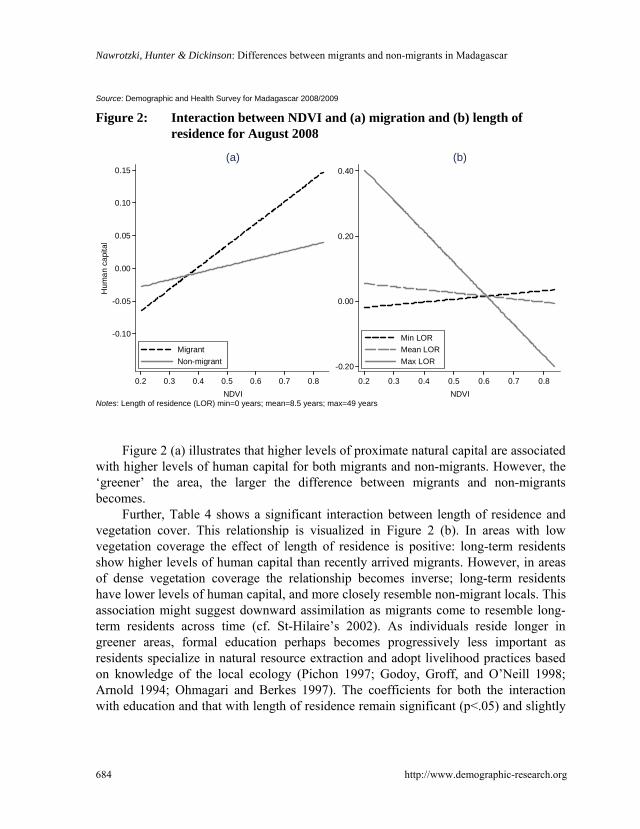
Figure 2: Interaction between NDVI and (a) migration and (b) length of residence for August 2008
-0.10
-0.05
0.00
0.05
0.10
0.15
Hum
an c
apita
l
0.2 0.3 0.4 0.5 0.6 0.7 0.8NDVI
MigrantNon-migrant
(a)
-0.20
0.00
0.20
0.40
0.2 0.3 0.4 0.5 0.6 0.7 0.8NDVI
Min LORMean LORMax LOR
(b)
Notes: Length of residence (LOR) min=0 years; mean=8.5 years; max=49 years
Figure 2 (a) illustrates that higher levels of proximate natural capital are associated
with higher levels of human capital for both migrants and non-migrants. However, the ‘greener’ the area, the larger the difference between migrants and non-migrants becomes.
Further, Table 4 shows a significant interaction between length of residence and vegetation cover. This relationship is visualized in Figure 2 (b). In areas with low vegetation coverage the effect of length of residence is positive: long-term residents show higher levels of human capital than recently arrived migrants. However, in areas of dense vegetation coverage the relationship becomes inverse; long-term residents have lower levels of human capital, and more closely resemble non-migrant locals. This association might suggest downward assimilation as migrants come to resemble long-term residents across time (cf. St-Hilaire’s 2002). As individuals reside longer in greener areas, formal education perhaps becomes progressively less important as residents specialize in natural resource extraction and adopt livelihood practices based on knowledge of the local ecology (Pichon 1997; Godoy, Groff, and O’Neill 1998; Arnold 1994; Ohmagari and Berkes 1997). The coefficients for both the interaction with education and that with length of residence remain significant (p<.05) and slightly
http://www.demographic-research.org 684
Demographic Research: Volume 26, Article 24
increase in effect size when greenness measures are used for February 2009 (summer), again suggesting an impact of seasonality on the observed associations.
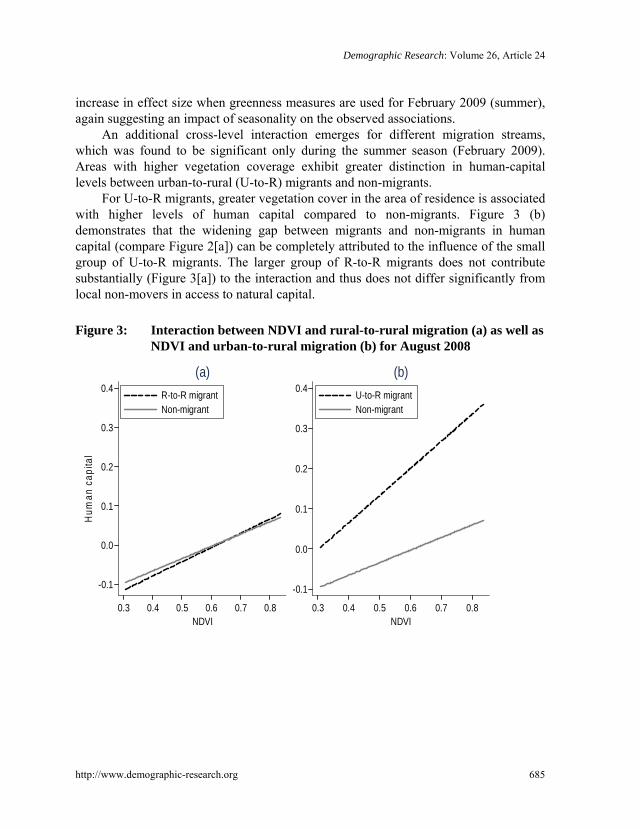
An additional cross-level interaction emerges for different migration streams, which was found to be significant only during the summer season (February 2009). Areas with higher vegetation coverage exhibit greater distinction in human-capital levels between urban-to-rural (U-to-R) migrants and non-migrants.
For U-to-R migrants, greater vegetation cover in the area of residence is associated with higher levels of human capital compared to non-migrants. Figure 3 (b) demonstrates that the widening gap between migrants and non-migrants in human capital (compare Figure 2[a]) can be completely attributed to the influence of the small group of U-to-R migrants. The larger group of R-to-R migrants does not contribute substantially (Figure 3[a]) to the interaction and thus does not differ significantly from local non-movers in access to natural capital.
Figure 3: Interaction between NDVI and rural-to-rural migration (a) as well as
NDVI and urban-to-rural migration (b) for August 2008
-0.1
0.0
0.1
0.2
0.3
0.4
Hum
an c
apita
l
0.3 0.4 0.5 0.6 0.7 0.8NDVI
R-to-R migrantNon-migrant
(a)
-0.1
0.0
0.1
0.2
0.3
0.4
0.3 0.4 0.5 0.6 0.7 0.8NDVI
U-to-R migrantNon-migrant
(b)
http://www.demographic-research.org 685
Nawrotzki, Hunter & Dickinson: Differences between migrants and non-migrants in Madagascar
http://www.demographic-research.org 686
5. Discussion and conclusions
In Madagascar, livelihood insecurity, as a result of adverse environmental conditions, is a critically important trigger of migration. Droughts, locust invasions, and cyclones deteriorate agriculture-dependent rural livelihoods and provoke large exoduses to more hospitable rural areas with the prospect of clearing forested areas to create new agro-pastoral land (Durbin et al. 2003, Elmqvist et al. 2007, Virah-Sawmy 2009).
To inform our understanding of the potential livelihood strategies of migrants and non-migrants in rural Madagascar, we present analyses of distinctions in available livelihood capital across these two groups. Given the centrality of natural resources to rural Malagasy livelihoods, we pay special attention to natural capital.
Results reveal that migrants tend to have higher levels of all forms of human, financial, and physical capital, compared to non-migrants. Our data do not allow for testing of whether these higher levels of livelihood capital are the result of migration, or were characteristic of the individuals prior to migration. Even so, they are in line with prior research suggesting migrants are positively selected, in the sense of typically possessing higher education and financial resources.
Given the central importance of natural resources in livelihoods within rural Madagascar, we focus also on natural capital. Interestingly, higher levels of proximate natural resources are associated with higher levels of financial, human, and social capital. Again, although our data do not allow for testing of the causal direction of these associations, the positive effect of natural capital suggests that perhaps households are able to tap into natural resources for income generation, also fueling acquisition of physical capital (e.g., phones, refrigerators) that further allow for livelihood diversification.
As to migrant/non-migrant distinction in levels of proximate natural capital, in areas endowed with relatively high levels of natural capital, migrants tend to have substantially higher levels of human capital as compared to non-migrants. We can tentatively evaluate this association from two perspectives. One explanation might suggest that highly educated migrants selectively move to particularly biodiverse areas to apply innovative knowledge of techniques for natural resource extraction learned in urban centers (Durbin et al. 2003). A more causal explanation might propose that migrants are more likely to use gains from natural capital to finance education (cf. de Sherbinin et al. 2008). However, empirical examination of such interpretation is left to future research.
This study makes important contributions in several arenas, while laying the groundwork for future analyses. The results offer insight into the distribution of various capitals, thereby shedding light on livelihood potential – a key finding being high levels of human capital among migrants within areas well-endowed with natural capital. This
Demographic Research: Volume 26, Article 24
http://www.demographic-research.org 687
improved understanding of distinctions in capital assets across population groups may be useful in the development of livelihood-enhancing programs. In this case, targeting rural migrants and long-term residents may be most appropriate, given their lower levels of livelihood capitals. Finally, although substantial research has explored differentials between migrants and non-migrants in origin areas – and the factors that may ‘select’ an individual into migration – far less is known about distinctions between these groups in destination regions. Here we reveal differences in livelihood capitals within migrant destination regions.
Despite these important contributions, a number of limitations deserve mention. A major constraint of this study is its cross-sectional nature. Livelihood strategies shift over time (Mahdi, Shivakoti, and Schmidt-Vogt 2009) and longitudinal social and environmental data would therefore be useful (cf. Henry et al. 2004). With regard to spatial influences, Entwisle (2007) emphasizes that time-dependent lagged effects may be stronger than contemporaneous effects. A longitudinal data set would also allow modeling the risk for migration (see for example Riosmena 2009) and the distinction between temporary and permanent moves.
In addition, the availability of variables in the DHS constrains construction of livelihood asset scales: the physical capital scale does not include communal assets such as access to roads or local infrastructure, and the social capital measure does not include social networks or relationships of trust. Among our outcome variables, social capital shows the greatest conceptual and measurement weakness, and we encourage researchers to investigate the social capital/natural capital/migration relationship by using a more comprehensive data set allowing for construction of a more robust social capital measure.
Finally, the livelihood capital measures are conceptually related and might influence each other. For example, human capital is likely to be a function of financial capital, since wealthier individuals can afford higher education. Higher educational attainments in turn provide better job opportunities with higher incomes that might be used to obtain physical assets. Possession of physical assets (especially production assets and tools) might then reduce the required labor input, freeing time that can be used for educational purposes.14
However, the analyses clearly show the importance of natural resources as a livelihood asset in rural Madagascar, regardless of migrant status. Therefore policies should be designed to protect the natural resource base while affording sustainable use.
14 To investigate whether a potential overlap affects the observed cross-level interactions, we included the financial and physical capital measures as predictors in the interaction models (not shown, available on request). Interestingly, when financial capital is included separately, the migrant x NDVI interaction (for February 2009 only) drops below significance, while all other interactions stay significant. However, if both financial and physical capital measures are included simultaneously, all interactions remain significant, which confirms the robustness of the reported relationships.
Nawrotzki, Hunter & Dickinson: Differences between migrants and non-migrants in Madagascar
http://www.demographic-research.org 688
Well-defined property rights could be an important starting point to maintain the current forest cover and prevent natural resource depletion (Elmqvist et al. 2007). Kull, Ibrahim, and Meredith (2007:229) point out that “tree planting is an officially recognized means of claiming vacant, communal land.” Therefore, designing a program that provides saplings at low cost and encourages tree planting might help to deal with unclear property rights and enhance resource availability for disadvantaged rural communities.
A number of forest protection policies are in the implementation stage and also deserve mention. A laudable conservation effort is the commitment of the Malagasy government in the 2003 Durban Vision to tripling the amount of protected area in Madagascar to 10% by creating a 6.0 million hectare network of terrestrial and marine reserves (Duffy 2006; Kull, Tassin, and Rangan 2007). Also, the legalization of private natural reserves, or aires protégées (Kull, Tassin, and Rangan 2007), is likely to improve the management and protection of forest areas and may provide tourism employment (Naughton-Treves, Holland, and Brandon 2005).
At the same time it is important to design conservation policies in ways that allow rural people to use natural resources within diverse livelihoods. One long-standing example combining conservation efforts with support of rural livelihoods is so-called integrated conservation and development projects (ICDPs). Although not without critics, ICDPs aim to establish core protected areas in which use is restricted, and to promote sustainable socioeconomic development and income generation in the surrounding areas (buffer zones), including ecotourism, agro forestry, and sustainable harvest of biological resources (Naughton-Treves, Holland, and Brandon 2005).
Another option for forest protection is outlined by Styger et al. (2007), who recommend intensifying and diversifying agriculture by improving soil fertility through optimized organic and inorganic inputs. Clearly, however, local cultural attitudes are key. For example, Tucker (2007) describes a case where a well-intended program that encouraged the replacement of maize, which requires slash-and-burn cultivation, with manioc, was not accepted by rural Malagasy.
Our findings suggest that urban-to-rural migrants may benefit disproportionately from access to natural resources, being able to transform these benefits into human capital. Qualitative studies would enhance our understanding of how urban-to-rural migrants make use of such resources, since the potential for unsustainable resource extraction is high. Indeed, Ingram, Whittaker, and Dawson (2005:792) argue that “local practices seem to have a lesser impact on tree communities than the practices of itinerant people.” In rural Madagascar migrants may in fact be disproportionately responsible for deforestation and thereby disruptive of traditional, more sustainable, production systems (Durbin et al. 2003). Indeed, a study by Casse et al. (2004) reports that migrants are frequently involved in maize cropping, a practice that requires large-
Demographic Research: Volume 26, Article 24
http://www.demographic-research.org 689
scale forest cover removal, and therefore has been found to be a major source of deforestation. If migration is fostering unsustainable natural resource extraction a wholly different set of policies and programs may be required to sustain rural livelihoods.
6. Acknowledgments
This project received funding and administrative support from the Institute of Behavioral Science at the University of Colorado, Boulder, and the University of Colorado Population Center (NICHD R24 HD066613). Special thanks to Richard G. Rogers, Elizabeth M. Lawrence, and three anonymous reviewers for helpful comments and suggestions on earlier drafts of this manuscript. We express our thanks to Nancy D. Mann for her careful editing and suggestions.
Nawrotzki, Hunter & Dickinson: Differences between migrants and non-migrants in Madagascar
http://www.demographic-research.org 690
References
Abrego, L. (2009). Economic well-being in Salvadoran transnational families: How gender affects remittance practices. Journal of Marriage and the Family 71(4): 1070-1085. doi:10.1111/j.1741-3737.2009.00653.x.
Adelman, R.M., Tsao, H., and Tolnay, S.E. (2006). Occupational disparity in a migrant metropolis: A case study of Atlanta. Sociological Spectrum 26(3): 269-287. doi:10.1080/02732170500541703.
Adeola, F.O. (2009). Katrina cataclysm: Does duration of residence and prior experience affect impacts, evacuation, and adaptation behavior among survivors? Environment and Behavior 41(4): 459-489. doi:10.1177/00139165 08316651.
AEO (2007). African economic outlook: Madagascar. Paris, France: AfDB/OECD.
Arnold, J.E.M. (1994). Non-farm employment in small-scale forest-based enterprises: Policy and environmental issues. Madison, WI: EPAT/MUCIA Research & Training University of Wisconsin-Madison (Working paper #11).
Barbieri, A.F. and Carr, D.L. (2005). Gender-specific out-migration, deforestation and urbanization in the Ecuadorian Amazon.Global and Planetary Change 47(2-4): 99-110. doi:10.1016/j.gloplacha.2004.10.005.
Bastia, T. (2007). From mining to garment workshops: Bolivian migrants in Buenos Aires. Journal of Ethnic and Migration Studies 33(4): 655-669. doi:10.1080/13691830701265628.
Béland, F., Birch, S., and Stoddart, G. (2002). Unemployment and health: Contextual-level influences on the production of health in populations. Social Science & Medicine 55(11): 2033-2052. doi:10.1016/S0277-9536(01)00344-6.
Bohra, P. and Massey, D.S. (2009). Processes of internal and international migration from Chitwan, Nepal. International Migration Review 43(3): 621-651. doi:10.1111/j.1747-7379.2009.00779.x.
Brown, S.K. and Bean, F.D. (2006). International migration. In: Posten, D. and Micklin, M. (eds.). Handbook of population. New York: Springer: 347-382.
Browning, H. and Feindt, W. (1969). Selectivity of migrants to a metropolis in a developing country: A Mexican case study. Demography 6(4): 347-357. doi:10.2307/2060082.
Demographic Research: Volume 26, Article 24
http://www.demographic-research.org 691
Bryceson, D.F. (2002). The scramble in Africa: Reorienting rural livelihoods. World Development 30(5): 725-739. doi:10.1016/S0305-750X(02)00006-2.
Buka, S.L., Brennan, R.T., Rich-Edwards, J.W., Raudenbush, S.W., and Earls, F. (2003). Neighborhood support and the birth weight of urban infants. American Journal of Epidemiology 157(1): 1-8. doi:10.1093/aje/kwf170.
Carney, D., Drinkwater, M., Rusinow, T., Neefjes, K., Wanmali, S., and Singh, N. (1999). Livelihoods approaches compared. London, UK: Department for International Development (DFID).
Casse, T., Milhoj, A., Ranaivoson, S., and Randriamanarivo, J. R. (2004). Causes of deforestation in southwestern Madagascar: What do we know? Forest Policy and Economics 6(1): 33-48. doi:10.1016/S1389-9341(02)00084-9.
Chambers, R. and Conway, G.R. (1991). Sustainable rural livelihoods: Practical concepts for the 21st century. Brighton: Institute for Development Studies (IDS Discussion paper #296).
Clarke, P. (2008). When can group level clustering be ignored? Multilevel models versus single-level models with sparse data. Journal of Epidemiology and Community Health 62(8): 752-758. doi:10.1136/jech.2007.060798.
Clarke, P. and Wheaton, B. (2007). Addressing data sparseness in contextual population research - Using cluster analysis to create synthetic neighborhoods. Sociological Methods & Research 35(3): 311-351. doi:10.1177/0049124106292362.
Cripps, G. (2009). Understanding migration among small-scale fishers in Madagascar. London: Blue Ventures Conservation (Report for ReCoMaP).
Curran, S. (2002). Migration, social capital, and the environment: Considering migrant selectivity and networks in relation to coastal ecosystems. Population and Development Review 28: 89-125.
Cutrona, C.E., Russell, D.W., Hessling, R.M., Brown, P.A., and Murry, V. (2000). Direct and moderating effects of community context on the psychological well-being of African American women. Journal of Personality and Social Psychology 79(6): 1088-1101. doi:10.1037/0022-3514.79.6.1088.
De Sherbinin, A., VanWey, L.K., McSweeney, K., Aggarwal, R., Barbieri, A., Henry, S., Hunter, L.M., Twine, W., and Walker, R. (2008). Rural household demographics, livelihoods and the environment. Global Environmental Change 18(1): 38-53. doi:10.1016/j.gloenvcha.2007.05.005.
Nawrotzki, Hunter & Dickinson: Differences between migrants and non-migrants in Madagascar
http://www.demographic-research.org 692
Dercon, S., De Weerdt, J., Bold, T., and Pankhurst, A. (2006). Group-based funeral insurance in Ethiopia and Tanzania. World Development 34(4): 685-703. doi:10.1016/j.worlddev.2005.09.009.
DHS (1996). Demographic and Health Survey: Sampling manual DHS-III Basic Documentation - 6. Calverton, MD: ICF Macro.
DHS (2008). Demographic and Health Survey: Description of the demographic and health surveys individual recode data file. Calverton, MD: ICF Macro.
DHS (2011). Demographic and Health Survey: GIS methodology: Collecting geographical data. Calverton, MD: ICF Macro, http://www.measuredhs.com/ aboutsurveys/gis/methodology.cfm.
Dovie, D.B.K., Shackleton, C.M., and Witkowski, E.T.F. (2002). Direct-use values of woodland resources consumed and traded in a South African village. International Journal of Sustainable Development and World Ecology 9(3): 269-283. doi:10.1080/13504500209470122.
Duffy, R. (2006). Non-governmental organisations and governance states: The impact of transnational environmental management networks in Madagascar. Environmental Politics 15(5): 731-749. doi:10.1080/09644010600937173.
Dufils, J.-M. (2003). Forest ecology: Remaining forest cover. In: Goodman, S.M. and Benstead, J.P. (eds.). The natural history of Madagascar. Chicago: University of Chicago Press: 88-96.
Durbin, J., Bernard, K., and Fenn, M. (2003). The role of socio-economic factors in the loss of Malagasy biodiversity. In: Goodman, S.M. and Benstead, J.P. (eds.). The natural history of Madagascar. Chicago: University of Chicago Press: 142-146.
Ellis, F. (1998). Household strategies and rural livelihood diversification. Journal of Development Studies 35(1): 1-38. doi:10.1080/00220389808422553.
Elmqvist, T., Pyykönen, M., Tengö, M., Rakotondrasoa, F., Rabakonandrianina, E., and Radimilahy, C. (2007). Patterns of loss and regeneration of tropical dry forest in Madagascar: The social institutional context. Plos One 2(5): 1-14. doi:10.1371/journal.pone.0000402.
Entwisle, B. (2007). Putting people into place. Demography 44(4): 687-703. doi:10.1353/dem.2007.0045.
Ezra, M. (2001). Ecological degradation, rural poverty, and migration in Ethiopia: A contextual analysis. New York: Population Council, Policy Research Division (Working Paper #149).
Demographic Research: Volume 26, Article 24
http://www.demographic-research.org 693
Foody, G.M., Cutler, M.E., McMorrow, J.,Pelz, D., Tangki, H., Boyd, D.S., and Douglas, I. (2001). Mapping the biomass of Bornean tropical rain forest from remotely sensed data. Global Ecology and Biogeography 10(4): 379-387. doi:10.1046/j.1466-822X.2001.00248.x.
Fussell, E., and Massey, D.S. (2004). The limits to cumulative causation: International migration from Mexican urban areas. Demography 41(1): 151-171. doi:10.1353/ dem.2004.0003.
Gelman, A., and Hill, J. (2007). Data analysis using regression and multilevel/hierarchical models. New York: Cambridge University Press.
Godoy, R., Groff, S., and O'Neill, K. (1998). The role of education in neotropical deforestation: Household evidence from Amerindians in Honduras. Human Ecology 26(4): 649-675. doi:10.1023/A:1018753510048.
Golden, C.D. (2009). Bushmeat hunting and use in the Makira Forest, north-eastern Madagascar: A conservation and livelihoods issue. Oryx 43(3): 386-392. doi:10.1017/S0030605309000131.
Gwatkin, D.R., Rutstein, S., Johnson, K., Suliman, E., Wagstaff, A., and Amouzou, A. (2007). Socio-economic differences in health, nutrition, and population within developing countries: An overview. Washington, D.C.: The World Bank.
Hagan, J.M. (1998). Social networks, gender, and immigrant incorporation: Resources and constraints. American Sociological Review 63(1): 55-67. doi:10.2307/2657477.
Henry, S., Schoumaker, B., and Beauchemin, C. (2004). The impact of rainfall on the first out-migration: A multi-level event-history analysis in Burkina Faso. Population and Environment 25(5): 423-460. doi:10.1023/B:POEN.000003692 8.17696.e8.
Heston, A., Summers, R., and Aten, B. (2009). Penn world table [version 6.3]. Philadelphia, PA: Center for International Comparisons of Production, Income and Prices at the University of Pennsylvania.
Hunter, L.M., Twine, W., and Johnson, A. (2011). Adult mortality and natural resource use in rural South Africa: Evidence from the Agincourt health and demographic surveillance site. Society and Natural Resources 24(3): 256-275. doi:10.1080/ 08941920903443327.
Hunter, L.M., Twine, W., and Patterson, L. (2007). ’Locusts Are Now Our Beef’: Adult mortality and household dietary use of local environmental resources.
Nawrotzki, Hunter & Dickinson: Differences between migrants and non-migrants in Madagascar
http://www.demographic-research.org 694
Scandinavian Journal of Public Health 35 (Suppl. 69): 165-174. doi:10.1080/ 14034950701356385.
Ingram, J.C., Whittaker, R.J., and Dawson, T.P. (2005). Tree structure and diversity in human-impacted littoral forests, Madagascar. Environmental Management 35(6): 779-798. doi:10.1007/s00267-004-0079-9.
Islam, M.M. and Azad, K. (2008). Rural-urban migration and child survival in urban Bangladesh: Are the urban migrants and poor disadvantaged? Journal of Biosocial Science 40(1): 83-96. doi:10.1017/S0021932007002271.
Jimenez, T.R. (2011). Immigrants in the United States: How well are they integrating into society? Washington, DC: Migration Policy Institute.
Jury, M.R. (2003). The climate of Madagascar. In: Goodman, S.M. and Benstead, J.P. (eds.). The natural history of Madagascar. Chicago: University of Chicago Press: 75-87.
Kull, C.A. (2002). Madagascar aflame: Landscape burning as peasant protest, resistance, or a resource management tool? Political Geography 21(7): 927-953. doi:10.1016/S0962-6298(02)00054-9.
Kull, C.A., Ibrahim, C.K., and Meredith, T.C. (2007). Tropical forest transitions and globalization: Neo-liberalism, migration, tourism, and international conservation agendas. Society & Natural Resources 20(8): 723-737. doi:10.1080/08941 920701329702.
Kull, C.A., Tassin, J., and Rangan, H. (2007). Multifunctional, scrubby, and invasive forests? Wattles in the highlands of Madagascar. Mountain Research and Development 27(3): 224-231. doi:10.1659/mrd.0864.
Leckie, G. and Charlton, C. (2011). runmlwin: Stata module for fitting multilevel models in the MLwiN software package. Bristol, UK: Center for Multilevel Modelling, University of Bristol.
Lindstrom, D.P. and Ramirez, A. (2010). Pioneers and followers: Migrant selectivity and the development of U.S. migration streams in Latin America. Annals of the American Academy of Political and Social Sciences 630: 53-77. doi:10.1177/0002716210368103.
LPDAAC (2011). Land Processes Distributed Active Archive Center: MODIS Terra Vegetation Indices (NDVI) 16-Day L3 Global 500m SIN Grid V005 (MOD13A1). [electronic resource]. Sioux Falls, SD: U.S. Geological Survey
Demographic Research: Volume 26, Article 24
http://www.demographic-research.org 695
(USGS) Earth Resources Observation and Science (EROS) Center.www.lpdaac.usgs.gov.
Luke, D.A. (2004). Multilevel modeling. Sage university papers series: Quantitative applications in the social sciences. Thousand Oaks, CA: Sage Publications.
Maas, C.J.M., and Hox, J.J. (2005). Sufficient sample sizes for multilevel modeling. Methodology 1(3): 86-92. doi:10.1027/1614-2241.1.3.85.
Mahdi, S.G., Shivakoti, G.P., and Schmidt-Vogt, D. (2009). Livelihood change and livelihood sustainability in the uplands of Lembang subwatershed, West Sumatra, Indonesia, in a changing natural resource management context. Environmental Management 43(1): 84-99. doi:10.1007/s00267-008-9142-2.
Massey, D.S. (1990). Social-structure, household strategies, and the cumulative causation of migration. Population Index 56(1): 3-26. doi:10.2307/3644186.
Massey, D.S., Arango, J., Hugo, G., Kouaouci, A., Pellegrino, A., and Taylor, E.J. (1998). Worlds in motion: Understanding international migration at the end of the millennium. Oxford: Oxford University Press.
Massey, D.S., Axinn, W.G., and Ghimire, D.J. (2010). Environmental change and out-migration: Evidence from Nepal. Population and Environment 32(2-3): 109-136. doi:10.1007/s11111-010-0119-8.
Massey, D.S. and Espinosa, K.E. (1997). What's driving Mexico-US migration? A theoretical, empirical, and policy analysis. American Journal of Sociology 102(4): 939-999. doi:10.1086/231037.
Mberu, B.U. (2006). Internal migration and household living conditions in Ethiopia. Demographic Research 14(21): 509-539. doi:10.4054/DemRes.2006.14.21.
Montana, L. and Spencer, J. (2004). Incorporating geographic information into measure surveys: A field guide to GPS data collection. Chapel Hill, NC: The University of North Carolina at Chapel Hill, Carolina Population Center.
Morgan, P.S. and Hagewen, K.J. (2006). Fertility. In: Poston, D.L. and Micklin, M. (eds.). Handbook of population. New York: Springer: 229-249.
Mutanga, O. and Skidmore, A.K. (2004). Narrow band vegetation indices overcome the saturation problem in biomass estimation. International Journal of Remote Sensing 25(19): 3999-4014. doi:10.1080/01431160310001654923.
Nawrotzki, Hunter & Dickinson: Differences between migrants and non-migrants in Madagascar
http://www.demographic-research.org 696
Mutenje, M.J., Ortmann, G.F., Ferrer, S.R.D., and Darroch, M.A.G. (2010). Rural livelihood diversity to manage economic shocks: Evidence from south-east Zimbabwe. Agrekon 49(3): 338-357. doi:10.1080/03031853.2010.503381.
Naughton-Treves, L., Holland, M.B., and Brandon, K. (2005).The role of protected areas in conserving biodiversity and sustaining local livelihoods. Annual Review of Environment and Resources 30: 219-252. doi:10.1146/annurev.energy.30.050 504.164507.
Ohmagari, K. and Berkes, F. (1997). Transmission of indigenous knowledge and bush skills among the Western James Bay Cree women of subarctic Canada. Human Ecology 25(2): 197-222. doi:10.1023/A:1021922105740.
Paumgarten, F. (2005). The role of non-timber forest products as safety-nets: A review of evidence with a focus on South Africa. GeoJournal 64(3):189-197. doi:10.1007/s10708-005-5647-x.
Pereira, T., Shackleton, C., and Shackleton, S. (2006). Trade in reed-based craft products in rural villages in the Eastern Cape, South Africa. Development Southern Africa 23(4): 477-495. doi:10.1080/03768350600927235.
Pichon, F.J. (1997). Colonist land-allocation decisions, land use, and deforestation in the Ecuadorian Amazon frontier. Economic Development and Cultural Change 45(4): 707-744. doi:10.1086/452305.
Qin, H. (2010). Rural-to-Urban Labor Migration, Household Livelihoods, and the Rural Environment in Chongqing Municipality, Southwest China. Human Ecology 38(5): 675-690. doi:10.1007/s10745-010-9353-z.
QMM. (2001). QIT-Madagascar Minerals: Social and environmental impact assessment. Montreal, Canada: QIT Madagascar Minerals South Africa.
Quiroz-Carranza, J. and Orellana, R. (2010).Use and management of firewood in dwellings of six localities from Yucatan, Mexico. Madera Y Bosques 16(2): 47-67.
Rabe, B. (2011). Dual-earner migration. Earnings gains, employment and self-selection. Journal of Population Economics 24(2): 477-497. doi:10.1007/s00148-009-0292-1.
Rasbash, J., Charlton, C., Browne, W.J., Healy, M., and Cameron, B. (2009). MLwiN Version 2.1. Bristol, UK: Center for Multilevel Modelling, University of Bristol.

Demographic Research: Volume 26, Article 24
http://www.demographic-research.org 697
Riosmena, F. (2009). Socioeconomic context and the association between marriage and Mexico-US migration. Social Science Research 38(2): 324-337. doi:10.1016/j.ss research.2008.12.001.
Roerink, G.J., Menenti, M., Soepboer, W., and Su, Z. (2003). Assessment of climate impact on vegetation dynamics by using remote sensing. Physics and Chemistry of the Earth 28(1-3): 103-109. doi:10.1016/S1474-7065(03)00011-1.
Rutstein, S.O. and Johnson, K. (2004). The DHS wealth index. Calverton, MD: ORC Macro (DHS Comparative Reports #6).
Saenz, R. and Morales, M.C. (2006). Demography of race and ethnicity. In: Poston, D.L. and Micklin, M. (eds.). Handbook of population. New York: Springer: 169-208.
Shackleton, C. and Shackleton, S. (2004). The importance of non-timber forest products in rural livelihood security and as safety nets: A review of evidence from South Africa. South African Journal of Science 100(11-12): 658-664.
Snijders, T.A.B. and Bosker, R. (1999). Multilevel analysis: An introduction to basic and advanced multilevel modeling. London: Sage Publications Ltd.
Stark, O. (1991). The migration of labor. Cambridge, UK: Basil Blackwell.
St-Hilaire, A. (2002). The social adaptation of children of Mexican immigrants: Educational aspirations beyond junior high school. Social Science Quarterly 83(4): 1026-1043. doi:10.1111/1540-6237.00131.
Styger, E., Rakotondramasy, H.M., Pfeffer, M.J., Fernandes, E.C.M., and Bates, D.M. (2007). Influence of slash-and-burn farming practices on fallow succession and land degradation in the rainforest region of Madagascar. Agriculture Ecosystems & Environment 119(3-4): 257-269. doi:10.1016/j.agee.2006.07.012.
Subramanian, S.V., Jones, K., Kaddour, A., and Krieger, N. (2009). Revisiting Robinson: The perils of individualistic and ecologic fallacy. International Journal of Epidemiology 38(2): 342-360.doi:10.1093/ije/dyn359.
Takenaka, A. and Pren, K.A. (2010). Determinants of emigration: Comparing migrant's selectivity from Peru and Mexico. Annals of the American Academy of Political and Social Science 630(1): 178-193. doi:10.1177/0002716210368109.
Timko, J.A., Waeber, P.O., and Kozak, R.A. (2010). The socio-economic contribution of non-timber forest products to rural livelihoods in Sub-Saharan Africa: Knowledge gaps and new directions. International Forestry Review 12(3): 284-294. doi:10.1505/ifor.12.3.284.
Nawrotzki, Hunter & Dickinson: Differences between migrants and non-migrants in Madagascar
http://www.demographic-research.org 698
Tucker, B. (2007). Applying behavioral ecology and behavioral economics to conservation and development planning: An example from the Mikea forest, Madagascar. Human Nature: An Interdisciplinary Biosocial Perspective 18(3): 190-208.
Tucker, C.J. (1979). Red and photographic infrared linear combinations for monitoring vegetation. Remote Sensing of Environment 8(2): 127-150. doi:10.1016/0034-4257(79)90013-0.
UN (2003). World statistics pocketbook: Least developed countries. New York: United Nations.
Virah-Sawmy, M. (2009). Ecosystem management in Madagascar during global change. Conservation Letters 2(4): 163-170. doi:10.1111/j.1755-263X.2009.000 66.x.
Wang, J., Rich, P.M., and Price, K.P. (2003). Temporal responses of NDVI to precipitation and temperature in the central Great Plains, USA. International Journal of Remote Sensing 24(11): 2345-2364. doi:10.1080/0143116021015 4812.
Wang, J., Rich, P.M., Price, K.P., and Kettle, W.D. (2004). Relations between NDVI and tree productivity in the central Great Plains. International Journal of Remote Sensing 25(16): 3127-3138. doi:10.1080/0143116032000160499.
Wang, S. and Lo, L. (2005). Chinese immigrants in Canada: Their changing composition and economic performance. International Migration 43(3): 35-71. doi:10.1111/j.1468-2435.2005.00325.x.
White, M.J. and Lindstrom, D.P. (2006). Internal migration. In: Poston, D.L. and Micklin, M. (eds.). Handbook of population. New York: Kluwer Academic Publishers: 311-346.
Yaro, J.A. (2006). Is deagrarianisation real? A study of livelihood activities in rural northern Ghana. Journal of Modern African Studies 44(1): 125-156. doi:10.1017/S0022278X05001448.
Zhou, L., Kaufmann, R.K., Tian, Y., Myneni, R.B., and Tucker, C.J. (2003). Relation between interannual variations in satellite measures of northern forest greenness and climate between 1982 and 1999.Journal of Geophysical Research-Atmospheres 108(D1): 1-19.
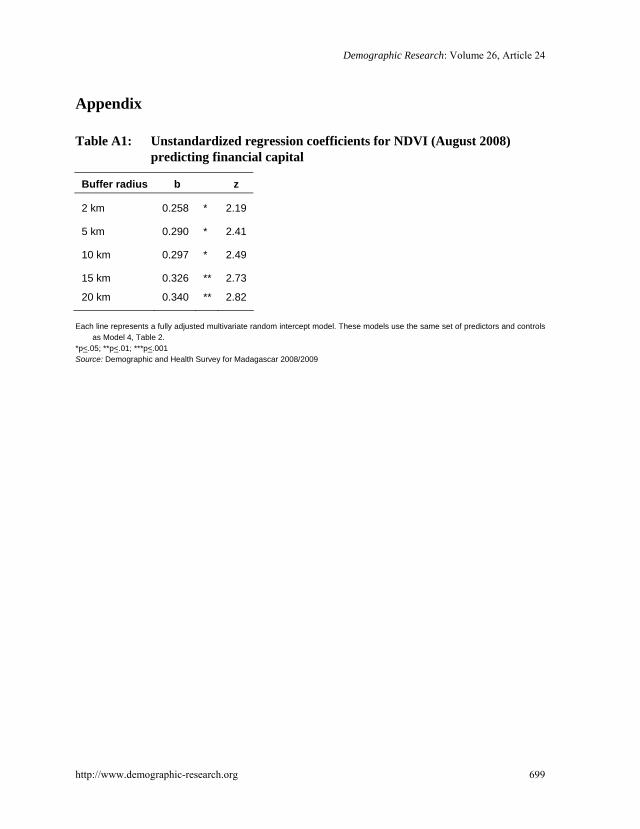
Demographic Research: Volume 26, Article 24
http://www.demographic-research.org 699
Appendix
Table A1: Unstandardized regression coefficients for NDVI (August 2008) predicting financial capital
Buffer radius b z
2 km 0.258 * 2.19
5 km 0.290 * 2.41
10 km 0.297 * 2.49
15 km 0.326 ** 2.73
20 km 0.340 ** 2.82 Each line represents a fully adjusted multivariate random intercept model. These models use the same set of predictors and controls
as Model 4, Table 2. *p<.05; **p<.01; ***p<.001 Source: Demographic and Health Survey for Madagascar 2008/2009
Nawrotzki, Hunter & Dickinson: Differences between migrants and non-migrants in Madagascar
http://www.demographic-research.org 700