Embed Size (px)
Citation preview

Rural Wetland Functions and Protection:
A Case Study
by
Doug Littauer
A Thesis
Submitted in partial fulfillment
of the requirements for the degree
Master of Environmental Studies
The Evergreen State College
March 2011

This Thesis for the Master of Environmental Studies Degree
by
Doug Littauer
has been approved for
The Evergreen State College
by
________________________
Paul Butler, PhD
________________________
Date

Abstract:
Rural Wetland Functions and Protection: A Case Study
Wetlands in rural areas are subject to a wide array of stressors that have the potential
to limit the functions they provide. The case-study wetland was selected because its
hydrogeomorphic properties, vegetation communities, size, and adjacent land-use
activities are common in the Henderson Inlet region of south Puget Sound in western
Washington. The case-study wetland was delineated using current, nationally
accepted methods, rated according to a method provided by the Washington State
Department of Ecology, and wetland functions were determined using a recently
developed technique. The same functional analysis was used to determine which
ecological services are limited by adjacent land-use activities. Analysis determined
that the current wetland management policies may not provide adequate protection to
maintain or restore the condition of the impacted receiving waters of Henderson Inlet.

iv
Table of Contents:
1. Introduction……………………………………………………...………………….1
2. Methodology...……………………………………………………………………...8
3. Results……………………………………………………………………………..36
4. Conclusion……...………………………………………………………………....54
5. References…………………………………………………………………………60

v
List of Figures:
Figure 1. Case Study Wetland Location……………………………………………....2
Figure 2. Topography of Surrounding Area………………………………...………...3
Figure 3. Soils of Study Area……………………………………………………….....4
Figure 4. Case Study Wetland Boundary and Sample Point Locations……………...18
List of Tables:
Table 1. Wetland Indicator Status Definitions…………………………..…………...21
Table 2. Scores of Grouped Functions……………………………………………….47

vi
Acknowledgments
I would like to thank my primary reader Dr. Paul Butler for his assistance in
completing this project.

1
1. Introduction
Wetlands are transitional ecosystems separating upland from aquatic eco-
systems. Individual wetlands may possess a wide range of vegetative characteristics,
soil composition, and hydrologic regimes. These unique areas provide many valuable
functions, including: improving water quality, providing important habitat for
wildlife, protecting infrastructure from flood damage, maintaining groundwater
supplies, and many other processes that are beneficial to human beings (Mitch and
Gosselink 2007). The value of wetlands to society, as well as their ecological
importance, necessitates regulatory protection in order to ensure that these resources
continue to contribute these important services.
Due to the important functions they provide, as well as their sensitivity to
disturbance, wetlands are managed under a variety of local, state, and federal
regulations that aim to avoid, minimize, and replace any unavoidable losses of
wetland area and function. The Clean Water Act serves as a Federal regulatory
mechanism that aims to protect wetlands and requires the replacement of impacted
wetlands (EPA 1972).
Wetlands in rural areas are subject to a wide array of stressors caused by
common land-use activities. Forest clearing, stream channelization, mowing
grasslands, and the presence of livestock and pets can potentially alter the ability of
wetlands to perform these ecological services (Sheldon et al. 2005). This paper
presents a thorough description of a specific wetland unit, and discusses the
regulations that aim to protect its ecological integrity. Analysis will focus on the
ecological impacts to the wetland that could potentially occur from permitted land-

2
Figure 1: Case study wetland location
background data from Washington State
Department of Transportation. (2010).
WSDOT GeoData Distribution Site.
use activities. Results will present important information regarding the size,
uniqueness, and level of ecological services provided by the case-study wetland, as
well as the functions that are limited by land-use activities occurring within the study
area.
This case study had two related
objectives. The first involved a
detailed characterization of the case-
study wetland. To achieve this
objective, the case-study wetland was
subject to a variety of methods that
provided accurate assessments of
wetland boundaries, vegetation
community structure, watershed
position, and characteristics that make
it unique. The second objective was to
identify potential activities that are
common in the watershed of the case-study wetland that are potentially limiting the
functions that the wetland provides. The results will provide insight concerning how
common land-use practices limit the functions provided by wetlands like the case-
study wetland.
The case-study wetland occurs in the Puget Trough physiographic region of
western Washington (Figure 1). . More specifically, the wetland is located in
northern Thurston County, within the Henderson Inlet watershed. The topography of

3
the area is primarily the result of the Puget Lobe of the Cordilleran ice sheet, which
covered the area approximately 18,000 years ago, and retreated around 14,000 years
ago (Waitt 1983). Many isolated
wetlands have formed in valleys and
depressions left by retreating ice and
associated fluvial processes.
The assessment area consists
of the case-study wetland and the
immediately surrounding uplands.
This area is located in a shallow north-
south oriented valley. The case-study
wetland is one of a series of wetlands
that comprise a complex of wetlands
and seasonal streams that originate on
the southern aspect of a minor hill, drain to the south and southwest, and eventually
terminate in Henderson Inlet (Figure 2).
The vegetation belongs to the western hemlock vegetation zone (Franklin and
Dyrness 1973). Dominant forest vegetation in the assessment area is comprised of
western hemlock and western red cedar. The forest surrounding the assessment area
is dominated by big-leaf maple and Douglas fir. The assessment area, including the
case study wetland, also contains both scrub-shrub and emergent vegetation
communities that will be described in greater detail in the wetland delineation results
discussion.
Figure 2: Topography of surrounding area
Background data from TopoQuest (2010)

4
Figure 3: Soils of case study wetland and surrounding
area. Soils data from Washington State Department
of Natural Resources (2010)
Soils in the study area are mapped as Kapowsin silt loam 3 – 15 percent
slopes (Figure 3), and the surface elevation of the case-study wetland is between 62.5
to 64 meters above sea level. Wetlands similar to the case-study wetland are common
features of the glacially influenced landscape. According to the National Wetlands
Inventory (NWI), there are several (four) wetlands within 1000 meters of the case-
study wetland (Thurston County 2010). The case-study wetland does not appear on
the NWI or Thurston County Assessor‟s maps, likely due to its small size and relative
isolation
The case-study location was
selected because it is typical of rural
wetlands in several ways, and
unlimited access to the entire wetland
was available, which facilitated field
investigations. The case-study
wetland occurs in a geomorphic
setting that is common to the region.
As previously discussed, the glacial
activity in Puget Sound lowland
areas has left the landscape with
networks of isolated depressional
wetlands. While the case- study
wetland is somewhat difficult to

5
classify based on hydrogeomorphic position, is does occur within a depression
containing a seasonal watercourse.
The vegetation in the case-study wetland and the surrounding upland buffer is
typical of forest wetlands in the area. All species that occur within the assessment
area are common to the Puget Sound region (Cooke 1997; Hitchcock et al. 1973). In
addition to the native vegetation, this wetland has communities of ecologically
undesirable invasive non-native species. Purple loosestrife (Lythrum salicaria) and
Himalayan blackberry (Rubus armeniacus) are both widespread invasive species
common in and around freshwater wetlands in this region. Both of these species are
present in the case-study wetland and are capable of out-competing and displacing
native species, and reducing the diversity of the vegetation communities (Whitson et
al. 2005).
Due to the resolution of images used in the National Wetland Inventory, most
wetlands that are included are larger than the case study wetland, which has an area of
0.04 hectare (0.09 acre). Because of the glacially influenced topography, however, it
is reasonable to assume that wetlands of this approximate size are common landscape
features of the region.
Rural wetlands that are surrounded by residential land uses are subject to
ecological stressors capable of changing the functions that a wetland can provide.
Land uses common in rural settings, for example hobby farms and orchards, can
contribute excess nutrients and toxicants to surface water. Water-quality functions
(the ability of wetlands to remove sediments, nitrates, phosphates, etc. from surface
water) are one of the most important ecological services that rural wetlands can

6
provide. The contributing area of the case-study wetland likely transports fertilizers,
bacteria from failing septic tanks and animal waste, and other potentially problematic
compounds into the wetland, where it has the opportunity to remove or retain them.
Factors that determine a wetland‟s effectiveness to improve water quality will be
discussed in greater detail in the following section.
Henderson
Inlet, the receiving water of the case-study wetland, has been impacted by
water-quality issues (Davis et al 2002). Commercial shellfish harvesting has been
conditionally closed due to fecal coliform bacteria. Although sampling determined
that most of the contamination is entering the inlet from two of its major tributaries
located in more urban parts of the watershed (Davis et al 2002), the ecological
integrity of wetlands like the case-study wetland, along with the restoration of
degraded wetlands in the more urban parts of the watershed, is imperative to
maintaining the aquatic health of this region, the southernmost extent of Puget Sound.
Because wetland functions are extremely complicated processes that often
rely on geochemical interactions between soil and water, they are extremely difficult
to measure directly (Sheldon et al. 2003). Instead, rapid wetland functional
assessment methods rely heavily on the presence of structural indicators, as well as
accessible information about the general area, to reveal the effectiveness of a wetland
to provide one or several ecological services.
This analysis will utilize such a functional-assessment method to determine
which functions (and their effectiveness) are provided by the case-study wetland.
Land-use activities in the contributing area will be determined using aerial

7
photographs, and their impact on the ecological integrity of the case-study wetland
will be determined using the functional assessment.
8
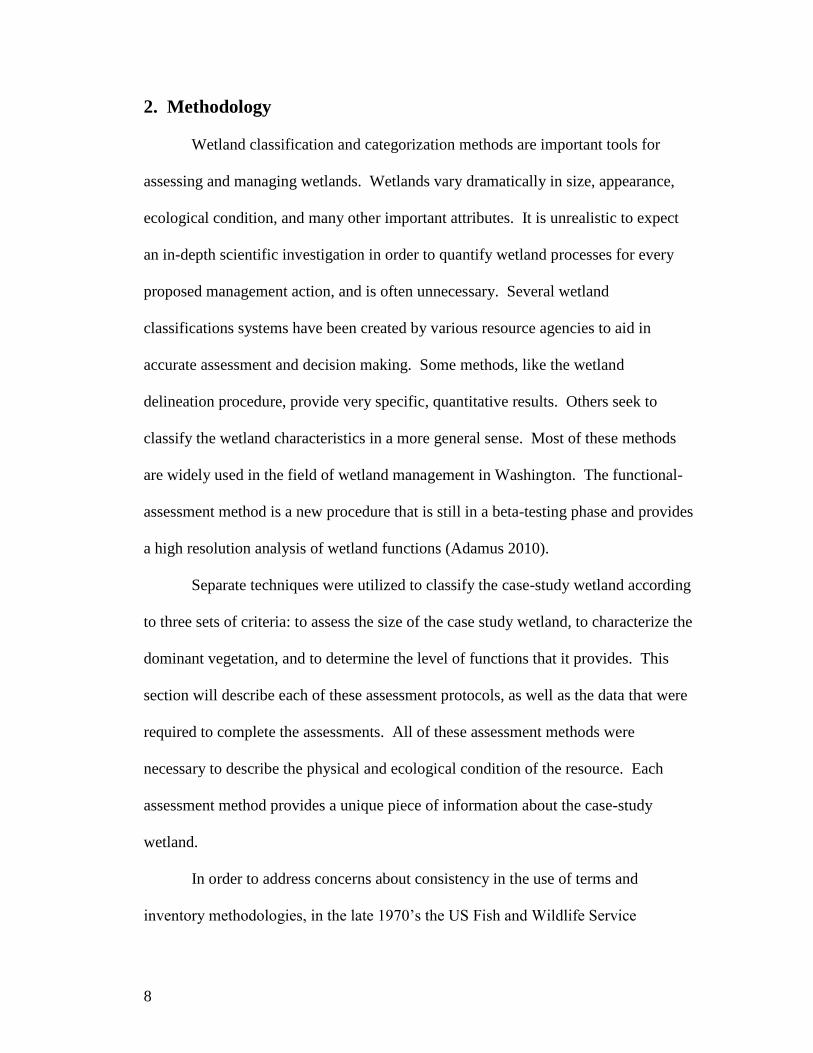
2. Methodology
Wetland classification and categorization methods are important tools for
assessing and managing wetlands. Wetlands vary dramatically in size, appearance,
ecological condition, and many other important attributes. It is unrealistic to expect
an in-depth scientific investigation in order to quantify wetland processes for every
proposed management action, and is often unnecessary. Several wetland
classifications systems have been created by various resource agencies to aid in
accurate assessment and decision making. Some methods, like the wetland
delineation procedure, provide very specific, quantitative results. Others seek to
classify the wetland characteristics in a more general sense. Most of these methods
are widely used in the field of wetland management in Washington. The functional-
assessment method is a new procedure that is still in a beta-testing phase and provides
a high resolution analysis of wetland functions (Adamus 2010).
Separate techniques were utilized to classify the case-study wetland according
to three sets of criteria: to assess the size of the case study wetland, to characterize the
dominant vegetation, and to determine the level of functions that it provides. This
section will describe each of these assessment protocols, as well as the data that were
required to complete the assessments. All of these assessment methods were
necessary to describe the physical and ecological condition of the resource. Each
assessment method provides a unique piece of information about the case-study
wetland.
In order to address concerns about consistency in the use of terms and
inventory methodologies, in the late 1970‟s the US Fish and Wildlife Service
9
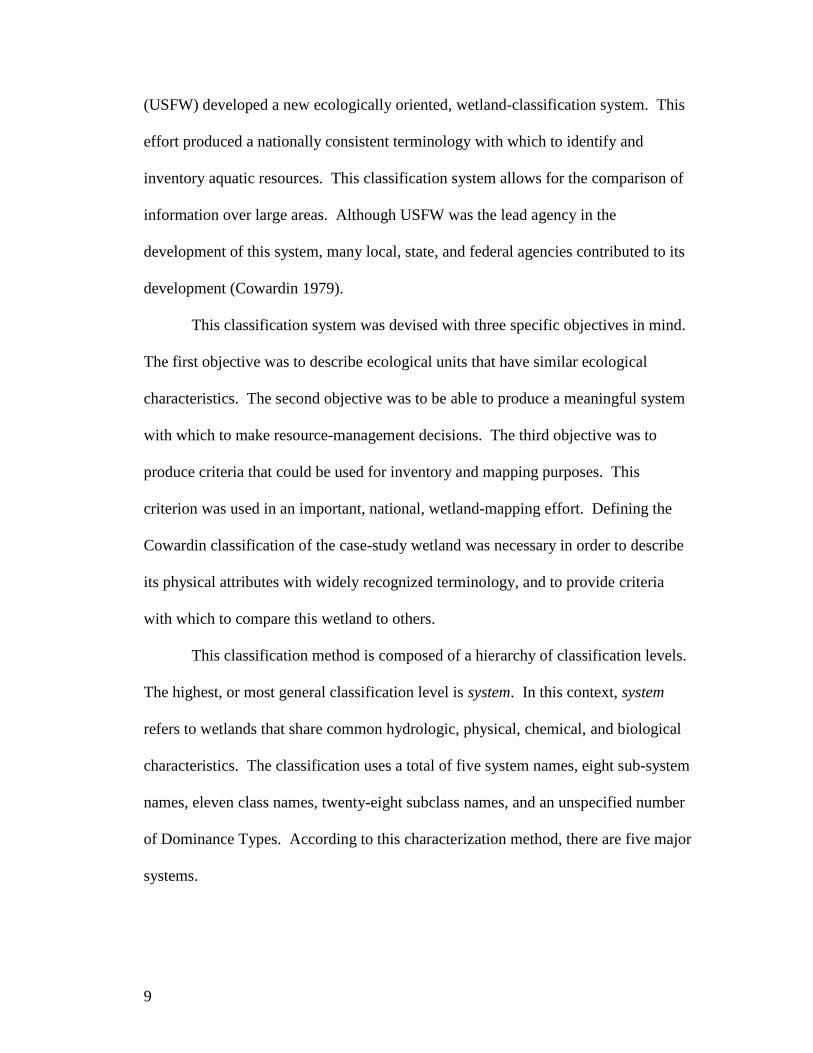
(USFW) developed a new ecologically oriented, wetland-classification system. This
effort produced a nationally consistent terminology with which to identify and
inventory aquatic resources. This classification system allows for the comparison of
information over large areas. Although USFW was the lead agency in the
development of this system, many local, state, and federal agencies contributed to its
development (Cowardin 1979).
This classification system was devised with three specific objectives in mind.
The first objective was to describe ecological units that have similar ecological
characteristics. The second objective was to be able to produce a meaningful system
with which to make resource-management decisions. The third objective was to
produce criteria that could be used for inventory and mapping purposes. This
criterion was used in an important, national, wetland-mapping effort. Defining the
Cowardin classification of the case-study wetland was necessary in order to describe
its physical attributes with widely recognized terminology, and to provide criteria
with which to compare this wetland to others.
This classification method is composed of a hierarchy of classification levels.
The highest, or most general classification level is system. In this context, system
refers to wetlands that share common hydrologic, physical, chemical, and biological
characteristics. The classification uses a total of five system names, eight sub-system
names, eleven class names, twenty-eight subclass names, and an unspecified number
of Dominance Types. According to this characterization method, there are five major
systems.

10
Categories such as marine, estuarine, riverine, lacustrine, and palustrine have
been long recognized as important distinctions between aquatic resources, but
methods to define the boundary between these different resource types have not been
widely agreed upon. This classification system provides practical methods to
determine the limits of all wetland systems.
Class is the next taxonomic level in this classification system and describes
the general appearance of the wetland in terms of dominant habitat type,
geomorphology, or substrate type. These characteristics are readily apparent and do
not require in-depth field investigations to distinguish. The class of vegetated
wetlands is typically determined by the nature of the life forms (trees, shrubs,
emergents, mosses, and lichens) that are present. Vegetation is an important
classification attribute because plants are easily distinguished and plant assemblages
are slow to change.
The next classification level in this system is subclass. This level further
defines the class based on vegetative characteristics like broad-leaved deciduous,
broad-leaved evergreen, needle-leaved evergreen, or dead. If no vegetation is
present, the subclass is determined based on dominant substrate characteristics such
as sand, mud, or unconsolidated bottom.
This classification system is flexible and can be used at a variety of scales.
Levels below class can be expanded as required by the user. Classification to the sub-
class level is typically possible using readily available aerial imagery and is the most
commonly used method for this classification system. A dichotomous key provided
in this document was used to determine the system, class, and sub-class of the case-

11
study wetland. This characterization provides an important tool when comparing the
vegetative structure of wetlands. Somewhat similar to the Cowardin classification
system, the hydrogeomorphic approach to wetland classification provides useful
information with which to compare wetlands based primarily on hydrologic attributes
(Brinson 1993).
Wetland ecologists continue to investigate how to group wetland types based
on the functions provided. It is accepted that to a large degree hydrologic and
geomorphic characteristics determine how a specific wetland functions (Brinson
1993). For this reason, a classification system was developed that groups wetlands by
landscape position and hydrologic properties.
The Hydrogeomorphic, or HGM approach, to characterizing wetland
functions is a multi-agency project with major contributions from the U.S. Army
Corps of Engineers, the Environmental Protection Agency, the Federal Highways
Administration, the Natural Resources Conservation Service, and the U.S. Fish and
Wildlife Service. This classification system (Cowardin et al 1979) establishes a
foundation from which to develop specific methods to quantify the physical,
chemical, and biological functions of wetlands. The HGM classification system is
purposefully flexible in order to facilitate its use across many types of wetlands, as
well as diverse geographic areas. While its use as part of a functional assessment
method has become the primary use of this classification system, HGM class alone
provides useful information about the range of ecological processes occurring within
a wetland.

12
Wetlands can be classified many ways. Earlier, a system based primarily on
vegetation classes was discussed (Cowardin 1979). Instead of vegetation, HGM
classification system is based on the hydrogeomorphic properties of wetlands. Three
basic properties of wetlands are used to determine the types of functions that a given
wetland may provide: geomorphic setting, water source, and hydrodynamics.
Geomorphic setting is another term for landscape position. Depressions in the
landscape, i.e. areas that are regularly flooded by rivers and areas adjacent to
permanent bodies of water, are all common wetland landscape settings. There are a
wide array of geomorphic settings that were derived from variations of depressional,
riverine, and lake-fringe. Wetlands of the same category tend to have similar
combinations of hydroperiod (the extent and duration of inundation), direction of
water flow, and structure of vegetation.
The HGM approach to wetland classification defines six wetland categories.
Depressional wetlands are formed in topographic low points where surface water
ponds. Sources of water for depressional wetlands typically include precipitation,
groundwater, and overland low from adjacent uplands. The hydrologic gradients of
depressional wetlands move water from adjacent areas towards the center of the
wetland. Depressional wetlands may or may not have a defined inlet or outlet. Water
may leave a depressional wetland by discharging through an outlet, by
evapotranspiration, and through the soil to groundwater. The concave topography of
depressional wetlands potentially facilitates both flood storage and water-quality
functions; however, there are many variables besides HGM classification, e.g.

13
vegetative structure, which will also contribute to the functional productivity of a
wetland.
Depressional wetlands are areas in the landscape that are topographically
lower than the immediate area. Frequently, depressional wetlands occur as a result of
a high water table intersecting the soil surface. These landforms include wetland
types such as kettles, potholes, and vernal pools. When these features occur in more
arid climates, they are frequently dry for much of the year. Vernal pools are a type of
depressional wetland that is “wet” for only a brief period of the year because
precipitation is the sole source of water. In wetter climates, conditions may allow for
the formation of peat because of the lack of a surface outlet and a high amount of
organic input. These areas are no longer considered depressional once the underlying
landscape no longer affects surface hydrology, however, and would be categorized as
extensive peatlands. Depressional wetlands may or may not receive surface flows
from adjacent areas. Similarly, water levels may or may not be dependent on
groundwater fluctuations.
The depressional category is further subdivided based on a variety of
hydrologic criteria. Groundwater wetlands are a type of depressional wetland that
occurs where there is a distinct break or change in the slope of the land surface.
These features are caused by either groundwater flow intersecting the topographic
surface, or areas where groundwater moves upward toward the lowest portion of the
slope as a result of a change in direction of hydraulic pressure (Brinson 1993). Where
glaciers once existed, layers of permeable material are vertically surrounded by less
permeable layers. This common geologic feature is described as a perched water

14
table. In areas where the permeable layer is exposed at the ground surface due to
erosion or other physical processes, seeps often occur.
Riverine wetlands are typically located in floodplain areas and have some
level of hydrologic connection to a stream or river. Primary water sources of riverine
wetlands consist of floodwater and subsurface flow from adjacent watercourses.
Other sources of water include overland flow from uplands, and precipitation.
Perennial flow in the stream is not generally required to maintain an adequate source
of surface water. Surface water leaves riverine wetlands as floodwater subsides, as
evapotransipration occurs, or as water recharges the water table.
Lacustrine-fringe wetlands occur adjacent to lakes. In these wetlands, the
water table is maintained by the water level in the lake. Additional sources of water
include precipitation and groundwater discharge. Surface water in lake-fringe
wetlands typically moves bi-directionally as the water level in the lake changes.
Water leaves lake-fringe wetlands as runoff to the lake ceases, by evapotranspiration,
and as sub-surface flow.
Tidal-fringe wetlands are present along coasts and estuaries. All of these
wetlands are affected by sea-level. Many tidal-fringe wetlands inter-finger with
riverine wetlands at the upper extent of the tidal range. Due to the nature of tidal
movements, these wetlands typically do not experience long, dry periods. These
wetlands lose water through tidal exchange and evapotranspiration. Estuarine
wetlands are an increasingly rare wetland type and because of their habitat value to
many species, they are typically highly functioning wetlands that require strong
protection.

15
Slope wetlands occur in locations where groundwater is discharged to the land
surface. These wetlands occur on slopes that vary in gradient from almost flat to
steep hillsides, and are always steep enough so that water does not pond. Water
moves in one direction. Sources of moisture from slope wetlands include overland
and subsurface flow from both wetlands and uplands. Defined water channels may be
present and convey water from the wetland. Water may also be lost through
evapotranspiration, and surface and sub-surface flow.
According to the HGM classification of wetlands, there are two types of flat
wetlands. Mineral-soil flats are located in settings that include relic lake bottoms and
extensive floodplain terraces. Precipitation is the primary source of water.
Groundwater is not a source of water, which differentiates flat from depressional or
slope wetlands. These wetlands lose water by evapotranspiration, overland flow, and
groundwater recharge. Organic soil flats are often referred to as peatlands and differ
from mineral-soil flats in that their topography is controlled by the accumulation of
organic matter. They may occur in flat areas or in depressions that have filled with
peat. These wetlands have unique chemical properties and are relatively rare in this
region (Hruby 2004).
The HGM classification of the case-study wetland is a simple, straightforward
process that provides the user with valuable information that can be used in order to
make accurate comparisons between wetlands (Brinson 1993).
The boundaries between the case-study wetland and the uplands that surround
it were delineated using the Army Corps of Engineers Wetland Identification and
Delineation Manual (Environmental Laboratory 1987), and the Interim Regional

16
Supplement to the Corps of Engineers Wetland Delineation Manual: Western
Mountain Valleys and Coast Region (USACE 2008). The original purpose of the
Army Corps of Engineers Wetland Identification and Delineation Manual (USACE
1987) was to provide users with a method for determining whether or not a wetland is
present for the purpose of addressing Section 404 of the Clean Water Act.
The 1987 manual identifies a three-factor approach to the wetland
determination process. The presence of all three factors ( hydrophytic vegetation,
hydric soil, and wetland hydrology) are used to determine wetland extent. Field
indicators for all three parameters are described in this manual. The methods
described in this manual can be used to delineate pristine, undisturbed wetlands, as
well as wetlands that have been altered in some way.
As part of a study funded by the EPA, the National Academy of Sciences
published recommendations that regional differences in climate, geology, soils, plant
communities, and other factors be integrated into wetland delineation methods in
order to “increase the regional sensitivity of wetland-delineation methods.” (National
Research Council 1995) This on-going, nationwide effort aims to improve the
accuracy and efficiency of wetland delineations, while taking into account differences
that require consideration in a specific regional context. Regional supplements have
now been drafted for all parts of the United States. The Arid West Supplement (U.S.
Army Corps of Engineers 2006) as well as the Western Mountain Valleys and Coasts
Region supplement (USACE 2008) includes areas of Washington.
The Western Mountains, Valleys, and Coast Regions surround the Arid West
Region, which is located in the south central part of Washington. These regional
17
supplements are not intended to replace the 1987 Corps Manual; instead they aim to
bring new knowledge and practices into the Corps wetland delineation procedure. If
applied correctly, wetland boundaries determined using this regionally specific
methodology should not differ from boundaries determined using the 1987 manual.
In instances where a delineation is conducted using both the 1987 Corps Manual and
the appropriate Regional Supplement results in different wetland boundaries, the
regional supplement takes precedence over the 1987 manual.

18
Figure 4: Case study wetland boundary and sample
point locations
Generally all areas in Washington, except the Columbia Basin, are included in
the Western Mountains, Valleys and Coast Supplement. The Columbia basin lies
with the region covered by the Arid West Supplement. Characteristics that
differentiate Western Mountains, Valleys and Coasts include higher amount of
precipitation, lower average temperature, higher humidity, and lower
evapotranspiration rates. Streams in the Western Mountains, Valleys and Coasts
Region are more likely to be perennial than streams in the Arid West, which are
typically ephemeral. These and similar region-specific hydrologic characteristics are
utilized in the Regional Supplements to refine the wetland delineation procedure
outlined in the 1987 Corps Manual. The procedure described in this manual and the
corresponding regional supplement is commonly used to delineate wetlands
nationwide for a variety of purposes,
including regulatory compliance and
resource assessment. Wetland
jurisdiction under the Clean Water act
is a separate determination, not a part
of this procedure, and is based on the
hydrologic connection between a
wetland and a navigable waterway.
Two sample points were
established in the assessment area
(Figure 4) along a gradient that
connects an obviously upland area to

19
a seasonally inundated depression. Sample Point 1 is located just inside of the
delineated boundary on the western side of the wetland unit. Sample point 2 is
slightly west on the upland side of the wetland boundary. These two sample points
are located along a fairly steep (15 percent slope) gradient. Vegetation surrounding
the sample points contains tree, shrub, and herbaceous vegetation. At the low end of
the slope only obligate wetland plants are present. Sample point 2 contains upland
grass and tree species. Vegetation plots were established for herbaceous,
shrub/sapling, and tree strata (see datasheets in Appendix 1 for plot configuration).
This location was chosen because the vegetation communities and the soil profile
were representative of the wetland unit.
The Corps wetland delineation procedure recognizes hydrophytic plant
assemblages as “the community of macrophytes that occurs in areas where inundation
or soil saturation is either permanent or of sufficient frequency and duration to exert a
controlling influence on the plant species present.” (USACE 2008)” This technique
employs a plant-community approach to assess vegetation, as opposed to the presence
or absence of certain indicator species. A vegetation community meets hydrophytic
requirements if the community is dominated by species that are specially adapted to
prolonged inundation or soil saturation for a significant portion of the growing
season.
Decisions concerning whether or not vegetation communities are hydric are
based on wetland indicator status of the dominant species within a plant community
(Reed 1993). Species that are given facultative ratings (FACW, FAC, and FACU)
have been statistically proven to occur in both wetland and upland conditions,

20
although FACW species are more likely to be found in wetlands that FAC species,
which are more likely to occur in wetlands than species with a FACU indicator status
(see Table 1 for definitions).

21
Indicator Code
Wetland Type
Comment
OBL
Obligate Wetland
Occurs almost always (estimated probability 99%) under natural conditions in wetlands.
FACW
Facultative Wetland
Usually occurs in wetlands (estimated probability 67%-99%), but occasionally found in non-wetlands.
FAC
Facultative
Equally likely to occur in wetlands or non-wetlands (estimated probability 34%-66%).
FACU
Facultative Upland
Usually occurs in non-wetlands (estimated probability 67%-99%), but occasionally found on wetlands (estimated probability 1%-33%).
UPL Upland Obligate
Occurs in wetlands in another region, but occurs almost always (estimated probability 99%) under natural conditions in non-wetlands in the regions specified. If a species does not occur in wetlands in any region, it is not on the National List.
NA No Agreement
The regional panel was not able to reach a unanimous decision on this species.
NI No Indicator
Insufficient information was available to determine an indicator status.
NO No Occurrence
The species does not occur in that region.
Table 1: Wetland Indicator Status Definitions (recreated from
http://plants.usda.gov/wetinfo.html)
Most wetlands are dominated by species rated OBL, FACW and FAC; however, there
are situations where a wetland could be dominated by species with a FACU indicator
status. One example of such a situation is a forested wetland that is dominated by
western hemlock. Although this species has a FACU indicator status, it is capable of
tolerating a wide range of soil moisture conditions, and other indicators of
hydrophytic vegetation will need to be considered to accurately determine the hydric
classification of the plant community.
The aerial cover for all species within vegetation plots was estimated by
strata. Up to four layers of vegetation (strata) may be present within a vegetation

22
sampling plot. Tree strata are defined as areas with more than 5 percent aerial cover
of woody vegetation that is greater than 7.6 cm (3 in) in diameter at breast height
(DBH) regardless of height. A shrub/sapling layer is an area with at least 5 percent
aerial cover of woody vegetation with a DBH of less than 7.6 cm (3 in), regardless of
height. The herb stratum comprises areas with more than 5 percent cover of non-
woody vegetation, including herbaceous vines, regardless of size. A woody vine
strata is defined as present if there 5 percent or more aerial cover of woody vines
within a vegetation sampling plot.
Dominant species of each strata were determined using the dominance test
procedure outlined in the manual. If more than one-half of the dominant species were
FAC, FACW or OBL, the plant community was considered hydrophytic. Similar to
vegetation communities, soils must also meet certain criteria to be considered hydric.
According to the National Technical Committee for Hydric Soils, a hydric soil
is one that formed under conditions of saturation, flooding, or ponding that last
enough period during the growing season to develop anaerobic conditions in the
upper part. Soils located near wetland boundaries typically experience alternating
saturated and aerobic conditions. The biogeochemical processes that take place under
these circumstances, including the depletion of oxygen and the reduction,
translocation, and concentration of iron and other elements creates distinctive
physical features in the soil profile that are visible under both saturated conditions
and after long dry periods. These redoxamorphic soil features appear as color
patterns in the soil formed by the oxidation and reduction of iron and/or manganese
caused by saturated conditions within the soil and are the basis for many of the hydric

23
soil indicators included in the manual. Although the presence of any approved soil
characteristic is a positive indicator of hydric soils, a soil that does not meet a hydric
soil criterion may still be considered hydric if it meets the definition stated earlier.
The evaluation of soils in the assessment area consisted of an on-site
investigation of the soils at each sample point (Figure 3). A soil pit was dug at each
location to a depth of at least 61 cm (24 in) below the soil surface. Soil profiles were
described layer by layer. Layers were determined based on changes in soil color,
texture, or the abundance of redoximorphic (redox) features. The depth of each layer
below the soil surface was recorded. The dominant (matrix) color of each layer was
determined using a Munsell Soil Color Chart, as were the colors of any redox
features. The quantity of redox features was estimated and recorded, as was the
location of the features with the soil profile. This soil profile was then compared to
the list of hydric soil indicators. If the soil description matched one or more hydric
soil indicator, the soil at the location of the sample point was determined to be hydric.
Wetland hydrology is the third factor used to determine the presence of
wetland conditions. Although hydric soils and hydrophytic vegetation provide
evidence of medium to long-term soil saturation during the growing season, the direct
observation of wetland hydrology provides clear evidence that the site has maintained
an adequate wetland hydrologic regime and the presence of hydric soils and wetland
vegetation are not artifacts of a previous hydrologic condition that has been altered.
Indicators of wetland hydrology are useful in determining if recent soil saturation or
inundation has occurred. These indicators may or may not give any indication of the

24
timing, duration, frequency of saturated soil conditions (National Research Council
1995).
Wetland hydrology indicators are more ephemeral than those of hydric soils
and hydric vegetation, and may not be present during the driest times of the year.
Therefore, the lack of a wetland hydrology indicator is not definitive evidence that the
wetland fails to meet the hydrologic requirements. Chapter 5 of the Western
Mountains, Valleys, and Coasts Manual outlines procedures for dealing with
problematic situations concerning all three factors.
Under the regulatory definition provided in the 1987 manual, wetland
hydrology must be present during the growing season. According to the WMVC
Supplement, the beginning and end of the growing season can be determined using
several techniques. Two of these techniques involve observing indicators of
biological activity. The first indicator is above-ground growth of non-evergreen
vascular vegetation. Two species in or near the wetland must exhibit one of several
vegetative growth characteristics such as the emergence of herbaceous species from
the ground, coleoptile/cotyledon emergence from seed, or bud burst on woody plants.
The second indicator of biological activity is soil temperature.
If vegetation has been cleared from a wetland it may be more practical to
determine if the growing season has begun by using the soil temperature. The spring
growing season is underway once the soil temperature at a depth of 30.5 cm (12 in) is
at least 5 C° (41° F). This information is obtained easily by inserting a soil
temperature thermometer in the side of a recently dug pit. A single measurement
during one site visit is sufficient to determine if the growing season has begun.

25
The growing season is determined to be over when woody deciduous species
lose their leaves, or when no herbaceous species are in the flowering stage. These
conditions are brought on by lower temperatures and drought conditions in the soil.
If neither approach is practical, the beginning and end of the growing season can be
estimated by examining reliable, long-term climate data such as the information
provided by the National Weather Service meteorological stations (U.S. Army Corps
of Engineers 2005).
Indicators of wetland hydrology are grouped into four categories that are
generally based on reliability (USACE 2008). Group A hydrologic indicators require
a direct observation of surface or ground water made on-site. Any surface inundation
(flooding or ponding) meets the surface water (A1) indicator. This indicator may be
problematic in situations immediately preceding a precipitation event when runoff
will saturate or pond in upland areas. If surface water is not present, but the water
table is evident in a pit or monitoring well at an elevation that is less than 30.5 cm (12
in) below the soil surface, the high water table indicator (A2) has been met.
Saturation (A3) is a Group A indicator that is met when soils are saturated within 30.5
cm (12 in) of the soil surface. Saturation is evident if visual glistening of water on the
outside of soil surfaces is observed. This indicator requires, with a few exceptions, a
water table present immediately below the zone of saturation. Exceptions occur when
an impermeable layer is present at or near the surface (episaturated conditions).
Group B hydrology indicators provide evidence that the site experiences
periods of saturated soil conditions and/or surface inundation, although direct
evidence is no longer present. Group B indicators include water marks, drift deposits,
26
and sediment deposits. Water marks (B1) are “discolorations or stains on the bark of
woody vegetation, rocks, bridge supports, buildings, fences, or other fixed objects as
a result of inundation.” (USACE 2008) Watermarks capture the maximum extent of
inundation and their relative elevation can be extrapolated to determine surface-water
elevation in adjacent areas. Although it may be somewhat difficult, it is necessary to
distinguish watermarks left from extreme, infrequent flood events from typical
surface-water elevations.
Similar to water marks, sediment deposits (B2) are accumulations of fine-
grained soils (silts and clays) or organic matter that remain on the bark of trees, rocks
and other objects after surface water recedes. Determining the frequency of the event
responsible for the deposit may be difficult (USACE 2008). This indicator is most
frequently encountered in floodplain and backwater settings, where the water velocity
is slow enough to deposit sediment. Sediment deposits will be visible for a relatively
short period of time before they are removed by precipitation or wind. Drift deposits
consist of vegetation remnants that have been either deposited by surface water on the
ground or have become entangled with other vegetation or other objects. The same
cautions apply to this indicator as the two previously discussed. Although these are
the most commonly used, as well as most reliable indicators (in most instances) of
wetland hydrology, seven more Group B indicators have been approved for use in this
area. Algal mats (B4), surface soil cracks (B6), and water-stained leaves (B9) are
examples of additional Group B indicators. All Group B indicators are primary.
Consequently, the presence of only one primary indicator is considered adequate
evidence of wetland hydrology.

27
The remaining indicators belong in Groups C and D and are considered
secondary. A few examples of secondary indicators include situations where
inundation is visible on aerial imagery (C9), certain geomorphic positions (D2), and
raised ant mounds (D6). Because these secondary indicators are considered less
reliable in this area, the presence of two or more are required to demonstrate wetland
hydrology (USACE 2008).
The USACE routine wetland delineation procedure represents the most
current, nationally accepted technique to determine the extent of wetland areas. It
requires an experienced field observer with a variety of technical skills. Plants must
be identified to species in order to assign a correct facultative status. During the
delineation of the case-study wetland, plant identifications were confirmed using a
dichotomous key (Hitchcock and Cronquist 1973).
A Global Positioning System (GeoXT) was used to record the position of the
wetland boundary. Although only two sample points are shown on Figure 3,
investigations of the three factors occurred wherever plant communities or
topography changed. This procedure provided a straightforward approach to finding
the wetland boundary. Although the field work was conducted at an ideal time for
both direct observations of wetland hydrology and plant identification, the USACE
routine wetland delineation procedure offers guidance on determining wetland
boundaries at any time of year.
The purpose of the wetland delineation was to determine the extent of an
existing wetland. Alternative methods have been developed to assess and categorize
a wetland based on ecological sensitivities, uniqueness, and other attributes that must

28
be taken into account when making regulatory decisions. The Washington State
Wetland Rating System for Western Washington (Rating System) is used extensively
in wetland mitigation in Washington State. The Rating System was designed to
provide a methodology for categorizing wetlands in Washington.
This assessment method divides wetlands into four categories. The category
or “rating” of a wetland is a classification based on several attributes, including their
sensitivity to disturbance, how rare or unique they are, how difficult it would be to
recreate a similar wetland, and the types of functions they provide.
Wetlands may be given the highest rating, Category I, for several reasons.
They may represent a type of wetland that is an exceptionally rare type, has a high
value to society, is sensitive to disturbance, are relatively undisturbed and difficult or
impossible to replace, or provide a very high level of function. For instance, only one
sixth of the historic estuarine wetlands in Snohomish River delta remain today
(Tulalip Tribes/Snohomish County 2001). The frequent development of estuaries for
residential and commercial purposes is consistent throughout Puget Sound and along
the outer coast. Due the commercial and residential land-use pressure, these wetlands
require a high level of protection to maintain their functional integrity. In addition to
their rarity, estuarine wetlands are also given the highest rating due to their level of
function and the importance of their habitat characteristics. Estuarine wetlands that
are undisturbed and larger than one acre automatically qualify as Category I due to
their uniqueness and importance to society.
The Washington State Department of Fish and Wildlife (WDFW) have
defined estuaries as “priority habitat,” due to their fish and wildlife density, species
29
richness, importance in providing breeding habitat, importance for fish and wildlife
seasonal ranges and movement corridors, limited availability, and high vulnerability
to alteration (WDFW 2008). Priority habitats are defined as “habitat types or
elements with unique or significant value to a diverse assemblage of species. A
priority habitat may consist of a unique vegetation type or dominant plant species, a
described successional stage, or a specific structural element.” These habitat types are
considered by WDFW to be priorities for conservation and areas that require strict
management. The presence of priority habitats is reflected in the rating system and
greatly increases the habitat score of the wetland in question.
Category I wetlands that qualify based on special characteristics include
wetlands types such as bogs; mature, old-growth forested wetlands; and wetlands
associated with coastal lagoons. Bogs are rated as Category I because they are
extremely difficult to construct and because they are extremely sensitive to
disturbance. The chemistry of the water and soils in a bog is highly acidic and
nutrient poor. The accumulation of organic soils that are responsible for forming
these wetlands is an extremely slow process. Two and a half centimeters (1 in) of
organic soil can take up to forty years to develop in western Washington (Rigg 1958).
Vegetation and wildlife associated with bogs possess specific adaptations that
enable them to thrive in these unique environments. These organisms tend to be
intolerant of chemical changes. Additionally, characteristics such as plant and animal
communities of these wetlands can change drastically as a result of disturbances to
the natural water regime or nutrient levels (Grigal and Brooks, 1997).

30
Mature and old-growth forested wetlands are Category I if they are larger than
0.4 ha (1 ac) in size. These wetlands are impossible to recreate in a time period
appropriate for compensatory mitigation. These wetland ecosystems may require
over a century to fully develop, and some functions may take longer before they are
provided (Sheldon et al. 2004.) Similar to estuarine wetlands, these wetlands are also
considered priority habitats by WDFW.
Coastal lagoons consist of relatively shallow bodies of water that are
separated from an ocean by a barrier beach. At times, these lagoons may have a
direct connection to the ocean, or they may only receive periodic water exchanges
during storms and/or high tides. Recent research has indicated that these types of
lagoons provide important habitat for juvenile salmonids (Hirschi et al. 2003).
Wetlands that are associated with these features are impossible to recreate, and are
rare in our region and therefore are typically rated as Category I based on special
characteristics. Since they are considered irreproducible, any impact would likely
result in an irreplaceable loss of function, so these areas are given the highest level of
protection.
To determine the rating of a wetland based on the functions that it provides, a
series of questions are answered and points are awarded based on the answers to these
questions. Wetlands that score 70 or more points out of a possible 100 also are
Category I wetlands. In order to achieve this score, a wetland must perform all three
groups of functions (water quality, hydrologic, and habitat) at a very high level.
Wetlands that achieve of this score are rare in our region. Of the reference sites used

31
to calibrate this scoring system, only 15 percent rate as Category I, based on their
functions.
Category II wetlands are highly productive in terms of functions and are
difficult, but not necessarily impossible to recreate. These wetlands are significantly
more common in Washington, but are still relatively rare enough to require high
levels of regulation (Hruby 2004). Specific examples of Category II wetlands in
Washington include small or impacted estuarine wetlands, wetlands between sand
dunes (interdunal), and highly functioning wetlands (defined below).
Estuarine wetlands that are not rated Category I qualify as Category II. These
are typically tidally influenced wetlands that are smaller than 0.4 ha (1 ac). An
estuarine wetland that is larger than 0.4 ha (1 ac) but is significantly altered by human
activities, such as dredging or filling, is Category II. These wetlands are believed to
provide valuable ecosystem function despite their partial disturbance. Estuarine
wetlands qualify as either Category I or II based on the criteria that they are tidally
influenced salt-marsh communities. This rating is not determined by the same
procedure as freshwater wetlands, whose rating is determined by separate evaluations
of hydrologic, habitat, and water quality performance.
Interdunal wetlands are defined as those wetlands that occur to the west of the
1889 line (western boundary of upland ownership). Interdunal wetlands are a small
component of the sand dune eco-system (Wiedemann 1984). Dune formation is the
result of highly dynamic interactions between geologic, hydrologic, and vegetative
features. These features form immediately behind the ocean beach and change
dramatically as the result of storms (Wiedemann 1984). Although they are only a

32
minor portion of this landscape, interdunal wetlands provide habitat that is critical to
many species. Two animal and three species of vegetation that are associated with
these habitats are listed as rare, threatened, or endangered (Hruby 2004). Because
methods to characterize these wetlands have not yet been developed, interdunal
wetlands that are greater than one acre are rated as Category II by default. Wetlands
that score between 51 and 69 points on the habitat, water quality, and hydrologic
criteria are also Category II, based on function. It has been determined that these
wetlands perform several functions well, or possibly one group of functions very
well, with other functions being performed at an intermediate level.
Category III and IV wetlands are those with moderate to low levels of
function. These wetlands are typically disturbed in some way, perhaps drastically.
Typically these wetlands exhibit low levels of species diversity. A low rating also
implies that the wetland is isolated from other aquatic and natural resources.
Although these wetlands do not function at the same level as Category I and II
wetlands, they are still capable of providing important functions, and thus require
regulation.
Currently, the Rating System is an important management tool for wetlands in
Washington. This tool was developed and is used by the Washington State
Department of Ecology (Ecology) to help ensure wetlands receive adequate
protection. Specifically, Ecology uses the Rating System to determine the distance
that development is allowed from a wetland, or the buffer width (Sheldon et al. 2005).
Wide buffers are sometimes required around wetlands to improve and protect water
quality, as well as to provide more complex and diverse habitat for wildlife.

33
The Rating System is also used to determine area requirements for wetland
mitigation. The category of impacted wetlands plays an important part in
determining wetland mitigation ratios. Mitigation ratios are used to calculate the area
of wetland mitigation (the establishment of new wetlands or enhancement of existing,
degraded wetlands) required relative to the area of impacted wetlands. The area of
wetland mitigation generally increases as the rating of the impacted wetland
decreases.
Ecology also uses this assessment method to determine which actions can be
permitted in a wetland (Sheldon et al. 2005). Several local governments, including
King County (King County Code 21A.24.318), have adopted regulations verbatim, or
with minor modifications, into their Critical Areas Ordinances to determine buffer
requirements.
The Wetland Rating System for Western Washington (Hruby 2004) is a useful
tool with which to rapidly characterize several important wetland attributes; however,
it does not provide a high level of detail concerning specific wetland functions. An
analysis of the ecological impacts to this case-study wetland required a greater
resolution than that provided by this characterization method. In order to determine
the levels of various wetland functions provided by the case study wetland, a new
rapid functional assessment was employed.
The purpose of the analysis section of this investigation is to determine how
much adjacent land uses limit the functions provided by the case-study wetland. The
Oregon Rapid Wetland Assessment Protocol (ORWAP) provides a standardized
approach with which to determine the functions of any wetland (Adamus et al. 2010).

34
Although this protocol is still in draft stage, the methods that it utilizes are derived
from a regional assessment method, The Oregon Rapid Wetland Assessment Protocol
(ORWAP), which has been field tested extensively (Adamus et al. 2010). A complete
ORWAP assessment typically requires three to six hours to complete. The method
was developed by the Oregon Department of State Lands with funding from the U.S.
Environmental Protection Agency.
ORWAP is designed for use by a variety of agencies for a variety of purposes,
including assessments at the individual wetland scale (or even a portion of a wetland)
to assessments at a watershed-level scale. This tool can be used in wetland mitigation
in several ways, including determining meaningful performance standards and
comparing functions lost through development, to those replaced through mitigation.
Unlike most other functional assessment methods, ORWAP allows the
assessment of functions provided by different types (HGM classes) of wetlands using
the same criteria. In other words, the same information is used to evaluate functions
regardless of the nature of the wetland (Adamus et al. 2010).
The WESPUS procedure involves answering questions about the assessment
area on one three-part Excel spreadsheet data form. In order to provide the required
information, the user determines answers using both Geographic Information Systems
(GIS) and field investigations.
Scores are generated by formulas built into the spreadsheet, and are
summarized on the “Scores” page. Scores represent a wetland‟s effectiveness at
providing the following functions: water storage and delay, sediment retention and
stabilization, phosphorus retention, nitrate removal and retention, thermoregulation,

35
carbon sequestration, organic matter export, pollinator habitat, aquatic invertebrate
habitat, anadromous fish habitat, non-anadromous fish habitat, amphibian & reptile
habitat, waterbird feeding habitat, waterbird nesting habitat, songbird, raptor and
mammal habitat, pollinator habitat, and native plant diversity. All but two functions
have associated value scores.
Functions and values must be considered together in resource assessment
investigations. A function such as water storage and delay is only beneficial to
humans if the wetland is located in an area with down-gradient buildings or other
infrastructure that can be damaged by floods. If this were not the case, although the
wetland is providing an important function, the value of that function is low.
Scores for individual functions are condensed into several categories and are
referred to as “grouped services,” and assigned a score for that group. Other scores
are provided for non-functional attributes such as ecological condition, provisioning
services, and sensitivity. For the functional analysis of the case-study wetland, this
method was used to determine if any functions provided are limited by activities or
man-made landscape features occurring in or present on adjacent areas.
WESPUS uses logic models to determine a 0-10 point score for each function
and value. The mathematics used in the scoring models are explained in detail in the
accompanying manual (Adamus et al. 2010).

36
3. Results
This section presents the results of the various wetland classification
and characterization methods discussed previously. Information derived from these
assessments is helpful in describing various attributes of the case-study wetland.
The objective of this case study involved two distinctly different but related topics.
The first component involved a detailed characterization of the case-study wetland.
To achieve this objective, the case-study wetland was evaluated by methods that
designed to accurately assessment wetland boundaries, vegetation structure,
watershed position, and relative uniqueness among other attributes. The second
objective was to identify potential activities that are common in the watershed of the
case-study wetland that potentially limit the functions that the wetland provides.
According to the Artificial Key to the Systems and Classes provided in
Classification of Wetlands and Deepwater Habitats of the United States (Cowardin
1979), the vegetation in the case-study wetland belongs in the Palustrine system. The
first couplet in the key refers to the influence of tides and the level of ocean-derived
salinity. Since the hydrology and water chemistry are in no way affected by tidal
influences, the case-study wetland cannot be estuarine. The next break in the system
key deals with vegetation. If persistent trees, shrubs, or emergent vegetation covers
greater than thirty percent of the wetland, then the wetland meets the criteria for the
Palustrine system. Since the aerial cover of all vegetation classes within the case-
study wetland greatly exceeds thirty percent, it is determined to belong in the
Palustrine system.

37
Since the Palustrine system has no sub-classes, the next section of the key
determines the dominance type. The first question again relates to the cover of
persistent vegetation, but more detail is required for the next question that refers to
the hydrophytic nature of the vegetation. The vegetation within the case-study
wetland is dominated by hydrophytic vegetation, which was determined using the
delineation procedure (USACE 2008), and that cover is composed of dominantly
vascular species. The final distinction in the key in this case determines the
dominance type; Forested Wetland. This is determined based on the dominance of
woody vegetation that is greater than six meters in height. Although the wetland is
dominated by forest species, the wetland also contains both palustrine emergent, and
palustrine scrub-shrub vegetation communities. The wetland was determined to be
dominated by forest species over six meters tall, which likely control the growth of
the remaining vegetation in the wetland to some extent. Similarly, a wetland with
both scrub-shrub and emergent vegetation communities would likely be classified as
scrub-shrub because of the greater influence of this vegetation community.
The HGM classification of the case-study wetland was determined using the
short questionnaire (key) that is provided in the Wetland Rating System for Western
Washington (Hruby 2004). Like the last evaluation, the first step is determining if
estuarine processes are present. This is done simply using the key, which requires the
user to determine if water levels (except during floods) are controlled by tides. Since
the answer to this question is no, the HGM classes of tidal fringe (both fresh and salt
water (estuary)) are eliminated as possibilities.

38
The next question deals with topography and the primary sources of the water
that creates the wetland. If the entire wetland is flat and only receives water in the
form of direct precipitation, the wetland belongs in the HGM class „flats.” This is not
true for the case-study wetland, which contains multiple topographic gradients
(Figure 1) and receives water from multiple sources. The next HGM class to be
determined is slope. Three criteria are considered. The first requirement is that water
moves across the wetland in one direction. Since it was determined by interpreting
topographic maps and during field investigations that there are multiple topographic
and hydrologic gradients, this criterion does not apply to the case-study wetland;
therefore, it is not a slope wetland. The other required criteria for slope wetlands are
the lack of impounded surface water and the presence of a slope. The topography of
the case-study wetland is not accurately described as a slope due to its location in a
depression and the ponding of water that occurs at the southern end.
The next question identifies riverine wetlands. There are two criteria that
involve the presence of a stream or river and a connection to the wetland. A riverine
wetland must be located in a river valley and receive over-bank flow from an adjacent
watercourse at least once every two years. As the case-study wetland is not located in
a stream channel, it does not meet riverine wetland criteria, although parts of the
wetland do convey surface water during some times of the year. There is no
unvegetated channel and water is only present seasonally, thus it was determined that
no stream is present within the assessment unit.
The next question requires the user to identify whether or not the wetland is
located in a topographic depression that has soils that are saturated to the surface or

39
ponds water at some point during the year. An outlet, if present, must be significantly
higher that the interior of the wetland.
The case-study wetland has no obvious outlet. The southern end of the
wetland is a berm that causes water to be impounded. This topographic feature was
potentially constructed by excavated material that was deposited along the southern
margin of the emergent area. This could have been done to provide water for
livestock, or to alter the hydrology of the area to the south. Determining if this
feature is natural or man-made would be relatively difficult at this time and is
unnecessary to achieve project objectives that do not involve determining the historic
extent of the wetland.
According to the HGM key provided in the Rating System, the-case study
wetland belongs in the “depressional” HGM class. This characterization is
appropriate because the wetland contains a topographic low-point that contains
impounded surface water for some part of the year. The lowest area of the wetland
not only ponds surface water during the wettest times of year, but soil in this area
remains saturated to the surface throughout the driest part of the summer. Plants
located in the depressional areas of the case study wetland are obligate wetland
species (Reed 1993) and characteristic of low-energy emergent settings with
permanent inundation and/or saturated soil conditions (Hitchcock and Cronquist
1973). This characterization accurately describes both the topographic setting as well
as the hydrologic characteristics of the case study wetland.
According to the Rating System, the case-study wetland is a Category III
wetland. This determination was based on the functional assessment component.

40
The final score for the case-study wetland is forty-six out of a potential one hundred.
The case study wetland did not qualify for higher designation based on special
characteristics. The wetland was rated using the depressional HGM class set of
questions. Category III wetlands are common, have generally experienced some level
of disturbance, and provide a moderate level of wetland functions (Hruby 2004).
Wetlands in this category are not typically diverse and are generally isolated from
other wetlands.
The first set of questions in the Rating System determines the wetland‟s
potential to improve water quality. Since the case-study wetland has no outlet,
contains greater than fifty percent aerial cover of ungrazed and persistent vegetation,
and the seasonally ponded area is greater than one half of the total wetland, ten out of
a total possible twelve points are awarded. This is considered a high score for this
attribute.
The next question determines if the wetland has the ability to improve water
quality. The user is asked to identify which of several attributes may be present, and
therefore whether or not excess nutrients or toxicants are deposited in the wetland. If
any of the described conditions are met, a multiplier is applied to the “potential to
improve water quality” score. One of the conditions refers to the presence of a stream
or culvert that discharges to the wetland that drains roads or residential areas.
Because a culvert discharges at the northern end of the case-study wetland, the
criterion is met and the multiplier is applied to the water-quality functions score. The
culvert is located under a driveway and receives surface water from both roads and
residential areas. This question concludes the water-quality portion of the

41
assessment. Out of a total of twenty-four possible points, the case study wetland
received eighteen, or seventy-five percent. This is a relatively high score in relation
to the other functional categories included in the assessment, which indicates that
water quality functions are likely the key function provided by the case-study
wetland.
Questions in the following section address the case-study wetland‟s potential
to reduce flooding and erosion. Since the wetland is in a depression and has no
outlet, the maximum number of points is awarded for the first question. The second
question addresses the maximum depth of ponded water in the wetland. An
intermediate category 15.2 to 61 cm (0.5 to 2 feet) accurately describes conditions
typically found in the case-study wetland. The final question in this section captures
information regarding the size of the wetland in relation to the upstream portion of its
watershed. With the aid of topographic maps and field investigation, an intermediate
category (the up-gradient contributing area is ten to one hundred times larger than the
wetland) was selected.
Similar to the water-quality functions, if a wetland has both the opportunity
and potential to reduce flooding and erosion, the score is multiplied by two if one or
more criteria are met. In this case, the criterion requires that the case study wetland
drain to a stream or river that has flooding problems. Because the case-study wetland
does not contribute water to a stream (the wetland has no outlet) the multiplier for
“potential” is not applied. The case-study wetland receives only ten out of a total of
thirty- two possible points for its ability to reduce flooding and erosion. This is
primarily due to the case-study wetland‟s hydrologic isolation.

42
The remaining portion of this assessment characterizes the quality of habitat
provided by the case-study wetland. The first section determines the wetland‟s ability
to provide habitat for many species. In order to determine the answer to the first
question, the user must decide how many Cowardin vegetation classes, or strata of
vegetation, are present within the wetland. Because the case-study wetland was
determined to contain palustrine emergent, scrub-shrub, and forested classes, three
points are awarded.
The case-study wetland contains areas with three distinct hydrologic regimes.
Within the wetland there are areas that are saturated only, seasonally flooded, and
occasionally flooded. All possible points (3 out of 3) were awarded for this question.
The next question addresses the richness of plant species within the case-study
wetland. The intermediate category (wetland contains 5-19 species that provide
greater than ten square feet of cover) was selected. Data obtained from the wetland
delineation procedure‟s vegetation plots were used to answer this question. Similarly,
the next question assesses the relative amount of interspersion that is present between
different types of habitat. Interspersion refers to the relative amount of edge between
different vegetation classes, as well as the number of vegetation classes present.
Because the case study wetland contains three vegetation classes, as well as
seasonally ponded areas, it receives the full number of possible points. The habitat
section continues with an assessment of special habitat features. Only two of a
possible six habitat features are present in the case-study wetland, standing snags and
low invasive cover.

43
The case-study wetland‟s opportunity to provide habitat for many species is
determined based on characteristics of the wetland‟s buffer. Using aerial imagery, it
was determined that the described condition that best fits the case-study wetland is
that the buffers contain fifty meters of relatively undisturbed vegetated areas for
greater than fifty percent of its circumference. This result earns three out of a
possible five points for the opportunity to provide habitat for many species. The next
component of the assessment characterizes the nature of the adjoining corridor. The
two options that receive the most points both require that the wetland be part of a
relatively undisturbed vegetated corridor. Since both breaks in vegetative cover, as
well as roads, are present between the case-study wetland and other wetlands, the
criteria are not met. The case-study wetland does meet the criteria for the minimum
number of points, which only requires that the case study wetland be within five
miles of an estuary. The estuaries of the Nisqually River, Woodard Bay, and lower
Woodland Creek are all within five miles of the case study wetland. One priority
habitat, mature forest, is located adjacent to the case study wetland (WDFW 2008).
This criterion requires multi-species stands of forest with trees that exceed 53.3 cm
(21 in) DBH. Most of the eastern margin of the case study wetland is under the
canopy of mature western red cedar, Douglas fir, and western Hemlock. The final
question of the assessment again addresses the connections between the case-study
wetland and other wetlands in the area. According to the data provided by the
National Wetlands Inventory, there are four wetlands within one half mile, but they
are separated by roads. Three out of five possible points are awarded for this
question. In total, only eighteen of forty-one points were awarded for the habitat

44
functions of the case-study wetland. Again, the most significant factors contributing
to this relatively low score remain the relative isolation of the wetland, more
specifically the lack of an intact vegetative corridor between this wetland and other
habitats.
Category III wetlands generally do not require large buffers to maintain
wetland functions. Consequently, these types of wetlands are not afforded unique
protections under any regulatory jurisdiction. These types of wetlands are common
and while they do not typically perform wetland functions at high levels, they still
provide valuable services in watersheds with water-quality issues, such as Henderson
Inlet.
The next wetland assessment procedure used to characterize the case study
wetland is a routine wetland delineation. As previously mentioned, this procedure
was conducted with techniques that are consistent with those outlined in the 1987
USCAE Delineation Manual and the Interim Regional Supplement for the Western
Mountains, Valleys, and Coast (USACE 2008).
The results of the wetland delineation determined the area of the case-study
wetland to be 0.04 ha (0.09 ac). The case-study wetland is surrounded by adjacent
uplands, except for the northern boundary where a watercourse enters the wetland via
a culvert beneath a gravel driveway. Wetland Sample Point 1 (SP1) is located on a
15 percent slope, within a slightly convex area. At the time of the field investigation,
climatic and hydrologic conditions were determined to be typical for that time of
year. Neither the soil, vegetation, or hydrology was determined to be significantly
disturbed.
45
Three strata of vegetation (tree, shrub/sapling, and herb) were present within
the sample plots established at SP1. Three dominant species were identified, all of
which have a wetland indicator status of FAC. Since all dominant species are FAC,
the vegetation community passes the Dominance Test and is therefore considered
hydrophytic.
The soil profile at SP1 consists of two layers. From zero to five cm (0-2 in)
below the soil surface the soil matrix color is 10YR 3/2 with no redoximorphic
features present. From five to sixty-one cm (two to twenty-four in) below the soil
surface the soil color is 10YR 3/2 with three percent concentrations (occurring as soft
masses) with a color of 10YR 5/6. The texture of both layers is loamy, and both
layers contain inclusions of gravel. This profile description fits the redox dark
surface (F6) hydric soil field indicator (NRCS 2010).
Two wetland hydrology indicators are present at SP1. The high water table
indicator (A2) was met because after a pit was dug, standing water was observed at a
depth of 30.5 cm (12 in). Saturation (A3) was present at a depth of 18 cm (seven in)
below the soil surface. Either of these indicators satisfies the wetland hydrology
criteria.
Because all three wetland parameters (hydrophytic vegetation, hydric soils,
and wetland hydrology) were present at SP1, it was determined that this sample point
occurs within a wetland. This point defines a point along a gradient where wetland
conditions are present. The next step involved determining the position along the
gradient where wetland conditions are no longer present.

46
Sample Point 2 (SP2) is located on a fifteen percent slope immediately up-
gradient from SP1. Five dominant species of vegetation were determined to be
present within sampling plots established at SP2. Of these five dominant species,
three have a facultative status of FAC, FACW or OBL, thereby meeting the
hydrophytic vegetation (Dominance Test) criteria.
The soil profile at SP2 also consists of two distinct layers. From the soil
surface to 33 cm (13 in) below the soil surface, the matrix (dominant) soil color is
10YR 2/1 with no redoximorphic features present. From 33 cm (13 in) to 63.5 cm
(25 in) below the soil surface, the matrix color is 10YR 3/3 with five percent
concentrations (occurring as soft masses) with a color of 10YR 4/6. The texture of
both layers is loamy, and both layers contain inclusions of cobbles. This soil profile
description does not meet any of the hydric soil indicators.
Wetland hydrology indicators were not present at SP2. Standing water was
present in a hydrology pit at 48.3 cm (19 in) below the soil surface. Saturated soils
were present at 40.6 cm (16 in) below the soil surface. Both of these elevations are
too low to meet either the saturation (A3) or high water table (A2) indicators. No
other primary or secondary indicators are present at SP2; therefore it is determined
that SP2 does not occur within a wetland because only two of the three required
parameters are present.
Further investigation determined the highest point along the gradient where all
three parameters were present, which indicate the uppermost extent of the wetland.
The same process was completed all the way around the wetland, which led to an

47
aerial extent of 0.04 ha (0.09 ac). The final set of results that will be presented
summarize the functions and associated values provided by the case-study wetland.
The Oregon Rapid Wetland Assessment Protocol was used to identify the
functions and values provided by the case-study wetland. Additionally, this protocol
was used to determine which functions and values are limited by adjacent land uses.
GROUPED FUNCTIONS Group Scores
(functions)
Hydrologic Function (WS) 4.75
Water Quality Group (WQ) 10.00
Carbon Sequestration (CS) 2.35
Fish Support Group (FISH) 1.87
Aquatic Support Group (AQ) 6.56
Terrestrial Support Group (TERR) 6.23
Table 2: Scores for grouped functions
The results of the functional assessment are provided in Table 2. In this table, the
results have been grouped into eight categories. These data support the Rating
System determination that water-quality functions are the primary ecological services
provided by the case-study wetland. According to the ORWAP results, most other
wetland functions are provided at moderate levels.
The case-study wetland provides moderate levels of hydrologic function.
Hydrologic functions are provided by impounding surface water within the case-study
wetland, which minimizes the severity and duration of flood events to down-stream
areas. The function is provided at a moderate level, due primarily to physical
attributes concerning the topography of the case-study wetland, as well as structures
controlling the way that water moves through the wetland. Because the configuration
of the wetland is relatively linear, and because the wet-season water levels are not
very deep, the case-study wetland‟s potential to store floodwater is very limited.

48
The case-study wetland provides a high level of water-quality function.
Individual functions that make up this group include sediment retention and
stabilization, phosphorous retention, and nitrate removal and retention. The primary
indicator for this level of function is the lack of a surface-water outlet, the presence of
both herbaceous and woody plants within the wetland, and the case-study wetland‟s
location in the upper one-third of its watershed.
Carbon sequestration is provided at low levels by the case-study wetland.
Indicators used to calculate the score for this function include the stability of the
water regime (infrequent change in water levels) in within the wetland, the type and
amount of vegetation within the wetland, and soil texture.
The ORWAP protocol presents individual habitat scores for fish (anadramous
and non-anadromous), and for terrestrial and aquatic habitat. While the case-study
wetland provides moderate levels of both aquatic and terrestrial habitat, anadromous
fish habitat does not exist within the case-study wetland. According to the ORWAP,
the case-study wetland does provide a low level of resident fish habitat; however, the
seasonal nature of the hydrology within the wetland, as well as a lack of a surface-
water connection to fish-bearing streams, severely limits the potential of the case-
study wetland to provide a significant amount of resident-fish habitat.
Terrestrial habitat provides a group of functions that can be divided into three
components: songbird, mammal and raptor habitat; pollinator habitat; and rare-plant
habitat. The scores for all three individual functions were generally moderate, and
primary indicators include hydrologic characteristics, vegetative characteristics of the

49
wetland and surrounding area, topography, the presence of near-by roosting structures
and several other important indicators.
The case-study wetland provides aquatic habitat at a moderate level. Aquatic
habitat functions are a group composed of aquatic invertebrate habitat, amphibian
habitat, the production and export of organic matter, and water-bird feeding and
nesting habitat. Not all of these functions are provided by the case-study wetland.
Although organic matter does accumulate within the case-study wetland, the lack of
an outlet prevents its export. Both invertebrate and amphibian habitat are provided at
moderate levels. Although significant water-bird feeding habitat is present, water-
bird breeding habitat is not present in the case-study wetland.
The results of these assessments indicate which wetland functions are
provided by the case-study wetland. While water quality functions are the primary
ecological service provided, the case-study wetland also provides hydrologic,
terrestrial habitat, and aquatic habitat functions. The second purpose of this analysis
was to determine which wetland functions are limited by land-use activities that have
occurred or are currently occurring in the vicinity of the case-study wetland.
According to the ORWAP analysis, a total of nine wetland functions are
currently limited by activities that have occurred or are occurring in the vicinity of the
case-study wetland. These limited functions belong to functional groups including
water-quality functions, and fish-, aquatic-, and terrestrial-habitat functions.
Hydrologic functions was the only group not affected by adjacent land-use activities.
Potentially significant land-use activities were divided into three disturbance-activity
groups, including the addition of impervious surfaces, disturbance to vegetation, and

50
hydrologic alterations. The following section describes how specific wetland
functions are limited by near-by land-use activities.
The amphibian habitat function is defined as the capacity of a wetland to
support an abundance and diversity of native amphibians and native wetland-
dependent reptiles (Adamus et al 2010). Although according to the ORWAP results,
this function is provided at moderate levels by the case-study wetland, the quality of
amphibian and reptile habitat present is compromised by several types of activities
occurring around the case-study wetland.
The proximity to large, open tracts of natural vegetation is one of several
positive indicators that quality amphibian habitat is present within the case-study
wetland. Amphibians that breed in the case-study wetland have access to large areas
of natural vegetation. Amphibians are not limited in range as roads do not encircle
the case-study wetland. Another characteristic beneficial to amphibians living in the
case-study wetland is the hydroperiod. The seasonal inundation of the soil within the
case-study wetland is a critical amphibian breeding requirement. Since water is
present during the amphibian breeding season, egg sacks anchored to vegetation can
remain submerged in water until larvae emerge and assume terrestrial life-stages.
Field observations of amphibians in the case study wetland support these conclusions.
Pacific chorus frogs (Pseudacris regilla), long-toad salamanders (Ambystoma
macrodactylum), and rough-skinned newts (Taricha granulose) were observed in or
within 20 feet of the wetland boundary. Additionally, chorus frogs call in unison
from the case-study wetland frequently during the breeding season.

51
Although the case-study wetland provides a significant amount of amphibian
and reptile habitat, this functions is somewhat limited by adjacent land-use activities.
Although roads do not encircle the case-study wetland, the distance from the wetland
to the nearest busy road (one vehicle per minute) is less than 152 meters (500 feet)
(Figure 2). According to the ORWAP scoring model, roads such as Johnson Point
Road present a significant obstacle to amphibians and reptiles. Although no new
roads have been recently constructed within the contributing area of the case-study
wetland, according to the ORWAP results, the presence of Johnson Point Road does
have a significant impact on the case-study wetland‟s amphibian populations. The
only other road in the vicinity does not meet the trip-frequency criteria, and therefore
does not present a significant impact.
Land-cover alterations both within the contributing area of the case-study
wetland, as well as larger-scale changes, were also determined to limit the reptile and
amphibian habitat provided by the case-study wetland. A significant amount of the
land immediately surrounding the case-study wetland, as well as across the greater
landscape (3.2 km radius) does not meet the ORWAP definition of a natural
landscape (Adamus et al. 2010). A significant amount of this area is maintained as
lawn, and contains ornamental vegetation as well as impervious surfaces. Mowing
also occurs immediately adjacent to the wetland boundary for approximately 35
percent of its length. Land-cover alterations immediately surrounding the case-study
wetland and alterations at the landscape scale indicate that the case-study wetland is
capable of providing a higher level of reptile and amphibian habitat but this function

52
is limited by the presence of altered vegetation and an increased amount of
impervious surfaces.
The accelerated input of nutrients and contaminants into the case-study
wetland also limits the wetland‟s ability to provide reptile and amphibian habitat.
The presence of septic systems in the case-study wetland‟s contributing area increase
the probability that effluent is present in the case-study wetland. Although livestock
are no longer present within the contributing area of the case-study wetland, other
domestic animals, most notably dogs, are. These domestic animals increase the
probability that elevated levels are nutrients are present in the case-study wetland.
Other potential sources for excess nutrients, as well as toxicants, are gardens and
orchards. The use of chemical fertilizers, as well as herbicides and pesticides, are
common in these types of land use.
A significant amount of amphibian habitat is provided by the case-study
wetland. The wetland‟s complex micro-topography, seasonal inundation, complex
vegetation communities, and proximity and access to large areas of natural vegetation
improve chances of survival for many species of reptiles and amphibians during
breeding, larval, and adult life-stages. Amphibian and reptile habitat functions are
limited by significant areas of land-cover alteration including the presence of roads,
as well as changes to vegetation. Accelerated increases in the levels of nutrients and
toxicants from sources including failing septic systems, agricultural practices and
domestic animals are limiting the amount of amphibian and habitat provided by the
case-study wetland.

53
Near-by land-use activities have also limited the ability of the case-study
wetlands to provide songbird, raptor, and small mammal habitat. Many of the same
types of land-cover alterations that affect amphibian habitat are also detrimental to
songbird, raptor and small mammal habitat.

54
4. Conclusion
This investigation allows comparisons of the results generated by the various
wetland assessment tools used to describe the case-study wetland, and their overall
usefulness in the context of managing wetlands in rural settings. In addition, the
study addresses the significance of the loss of functions provided by the case-study
wetland as the result of human activities. The value of this case-study involves the
recognition of the cumulative effects of impacts to common wetlands. Although the
case-study wetland does not provide a high level of wetland functions, the permitted
degradation of these types of wetlands may have a significant effect on water quality
in problematic watersheds such as Henderson Inlet.
Both the Classification of Wetlands and Deepwater Habitats of the United
States and the HGM characterization provide meaningful, useful information about
the case study wetland. The Classification of Wetlands and Deepwater Habitats of
the United States provides a set of terms to describe the influence of saltwater, as well
as the vegetation communities present within the wetland. These terms are useful
when comparing wetlands. As only the tallest layer of vegetation is used in the
assessment, however, the information provided is only useful in comparisons done at
a very coarse scale. This system was developed to address three primary objectives.
The first objective is to allow users to describe ecological units with similar
ecological characteristics. The second objective was to provide users with a tool for
making resource management decisions. The final objective was to improve
consistency across wetland mapping and inventory efforts.

55
This system utilizes terms associated with the tallest layer of vegetation
present in a wetland plant community. Terms like emergent, scrub-shrub, and
forested allow users to succinctly describe the dominant vegetation within a wetland.
Modifiers that provide more specific information about water chemistry, water
regime, uncommon soil characteristics, and types of disturbances to wetlands are less
commonly used outside of the National Wetlands Inventory. The emphasis on the
presence and structure of dominant vegetation facilitates aerial photo analysis and
classification, but does not provide the level of detail required to make resource
management decisions in many cases. For example, the presence of rare plant or
animal species, or any other indicators of wetland functions, is not addressed by this
classification system.
Similarly, the HGM approach to wetland classification was useful in
describing the case-study wetland in terms of geomorphic setting and hydrologic
characteristics. The aspects of this classification approach that attempt to determine
wetland functions based on HGM profile characteristics were not utilized in this
investigation. An alternative functional assessment procedure was utilized, due to its
relative ease of use and comparability of the results across different types of wetlands.
The actual HGM classification of the case study wetland was relatively straight
forward and provides useful information for resource-management decision makers.
The case-study wetland rated as Category 3 according to the Wetland Rating
System for Western Washington. This categorization provides a relatively minimal
level of protection due to perceived low levels of species diversity, as well as wetland
functions.

56
Buffers are an important component in the protection of wetland functions.
Buffers reduce the adverse impacts of adjacent land uses and provide important
habitat for wildlife. The width of a wetland‟s buffer is ideally at least equal to the
minimum distance necessary to protect the most sensitive functions provided by the
wetland. Depending on the species present, wildlife functions generally require the
greatest buffer widths, but intact buffers are also important in protecting water-quality
functions.
The Washington State Department of Ecology typically requires buffers of 75
feet (23 m) to 150 feet (46 m) around Category 3 wetlands (Ecology 2006). Ground-
disturbing land-use activities such as grading or clearing vegetation would require
regulatory approval if they are to occur within the regulatory buffer. It is difficult to
determine if a 75-foot (23 m) buffer around the case study wetland is adequate to
protect both habitat and water quality functions. Important details that appear to be
absent from the rating procedure are a recognition that the slope of the buffer, as well
as the buffer‟s vegetative characteristics will significantly affect the potential for
contaminated surface water to reach the wetland (Castelle et al 1992).
The objectives of the Rating System involve differentiating between wetlands
based on several factors, including sensitivity to disturbance, significance,
uniqueness, our ability to reproduce the wetland, and the functions that a wetland
provides. In the context of the case-study wetland, the Category 3 assessment
appears consistent with the stated rational for Category 3 wetlands, due to the
presence of past disturbance and limited vegetative diversity. The assertion that
Category 3 wetlands are isolated from other natural resources in the landscape is not

57
an accurate assessment of the case study wetland, however, as this wetland is one in a
series that connects intact, forested areas to the shore of Henderson Inlet.
In contrast to results of the Rating System, the case-study wetland scores high
for water quality functions according to the ORWAP. While not directly comparable,
the scores of habitat functions, as well as hydrologic (floodwater storage) functions
are similar. According to both sets of results, the case-study wetland provides habitat
functions at moderate levels, while hydrologic functions are only provided at low
levels. These functions are limited by the relatively small size of the case-study
wetland.
The final component of this investigation involves determining the
significance of land-use activities on the functions provided by the case-study
wetland. As is typical in rural setting, activities such as logging, fertilizer use,
nutrient inputs from septic systems, mowing, and the presence of livestock occur or
have occurred within the contributing basin of the case-study wetland.
Habitat functions, particularly those relating to amphibians appear to be most
affected by adjacent land-use activities. Amphibians utilizing the case-study wetland
are subject to adverse conditions during both the aquatic and terrestrial life-stages.
Toxicants and nutrients entering the wetland can be detrimental to the health of
amphibians in early life stages. Similarly, terrestrial amphibians are at some risk
while occupying the adjacent uplands that are regularly mowed.
Water-quality functions are the primary benefits of the case study wetland,
because the vegetation communities provide a high cover of dense herbaceous species
that are capable of tapping sediments, as well as removing nutrients and toxicants

58
from the water column. Additionally, the case-study wetland has the opportunity to
improve the quality of surface water due to the presence of septic tanks, animal waste,
and chemical fertilizers. No removal of this vegetation is currently taking place,
although the presence of livestock has likely affected the way water-quality functions
are provided by the case study wetland; thus, current land-use practices are not
significantly impacting the wetlands ability to provide water-quality functions.
The investigation of the case-study wetland has yielded several insights into
how wetlands are characterized. While there are many methods to assess wetlands,
no one method is capable of capturing all of the information necessary to make
informed management decisions. Wetlands vary dramatically, both physically and
chemically, and management decisions must be made based on sound scientific
evidence and determined on a case by case basis. Protecting wetlands like the case-
study wetland may prove instrumental in improving conditions in the larger, impaired
receiving waters like Henderson Inlet or Hood Canal. It is therefore critical that we
understand the complexities involved in how these wetland-resources function, as
well as the ecological implications of development.

59

60
References:
Adamus, P., J. Morlan, and K. Verble. 2009. Manual for the Oregon Rapid Wetland
Assessment Protocol (ORWAP). Version 2.0. Oregon Dept. of State Lands,
Salem, OR.
Brinson, M.M. 1993. Hydrogeomorphic Classification for Wetlands.
Technical Report WRP-DE-4. U.S. Army Corps of Engineers Waterways
Experiment Station.
Community Trade and Economic Development. 2008. Washington State Growth
Management Act.
Cowardin, L. M., V. Carter, F. C. Golet, E. T. LaRoe. 1979. Classification of
deepwater habitats of the United States. U. S. Department of the Interior, Fish
and Wildlife Service, Washington, D.C. Jamestown, ND: Northern Prairie
Wildlife Research Center Home Page.
http://www.npwrc.usgs.gov/resource/1998/classwet/classwet.htm (Version
04DEC98)
Davis, S., C. Hansen, and L. Hofstad. 2002. Henderson Inlet Watershed
Implementation Program. Thurston County Public Health and Social Services
Department, Environmental Health Division, Resource Protection Programs.
Environmental Laboratory. 1987. “Corps of Engineers Wetlands Delineation
Manual,” Technical Report Y-87-l, US Army Engineer Waterways
Experiment Station, Vicksburg, Miss.
Environmental Protection Agency (EPA) Section 404 of the Clean Water Act of
1972. Http://www.epa.gov/owow/wetlands/pdf/reg_authority_pr.pdf
Hruby, T. 2004. Washington State wetland rating system for western Washington –
Revised. Washington State Department of Ecology Publication # 04-06-025.
Mitch, W. and James G. Gosselink. 2007. Wetlands, Third Edition; John Wiley &
Sons, Inc., New York, NY.
Mueller-Dombois, D., and H. Ellenberg. 1974. Aims and Methods of Vegetation
Ecology. New York, NY; Wiley.
Rigg, G.B. 1958. Peat Resources of Washington. Bulletin No. 44. Division of Mines
and Geology, Washington State Department of Conservation.
Sheldon, D., T. Hruby, P. Johnson, K. Harper, A. McMillan, T. Granger, S. Stanley,

61
and E.Stockdale. March 2005. Wetlands in Washington State - Volume 1: A
Synthesis of the Science. Washington State Department of Ecology.
Publication #05-06- 006. Olympia, WA.
U.S. Army Corps of Engineers. (in prep.). “Interim Regional Supplement to the Corps
of Engineers Wetland Delineation Manual: Western Mountains, Valleys and
Coast Region,” J. S. Wakeley, R. W. Lichvar, and C. V. Noble, eds.,
Technical Report _______, U.S. Army Engineer Research and Development
Center, Vicksburg, MS.
TopoQuest (2010). TopoQuest Map Viewer. http://www.topoquest.com/.
Tulalip Tribes, Snohomish County Department of Public Works, Surface Water
Management. February, 2001. A Historical Analysis of Habitat Alterations In
the Snohomish River Valley, Washington, Since the Mid-19th
Century:
Implications for Chinook and Coho Salmon.
Waitt, Richard B., R. Thorson. 1983. The Cordilleran Ice Sheet in Washington, Idaho,
and Montana: IN: H.E. Wright, Jr., (ed.), 1983, Late-Quaternary
Environments of the United States, Volume 1: The Late Pleistocene (Stephen
C. Porter (ed.)): University of Minnesota Press, 407p., Chapter 3, p.53-70.
Washington Department of Fish and Wildlife. 2008. Priority Habitat and Species
List. Olympia, Washington. 177 pp
Washington State Archives, 2008. Governors Executive Order EO 89-10
http://www.digitalarchives.wa.gov/governorlocke/eo/eoarchive/eo89-10.htm
Washington State Archives 2008. Governors Executive Order EO 90-04
http://www.digitalarchives.wa.gov/governorlocke/eo/eoarchive/eo90-04.htm
Washington State Department of Ecology (Ecology). 1997. Washington State
Wetlands Identification and Delineation Manual. Publication No.96-94,
Olympia, WA.
Washington State Department of Ecology . Shoreline Management Act. 2008
http://www.ecy.wa.gov/programs/sea/sma/index.html
Washington State Department of Ecology. Washington State Environmental Policy
(SEPA), 2008 http://www.ecy.wa.gov/programs/sea/sepa/e-review.html

62
Washington State Department of Transportation. (2010). WSDOT GeoData
Distribution Site.
http://www.wsdot.wa.gov/mapsdata/geodatacatalog/default.htm#admin
Wiedemann, A. M. 1984. The ecology of Pacific Northwest coastal sand dunes: a
community profile. Washington, D.C.: The Team.