Embed Size (px)
Citation preview
Deloitte Research Centre | Seventh issue | 2Q 2017
Russia through a lensMacroeconomic outlookKey Russian macroeconomic indicators in 2Q 2017
Page 04
Innovations and digitalization40 RUB billion is R&D expenses planned by the surveyed companies in 2017
Page 16
Steel and iron marketOver the first three months of 2017 saw global steel output reach 410.5 mln tonnes, up 5.7 % from the same period in 2016
Page 22
Pharmaceutical MarketNew trends in strategic development: focus on R&D activities and deeper localization
Page 24
Russia through a lens
02
03
Russia through a lens
Content
04Russia in figuresMacroeconomic outlook (GDP, inflation, trade indicators, currency rate, Central Bank key rate, top-pricing, etc.)
14Research Centre market analysis"CFO Survey in Russia""Overview of steel and iron market""Russian Pharmaceutical Market Trends in 2017"
27Global windTop news: China and RussiaTop news: Europe and Russia
30Contacts
28Useful stickers
26Top M&AsTop-5 deals in Russia
Page 14 Page 22 Page 24
We are pleased to present the latest edition of Russia Through a Lens, the macroeconomic journal produced by Deloitte Research Centre in Moscow.
Established in December 2015, the journal is published quarterly and falls under the Research Centre’s monitoring activities.
In Russia Through a Lens, we focus on current key trends in the Russian economy and present our research key findings.
If you have any questions or suggestions regarding this research, please do not hesitate to contact us:[email protected]
Designed by the Deloitte Design Group, Moscow
Russia through a lens | Russia in figures
04
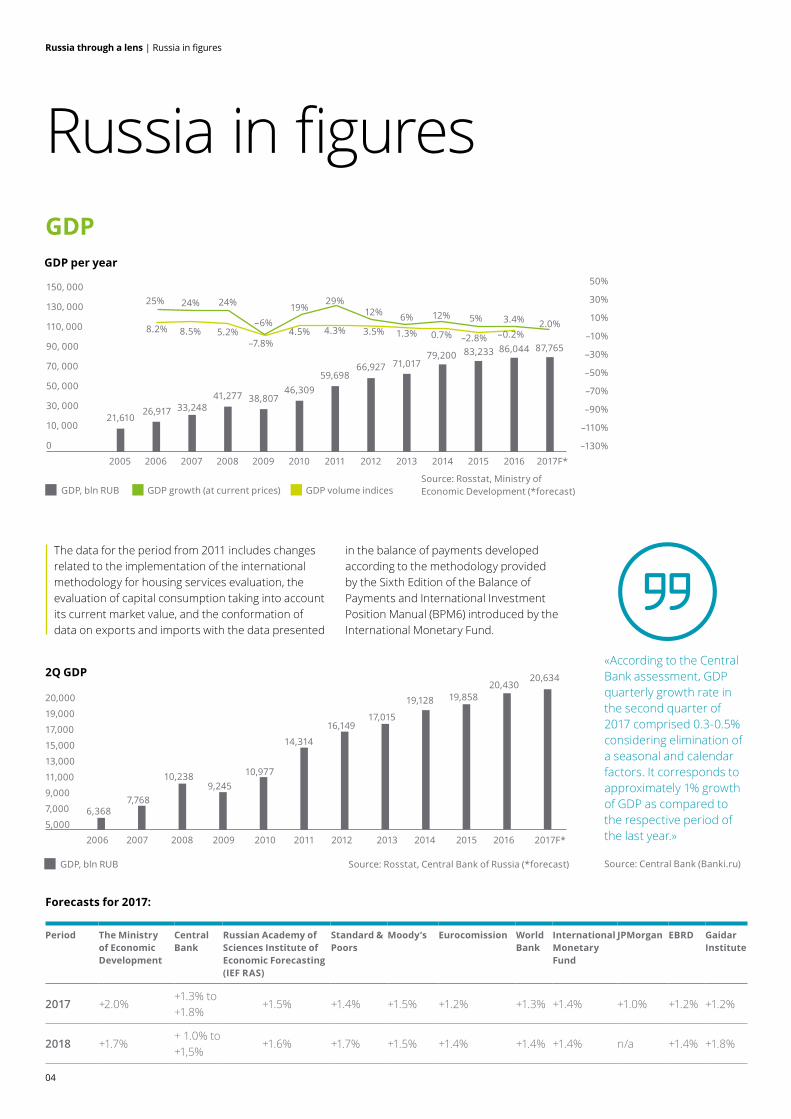
Russia in figuresGDPGDP per year
The data for the period from 2011 includes changes related to the implementation of the international methodology for housing services evaluation, the evaluation of capital consumption taking into account its current market value, and the conformation of data on exports and imports with the data presented
in the balance of payments developed according to the methodology provided by the Sixth Edition of the Balance of Payments and International Investment Position Manual (BPM6) introduced by the International Monetary Fund.
Forecasts for 2017:
Period The Ministry of Economic Development
Central Bank
Russian Academy of Sciences Institute of Economic Forecasting (IEF RAS)
Standard & Poors
Moody’s Eurocomission World Bank
International Monetary Fund
JPMorgan EBRD Gaidar Institute
2017 +2.0%+1.3% to +1.8%
+1.5% +1.4% +1.5% +1.2% +1.3% +1.4% +1.0% +1.2% +1.2%
2018 +1.7%+ 1.0% to +1,5%
+1.6% +1.7% +1.5% +1.4% +1.4% +1.4% n/a +1.4% +1.8%
150, 000
130, 000
110, 000
90, 000
70, 000
50, 000
30, 000
10, 000
0
21,61026,917
25%
33,248
24% 24%
41,277
–6%
38,807
19%
46,309
29%
59,698
12%
66,927
6%
71,017
12%
79,200
5%
–2.8%83,233
3.4% 2.0%–0.2%86,044 87,765
50%
30%
10%
–10%
–30%
–50%
–70%
–90%
–110%
–130%
0.7%1.3%3.5%4.3%4.5%–7.8%
5.2%8.5%8.2%
2005 2006 20102008 2012 2015 2007 2011 20142009 2013 2016 2017F*
GDP, bln RUB GDP growth (at current prices) GDP volume indicesSource: Rosstat, Ministry of Economic Development (*forecast)
Source: Rosstat, Central Bank of Russia (*forecast)
2Q GDP
20,000
19,000
17,000
15,000
13,000
11,000
9,000
7,000
5,0006,368
7,768
10,2389,245
10,977
14,314
16,14917,015
19,128 19,85820,430
20,634
2006 2007 2008 2009 2010 2011 2012 2013 2014 2015 2016 2017F*
GDP, bln RUB
«According to the Central Bank assessment, GDP quarterly growth rate in the second quarter of 2017 comprised 0.3-0.5% considering elimination of a seasonal and calendar factors. It corresponds to approximately 1% growth of GDP as compared to the respective period of the last year.»
Source: Central Bank (Banki.ru)
Russia through a lens | Russia in figures
05
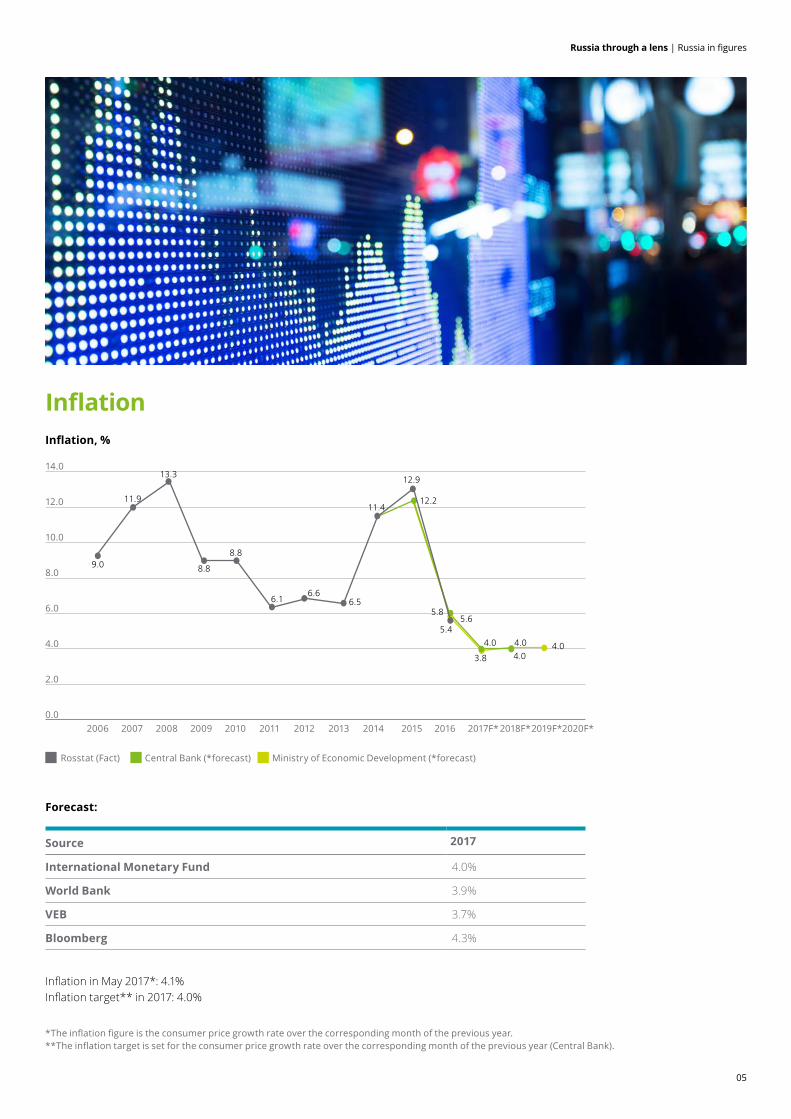
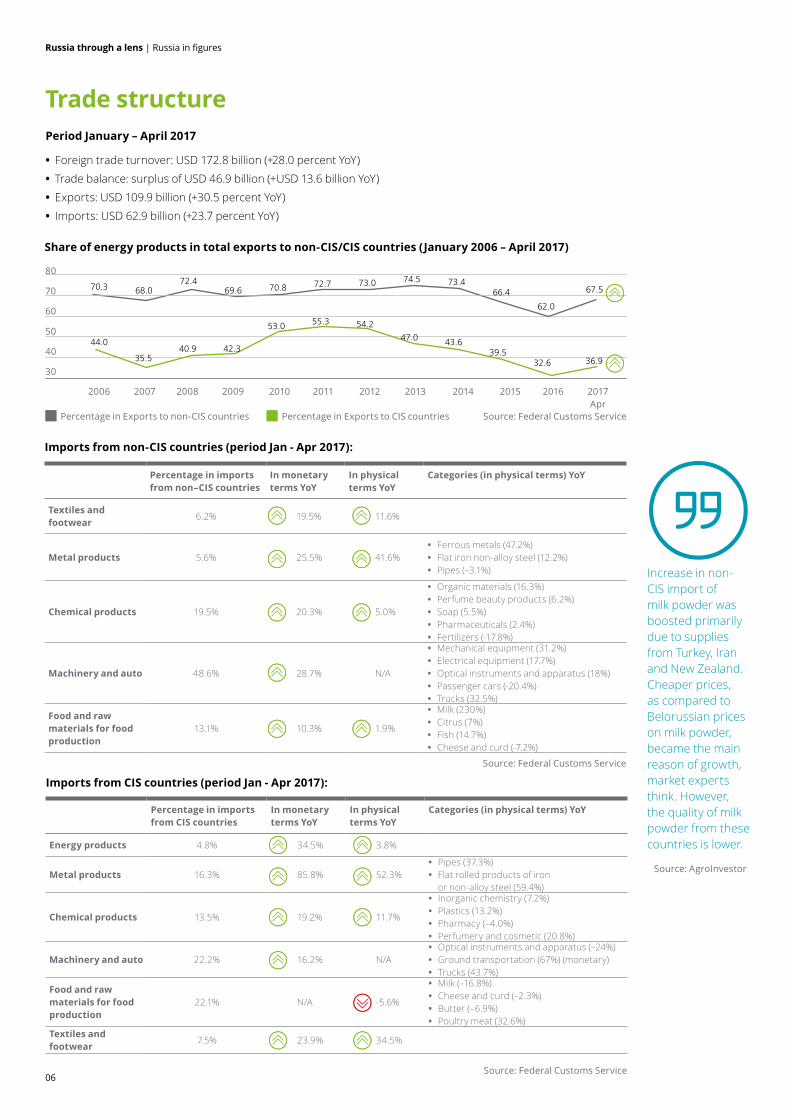
InflationInflation, %
Forecast:
Source 2017
International Monetary Fund 4.0%
World Bank 3.9%
VEB 3.7%
Bloomberg 4.3%
Inflation in May 2017*: 4.1%Inflation target** in 2017: 4.0%
*The inflation figure is the consumer price growth rate over the corresponding month of the previous year.**The inflation target is set for the consumer price growth rate over the corresponding month of the previous year (Central Bank).
14.0
12.0
10.0
8.0
6.0
4.0
2.0
0.02006 2007 2008 2009 2010 2011 2012 2013 2014 2015 2016 2017F* 2018F* 2019F*2020F*
9.0
13.3
8.8
8.8
6.16.6
6.5
12.9
12.2
5.44.0 4.04.03.8
4.0
5.85.6
Rosstat (Fact) Central Bank (*forecast) Ministry of Economic Development (*forecast)
11.911.4
Russia through a lens | Russia in figures
06
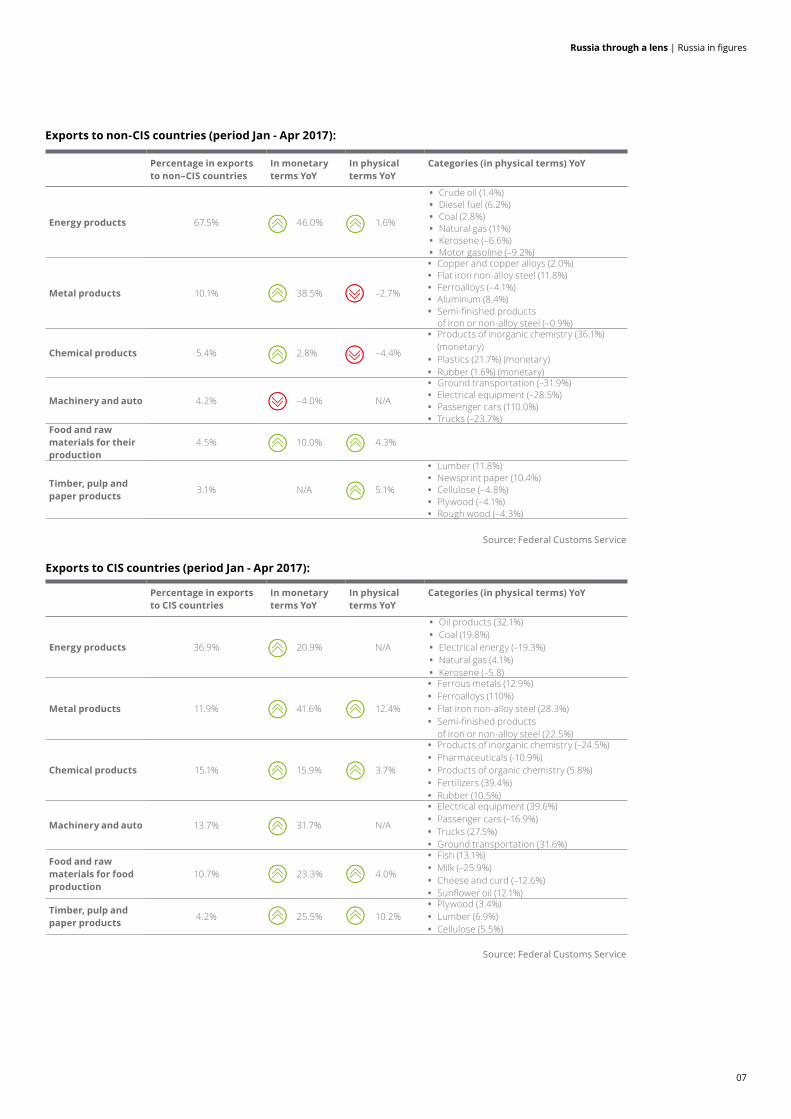
Trade structurePeriod January – April 2017
• Foreign trade turnover: USD 172.8 billion (+28.0 percent YoY)
• Trade balance: surplus of USD 46.9 billion (+USD 13.6 billion YoY)
• Exports: USD 109.9 billion (+30.5 percent YoY)
• Imports: USD 62.9 billion (+23.7 percent YoY)
Imports from non-CIS countries (period Jan - Apr 2017):
Source: Federal Customs Service
Percentage in imports from non–CIS countries
In monetary terms YoY
In physical terms YoY
Categories (in physical terms) YoY
Textiles and footwear 6.2% 19.5% 11.6%
Metal products 5.6% 25.5% 41.6% • Ferrous metals (47.2%) • Flat iron non-alloy steel (12.2%) • Pipes (–3.1%)
Chemical products 19.5% 20.3% 5.0%
• Organic materials (16.3%) • Perfume beauty products (6.2%) • Soap (5.5%) • Pharmaceuticals (2.4%) • Fertilizers (-17.8%)
Machinery and auto 48.6% 28.7% N/A
• Mechanical equipment (31.2%) • Electrical equipment (17.7%) • Optical instruments and apparatus (18%) • Passenger cars (-20.4%) • Trucks (32.5%)
Food and raw materials for food production
13.1% 10.3% 1.9%
• Milk (230%) • Citrus (7%) • Fish (14.7%) • Cheese and curd (-7.2%)
Source: Federal Customs Service
Imports from CIS countries (period Jan - Apr 2017):
Percentage in imports from CIS countries
In monetary terms YoY
In physical terms YoY
Categories (in physical terms) YoY
Energy products 4.8% 34.5% 3.8%
Metal products 16.3% 85.8% 52.3% • Pipes (37.3%) • Flat rolled products of iron
or non-alloy steel (59.4%)
Chemical products 13.5% 19.2% 11.7%
• Inorganic chemistry (7.2%) • Plastics (13.2%) • Pharmacy (–4.0%) • Perfumery and cosmetic (20.8%)
Machinery and auto 22.2% 16.2% N/A • Optical instruments and apparatus (–24%) • Ground transportation (67%) (monetary) • Trucks (43.7%)
Food and raw materials for food production
22.1% N/A -5.6%
• Milk (–16.8%) • Cheese and curd (–2.3%) • Butter (–6.9%) • Poultry meat (32.6%)
Textiles and footwear 7.5% 23.9% 34.5%
Source: AgroInvestor
Share of energy products in total exports to non-CIS/CIS countries (January 2006 – April 2017)
Source: Federal Customs ServicePercentage in Exports to non-CIS countries Percentage in Exports to CIS countries
80
70
60
50
40
30
2006 2007 2008 2009 2010 2011 2012 2013 2014 2015 2016 2017 Apr
32.6 36.939.5
54.2
42.343.6
55.3
40.947.0
53.0
35.5
62.0
67.566.473.0
69.673.472.772.4 74.5
70.868.070.3
44.0
Increase in non-CIS import of milk powder was boosted primarily due to supplies from Turkey, Iran and New Zealand. Cheaper prices, as compared to Belorussian prices on milk powder, became the main reason of growth, market experts think. However, the quality of milk powder from these countries is lower.
Russia through a lens | Russia in figures
07
Exports to non-CIS countries (period Jan - Apr 2017):
Percentage in exports to non–CIS countries
In monetary terms YoY
In physical terms YoY
Categories (in physical terms) YoY
Energy products 67.5% 46.0% 1.6%
• Crude oil (1.4%) • Diesel fuel (6.2%) • Coal (2.8%) • Natural gas (11%) • Kerosene (–6.6%) • Motor gasoline (–9.2%)
Metal products 10.1% 38.5% –2.7%
• Copper and copper alloys (2.0%) • Flat iron non-alloy steel (11.8%) • Ferroalloys (–4.1%) • Aluminum (8.4%) • Semi-finished products
of iron or non-alloy steel (–0.9%)
Chemical products 5.4% 2.8% –4.4%
• Products of inorganic chemistry (36.1%) (monetary)
• Plastics (21.7%) (monetary) • Rubber (1.6%) (monetary)
Machinery and auto 4.2% –4.0% N/A
• Ground transportation (–31.9%) • Electrical equipment (–28.5%) • Passenger cars (110.0%) • Trucks (–23.7%)
Food and raw materials for their production
4.5% 10.0% 4.3%
Timber, pulp and paper products 3.1% N/A 5.1%
• Lumber (11.8%) • Newsprint paper (10.4%) • Cellulose (–4.8%) • Plywood (–4.1%) • Rough wood (–4.3%)
Source: Federal Customs Service
Exports to CIS countries (period Jan - Apr 2017):
Percentage in exports to CIS countries
In monetary terms YoY
In physical terms YoY
Categories (in physical terms) YoY
Energy products 36.9% 20.9% N/A
• Oil products (32.1%) • Coal (19.8%) • Electrical energy (–19.3%) • Natural gas (4.1%) • Kerosene (–5.8)
Metal products 11.9% 41.6% 12.4%
• Ferrous metals (12.9%) • Ferroalloys (110%) • Flat iron non-alloy steel (28.3%) • Semi-finished products
of iron or non-alloy steel (22.5%)
Chemical products 15.1% 15.9% 3.7%
• Products of inorganic chemistry (–24.5%) • Pharmaceuticals (-10.9%) • Products of organic chemistry (5.8%) • Fertilizers (39.4%) • Rubber (10.5%)
Machinery and auto 13.7% 31.7% N/A
• Electrical equipment (39.6%) • Passenger cars (–16.9%) • Trucks (27.5%) • Ground transportation (31.6%)
Food and raw materials for food production
10.7% 23.3% 4.0%
• Fish (13.1%) • Milk (–25.9%) • Cheese and curd (–12.6%) • Sunflower oil (12.1%)
Timber, pulp and paper products 4.2% 25.5% 10.2%
• Plywood (3.4%) • Lumber (6.9%) • Cellulose (5.5%)
Source: Federal Customs Service
Russia through a lens | Russia in figures
08
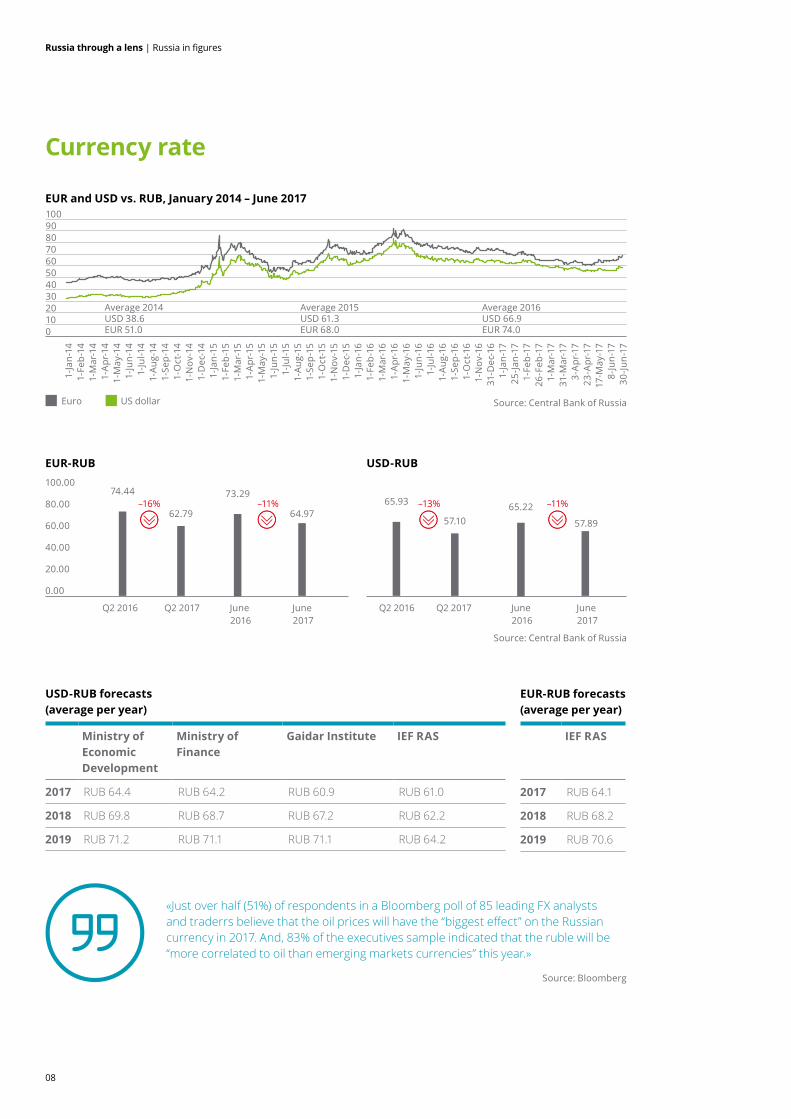
EUR-RUB USD-RUB
EUR and USD vs. RUB, January 2014 – June 2017
Currency rate
USD-RUB forecasts (average per year)
EUR-RUB forecasts (average per year)
Ministry of Economic Development
Ministry of Finance
Gaidar Institute IEF RAS
2017 RUB 64.4 RUB 64.2 RUB 60.9 RUB 61.0
2018 RUB 69.8 RUB 68.7 RUB 67.2 RUB 62.2
2019 RUB 71.2 RUB 71.1 RUB 71.1 RUB 64.2
IEF RAS
2017 RUB 64.1
2018 RUB 68.2
2019 RUB 70.6
Source: Central Bank of Russia
100.00
80.00
60.00
40.00
20.00
0.00
74.44
Q2 2016 Q2 2016
65.93
June 2016
June 2016
73.2965.22
Q2 2017 Q2 2017
62.7957.10
–13%–16% –11% –11%
June 2017
June 2017
64.9757.89
Source: Bloomberg
Source: Central Bank of Russia
1009080706050403020100
1-Ja
n-14
1-Fe
b-14
1-M
ar-1
41-
Apr
-14
1-M
ay-1
41-
Jun-
141-
Jul-1
41-
Aug-
141-
Sep-
141-
Oct
-14
1-N
ov-1
41-
Dec
-14
1-Ja
n-15
1-Fe
b-15
1-M
ar-1
51-
Apr
-15
1-M
ay-1
51-
Jun-
151-
Jul-1
51-
Aug-
151-
Sep-
151-
Oct
-15
1-N
ov-1
51-
Dec
-15
1-Ja
n-16
1-Fe
b-16
1-M
ar-1
61-
Apr
-16
1-M
ay-1
61-
Jun-
161-
Jul-1
61-
Aug-
161-
Sep-
161-
Oct
-16
1-N
ov-1
631
-Dec
-16
1-Ja
n-17
25-Ja
n-17
1-Fe
b-17
26-F
eb-1
71-
Mar
-17
31-M
ar-1
73-
Apr
-17
23-A
pr-1
717
-May
-17
8-Ju
n-17
30-Ju
n-17
Euro US dollar
Average 2014USD 38.6EUR 51.0
Average 2015USD 61.3EUR 68.0
Average 2016USD 66.9EUR 74.0
«Just over half (51%) of respondents in a Bloomberg poll of 85 leading FX analysts and traderrs believe that the oil prices will have the “biggest effect” on the Russian currency in 2017. And, 83% of the executives sample indicated that the ruble will be “more correlated to oil than emerging markets currencies” this year.»
Russia through a lens | Russia in figures
09
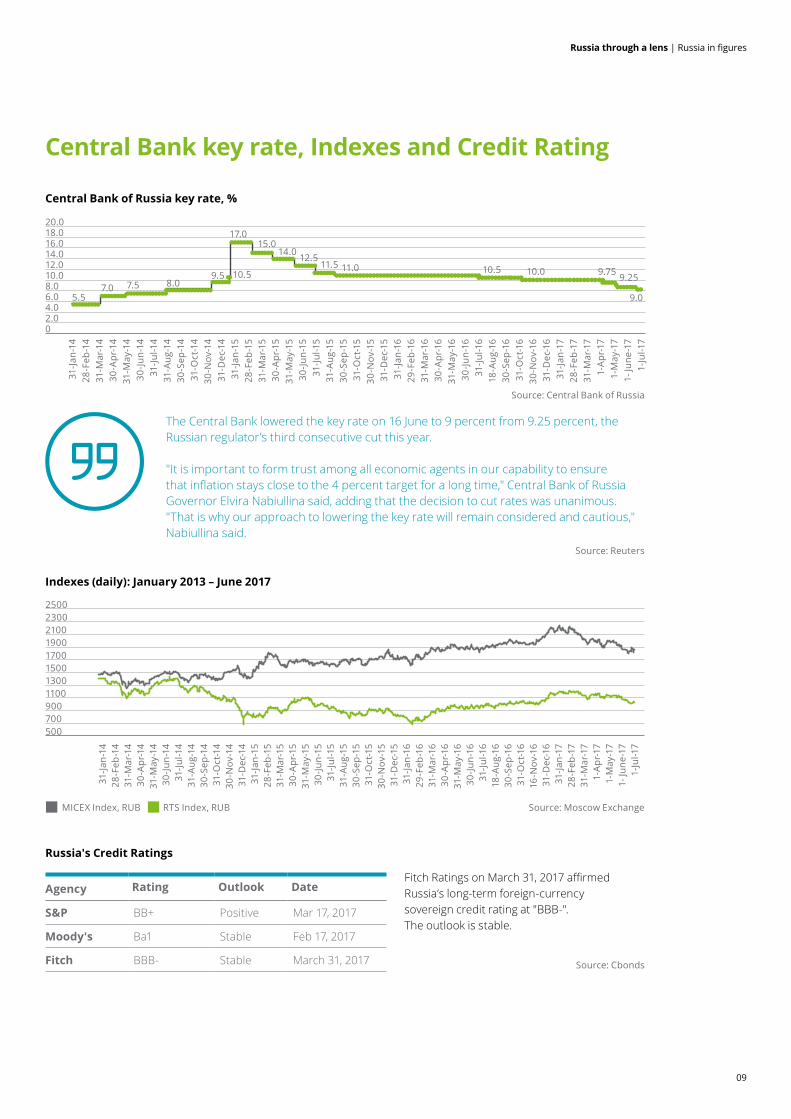
Central Bank of Russia key rate, %
Indexes (daily): January 2013 – June 2017
Russia's Credit Ratings
Central Bank key rate, Indexes and Credit Rating
Agency Rating Outlook Date
S&P BB+ Positive Mar 17, 2017
Moody's Ba1 Stable Feb 17, 2017
Fitch BBB- Stable March 31, 2017
Source: Reuters
Source: Central Bank of Russia
31-Ja
n-14
28-F
eb-1
431
-Mar
-14
30-A
pr-1
431
-May
-14
30-Ju
n-14
31-Ju
l-14
31-A
ug-1
430
-Sep
-14
31-O
ct-1
430
-Nov
-14
31-D
ec-1
431
-Jan-
1528
-Feb
-15
31-M
ar-1
530
-Apr
-15
31-M
ay-1
530
-Jun-
1531
-Jul-1
531
-Aug
-15
30-S
ep-1
531
-Oct
-15
30-N
ov-1
531
-Dec
-15
31-Ja
n-16
29-F
eb-1
631
-Mar
-16
30-A
pr-1
631
-May
-16
30-Ju
n-16
31-Ju
l-16
18-A
ug-1
630
-Sep
-16
31-O
ct-1
630
-Nov
-16
31-D
ec-1
631
-Jan-
1728
-Feb
-17
31-M
ar-1
71-
Apr
-17
1-M
ay-1
71-
June
-17
1-Ju
l-17
20.018.016.014.012.010.08.06.04.02.00
Source: Moscow Exchange
Source: Cbonds
MICEX Index, RUB RTS Index, RUB
9.5 10.5
5.57.0 7.5 8.0
17.015.0
12.511.5 11.0 10.5 10.0 9.25
9.0
9.75
14.0
31-Ja
n-14
28-F
eb-1
431
-Mar
-14
30-A
pr-1
431
-May
-14
30-Ju
n-14
31-Ju
l-14
31-A
ug-1
430
-Sep
-14
31-O
ct-1
430
-Nov
-14
31-D
ec-1
431
-Jan-
1528
-Feb
-15
31-M
ar-1
530
-Apr
-15
31-M
ay-1
530
-Jun-
1531
-Jul-1
531
-Aug
-15
30-S
ep-1
531
-Oct
-15
30-N
ov-1
531
-Dec
-15
31-Ja
n-16
29-F
eb-1
631
-Mar
-16
30-A
pr-1
631
-May
-16
30-Ju
n-16
31-Ju
l-16
18-A
ug-1
630
-Sep
-16
31-O
ct-1
616
-Nov
-16
31-D
ec-1
6 31
-Jan-
1728
-Feb
-17
31-M
ar-1
71-
Apr
-17
1-M
ay-1
71-
June
-17
1-Ju
l-17
25002300210019001700150013001100900700500
The Central Bank lowered the key rate on 16 June to 9 percent from 9.25 percent, the Russian regulator’s third consecutive cut this year.
"It is important to form trust among all economic agents in our capability to ensure that inflation stays close to the 4 percent target for a long time," Central Bank of Russia Governor Elvira Nabiullina said, adding that the decision to cut rates was unanimous."That is why our approach to lowering the key rate will remain considered and cautious," Nabiullina said.
Fitch Ratings on March 31, 2017 affirmed Russia’s long-term foreign-currency sovereign credit rating at "BBB-". The outlook is stable.
Russia through a lens | Russia in figures
10
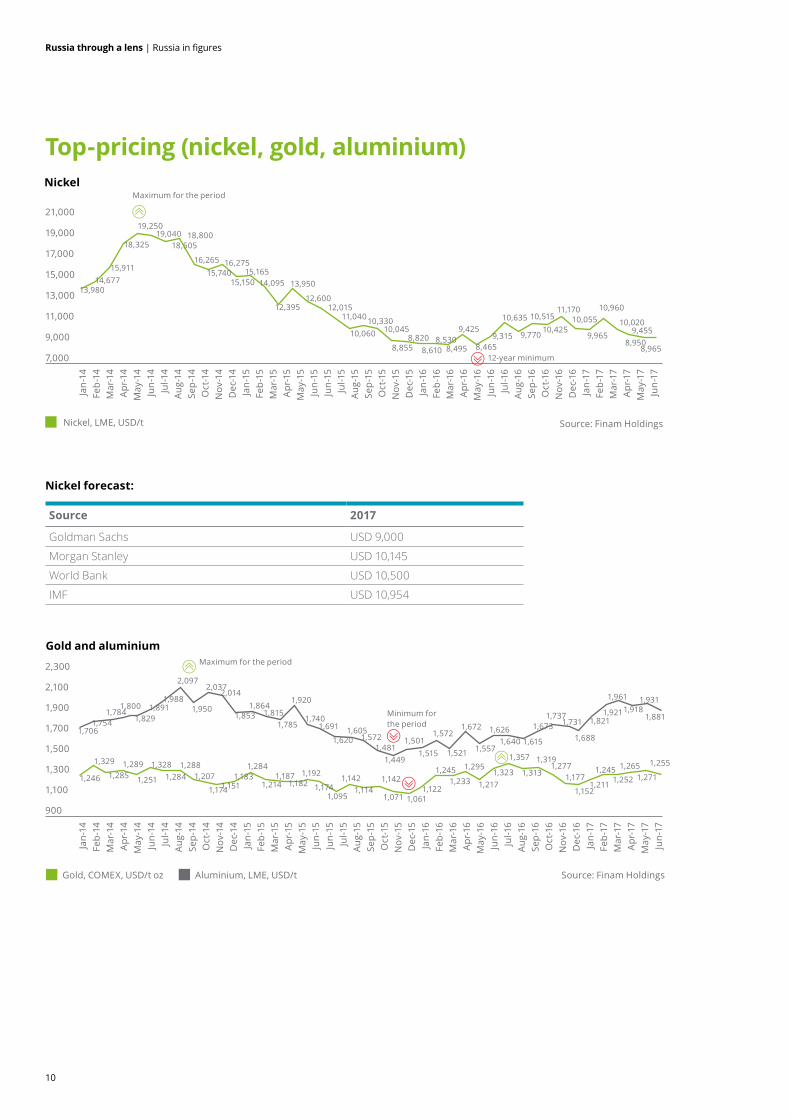
Top-pricing (nickel, gold, aluminium)
Nickel forecast:
Source 2017
Goldman Sachs USD 9,000
Morgan Stanley USD 10,145
World Bank USD 10,500
IMF USD 10,954
Source: Finam Holdings
2,300
2,100
1,900
1,700
1,500
1,300
1,100
900
Gold and aluminium
Gold, COMEX, USD/t oz Aluminium, LME, USD/t
1,706
1,246
1,329
1,2851,289
1,251
1,3281,284
1,2881,207
1,1741,151
1,7541,784
1,8001,829
1,8911,988
2,097
1,950
2,0372,014
1,8531,864
1,8151,785
1,920
1,7401,691
1,6201,605
1,5721,481
1,449
1,5011,572
1,521
1,672
1,557
1,6261,640 1,615
1,6731,737
1,277
1,731
1,177
1,688
1,9611,918
1,931
1,8811,9211,821
1,1521,211
1,2451,252
1,2651,271
1,2551,515
1,1831,284
1,2141,187
1,1821,192
1,1741,095
1,1421,114
1,142
1,071 1,0611,122
1,2451,233
1,295
1,2171,323
1,357
1,313
1,319
Maximum for the period
Minimum for the period
Nickel
21,000
19,000
17,000
15,000
13,000
11,000
9,000
7,000
Maximum for the period
12-year minimum
13,98014,677
15,911
18,325
19,25019,040
18,50518,800
16,26515,740
16,275
15,15015,165
14,095
12,395
13,950
12,60012,015
11,040
10,06010,330
10,045
8,8558,820
8,6108,530
8,495
9,425
8,4659,315
10,635
9,770
10,515
Nickel, LME, USD/t Source: Finam Holdings
Jan-
14Fe
b-14
Mar
-14
Apr
-14
May
-14
Jun-
14Ju
l-14
Aug-
14Se
p-14
Oct
-14
Nov
-14
Dec
-14
Jan-
15Fe
b-15
Mar
-15
Apr
-15
May
-15
Jun-
15Ju
n-15
Jul-1
5Au
g-15
Sep-
15O
ct-1
5N
ov-1
5D
ec-1
5Ja
n-16
Feb-
16M
ar-1
6A
pr-1
6M
ay-1
6Ju
n-16
Jul-1
6Au
g-16
Sep-
16O
ct-1
6N
ov-1
6D
ec-1
6Ja
n-17
Feb-
17M
ar-1
7A
pr-1
7M
ay-1
7Ju
n-17
Jan-
14Fe
b-14
Mar
-14
Apr
-14
May
-14
Jun-
14Ju
l-14
Aug-
14Se
p-14
Oct
-14
Nov
-14
Dec
-14
Jan-
15Fe
b-15
Mar
-15
Apr
-15
May
-15
Jun-
15Ju
n-15
Jul-1
5Au
g-15
Sep-
15O
ct-1
5N
ov-1
5D
ec-1
5Ja
n-16
Feb-
16M
ar-1
6A
pr-1
6M
ay-1
6Ju
n-16
Jul-1
6Au
g-16
Sep-
16O
ct-1
6N
ov-1
6D
ec-1
6Ja
n-17
Feb-
17M
ar-1
7A
pr-1
7M
ay-1
7Ju
n-17
10,425
11,17010,055
9,965 9,4558,950
8,965
10,960
10,020
Russia through a lens | Russia in figures
11
Source 2017 2018
Morgan Stanley USD 1,243 USD 1,250
World Bank USD 1,225 USD 1,206
Goldman Sachs Group USD 1,227 USD 1,250
Credit Suisse USD 1,323 USD 1,375
Oxford Economics USD 1,250 USD 1,265
Source 2017 2018
Goldman Sachs Group USD 2,100 USD 1,950
World Bank USD 1,800 USD 1,828
Morgan Stanley USD 1,808 USD 1,852
IMF USD 1,893 USD 1,928
Oxford Economics USD 1,700 USD 1,766
Gold forecasts:
Aluminium forecasts:
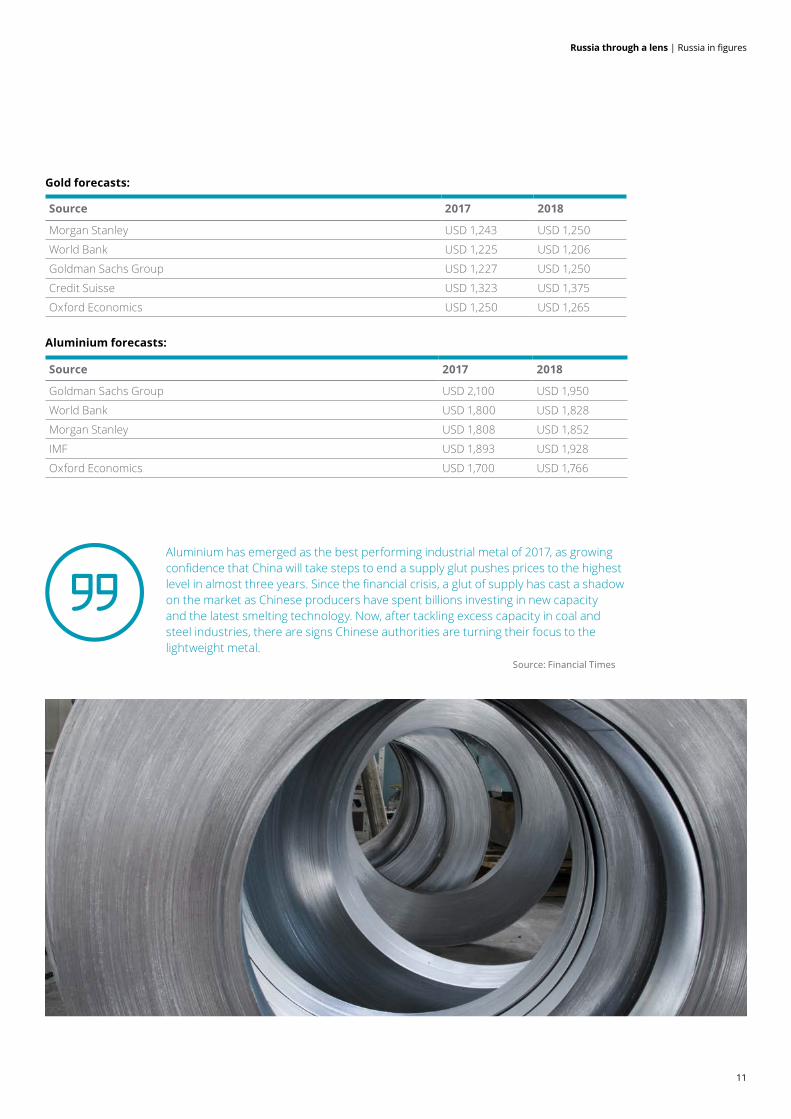
Source: Financial Times
Aluminium has emerged as the best performing industrial metal of 2017, as growing confidence that China will take steps to end a supply glut pushes prices to the highest level in almost three years. Since the financial crisis, a glut of supply has cast a shadow on the market as Chinese producers have spent billions investing in new capacity and the latest smelting technology. Now, after tackling excess capacity in coal and steel industries, there are signs Chinese authorities are turning their focus to the lightweight metal.
Russia through a lens | Russia in figures
12
Natural gas forecasts:
Crude oil forecasts:
Source 2017 2018
U.S. Energy Information Administration USD 52.69 USD 55.61
World Bank USD 55 USD 60
Central Bank of the Russian Federation USD 50 USD 40
Ministry of Economic Development USD 45.6 USD 40.8
Standard & Poors USD 52 USD 50
IMF USD 55.2 USD 55.1
European Central Bank USD 51.6 USD 51.4
Goldman Sachs USD 55.39 USD 58
IEF RAS USD 53 USD 55
JPMorgan USD 55.78 USD 45
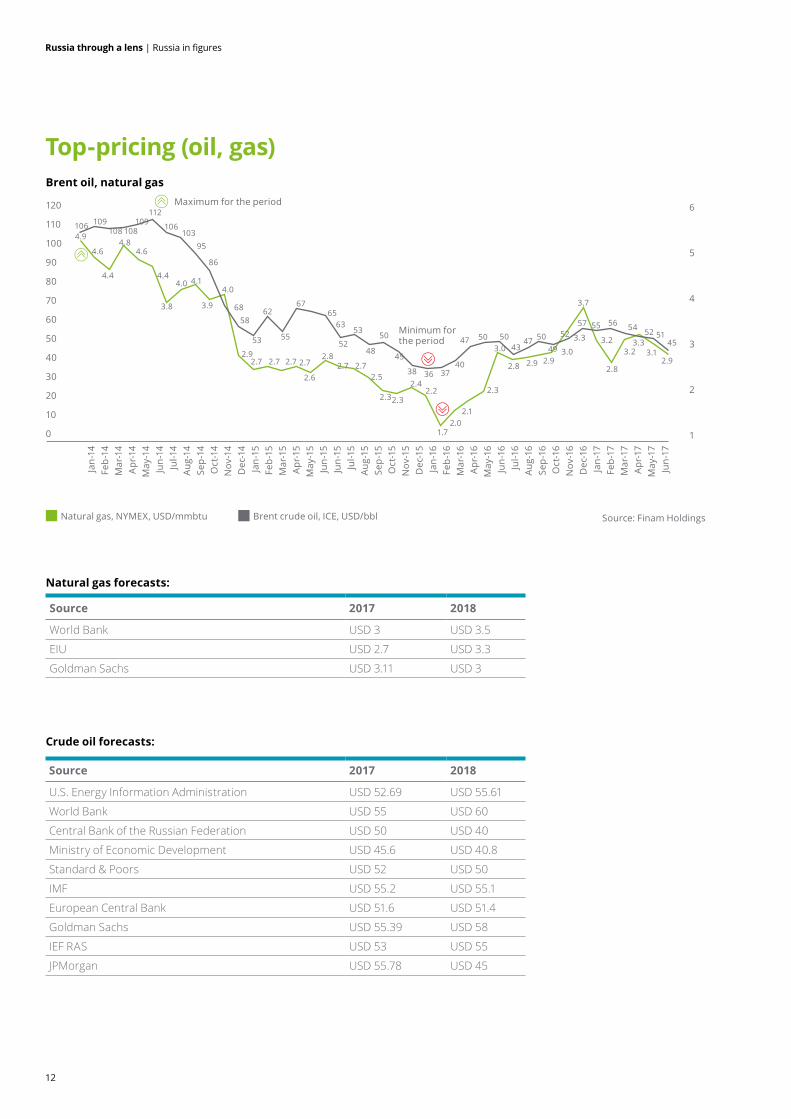
Top-pricing (oil, gas)
Source 2017 2018
World Bank USD 3 USD 3.5
EIU USD 2.7 USD 3.3
Goldman Sachs USD 3.11 USD 3
120
110
100
90
80
70
60
50
40
30
20
10
0
6
5
4
3
2
1
Brent oil, natural gasMaximum for the period
Minimum for the period
Source: Finam Holdings Natural gas, NYMEX, USD/mmbtu Brent crude oil, ICE, USD/bbl
4.9
4.6
4.4
4.84.6
4.4
3.8
4.0 4.1
3.9
4.0
2.7 2.7 2.7 2.72.5
2.32.3
2.4
1.7
2.7
2.6
2.72.82.9
106
2.02.1
2.3
3.0
2.8
3.0
3.3
2.92.9
3.2
2.2
109108 108
109112
68
53
62
55
6765
63
5248
50
45
38 36 3740
47 50 50 5043 49
4752
57 55 56 54 52 5145
53
106103
95
86
58
2.8
3.23.3
3.12.9
3.7
Jan-
14Fe
b-14
Mar
-14
Apr
-14
May
-14
Jun-
14Ju
l-14
Aug-
14Se
p-14
Oct
-14
Nov
-14
Dec
-14
Jan-
15Fe
b-15
Mar
-15
Apr
-15
May
-15
Jun-
15Ju
n-15
Jul-1
5Au
g-15
Sep-
15O
ct-1
5N
ov-1
5D
ec-1
5Ja
n-16
Feb-
16M
ar-1
6A
pr-1
6M
ay-1
6Ju
n-16
Jul-1
6Au
g-16
Sep-
16O
ct-1
6N
ov-1
6D
ec-1
6Ja
n-17
Feb-
17M
ar-1
7A
pr-1
7M
ay-1
7Ju
n-17
Russia through a lens | Russia in figures
1313
Russia through a lens | Russia in figures
Russia through a lens | Research Centre market analysis
14
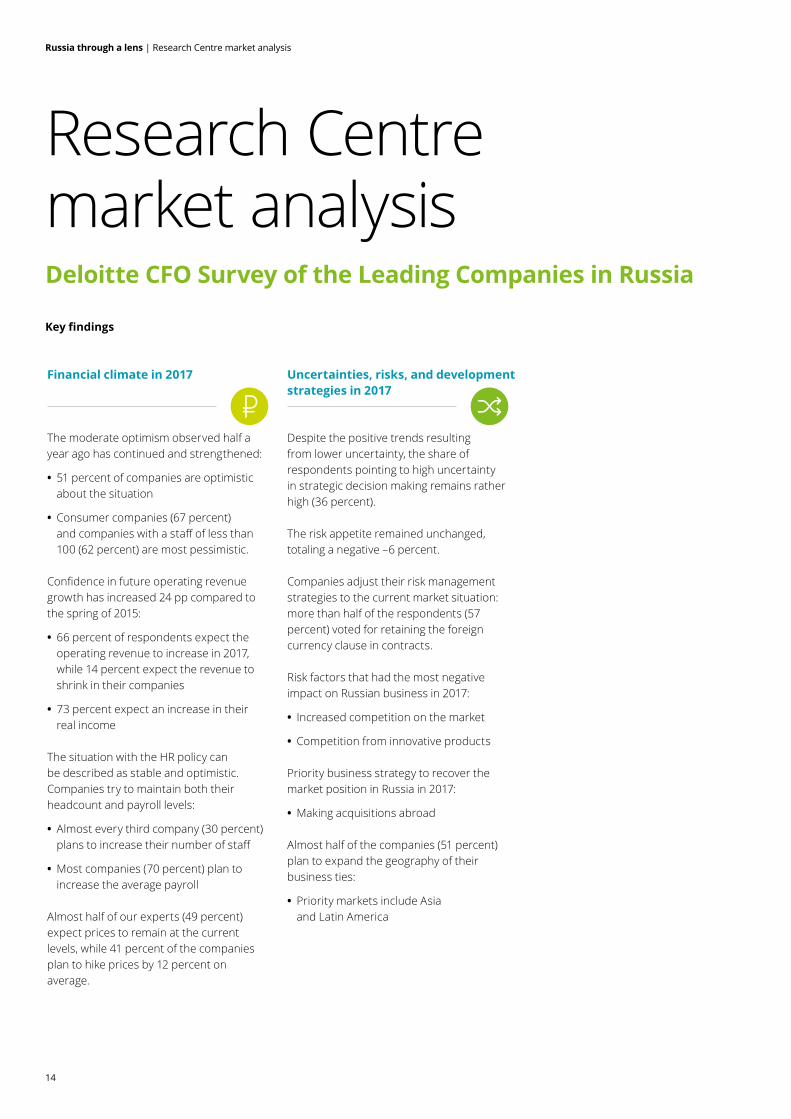
Deloitte CFO Survey of the Leading Companies in Russia
Key findings
Research Centre market analysis
Financial climate in 2017 Uncertainties, risks, and development strategies in 2017
The moderate optimism observed half a year ago has continued and strengthened:
• 51 percent of companies are optimistic about the situation
• Consumer companies (67 percent) and companies with a staff of less than 100 (62 percent) are most pessimistic.
Confidence in future operating revenue growth has increased 24 pp compared to the spring of 2015:
• 66 percent of respondents expect the operating revenue to increase in 2017, while 14 percent expect the revenue to shrink in their companies
• 73 percent expect an increase in their real income
The situation with the HR policy can be described as stable and optimistic. Companies try to maintain both their headcount and payroll levels:
• Almost every third company (30 percent) plans to increase their number of staff
• Most companies (70 percent) plan to increase the average payroll
Almost half of our experts (49 percent) expect prices to remain at the current levels, while 41 percent of the companies plan to hike prices by 12 percent on average.
Despite the positive trends resulting from lower uncertainty, the share of respondents pointing to high uncertainty in strategic decision making remains rather high (36 percent).
The risk appetite remained unchanged, totaling a negative –6 percent.
Companies adjust their risk management strategies to the current market situation: more than half of the respondents (57 percent) voted for retaining the foreign currency clause in contracts.
Risk factors that had the most negative impact on Russian business in 2017:
• Increased competition on the market
• Competition from innovative products
Priority business strategy to recover the market position in Russia in 2017:
• Making acquisitions abroad
Almost half of the companies (51 percent) plan to expand the geography of their business ties:
• Priority markets include Asia and Latin America
Russia through a lens | Research Centre market analysis
15
Drivers and barriers for business in Russia in 2017
Innovations in Russia in 2017
The long-term impact of the global crisis gradually fades away: in 1H17 currency risks were not identified within the top-5 barriers.
Drivers of business development in Russia:
• Cost optimization
• Expansion into new markets
• Focus on core operations
• Innovative products
• Digitalization
Barriers for business development in Russia:
• Increase in the cost of capital
• Financial condition
• Production in Russia
• Production abroad
• Innovations
One out of every three companies (34 percent) that implemented structural and organizational changes grew in value.
TMT and manufacturing companies won the highest ratings among other industries for implementing disruptive technologies.
More than half of the surveyed companies (58 percent) said they spent up to one percent of their annual revenue on R&D.
According to 58 percent of the poll participants, most innovations come from dedicated divisions within companies.
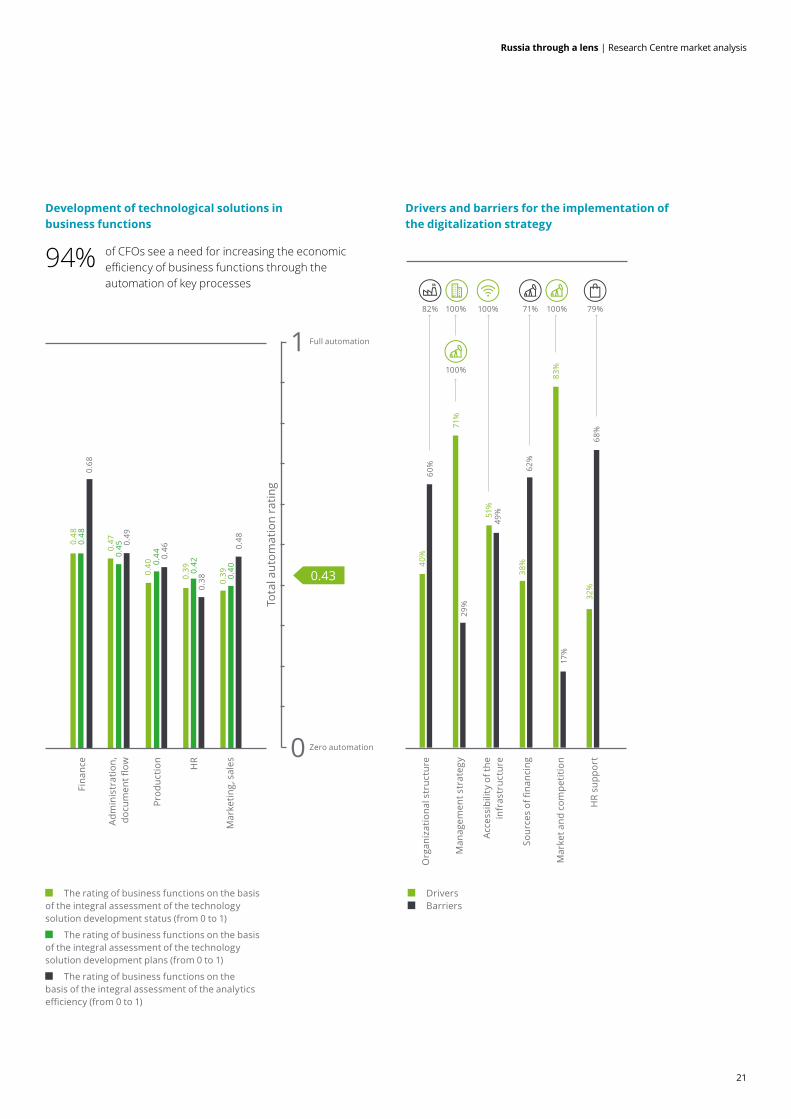
The experts rated the level of function automation in leading Russian companies slightly below the average (0.43 out of 1).
The administrative function was rated as the most advanced (after the financial function) in terms of the quality of analytics.
The key obstacle for implementing innovations in companies is the shortage of talent.
The key drivers for implementing innovations are the market and competition.
Russia through a lens | Research Centre market analysis
16
Innovations and digitalization
Participation of CFOs in the implementation of innovations
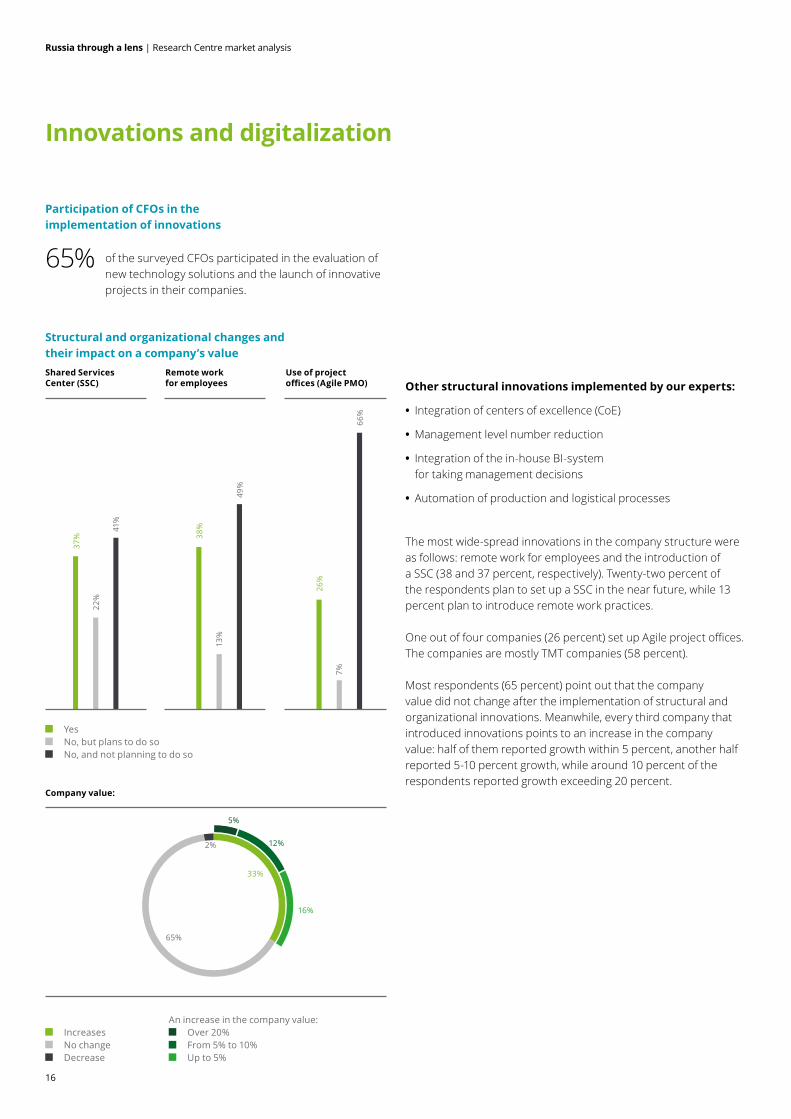
Structural and organizational changes and their impact on a company’s value
of the surveyed CFOs participated in the evaluation of new technology solutions and the launch of innovative projects in their companies.
Other structural innovations implemented by our experts:
• Integration of centers of excellence (CoE)
• Management level number reduction
• Integration of the in-house BI-system for taking management decisions
• Automation of production and logistical processes
The most wide-spread innovations in the company structure were as follows: remote work for employees and the introduction of a SSC (38 and 37 percent, respectively). Twenty-two percent of the respondents plan to set up a SSC in the near future, while 13 percent plan to introduce remote work practices.
One out of four companies (26 percent) set up Agile project offices. The companies are mostly TMT companies (58 percent).
Most respondents (65 percent) point out that the company value did not change after the implementation of structural and organizational innovations. Meanwhile, every third company that introduced innovations points to an increase in the company value: half of them reported growth within 5 percent, another half reported 5-10 percent growth, while around 10 percent of the respondents reported growth exceeding 20 percent.
Remote work for employees
Use of project offices (Agile PMO)
Shared Services Center (SSC)
Company value:
37%
22%
41%
38%
26%
13%
7%
49%
66%
Yes No, but plans to do so No, and not planning to do so
Increases No change Decrease
An increase in the company value: Over 20% From 5% to 10% Up to 5%
33%
5%
12%
16%
65%
2%
65%
Russia through a lens | Research Centre market analysis
17
Advanced ERP systems
Full automation of selected business processes
Big data processing
Full automation of business process chain
Artificial intelligence*
Robotization of business processes
Internet of things (machine-to-machine communication, IoT-technologies)
Blockchain settlements
Augmented or virtual reality
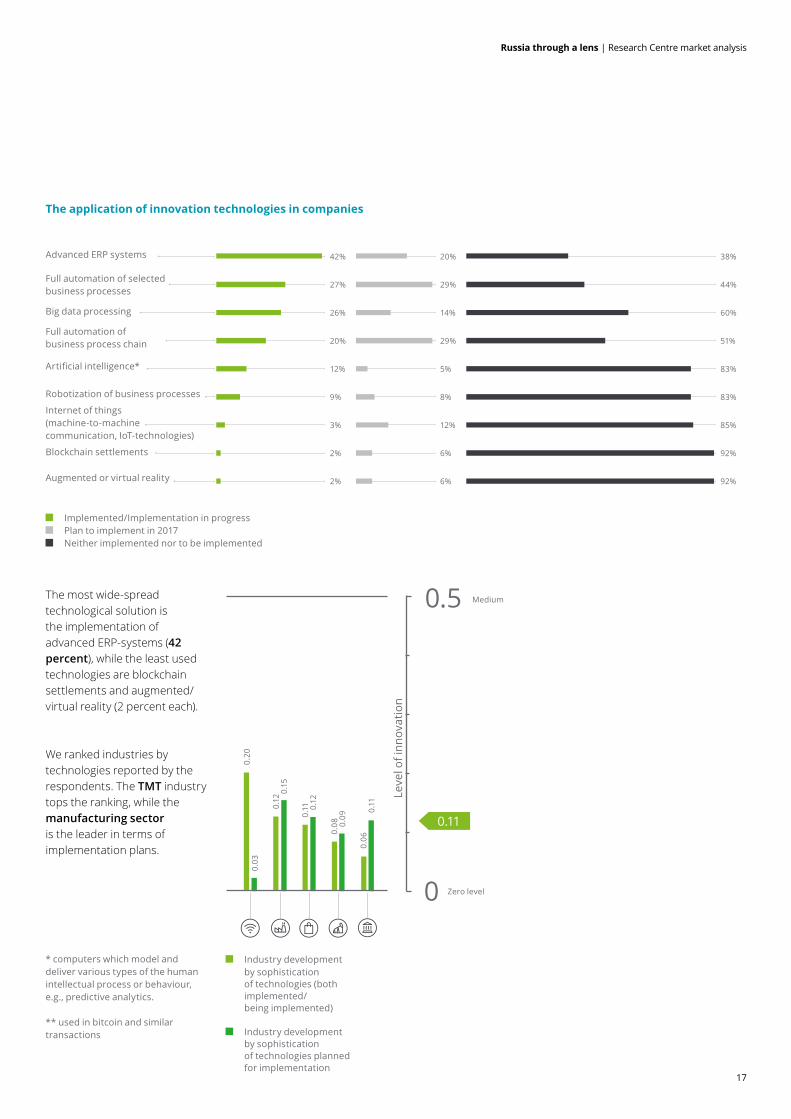
The application of innovation technologies in companies
The most wide-spread technological solution is the implementation of advanced ERP-systems (42 percent), while the least used technologies are blockchain settlements and augmented/virtual reality (2 percent each).
We ranked industries by technologies reported by the respondents. The TMT industry tops the ranking, while the manufacturing sector is the leader in terms of implementation plans.
* computers which model and deliver various types of the human intellectual process or behaviour, e.g., predictive analytics. ** used in bitcoin and similar transactions
42% 20% 38%
27% 29% 44%
26% 14% 60%
20% 29% 51%
12% 5% 83%
9% 8% 83%
3% 12% 85%
2% 6% 92%
2% 6% 92%
Implemented/Implementation in progress Plan to implement in 2017 Neither implemented nor to be implemented
Industry development by sophistication of technologies (both implemented/ being implemented)
Industry development by sophistication of technologies planned for implementation
Lev
el o
f inn
ovat
ion
Zero level
Medium
0.15
0.12
0.11 0.
12
0.08 0.
09
0.11
0.06
0.20
0.03
0.5
0
0.11
Russia through a lens | Research Centre market analysis
18
58%
87%
61%
57%
33%
17%
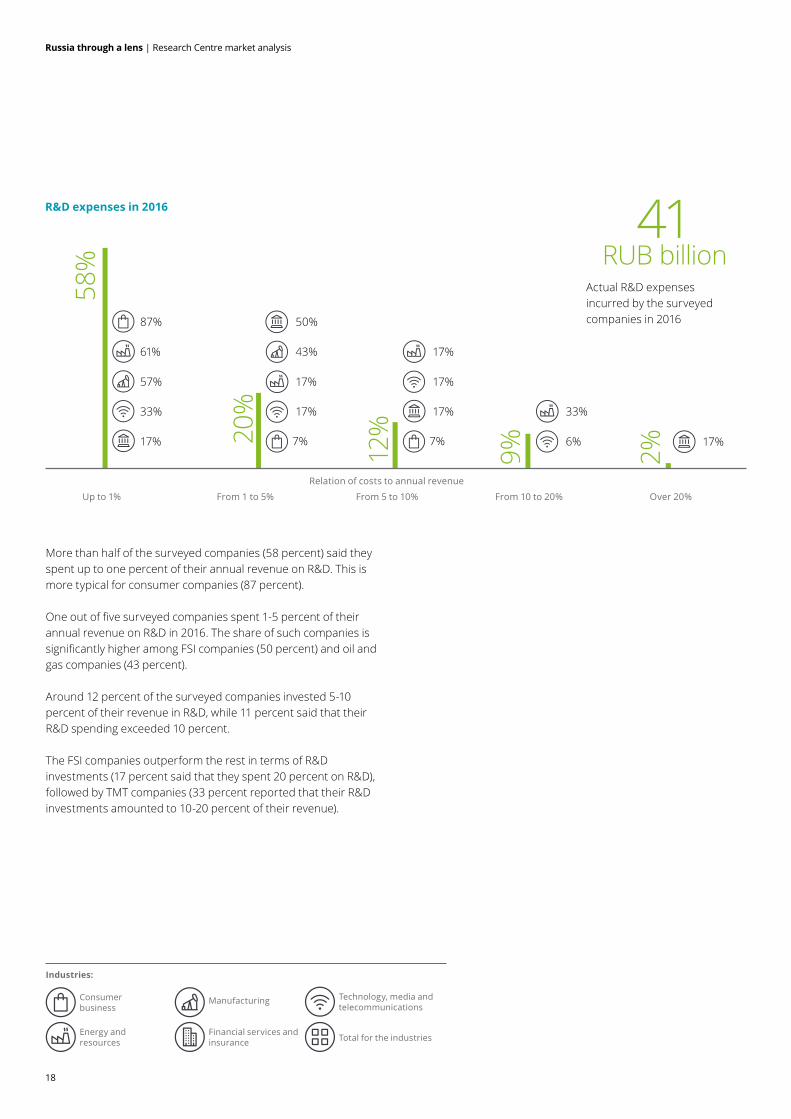
R&D expenses in 2016
More than half of the surveyed companies (58 percent) said they spent up to one percent of their annual revenue on R&D. This is more typical for consumer companies (87 percent).
One out of five surveyed companies spent 1-5 percent of their annual revenue on R&D in 2016. The share of such companies is significantly higher among FSI companies (50 percent) and oil and gas companies (43 percent).
Around 12 percent of the surveyed companies invested 5-10 percent of their revenue in R&D, while 11 percent said that their R&D spending exceeded 10 percent.
The FSI companies outperform the rest in terms of R&D investments (17 percent said that they spent 20 percent on R&D), followed by TMT companies (33 percent reported that their R&D investments amounted to 10-20 percent of their revenue).
Up to 1% From 1 to 5% From 5 to 10% From 10 to 20% Over 20%
Actual R&D expenses incurred by the surveyed companies in 2016
41RUB billion
9%
33%
6%
2%
17%20%
50%
43%
17%
17%
7%
12%
17%
17%
17%
7%
Relation of costs to annual revenue
Consumer business
Manufacturing
Energy and resources
Financial services and insurance
Technology, media and telecommunications
Industries:
Total for the industries
Russia through a lens | Research Centre market analysis
19
55%
80% 50% 17%
8%
25%
57% 29% 17%
17%56% 28% 14%
33% 17% 11%
6%17% 13% 7%
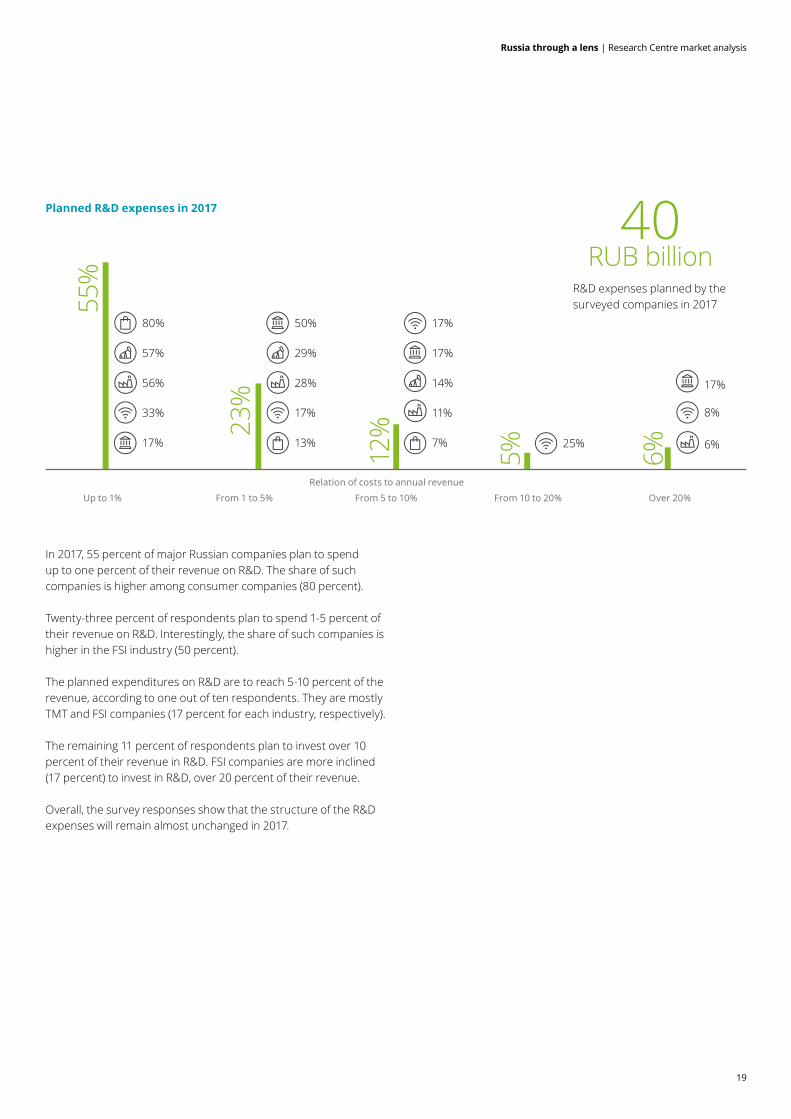
Planned R&D expenses in 2017
In 2017, 55 percent of major Russian companies plan to spend up to one percent of their revenue on R&D. The share of such companies is higher among consumer companies (80 percent).
Twenty-three percent of respondents plan to spend 1-5 percent of their revenue on R&D. Interestingly, the share of such companies is higher in the FSI industry (50 percent).
The planned expenditures on R&D are to reach 5-10 percent of the revenue, according to one out of ten respondents. They are mostly TMT and FSI companies (17 percent for each industry, respectively).
The remaining 11 percent of respondents plan to invest over 10 percent of their revenue in R&D. FSI companies are more inclined (17 percent) to invest in R&D, over 20 percent of their revenue.
Overall, the survey responses show that the structure of the R&D expenses will remain almost unchanged in 2017.
Up to 1% From 1 to 5% From 5 to 10% From 10 to 20% Over 20%
R&D expenses planned by the surveyed companies in 2017
40RUB billion
5% 6%
23%
12%
Relation of costs to annual revenue
Russia through a lens | Research Centre market analysis
20
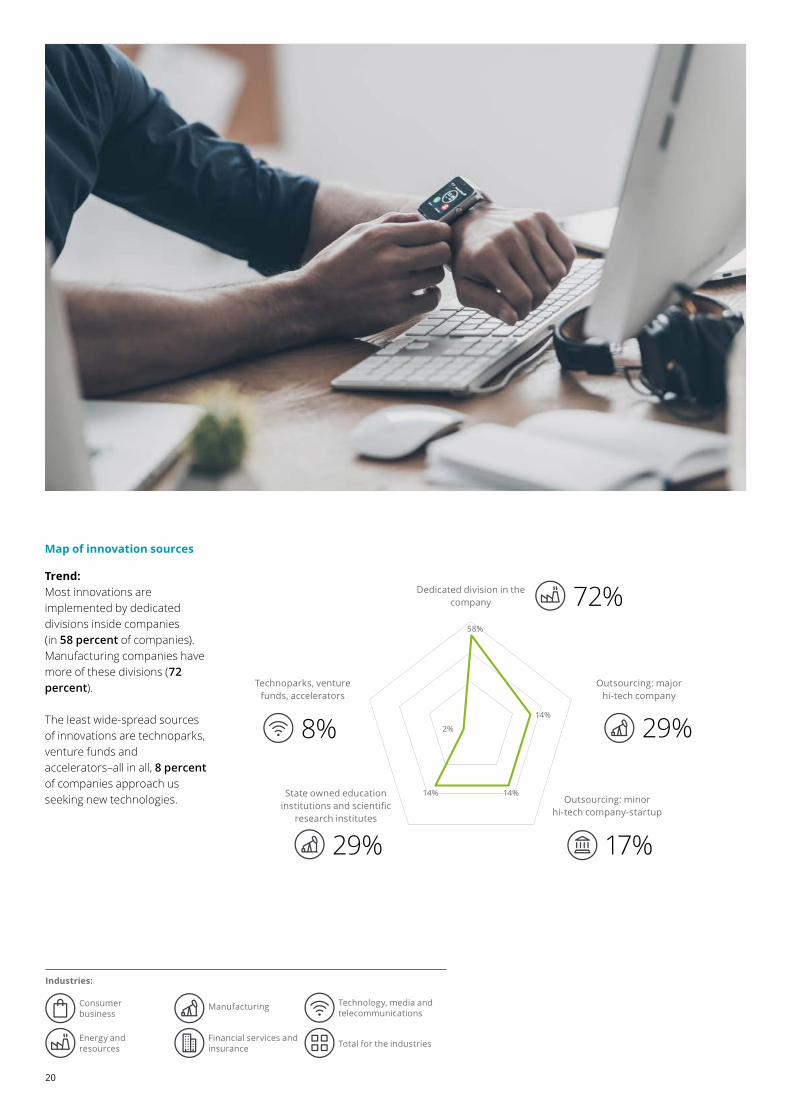
Map of innovation sources
Trend:Most innovations are implemented by dedicated divisions inside companies (in 58 percent of companies). Manufacturing companies have more of these divisions (72 percent).
The least wide-spread sources of innovations are technoparks, venture funds and accelerators–all in all, 8 percent of companies approach us seeking new technologies.
72%
29%
17% 29%
8%
Dedicated division in the company
Outsourcing: major hi-tech company
Technoparks, venture funds, accelerators
Outsourcing: minor hi-tech company-startup
State owned education institutions and scientific
research institutes
58%
2%
14% 14%
14%
Consumer business
Manufacturing
Energy and resources
Financial services and insurance
Technology, media and telecommunications
Industries:
Total for the industries
Russia through a lens | Research Centre market analysis
21
Development of technological solutions in business functions
of CFOs see a need for increasing the economic efficiency of business functions through the automation of key processes
94%
Zero automation
Full automation1
0
Adm
inis
trat
ion,
do
cum
ent fl
ow
Prod
uctio
n
HR
Mar
ketin
g, s
ales
Fina
nce
0.39 0.
420.
38 0.39 0.
400.
48
0.40 0.
44 0.46
0.48
0.48
0.68
0.47
0.45 0.
49
Tota
l aut
omat
ion
ratin
g
The rating of business functions on the basis of the integral assessment of the technology solution development status (from 0 to 1)
The rating of business functions on the basis of the integral assessment of the technology solution development plans (from 0 to 1)
The rating of business functions on the basis of the integral assessment of the analytics efficiency (from 0 to 1)
Drivers and barriers for the implementation of the digitalization strategy
Man
agem
ent s
trat
egy
Acce
ssib
ility
of t
he
infr
astr
uctu
re
Sour
ces
of fi
nanc
ing
Mar
ket a
nd c
ompe
titio
n
HR
supp
ort
Org
aniz
atio
nal s
truc
ture
Drivers Barriers
82% 71% 100% 79%
100%
100%100%
40%
38%
32%
71%
51%
83%
60% 62
%
68%
29%
49%
17%
0.43
Russia through a lens | Research Centre market analysis
22
Overview of steel and iron market
From a strategic perspective, the steel and iron industry depends on global industralisation, which primarily involves the demand for metals from countries that are ready to make an investment leap (e.g. India, Vietnam and Indonesia). From a tactical perspective, the industry is dependent on actions China and global companies might take and how some countries would respond in terms of protectionism.
While being potential regions of growth, India, Iran and Vietnam have limited opportunities to raise capital. The search for a solution is on, with a way out likely to be found in 2018-2019. However, these countries will not have a significant impact on the global metals market. Growing demand will drive the rise of local industry. Countries in the Middle East and Africa represent potential growth areas that will be attracting global resources to meet the demand. Investment mechanisms may start emerging in these countries after 2020.
Re-industrialisation of the industrialised nations is expected to involve a fundamentally different technology platform. This effort would require materials that are substantially different from the existing offerings on the global market. The development of a resource platform for cutting-edge manufacturing applications is currently driven by projects aimed at manufacturing metal products with the use of rare earth elements and producing metal powders to support additive technologies and increase the output of products with higher technological availability (e.g. products and fabricated metals with complex structures).
Demand limitations in 2017 highlight the importance of corporate policy as a tool for gaining a competitive edge. Companies price their products to solve the tasks at hand, which leads to volatility in prices.
In a situation with prices fluctuating rapidly over a limited period, forecasts are driven by institutional factors. Such volatile prices benefit vertically integrated companies. Fluctuating prices create a barrier to new market entrants and complicate investment decision making. It is particularly important in the context of China’s programme to restructure the steel-making industry, as well as India’s and Iran’s plans to develop their steel-making industries.
Reaching a normal level after a price hike or collapse is indicative of a general trend towards a relative decrease in prices. Steel-makers have limited opportunities to transfer a price impulse to metal product consumers as they experience issues with end-user demand. When choosing between lower prices and lower output companies are increasingly going for lower prices.
However, the existing trends towards lower prices on the global market do not exclude a stronger price differentiation across regions and countries. This is driven by protectionist efforts taken over 2016-2017.
The most likely trend for 2017 would involve a gradual decrease in prices down to a level enabling an efficient production of coking coal in China (above USD 100 per tonne).
Prof. I.A.Budanov,Doctor of Economics (INP RAN)
Igor BudanovProfessor, Doctor of EconomicsInstitute for Economic Forecasting of the Russian Academy of Sciences(INP RAN)
Russia through a lens | Research Centre market analysis
23
In 2016 the downward trend in output and consumption that had been continuing from 2015 gave way to greater stability, with industry indicators changing by less than 2 percent:
• Steel output grew by 0.8 percent up to 1,629 million tonnes
• Steel consumption grew by 1.3 percent up to 1,600 million tonnes.
Over the first three months of 2017 saw global steel output reach 410.5 million tonnes, up 5.7 percent from the same period in 2016.
In 2016 China saw an increase of 1.8 percent in domestic consumption of steel amidst the continuing incentives and growth in loans.
Driven by a decrease in government incentives, an expected gradual weakening in the demand from China will create an oversupply, forcing prices down.
In 2016 steel output in Russia has grown by 0.3 percent to 69.6 million tonnes.
The apparent domestic consumption of steel dropped by 3.9 percent to 34.6 million tonnes. However, 4Q2016 saw a YoY increase of 3.7 percent as a result of the slightly improved situation in the construction industry and the Russian economy as a whole.
Exports and imports totaled 43.3 million tonnes and 11,3 million tonnes, respectively.
*Based on the annual survey by Deloitte CIS.
Top-5* issues for the industry in 2017:
• Prospects of weaker domestic demand
• Stagnation in the Russian economy
• Decrease in core business revenue
• Higher production costs in Russia
• Stricter government regulation in Russia
Top-5* priority business strategies in 2017:
• Ongoing cost control
• Business development through organic growth
• Cost cutting
• Increase in domestic output
• Expansion into new markets
Key findings
Russia through a lens | Research Centre market analysis
24
Russian Pharmaceutical Market Trends in 2017
Key findings
Market snapshot
In 2016 the pharmaceutical market grew by 6.7 percent in ruble terms while remaining unchanged from 2015 in unit terms.
Market growth forecasts for 2017 (in ruble terms): • DSM Group: up by 8-9 percent • RNC Pharma: up by 10 percent • QuintilesIMS: up by 9.2 percent
Market growth forecasts for 2017 (in unit terms): • DSM Group: up by 1-2 percent • QuintilesIMS: up by 4.8 percent; • IPT Group: up by 4-6 percent.
In 2016 pharmaceutical price inflation was 5 percent.
The share of local medicines grew by 1.2 pp in monetary terms.
The Russian market is ranked 14th in the world in terms of size.
In Russia pharmaceutical output increased by 23.8 percent to RUB 286 billion while medical product output grew by 15 percent to RUB 52.8 billion.
Output forecast for 2017 by the Russian Ministry of Industry and Trade: • Medicines: up by 8 percents • Medical products: up by 4 percent
By the end of 2016 medicines produced in Russia accounted for 77 percent of the Essential Drug List.
In 2016 almost 80 percent of imports came from Europe, primarily from France and Germany.
The post-Soviet countries remain the major export markets for Russian medicines, accounting for 86 percent of the total exports.
Pharmaceutical market perception
View of the current state of: • Pharma industry–positive perception (a balance of +52 percent)
• Pharmaceutical businesses–positive perception (a balance of +82 percent)
View of the future prospects of: • Pharma industry–neutral perception (a balance of +7 percent)
• Pharmaceutical businesses–positive perception (a balance of +42 percent)
Change in the share of imports as expected by the Russian market: down by 3 percent in monetary terms and by 4 percent in unit terms.
Demand for regulatory measures aimed at reducing the share of pharmaceutical imports: localization incentives and privileges for foregn companies, as well as subsidies and privileges for Russian companies.
Demand for more efficient regulation • Medicine pricing (87 percent) • Public procurement regulation (74 percent) • Regulation of on-line sales of medicines and telehealth (67 percent)
• State registration of medicines (67 percent) • Mandatory track & trace framework (67 percent)
Russia through a lens | Research Centre market analysis
25
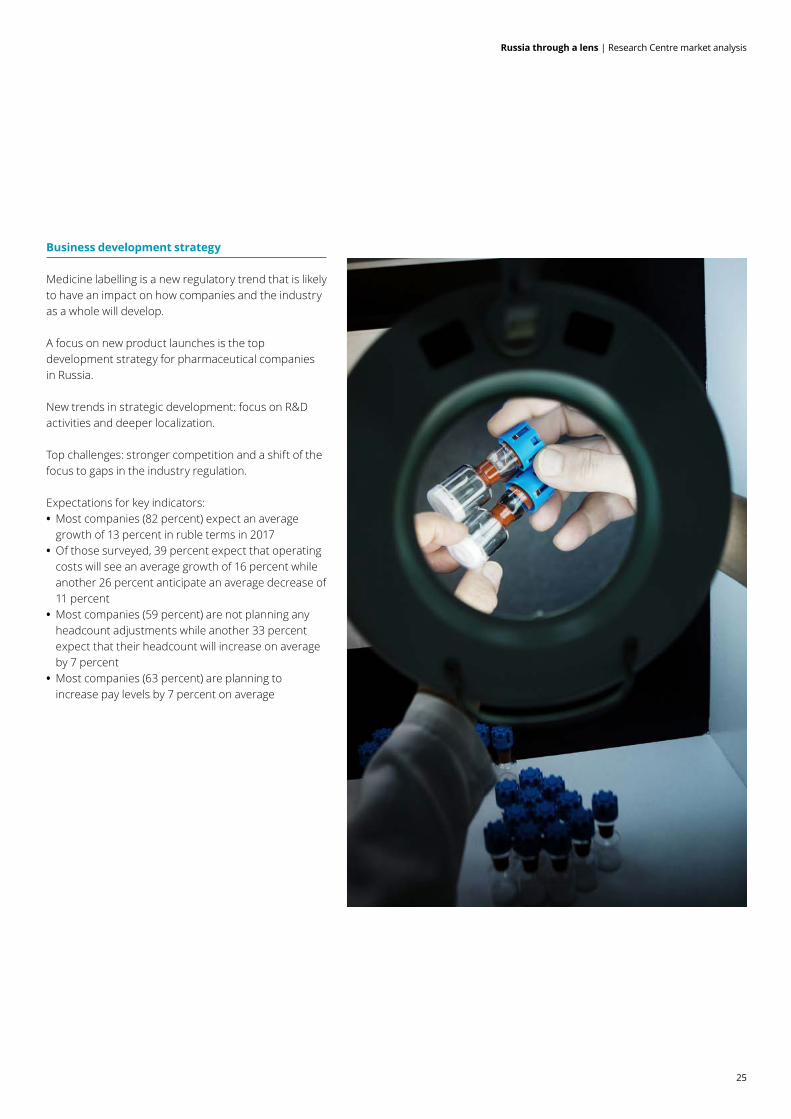
Business development strategy
Medicine labelling is a new regulatory trend that is likely to have an impact on how companies and the industry as a whole will develop.
A focus on new product launches is the top development strategy for pharmaceutical companies in Russia.
New trends in strategic development: focus on R&D activities and deeper localization.
Top challenges: stronger competition and a shift of the focus to gaps in the industry regulation.
Expectations for key indicators: • Most companies (82 percent) expect an average growth of 13 percent in ruble terms in 2017
• Of those surveyed, 39 percent expect that operating costs will see an average growth of 16 percent while another 26 percent anticipate an average decrease of 11 percent
• Most companies (59 percent) are not planning any headcount adjustments while another 33 percent expect that their headcount will increase on average by 7 percent
• Most companies (63 percent) are planning to increase pay levels by 7 percent on average
Russia through a lens
26
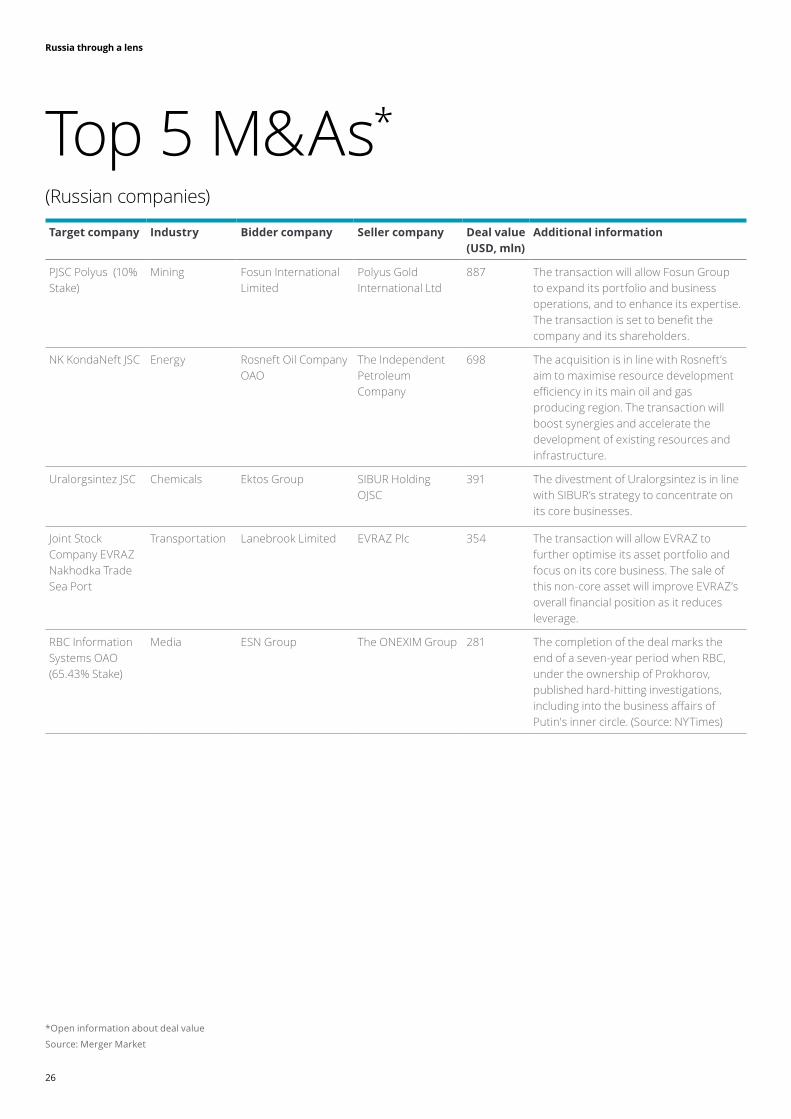
Top 5 M&As*
Target company Industry Bidder company Seller company Deal value (USD, mln)
Additional information
PJSC Polyus (10% Stake)
Mining Fosun International Limited
Polyus Gold International Ltd
887 The transaction will allow Fosun Group to expand its portfolio and business operations, and to enhance its expertise. The transaction is set to benefit the company and its shareholders.
NK KondaNeft JSC Energy Rosneft Oil Company OAO
The Independent Petroleum Company
698 The acquisition is in line with Rosneft’s aim to maximise resource development efficiency in its main oil and gas producing region. The transaction will boost synergies and accelerate the development of existing resources and infrastructure.
Uralorgsintez JSC Chemicals Ektos Group SIBUR Holding OJSC
391 The divestment of Uralorgsintez is in line with SIBUR’s strategy to concentrate on its core businesses.
Joint Stock Company EVRAZ Nakhodka Trade Sea Port
Transportation Lanebrook Limited EVRAZ Plc 354 The transaction will allow EVRAZ to further optimise its asset portfolio and focus on its core business. The sale of this non-core asset will improve EVRAZ’s overall financial position as it reduces leverage.
RBC Information Systems OAO (65.43% Stake)
Media ESN Group The ONEXIM Group 281 The completion of the deal marks the end of a seven-year period when RBC, under the ownership of Prokhorov, published hard-hitting investigations, including into the business affairs of Putin's inner circle. (Source: NYTimes)
(Russian companies)
*Open information about deal value
Source: Merger Market
Russia through a lens
27
Global windTop news: China and Russia
Top news: Europe and Russia
31 May 2017A Beijing company to build three plants in the Penza regionShemysheika Industrial Complex to put about 30 thousand hectares of land into a crop rotation in the Penza Region and to construct three factories for production of flour, oil and potato processing.
30 May 2017Chinese investors intend to build light railway in RussiaAt present, two light railway projects are under construction. These projects envisage building a light railway running to Sertolovo through Bugry and Devyatkino and to Vsevolozhsk through Rzhevka and Kudrovo. The Sertolovo project is estimated at nearly 17 billion rubles ($300 million). The Leningrad region authorities are aiming for the projects’ construction to launch as soon as investment contracts are signed.
20 June 2017Germany's Daimler began construction of a new Mercedes-Benz plant near MoscowDaimler said in February that it will invest more than 250 million euros ($279 million) into the factory. These contrasts with widespread skepticism among international investors about the Russian auto market after a prolonged downturn brought on by the sanctions and a collapse in global oil prices.
01 June 2017Turkish-Italian ICA to take part in road construction projects in RussiaThe head of Russia’s Federal Road Transport Agency (Rosavtodor) Roman Starovoit and Chairman of the Board of ICA Firat Cecen signed a cooperation agreement on road construction investment projects. The Turkish-Italian investors were particularly interested
25 May 2017Hilong oilfield services group to open factory in RussiaBy the end of 2017, Hilong Group, a Chinese oilfield services company, will open a factory in Surgut, a city in the Khanty-Mansiysk autonomous region. Investment into the project will total 600 million rubles. In addition, the company also plans to begin the construction of a plant in another city in the region, Nizhnevartovsk, in the near future.
16 May 2017The Chinese are set to build a $120m plant in the Russian Far EastJoybay Agricultural Holding Limited, a Chinese company, is investing $120 million into a new Russian plant for deep processing of soybeans and production of soy protein isolate. The facility will be located in the Jewish autonomous region situated in the Russian Far East.
13 May 2017A Chinese investor to build a marine biotechnopark in the Primorye territoryAccording to the local administration, China’s Wen Lian Aquaculture intends to create a marine biotechnopark on the island of Popov in the Primorye territory.
27 April 2017Russia is ready to significantly increase its exports to ChinaThe Chinese market continues to demonstrate demand for Russian agricultural products and foodstuffs. “The Chinese consumer has got a positive perception of Russian products. There is a well-established idea that our food products are of high quality, they are free of genetically modified organisms (GMOs), and this is regulated at the legislative level. In addition, they are organic and, as a general rule, are much less expensive than their foreign counterparts,” according to Mikhail Mamonov, managing director for international projects at the Russian Export Center (REC).
in the Agency’s regional projects being undertaken as public-private partnerships.
01 June 2017Philips signs deal on localization of CT scanners production in RussiaGovernor of the Moscow region, Andrei Vorobyov, and Director General of Philips Russia, Arman Voskerchyan, signed a localisation agreement for the production of innovative ultrasound systems and CT scanners under the Philips brand in Istra.
31 May 2017Innothera to establish production in RussiaFrance’s Innothera Holding plans to start production of its medicines in Russia. This will help the company to boost its drug production in the fields of gynecology (Polygynax, Pharmatex), hematology (Totema), phlebology (Phlebodia 600) and other areas of medicine.
31 May 2017Mapei S.P.A bought a factory in the Leningrad regionMapei S.p.A, an Italian building materials conglomerate, purchased the plant in Leningrad region’s Volosovo district from Austria’s Baumit Company, and will invest RUB 450 million into its modernisation.
31 May 2017Switzerland’s Sika invests in the Moscow region’s construction industrySika, a Swiss chemical company, launched the manufacture of high-tech floor epoxy coatings in the Moscow regional city of Lobnya. Investment into this production line totalled 50 million rubles (over $880,000). This allowed the company to begin manufacturing of products that previous been imported to Russia.
Russia through a lens
28
Useful stickers
BP Statistical Review of World Energy (June 2017)We project Russia remains the world’s largest energy exporter, with exports meeting over 4% of global energy demand by 2035.
Outcomes of SPIEF 2017The global economy in search of a new balance.
The 10 Top Research Universities
Since May 2017, Deloitte CIS has become the official intellectual partner of the department of Economics at the Novosibirsk State University.
V Expert RA Russian Universities Ranking 2017 Leading economic universities demonstrate a stable positive shift in demand from applicants who, one year after graduation, earn 28% more than graduates from other RAEX top 30 universities.
(In Russian)
1 Lomonosov Moscow State University
2 National Research Nuclear University MEPhI
3 Moscow Institute of Physics and Technology (State University)
4 Tomsk State University
5 Saint Petersburg State University
6 Novosibirsk State University
7 Tomsk Polytechnic University
8 Peter the Great St.Petersburg Polytechnic University
9 Ural Federal University
10 Kazan (Volga region) Federal University
Russia through a lens
29
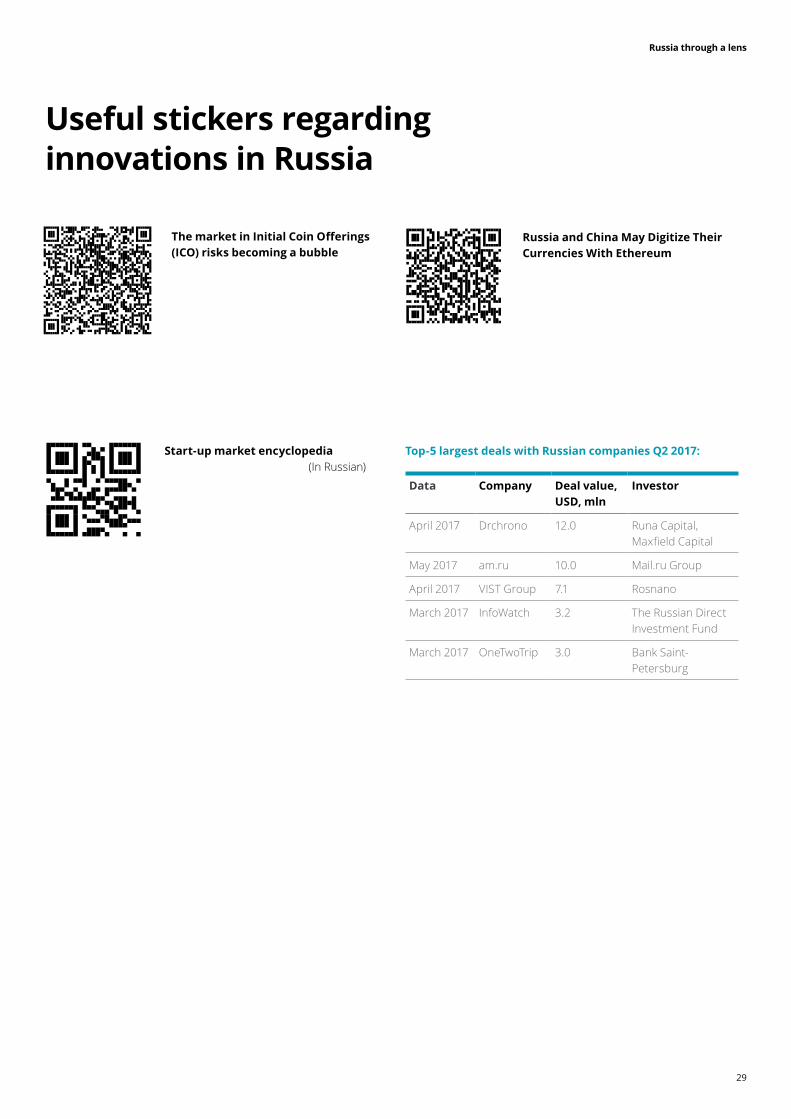
Useful stickers regarding innovations in Russia
The market in Initial Coin Offerings (ICO) risks becoming a bubble
Russia and China May Digitize Their Currencies With Ethereum
Start-up market encyclopedia (In Russian)
Top-5 largest deals with Russian companies Q2 2017:
Data Company Deal value, USD, mln
Investor
April 2017 Drchrono 12.0 Runa Capital, Maxfield Capital
May 2017 am.ru 10.0 Mail.ru Group
April 2017 VIST Group 7.1 Rosnano
March 2017 InfoWatch 3.2 The Russian Direct Investment Fund
March 2017 OneTwoTrip 3.0 Bank Saint-Petersburg
Russia through a lens
30
ContactsJoe [email protected]
Lora ZemlyanskayaResearch Centre [email protected]
Dmitriy KasatkinSenior Research [email protected]
Mikhail GordeevSenior Research [email protected]
Vladimir SokolovSenior Research [email protected]
Artyom [email protected]
deloitte.ruAbout Deloitte
Deloitte refers to one or more of Deloitte Touche Tohmatsu Limited, a UK private company limited by guarantee (“DTTL”), its network of member firms, and their related entities. DTTL and each of its member firms are legally separate and independent entities. DTTL (also referred to as “Deloitte Global”) does not provide services to clients. Please see www.deloitte.com/about for a more detailed description of DTTL and its member firms.
Deloitte provides audit, consulting, financial advisory, risk management, tax and related services to public and private clients spanning multiple industries. Deloitte serves four out of five Fortune Global 500® companies through a globally connected network of member firms in more than 150 countries bringing world-class capabilities, insights, and high-quality service to address clients’ most complex business challenges. To learn more about how Deloitte’s approximately 244,000 professionals make an impact that matters, please connect with us on Facebook, LinkedIn, or Twitter.
This communication contains general information only, and none of Deloitte Touche Tohmatsu Limited, its member firms, or their related entities (collectively, the “Deloitte Network”) is, by means of this communication, rendering professional advice or services. Before making any decision or taking any action that may affect your finances or your business, you should consult a qualified professional adviser. No entity in the Deloitte Network shall be responsible for any loss whatsoever sustained by any person who relies on this communication.
© 2017 ZAO Deloitte & Touche CIS. All rights reserved.