Embed Size (px)
Citation preview

Russian Gas for Europe
Creating Access and Choice
Clingendael International Energy Programme
Tom Smeenk


Russian Gas for Europe
Creating Access and Choice
Underpinning Russia’s gas export strategy with
Gazprom’s infrastructure investments
Tom Smeenk

ii
Clingendael International Energy Programme
CIEP is affiliated to the Netherlands Institute of International Relations ‘Clingendael’. CIEP acts as an independent forum for governments, non-governmental organisations, the private sector, media, politicians and all others interested in changes and developments in the energy sector. CIEP organises lectures, seminars, conferences and roundtable discussions. In addition CIEP members of staff lecture in a variety of courses and training programmes. CIEP’s research, training and activities focus on three themes:
• regulation of energy markets (oil, gas, electricity) in the European Union;
• the international economic and geopolitical aspects of oil and gas markets, particularly with respect to the European Union security of supply;
• energy and sustainable development. CIEP is endorsed by the Dutch Ministry of Economic Affairs, the Dutch Ministry of Foreign Affairs, the Dutch ministry of Housing, Spatial Planning and Environment, BP, Delta, Electrabel GDF-Suez, Eneco, Energie Beheer Nederland, Essent, Esso Nederland, GasTerra, Gasunie, ING, NAM, NUON, Oranje-Nassau Groep, Port of Rotter-dam, RWE, Shell Nederland, Total E&P Nederland, Vopak Oil Europe Middle East and Wintershall. CIEP publications and research results are made available primarily through the CIEP website: www.clingendael.nl/ciep. Title : Russian Gas for Europe: Creating Access and Choice Subtitle : Underpinning Russia’s gas export strategy with Gazprom’s infrastructure investments Author : Tom Smeenk ISBN : 978-90-367-4445-4 English translation : Deborah Sherwood, Rob Bradley (chapters 2; 5-7) Printed by : Jurriaans Lindenbaum Grafimedia b.v. Copyright : 2010 Clingendael International Energy Programme Copyright photo cover : Nord Stream AG Copyright world map : Le Monde Diplomatique Number : 2010/2 Published by : Clingendael International Energy Programme Address : Clingendael 7, 2597 VH The Hague, The Netherlands P.O. Box 93080, 2509 AB The Hague, The Netherlands Telephone: +31 70 374 66 16 Telefax: +31 70 374 66 88 E-mail : [email protected]

iii
Preface The Clingendael International Energy Programme (CIEP) has been involved in interna-tional natural gas market and energy policy research from its inception in 2001. As part of the wider research into international natural gas market developments, two PhD projects, in cooperation with the University of Groningen, on the evolving Russian gas infrastruc-ture investment strategy and possibilities for cooperation in the international gas market, were integrated into that research agenda. Both studies, ‘The Dynamics of Gas Supply Coordination in a New World’ and ‘Russian Gas to Europe: Creating Access and Choice’, are an academic effort which aims to provide greater insight into the investment challenges Russia faces in the gas value chain in Europe and in the world gas markets. They are unique in that they strive to disentangle the political from the economic intricacies in-volved in such a topic through a multi-disciplinary approach that is part theoretical, part empirical. The interregional gas market is undergoing a myriad of changes that are both complex and novel. Only a short while ago, few could have believed the world’s major gas markets would become as integrated as they have become today. The expansion of liquefied natural gas (LNG) played a major role in these developments. In the years running up to the in-ternational financial and economic crisis of 2008-2009, the advent of new trade and pric-ing patterns has helped catalyse the globalisation of the world’s regional gas markets. De-velopments such as unconventional gas in the US, the assertion of various existing and emerging gas-exporting countries point to the ever-changing face of the increasingly inter-regional gas market. This interregional gas market is also inescapably influenced by geopo-litical factors, especially in a system with changing international political and economic relations. The European gas market in particular faces a host of economic and political challenges as Russia and Europe and the US reshape their relationships. Analysing the natural gas market in a multi-disciplinary manner helps us pursue the task of capturing both the political as well as economic complexities of developments in the gas market. These two studies differ from the typical endeavours on energy in general, and gas in particular, in that they are a multi-disciplinary effort at explaining the complexities Russia faces in an uncertain and dynamic interregional gas market. They strive to highlight the economic-strategic aspects of gas infrastructure investments and their impact on mar-ket structures and cooperation. The activities and research programmes of CIEP subscribe to an integral approach to en-ergy policy. Academic research can contribute to a good discussion on national, European and global energy sector developments and policies. With these two works, CIEP intends to make such a contribution to the public debate on the international economic and geo-

iv
political aspects of oil and gas markets, particularly with respect to the European Union’s security of supply. These two studies are the result of the generous cooperation and help of the University of Groningen and CIEP’s sponsors, as well as other actors in the private and public sector, whose support has been essential in this regard. The Hague, May 2010 Coby van der Linde

v
Table of contents
Preface _____________________________________________________________ iii
Table of contents ______________________________________________________ v
List of figures, tables, boxes, and maps_____________________________________ xi
Glossary ____________________________________________________________ xv
Chapter 1 Introduction _________________________________________________1 1.1 Research background _____________________________________________1 1.2 Research objective and research questions______________________________6 1.3 Overview of the study ____________________________________________8 1.4 Research methodology ___________________________________________10
PART I_____________________________________________________________13
Chapter 2 The gas value chain and its infrastructure: A comprehensive introduction _15 2.1 Introduction __________________________________________________15 2.2 The gas value chain and its stakeholders______________________________15 2.3 Risks related to gas infrastructure investments _________________________20 2.4 Common types of risk mitigation in the gas infrastructure business _________22
2.4.1 Contractual risk mitigation__________________________________22 2.4.2 Organisational risk mitigation _______________________________26
2.5 Gas infrastructure: old and new business models _______________________29 2.5.1 Time horizon of gas infrastructure ____________________________29 2.5.2 Old and new business models for gas pipeline investments __________31 2.5.3 Old and new business models for LNG terminal investments ________32
2.6 Conclusion ___________________________________________________35
Chapter 3 Government-supported business investment strategy in gas markets:
Institutional and theoretical backgrounds __________________________________37 3.1 Introduction ____________________________________________________37 3.2 The political economy of states and markets: Relative advantages___________38 3.3 The role of governments in the gas sector: producing______________________
and consuming countries _________________________________________43 3.3.1 Consuming country perspective ______________________________45 3.3.2 Producing country perspective _______________________________47
3.4 Interregional gas market dynamics __________________________________49 3.4.1 Dynamic Market Theory ___________________________________49

vi
3.4.2 Coordination mechanism in dynamic markets ___________________52 3.5 Socio-economic agendas and the merit order for gas exports_______________54 3.6 Theoretical background of business investment behaviour in the gas market:
Strategic planning and value creation ________________________________56 3.7 The valuation of investments in an uncertain, competitive environment _____62
3.7.1 Discounted cash flow model_________________________________62 3.7.2 Real-options approach _____________________________________64 3.7.3 A game theoretical framework _______________________________69 3.7.4 Entry deterrence and strategic investments ______________________71
3.8 Conclusion ___________________________________________________73
Chapter 4 A real-option game approach to valuing gas value chain investments _____77 4.1 Introduction __________________________________________________77 4.2 Whether or not to invest strategically: A conceptual toolbox ______________78
4.2.1 Some definitions__________________________________________78 4.2.2 Market uncertainty: Volume and price risks versus likely competition _81 4.2.3 Gas suppliers: Weighing rival cost structure versus production capacity 83 4.2.4 Other investment variables __________________________________84 4.2.5 Organisational and financial institutionalisation__________________85 4.2.6 Possible market outcome scenarios ____________________________88 4.2.7 Interregional prices and shared investments _____________________89
4.3 Whether or not to invest strategically: A real-option game model___________89 4.3.1 The strategic value of early commitment _______________________91 4.3.2 Competitive strategies _____________________________________93 4.3.3 The base case versus the proprietary case________________________95 4.3.4 Model outcomes, demand moves and the decision tree_____________95 4.3.5 Input variables from the perspective of the gas industry ___________100
4.4 Conclusion __________________________________________________104 4.5 Appendix to Section 4.3_________________________________________105
PART II ___________________________________________________________109
Chapter 5 Soviet Union’s gas export strategy to Europe ______________________111 5.1 Introduction _________________________________________________111 5.2 Rationale for Soviet’s gas production and exports and its institutionalisation _112
5.2.1 Rationale for Soviet’s gas production and exports ________________112 5.2.2 Institutionalisation of the Soviet gas sector _____________________115
5.3 Gas market developments in Western Europe and the CMEA-6 __________115 5.3.1 Gas market developments in the CMEA-6 _____________________115 5.3.2 Gas market developments in Western Europe___________________118
5.4 Soviet gas strategy in Europe _____________________________________121

vii
5.5 Conclusion __________________________________________________124
Chapter 6 Russia’s post-Soviet gas industry during the 1990s __________________127 6.1 Introduction _________________________________________________127 6.2 The transition of the internal Russian gas market in the 1990s____________128
6.2.1 Transition of the Russian gas sector in a macro-economic context ___129 6.2.2 Russia’s transition process: constraints and opportunities for __________ Gazprom’s strategy _______________________________________134
6.3 Repositioning of the Caspian gas region_____________________________135 6.3.1 Developments in the Caspian gas market ______________________136 6.3.2 Caspian gas export flows: new pipeline routes in the 1990s_________138
6.4 Gas sales and transit issues in Ukraine and Belarus _____________________140 6.4.1 Gas transit and sales relation between Ukraine and Russia _________141 6.4.2 Gas transit and sales relation between Belarus and Russia __________143 6.4.3 Gazprom’s mitigation strategy for transit risks __________________143
6.5 Conclusion __________________________________________________145
Chapter 7 Russia’s post-Soviet gas export strategy during the 1990s _____________149 7.1 Introduction _________________________________________________149 7.2 Politico-institutional developments in Europe during the 1990s __________150 7.3 Developments in the European gas market in the 1990s_________________152 7.4 Gazprom’s export strategy in Europe during the 1990s _________________156
7.4.1 Gazprom’s general export strategy in Europe during the 1990s______157 7.4.2 Gazprom’s new gas infrastructure projects: the Yamal-Europe _________ and Blue Stream pipelines _________________________________159
7.5 Conclusion __________________________________________________161
PART III __________________________________________________________165
Chapter 8 Politico-economic background of interregional gas market developments 167 8.1 Introduction _________________________________________________167 8.2 A newly emerging geo-strategic dimension to gas flows _________________167
8.2.1 Politico-economic background to West-Russian relations__________168 8.2.2 Geo-economic and political interests in institutionalisation of _________ Eurasian gas flows________________________________________169
8.3 Reserves, current production and net-exporting countries _______________175 8.4 Regional gas markets and gas flows_________________________________178
8.4.1 European gas markets_____________________________________178 8.4.2 The US gas market_______________________________________180 8.4.3 Asian gas markets ________________________________________181 8.4.4 Trade and pricing patterns _________________________________182

viii
8.5 Growth opportunities for gas exporting countries______________________184 8.5.1 The European gas markets _________________________________185 8.5.2 The US gas market_______________________________________187 2.5.3 The Asia-Pacific gas markets________________________________188
8.6 Conclusion __________________________________________________189
Chapter 9 Gas export strategies of Russia’s main competitors, cooperation and market
power _____________________________________________________________191 9.1 Introduction _________________________________________________191 9.2 Strategies of the main non-former Soviet gas-exporting countries__________191 9.3 Gas strategies of former Soviet republics in the Caspian region____________194
9.3.1 Azerbaijan _____________________________________________196 9.3.2 Turkmenistan___________________________________________197 9.3.3 Kazakhstan_____________________________________________200 9.3.4 Uzbekistan _____________________________________________202
9.4 Supply costs and market power in the Atlantic LNG basin and Europe _____204 9.5 Cooperation in an interregional gas market __________________________209 9.6 Conclusion __________________________________________________211
Chapter 10 Russia’s vantage point in a dynamic interregional gas market _________215 10.1 Introduction _________________________________________________215 10.2 Russia’s current gas balance ______________________________________216 10.3 The Russian gas sector __________________________________________220 10.4 Domestic gas needs and strategy___________________________________225 10.5 Gas export ambitions and strategy _________________________________228
10.5.1 Near abroad: export to CIS markets __________________________229 10.5.2 Far abroad: export to European markets _______________________231 10.5.3 Far abroad: export to the Far East markets _____________________237 10.5.4 Far abroad: export to different regional markets by LNG __________239
10.6 Uncertainties related to Russia’s merit order__________________________239 10.7 Conclusion __________________________________________________240
Chapter 11 Gazprom’s investment strategy in an uncertain, competitive gas market 243 11.1 Introduction _________________________________________________243 11.2 CASE STUDY 1: Gazprom versus competition in the Turkish gas market __244 during the 1990s ______________________________________________244
11.2.1 Background ____________________________________________244 11.2.2 Market demand in Turkey: A booming gas market _________________ during the late 1990s _____________________________________245 11.2.3 Various potential gas suppliers to the Turkish market (1991-1999) __247 11.2.4 Other investment variables relevant to the Caspian pipelines __________ and Blue Stream_________________________________________254

ix
11.2.5 Institutionalisation of the Blue Stream and Caspian pipeline projects _255 11.2.6 Application of the real-options game model to the Blue Stream case__257
11.2.6.1 Assumptions and parameter values _________________________258 11.2.6.2 Model application and backward induction __________________260 11.2.6.3 Sensitivity analysis _____________________________________264
11.2.7 A reflection on Blue Stream and competitors’ projects outcomes: ______ ex-post Turkish gas market structure _________________________267
11.3 CASE STUDY 2: Gazprom versus competition in the South Southeast _______ European gas market ___________________________________________271
11.3.1 Background ____________________________________________271 11.3.2 Demand-side factors in the South Southeast European gas market ___272 11.3.3 Various potential gas suppliers to the South Southeast _______________ European market ________________________________________275 11.3.4 Other investment variables in relation to new investment projects ___282 11.3.5 Organisational and financial institutionalisation of the South Stream ___ and Caspian pipeline projects _______________________________285 11.3.6 Application of the model to the South Stream case_______________287
11.3.6.1 Assumptions and parameter values _________________________287 11.3.6.2 Model application and backward induction __________________290 11.3.6.3 Sensitivity analysis _____________________________________293
11.3.7 Market-outcome scenarios _________________________________295 11.3.8 Reflecting on the application of the model and the conceptual ________ toolbox________________________________________________295
11.4 CASE STUDY 3: Gazprom versus competition in the Northwest European ____ gas markets __________________________________________________298
11.4.1 Background ____________________________________________298 11.4.2 Demand-side factors in the Northwest European gas market _______299 11.4.3 Various potential gas suppliers to the Northwest European market___302
11.4.4 Other investment variables concerning Nord Stream supplies _______308 11.4.5 Organisational and financial institutionalisation of__________________ the Nord Stream project___________________________________309 11.4.6 Application of the model to the Nord Stream case _______________311
11.4.6.1 Assumptions and parameter values _________________________311 11.4.6.2 Model application and backward induction __________________314 11.4.6.3 Sensitivity analysis _____________________________________316
11.4.7 Market outcome scenarios _________________________________319 11.4.8 Reflecting on the application of the model and the conceptual ________ toolbox________________________________________________319
11.5 Case studies: conclusion_________________________________________321
x
Chapter 12 Russia’s export strategy in the dynamic European market as a whole ___325 12.1 Introduction__________________________________________________325 12.2 Aggregated supply and demand outlooks for Europe:______________________
A Russian perspective___________________________________________325 12.3 Russia’s market position in Europe and implications for Gazprom’s___________ investment strategy – scenario analysis ______________________________328
12.3.1 European demand: Scenario cases ___________________________329 12.3.2 Pipeline and LNG supplies from Russia’s competitors: Scenario cases 329 12.3.3 Combined scenarios of demand and supply____________________331 12.3.4 Investment variables in mid- and upstream ____________________332
12.3.5 Different market position and market condition scenarios for Russia_334 12.4 The rationale for overcapacity in the Russian export pipeline system __________
to Europe____________________________________________________340 12.4.1 Background on Gazprom’s transit issues in Ukraine and elsewhere __340
12.4.2 Mitigation of Gazprom’s transit risk: Rerouting and diversifying flows342 12.4.3 Flexible supplies and overcapacity ___________________________343
12.5 Conclusion __________________________________________________345
Chapter 13 Conclusions and discussion ___________________________________347 13.1 Summary and conclusions _______________________________________347
13.1.1 Theoretical and institutional aspects and valuation tools in relation _____ to gas infrastructure investments_____________________________347 13.1.2 Russia’s gas strategy: A historic-institutional background __________350 13.1.3 Russia’s position in a rapidly evolving interregional gas market______353 13.1.4 Russia’s, and Gazprom’s, appropriate investment strategy towards ______ gas infrastructure into possible growing (sub)regional export markets _354 13.1.5 Epilogue: Oversupply and avoiding price competition ____________359
13.2 Discussion and future research ____________________________________360 13.2.1 Discussion and recommendations____________________________360 13.2.2 Future research__________________________________________362
Bibliography ________________________________________________________365
Index______________________________________________________________393

xi
List of figures, tables, boxes, and maps Figures
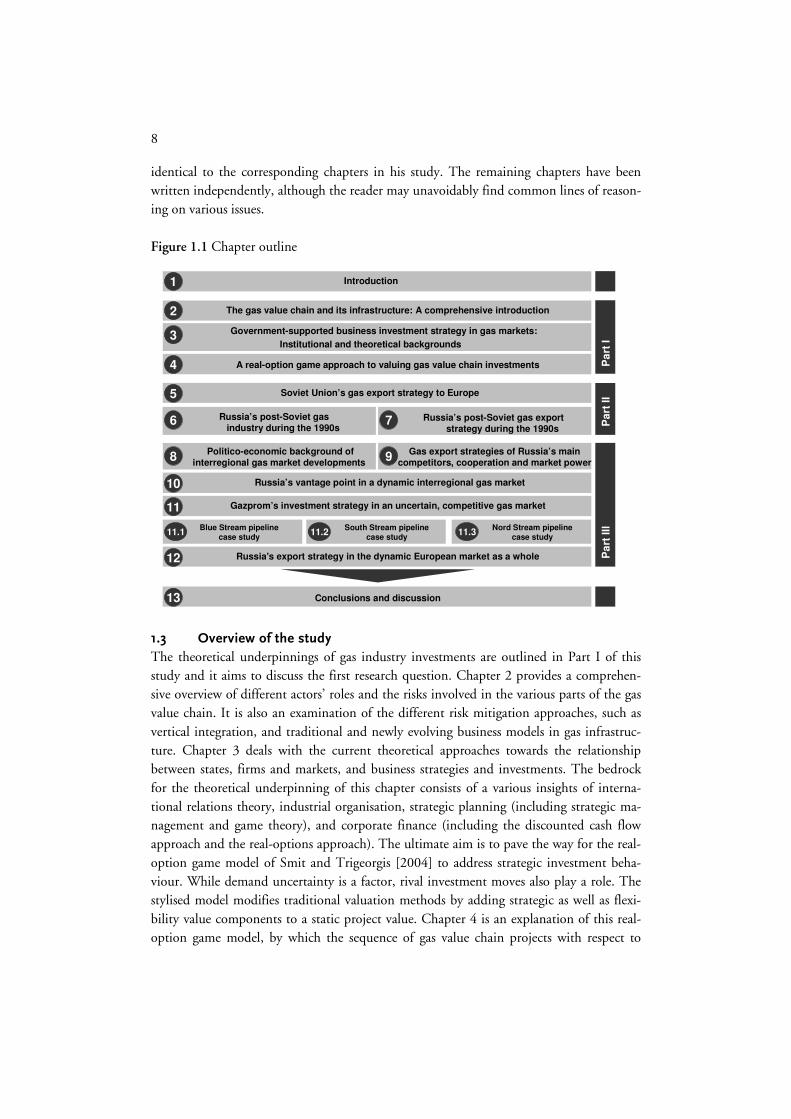
Figure 1.1 Chapter outline Figure 2.1 Gas value chain: physical flow and payment flow of natural gas Figure 2.2 A simplified overview of gas pricing and margin distribution Figure 2.3 Players along the gas value chain Figure 2.4 Relevant stakeholders in the gas infrastructure Figure 2.5 Risks related to gas infrastructure investments Figure 2.6 Risk profile analysis Figure 2.7 Standard structure (take-or-pay) of a gas contract system Figure 2.8 Cost realisation and ramp-up period of pipeline capacity Figure 2.9 Standard guarantee structure of gas contracts Figure 2.10 Time horizon of gas pipeline infrastructure Figure 3.1 Russian oil and gas reserves and production in 2008 Figure 3.2 Developments in the gas market: The growth cycle Figure 3.3 The Five-Forces model: industry and competitive analysis Figure 3.4 Resources as a basis for economic rents: why can investments be valuable? Figure 3.5 Proprietary opportunity (license): Wait with investing under uncertainty Figure 3.6 Impact of business strategic planning on the overall project value Figure 4.1 Exploring a pro-active strategy towards new off-take markets Figure 4.2 Exploring the degree of concentration in possible new off-take markets Figure 4.3 The general structure of financial flows for Russian gas exports Figure 4.4 Time line of two-stage real-option game Figure 4.5 Sign of strategic effect and competitive strategies under different position
and competition Figure 4.6 Graphical representation of quantity competition Figure 4.7 Gazprom’s market outcomes in scenarios and model terms Figure 4.8 The two-stage game in extensive form under different market structures Figure 4.9 The conceptual toolbox and the stylised model Figure 5.1 The value of Soviet hard-currency incomes, including oil and gas exports
(in millions of $) Figure 5.2 Gas consumption in the CMEA-6 from 1965 to 1990 (in bcm) Figure 5.3 Total energy consumption in OECD Europe in 1973 and 1990 Figure 5.4 Gas consumption in Western Europe from 1965 to 1990 (in bcm) Figure 5.5 Gas supply in Western Europe in 1990 (in bcm) Figure 5.6 Export volume of the Soviet Union to Western Europe and the CMEA
(1960-1990, in bcm) Figure 7.1 Gas consumption in Europe from 1990 to 2000 (in bcm) Figure 7.2 Gazprom’s gas exports to Europe 1991-2000 (in bcm) Figure 7.3 The Yamal-Europe pipeline project

xii
Figure 8.1 Historical export volume development of gas exporting countries: 1998-2008
Figure 8.2 Gas supply to the European countries by type and source in 2008 (in bcm)
Figure 8.3 Gas supply to the US by type and source in 2008 (in bcm) Figure 8.4 Gas supply to the Asian LNG importing countries by type and source in
2008 (in bcm) Figure 8.5 World natural gas price formation 2005 and 2007 Figure 8.6 OECD Europe gas market: Reference and Green scenarios (in bcm) Figure 8.7 US gas market: Reference and Green scenarios (in bcm) Figure 8.8 Asia-Pacific gas market: Reference and Green scenarios (in bcm) Figure 9.1 Natural gas balances of Caspian countries in 2007 Figure 9.2 Export potential from the Caspian region (base case scenario) Figure 9.3 LRMC estimates for gas delivered to Europe in 2020 (in $/mcm) Figure 9.4 Market shares of the various gas suppliers in the Atlantic Basin and
Europe in 2007, compared with 2015 (LNG and pipeline) Figure 9.5 The Lerner index for the Atlantic Basin market for LNG Figure 9.6 The Lerner index for the European gas market Figure 10.1 Russia’s gas balance in 2008 Figure 10.2 Russia’s supply portfolio: A possible projection Figure 10.3 Gazprom’s sales and revenues in different markets in 2008 Figure 10.4 Shareholder’s structure OAO Gazprom in 2000 and 2008 Figure 10.5 Approximated schematic schedule of the decision-making process in
the Russian gas industry Figure 10.6 Diversification of Gazprom’s export activities Figure 10.7 Gas prices for Gazprom’s gas in different markets: 2003-2008 Figure 10.8 Export volume of Gazprom to Europe: 1990-2008 Figure 10.9 Gazprom’s sales and market share in European countries in 2008 Figure 11.1 Schematic overview of competing gas supply and transport routes to
the Turkish gas market in 1999 Figure 11.2 Turkey’s natural gas consumption from 1984 to 2000 Figure 11.3 The Blue Stream project Figure 11.4 Trans-Caspian Gas Pipeline project Figure 11.5 Potential exports from the Caspian region in 1999 – base case scenario Figure 11.6 Existing and pending supply distribution over Turkey’s demand
projections in from 1999 onwards Figure 11.7 Comparative unit costs to deliver gas to the Turkish gas market
in Ankara – base case scenario in 1999 $/mcm Figure 11.8 Likely reconstruction of financial structure of the Blue Stream project Figure 11.9 The proprietary case for Blue Stream vis-à-vis the competitor Figure 11.10 Overall Net Project Value as function of upward market demand
potential, u (with d fixed at 0.50)

xiii
Figure 11.11 Overall Net Project Value as function of the WACC Figure 11.12 Overall Net Project Value as function of unit operating costs, c Figure 11.13 Schematic overview of competing gas supply, transport routes and
delivery points, from the Caspian region and Russia to the SSEE market Figure 11.14 Natural gas consumption in SSEE markets until 2008 per country Figure 11.15 Existing and pending supply distribution over SSEE demand projection
(2001-2040) Figure 11.16 The South Stream project Figure 11.17 The Nabucco project Figure 11.18 Gazprom’s proprietary case for South Stream vis-à-vis the competitor Figure 11.19 Overall Net Project Value as function of upward market demand
potential, u (with d fixed at 0.65) Figure 11.20 Overall Net Project Value as function of the WACC Figure 11.21 Overall Net Project Value as function of unit operating costs, c Figure 11.22 Schematic overview of competing gas supply and transport routes from
pipeline and LNG suppliers to NWE market Figure 11.23 Natural gas consumption in Northwest Europe (1965-2008) Figure 11.24 Existing and pending supply distribution over SSEE demand projection
(2001-2036) Figure 11.25 The Nord Stream project Figure 11.26 Gazprom’s proprietary case for Nord Stream vis-à-vis the competitor Figure 11.27 Overall Net Project Value as function of upward market demand
potential, u (with d fixed at 0.55) Figure 11.28 Overall Net Project Value as function of the WACC Figure 11.29 Overall Net Project Value as function of unit operating costs, c Figure 12.1 Breakdown of European demand by sub-region in 2008 Figure 12.2 Total existing, committed and planned export capacity to Europe by
pipeline Figure 12.3 Total European existing, under construction and planned
LNG regasification capacity Figure 12.4 Different demand scenarios for the European gas market in 2015 Figure 12.5 Pipeline and LNG supplies from Russia’s competitors in the European
market: Different scenarios for 2015 Figure 12.6 Gazprom’s possible gas supply in Europe, based on combined scenarios
of European gas demand and competition supply in 2015 Figure 12.7 Different market position and market condition scenarios for Russia Figure 12.8 Physical Gazprom’s export flows via different supply routes to Europe in
2007 Figure 12.9 Gazprom’s existing, committed and planned export capacity to Europe
by pipeline

xiv
Tables
Table 4.1 Equilibrium quantities, profits and state project values for various market structures under contrarian (Cournot) quantity competition in the second stage
Table 11.1 Second-stage equilibrium state project values and strategic effects for different market structures and states of demand for the base and proprietary pipeline investment case
Table 11.2 Second-stage equilibrium state project values and strategic effects for different market structures and states of demand for the base and proprietary pipeline investment case
Table 11.3 Second-stage equilibrium state project values and strategic effects for different market structures and states of demand for the base and proprietary pipeline investment case
Boxes
Box 2.1 Netback pricing mechanism Box 2.2 Managing the ramp-up period of pipeline capacity and cost realisation Box 3.1 Concentration and market power Box 3.2 Economic rent: Definition, underlying sources and the link to
corporate finance Box 12.1 Theoretical versus practical desirability of monopoly or near-monopoly
market outcomes
Maps
Map 8.1 Geopolitical spheres of influence, forces and gas flows Map 8.2 Main net-exporting countries and their gas infrastructures Map 9.1 GECF, OPEC, and Gazprom’s selected shared investments
and cooperation along the gas value chain

xv
Glossary
Notations
tbd thousand billion barrels tmb thousand million barrels bbl(s) barrel(s) bbls/d barrels per day $/bbl dollar per barrel mb/d million barrels per day tcm thousand cubic meters bcm billion cubic meters1 bcm/y billion cubic meters per year mmbtu million British Thermal Units $/mmbtu dollar per million British Thermal Units mcm thousand cubic meters mcm/y thousand cubic meters per year $/mcm dollar per thousand cubic meters EUR Euro km kilometre MJ/cm mega joule per cubic meter MW mega watt R/P ratio Reserves-to-Production ratio RUR/US$ Russian rouble per dollar mln million Countries, governmental and intergovernmental organisations
CAU Central Asian Union CIS Commonwealth of Independent States CMEA Council for Mutual Economic Assistance CSTO Collective Security Treaty Organisation CREG Commission de Régulation de l’Électricité et du Gaz EBRD European Bank for Reconstruction and Development EC European Commission EC European Community
1 A standard cubic meter is defined by a cubic meter at 0 atm. and 0 degrees Celsius. On average, the calorific value of European gas (including Norway) is 40 mega joule (MJ) per cubic meter. The different cubic meters of gas are con-verted to ‘European’ cubic meters (excluding data from BP and IEA and other data where explicitly stated). A Russian cubic meter has to be multiplied by 0.9. This conversion factor can be explained by the following definition: a Russian cubic meter of gas has a pressure of 1 atm. and is defined at a temperature of 20 degrees Celsius. On average, the calorific value of Russian gas is 38.5 MJ per cubic meter [CIEP 2008].

xvi
ECT Energy Charter Treaty EEA European Economic Area EEC European Economic Community EFTA European Free Trade Association EIB European Investment Bank EU European Union FYROM Former Yugoslav Republic of Macedonia GATT General Agreement on Tariffs and Trade GECF Gas Exporting Countries Forum GUAM Georgia, Ukraine, Azerbaijan, and Moldova Organisation for Democracy and Economic Development IGU International Gas Union IMF International Monetary Fund KGB Komitet Gosoedarstvennoj Bezopasnosti MENR Ministry of Energy and Natural Resources NATO North Atlantic Treaty Organisation NPD National Petroleum Directorate OECD Organisation for Economic Co-operation and Development OIC Organisation of Islamic Conference OPEC Organisation of the Petroleum Exporting Countries OSCE Organisation for Security and Cooperation in Europe SCO Shanghai Cooperation Organisation UAE United Arab Emirates UK United Kingdom UN United Nations UNIDO United Nations Industrial Development Organisation US United States (of America) US DOE United States Department of Energy USSR Union of Soviet Socialist Republics WTO World Trade Organisation
Research institutions and Organisations
CERA Cambridge Energy Research Associates CIEP Clingendael International Energy Programme IEA International Energy Agency EIA Energy Information Administration EIU Economist Intelligence Unit MEES Middle East Economic Survey NGMR Natural Gas Market Review RIA Russian Information Agency OME Obervatoire Mediterraneen de l’Energie WGI World Gas Intelligence

xvii
Energy companies
AIOC Azerbaijan International Operating Company Agip KCO Agip Kazakhstan North Caspian Operating Company BASF Badische Anilin- und Soda-Fabrik BHP Billiton Broken Hill Proprietary BP British Petroleum BG British Gas Cepsa Compañía Española de Petróleos S.A. CNOOC China National Offshore Oil Corporation CNPC China National Petroleum Corporation Depa Public Gas Corporation of Greece DESFA Hellenic Gas Transmission System Operator EDF Electricité de France EGL Elektrizitats-Gesellschaft Laufenburg AG Enagás Empresa Nacional del Gas ENI Ente Nazionale Idrocarburi ENEL Ente Nazionale per l'Energia eLettrica Gazprom M&T Gazprom Marketing & Trading GDF Gaz de France (Suez) GFU Gas Negotiating Committee INGC Indian Oil and Gas Corporation KPO Karachanak Petroleum MOL Magyar Olaj és Gázipari Részvénytársaság NAM Nederlandse Aardolie Maatschappij NES National Energy Services NIOC National Iranian Oil Company NIGC National Iranian Gas Company NIGEC National Iranian Gas Export Company OMV Österreichische Mineralölverwaltung PGNiG Polish Petroleum and Gas Mining RasGas Ras Laffan LNG Company RWE Rheinisch-Westfälisches Elektrizitätswerk SNAM Società Nazionale Metanodotti SOCAR State Oil Company of Azerbaijan Republic SODECO Sakhalin Oil and Gas Development Corp. Sonatrach Société Nationale pour le Transport et la Commercialasation des Hydrocarbures Statoil Norske Stats Oljeselskap AS TPAO Turkish State Petroleum Company Qatargas Qatar LNG Company WIEE Wintershall Erdgas Handelshaus Zug AG WIEH Wintershall Erdgas Handelshaus GmbH

xviii
Gas Pipelines
AGP Arab Gas Pipeline BBL Balgzand Bacton Line BTC Baku Tbilisi Ceyhan (pipeline) CAC/SAT Central Asia-Centre (pipeline system) GALSI Gasdotto Algeria Sardegna Italia (pipeline) GUEU Georgia-Ukraine-European Union (pipeline) IGAT Iranian Gas Trunkline (pipeline series) IGI Interconnector Greece Italy (pipeline) IPI Iran-Pakistan-India (pipeline) JAGAL Jamal-Gas-Anbindungs-Leitung MEGAL Mittel-Europäische-Gasleitung MIDAL Mittel-Deutsche Anbindungs-Leitung NEGP North European Gas Pipeline SCP South Caucasus Pipeline TAG Trans Austria Gasleitung TAP Trans-Adriatic Pipeline TAPI Turkmenistan-Afghanistan-Pakistan-India (pipeline) TCGP Trans-Caspian Gas Pipeline TGII Turkey-Greece-Italy Interconnector (pipeline) TIT Turkmen-Iranian-Turkish (pipeline) TSGP Trans Sahara Gas pipeline UGTS United Gas Transmission System Miscellaneous
ACG Azeri-Chirag-Gunashli (associated gas fields) ACQ Annual Contracted Quantities AGC Argus Gas Connections CAPEX Capital Expenditures CAPM Capital Asset Pricing Model CCGT Combined Cycle Gas Turbines CCS Carbon Capture and Storage CDC Caspian Development Corporation CEE Central and Eastern Europe CEGH Central European Gas Hub CEO Chief Executive Officer CO2 Carbon Dioxide DCF Discounting Cash Flow EEZ Exclusive Economic Zone EGA Eurasia Gas Alliance ENP European Neighbourhood Policy FID Final Investment Decision

xix
FOB Free on Board GATE Gas Access To Europe GDP Gross Domestic Product GIE Gas Infrastructure Europe GtL Gas-to-Liquids HoA Heads of Agreement INOGATE Interstate Oil and Gas Transport to Europe IPE International Political Economy IPO(s) Initial public offering(s) IRNA Islamic Republic News Agency ISA Iranian Sanction Act ISLA Iran-Libya Sanction Act ISO Independent Systems Operator ITSO(s) Independent Transport Service Operator(s) JBIC Japan Bank for International Cooperation JCC Japan Crude Cocktail J-EXIM Export-Import Bank of Japan LNG Liquefied Natural Gas LDR(s) London Depository Receipt(s) LRMC Long-Run Marginal Costs M&A(s) Mergers and Acquisition(s) MEES Middle East Economic Survey MITI Ministry of International Trade and Industry MoU Memorandum of understanding NBP National Balancing Point NGMR Natural Gas Market Reports NIMBY Not In My Back Yard NNEE North and Northeastern Europe NYMEX New York Mercantile Exchange NPV Net present value NPV* Overall net present value NPT Nadym-Pur-Taz NWE Northwestern Europe OAO Otkrytoe Aktsionernoe Obschestvo (Russian open joint-stock company) OGPP Orenberg Gas Processing Plant OPEX Operational Expenditures PCA(s) Partnership and Cooperation Agreement(s) PIGR Platts International Gas Review PHARE Poland and Hungary Assistance for Restructuring their Economies PSA(s) Production Sharing Agreement(s) PSO Public Service Obligation

xx
PSV Punto di Scambio Virtuale PPP Public-private partnership RAO Russian joint stock company RFE/RL Radio Free Europe/Radio Liberty SACE Servizi Assicurativi del Commercio Estero SDFI State Direct Financial Interest SRMC Short-Run Marginal Costs SPA Sales and Purchase Agreement SSEE Southern and Southeastern Europe SWF(s) Sovereign Wealth Fund(s) TACIS Technical Assistance to the Commonwealth of Independent States TEN-E Trans-European Network TENP Trans-European Networks Programme TRACECA Transport Corridor Europe-Caucasus-Asia TTF Title Transfer Facility TPA Third-Party Access TSO Transport Service Operator UGS Underground Gas Storage WACC Weighted Average Cost of Capital WEO World Energy Outlook WGI World Gas Intelligence WTI West Texas Intermediate
1
Chapter 1 Introduction
1.1 Research background
Russia has the largest conventional gas reserves in the world with about a quarter of the total. Although Russia also has significant oil reserves and is a large producer, its natural gas reserves, in tons of oil equivalent, vastly exceed those of oil [BP 2009]. Due to the vastness of the gas reserves and the quality of natural gas as a relatively clean fuel, gas is considered to be an important fuel of the 21st century. According to the International Energy Agency [2009c], gas demand is expected to grow in the coming two decades in the main regional markets, although the outlook is still very uncertain. Russia is thus well-positioned. Moreover, in Russia’s main export market – in West and Central Europe – natural gas production is predicted to decline, opening new export possibilities. Despite the mid-term positive outlook for gas, demand declined in 2009 as a result of the financial and economic crisis. This decline in demand coincided with new gas flows, in particular liquefied natural gas (LNG)2 and unconventional gas in the United States (US), coming on the market, putting pressure on volumes and prices in some markets.3 The demand outlook in the long term looks even more uncertain vis-à-vis the mid term, largely as a result of the growing role of renewables. Already from the Soviet era, Russia has been one of the largest producers and exporters of natural gas. Since the 1960s, also the domestic gas market expanded, and for Russia the main question is when to develop and export the resources to satisfy both domestic and foreign needs for gas; while also serving socio-economic priorities.4 After the demise of the Soviet Union, energy exports were the main exportable products for hard-currency mar-kets. These revenues have, to a certain extent, channeled the economy into a one-product economic structure, as has been the case in many energy-exporting countries. Russia strug-gles with the notion that it should move its focus from energy incomes towards earnings from modern sectors, such as information technology and telecommunications [Trenin 2008; Financial Times 2009]. Yet, developing Russia’s gas reserves may offer economic stability and capital to invest in their new sectors. Moreover, energy provides Russia with an important role in international affairs. In addition, Russia may be encouraged by its off-take regions, such as Europe and perhaps China, to develop its resources for their energy
2 LNG is a mode of transport for gas by which methane is super cooled to minus 260 degrees Celsius, enabling its transport in liquid form in tankers or LNG cargoes. The upstream physical chain, which produces LNG, is called a ‘train’. This train is able to produce a certain amount to be loaded on a cargo.
3 In markets where long-term oil-related contracts are dominated, firms in consuming countries used the room for flexible off-take on their take-or-pay contracts.
4 Increasingly, Russia is focusing on the development of a gas-based industry in order to export (semi-)products. How-ever, this study concentrates on gas as a commodity product.

2
needs. Hence, the main decision-makers within the government believed that if used effec-tively, mineral and energy resources could provide the basis for Russia’s entry into the world economy and could offer the means to modernise Russia’s military and industrial complex [Balzer 2005; Lavrov 2007]. For this reason, management of the domestic re-source base – i.e., to make use of its natural competitive advantages – plays a crucial role in the future of the Russian State. Yet, the privatisation of the energy sector during the 1990s, induced by the introduction of market concepts based on the Western economic model in Russia, had resulted in the government’s loss of control over the sector’s resource management and windfall profits flowed largely to the private sector [Åslund 2007]. The gas sector remained rather centra-lised owing to a strong political lobby to keep the sector together. Both the importance for the domestic market and the rigidity of pipeline transport had reinforced its continued centralised institutionalisation. The rapid development of export markets in the period of economic decline in the 1990s and the clean properties of gas held promises for future significance. Gas holds therefore the promise for Russia to be a tool for economic growth and diversification, like oil was up till now. Gazprom, as a government-controlled firm, has come to embody Russia’s awareness of its role as an important future gas supplier with global aspirations [Åslund 2007]. Restoring Russia’s grip over a large part of the Russian gas sector took place against the backdrop of record-breaking energy prices in the four years leading up to August 2008. Gazprom has a dominant position in Russian gas production, although the role of independent (foreign) producers is growing (25 percent in 2008) [IEA 2009b; Gazprom 2009].5 In addition, Gazprom owns the Russian united gas transmission system (UGTS) and since 2006, it officially holds a monopoly over Russia’s existing and potential gas exports. However, it is possible that Gazprom must share this position with Rosneft – Russian national oil firm – who also is developing its gas resources [Financial Times 2010]. For its export and hard-currency earnings, Gazprom is highly dependant on the European markets [Gazprom 2009]. The ‘pipeline’ orientation towards Europe is the heritage of more than half a century of gas developments, both in Russia’s ‘backyard’ in the Com-monwealth of Independent States (CIS) and Central Europe and the West-European hard-currency markets. Given the central role of Gazprom in gas exports, this study takes essentially the view of Gazprom as its perspective, with a particular focus on strategic infra-structure investments for Gazprom’s gas exports. The European market, Russia’s main export market, has also been undergoing a process of major restructuring, enforced by European Union (EU) directives aimed at lowering the
5 The term ‘independent’, however, has become increasingly unsuitable since Gazprom formed strategic relationship with and has taken (minority) equity stakes in these companies [Stern 2009].

3
barriers to entry, enhancing competition, and integrating national markets into a single European gas market [De Jong et al. 2010]. Together with changes in the other main regional gas markets6 – the US and Asia – market structures and trading and pricing pat-terns will change as a result of different factors, such as the increasing import-dependencies and the development of new supply flows. This change precipitates the need for compara-tively greater interregional7 gas flows in the medium-term and beyond 2015-2020 [IEA 2009c]. The regional gas markets began their development in relative isolation; each with their own pricing and trade patterns and their own market structures. The regional markets have gradually become more interlinked and interconnected and have recently been ex-posed to many of the same LNG flows. However, they still differ in terms of how gas is priced and traded [Barnes et al. 2006]. The big prize, in absolute volume terms of rising import-dependency – and thus new market share – is likely to remain Europe for some time to come, especially for Russia [IEA 2009a]. In addition, Asia, which includes mature gas markets, such as Japan, and emerging gas markets, such as China and India, will offer most of the growth opportunities in relative terms. The expected increase in LNG imports in the US market does not look likely to materialise due to the rapid increase of unconven-tional gas production. The combination of new LNG and unconventional supplies and the reduction in demand caused the seller’s market of the last few years to quickly turn into a buyer’s market [IEA 2009c].
Due to the oligopolistic situation of the supply of gas for exports, only a few pipeline and LNG gas suppliers can influence the various regional gas markets. In terms of gas reserves, in addition to Russia, also Iran and Qatar can influence the market over a long period of time, while the potential to influence the market in medium term also rests with substan-tial suppliers, such as Norway, Algeria, Nigeria and Australia. Russia has to get used to a situation where more varied supplies can reach its traditional export market. Both LNG and alternative pipeline supplies are vying for market share on the European market. It is in this environment of market change that we have to view Gazprom’s strategy, which is shifting its export focus from a regional to a more global scope [Stern 2009; Gazprom 2009]. For Gazprom, the issue at stake is crafting an investment strategy that maximises
6 The non-OECD gas producing countries are also large consumers of gas (for example, the CIS, Middle Eastern and North African countries) [IEA 2009a]. This study focuses primarily on the export strategies towards gas-importing countries. Combined with the fact that these countries are more or less self-sufficient, these off-take markets will not be taken into account in an in-depth analysis.
7 The term ‘interregional’ is used to a refer to the idea that, while gas is still largely traded on a regional basis, the increasing amounts of LNG made available over the last decade flow between these regional markets. In the meantime, while LNG (and pipeline) trade increasingly takes place between regions, i.e., is more interregional, the gas market is in that regard far from entirely global, especially when compared with the world oil market. Hence, the term interregional is preferable over global.
4
the value of its resources available for exports.8 Therefore, Gazprom must make a series of complex interrelated strategic investment decisions in its gas value chain to both gain access to new markets and secure old ones. Combined with the fact that Gazprom’s pro-duction has been declining recently, it must develop new gas production areas and/or increase its imports from the former Soviet republics in the Caspian region. Yet, both the development of new production areas and the Caspian imports are becoming more expen-sive than in the past. Nonetheless, the company has repeatedly announced investment programmes for new gas production areas (e.g., Yamal Peninsula, the Barents Sea, and Eastern Siberia). In order to deliver additional gas volumes to expanding markets, suppliers must build also new capacities in gas transport to connect these supplies with the market. In this respect, Gazprom has announced and started to realise several gas infrastructure projects (e.g., Nord and South Stream, LNG and Asian pipeline projects). This position points to a proactive stance on Gazprom’s part when it comes to playing a more global role by rein-forcing export plans [CIEP 2008; Gazprom 2009]. It is nevertheless expected that the European market will remain Gazprom’s main gas export market in the foreseeable future. The capacities, or infrastructures, set the stage and creates the strategic context, in which the firm can preserve its continuity and thrive [Smit 2003]. In the gas market, infrastruc-tures such as pipelines and LNG trains act as options for vertically integrated firms in gaining, maintaining or expanding access to new markets or consolidate positions in exis-ting ones. In natural gas transport, primarily in large-diameter pipelines, economies of scale and unit costs play a critical role. Lower absolute unit costs with greater gas transport capacity can enable a gas supplier to capture additional market share relative to potential rival suppliers. Thus relative cost advantages can endow certain gas infrastructures with a certain strategic value. This value is realised when greater economies of scale in capacity lock out or limit the presence of possible competitors in the market (entry deterrence value) [Tirole 1988]. Additional value can be reaped from changing the structure of the market altogether as a result of a strategic investment that captures additional market share. Moreover, (geo)political drivers can also trigger investments to enhance the impor-tance of the state9. Of course, market demand is not a static factor; it may rise, remain stagnant or fall and should be taken into account, alongside the potential sources of competition as a factor of uncertainty. In the case of a high downside demand risk, economies of scale in gas trans-
8 The possible threat of resource curse, among others, could limit the availability of gas for its export market.
9 While the ‘state’ as an entity pertains to entire nations being and resources, including the government, resources, population and resources, the term ’government’ is employed to refer to the decision-making body, responsible for state affairs, often as a stakeholder in firm-level affairs, particularly in gas-producer countries. The firm is ultimately accountable to a government rather than the state as a whole.
5
port can be seen as a strategic disadvantage if price competition will increase sharply and reduce income. Alternatively, a part of capacity will not be used as a result of reducing gas sales, which increases the transport unit cost. The possible downside demand risk could encourage a less pro-active strategy, despite the deterrence effect of such a strategic invest-ment [Smit and Trigeorgis 2004]. After all, strategic investments are cumbersome and ultimately may prove to be unprofitable in the case of oversupply when other suppliers engage in strategic investments. To illustrate this fact, many large-scale LNG projects (such as those in Qatar and Nigeria) have come and will come onstream in 2009-10, much of them falling into the category of flexible LNG – gas not committed to any markets for the long term. This flexible LNG is competing with, for example, Russian supplies in Europe and unconventional gas in the US. However, US demand for gas imports has dropped as a result of the development of unconventional gas and the overall reduction in demand owing to the economic crisis. These developments have led to a situation of over-supply, at least for some years, and have affected prices negatively. Traditionally, the busi-ness model based on long-term contracts between producers and buyers in Asia and Europe mitigates volume risks in the market, and therefore ensures a first-mover advantage because of economies of scale. The new business model of flexible supplies has challenged this traditional business model.10 The current decline in economic activity, combined with falling gas prices and the relative scarcity of finance, technology and human capital, are likely to affect Gazprom’s invest-ment decisions [CIEP 2008]. Moreover, the recent gas disputes between Russia and Ukraine (2005/06 and 2008/09), which in 2009 resulted in serious gas supply shortfalls in mainly Southeastern Europe, have politicised Russia’s position in the European market and investments. This (geo)political ‘sensitisation’ has led to a drive on the part of mostly US orientated countries, mainly Central European ones, to promote limitation and/or containment of their own (and European) dependencies on Russian gas. Therefore, these trans-Atlantic orientated countries politically support flows that might encourage diversifi-cation away from Russian gas, such as the Nabucco pipeline from the Caspian region (and the Middle East) to Europe. Conversely, continental countries (such as Germany and Italy) encourage further integration of Gazprom’s investments. This is driven by a per-ceived need at the national and business level of gaining greater upstream access to Russia’s gas sector in an effort to secure gas supplies in the long term. Moreover, the diversification of pipeline routes and the rerouting of existing flows could increase Russia’s security of demand (and European security of supply), and may therefore encourage new infrastruc-ture investments to maintain access to this important export market [Grigoriev and Belova 2009].
10 Yet, few flexible spot LNG has reached the European market, because buyers have difficulty absorbing their ‘take’ gas. Once the threshold can be breached it is possible that the ‘take’ gas will stabilise and additional supplies come from flexible spot LNG [De Jong et al. 2010].
6
Given the wide ranging gas market changes in both the domestic and Russia’s export mar-kets, a strategic-economic analysis is required to fully understand Gazprom’s infrastructure investment decisions. This approach allows us to integrate the impact of potential com-petitors’ entry and market uncertainties. Gazprom’s assertive investment strategy (in the midstream) so far could be explained by incorporating strategic aspects, besides purely (short-term) commercial ones, like economies of scale and early mover’s advantages in capturing additional market share vis-à-vis its competition (i.e., deter competition). How-ever, different (policy) hurdles threaten the strategic value and relevance of such invest-ments and therefore also their institutionalisation. This in turn underlines the importance of a wait-and-see strategy, i.e., delaying investment decisions. Because of the complexity of the interregional gas market and the fact that gas has yet to experience a further evolution in its product lifecycle, we focus here primarily on competi-tion, where suppliers are assumed to compete with gas volumes rather than with gas prices. It is acknowledged, however, that issues of pricing and trade patterns also have a funda-mental impact on the development of the interregional gas market; this will be discussed in a qualitative way. The notion that firms compete on the basis of volumes (i.e., capaci-ties) before way is given to price competition concurs with a widely held view in industrial organisation [Tirole 1988; Jacquemain 1987]. While much has been written about the role of Russian gas in the Europe market and pipelines which supply this market, little is said about the strategic-economic value for Gazprom (and for Russia) of infrastructural investments in maintaining and expanding its export position. In this analysis, we have developed a stylised approach to assessing such value through a so-called real-option game model, which assumes value maximalisation as a rational criterion. This approach offers intuitive insights about the value of Gazprom’s investments under conditions of both uncertainties of future gas demand and the strategic interaction with rival gas exporters. In addition, we apply strategic valuation techniques in real-world cases. Nevertheless, the stylised model has its limitations, despite its explanatory merits. For instance, it is limited to duopoly situations, i.e., limitation to two suppliers, whereas the gas industry is usually characterised by more than two (interregional) sup-pliers. Also, the model does not take the issue of pricing into account, even though pricing is an important driver in the present-day development in the interregional gas industry. Therefore, a complementary quantitative assessment, based on a conceptual toolbox, is used to include aspects, which are not covered by the model. This toolbox includes other elements into the process of decision-making as well as business models to institutionalise gas infrastructure investments. 1.2 Research objective and research questions
The politico-strategic implications of Russia’s investment strategies and decisions are bound to have a long-lasting impact on Europe’s energy balance in general, and its gas balance in particular; with all its geo-economic and ultimately also geopolitical conse-
7
quences. A multi-disciplinary investigation into Gazprom’s investment strategy can help shed some light on the economic and political logic of these investment strategies and is a topic that merits further research and academic inquiry. Given the above, this study pre-sents a concerted effort to pursue the following research objective: In order to pursue this objective, the following research questions are specified to disen-tangle the complexity of the gas export strategy and the accompanying investments in infrastructure:
1) What are the different institutional and theoretical aspects and relevant valuation tools in relation to the gas infrastructure investments in light of business strategies and markets?
2) What is the historical-institutional background with respect to Russia’s, and Gaz-prom’s, investment strategy regarding its export markets?
3) What is Russia’s, and Gazprom’s, position in the rapidly evolving interregional gas market that pertains to Europe?
4) How can we identify, evaluate and extrapolate Gazprom’s investment strategy re-garding Russia’s gas exports and export market behaviour, based on empirical analysis of a number of case studies?
Answers to these questions may provide us with further insights into both the commercial and the economic-strategic value of (proposed) investments in gas-infrastructural projects. The study is organised into three parts, aiming in this manner to answer the different research questions (see Figure 1.1 for a chapter outline). In order to evaluate Russia’s, and Gazprom’s, gas export strategy and the geo-economic and geopolitical developments on project-level, it is necessary to integrate macro-level aspects into project-level evaluations. These macro-level aspects require us to look at re-gional project-level evaluations, because of the regional and rigid character of the gas mar-ket. A major part of this research has been conducted in cooperation with a fellow PhD researcher, Mr. Timothy A. Boon von Ochssée. His work, see Boon von Ochssée [2010], deals with the market structure-level, with Russia as a focal point, aiming at discovering the boundary solutions for cooperation between gas-exporting countries. Herein Gaz-prom’s gas export infrastructure investments play a key role. Therefore, cooperation has been extensive on the empirical front as well as on the theoretical one. This cooperation has resulted in chapters 3, 8, 9, 10 and 12, being similar with respect to major elements of the corresponding parts of Boon von Ochssée’s study. Chapters 4 and 11 are virtually
To identify, evaluate and extrapolate Gazprom’s investment strategy regarding Russia’s gas exports and export market behaviour, with a focus on European infrastructure projects, in a geopolitical context.
Research objective
8
identical to the corresponding chapters in his study. The remaining chapters have been written independently, although the reader may unavoidably find common lines of reason-ing on various issues.
Figure 1.1 Chapter outline
The gas value chain and its infrastructure: A comprehensive introduction
Russia’s post-Soviet gas industry during the 1990s
Russia’s post-Soviet gas export strategy during the 1990s
Russia’s vantage point in a dynamic interregional gas market
Gazprom’s investment strategy in an uncertain, competitive gas market
Introduction
Soviet Union’s gas export strategy to Europe
Conclusions and discussion
1
2
5
6 7 Part
II
10
Pa
rt III
11
Blue Stream pipeline case study
11.1
13
South Stream pipeline case study
11.2Nord Stream pipeline
case study 11.3
Pa
rt I
Politico-economic background of interregional gas market developments
Gas export strategies of Russia’s main competitors, cooperation and market power
8 9
A real-option game approach to valuing gas value chain investments
Government-supported business investment strategy in gas markets:
Institutional and theoretical backgrounds3
4
Russia's export strategy in the dynamic European market as a whole12
1.3 Overview of the study
The theoretical underpinnings of gas industry investments are outlined in Part I of this study and it aims to discuss the first research question. Chapter 2 provides a comprehen-sive overview of different actors’ roles and the risks involved in the various parts of the gas value chain. It is also an examination of the different risk mitigation approaches, such as vertical integration, and traditional and newly evolving business models in gas infrastruc-ture. Chapter 3 deals with the current theoretical approaches towards the relationship between states, firms and markets, and business strategies and investments. The bedrock for the theoretical underpinning of this chapter consists of a various insights of interna-tional relations theory, industrial organisation, strategic planning (including strategic ma-nagement and game theory), and corporate finance (including the discounted cash flow approach and the real-options approach). The ultimate aim is to pave the way for the real-option game model of Smit and Trigeorgis [2004] to address strategic investment beha-viour. While demand uncertainty is a factor, rival investment moves also play a role. The stylised model modifies traditional valuation methods by adding strategic as well as flexi-bility value components to a static project value. Chapter 4 is an explanation of this real-option game model, by which the sequence of gas value chain projects with respect to

9
Gazprom’s export markets should be assessed, both in a quantitative and qualitative framework. This is preceded by a conceptual framework, which is used to include aspects, which are not covered by the model, such as Barnes et al. [2006] have done. The concep-tual framework (toolbox) and the real-option game model concentrates on infrastructure projects, in a sense that they may create an advantageous strategic position by expanding their economies of scale in the value chain or in the infrastructure project itself, especially in the case of long-distance transport.11 These strategic investments feed back into the process of strategy-making vis-à-vis Gazprom, and therefore Russia’s, relative position in dynamic gas markets. In the end, these could also influence Russia’s relative power in the international political system, shaped by its resources, capabilities, and geographical dispo-sition. Part II is an overview of the historic-institutional development of Russia’s export strategy. Chapter 5 is a historic account of how the politico-economic rationale arose for starting Soviet gas exports, in addition to oil exports. Moreover, a discussion of the institutionalisa-tion of the Soviet Union’s gas production and export programme is included. The conse-quences of the institutional transition on the Eurasian continent for Russia’s export stra-tegy during the 1990s, a transition which began with the fall of the Berlin Wall in 1989 and the break-up of the Soviet Union more than a year later, will be discussed and ex-plored in chapters 6 and 7. Chapter 6 is an account of the changing institutionalisation of Russia’s gas industry and Gazprom’s changing upstream and transit position and the corre-sponding export strategy with respect to the former Soviet states during the 1990s. Chap-ter 7 is an assessment of Russia’s gas export strategy to Europe during the 1990s, against the background of major political and economic transformations taking place in that pe-riod in Europe. The aim of this part is to discuss the second research question. Russia’s strategic path-dependency not only determines which investment alternatives are open to Gazprom today, but can also constrain the firm’s future choices to create a competitive advantage. Part III assesses the current and future possible (midstream) investment strategy of Gaz-prom for Russia’s growing export markets in a rapidly evolving interregional gas market. In light of the current geo-economic and geopolitical dimensions of gas flows, Chapter 8 is an overview of interregional gas flows and gas pricing patterns in interregional trade. Chapter 9 addresses the gas export strategies of Russia’s main competitors, with a special focus on the former-Soviet republics in the Caspian region. Next, attention is paid to the gas-exporting countries’ market power in the European and Atlantic market and develop-ments in the field of cooperation amongst gas-exporting countries. Chapter 10 is an ex-posé of Russia’s gas export strategy and its internal and external incentives as well as re-
11 Economies of scale can be found either in the mid-stream (e.g., large diameter pipelines) or along the entire chain (e.g., large fields). Taking into account that the associated costs of midstream infrastructures are capital intensive and sunk when the investment is made.

10
strictions in shaping an appropriate investment strategy for Gazprom. Together, these largely descriptive chapters aiming to discuss the third research question of this study. Chapter 11 applies the stylised real-option game model in a duopoly setting, combined with the conceptual framework for analysis, to a number of cases and aims to approach the last research question. Since the international gas market is in fact still very (sub)regional, it is useful to break down the problem into three separate case studies. This is done by looking at Gazprom’s plausible investment strategy, first through a country-level lens, then through a sub-regional level lens. The chapter is opened with a historical case, in order to provide an ex-post evaluation of a strategic investment. It focuses on growth markets, in which a proactive Gazprom investment policy is deemed desirable, given the level of com-petition, and market, transit and other (politico-economic) uncertainties. Account is taken of the institutionalisation strategy at the disposal of the Euro-Atlantic community to chal-lenge Gazprom’s investment strategy. European sub-regional markets will be given specific attention in the other two cases. In Chapter 12, the various market outcomes and scena-rios are analysed at a regional European level and Russia’s possible sequences of invest-ment-scenarios over time (i.e., the so-called merit order) will be discussed in a qualitative way. In addition, the Chapter 12 addresses the rationale for overcapacity in Russia’s export pipeline system. The best export strategy-outcome for Russia and Gazprom is subject to different investment parameters, including organisational and financial constraints and consequences of various market outcomes. Chapter 13 summarises the main findings and tries to evaluate the research objective of the study. Additionally, it provides a discussion and recommendations and suggests fur-ther research. 1.4 Research methodology
The methodology applied in this study consists of a two-fold, multi-disciplinary approach. First, a descriptive method is used to bring together all the required facts, figures and other necessary information through reviews of literature and statistical information. The de-scriptive method is largely applied in Part II and in chapter 8-10 of Part III. Secondly, a quantitative model is employed to analyse strategic interaction and to value investments in a real-option game setting, combined with a conceptual framework. In Part I, Chapter 3/4, the real-option game model is embedded in multi-disciplinary approaches of govern-ment-controlled business (investment) strategies in dynamic gas markets. Such two-fold, multi-disciplinary framework is necessary to integrate international relations and (political) economy in order to explain the real-world complex issues in the gas market and the inter-play between governments and markets. Through three case studies, Chapter 11 in Part III applies the real-option game model, embedded in a conceptual framework. Parts of the conceptual framework will be applied in Chapter 12 as well.

11
The previous explanation implies that the empirical research has two main orientations. An important part is of a descriptive institutional nature. The part that concerns the evalua-tion of infrastructural investments is based on case-study analyses and is of an explorative nature. The multi-disciplinary nature of the research is highlighted by a combination of the use of different disciplines, notably a market-economic, a financial-economic and a politically-oriented one. A large part of this study has been written in the context of a seller’s market for oil and natural gas. This period lasted from the mid-2000s to the autumn of 2008, while from the subsequent year onwards a buyer’s market has resulted. Account is taken of buyer’s market conditions throughout the study, even though the reader may encounter streams of thought pertaining to the prevalence of a seller’s market. This research reports on a study of the institutional and strategic choices Russia, and Gaz-prom, can possibly make regarding their position in the relevant export markets. In par-ticular, we will concentrate on Gazprom’s possible capacity expansions in the light of Rus-sia’s desirable gas export strategy, given its socio-economic constraints. These capacity expansions could be seen for Gazprom, and Russia, as a way to ensure their position in the changing interregional gas market. Among other issues, our analysis reveals that strategic capacity expansion projects typically include the option to postpone (wait and see). There-fore, a crucial element of strategic infrastructural planning in gas markets involves the timing of strategic investments, i.e., committing now vis-à-vis postponing to a later period. This timing aspect gains even more importance when uncertainty of future demand is considered simultaneously with competitive behaviour of (potential) rival suppliers in the market.

12

13
PART I

14

15
Chapter 2 The gas value chain and its infrastructure:
A comprehensive introduction
2.1 Introduction12
During the 20th century, natural gas has developed into an important fuel source in many countries' energy mix. Previously, natural gas was only used on a minor scale. In the US, natural gas was first used in 1821, and at that time its use was purely local. Fifty years later, in Baku (Azerbaijan), natural gas was captured during local oil extraction work. Technological progress during the 1920s made gas transport over long distances possible. In 1925, the US started building a long-distance pipeline system, while in the 1950s the Soviet Union began doing the same on a large scale. The discovery of the Groningen field in the Netherlands, in 1959, launched the development of a European continental gas transport system. A decade later, the British developed their own pipeline network, inde-pendent from the continental European system [CE/CIEP 2007]. From the 1970s on-ward, the European gas network expanded further, with connections to Russia, Norway and Algeria [Correljé et al. 2009]. The transport and supply of gas is a complex matter, owing to its capital-intensive nature and the investment risks for the stakeholders. This chapter provides a background to gas transport in relation to the value chain (i.e., from gas extraction to gas delivery) and risk management within the value chain. Section 2.2 starts by describing the gas value chain and the various interests of stakeholders in that value chain. The focus is on the position of gas infrastructure.13 The relevant risks and barriers for new pipeline investments are ad-dressed in Section 2.3. Section 2.4 then focuses on the various forms of risk mitigation. Besides using contracts to mitigate risks, other forms of risk mitigation are also discussed, such as organisational risk mitigation. Section 2.5 discusses traditional and new business models for gas transport. The chapter ends with a conclusion in Section 2.6. 2.2 The gas value chain and its stakeholders
The process from extraction to delivery of gas can be divided into three components (up-stream, midstream and downstream), and is defined as the gas value chain. The physical flow of gas starts upstream, including exploration and production as well as the treatment
12 The content of this chapter is based largely on and has been verified by interviews with experts from companies involved in energy markets and from research organisations in the field.
13 For the purposes of this study, gas infrastructure is used as a collective term regarding to all transport facilities: pipeline networks, LNG terminals (and storage). Gas transport (or transmission) takes place through pipelines or by means of LNG tankers. A gas corridor is defined as an important pipeline or LNG route from the point of extraction to the end consumer, consisting of a serie of pipelines or LNG facilities.

16
of the gas to prepare it for transport. After the long-distance gas transport (midstream), the gas physically arrives in the downstream distribution network.14 The gas is transported by pipeline, or by tanker as LNG.15 In the latter scenario, gas is made liquid for transport by sea, and regasified at the receiving terminal for connection to the pipeline network. Gas storage serves as a buffer for seasonal and other fluctuations in demand. The downstream component includes the marketing to bring the gas to the customers. In Figure 2.1, the upper chain represents the physical gas flow. Figure 2.1 Gas value chain: physical flow and payment flow of natural gas
Upstream producerPipeline Company
Shipper Buyers
Payment flow in the value chain, and relevant stakeholders
Physical flow of gas
Gas Exploration, Production & Treatment (upstream)
Gas Transportation & Storage (midstream)
Source: own analysis, based on expert interviews.
Other stakeholders (e.g., governments and financiers)
Gas Sales & Distribution (downstream)
The payment flow and the relevant stakeholders are shown in the lower chain of Fi-gure 2.1. The retailer pays for the gas to the wholesale marketer, which is generally also the shipper. The shipper is required to pay transport charges to the transmission company as well as a fee to the upstream producer. In Europe, the netback pricing mechanism is a common method for pricing gas (see Box 2.1 and Chapter 8). Each component in the gas value chain fulfils a specific role in that chain, involving va-rious stakeholders, including governmental actors. Developing the chain and putting it into operation is a complex matter involving major investments and risks. Moreover, as soon as a pipeline has been constructed, the costs are sunk [Correljé et al. 2009]. Capital expenditures account for the largest part of the total costs, while operating expenditures are relatively minor (see also Box 2.2 in Section 2.4). Figure 2.3 shows the direct stake-
14 Gas transport over long distances uses high-pressure pipelines. Gas transport by distribution networks generally uses low-pressure lines.
15 Unlike gas, it is relatively simple to market oil, since more options are available for transport: it is generally trans-ported by pipeline, by train or by boat. Moreover, the oil market is more liquid and has a more global nature.

17
holders, including governments and financiers, that are involved in the creation and up-keep of the gas value chain.16
Upstream operators Traditionally, the international energy firms and national energy firms occupy a dominant position in the area of gas exploration and production. The interest of upstream operators
16 Owing to the nature of this study, the emphasis is on gas transport, while the other components are only addressed insofar as they are relevant to gas transport.
Box 2.1 Netback pricing mechanism In the method of netback pricing, a commodity is chosen that serves as the substitute for natural gas. The most common example is the netback link to the price of fuel oil (for households). Other units of reference are coal or collections of various types of energy, which may include elements of gas-to-gas competition (price determined by supply and demand). The price for the end user, therefore, is calculated using a substitute. The sum remaining for the upstream producer is the price for the end user minus the government's share and the costs of marketing, distribution, storage, treatment, trans-port, production and the use of capital, and the residual netback. Figure 2.2 A simplified overview of gas pricing and margin distribution
Pipeline operator(s) Upstream player(s) Shipper(s) Buyer(s)
• Netback (residual income)
• (Fixed) return on capital • End consumer price related to energy substitute
Government
• Tax/royalties
• Earnings from PSA
• CIT
Government(s)
• Transit fees
• Royalties
• CIT
Government(s)
• CIT
Government(s)
• VAT
• Excise duty
• Dividend
• Interest/principal to banks
Sponsor(s) Sponsor(s)
• Dividend
• Interest/principal to banks
Sponsor(s)
• Dividend
$$$$
• Margin fee
Capital intensiveCapital intensive Trading
Distribution
11%
Transmission
6% Commodity
31%
Energy tax
19%
VAT19%
Swing
14%
* Natural gas price for Dutch domestic consumer in 2006Note: the relative width of the arrows does not correspond to real-life proportions. Source: own analysis, based on expert interviews; Energiened [2006].
End-user gas price*
Figure 2.2 shows a common, though simplistic, breakdown of the price at end-user level. The major-ity of the revenue is intended for governments (in the form of taxes, participations and royalties in both producer and consumer countries) and the upstream operators. For more details on how prices are determined, see Chapter 8.

18
is to achieve the highest possible returns. They may benefit from directly or indirectly influencing other parts of the value chain in order to mitigate their risks and maximise their profits (see also Risk Mitigation in Section 2.4). Governments issue licences to pro-duce and explore new gas fields. Depending on government policy, the government may participate directly or indirectly in production and exploration, for example as a share-holder in a (national) gas firm (see also Chapter 3). Governments also collect income taxes and other forms of taxation and royalties on upstream activities. Figure 2.3 Players along the gas value chain
Upstream Midstream Downstream
Upstream player(s)
Shipper(s)
Pipeline operator(s)
Off taker(s) End-consumer(s)
Government(s) and politician(s)
Regulator(s)
Investment bank(s) and financier(s)
Sponsor(s) and investor(s)
Source: own analysis, based on expert interviews. Shippers The shipper fulfils a possible17 role between the producer and the buyer of gas, bearing the risk of ownership only during transport. It generally does not buy and sell the gas at its own risk, and as such is not exposed to price and volume risks (see also Section 2.3). The shipper procures transport capacity from the firm managing the pipeline. In exchange, it must offer payment and the guarantee of a certain capacity purchase, preferably for the long term, for example using ship-or-pay contracts. Shareholders and governments in the gas infrastructure The primary role of pipeline shareholders lies in constructing the transport facilities such as pipelines, compression facilities and possibly storage. During the operational phase, this shareholder is responsible for outsourcing the transport capacity, managing the supplies of
17 In a bilateral business model, the producer and/or the gas importer are responsible for the gas transport. This ex-cludes any intermediate role from being carried out by a shipper (see also Section 2.5).

19
gas from the entry to exit points of the transport system and for ensuring that the pipeline facilities are maintained in a good state. The transmission company does not own the gas during transport. The transmission company may sell the available capacity to one or more independent shippers, one or more gas producers or one or more gas importers. The shareholder (whether private, public or a combination of the two) in a pipeline or a series of pipelines (constituting a gas corridor) may be an independent transmission system ope-rator (TSO). Another possibility is that vertically integrated firms act as shareholders in the gas infrastructure, both gas producers and importers. Recent proposals by the European Commission (EC) are based on a further unbundling of activities. This will shift the re-sponsibility for constructing and managing pipelines to TSOs or Independent Transmis-sion Operators (ITOs).18 Intergovernmental and national authorities define the investment framework. They also issue licences to construct gas infrastructure and are responsible for related new laws and directives regarding such matters as regulation. The construction of international gas cor-ridors may cross multiple jurisdictions, for example within and beyond the EU. Providers of debt capital (such as banks) also play an important role in financing the pipeline. Figure 2.4 Relevant stakeholders in the gas infrastructure
Field I
Field II
Field III
Upstream players
• National energy firms
• International energy firms
• Government (including politicians and regulations)
• Sponsors
Gas corridors shippers
• National energy firms
• International energy firms
• Independent traders
• Utilities (from downstream)
• Government (including politicians and regulation)
• Sponsors
Gas corridors owners
• Pipeline companies
• National energy firms
• International energy firms
• Utilities (from downstream)
• Government (including politicians and regulation)
• Sponsors
Players in other gas pipelines
• Pipeline owners
• Utilities
• National energy firms
• International energy firms
• Government (including politicians and regulation)
• Sponsors
Alternative gas supply
• Gas corridors
• LNG
Industry
Power
Retail
Sector
LNG
(Storage)Transit country 1 Transit country 2
Gas production fields
Upstream Midstream Downstream Midstream
Source: own analysis, based on expert interviews. Downstream stakeholders The downstream transmission capacity (i.e., between exit points from the gas corridors and the end users) is less important for purposes of this study. The three principal sectors
18 For a discussion of the liberalisation of the European gas market, see for example Haase [2009] and Chapters 3 and 7.

20
– representing the end users – are industry, retail and the power sector. Some countries in continental Europe unbundled transmission and trade. In the United Kingdom and the US independent TSOs have been operating in the downstream transport system for some time. Most other operators are the traditional national utilities. The downstream distribu-tion networks are governed by a high degree of regulation. Figure 2.4 sets out a schematic overview of the operators in the gas infrastructure (including multiple-country transporta-tion) as an integral part of the gas value chain.
2.3 Risks related to gas infrastructure investments
Naturally, there are risks involved in any gas infrastructure investment. These risks stem from, first, investment barriers and, second, future uncertainty (e.g., about market devel-opment). Not all risks are equally probable, nor is their impact equally great. Investment barriers are caused by, among other things, the entry barriers for investing, and by the level of capital intensity of gas infrastructure projects, where the investments have a long recovery period and are largely sunk. One of the reasons for these entry barriers is that managing pipelines, particularly international ones, is often the domain of firms in which the government holds a majority interest. In some cases, the transmission company is operating as a subsidiary of a vertically integrated gas firm. For example, the Russian gas network has been turned into a monopoly under the unified gas transport system (UGTS), which is a wholly owned subsidiary of Gazprom. Figure 2.5 Risks related to gas infrastructure investments
Description
• Risks that are inherent to the project itself, or in the market in which it operates
• Risks that are related to external economic effects not directly related to the project
• Risks that are related to the effects of government action/policy or political force
majeure events such as civil disturbance and war
Risk Risk components
• Commercial viability• Completion risks• Environmental risks• Operating risks• Revenue (market) risks• Input supply risks• Force majeure risks• Contract mismatch • Sponsor support
• Inflation risks• Interest rate risks• Exchange rate risks
• Investment risks (currency convertibility and transfer, expropriation of the project by state, political force majeure);
• Change of law risks (new legislation/regulation that affect the viability of the project);
• Quasi-political risks (breach of contract and court decisions, sub sovereign risks, creeping expropriation)
Translated to main risks for gas infrastructure investments
• Market risks (e.g., volume and price)
• Finance risks (project related)
• Transport risks (e.g., design, construction, operation, maintenance, and interruption)
• All risks are applicable
• Regulation and policy risks (i.e. those related to the energy mix)
• Political force majeure and uncertainties about (geo)political relations, especially when the project involves cross-border financing or investment
Commercial (project) risks
Political (country) risks
Macro economic risks
Source: own analysis, adapted from Yescombe [2002]; Razavi [1996]; ECN [2007]; expert interviews.

21
In terms of uncertainty, Yescombe [2002] distinguishes between (1) commercial, (2) ma-croeconomic and (3) political risks for project financing. Figure 2.5 shows descriptions of and a breakdown into the various risk components. The most relevant risks for invest-ments in the gas infrastructure under the different components are also mentioned in the rightmost column. These risks together affect the projected cash flows and thus the in-vestment decisions [EC 2007; ECN 2007]. Risks can be organised by probability and impact using a risk profile analysis. Using these distinctions, risks can be organised into four general categories (see Figure 2.6). If the probability is low and the impact also low, the risk is irrelevant. If the probability increases but the impact remains low, the risk becomes more relevant yet still manageable through organisation. If the impact is high but the probability is low, the risk is contingent. The final risk category is critical, since the risk has both a high probability and a high impact. The category in which above-mentioned risks can be divided depends on the gas infra-structure project and the area operating in. In general, the dominant risk in connection with investment in the gas infrastructure, which can as such be qualified as critical, is the so-called market risk, falling into the category of commercial risks. Specifically in terms of investing in the gas infrastructure, this is the risk that the capacity is not used or con-tracted sufficiently and/or that the internal tariffs are too low to achieve a certain profit-ability [Correljé et al. 2009]. In Chapter 4, the relevant risks are integrated into the con-ceptual toolbox for evaluating gas infrastructure investments.
Figure 2.6 Risk profile analysis
Low High
Impact
High
Low
Likelihood
Source: expert interviews.
Contingent Critical
Irrelevant Organisational

22
2.4 Common types of risk mitigation in the gas infrastructure business
The market characteristics of the gas market, such as imperfect competition, call for a degree of risk management in order to achieve the long-term investments [ECN 2007]. The risks are divided among the parties in the value chain, in exchange for part of the value in the system. Depending on creditworthiness and on the available options for fi-nancing and guarantees, the risk may be absorbed by one specific operator.19 Any risks that cannot be absorbed are ideally transferred to other parties and/or mitigated. Firms have three options for mitigating risks using a particular organisational structure: vertical inte-gration, horizontal integration and mitigation through organisational risk diversification. A firm can also mitigate its risks using contracts and financial instruments.20 Contractual and organisational risk mitigation are the methods most commonly used for gas infrastruc-ture investments and are the focus of this section. 2.4.1 Contractual risk mitigation
Contracts divide risks between parties and determine mutual rights, guarantees and obliga-tions. Traditionally, market risks are covered by long-term capacity and volume con-tracts.21 A typical long-term contract, a take-or-pay contract using the netback pricing mechanism (generally 15-20 years), places the price risk with the upstream operator, by linking the gas price to the prices of the substitute energy carriers, and places the volume risk with the buyer. Take-or-pay contracts oblige the buyer to purchase a certain mini-mum volume of gas. Before the liberalisation of the gas market, such contracts also in-cluded a destination clause, prohibiting the buyer from reselling the gas to third parties. The destination clause offers gas-exporting countries a greater degree of flexibility, as they can ‘unilaterally’ determine their sales markets and the accompanying prices. In the EU, inclusion of destination clauses was prohibited since the gas liberalisation, meaning that buyers of gas can sell some or all of the volume purchased on the secondary market [Davis 1984; ECN 2007]. Partly as a result of liberalisation, the transport and commodity markets have become more and more distinct from one another. In such a situation, the shipper concludes a ship-or-pay contract with the transmission company, independently from long-term take-or-pay contracts.22 If the planned capacity is covered sufficiently by ship-or-pay contracts,
19 Credit ratings can be used as a measure of a party's creditworthiness.
20 To make financial risk mitigation possible, a firm needs access to liquid commodities or financial markets, gas ex-changes and forward and futures markets. However, in Europe those markets are not sufficiently developed at present, although more and more financial tools are being introduced into the market, for example for facilitating arbitrage between the various markets (e.g. Henry Hub vis-à-vis National Balancing Point, NBP, and Title Transfer Facility, TTF) [ECN 2007]. In case risk mitigation can not be (sufficiently) achieved, the firm may have to demand a higher rate of return to reflect the higher risk.
21 See Box 2.2 at the end of this sub-section for the relationship between gas contracts and pipeline capacity. For a comprehensive overview of gas sales and gas transportation agreements, see Roberts [2004], for example.
22 The Transit & Tariff agreements between the shipper and the transmission company specify a number of conditions. An Annual Contract Quantity (ACQ) is determined, with a minimum and a maximum ship-or-pay quantity. Owing

23
whether or not the tariffs are regulated, the pipeline investor's cash flows can be guaran-teed in order to cover the costs of investment and the return and to attract financiers [Roberts 2004]. Figure 2.7 shows a standard structure for gas contracts, under which the transmission company operates with legal independence. It also shows the role of the au-thorities, regulation and other parties. Figure 2.7 Standard structure (take-or-pay) of a gas contract system
Turnkey construction
contract
Operate & maintain contract
Gas Supply Agreement (Take-or-Pay)
* This task could be performed by the transmission company
** If the transmission company is an joint ventureSource: expert interviews.
Equity Investors**
Lenders
Transmission company
Operator*Government authority
Insurance underwriter
Contractor*
Shipper
Upstream player
Buyer
Construction and supply companies
Gas Sales & Purchase Agreement (Take-or-Pay)
Gas Transportation & Tariff Agreement (Ship-or-Pay)
Construction and supply contracts
Loan & Security Arrangements
Joint Venture Agreements
(1) Permits, approvals; (2) Central, Provincial government support; (3) regulation (via regulatory authority)
Security over investor’s interests
Guarantee Agreement
EXAMPLE
In addition, the procedures have changed since the liberalisation in the EU and elsewhere. Important changes include:
• More and more often, potential investors in the gas infrastructure are organising ‘open seasons’, during which prospective users can make long-term reservations of capacity [Correljé et al. 2009]. Open seasons are generally not used with gas cor-ridors outside the jurisdiction of liberalised gas markets (to liberalised countries).23
• The transport and distribution network is partly regulated, based on the principle of non-discrimination, in order to ensure third party access (TPA).24 These meas-
to day-to-day and seasonal fluctuations in gas flows, this results in an upward and downward standard deviation of generally 10 percent of the ACQ. The shipper pays the transmission company a proportional tariff that is at least the same as the ship-or-pay quantity.
23 An example of an exception to that rule, however, is the prospective Nabucco pipeline through Turkey (see Case study 2 in Chapter 11).
24 New tariffs are determined every 3-5 years [Correljé et al. 2009]. In the regulated regime, costs are covered by (1) regulated cost-plus tariffs; (2) regulated transmission tariffs (price cap regulation); and (3) regulated revenue from transmission operations (revenue cap regulation) [ECN 2007].

24
ures are intended to make it simpler for new operators to enter the market, in-creasing competition on a non-discriminatory basis and allowing the secondary market to develop [Lecarpentier 2006; De Jong 2007]. In addition, they make it possible for pipeline investors to make the best possible use of economies of scale. Open seasons promote the non-discriminatory treatment of prospective users.
• The price formulas in supply contracts have become more flexible (such as gas hub prices alongside the link to oil prices), and as a rule more periodic renegotia-tion clauses are specified. Use-it-or-lose-it conditions serve to prevent the con-tracted capacity from not being used [ECN 2007; Correljé et al. 2009].
Figure 2.9 Standard guarantee structure of gas contracts
Upstream producer
Shipper (e.g. sales company)
Transmission company
reseller
Supply Guarantee
Source: expert interviews.
Ship-or-Pay obligation
Take-or-Pay obligation
Supply commitment
Take-or-Pay obligation
EPC Contractor
Lender
(1) Completion guarantee
(2) Dispute and Arbitration
(3) Liquidated damages, Penalties
loan guarantee
Some of the mentioned guarantees are captured in the contracts (e.g. warranties, indemnities), some guarantees are agreed in separate guarantee documents, and some guarantees may be implicit (i.e. not formally agreed).
Guarantee structure of gas transmission
EXAMPLE
Next, Figure 2.9 shows common obligations and guarantees of the respective parties. The upstream producer agrees to supply the contracted gas; this is balanced by the buyer's take-or-pay obligation. The buyer is also obliged to provide a guarantee to support its credit-worthiness. In the ship-or-pay contracts, the shipper agrees to pay for a certain minimum capacity, regardless of whether or not it uses that capacity. The shipper guarantees that minimum capacity by way of a business or government guarantee, a letter of credit or a security deposit.

25
Box 2.2 Managing the ramp-up period of pipeline capacity and cost realisation With investments in the gas infrastructure, the realisation of costs is not the same as the use of that investment (i.e. the return). The owner of gas infrastructure and the producer/shipper have various options for strategically managing the difference. As a rule, the build-up in the increase of the gas sales is phased (during a ramp-up period), owing largely to a layered build-up of the demand (see lower section of Figure 2.8, shown an example in gas through-put per supply region and/or field). This increases the possibility that shippers will be willing to purchase capacity from the transmission company in phases. The capital expenditures (CAPEX), conversely, are realised during the first few years, sometimes followed after some years by additional CAPEX for additional compression. The operating expenditures (OPEX) cover the costs of running the compressor and pipeline facilities for operational use (see upper section of Figure 2.8 and Chapter 4). The uncontracted capacity at the beginning of the pipeline's operational phase has a downward impact on the expected cash flows, endangering pipeline projects to sometimes being cancelled. If the ramp-up period is strategically planned and coordinated, the pipeline can be used sooner. Four options are available in this connection. First, the transmission company can build up its capacity in phases, by laying two or more consecutive pipelines alongside one another or putting compressor stations into operation in phases. An example of this scenario is Nord Stream, in which two pipelines are being constructed in separate phases alongside each other. Figure 2.8 Cost realisation and ramp-up period of pipeline capacity
Region 1
Region 2
Region 3
Region X
0 1 2 3 4 5 6 7 8 9 10 11 12 13 14 15 t = x
0 1 2 3 4 5 6 7 8 9 10 11 12 13 14 15 t = x
CAPEX Pipeline
CAPEX Compressor
OPEX Pipeline
OPEX Compressor
Capital cost of a gas pipeline
Gas pipeline through-put profile
bcm
Source: own analysis, based on expert interviews.
EXAMPLE
0
2 0 0
4 0 0
6 0 0
8 0 0
1 . 0 0 0
1 . 2 0 0
1 . 4 0 0
1 . 6 0 0$
(continued)

26
Using this guarantee structure, the only risks to which the transmission company is ex-posed concern design, construction, operation, maintenance and interruption. If it so desires, the transmission company may engage its subcontractors to construct or deliver parts of the pipeline. The subcontractors provide the transmission company with guaran-tees for their activities. The operating activities may also be outsourced to third parties. The firm uses equity and debt to finance the gas infrastructure (possibly provided by ex-ternal investors participating in a joint venture). In some cases, the (debt) capital is pro-vided and/or guaranteed by a government authority. A central or regional government body is also responsible for the licence, regulation and other permits for constructing gas infrastructure. It may also offer the transmission company assistance (political or other-wise). Finally, insurances are offered to the transmission company. 2.4.2 Organisational risk mitigation
Besides the long-term contracts, certain choices in terms of the organisation structure are regarded as a strategy of risk mitigation on the gas market. This subsection deals with some common organisation structures, namely vertical and horizontal integration and risk mitigation through organisational risk diversification, and the conditions and market cir-cumstances under which a particular organisational structure is preferable. Vertical integration includes forward and backward integration, both of which are used in practice. Complete (or incomplete) vertical integration generally occurs in the gas market as a result of the highly capital-intensive nature in parts of the value chain, the need for economies of scale, the need to secure economic rents and the possibility of influencing market conditions through control over the chain [Davis 1984]. Gas-exporting countries are increasingly taking stakes in downstream markets, while midstream operators from Europe try to gain access to the upstream market, both for the purpose of realising greater competitive power.
Box 2.2 Managing the ramp-up period of pipeline capacity and cost realisation (continued) Second, if the producer/shipper assumes the ramp-up risk from the transmission company, it canshorten the ramp-up period ahead of time by exercising its influence to accelerate the growth of the sales market. Forward integration – for example making a greenfield investment in a gas-fired power station – can be used to reinforce this strategy. Third, the producer/shipper can shorten the ramp-up period by coordinating gas fields. Finally, the producer/shipper can assume the risk by purchasing capacity and considering any overcapacity to be a strategic option (see Chapter 4). The choice of a particular organisation structure in which the pipeline and producer/shipper func-tions are integrated will affect the perception of the ramp-up period, the creation of possibilities and the way of dealing with risks. Exercising control over the gas value chain may increase the options available. This aspect is discussed at greater length in the following chapters.

27
However, in a liberalised gas market, stakeholders have a limited number of options for mitigating their commercial risks through vertical integration, following the implementa-tion of the EU directives, the aims of which include unbundling.25 In non-liberalised mar-kets, which include many gas-exporting countries, vertical integration is still a common strategy, owing to economies of scale, among other factors [ECN 2007]. Such a strategy is only favourable if vertical integration is necessary in order to protect or create value, re-quiring the firm's competitive position to improve significantly [Stuckey and White 1993; Thompson and Strickland 2001]. Stuckey and White [1993] identify four situations in which vertical integration might be a good strategy:
1) in the case of a high-risk and unreliable market; 2) if firms in some parts of the value chain possess more market power compared
with firms in other parts of the chain; 3) if vertical integration results in market power by creating entry barriers or price
discrimination; 4) if the market is still relatively underdeveloped, forcing a firm to integrate verti-
cally in order to develop the market, or if the market is deteriorating. The current characteristics of the gas market correspond largely to these points. Producing countries are facing increased uncertainty about the use of gas in the energy mix, owing to developments in technology, economy and/or policy in connection with sustainable energy sources, or the ‘security of demand dilemma’. For consuming countries, the uncertainty concerns the question of whether sufficient gas will be available, based on economic and/or political and geopolitical considerations, known as the ‘security of supply di-lemma’. Vertical integration may also result in the creation of barriers to entry, although regulating policies try to break some of those barriers [CIEP 2010]. From the perspective of vertically-integrated firms and traders, investments in transport capacity might have an optional value owing to the ability to sell more gas in the future, if the firm so wishes (in part because on the commodity market costs are relatively ‘minor’ compared with possible opportunity losses on the commodity market). In financial-economic theory, this type of infrastructure investment is regarded as a platform of strategic growth options (see chap-ters 3, 4 and 11). Moreover, the degree of vertical integration and concentration differs across the various phases of development. The phases of development on and between regional and sub-regional gas markets also differ greatly. According to De Jong [1989], vertical integration occurs primarily during the embryonic and mature market phases. Vertical differentiation appears to be more frequent in bull markets and less common in bear markets. In embry-
25 The purpose of unbundling of transmission and trade activities (and the ownership thereof) is to prevent strategic behaviour on the part of incumbents and to promote competition. An integrated company has no incentive to realise interconnections between submarkets or to share capacity with its competitors, since such actions may have a negative impact on the trade in the commodity. Vertical integration is still possible under legal unbundling, albeit in a limited manner [ECN 2007].
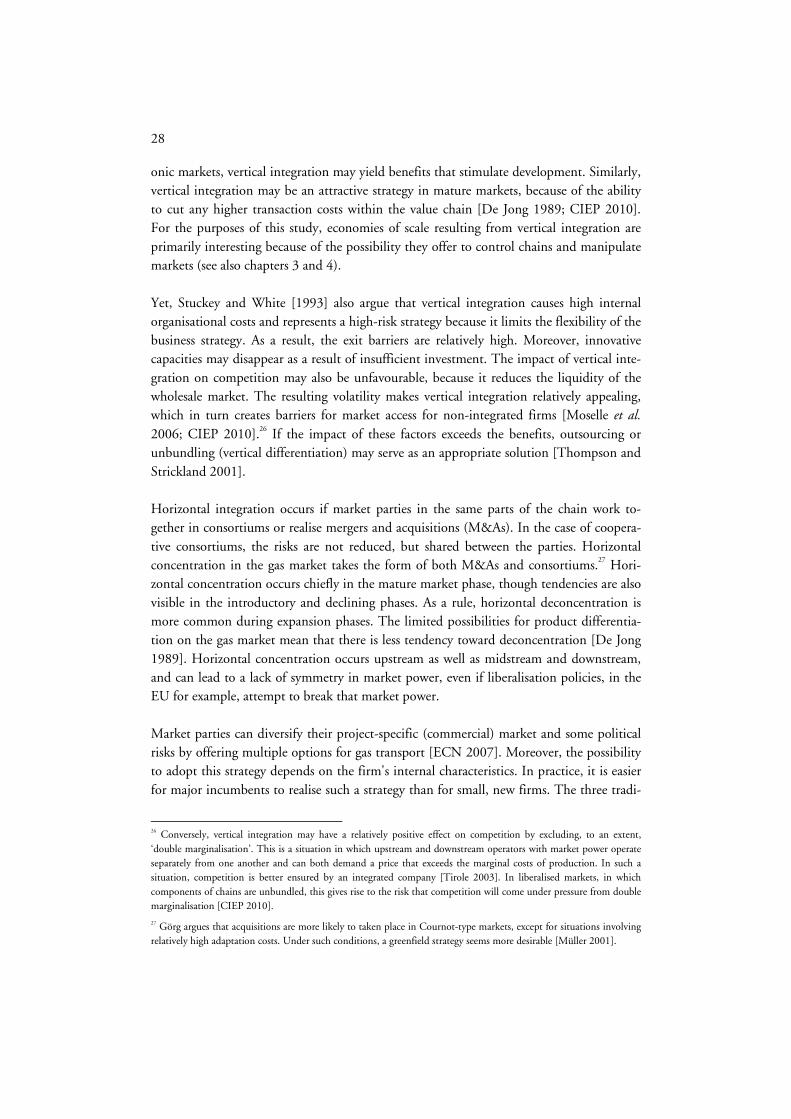
28
onic markets, vertical integration may yield benefits that stimulate development. Similarly, vertical integration may be an attractive strategy in mature markets, because of the ability to cut any higher transaction costs within the value chain [De Jong 1989; CIEP 2010]. For the purposes of this study, economies of scale resulting from vertical integration are primarily interesting because of the possibility they offer to control chains and manipulate markets (see also chapters 3 and 4). Yet, Stuckey and White [1993] also argue that vertical integration causes high internal organisational costs and represents a high-risk strategy because it limits the flexibility of the business strategy. As a result, the exit barriers are relatively high. Moreover, innovative capacities may disappear as a result of insufficient investment. The impact of vertical inte-gration on competition may also be unfavourable, because it reduces the liquidity of the wholesale market. The resulting volatility makes vertical integration relatively appealing, which in turn creates barriers for market access for non-integrated firms [Moselle et al. 2006; CIEP 2010].26 If the impact of these factors exceeds the benefits, outsourcing or unbundling (vertical differentiation) may serve as an appropriate solution [Thompson and Strickland 2001]. Horizontal integration occurs if market parties in the same parts of the chain work to-gether in consortiums or realise mergers and acquisitions (M&As). In the case of coopera-tive consortiums, the risks are not reduced, but shared between the parties. Horizontal concentration in the gas market takes the form of both M&As and consortiums.27 Hori-zontal concentration occurs chiefly in the mature market phase, though tendencies are also visible in the introductory and declining phases. As a rule, horizontal deconcentration is more common during expansion phases. The limited possibilities for product differentia-tion on the gas market mean that there is less tendency toward deconcentration [De Jong 1989]. Horizontal concentration occurs upstream as well as midstream and downstream, and can lead to a lack of symmetry in market power, even if liberalisation policies, in the EU for example, attempt to break that market power. Market parties can diversify their project-specific (commercial) market and some political risks by offering multiple options for gas transport [ECN 2007]. Moreover, the possibility to adopt this strategy depends on the firm's internal characteristics. In practice, it is easier for major incumbents to realise such a strategy than for small, new firms. The three tradi-
26 Conversely, vertical integration may have a relatively positive effect on competition by excluding, to an extent, ‘double marginalisation’. This is a situation in which upstream and downstream operators with market power operate separately from one another and can both demand a price that exceeds the marginal costs of production. In such a situation, competition is better ensured by an integrated company [Tirole 2003]. In liberalised markets, in which components of chains are unbundled, this gives rise to the risk that competition will come under pressure from double marginalisation [CIEP 2010].
27 Görg argues that acquisitions are more likely to taken place in Cournot-type markets, except for situations involving relatively high adaptation costs. Under such conditions, a greenfield strategy seems more desirable [Müller 2001].

29
tional gas suppliers outside the EU use this strategy for their pipeline (and LNG) invest-ments, among other purposes. Russia has been using this strategy with Europe since the 1990s (see also Part II). Integrated firms have other options for risk mitigation. In addition, from the perspective of integrated firms, investments in infrastructure are a tool to reinforce their core activities (on the commodity market). For non-integrated firms, conversely, those investments are the core activity, and need to yield commercial returns. Depending on the ownership structure, the required rate of return of a transmission company may be greater than those of integrated firms.
2.5 Gas infrastructure: old and new business models
One result of liberalisation, also given the increased distances between production and consumption, technology, other forms of risk mitigation and intra- and interregional arbi-trage possibilities, is that the business models for pipeline and LNG infrastructures have changed since the 1990s. Traditionally, the buyer and producer have been the primary parties involved in realising the gas infrastructure. As a result of liberalisation and other factors, third parties, such as independent shippers, are involved more and more often in gas infrastructure. At the same time, the increased distances between production and con-sumption often imply that transit countries are involved. Before this section addresses the traditional and new models of gas infrastructure at greater length, a brief description is given of the time horizons for gas infrastructures, with particular focus on the process of development and construction. 2.5.1 Time horizon of gas infrastructure
Investments in the gas infrastructure can be made for existing gas infrastructure (brown-fields) or for new infrastructure (greenfields).28 Before governments and firms conduct official negotiations, a feasibility study is carried out, based on economic and technical issues. The governments of the parties involved then draw up a letter of intent.29 Next, the representatives of the gas firms conduct the contract negotiations in order to compile a memorandum of understanding (MoU).30 Eventually, the MoU may lead to a final in-vestment decision (FID). In the heads of agreements, as they are called, the gas firms in-volved agree on certain matters, and also agree to negotiate about the elements on which they have not yet reached consensus. Finally, the contract is drawn up. In this final phase of the negotiations, the tariffs and other (mostly minor) points of negotiation are specified (see also Figure 2.10).
28 Investments in existing pipelines may pertain to either of two purposes: the upkeep of the infrastructure or the expansion of the existing infrastructure.
29 This is a letter of approximately fifteen lines, in which the heads of state of the countries involved express their intention to conclude a contract in the future for the construction of new gas infrastructure.
30 A MoU is sometimes called a framework agreement or an agreement in principle.

30
Figure 2.10 Time horizon of gas pipeline infrastructure
• Depending on level of risks (for example market, supply and transit risk)
• Intergovernmental agreements (LoI and MoU)
• Business agreements on sales, transportation, (on/offshore transit)
• Licenses, permits, finance agreement, sponsor support agreement, guarantees
Development phase Construction phase Operation phase
(contractual life)
• Long-term ToPGas sales/SoP Gas transport Agreements 20-25 years
• Depending on length and complexity (e.g. offshore/ onshore pipeline)
Technical life
• Technical life of a gas pipeline is on average 50 year (depending on quality and maintenance)
Factors/ description
10-15 year
20-25 years
3-5 year 50 yearTime (average)
Option for new operation phase
Source: own analysis, based on expert interviews.
SIMPLIFIED
In terms of pipeline infrastructure specifically, ‘transit’ across the territory of third parties occurs if the two countries (or jurisdictions) involved are not directly connected. The in-terests of the transit countries in between must be guaranteed in terms of such factors as (regulated) transit fees and royalties. Transit agreements are concluded at the level of the governments, and are generally supported by business agreements. A solution, to a degree, for limiting the transit negotiations lies in offshore gas pipelines. Underwater pipelines make it possible to save on transport costs (e.g. royalties and transport and transit tariffs) and reduce the direct influence of local gas firms and governments. However, the countries adjacent to the water through which the pipeline is conducted influence the issuance of environmental permits and other licences.31 As Figure 2.10 shows, the development phase of a pipeline generally takes 10-15 years. Once a decision has been made to build the pipeline, it takes approximately 3-5 years before the pipeline infrastructure is operational. Depending on quality and maintenance, the technical life of the pipeline will be around 50 years.
31 If the pipeline crosses a country's Exclusive Economic Zone (EEZ), that country will have to issue a licence. The EEZ is a zone that extends to 200 nautical miles beyond a state's coast. Within that zone, the country in question has several rights, such as the right to exploration of any natural resources present, the fishing rights and the right to conduct scientific research. A country that imposes an EEZ is responsible for managing that area's nature and envi-ronment. Arrangements on this issue were laid down in the UN Treaty of 1982 (UNCLOS). Similarly, countries that might be adversely affected by cross-border environmental problems resulting from the construction of the pipeline can also influence the process by way of environmental requirements, using the Environmental Impact Assessment (EIA) procedure. This consultation procedure applies not only to transit countries whose EEZ the pipeline crosses.
31
Depending on the business model, the negotiations for the realisation of LNG projects are generally governed by the same procedures, though the advantage is that direct transit through third-party countries is generally not relevant. However, maritime straights such as the Suez Canal and the Strait of Malacca mean that transit risks remain for some routes, such as the route from Qatar to Europe by way of the Suez Canal and other waters. 2.5.2 Old and new business models for gas pipeline investments
32
As described above, new models for gas infrastructure have been developed during the course of the development of the regional gas markets. In terms of the development of the business models for pipeline infrastructures, a distinction can be made between bilateral and multilateral: without transit through third-party countries and including transit coun-tries, respectively. In addition to this, the appearance of independent shippers alongside producers and ‘end consumers’ has also changed the business models. Bilateral business model The scenario in which a relatively small number of stakeholders is involved can be ap-proximated using a bilateral model. In that model there is one gas producer (or one gas importer), that also manages the network, contracts the gas out to retail firms or sells it directly to the end user. The financing for the infrastructure is based on the gas contract. The risk of debt repayment is generally determined using the creditworthiness of the im-porting firms and the accredited reserves and/or creditworthiness of the supplier of the gas [Barrett 2007]. Most older gas corridors to Europe were created along the lines of this model [ECN 2007]. A recent example of the bilateral model is the Greenstream, which connects Libya directly with its buyers in Italy. Multilateral business model If transit is involved, it becomes more complex to realise a pipeline. Transit countries can influence the operation of the pipeline, sometimes as single or joint shareholders. The political risks attached to transit through third-party countries can be mitigated using bilateral governmental agreements, combined with business contracts for transit fees and royalties. The first Algerian pipelines to Italy and Spain, and the Soyuz-Transgas and Ya-mal-Europe pipelines are examples of this model. Following the collapse of the Soviet Union and its loss of control over the Soviet republics and Council for Mutual Economic Assistance (CMEA), the transit agreements were revised, and transit became more complex [Barrett 2007].33 Bilateral shipper business model Two submodels can be used to show the involvement of a shipper. First, there is the model in which a single shipper contracts all the capacity using ship-or-pay contracts and as such
32 This sub-section is based largely on Barrett [2007].
33 Chapter 6 and Chapter 12 discuss the increased Russian transit risks at greater length.

32
links one or more gas suppliers to one or more buyers. In this model, financing the pipe-line requires that the majority of the capacity be sold to the shipper. As a result, it is no longer a real concern for the pipeline owner whether the pipeline is actually filled. Use-it-or-lose-it rules can be used to prevent shippers from abusing their market power. In the past, the pipeline system from Norway to northwestern Europe was an example of the bilateral shipper model.34 Lately, it seems as if Nord Stream pipeline will also adopt this model [Barrett 2007; Correljé et al. 2009]. In the second submodel, the multi-shippers model, the various producers and marketers can procure transport services from multiple shippers, creating greater competition and flexibility among the producers for the various markets. The United Kingdom (UK) Inter-connector and the Balgzand-Bacton Line (BBL), among others, follow this model. The involvement of independent shippers and infrastructure companies leads to higher busi-ness risks, which contracts may serve to reduce [Barrett 2007]. Multiplicity business model The most complex business model, the multiplicity business model, is characterised by open access and competition at all points of the gas infrastructure. Multiple shippers can purchase capacity in some or all parts of the gas pipeline. Various gas suppliers, aggregators and end users have access to the shippers' services. To date, this model has not been put into practice, though the proposal for the Nabucco pipeline matches it most closely [Bar-rett 2007]. In the multiplicity model, the gas infrastructure is financed primarily using multiple long-term ship-or-pay contracts, combined with government or intergovernmen-tal agreements for transit. This model is more competitive and is often initiated by new-comers on the market or by shippers. These projects, which are generally midstream-driven, are more difficult to realise. Political involvement may help with the troublesome financial and other aspects of realisation [ECN 2007; Barrett 2007]. 2.5.3 Old and new business models for LNG terminal investments
As far as LNG infrastructure is concerned, the different LNG business models correspond to the pipeline business models described above. The rationale of vertical integration and economies of scale, interregional price differences (i.e., arbitrage opportunities), the open-ing of the US market, high energy prices and the seller’s market in this decade until the autumn of 2008 have combined to create a second generation of business models for LNG. This type diverges significantly from the traditional LNG business model of long-term contracts. These new LNG business models could have a spill-over effect on the business models of pipeline projects (and vice versa).
34 Norwegian gas exports were organised through the state-run monopoly on gas sales, the Gas Negotiating Committee (GFU). Since that system was abolished, Norwegian gas export has followed the multishipper model.

33
The first traditional type of LNG regasification terminals corresponded to the bilateral model, in which the producer and the buyer conclude long-term contracts. The transmis-sion project is integrated, and no project financing is needed. The buyer bears the costs of regasification. Gaz de France and Distrigaz of Belgium built their first generation of ter-minals in this fashion, with Société Nationale pour le Transport et la Commercialasation des Hydrocarbures (Sonatrach) of Algeria as their supplier. Under pressure of regulation, third-party access and official tariffs are being demanded more and more often. For the most recent type of LNG regasification terminals, the project is initiated by inde-pendent operators, while producers and/or buyers contract capacity for the long- and the short term. The Gas Access To Europe (GATE) terminal in the Port of Rotterdam, a partnership between Nederlandse Gasunie and Vopak, is an example of the latter type of LNG terminal [Barrett 2007; De Jong et al. 2010]. Specifically, the second-generation type is driven by gas producers to gain access to the market. Self-contracting also occurs on the European pipeline gas markets, and is therefore an interesting topic to address in this subsection. This new business model includes [De Jong et al. 2010; CIEP 2008; IEA 2008]:
1) Producers reserving part of their liquefaction capacity for short-term deals. 2) Producers and mid-streamers contracting their own production (i.e., self-
contracting): Upstream stakeholders purchase planned liquefaction output, and in turn market it themselves, either through capacity and/or equity acquisition at re-gasification terminals downstream in consuming countries or through direct sales to interested buyers. Various pockets of liquefaction output are thus allocated to different markets either by a consortium or by a single player, achieving supply diversity and optimal revenues through the attainment of regasification assets downstream.35
3) The emergence of LNG aggregators buying LNG on a long-term basis and selling it in a mixed portfolio (though few firms have actually ventured on with this business model). Aggregators, as they are known, make sales commitments to LNG receiving terminals in LNG consuming countries. Often, long-term sup-plies are bought by an aggregator and then sold on a short-term basis on different markets, as described above.
35 Firms with regasification capacities or sales commitments in multiple consuming regions also make free-on-board off-take commitments to fill those capacities or to sell (or ‘divert’) to higher-paying markets in a more flexible fashion than previously seen. This strategy may be pursued by LNG producers already established on the market with assured cash flows from earlier investments, or by new LNG players, to the extent that they have a sufficient cash flow from supplies committed under long-term contracts. An example of self-contracting by producers is the Qatar/ExxonMobil development of two 7.8 mtpa trains. Pipeline suppliers to the European market, notably those from Russia, Norway and Algeria, also appear to add “flexible supplies”, not committed to their markets by means of long-term contracts, in their supply portfolio for Europe, for purposes of direct marketing and sales on the wholesale spot market [De Jong et al. 2010; CIEP 2008]. An example is Nord Stream, where Gazprom Marketing and Trading has already contracted pipeline capacity (see also Chapter 12).

34
The new business models have enabled LNG (and pipeline gas) to become more flexible, fostering the impression that interregional gas-to-gas competition may decouple this flexi-ble LNG from long-term, take-or-pay, oil-indexed contracts, see also Chapter 8 [Jensen 2004]. At the value chain level, some consequences of self-contracting (and other forms of flexibly marketing LNG) are [De Jong et al. 2010]:
• the need for producers to secure regasification capacity on different markets (or overcapacity in the case of pipeline systems) in order to realise the potential of ar-bitrage. This is also done in order to maintain shipping capacity to ensure that the supplier remains capable of reaching the markets included in its arbitrage portfolio;
• the need for producers to develop the tools and capabilities to sell gas directly on the markets of their choice, without long-term supply contracts for flexible gas.
This business model may lead to chronic surpluses in shipping and regasification, which would result in higher risks and costs for producers (and aggregators). The downside risks of the new business models are both revenue- and volume-related. In case of a buyer’s market, short-term and spot gas prices may well be less desirable than the prices realised under long-term contracts and it may even prove difficult to place LNG on markets which are already well supplied. For these reasons, according to De Jong et al. [2009], self-contracting producers and aggregators often exploit at least one ‘haven’ of last resort for their LNG via the firm’s regasification capacity. In many cases this is situated in the US, which offers the most liquid market, with the greatest capacity to absorb surplus LNG even if the global or US market is oversupplied. Naturally, this assured outlet for LNG comes at a cost, because of its low prices (see also Chapter 8). Whether this business model will evolve and develop further depends on (1) the risk appe-tite of LNG suppliers to continue to exploit their resources on the basis of the new busi-ness models in conditions of lower and/or volatile energy prices; (2) the ability and com-pliance of the markets, particularly the European market operators and to a lesser extent those on Asian markets, to accept and manage the supply risks associated with these busi-ness models; and (3) the willingness of producing and consuming governments to step back from LNG sale and purchases transactions. The economic crisis of 2008/2009 is encouraging gas-exporting firms to go for long-term contracts rather than choosing a busi-ness model of flexible supplies [De Jong et al. 2010].36
36 The share of flexible LNG on the Asian market may be considerably lower than the Atlantic Basin (i.e., the European and US LNG markets), because those markets are based primarily on long-term oil-linked contracts. In the Atlantic Basin, approximately 40 percent of the total trade consisted of ‘flexible’ LNG before the economic downturn in 2008 [De Jong et al. 2010].

35
2.6 Conclusion
This chapter offers an outline of the complexity of gas transport as an element in the gas value chain. The gas value chain has three components: upstream, midstream and down-stream. The producer, the infrastructure company, the shipper and the downstream buyer are the principal actors in the chain. In addition, financiers and governments are other parties that are indispensable for successfully constructing new gas infrastructures. Invest-ments in gas infrastructure are largely characterised by market, financing, transport, mac-roeconomic, policy (including regulation-related), and political and geopolitical risks. Contracts between the various parties, such as pipeline companies and shippers, can serve to better guarantee investments in infrastructure. With traditional long-term take-or-pay contracts, the risks are divided between the various parties in the value chain. Parties can also adjust their organisational structures in order to manage and mitigate their risks. Ver-tical and horizontal integration are commonly used strategies for this. Similarly, project risks can be mitigated by diversification (of gas transport, for example). The liberalisation in the EU has restricted a number of these possibilities in order to promote the operation of market forces. Gas transport becomes more complex as the number of parties that can influence the deci-sions increases. If the transport crosses transit countries, the negotiation process may be-come more difficult. In that process, the industry actors seek the assistance of governments to help the negotiations and to issue investment guarantees. Factors such as liberalisation, arbitrage possibilities on and between regional gas markets, the need to secure economic rents, the necessity of economies of scale and high prices until the autumn of 2008 have forced pipeline gas and LNG providers to develop new business models for gas transport and sales. Besides the business models that include shippers, the self-contracting model, as it is known, offers suppliers flexibility in their methods of selling gas. It is unclear whether that business model will develop further, considering the downside risks (i.e., price ero-sion). If an infrastructure firm operates independently or if the infrastructure is handled as a project, the investment should be profitable in and of itself. The choice of a particular organisation structure will affect the perception of profitability (or capacity utilisation), the creation of possibilities for uncontracted capacity and the way of dealing with risks. Exer-cising control over the gas value chain may increase the options available. This aspect is discussed at greater length in the following chapters in this part.

36

37
Chapter 3 Government-supported business investment strategy
in gas markets:
Institutional and theoretical backgrounds
3.1 Introduction
For energy-producing and -exporting countries, management of the domestic resource base plays a crucial role in earning export revenues.37 These resources can also be used to balance the country’s budget or can be reinvested in other sectors of the economy. It can be argued that such a resource advantage can be translated into long-run relative advan-tages for producer countries. In this manner, the translation into relative advantages should be seen in a world of scarce resources and rising import-dependencies on the part of net-importing and consuming countries (of the particular resource). The revenues from the energy sector play and have played an important role in resurrecting – at least partially – Russia’s economy and other (strategic) sectors during the late 1990s and early 2000s. Yet, these same revenues can also channel the economy into a one-product economic structure, as has been the case in many energy-exporting countries before. For Russia, the question is if and when Russia should further develop and export these resources as a commodity, besides its domestic needs, amongst other socio-economic priorities. In most of the energy-producing and exporting countries, national energy firms act as caretakers of the nation’s sovereign resources, doing so under the auspices of the govern-ment. The government’s interests in the gas market lie in, for example, the presence of economic rents, its primary need in societies, and the inherent complex inter-linkage be-tween the government and market as institutions. When trans-national investments come into play, it attains correspondingly trans-national complexities. In consuming, net-importing countries too, governments claim an important role in their energy sectors as regulators and/or owners of gas (distribution) firms. The strong relationship between the state and market in the gas sector requires an integrated analysis of government-driven and economic determinants. The modern variant of international political economy covers the overarching theoretical background to the relationship between states and market. Gas firms (whether they are government-owned, semi-national or private firms) must also increasingly operate in a dynamically interregional gas market. The interregional gas mar-ket exhibits changing dynamics with respect to market structure, pricing, contract types, economies of scale (in LNG and pipeline gas trade), amongst other factors. The dynamic
37 This and the next chapter aim to provide the major theoretical and analytical tools of the research as such. In doing so, however, the empirical domain of the research cannot – and should not – be ignored. The important developments in this domain will be discussed at great length in Part II (Chapter 5-7) and Part III (Chapter 8-10).

38
market theory of De Jong [1989] encompasses the factors that determine an industry structure as it changes over time along its growth path. The dynamics of the market have an impact on the choice of a firm’s coordination mechanisms. Strategies of the gas firms acting in the export market have to anticipate dynamic market developments. Conversely, gas firms, when large enough, can also influence the structure of the oligopolistic gas mar-ket. Generally speaking, private gas firms have the task for their shareholders of maximising the profits of their equity gas reserve. Conversely, national gas firms have the task to maximise the revenues of a country’s gas reserves. In addition, most of the government-controlled energy firms have to take into account the government’s wider socio-economic policy goals [Van der Linde 1999]. Depending on the resource-base and the income needs of the go-vernment (also determined by absorption capacity), the emphasis or sequencing of certain investments in the value chain is influenced by these wider goals. Therefore, the dynamics of national and private gas firms differs and, in this respect, they have other investment incentives, being more or less pro-active. However in the long run, for the purpose of this research, it is assumed that a national gas firm aims to maximise the value of gas available for its export markets. In order to capture the full long-run value creation in an uncertain and competitive environment where national gas firms operate in, valuation tools from corporate finance theory should be integrated with the ideas and principles of strategic management theory and industrial organisation [Smit and Trigeorgis 2004]. The theoretical background of the political economy of states and market will be discussed in Section 3.2, with a focus on the actors’ relative advantages. The role of governments, both in producing and consuming countries is the central focal point in Section 3.3. Sec-tion 3.4 provides an overview of dynamic market theory and its different coordination principles in dynamic gas markets. The merit order concept will be introduced in Section 3.5 in order to set the scene for forming a business investment strategy. Section 3.6 ad-dresses the linkages between strategic investment planning and corporate finance, in light of the concept of value creation. The ultimate aim is to pave the way towards the a real-option game model to be explained in Chapter 4 to ascertain the value of investments in an uncertain market and competitive environment. This will be done in Section 3.7. The chapter ends with a conclusion. 3.2 The political economy of states and markets: Relative advantages
In the post-Cold War era, the international system has changed and is still in transition; see further Chapter 8, and Chapter 2 and 3 in Boon von Ochssée [2010]. In the changing international system absolute military advantages, as it was during the Cold War, have become comparatively less important than relative advantages [Strange 1994]. Relative advantage is primarily about long-run economic power. Especially in a globalising world economy, such advantage may translate into political influence, in particular through structural dependency and the ability to set the rules of engagement to one’s advantage

39
[Strange 1994; Grieco 1988]. This difference between absolute and relative advantages is similar to the difference between chess and “go”, one that Henry Kissinger made in 2004: “Chess has only two outcomes: draw and checkmate. The objective of the game is absolute advantage – that is to say, its outcome is total victory or defeat – and the battle is con-ducted head-on, in the centre of the board. The aim of Go is relative advantage; the game is played all over the board, and the objective is to increase one’s options and reduce those of the adversary. The goal is less victory than persistent strategic objectives.” [Newsweek 2004]. Within this changing international political system, Russia as a state wishes and could attain the status of great power, through developing a relative advantage. This sec-tion argues that Russia’s oil and gas wealth, and in particularly gas, offers a means to de-velop such a relative advantage. This section serves thus as a theoretical background in the transition from government-to-government relations to firm-level relations. Through the acknowledgement of economic factors and non-governmental actors neo-liberalism assumes that because of interdependence, states also maintain relative advantages [Keohane and Nye 1977]. The modern variant of international political economy (IPE)38 argues that it is essential to synthesise international relations and (political) economy in order to explain complex issues in the world, such as in the gas market [Strange 1989]. In contrast, neo-realists and realists alike make a distinction between ‘high’ and ‘low’ politics; ‘politics’ and ‘economy’; and state, and respectively market.39 Gilpin [1987] reasons that “the parallel existence and mutual interaction of ‘state’ and ‘market’ in the modern world create ‘political economy’; without both state and market there could be no political eco-nomy […] Although neither world can ever exist in a pure form, the relative influence of the state or market changes over time and in different circumstances” [Gilpin 1987, p. 8]. The thinking of Ricardo and Hecksher-Ohlin in international economics shows how comparative advantage plays an important role in international economic relations, based on international differences of factor endowments [Nielsen et al. 1995]. Two centuries later Porter [1990] argued on the basis of an extensive case by case study of economically well-developed countries that a combination of factors is important in the development of a country’s economy: availability and skill of labour, resources, etc. Countries are endowed with certain resources, in terms of labour, capital, resources and they employ them to develop competitive advantages in the international economic arena. Strange [1988] ar-gues that a nation’s power consists of four dimensions in a framework of structural power:
38 International political economy (IPE) is concerned with the political determinants of international economic rela-tions. The mainstream of IPE built further on the Liberal vision on the International Relations (IR). The core prob-lem, which is studied by IPE, is the mismatch between two organisation principles: territorial organised state systems and de-territorial organised market systems [Voitti and Kauppi 1999].
39 According to (neo-)realists and liberals, ‘high’ politics refer to matters of security, such as the strategic interests of states, in particular security and the survival of the state. They have tended to draw a distinction between such high political concerns and those dealing with socioeconomic or welfare issues of lesser interest to statesmen and so-called ‘low’ politics [Voitti and Kauppi 1999; Keohane and Nye Jr, 1977; Nye Jr. 2004].
40
security, knowledge, finance and production. “Structural power is the power to shape and determine the structures of the global political economy, within other states, their political institutions, their economic enterprises and (not least) their scientists and other profes-sional people have to operate” [Strange 1988, pp. 24-25].40 Increases or decreases in terms of the ability to wield power in each of these four different dimensions, thus influences a state’s relative power position vis-à-vis others. Non-governmental actors can play impor-tant roles too, but they do not have monopoly over force like governments do [Burchill et al. 2005]. A country’s knowledge and production can lead to financial wealth, which can be used to further boost production, develop the intellectual capital base and develop the means to defend itself. Up to this point, relative advantage has been described as an economic advantage or, in the case of Strange [1988], as a combination of different power dimensions. Of increasing importance is the role of access to energy (and gas), where energy-consuming countries are becoming more dependent on ever more scarce and steadily more concentrated natural resources.41 In essence, countries with great endowments in energy resources have a natural absolute trade advantage [Smith 1993]. Given the concentration of natural gas in only a handful of countries (which also holds for many other natural resources), the balance of power is skewed in favour of those countries with excess resources for valuable exports or firms that have the right to exploit them. States rich in natural resources upon which oth-ers depend for economic development have a strong relative advantage. This advantage can subsequently be translated into other dimensions of power in the long run [Strange 1988]. In the specific case of natural gas, this resource is gaining in importance, particularly in a post-Kyoto world where reducing carbon emissions is becoming a pressing issue. Gas is a cleaner-burning fuel than oil and coal and the potential contribution of gas as a partly sustainable energy source mix lends it more strategic significance [IEA 2009]. The applica-tions of gas are becoming more numerous: not just power generation, heating and coo-king, but also gas-based industries, pharmaceuticals and high value liquids. The reserves for gas also exceed those of oil in terms of reserves-to-production ratio (see Figure 3.1), offering long-term potential in terms of future trade while the industry is still in a rela-tively early stage of development. For Russia as a state, its gas wealth also offers a means to develop relative advantages with respect to other states. After the dissolution of Soviet Union, as will be argued in Chapter 6, Russia as a state became weak. In Porter [1990] or in Strange [1988] terms, in that period of time, Russia had limited recourses to export in order to develop a relative advantage or structural power
40 Next to structural power, Strange [1988] distinguishes relational power, which is “the power of A to get B to do something they would not otherwise do” [Strange 1988, pp. 24-25]. The most direct form of relational power is a military action, where a state is forced to act according to the other.
41 Before, as will be discussed in Section 3.3.1, Western countries used international energy firms to perform this function.

41
vis-à-vis other countries, except from its oil and gas reserves. By means of its energy reve-nues, especially oil, Russia tried to increase its income of hard currency and to repay its debts. However, due to low oil prices in the 1990s, the financial and production power from its oil (and gas) revenues was limited. Therefore, Russia could not broaden its oil and gas revenues from the production dimension to other structural power dimensions. In addition, due to privatisation of the energy sector the government lost partly its control over the sector’s resources and windfall profits [Åslund 2007]. Although, as will be dis-cussed in Chapter 6, part of the gas sector fell into private possession, the gas sector re-mained reasonably centralised owing to the nature of the industry and the strong political lobby. Figure 3.1 Russian oil and gas reserves and production in 2008
Russian Oil
Oil
(other regions)
World/Russian reserves* World/Russian production* World/Russian R/P*
77%
21%
79%
94% 88%
72 year
22 year
Gas
(other regions)
Russian Gas
79 tmb
1179 tmb
43 tcm
42 year
60 year
9886 tbd
71934 tbd
657 bcm
142 tcm 2492 bcm
12%
• Russia has almost a quarter of global proven gas reserves and only 6 percent of oil reserves
• Russia accounts for roughly a quarter of global gas production and for oil 12 percent
• Russian R/P ratio for gas is 72 year, for oil 22 year
• In the long-run, gas will be more important for Russia than oil
* Conventional reserves at end 2008. Conventional production over 2008.Source: IEA [2009] for gas production; BP [2009] for other data.
6%
23%
Since the end of Putin’s first term however, trade and current account surpluses increased sharply and have kept on rising ever since, as a result of the sharp 1998 devaluation, among others (see also Chapter 6). The steep rise of the oil and gas prices from 2004 on-wards, which provided (foreign) revenues to the state budget, freed Russia of any need for funds from the International Monetary Fund (IMF), the Worldbank or the European Bank for Reconstruction and Development (EBRD). The increase in oil (and gas) reve-nues lessened Russia’s debt repayment and also enabled it to repay its debt to the Paris Club [Legvold 2007]. In addition, Putin created a stabilisation fund, with the aim to ma-nage the income streams from its energy revenues. It made Russia more financially inde-pendent as far as state finances are concerned and provides Russia with greater interna-tional structural financial power. However, Russia remained largely dependent on its for-eign oil and gas income, see Chapter 10.

42
The increasing fuel revenues from exports are seen by Russia as a way to regain and carve out for Russia a respected position in the international political system. In this manner, Russia’s leadership saw it as merely natural for Russia to make use of its natural competi-tive advantages [Lavrov 2007]. Putin firmly believed that if used effectively, mineral and energy resources could provide the basis for Russia’s entry into the world economy and could offer the means to modernise Russia’s military and industrial complex and provide social stability and well-being for the Russian population [Balzer 2005]. The process of modernisation of Russia’s economy and political system is still ongoing [Åslund 2007; Trenin 2008b]. In the modernisation of Russia’s economy, Medvedev said the economy should move its focus away from energy and heavy industry towards information techno-logy, telecommunications and space [Financial Times 2009]. However, it is expected that Russia’s oil and gas resources and revenues will continue to play an important role in this respect. For Russia, gas (in terms of production, transport, export earnings and the possi-ble development of gas-based industries) is central to its national interest or relative advan-tage, particularly inasmuch as they favour and secure the means for long-run economic development. Economic development and security based on gas ultimately translates into other structural powers, such as financial wealth and intellectual capital and secures Rus-sia’s long-run economic power. Depending on the developments in the oil versus gas mar-ket (i.e., the relation between gas-to-gas prices and oil-indicated gas prices, see Chapter 8), it can be argued that in the long run gas is better positioned as a relative advantage for Russia than oil. Besides above-mentioned advantages of natural gas as an energy source, Russia is holder of the largest conventional gas reserves in the world. It holds roughly one quarter of the world’s total, 43.3 tcm [BP 2009]. It is also geographically well positioned to export these reserves. It produced 657 billion cubic meter (bcm) in 2008, which is more than 20 per-cent of the world’s total [IEA 2009]. In terms of oil versus gas reserves, Russia’s relative position differs: while it has almost a quarter of global proven gas reserves, it has only 6 percent of the world’s conventional oil reserves [BP 2009]. In terms of production levels, Russia accounts for roughly 12 percent of global oil production, producing 9.9 mb/d in 2008 and is an observer to the Organisation of the Petroleum Exporting Countries (OPEC) [BP 2009].42 Additionally, in the oil market the countries of the OPEC are and will continue to be dominant exporters, where Russia has no real place as a price setter.43 While in gas terms, Russia may perhaps be able to develop its own dominance. Given Russia’s future decline in oil production in the coming decades, oil can thus be seen as Russia’s current cash cow,
42 Gas condensates also make an important contribution to Russia’s oil and gas production [Gazprom 2009].
43 The largest (government-controlled) Russian oil company, Rosneft, expects roughly the same level of output by 2020 compared to 2008. The arm’s length cooperation with OPEC and speculation premiums enables Russia to free ride on rising oil prices and to cooperate with OPEC, in the case of declining oil prices [Åslund 2007].

43
whereas gas could have major market growth potential. In this regard, see Figure 3.1, which provides a statistical overview of Russian oil and gas reserves and production. Moreover, gas provides Russia room to develop as an important energy hub in a rapidly developing international multi-functional gas industry. The production of gas and the institutionalisation of its use, both for domestic purposes and foreign, have always re-mained largely in government’s hands under a centralised decision-making structure (see Chapter 6 and 10). This optimises the production and financial dimension of Strange’s structural powers. Furthermore, most of Russia’s gas trade is conducted by pipeline and long-term take-or-pay contracts, which brings on long-term political and business relation-ships, due to the rigid nature of natural gas pipelines. Pipeline gas flows, upon which other countries depend, can enhance influence, perhaps more in economic rather than (geo)political terms.44 The structural dependency primarily of European and CIS states on Russia’s gas can be translated into the development of structural power for Russia. Con-versely, Russia is just as dependent on the income stream provided by exports to mainly European countries as Europe is on its gas flows (see Chapter 10) [Hill 2004].45 The lack of control exercised during the politico-economic crisis of the 1990s (see also Chapter 6) led Putin to restore some measure of order through government-centred re-forms, returning Russian society to a state of relative stability, see also Section 8.2 [Åslund 2007]. In order to coordinate the strategic role of gas as a relative advantage, among oth-ers, a strong role for the state appears necessary in the eyes at least of many of Russia’s political elite. The role of the Russian government and governments in the gas sector in general will be discussed in the next section. 3.3 The role of governments in the gas sector: producing and consuming
countries
In this section a more descriptive approach is taken in order to analyse the role of the go-vernment in the gas sector in both producing and consuming countries. Energy policy in Europe, as elsewhere, is typically a national concern. The policy measures and instruments are usually aimed toward a reliable, affordable and clean supply of energy.46 The substan-tive interpretation of the policy can differ from country to country due to the tension between the three goals and the domestically available natural resources [De Jong et al.
44 Yet, pipeline trade, and particularly the development of new pipeline corridors, has always had, to a certain degree, a (geo)political dimension.
45 The use of gas as a tool of coercion (e.g., shut-offs) as part of their pursuit of geopolitical goals, has its risks. If and when dependence is highly asymmetric, as in the case of small, isolated gas consuming countries, geopolitical goals could be more easily achieved. This is especially the case when such geopolitical goals are of a short-term and localised nature.
46 Often translated as price, security of supply and environment. These goals are accepted internationally and have been applied to the energy policies of Western countries for decades.

44
2005].47 Traditionally, there is a large difference in political interests between producing and consuming countries. Due to security of supply issues, gas-importing countries gene-rally have a common interest in coordinating policy. Gas producing countries have an interest in avoiding a common policy in order to retain their freedom with respect to ex-port policy [Matláry 1997]. In this context, gas-producing and net-exporting countries are distinguished from gas-consuming and net-importing countries in that they have net outflows of gas volumes. Gas-exporting countries may also be important consuming countries, which influences their gas-export strategy. Consumer countries are defined as countries, which may also be producers but require net inflows or imports to satisfy domestic gas demand. Today, the gas producing and exporting countries mostly include countries that are not member of the Organisation for Economic Co-operation and Development (OECD), such as Russia, Algeria, Qatar, Nigeria, etc. The consumer countries include mostly the OECD econo-mies, but also new recent newcomers as gas importers, such as China and India, for exam-ple. As argued in Chapter 2, competition within the natural gas market is imperfect, because the suppliers involved must be firms large enough to deal with a number of gas industry challenges. Such challenges include the long-lead times between the discovery of gas re-sources and their production and the capital intensity of the projects involved. Complexi-ties arise in terms of the physical transportation and distribution of gas, the involvement of large sunk costs of infrastructural investments and their irreversibility and the necessity, in many cases, of long-term commitments. Due to these complexities, the natural gas sector is therefore exposed to potential market failures. Market failures fall into three categories, namely the problems of asymmetric information, problems of externalities and problems of monopoly power. They compel governments in both consuming and producing coun-tries to intervene [Armstrong et al. 1980]. Solutions to market failures traditionally range from vertical integration (see Chapter 2), corrective taxes, regulations, aggregate demand management, price controls, subsidies, planning and government ownership [Shleifer and Vishny 1998]. Moreover, the socio-economic impact of gas on national economies, the environment and security of supply are too diverse and crucially interdependent (as an essential public inter-est) to be left to the market alone, both in producing as well as consuming countries. As far as the gas value chain is concerned, its governance is often not limited to a one single
47 For a closer study of energy policy instruments and of energy policy in general, see among others: CIEP [2004], De Jong et al. [2005], and Helm [2002]. For a closer study of the national reforms and backgrounds of the European gas market, see among others: Arentsen en Künneke [2003], Helm [2003], and Finon and Midttun [2004]. Specifically for the energy markets in the CMEA-6, see among others: Van der Linde [1991].

45
jurisdiction.48 Therefore, the role of governments is defining in the gas sector, both in a market-based economic system and a mixed or government-orientated system [CIEP 2008; De Jong et al. 2010]. Governments also play an important role in shaping the general investment climate. Go-vernments are also responsible for macroeconomic, monetary and fiscal stability, as well as tax and royalty collection from energy and gas production, both in producing and con-suming countries. As owners of subsurface resources (with the exception of some coun-tries, such as the US), governments are furthermore in charge of issuing permits to explore, produce, transport and distribute gas. Moreover, both in producing and consuming coun-tries, governments regulate markets and are often either shareholders or full owners of gas (transport) firms. The level of stability and predictability of all these aspects is important to realise the capital-intense investments in the gas value chain (see also Chapter 4) [CIEP 2008; De Jong et al. 2010]. Despite expectations during the 1990s and early 2000s for continued market-oriented globalisation, a host of events and factors have shown that globalisation is challenged by politico-strategic calculations of governments [Van der Linde 2005].49 At the heart of all government intervention in the energy sector is the distribution of risks and benefits through the energy resource value chain in the short- and long-term. The government policies are often termed as security of supply and security of demand [De Jong et al. 2010]. 3.3.1 Consuming country perspective
Traditionally, national and international energy firms from mainly Western countries were responsible for the energy security of net-consuming countries in the OECD. They con-trolled most of the world’s oil and gas-producing assets unto the late 1960s [Yergin 1991]. In addition, international energy firms have their headquarters in consuming countries and are backed by their host-governments in doing business. They also enjoyed control of the technology and know-how necessary to produce and export their oil and gas [Yergin 1991]. Only during and after the great nationalisations via national energy firms of the late 1960s and early 1970s, the international energy firms were compelled to abandon their dominant upstream stakes [Van der Linde 1999]. Since then, international energy firms have tried to maintain an edge in terms of access to capital, technological and organisa-tional know-how and other skills, as well as access to downstream markets for both oil and gas. Mid-streamers and international energy firms create joint ventures with national ener-gy firms, offering market access in exchange for upstream access. This does, however, oc-
48 Political economy theories of government, furthermore, assert that interest groups in society have a stake in the outcome of the regulatory process, and actively seek to influence the formation of public policy [Ordeshook 1990].
49 These events and factors include, amongst others, the US invasion of Iraq in March 2003, general instability in the Middle East, the rise of China and its influence in energy-producing and exporting countries, and the assertiveness of oil and gas-producing countries in pursuing greater control of their energy sectors as well as macro-economic shifts (see also Chapter 2, 3 and 11 in Boon von Ochssée [2010]) [Van der Linde 2005].
46
cur on less favourable terms for the international energy firms than was the case even as recently during the 1990s [Van der Linde 2005]. The rationality of government versus private ownership in a number of energy markets came under scrutiny during the early 1980s, when many governments had to acknowledge their failure as efficient producers and had to limit the weaknesses of their monitoring capabilities [Shleifer and Vishny 1998]. From the 1980s onwards, governments started to limit their role to market regulator and tax and royalty collector [De Jong et al. 2010]. With the collapse of the Soviet Union and the transition of centrally planned economies towards market economies during the 1990s, the privatisation of national energy firms received a major boost (see also Chapter 6) [Stiglitz 1995]. The energy sector in general, both in net-importing and exporting countries, was supposed to participate in an overall process of globalisation, driven primarily by and largely for the benefit of OECD coun-tries and their multinational firms, including the international energy firms. Such at least, was the thinking during the 1980s and much of the 1990s, encouraged by low oil prices and a buyer’s market for oil and gas [CIEP 2004]. During the 1980s and 1990s, the processes of liberalisation and integration of markets started in the US and the UK. Member states within the EU followed suit throughout the 1990s, which occurred by means of directives [Matláry 1997].50 These processes were de-signed to lower the barriers to entry, enhancing competition and integrating national mar-kets into a single European gas market, which would be beneficial for a low price and security of supply [De Jong et al. 2010; Dutch Energy Council 2005]. Today, gas (and energy) importing countries are increasing control over the energy sector again, after the extended period of liberalisation and privatisation. The explanation for the more interven-tionist energy policies can be found in the increasing tightness, until the autumn of 2008, of the oil and gas markets [De Jong et al. 2010]. The governments of consumer countries, especially in industrialised societies, re-emphasise their public policy interests, because the market would not automatically serve these. As a result, they implemented policies to boost energy saving and efficiency, subsidise new energy sources, and diversifying their dependence on imported energy [Van der Linde 1999; CIEP 2008]. In addition, national governments in consuming countries are regula-ting markets within the constraints of their public interests, breaking up the value chain through (legal) ownership unbundling. At the same time, these governments tax the en-ergy sector to capture economic rents on the ‘consumption side’ of the value chain. Some governments and international institutions, both on a country and regional level, assist
50 The main background of the liberalisation and deregulation in the EU was the dissatisfaction regarding its deteriorat-ing economic competitiveness in comparison to the US and Japan. In addition, the political integration process in Europe was slow moving. A more efficient market and exploiting economies of scale would strengthen the competitive advantage [Boxhoorn and Jansen 2002]. For a historical overview of the EU energy policy (and its member states), see: Lefeber and Van der Linde [1987], Stern [1998], De Jong [2007], De Jong et al. [2005].
47
their ‘national energy champions’ within their industries to realise gas (and energy) im-ports through political support, by influencing international institutions and creating guarantees, either for economic or political reasons [CIEP 2008; Finon and Locatelli 2002]. 3.3.2 Producing country perspective
Of contrary to consuming countries, energy-producing and exporting countries have, throughout the 1990s and increasingly during the 2000s shown a reluctance to relinquish their national interests in the energy sectors. Governments in producing countries began reasserting control of their energy sectors in a bid to strengthen their grip on the economic rents generated by the profitable exploitation of their natural resources. In order to strengthen government’s grip on economic rents, the government can either develop a tax and royalty system or take a greater stake (majority) ownership of their national energy firms (in various upstream projects) [Olorunfemi 1991; CIEP 2008]. The last trend is visible in a large number of gas exporting countries, both non-OECD and OECD coun-tries [De Jong et al. 2010; CIEP 2008]. Also Russia began a process of restoring majority government control and ownership over the Russian gas (and energy) sector, as is ex-plained above and will be addressed in depth in Chapter 10. Being in control of the vast bulk of the world’s gas resources (some 75 percent), these national energy firms have yet to shape the world’s dynamic interregional gas market. The national energy firms have a national agenda, which often largely concurs with the na-tional agenda and interests of any energy-producing country, which may include the wider socio-economic (and sometimes political-social) interests (see above). Thus in respect to national energy firms, investments in gas must compete with wider investments in eco-nomy. Conversely, the international energy firms simply seek to maximise profits and often have a shorter, more commercially oriented time horizon when it comes to imple-menting projects in the energy sector. Increasingly today, the national gas firms also ex-plore new business models of vertical integration in order to capture additional rents along the value chain [Van der Linde 1999; CIEP 2008]. As such, governments in energy-exporting countries have a principal-agent relationship with their national energy firms as an external agent. Governments in gas-exporting countries delegate to their national gas firms the task of maximising the value of a country’s gas reserves for their export markets. Operating as the government’s agent, the national energy firm determines or biases entry, especially through the administration of Production Sharing Agreements (PSAs) or through serving as a contractor with private international energy firms [Van der Linde 1999]. Contracts between the government as principal and the national energy firm as agent may involve problems of asymmetric information for both the government and the national energy firm.51 It is uncertain whether the trend of so-called resource nationalism
51 These problems of asymmetric information may pertain to risk assessment (i.e., adverse selection) and moral hazard vis-à-vis the government as far as excessive risk-taking is concerned when making investments [Stiglitz 1989; Akerlof 1970].

48
will persist into the future, even though its rise seemed inexorable throughout the early to late 2000s [Breumer and Johnston 2009]. Once the governments in producing countries had secured their income flows, they awarded national firms by offering them a leading role in the economy [Van der Linde, 1999]. The income flows obtained from exporting raw materials (such as gas, oil, and minerals) serve a producing country’s national interest. In general, the energy-producing countries’ patterns of investment reflected the following objectives: the expansion of growth of the non-energy economy, the modernisation and diversification of the economy and reduced dependence on energy as well as the consolidation of national control over the oil, gas and other industrial sectors [Gelb and Associates 1988]. Revenues can also be accrued and saved using a variety of means, such as government-owned investment funds, i.e. Sovereign Wealth Funds (SWFs). Such funds may include mechanisms where revenues earned are taken out of the economy to avoid inflationary effects and stored either in funds for reinvestment in the economy or as foreign reserves. In addition, a large number of gas exporting countries (cross-)subsidise gas prices domestically. Some of them also subsidise their exports, see for example the Soviet subsidies to CMEA countries (see Chap-ter 5). The policy towards developing a gas industry and a gas export strategy differs per country. Each country’s export strategy depends, for example, on its path-dependency and natural heritage, such as its geographical location, etc., and the policy priorities in place. This may include domestic needs, such as the development of oil exports and the perceived need to develop a gas-based industry, or merely domestic gas consumption as opposed to exports (which may constrain room for exports). Other factors may include political and geo-political constraints. For oil and gas producing states there exists the risk of becoming overly dependent on revenues from energy exports. This is one of the risks inherent to the so-called resource curse. The effects of these revenues on its economy depend in part on the absorption ca-pacity of the economy in question and the management of the surplus incomes. The inef-ficient use of its resources and their revenues can easily give way to the comparatively unfavourable aspects of a resource-based economy, i.e., having no other sources of eco-nomic development than export revenues from energy [Ross 1999].52 On the one hand,
52 If and when a country becomes a so-called petro-state, it basically entails that a country cannot translate its sudden increase in export revenues into state welfare and an effective public system [Ross 1999]. According to Ross [1999] a state can be classified as an energy state on a political policy and institution bases and by economical arguments. The energy state based on political policy can be explained by: (1) cognitive (e.g., earning economic rent results in short-sightedness, for example high-level corruption and policy instability); (2) societal (e.g., increasing non-state actors who favour growth-impeding policies); (3) statist variables (e.g., rentier-state, tax-collecting on energy sector). Another characteristic of an energy state can be derived from the level of political institutions based on rule of law. Economical arguments for energy states can be found in the phenomena of Dutch disease. This could occur when a sudden in-

49
the threat of the resource curse may provide the incentive to leave a country’s resources (for example gas) under the surface, hence postponing exports. On the other hand, counter-cyclical policy, such as by using government-owned investment funds, could help alleviate the risks of the resource curse. Also the political coherence (among elites) to ma-nage this wealth in the short and long run is important in order to avoid instability due to internal distribution issues. The process of government involvement in the gas sector, both in producing and consum-ing countries, is very dynamic and uncertain and may change in the coming decades, due to changing circumstances in the increasingly interregional gas market. The theory of dynamic markets developed by De Jong [1989] offers a theoretical framework for analy-sing how gas-exporting and importing countries and their respective agents are compelled market behaviour over time, given dynamic market circumstances. 3.4 Interregional gas market dynamics
The current expansion, evolution and globalisation of the interregional gas market, as will described in Chapter 8, is characterised by a market structure that is naturally oligopolistic. This is the case not only because of the size and location of major reserves, which is impor-tant for the long-run, but also in terms of the capital intensity of the natural gas industry. Only a select number of players are able to compete and develop in this industry. In addi-tion, as has been shown above, national gas firms are increasingly expanding downstream in the value chain through new sales strategies and are diversifying their export portfolios in the process. The degrees of vertical integration and concentration vary depending on the phase of evolution the market in question is in (other parameters that differ over time include: e.g., economic scales and costs) [De Jong 1989]. Other factors influenced by the evolution of the market include the propensity to compete, form joint ventures or collude, all differing in their intensity and likelihood as a function of time and market circum-stances. 3.4.1 Dynamic Market Theory
There is no single model that can capture the totality of all major market changes. The so-called dynamic market theory, developed by De Jong [1989, originally 1972] argues that all these market parameters are constantly shifting in scope and value in a long-term mar-ket cycle. This cycle, pertaining to any given product, is divided into four major phases of development: it starts with an embryonic phase of development, followed by expansion and maturity and finally ends in a decline (see Figure 3.2). The essence of dynamic market theory rests on the relationship between the product life cycle and the paradigm of structure-behaviour-result: Firms behave as a function of the
crease in export energy revenues results in an increase in a country’s exchange rate, which will have an impact on the competitiveness of other export products [Van der Linde 1999; Ross 1999].

50
structure of the market, and to a certain extent (see below), markets are influenced by individual firm behaviour. In other words, the paradigm emphasises that the conditions of supply and demand in a specific industry determines its market structure. This can pertain to various players in the gas market: from consumers to producers, from public to private entities. Each market phase of development has different characteristics and bottlenecks, which compel actors in the market to adapt their strategies to newly emerging market situations. According to De Jong [1989], firms with market power can influence market conditions, the latter also being a function of the different market cycle phases. Particu-larly in markets with strong oligopolistic tendencies such as the gas market, a dynamic market approach is well-suited to analyse how players in such a market setting would in-teract, since they are few. Especially when it comes to the natural gas market, the approach is indeed helpful in qualitatively analysing a market strongly characterised by product homogeneity, binding capacity barriers, high barriers to entry, low price elasticity as well as necessary economies of scale [Van Witteloostuijn et al. 2004]. Figure 3.2 Developments in the gas market: The growth cycle
Market phase/Time
Quantity
Characteristics:• monopolistic or oligopolistic market structure, with investments largely in and competition on capacity • Regional markets with little or no interaction
Characteristics:• Oligopolistic market structure due to imperfect competition, with investments largely in and competition on capacity • More de-concentration and market entry
Characteristics:• An increasing quasi-monopolistic market structure (i.e., further horizontal integration)• Competition largely on price
Characteristics:• Oligopolistic (or monopolistic) inter-regional market structure, with possible capacity overshoot • Competition largely on price• Further possibilities of oligopolistic cooperation
Embryonic Expansion Maturity Decline
Source: based on De Jong [1989].
Ultimately, static models do not capture industry and market dynamics, though they help explain strategic behaviour and the incentives firms may have in cooperating or not. Stra-tegic behaviour in general takes place in dynamic contexts, not static ones. Indeed, struc-tural developments in markets are above all dynamic in nature [De Jong 1989]. Dynamic market theory is a useful qualitative tool for explaining the dynamics of a market as it moves from one phase to another and as the actors in the market shift from one form of behaviour to another. Market conditions change, shift from one of phase of evolution into

51
another as circumstances alter, e.g., in terms of costs, technological know-how, economies of scale, entry into the market by new players or market structure, etc. As such, the oil market was shown to be dynamic, with differing levels of concentration amongst market players having a major impact on the leeway for cooperation, prices, mar-ket liquidity and other market parameters [Van der Linde 1991]. For firms operating in industries such as those involving natural resources, managing the value chain in a dy-namic process is central to their survival and continuity. The interregional or global gas market, as has been the case for the oil market since its very beginning, is characterised by dynamic circumstances, though revolving around different players and more rigid struc-tures than is the case for the oil market. The gas market is, by comparison, in different phase(s) of evolution than the oil market is, and so circumstances are different as well. The difference between the oil and gas markets lies also in the inherent differences between oil as a liquid and natural gas as a gaseous substance and their transportation. The different sequential phases in dynamic market theory need not abruptly end as a new one begins. Instead, they gradually roll over into one another as the market situation and characteristics shift gradually over time. Some factors are more constant than others, but they can change and show different characteristics throughout the evolution of a market. The concept of market development relates to the sequence of different market situations, which may arise in the growth cycle. The forces associated with market developments affect market situations to the effect of metamorphosing each from one form into another. The underlying logic of importance to this discussion (i.e., with respect to natural gas as commodity) is the notion of a dynamic market in which consuming regions become in-creasingly inter-linked as growth and demand rise, together with fluidity (as opposed to rigidity) in a dynamically oligopolistic market (both at regional and global levels). The duration of each phase of market development or evolution is not specific in this regard [De Jong 1989], but in the gas industry one may assume each phase can last as long as several decades.53 Looking at the interregional gas market from a dynamic market vantage point, one can witness it experiencing a maelstrom of evolutionary cycles, in which producer and con-sumer countries are struggling to formulate their strategies, in order to strengthen their positions in an ever-changing market. LNG has made possible the globalisation of the gas market by inter-linking different demand centers and opening up new venues for commer-cial opportunities, while pipelines continue to play a regional role, depending on the con-suming and supplying regions in question. The international gas market is not only in transition but also in expansion with emerging trends such as the increasing – though still rather limited – liquidity of LNG trade and the entry of new regional and intraregional market players, both public and private. Specifically for the European market, the sub-
53 In the oil market, each phase was consistently at about 20 years [Van der Linde 1991].

52
regional markets are also in different phases in terms of the growth cycle. Northwest Europe is more or less a mature market, although the northwest European import market is in expansion due to declining indigenous production. Most of the countries in the other main sub-regional market within Europe, south-southeast Europe, are located in an expan-sion phase (see also Chapter 11). Figure 3.2 provides a typical form of the growth cycle and the changing characteristics, at large, along growth cycle of the gas market. 3.4.2 Coordination mechanism in dynamic markets
An essential feature in De Jong’s [1989] dynamic market approach is the idea that firms are influenced by the structure of the market, compelling them to use different strategies. Throughout the process, firms change, adapt to the new equilibrium and are again affected by new imbalances. The strategies in turn affect their environment; ultimately changing it and the cycle starts over again. The degree of competition (on the scale of monopoly to perfect competition) is directly relevant to the ‘gravity’ of this effect. In the specific case of national gas firms, the convergence and divergence of the strategies of national gas firms and gas strategies at a government-level may lead to tension between the management of national gas firms and decision-makers at a government-level (i.e., principal-agent di-lemma, as mentioned in Section 3.3.2). It is inevitable that a certain point, with the changing nature and direction of gas flows, that the producers need to take into account the impact of all these different supply alloca-tion decisions on different (sub)regional and interregional market structures. With the uncertainties in such a transition, from one phase to the next, firms must adapt to new circumstances. Conversely, strategies of gas firms with strong market power in terms of price and volume can affect market structures. The way in which firm behaviour can be coordinated falls into two basic categories: either firms behave as rivals and compete, or they cooperate, trying to exercise some form of joint control over market processes in the value chain. Following this distinction, De Jong [1989] identifies three coordination prin-ciples, which firms tend to follow throughout the evolution of the market.
a) Control: Mergers and acquisitions According to de Jong [1989], firms can choose to acquire assets further down along the value chain via vertical integration (see also Chapter 2). Gazprom’s ac-quisitions in downstream Europe in the form of storage, stakes in or complete ownership of utilities are prime examples. This form of trying to attain control of assets can materialise independently of whether firms actually compete or coope-rate. Other forms of M&As, except from vertical integration, are horizontal and diagonal integration. In the oil and gas sectors, gas producers and sellers moving into oil production and sales and power generation is one example of diagonal in-tegration. These M&As can help deal with smaller potential competitors in order to neutralise their possible effect on market share. Particularly players with a comparatively small production capacity but also low supply costs (due to their

53
proximity to the market, for example) and thus low economies of scale, are poten-tial M&A targets. On the other hand, smaller players may want security of stable cash flows, resulting in cooperation with a dominant player in the market.
b) Firms behave as rivals: Direct competition Firms can choose for a competitive model or strategy, in which, for example, as they integrate vertically, they set up direct subsidiaries to penetrate the market further and sell directly to end consumers and thus invest in ‘new’ projects or greenfields by establishing a whole new subsidiary organisation. The examples of Gazprom (via Gazprom Marketing and Trading, see Chapter 10) and Sonatrach are cases in point.
c) Joint ventures or collusion Firms can be driven to cooperate by looking for ways to collude and avoid com-petition. This can result in cartels or consortia, which does not include setting up some separate organisation while syndicates, joint ventures and/or common sub-sidiaries or investments do include separate organisations, which can be jointly owned by the firms choosing to cooperate. Shared investments are those made to-gether with rivals whose market-level impact may be very large in terms of pro-duction capacity and may have any level of supply costs and associated economies of scale. Particularly those with large reserves are likely to have economies of scale benefits upstream, but might also need to incur significant transportation costs to bring the gas to the market. Since shared investments are made together with other players, they are not wholly owned, i.e., they are jointly owned, and thus to the extent possible, they serve purposes other than deterrence. According to de Jong [1989], cartels are agreements between producers, which enable them to influence the market to their advantage. Both private and go-vernment-owned firms can participate in forming a cartel. Profit sharing, the ap-plication of sales quota, the exchange of statistical information and a policy on battling non-cartel members can be agreed upon. Limiting competition, monopo-listic pricing, supply restrictions are all goals, which are attributable to cartels [Jacquemain 1987].54
54 The stability of collusion depends on a number of interlocking conditions: concentration, number of sellers (in a collusive organisation), barriers to entry and demand inelasticity. There also exist different definitions of what cartels actually are (tacit versus explicit collusion) and different types of cartels. See Chapter 4 in Boon von Ochssée [2010] for a theoretical background of collusion and stable agreements in relation to the gas market.
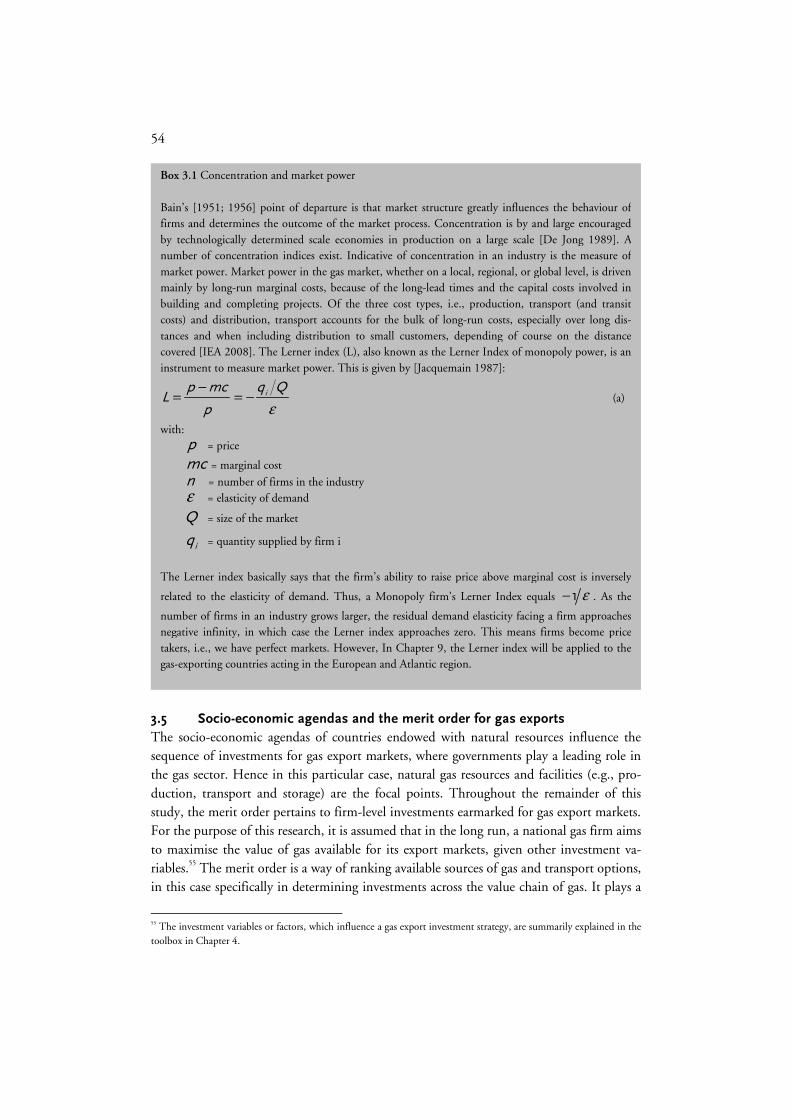
54
3.5 Socio-economic agendas and the merit order for gas exports
The socio-economic agendas of countries endowed with natural resources influence the sequence of investments for gas export markets, where governments play a leading role in the gas sector. Hence in this particular case, natural gas resources and facilities (e.g., pro-duction, transport and storage) are the focal points. Throughout the remainder of this study, the merit order pertains to firm-level investments earmarked for gas export markets. For the purpose of this research, it is assumed that in the long run, a national gas firm aims to maximise the value of gas available for its export markets, given other investment va-riables.55 The merit order is a way of ranking available sources of gas and transport options, in this case specifically in determining investments across the value chain of gas. It plays a
55 The investment variables or factors, which influence a gas export investment strategy, are summarily explained in the toolbox in Chapter 4.
Box 3.1 Concentration and market power Bain’s [1951; 1956] point of departure is that market structure greatly influences the behaviour of firms and determines the outcome of the market process. Concentration is by and large encouraged by technologically determined scale economies in production on a large scale [De Jong 1989]. A number of concentration indices exist. Indicative of concentration in an industry is the measure of market power. Market power in the gas market, whether on a local, regional, or global level, is driven mainly by long-run marginal costs, because of the long-lead times and the capital costs involved in building and completing projects. Of the three cost types, i.e., production, transport (and transit costs) and distribution, transport accounts for the bulk of long-run costs, especially over long dis-tances and when including distribution to small customers, depending of course on the distance covered [IEA 2008]. The Lerner index (L), also known as the Lerner Index of monopoly power, is an instrument to measure market power. This is given by [Jacquemain 1987]:
ip mc q QL
p ε
−= = − (a)
with: p = price
mc = marginal cost
n = number of firms in the industry ε = elasticity of demand
Q = size of the market
iq = quantity supplied by firm i
The Lerner index basically says that the firm’s ability to raise price above marginal cost is inversely
related to the elasticity of demand. Thus, a Monopoly firm’s Lerner Index equals 1 ε− . As the
number of firms in an industry grows larger, the residual demand elasticity facing a firm approaches negative infinity, in which case the Lerner index approaches zero. This means firms become price takers, i.e., we have perfect markets. However, In Chapter 9, the Lerner index will be applied to the gas-exporting countries acting in the European and Atlantic region.

55
crucial role for investment decisions in gas-producing and exporting countries, and differs per country. The amount of gas available for export is constrained by the socio-economic agenda men-tioned above. The incentives created by government policies may stimulate or dampen the overall gas export potential. The most important socio-economic considerations include:
• Once gas has been extracted from the subsoil, its future potential production is diminished since it is exhaustible. Some policy considerations, such as the small fields policy in the Netherlands, may include leaving some of the gas in the ground for possible future production.
• Long-term conservation policies to satisfy domestic macro-economic policies in order to avoid the negative effects of the resource curse (see Section 3.3.2).
• Decisions regarding the energy mix: e.g., the use of substitute fuels such as nu-clear or coal energy to free up gas volumes for export.
• Caught between the inability to earn as much from natural gas as from crude oil, and low-revenue domestic operations, the potential gas exporter will tend to set aside the resources for future use [Davis 1984]. Thus decisions need to be made regarding alternative gas needs, including oil-lifting56 and the development of gas-based industries.
• Investment of gas revenues outside the gas sector, aimed to meet domestic re-quirements for socioeconomic welfare priorities or to meet budget deficits. The non-commercial activities hindered the firms from sustaining core operations [Myers Jaffe and Soligo 2010].
• Due to political considerations, amongst other factors, cross-subsidies of domestic gas prices and the subsidisation of gas exports to neighbouring countries through reinvested earnings from gas export markets, encourages a proactive gas export strategy.
• Pursuant to the point made above, gas exports, and gas flows in general, can play an important role in achieving political integration amongst countries. This adds to the points made above a political rather than strictly economic dimension.
Preferences resulting from the socio-economic agenda can be expressed through policy measures, such as regulation, openness to foreign investment, taxation, etc. Ultimately, these policy measures influence over time the scope for the sequence of investments for gas exports. By extension, as a government-controlled firm, Gazprom is able to play either a proactive role towards gas exports, or a less proactive one. Given the above, the dynamics of national and private gas firms differs and, in this respect, they have other investment incentives.
56 Oil lifting refers to the process of injecting gas into oil reservoirs to boost oil production.

56
3.6 Theoretical background of business investment behaviour in the gas
market: Strategic planning and value creation57
As has been made clear previously, the energy sector can be of strategic importance to an energy or gas-exporting country, central to its national interests. These include the deve-lopment of the economy, having a fund for future generations, etc. In general, gas export-ing country governments delegate to their national gas firms the task of maximising the value of a country’s gas reserves for their export markets. As mentioned-earlier, this is also the case for Russia. Given this task, new investments should only be made if they add value. In other words, investments should have a return in excess of the opportunity cost of capital, or investments should create or sustain economic rents (see Box 3.2 at the end of this section). On the basis of the previous sections, it can be argued that Gazprom’s investment strategy is potentially driven by a long-term view, in which politico-strategic and economically strategic investments play an important role. In this context, it has to weigh export growth strategies and market structure changes in respect to their competi-tors against conservation policies and domestic requirements. In order to capture the full value creation in an uncertain and competitive environment, the traditional corporate finance valuation approach of investments, which assumes that all operating decisions are set in advance, is insufficient. According to Smit and Trigeorgis [2004], valuation tools from corporate finance theory can be integrated with the ideas and principles of strategic management theory and industrial organisation to value investments under market uncertainty and competition. Such integrated approach can be adequate in assessing long-run competitive advantage and strategic adaptability. The issue of value creation as far as strategic planning is concerned is that it pertains to both internal and external (e.g., position vis-à-vis competitors) factors. From corporate finance theory, one can make a distinction between value from assets in place and from growth opportunities. Generally, assets in place can be valued through a regular (static) discounted cash flow approach, whereas growth opportunities need to be valued via a dynamic approach: the real-option approach (see also Section 3.7.2). Therefore, a combination of strategic plan-ning and corporate finance incorporates not only the static value of measurable cash flows, but also the managerial flexibility value and the strategic value components of investments. This section addresses the linkages between strategic planning and corporate finance, in light of the concept of value creation through investments along the growth cycle. In this respect, firms and governments have to manage a portfolio of cash-generating activities as well as future growth possibilities. The ultimate aim of Sections 3.6 and 3.7 is to pave the way towards the real-option game model in Chapter 4, which is introduced in Section 3.8.
57 Section 3.6 and 3.7 are largely based on Smit and Trigeorgis [2004] and to a lesser extent Smit and Trigeorgis [2001]. For an in-depth analysis on the linkage between corporate finance and strategy, see the first-mentioned refer-ence.

57
Internal factors: resources and capabilities According to the resource-based theory, which is part of strategic management theory, firms should invest in resources or capabilities for pursuing market opportunities in a dynamic environment. That means that these investments should focus on acquiring a distinctive advantage [Wernerfelt 1984; Rumelt 1984]. Resources are firm-specific assets, which are the basic inputs in the production process.58 According to Barney [1986] and Grant [1995], the resources should have three important features so as to add value (see also Box 3.2 for value components of competitive advantages):
1) Resources should be distinctive, scarce and relevant to establish a competitive ad-vantage.
2) Resources should be sustainable and difficult to imitate in order to maintain a competitive advantage.
3) The firm should be able to appropriate the added value or economic rents, which result from the resources.
As an additional insight, capability (or competence) is the capacity of management to make a set of resources perform a given task or activity. The dynamic capabilities approach focuses on competitive advantage in a rapidly changing environment. The value from the capability to adapt is covered in corporate finance by the real-option approach. According to Teece et al. [1997], three main factors shape the firm’s dynamic capabilities and its ability to create value in a changing environment:
1) Managerial and organisational processes. These processes emphasise the role of learning, integration and re-orientation.
2) Strategic positions. The strategic position of a firm is partly determined by its spe-cific asset base. For example, in the gas industry, a firm’s specialised upstream plant or equipment, its technical know-how and/or reputation among importing firms and governments may determine the firm’s position.
3) Paths and path-dependency. In shaping a competence-building strategy, strategy is also path- or history-dependent. The path-dependency not only determines which investment alternatives are open to the firm today, but can also constrain the firm’s future choices to create a competitive advantage. It emphasises the fact that investments are to some extent costly to reserve and may affect the value of future investment alternatives. For instance, the heritage of the Soviet Union, in addition to its geographical position, has resulted in Gazprom’s focus on gas ex-ports to Europe by pipelines (see Part II). Conversely, Qatar as a relative new-comer has developed a multi-market export strategy (using also LNG) orientated towards different regional markets.
58 One can make a distinction between tangible and intangible assets. In the gas industry, intangible assets are for instance a firm’s brand name and patents on in-house knowledge. The resources, for example, are tangible assets. Intangible assets are important in generating future valuable ‘growth options’, whereas the firm’s tangible resources (such as gas resources) may be subject to embedded options to expand or abandon (see Section 3.7.2).

58
External factors: competitive advantage with regard to competitors External orientations matter in that they may potentially yield a competitive advantage with regard to competitors. The presence and strategic position of potential competitors also influences the strategic choices of the firm. The external view can be related to Porter [1980], who analyses the sources of competitive advantage and excess profits with respect to the level of industry and firm’s strategic behaviour. The industry and competitive analy-sis framework of Porter [1980] finds its roots in industrial organisation.59 In line with the dynamic market theory, Porter’s business strategy framework originates from the struc-ture-conduct-performance paradigm. The conditions of competitive behaviour that is determined by the industry’s structure, externally affects the firm’s behaviour. In turn, it determines the performance of the industry as a whole. The competitive forces approach views concentrated industries as attractive in that entry barriers can shield market posi-tions. The profitability and attractiveness of a specific industry or a part of the value chain depends on the so-called five forces in a specific industry, see Figure 3.3 [Porter 1980].
Figure 3.3 The Five-Forces model: industry and competitive analysis
• Unless profitability is protected by means of entry barriers, etc., entrants may reduce the market share of incumbents (i.e. increase market rivalry)
Threat of substitutes
• Substitutes such as nuclear power, coal and renewables are also a threat for gas-exporting firms, which may replace gas in the power generation sector
Threat of potential entrants
Bargaining power of customers
• Customers down the value chain can extract value from firms core activity.
• In a buyers’ market, customers (or importers) have more power with respect to extracting such value than in a sellers’ market
Bargaining power of suppliers
• Suppliers, such as subcontractors of materials and technology, can extract value through price-setting and other supply conditions.
• Changing market fundamentals can affect bargaining power
Market rivalry
• Competition among market participants for market share in the various markets
• E.g., between StatoilHydroand Gazprom in the Northwest European market
Source: Porter [1980].
Yet, this five forces framework does not provide a framework to quantify the trade-off between the need to compete versus cooperate. In addition, it has limitations in the con-ceptual reasoning in a dynamic setting regarding sequential moves. However, a competi-tive analysis approach involving game theory can be used to quantify these trade-offs (in
59 Industrial organisation is a discipline within microeconomics, which analyses the strategic behaviour of firms, the structure of markets and their interactions.
59
sequential moves). Game theory is useful in obtaining insights about the structure of in-teraction between players, and in understanding the existing possibilities and conse-quences of rivalry, see Section 3.7.3 [Tirole 1988]. Portfolio of cash-generating activities as well as strategic options in dynamic markets As mentioned-earlier, at the strategic level, firms (and governments too) have to manage a portfolio of cash-generating activities as well as future growth possibilities (e.g., strategic options). The growth versus profitability matrix of the Boston Consulting Group (BCG) categorises projects (or product-market combinations) into four quadrants according to their potential for future growth and current profitability. ‘Rising stars’ are projects in growth markets with relatively high profitability. ‘Question marks’ represent projects with high growth, but with low profitability. A ‘cash cow’ is a project in a stable market envi-ronment (i.e., low growth) with high present profitability. A ‘dog’ is a project in a stable or declining market (low growth) with low present profitability. Portfolio management recommends that firms use the profits earned by cash cows to fund developments of rising stars and question marks [Smit and Trigeorgis 2004]. However, portfolio strategies must be flexible in order for them to enable the firm to adjust to an uncertain dynamically competitive and, depending on the industry, technological change. Therefore, the static aspect of the BCG growth-matrix approach is not in all cases suitable for analysing, for instance, follow-on investment opportunities in an uncertain environment. A so-called real-option growth (ROG) matrix incorporates the planning and management of a portfo-lio of opportunities in an uncertain and competitive environment via real-option-based valuation (see Section 3.7.2 and Chapter 4). The ROG matrix is a trade-off between short-term profitability and long-term growth potential. In the process of decision-making, the timing of strategic investment(s) and the choice of productive capacity in growing gas markets are the most common problems in business strategy when it comes to the gas industry.60 As described in a previous section, each stage along the growth cycle is associated with particular, structural features, which determine competitive advantage and the level of competition. During the introduction and growth stages (cf. Figure 3.2 of Section 3.4.1), a firm can uphold an entry barrier through the establishment of economies of scale, for example, by building substantial production and transmission capacity. Such a barrier lowers the expected revenues for prospective pur-chaser. Late-movers would be reluctant to grow since they would be faced with the higher cost associated with the threat of price competition due to, for example, already existing excess capacity. In the first two phases, most isolating mechanisms are based on early-mover advantages (see also Chapter 4). However, it is not always fruitful to move early, which implies late-mover advantages. Lieberman and Montgomery [1988] argue that late movers can benefit from (1) the ability to free-ride on the advantages of early-movers (i.e.,
60 See Grant [1995] for an in-depth analysis of competitive advantage and the growth cycle.

60
shared growth options); (2) the option value to wait in a situation of high (market) uncer-tainty; (3) switching benefits because of created substitutes or new technology. During the mature phase, a usual development, which can also be applied to the gas in-dustry, is that competition shifts from capacity to price competition. Depending on the height of exit barriers and the strength of international competition, the process of price competition may intensify during the decline phase. In such a phase, a competitive advan-tage can be obtained from two generic strategies: (1) a cost leadership strategy that allows a firm to produce at lower cost than its competitors; or (2) a differentiation strategy that allows the firm to set a premium price.
Box 3.2 Economic rent: Definition, underlying sources and the link to corporate finance Gas is only worth what it can bring in gas markets minus transportation (and other related) costs [Davis 1984]. In this sense, the level of economic rent – profit above the opportunity cost of capital – achieved by a gas firm consists on average of the added value of the gas industry and the value created relative to its competitors (see Figure 3.4). Formally, the economic rent from the production of a natural resource can be defined as “any payment made to a production factor above the amount necessary to keep that factor of production in its present employment” [Baumol and Blinder 2000, p. 753]. Applied to the gas industry and specific from the sphere of costs, economic rent can be defined as the difference between the market price for a certain amount of gas minus the total cost of the producer at that level (of production, transport, processing, storage, distribution and use of capital for the specific producer) and the market price for that amount of gas minus the normal cost at that level (the ‘normal’ cost of production, transportation, processing, storage, distribution and capital, as it applies to competitors):
Economic rent of firm
j = profit
j – ‘normal’ profit of competitors
Economic rent of firm
j = ( ) ( )N
M j Mq p c q p c− − −
i.e.:
Economic rent of firm
j = ( )N
jq c c− (b)
with, from a gas producer’s perspective:
q = demand of natural gas in cubic meters;
Mp = market price for natural gas per cubic meter;
jc = total cost per cubic meter for production, transportation, processing, storage,
distribution and use of capital, for the specific producer j; Nc = ‘normal’ cost per cubic meter for production, transportation, processing, stor-
age, distribution and capital, as it applies to the competitors of j.
(continued)

61
Box 3.2 Economic rent: Definition, underlying sources and the link to corporate finance (continued) Achieving a cost advantage is only one value component as a basis for economic rents. Looking more in detail to the (other) different value components, there are two underlying sources, as described in Figure 3.4. Firstly, it depends on the general investment attractiveness of the industry in which the firm operates. In this category, barriers to entry, a natural monopoly or a monopoly imposed by the government, and vertical bargaining power can be underlying sources of excess returns in, for exam-ple, the gas industry. Secondly, value creation depends on the creation of a competitive advantage of a specific firm over its rivals. Such value driver may result in a cost advantage, for example: Econo-mies of scale and scope and absolute cost advantages, or product differentiation [Shapiro 1991]. This value may be enhanced by means of strategic moves, which enhance market power. Within microeconomics, the producer surplus, which a firm earns on its output, is equal to the economic rent, which it earns from its scarce input. Under perfect competitive markets, the producer surplus is zero, thus economic rents cannot be achieved. Economic rents are thus related to the factor of input, and the producer surplus to output [Pindyck and Rubinfeld 2001]. Figure 3.4 Resources as a basis for economic rents: why can investments be valuable?
BrandsPatents Retalia-torycapacity
Brands Marketing, distribution, and service capabilities
Access to low cost inputs
Product techno-logy
Process techno-logy
Size of plant
Financial resour-ces
Firm sizeMarket share
Sources: based on Grant [1991]; Smit & Trigeorgis [2004].
Returns in excess of competitive level
(i.e., economic rents)
Industry attractiveness
Competitive advantage
Differentiation advantage
Cost advantageVertical bargaining
MonopolyBarrier to entry
In order to analyse investment opportunities to achieve economic rents, the financial-economic litera-ture developed the concept of net present value (NPV) in corporate finance [Brealey and Myers 2005]. As mentioned above, firms look for value creation in order to maximise their shareholders’ wealth. Under perfect competition, an investor cannot earn more than the opportunity costs of capi-tal. In that case, the net present value is zero. Profits that are greater than the opportunity cost of capital (i.e., the economic rents) are temporary when the industry is not in its long-term equilibrium. They are permanent in the situation when a firm has a structural (semi-)monopoly or structural market power. In theory, the NPV is simply the discounted value of economic rents [Brealey and Myers 2005].

62
3.7 The valuation of investments in an uncertain, competitive
environment
Just as in many industries, gas firms must develop strategies in anticipation of market developments that are dynamic. Because of the complexity of the interregional gas market, primarily we focus in this paper on Cournot-type quantity competition, where suppliers are assumed to compete in quantity or gas volume rather than in gas prices. In order to deliver new volumes to market and thereby potentially capture additional market share, suppliers must build additional capacities in gas transport. For a firm with growth oppor-tunities, infrastructure sets the stage and creates the strategic context in which the firm can thrive and preserve its continuity [Smit 2003]. This is certainly true in the gas market. Because few investment opportunities exist in a vacuum, they must be considered in their strategic and competitive context [Smit 2003]. We therefore argue that in order to ascer-tain the overall value of gas transport infrastructure, account must be taken of both de-mand uncertainty and possible competition through strategic-economic approach. The real-option game model, developed by Smit and Trigeorgis [2001], is a two-stage entry deterrence model that captures, from an incumbent’s perspective, both the aspect of po-tential entry and the prevailing uncertainty in gas market demand. This real-option game, as the name suggests, also discounts the overall value of gas transport infrastructure to the beginning of the game as a function of market outcomes at the end of the second stage. The three theoretical building blocks to this real-option game approach include:
• the direct cash flow value through the discounted cash flow (DCF) approach;
• managerial flexibility value through the real-option approach; and
• the strategic value obtained through the use of game theoretical concepts (com-bined with real-option analysis).
These three components will be discussed in Section 3.7.1, 3.7.2, and 3.7.3 respectively. The different components provide the basis of an entry deterrence game and a real-option game framework for strategic investments, which will be discussed in Section 3.7.4. 3.7.1 Discounted cash flow model
In general, an investment is a firm-level project. The overall profitability of a project is determined by its expected annual net cash flows. In corporate finance, the DCF approach is a tool designed to value a project, by discounting the project’s expected cash flows, E(CFt) over project’s lifetime (T) at a risk-adjusted discount rate (k). The risk-adjusted discount rate can be derived from the prices of a security in the same risk category, typi-cally from the Capital Asset Pricing Model (CAPM)61. In order to adjust the cost of capi-
61 The CAPM is used to determine a theoretically appropriate required rate of return of an asset by investors. This rate of return depends on: (1) compensation for the time value of money (i.e., risk-free interest rate), and (2) a risk pre-mium, which depend on the beta and the market risk premium. The beta is the asset’s sensitivity to systematic (or market) risk. The market risk premium is the risk premium on the market portfolio [Brealey et al. 2005]. Given the empirical limitation of the CAPM, firms may prefer to use a multi-factor approach for estimating required rates of

63
tal, as a discount factor, for the effect of the capital structure (the mix of debt and equity financing) and tax, the weighted average cost of capital (WACC) is commonly used. The WACC is the expected rate of return on the portfolio of debt and equity securities issued by the firm. The required rate of return on each capital component is weighted via its ratio relative to the firm’s market value [Brealey et al. 2005].62 The DCF approach is a standard method for using the combined effect of the time value of money and risk aver-sion to appraise long-term projects. The net present value (NPV) is a criterion within the DCF approach and is equal to the current value of future cash flows minus the initial investment:
( )
( )0 0
1 1
Tt
tt
E CFNPV I
k=
= − ++
∑ . (3.1)
with:
0I = investment in year 0;63
( )tE CF = expected cash flow in year t;
k = risk-adjusted discount rate; T = life time of the investment project.
When this current value is positive, the project adds value to the firm. Investments with positive NPV thus contribute to the wealth of shareholders (see also Box 3.2 for the rela-tion of the NPV criterion with the concept of economic rent). Investments with a negative NPV reduce the wealth of shareholders. The rule of thumb is that firms should invest in positive NPV projects while those with negative outcomes should be rejected. According to Shapiro [2005], new investment projects should be assessed on the basis of three crite-ria: (1) it must focus on cash and only cash; (2) it must account for the time value of money; (3) it must account for risk. The DCF approach is consistent with these criteria. Another criterion within the DCF valuation is the Internal Rate of Return (IRR). The IRR is the discount rate of the future cash flows, where the NPV is equal to zero (the project is thus attractive if the IRR exceeds the opportunity cost of capital). The adjusted present value (APV) is another valuation method, although it is essentially a reformulation of the DCF approach. The APV is the net present value of a project if financed only by equity, with separately including the present value of the financing benefits (in particular interest tax shields). In this respect, cash flows should be discounted at a rate that is only
return. Such approach, however, does maintain the basic idea of returns being composed of a risk-free rate plus a risk premium (now consisting of multiple components).
62 The required return on debt is measured after tax, since interest payments are deductible.
63 In practical cases (such as the building gas infrastructure), project investment may involve several years of initial negative cash flows.

64
adjusted for business risk, and tax shields at the cost of debt (as an alternative of the WACC). 3.7.2 Real-options approach
The standard DCF approach is a static approach to investment projects, because it as-sumes that all operating decisions are set in advance and because it defines an investment decision as a ‘now or never’ choice. In an uncertain, changing situation, however, an op-tion to invest in the future could also be valuable, as alternative to direct cash inflows. In situations involving newly available market information the ability to anticipate creates additional value. The value of flexibility in projects is covered in corporate finance by the real-option approach. Such real-options offer the management board of the firm ‘manage-rial flexibility’ in the process of decision-making regarding investment projects, also after the initial investment has been made. The work of Merton [1973], and Black and Scholes [1973] laid the foundation for pricing options and derivatives in financial markets. There are two basic types of options. A call option is the right to buy a stock/asset at a specific strike price on or before the exercise date. A put option is the right to sell a stock/asset at a specific strike price on or before the exercise price [Brealey et al. 2005]. In this respect, (1) the stock price at time zero, (2) the strike price, (3) the continuously compounded risk-free rate, (4) the stock price volatility, (5) time to maturity of the option, and (6) the dividend yield are variables, which influ-ence the value of a call option [Hull 2003]. When exercised, the payoff of a call option is the value of a stock/asset minus strike price when the difference is positive (otherwise zero). Myers [1977] explained that a firm’s value may substantially depend on its option to de-velop ‘real’ assets – what he referred to as ‘real’ options.64 Copeland et al. [2000] distin-guish a number of categories in real-options, which include: (1) an option to defer invest-ment; (2) an abandonment option; and (3) an option to adjust production.65 The option to defer, or postpone, investment bears basic similarity with regard to call options on a share of a firm. When applied to the gas production in the gas industry, this option may be seen as functioning through the payment of a lease-on-development price. Through such option, the owner has the opportunity to develop a gas field or not. The owner could postpone the development of the field if oil and gas prices have fallen. The expected de-velopment costs can be compared with the strike price of a call option. In a situation in-volving opportunity costs, which can be prohibitively high, the owner may wish not to exercise his option (i.e., start to develop a gas field right away). The project uncertainty,
64 The following real-options literature offers some different examples of flexible investment strategy: Myers [1978]; Trigeorgis and Mason [1978]; Majd and Pindyck [1978]; Pindyck [1988]; Myers and Majd [1990]; Ingersoll and Ross [1992]; and Trigeorgis [1993].
65 For extended overview of (numerical) examples of the different categories on real-options, see for example Copeland et al. [2005] and Schwartz and Trigeorgis [2001].

65
the postponement period, and the level of interest have thus a positive impact of the value of this postponement option; referring to the above-mentioned variables. An abandon-ment option functions in the opposite manner and bears similarity to a put option. The other category, which Copeland et al. [2005] explore, is the option to adjust production. A venture has a flexibility to adapt vital aspects of its investment, such as the scale, range and life span. In this category the following options can be distinguished: (1) an option to expand or contract; (2) an option to extend or shorten; (3) an option to scope up or scope down; and (4) a switching option. Trigeorgis [1988] distinguishes real-options in simple and compound (follow-up) options, respectively proprietary and shared ones. Simple options are commercial one-stage projects that – when the option to invest has been exercised – generate cash flows. A compound option is basically an option on an option. Projects that derive their value from strategic value and not only or exclusively from cash inflows are called compound options. If a simple or compound option is proprietary, then the investment opportunity provides an exclusive right to exercise it. Conversely, if a competitor is able to influence the timing and value of the investment, then the investment opportunity is shared, which is when coop-eration with competitors may be seen as desirable. Thus, creating and securing real-options offer the firm managerial flexibility (e.g., the possibility to wait-and-see). For firms, significant ‘growth opportunities’ can hereby be considered as a collection of projects in the form of ‘options to grow’. In case of such pro-jects, the emphasis lies on ‘option valuation’, where the DCF is (almost) irrelevant. In addition to where real options can or should be actively created, in many cases there are options that are 'naturally' embedded in projects (i.e., embedded option). In such situa-tion, the static DCF approach is to be supplemented by the value of these embedded. Therefore, the DCF approach should be expanded with real-option valuation in case in-vestments projects have embedded options or when real-options are the core of a project. The following formula summarises the impact of real option on project valuation:66 The extended Net Project value = ‘direct’ (static) NPV + net real-options value (3.2) Binomial valuation of real options The option-pricing model of Black and Scholes [1973] and Merton [1973] offers a closed-form solution, based on rather restrictive assumption. For practical purposes Cox et al. [1979] have developed a binomial model of option valuation as a tool for generating nu-merical solution.67 This approach has proven to be suitable for many cases of real-option valuation. In order to understand some operational valuation aspects of the real-option
66 Note that in formula 3.2 the component of the value from 'strategic competition' is not yet included.
67 It can be shown that ‘in the limiting case’ the binomial model converges into the Black-Scholes-Merton model.

66
approach, attention here is given to the binomial modelling of uncertainty and the risk-neutral valuation approach.68 To illustrate these operational valuation aspects and the advantage of the real-option ap-proach vis-à-vis the DCF approach, consider a firm that has to decide if it should invest in a gold mine, requiring an irreversible investment of $4.5 million.69 It is assumed that de-velopment and extraction can be started directly and there are no variable costs. The risk-free interest rate ( r ) is 4 percent per year. The reserves of gold are 14,000 ounces and can
be produced in year 1 ( 1t = ): thus production level at 1t = (1
Q ) is 14,000 ounces. The
level of uncertainty can be measured by the volatility of the underlying value (the price of
gold). It is assumed that the current price of gold (0
S ) is $300 per ounce. The gold price
either moves up ( uS ) or down ( dS ) over the period, where u (assumed at 1.5) and d
(assumed at 0.67) are the multiplicative (up and down) binomial parameters. Depending on the development of the gold price, the operating cash flows (production level times gold price, or CF Q S= × ) will diverge.
When applying the NPV criterion, management should not invest in the mine, because it results in a negative NPV (–$0.3 million).70 However, the DCF approach is not a useful instrument to determine the value of the mine via expected cash flows, because capital investment is not a now-or-never proposition. Once the firm has made its pre-investment (buy a license) to have the right to make the full investment in the mine, management has the option to wait (with the option maturity period being the time period of the license). The real-options approach considers managerial flexibility into the decision-making proc-ess based on the development of the underlying asset (gold price) and takes into account above-mentioned determinants of the project value, such as price volatility. A visualisation technique for the binomial pricing model involves constructing a binomial tree, see also Figure 3.5. This is a diagram that represents different possible paths that might be fol-
68 Implementing real-options valuation in sectors whereby correlated financial instruments do exist (e.g., futures and forwards), decision-makers can make use of the concept of replicating future cash flows. For example, in order to value a producing gas field, one can use oil and/or gas futures (although gas futures are not that liquid). For an overview of pricing through replication and the binomial risk-neutral valuation approach, see for example Hull [2006]; Cox et al. [1979]; or Trigeorgis [1991].
69 This example of valuing the gold mine is adapted from Brennan and Schwartz [1985] in Smit and Trigeorgis [2004] and Ross et al. [2005, pp. 669-675].
70 When assuming that both prices under the binomial distribution in a one period (two-date) setting are equally likely
(probability 0.5q = ) and that the implied market-required return (k ) is 8.33 percent (derived from the expected
gold price in 1t vis-à-vis
0S ), then
( ) ( )0.5 450 14, 000 0.5 200 14, 0004, 500, 000 300, 000
1.0833NPV
× + ×= − = − . Further explanation; see Bren-
nan and Schwartz [1985].

67
lowed by the price of the underlying asset over the time to maturity. The binomial deci-sion tree analysis can thus capture decision flexibility that is not included adequately by the direct NPV approach. Figure 3.5 Proprietary opportunity (license): Wait with investing under uncertainty
Su = $450 Vu = 6.3 mln$
Source: adapted from Brennan and Schwartz [1985] in Smit and Trigeorgis [2004].
V0
Cu = Max[6.3–4.5; 0] = 1.8 mln$(Invest)
Vd = 2.8 mln$
Cd = Max[2.8–4.5; 0] = 0 mln$(Abandon)
Sd = $200
t=0 t=1
S0 = $300
Risk-neutral (or a certainty-equivalent) valuation is an important principle in the binomial model. It can be shown that in a one-period binomial setting, the value of a call option
does not depend on the probability of the underlying value going up (to uS ) or down
(to dS ). It is the ‘volatility’ u dS S− in conjunction with 0
S and the interest rate r (and
also the strike price of the option) that determines the option value. Since the probabilities
up and dp ( 1 up= − ) are irrelevant, one is free to assume any convenient probability
level. A very convenient one is a probability p (and corresponding to1 p− ) that complies
with a result of risk-neutral valuation in the risky situation that is represented by the bi-nomial setting [Hull 2003]. The risk-neutral probability ( p ) is the probability that would
prevail if the underlying asset were expected to earn the risk-free return. This means:71
71 For the calculation within the real-option game model of the risk-neutral’ or ‘certainty-equivalent’ probabilities in Chapter 4, according to Smit and Trigeorgis [2004], Formula 3.3 is adjusted by adding a constant asset (dividend-like) payout yield:
( )1 r dp
u d
δ+ − −=
−, and ( )1 p− .
where u and d represent the multiplicative up or down moves in price, r is the risk-free interest rate, and δ is the is
the constant asset (dividend-like) payout yield (equal to k/(1+k) for a perpetual project, where k is the risk-adjusted discount rate).
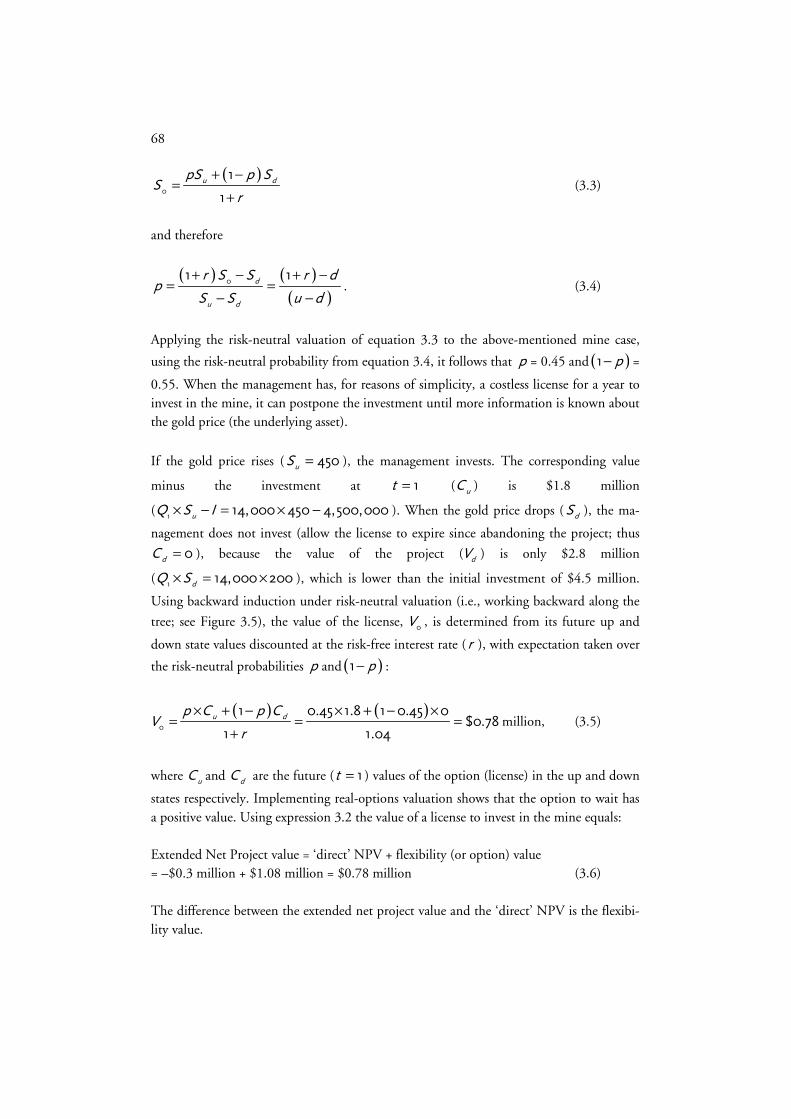
68
( )0
1
1
u dpS p SS
r
+ −=
+ (3.3)
and therefore
( ) ( )
( )0
1 1d
u d
r S S r dp
S S u d
+ − + −= =
− −. (3.4)
Applying the risk-neutral valuation of equation 3.3 to the above-mentioned mine case,
using the risk-neutral probability from equation 3.4, it follows that p = 0.45 and ( )1 p− =
0.55. When the management has, for reasons of simplicity, a costless license for a year to invest in the mine, it can postpone the investment until more information is known about the gold price (the underlying asset).
If the gold price rises ( 450uS = ), the management invests. The corresponding value
minus the investment at 1t = ( uC ) is $1.8 million
(1
14,000 450 4,500,000uQ S I× − = × − ). When the gold price drops ( dS ), the ma-
nagement does not invest (allow the license to expire since abandoning the project; thus
0dC = ), because the value of the project ( dV ) is only $2.8 million
(1
14,000 200dQ S× = × ), which is lower than the initial investment of $4.5 million.
Using backward induction under risk-neutral valuation (i.e., working backward along the
tree; see Figure 3.5), the value of the license, 0
V , is determined from its future up and
down state values discounted at the risk-free interest rate (r ), with expectation taken over
the risk-neutral probabilities p and ( )1 p− :
( ) ( )0
1 0.45 1.8 1 0.45 0$0.78
1 1.04
u dp C p CV
r
× + − × + − ×= = =
+million, (3.5)
where uC and dC are the future ( 1t = ) values of the option (license) in the up and down
states respectively. Implementing real-options valuation shows that the option to wait has a positive value. Using expression 3.2 the value of a license to invest in the mine equals: Extended Net Project value = ‘direct’ NPV + flexibility (or option) value = –$0.3 million + $1.08 million = $0.78 million (3.6) The difference between the extended net project value and the ‘direct’ NPV is the flexibi-lity value.
69
For the purpose of this study, the real-option approach will be applied for gas infrastruc-ture investment, especially midstream pipelines and LNG infrastructure. Such investments generate options in the follow-on project to deliver gas to a specific gas market. It is as-sumed that the firm can use the pipeline capacity exclusively for its own use. In Chapter 11, this assumption will be reviewed, because of regulatory policies in some regions in the world (especially the US and Europe), which may force firms to provide third parties with access to their pipeline capacity. A strategic infrastructure investment opportunity can be viewed as a call option (the right to buy an underlying value in the future). In this case the underlying value is equal to the present value of the expected cash inflows from the opera-ting follow-on project with an exercise price being the follow-up investment outlay of the midstream infrastructure project. The ability to defer the follow-on investments under market demand uncertainty offers decision-makers managerial flexibility. In a situation in which market demand develops favourably, the firm may invest in follow-on capacities. If not, the firm may defer its follow-up investment and invest maybe in a latter stage. One can use a binomial option-valuation tree of the level of demand (applying risk-neutral option valuation) to assess the real-option value of the project, with demand itself acting as an underlying asset, just as the price of gold does in the previous gold mine example. 3.7.3 A game theoretical framework
The next step in finding a framework that takes into account both uncertainty in dynamic markets and rival behaviour, is adding a game-theoretic component.72 Doing so will shift this theoretical discussion from one involving merely market uncertainty (in terms of demand or price) to one also involving decisions made by an external player, a potential competitor or market entrant. This effectively adds one more layer of uncertainty, namely the risk of a negative impact on profits due to a loss in market share to competitors. In an oligopolistic market (as is the gas market) a player could influence, for example, market outcomes through strategic investments vis-à-vis the competition. These investments can-not be analysed using a static NPV approach and/or the common real-options approach. However, game theory offers a tool to assess the strategic value from competitive invest-ment action [Smit and Trigeorgis 2001]. All oligopoly models may be seen as examples of game theory, which uses formal models to analyse situations involving conflict or cooperation between economic agents. A game is any competition in which strategic behaviour is important and where each player’s payoff depends directly on actions of other firms [Carlton and Perloff 2000]. A game represents a strategic context in which firms’ decisions are interdependent. First, this can be a game for the division of a given economic pie, a so-called zero-sum game. Second, firms can work together or have mutual beneficial decisions that enhance total value (positive-sum
72 Game theory, as a branch of mathematics and economics, has allowed for the study of the behaviour of economic agents in a broad range of economic phenomena such as bargaining, market entry, and conflicts of interest amongst many others. It has also served as a useful instrument in analysing the strategic behaviour of agents in non-economic circumstances. For an introductory text to game theory, see for example Dixit and Nalebuff [1991].
70
games). Dixit and Nalebuff [1991] distinguish between unconditional and conditional strategic moves, whereby the last one can be split up into a threat and promise. An un-conditional move is a response rule in which the firm moves first and the action is prede-termined. For example, a pre-commitment to invest in pipeline capacity may provide an advantage vis-à-vis a firm’s competitors, which can then alter their investment strategies because of the threat of the pre-commitment. With a conditional move, a firm may limit or condition its own actions by specifying a rule for how to respond under different cir-cumstances. For example, this might include a threat to punish rivals if they take actions, which work against a firm’s interests. Conversely such a rule may include a promise to reward ‘rivals’ if they take actions, which work in its favour. This research will primarily focus on unconditional strategic moves. Players engage in strategic games and their interaction results in an equilibrium73, such as the Nash equilibrium. The Nash equilibrium is a dominant strategy equilibrium such that no player has an incentive to deviate from the chosen strategy given that the other players do not deviate either, i.e., such that each firm is doing the best it can given what its com-petitors do [Rasmusen 2001].74 This situation can change, however, if games are dynamic. The essence of dynamic (or multi-period) games, as opposed to static (or single-period) games, is that firms compete repeatedly over time. In addition, players may adjust their beliefs about rivals’ behaviour over time and may use more complex strategies than in static games [Carlton and Perloff 2000]. In dynamic games, players can learn from each other’s actions and adapt their own behaviour so as to maximise their own individual payoffs [Schmalensee 1988]. Of specific interest in this context are repeated games involving strategic interaction be-tween two players over the span of two periods, i.e., a sequential game. Sequential games are repeated games, for a limited duration of time, i.e., a specific number of periods. In such games, players choose their first-period actions while taking into account the conse-quences in both the first and second periods, and the final outcome is reasoned backwards towards the beginning of the game [Tirole 1988]. Having reasoned backwards (i.e., back-ward induction), the player is then in a position to make a particular decision at the be-ginning of the decision tree. A game can involve competition in quantity and price. Com-peting in quantities here refers to the notion of choosing a scale that determines the firm’s cost functions and thus determines the conditions of price competition. Cournot competi-tion is a model used to describe an industry structure in which firms compete on quantity, whereas a Bertrand model describes an industry structure on price competition [Tirole
73 An equilibrium is a strategy combination consisting of a best strategy for each player in a game. Related to this, an equilibrium concept is a rule that defines an equilibrium based on the possible strategy combinations and the payoff functions, see Rasmusen [2001].
74 A Nash equilibrium is a non-cooperative equilibrium in that without the ability to make credible commitments, players choose their dominant strategies for sake of security. It is the basic solution concept in game theory [Rasmusen 2001].

71
1988]. In the context of gas infrastructure investment strategy, the Cournot model seems appealing when ‘quantity’ is interpreted as ‘capacity’. In such situation each firm chooses in secret a production capacity, realising that once their capacity is chosen in one sequence they will compete through price in the next (i.e., a Bertrand game) [Varian 1992]. 3.7.4 Entry deterrence and strategic investments
A possibility in sequential games is for one player to act early, investing in capacity on big scale so as to deter potential entry of rivals or establish a strong market position in general. An important feature of this research is that firms are able, if they choose to, to make strategic pre-commitments in order to alter the conditions of future competition in a manner that is favourable to them. Entry deterrence and the sunk costs associated with certain ‘strategic’ investments are by definition a multi-period phenomenon. These in-vestments are strategic in that they are not designed purely for cost-minimisation pur-poses, but also for deterring entry by possible entrants [Tirole 1988]. For the firm, acting strategically early on, i.e., creating a first mover’s advantage, it may deter entry because it becomes unprofitable for the entrant to invest. These investments could alter the structure of the market at some future point or to draw the structure of the market to their advan-tage [Schmalensee 1988]. Long-term contracts in the natural gas industry, the economies of scale involved and the capital intensive nature of the gas industry call for strategies that involve long-run invest-ments with long-run potential to affect access to a market. Of particular interest in this framework are two-stage models involving strategic investment with sunk costs, such as the pipelines in the natural gas industry and other natural gas transportation infrastructure such LNG liquefaction, re-gasification terminals and tankers. The importance of existing contracts, which are used to underpin these infrastructures, may lie less in the benefit of their enforceability but, rather, in their ability to tap a first-mover advantage. In addition, existing relationships through sunk infrastructural costs act as a deterrent to others [Barnes et al. 2006]. One should hasten to add that in a dynamic context, a firm might want to ‘pull its punches’ because an aggressive action or long-term commitment by an opponent will induce it to behave likewise [Tirole 1988]. As Colell et al. [1995] note, in two-stage models, entrants must sink fixed costs prior to competing. While in one-stage models players can compete for sales while retaining the option not to sink these costs if a player does not make any sales. These types of invest-ment enable firms to make use of capacities, or transport capacities in the case of natural gas markets. The aim in this setting is to show that in the natural gas industry it is possible to deter or pre-empt other suppliers by making such investment or sunk costs. An incum-bent in one gas market can reduce the scale of entry of a rival firm, which is a barrier to mobility [Caves and Porter 1977]. The key aspects of sunk costs in models of industrial organisation are their commitment value. If the capital investment is to have commitment value, then the investment must be somewhat difficult to reverse [Tirole 1988].

72
According to Smit and Trigeorgis [2004], a framework based on real options and games hence incorporates three levels of planning that have an effect on the overall value of a firm’s project (see three corresponding layers in Figure 3.6):
• the project appraisal from corporate finance, which aims to determine the effect on the net present value of the projected cash flows resulting from the establish-ment of a competitive advantage;
• the strategic planning of growth opportunities, which aims to capture the flexibi-lity (option) value, resulting from the firm’s adaptive capabilities through real-options valuation;
• the competitive strategy, which aims to capture the strategic value from establish-hing, enhancing, or deferring a strategic position vis-à-vis possible competitor(s) based. This value is derived using game theoretic analysis and industrial organisa-tion economics.
Figure 3.6 Impact of business strategic planning on the overall project value
Flexibility (option) value
Strategic value
Static NPV
Overall project value
Real-options valuation (Corp. Fin.)
Game theory/I.O. Economics
Discounted cash flow (Corp. Fin.)
Valuation Methodology
Source: adapted from Smit & Trigeorgis (2004).
+
+
Adaptive capability
Strategic moves
Competitive advantage
Value Drivers
Strategic planning of growth options
Competitive strategy
Project appraisal
Strategic planning
QuantifiedConceptual
According to Smit and Trigeorgis [2004], the decision to invest in this manner is therefore based on an overall NPV criterion that integrates the strategic and the flexibility value. Both values pertain to the impact on profitability of demand uncertainty and competitive interactions. In line with the real-option game model as developed by Smit and Trigeorgis [2004], we can distinguish between the value of having a strategic option to compete (strategic ‘option-game’ value) and foregoing this option to compete now (the value of the option to post-pone strategically). The strategic (option-game) value is the value of ‘contingent’ strategic investing commitment. Hence exercising this strategic option means committing oneself,

73
and not exercising the option to postpone strategically. The strategic (option-game) value includes the option value of postponing commercial investments after committing.75 Exer-cising the option to postpone means postponing to commit oneself, waiting-and-seeing strategically. Collectively, these values are an addition to the traditional direct (static) NPV, which is equal to the expected cash flows from investing immediately (see also Sec-tion 3.7.1). That is: The overall Net Project value = ‘direct’ (static) NPV + flexibility (option) value
+ strategic (game-theoretic) value (3.7)
The value components of expression (3.7) are illustrated in Figure 3.6. A firm should invest in a strategic project when the total sum of the overall net project value is positive, whereby the strategic option-game value is higher than the value from the strategic option to postpone (of making a strategic investment). The strategic commitment and postponement values In non-regulated gas markets infrastructures, such as pipelines and LNG trains, hence act as options for vertically integrated firms in to gaining, maintaining or expanding access to new markets or consolidate positions in existing ones. Thus for vertically integrated gas firms, producer’s commodity trade largely ensures midstream investments. In order for this to be the case, it is the exclusive ownership of the capacity (i.e., no third-party access), which ensures that these investments may be seen as an option today in order to expand commodity trade in the future. The model, which will be discussed in Chapter 4, focuses on this specific case of strategic and irreversible investments in a competitive, uncertain environment. The emphasis in the model lies on the value of the option to postpone stra-tegically versus the strategic (option-game) value. Given the uncertainty of the value of the underlying assets, i.e., profits from demand, and potential entry, an early commitment provides a strategic option on future growth. When no early commitment is made, no option on future growth is created. By committing early, an incumbent creates an option that potentially enables it to capture intrinsic value over time by anticipating possible entry. Alternatively, a certain value derived from the option to postpone strategically is present whenever any combination between downside demand risk and the scale of entry potentially proves to be detrimental to the value of the underlying asset, a so-called wait-and-see value. 3.8 Conclusion
The bedrock for the theoretical underpinning of this chapter in order to describe the rela-tionship between governments, firms and market consists of a multi-disciplinary combina-
75 This option is a so-called embedded option, i.e., managerial flexibility at a tactical level (see also Section 3.7.2). In practice, managerial flexibility exists when a decision is taken to proceed (or not do so) with the installation of com-pressor facilities, after an initial pipeline investment has been made.
74
tion of international relations theory, industrial organisation, strategic planning (including strategic management and game theory), and corporate finance. The modern variant of IPE argues that it is necessary to integrate international relations and (political) economy in order to explain, for example, complex issues in the gas market. Strange’s structural power, which should be seen as a relative concept between states (rather than measures in absolute terms), primarily relates to the abilities of governments and non-government actors to influence the international political system to their own advantage. The ability to exert power relies heavily on being able to engage a nation’s national resources and mana-ging them adequately. These resources can consist of intellectual capital, natural resources, manufactured goods, etc., as Adam Smith already argued in the 18th century. Strange [1989] goes on to argue that a nation’s power consists really of four dimensions: security, knowledge, finance and production. A country’s knowledge and production can lead to financial wealth, which it can use to further boost its production, develop its intellectual capital base and develop the means to defend itself. The government plays an important role in shaping the gas sector due to the risks and benefits (i.e., its economic rents) along the value chain, both in consuming and producing countries. When a country or nation is blessed naturally with resources, or raw materials, it already holds a major advantage relative to countries, which do not possess these re-sources but require them to survive economically. In the case of oil and natural gas, re-sources are concentrated in the hands of comparatively few countries. For Russia, having been an oil and gas producer for decades, gas is the sequel to oil in terms of earning energy revenues. In addition, as the cleanest fossil fuel with numerous applications, its centralised institutionalisation and its related political integration, gas can be seen to Russia as a rela-tive advantage or structural production and financial power. Roughly speaking, from a period stretching between the 1950s and late 1960s, the inter-national energy firms controlled the main oil (and gas) producing areas. Resource nation-alism has resulted in the rise of national energy firms, owning today some 75 percent of the world’s gas resources, fundamentally changing the relationship between producer and consumer countries. The national energy firm invests on the basis of the government’s socio-economic policy priorities for both domestic development and earning export reve-nues. Diversification of the economy may also play an important role. The socio-economic agendas of governments influence the merit order on firm-level, which in this research determines the sequence of gas sector investment across the gas value chain for its export markets, both in vertical as well as in horizontal terms. The government and the national energy firm have a principal-agent relationship where the nation’s resources are owned by the government (the principal) and managed by the national energy firm (the agent). The prevailing threat for energy producing countries lies in the essence of the re-source curse. Its consequences may provide energy producing countries with the incentive to leave a country’s resources undeveloped below the surface or to develop a counter-cyclical policy by saving and financially isolating the revenues from exports. The main
75
difference between international energy firms and national energy firms is their investment horizon, which may be influenced in the case of national energy firms, by a broad politico-economic agenda. Having said that, the international gas market is currently undergoing a major transforma-tion, one that pertains to economies of scale, trading patterns, pricing, concentration of production, the vertical integration of major firms in the business, et cetera. The dynamic market theory argues that all these elements are constantly shifting in scope and value in a long-term market cycle. This cycle, pertaining to any given product, is divided into four major phases of development: it starts with an embryonic phase of development, followed by expansion and maturity and finally ends in a decline. Each market phase of develop-ment has different characteristics and bottlenecks, which compel actors in the market to adapt their strategies to newly emerging market situations. De Jong [1989] recognizes the possibility that firms with market power can influence the market conditions as do the different market development phases. Depending on the phase of the market these firms operate in they are likely to interact in different ways, by competing or colluding. Collu-sion and cooperation may include a range of forms of cooperation, from tacit collusion to explicit agreements. Attempting to control the value chain through M&As is another possibility from an organisational perspective. Strategies of firms acting in the market have to anticipate on these dynamic market deve-lopments. In most gas exporting countries, governments delegate to their national gas firms the task of maximising the value of a country’s gas reserves for their export markets. Capturing new market opportunities (e.g. to generate a profit stream in excess of the op-portunity cost of capital) are based on the exploitation of scarce firm-specific, internal resources and dynamic capabilities. In order to capture the full long-run value creation in an uncertain and competitive environment, the static valuation approach of investments, which assumes that all operating decisions are set in advance, is insufficient. According to Smit and Trigeorgis [2004], valuation tools from corporate finance theory can be integrated with the ideas and principles of strategic management theory and indus-trial organisation to value investments under market uncertainty and competition. The combination of traditional corporate finance and strategic planning can be adequate in assessing long-run competitive advantage and strategic adaptability. Such a combination incorporates not only the static value of expected cash flows (via the discounted cash flow method), but also the flexibility (option) value (via the real-option approach) and the strategic value components (via concepts of the game theory). For vertical integrated firms, it is the exclusive ownership of the capacity of infrastructure, which ensures that the infra-structure investments may be seen as an option today in order to expand commodity trade in the future. Such strategic investments may alter the conditions of future competition in a manner that is favourable to them (e.g., entry deterrence).

76

77
Chapter 4 A real-option game approach to valuing gas value chain
investments∗
4.1 Introduction
The merit order of investments in Russia’s large gas resource base will shape the future of regional markets and the interregional gas market for decades to come. In order to assess what factors have an impact on gas infrastructure investments and to define this merit order, a hybrid approach is employed in this research, consisting of a qualitative and a quantitative framework. Capturing the full value creation in an uncertain and competitive environment requires valuation tools from corporate finance theory that can be integrated with the ideas and principles of strategic management theory and industrial organisation. The goal is to ultimately value investments under market uncertainty and competition [Smit and Trigeorgis 2004]. The qualitative framework is essentially a ‘toolbox’ of concepts, while the quantitative framework consists of an application of the stylised real-option game model developed by Smit and Trigeorgis [2004]. The quantitative framework aims to value strategic invest-ments in gas infrastructure, linking this valuation process with market structures and out-comes in the commodity market. The market outcomes determine the nature of competi-tion as well as the boundary solutions for cooperation, which in turn influence the timing of investment decisions (and thus also the merit order). A stylised model, in this sense, is insufficient to explain the complex decision making in gas infrastructure. The model is centred on the notion of a volume-driven strategy through transport capacity extensions. Therefore, the toolbox acts as a supplement to the quantitative approach in that it aims to cover aspects and/or factors, which cannot be analysed directly in the quantitative ap-proach. These include market structure, volume and price uncertainty, likelihood and nature of competition, general investment climate, transit and geopolitical factors, regula-tory uncertainty, amongst others.76 Prices will be discussed in a qualitative manner. As was described in Chapter 8, Gazprom aims to become an increasingly interregional gas exporter rather than merely a regional one. The company aims to do so both by means of newly emerging pipeline gas as well as LNG exports to new regional gas markets. For vertically integrated companies, infrastructures such as pipelines and LNG trains (i.e., the midstream gas transportation components of the value chain) act as options to gain access to new markets or consolidate positions in an existing one. In addition, in the case of
∗ This chapter was co-authored with Timothy Boon von Ochssée.
76 Russia’s gas export path-dependency and how it influences Russia’s current strategy is also taken into account in the conceptual approach.

78
long-distance transport in general, the largest part of the total costs in the value chain is located in the transport component. Therefore, the economies of scale in this section help decrease the average cost of gas vis-à-vis competition both in relative and absolute terms. This relative cost advantage can endow gas infrastructure with a certain strategic value with regard to possible competitors, i.e., entry deterrence. Downside demand risk, amongst other factors, may encourage a wait-and-see approach. As a result, the corre-sponding investment decisions involve a trade-off between the values of postponement and pre-commitment [Smit and Trigeorgis 2004]. The quantitative model finds its foundations in a combination of game-theoretical con-cepts and corporate finance-oriented project valuation, in particular using real-options. Together with the conceptual toolbox, these are used to ascertain the value of a strategic investment from Gazprom’s point of view. Section 4.2 consists of the toolbox while Sec-tion 4.3 contains the real-option game model developed by Smit and Trigeorgis [2004], the foundations for which are introduced in Chapter 3. The content of this chapter is based and has been verified by interviews with experts.
4.2 Whether or not to invest strategically: A conceptual toolbox
The conceptual toolbox is essentially a supplemental instrument to the model in Section 4.3. The combination between the toolbox and the model is employed on the basis of various levels of geographical analysis, and in different parts of the gas value chain, espe-cially gas transport infrastructure, with a focus primarily on export strategy and market orientation. Gazprom’s investment strategy will be the empirical focus point. This involves exploring and prioritising Gazprom’s investment programme. It provides an overview of Gazprom’s (historical) growth opportunities in relation to the export markets, which in the various cases can consist of countries and sub-regions such as Northwest Europe or a combination of these. Given the various market expansions in terms of demand and im-port-dependency, there are certain export growth options involved, which are subject to a range of complexities. This section develops a conceptual toolbox, which accounts for such complexities, i.e., a range of factors not accounted for in the model included in Section 4.3. It is therefore designed as a bridge between the quantitative approach and the real world.
4.2.1 Some definitions
Before embarking on a description of the conceptual factors influencing strategic invest-ment decisions, it is necessary to first review a number of definitions with regard to value chain investments:77
77 These definitions are originally used by Smit [1996] and Smit and Trigeorgis [2004] and adapted to fit the concep-tual framework of the natural gas industry.

79
• Economies of scale: According to Smit [1996], so-called value drivers can result from strategic investments (see below), ranging from absolute cost advantages to developing innovative products as well as capacity expansions possessing (enhanced) economies of scale. In the case of natural gas, long-run marginal costs are a key determinant of market power and can be brought to fruition in different sections in the value chain. The long-run marginal costs are theoretically determined mainly by economies of scale upstream and in transport (and also include other costs such as transit fees). While economies of scale bring down unit costs, it depends in practice on the utilisa-tion rate of pipelines whether these unit costs are indeed achieved. Once infrastructures have been constructed, (especially mature) suppliers have com-mitted themselves to market, and are set to supply on the basis of short-run marginal costs (SRMC), selling gas volumes in order to recover short-run marginal costs in the short-run. We assume that these pertain to the operational expenditures made for gas transport infrastructures (see Subsection 4.3.5). This is pursuant to the standard short-run marginal cost definition in microeconomics in which one or more cost fac-tors of production cannot be changed, i.e., fixed inputs [Pindyck and Rubinfeld 2001]. The capital expenditures made for gas transport infrastructures, are fixed in the short-run and are thus captured by the notion of long-run marginal costs discussed above. In the long run therefore, unit costs as a whole are brought down with greater economies of scale. Conceptually, investments along the entire chain, including the upstream, are taken into account while in the model’s application the mid-stream is the focal point. As is mentioned in Chapter 3, significant economies of scale in the value chain can deter entry, because an investor forces entrants to invest heavily in capacity, while still risk-ing an aggressive response from the incumbent [Smit and Trigeorgis 2004a]. The transmission of gas can also have significant economies of scale, especially for long-distance gas pipelines [Correljé et al. 2009]. In the toolbox, the economies of scale are measured conceptually from total average transportation cost per unit, en-compassing both capital and operating expenditures. In the application of the real-option game model only the operating expenditures (OPEX) are used to calculate the average cost per unit in transport, i.e., excluding upstream production costs, for a stra-tegic investment. The capital expenditures (CAPEX) in excess of what is required for a commercial investment is seen as an initial expense to be made (see Subsection 4.3.5).78 As for the difference between pipeline gas and LNG infrastructures, LNG
78 Greater economies of scale are not necessarily specific to strategic investments. Commercial investments can also benefit from high economies of scale, the difference being in the load factor or utilisation of the infrastructure (as described above).

80
trains and ships have lower economies of scale in terms of unit costs, only becoming economic vis-à-vis pipeline gas over longer distances.79
• Strategic versus commercial investments: For the purpose of this research, commercial projects are those, which have a short technical ramp-up phase (i.e., by making the greatest possible use of capacity of ever any length of time). These are generally lower capacity infrastructures with higher average transport costs per unit (i.e., a smaller pipeline diameter). By contrast, at the conceptual level, strategic investments pertain primarily (but not exclusively) to the mid-stream segment of any given value chain, i.e., pipelines and/or LNG trains and shipping with higher capacities and thus gene-rally lower average transport cost per unit. They are strategic only when the econo-mies of scale resulting from their construction are proprietary to the investor and in the sense that they are made early to capture market share. During times of falling demand these high-capacity midstream projects have a greater tendency towards lower utilisation levels while in cases of strongly rising demand they are more fully and thus more optimally utilised (see Subsection 4.3 for the model definitions). In that light, strategic investments in LNG value chain components are also imaginable, though the relative cost reductions are less advantageous.80
• Proprietary versus shared investments: There is a difference between proprietary invest-ments and shared investments. Proprietary investments are wholly owned and exclu-sive, and as is mentioned above projects can only be strategic when their use is pro-prietary. This pertains to pipeline cases in which both the commodity and the capa-city are exclusive to the owner of the project. This can also be the case for an LNG project, where upstream liquefaction assets are wholly owned by one single company (or brought together under a joint venture, selling it gas under one single holding).
79 Significant economies of scale gains have been made in the LNG value chain throughout the 1990s and 2000s, with trains and ships gradually increasing in terms of transport capacity. LNG travels longer distances at greater economies of scale than does pipeline gas while it has a higher threshold cost than does pipeline gas in being economic. Con-versely, with shorter distances pipelines possess much greater economies of scale. Jensen [2004] describes the relation-ship between pipeline gas transport and LNG as such: “The costs of pipelining natural gas benefit substantially from economies of scale, since large diameter pipelines are not that much more expensive to lay than smaller lines but carry much greater volumes. Pipeline costs rise linearly with distance, but LNG–requiring liquefaction and re-gasification regardless of the distance travelled–has a high threshold cost but a much lower increase in costs with distance. Thus shorter distances tend to favour pipelining, but longer distances favour LNG […]. For markets with an established pipeline grid [such as the US and much of Europe], LNG can easily alter the geographic pricing relationships or basis differentials among different points on the pipeline system” [Jensen 2004, p. 7].
80 The increase in plant (i.e., liquefaction capacity) and tanker size during the 1990s and 2000s has significantly re-duced average costs. As a rule of thumb, the a plant size increase by a factor of 2 has led to a reduction of unit costs by 25 percent (e.g., from 3 bcm to 6 bcm and from 6 bcm to 10.66 bcm more recently), while a 20 percent increase in shipping capacity has led to a 5 percent reduction in shipping costs [Jensen 2004]. By that yardstick, the new 250,000 cubic meter LNG tankers reduce unit costs by 10 percent relative to 145,000 cubic meter tankers. Case study 3 in Chapter 11 includes a numerical example for Qatari LNG.

81
By contrast in theory, shared investments result from the investment on one supplier’s part in greater economies of scale whereupon it can be jointly used by itself and its partners (i.e., investment free rider behaviour on the part of the competitor). A shared investment in the gas industry may also be thought of as, for example, a pipeline go-verned by TPA rules, effectively making it a compulsory shared investment, robbing it of its strategic nature.
There is always a trade-off between the incentives to invest early versus waiting for a more opportune time to invest strategically.81 According to the model, it may be better to post-pone strategic investments when the value of postponement, i.e., an option to ‘wait and see’, is greater than the value to commit early.82 In this sense, a strategic investment may be seen as a competitive ‘disadvantage’. In addition, suppliers may choose to make a commer-cial investment at different phases of the game’s development or defer (after having made a strategic investment or not at the beginning of the game) within the model. This is an option to wait as well, but is known as ‘managerial flexibility’. Thus, having provided some of the basic conceptual definitions above, a step-by-step sequence of conceptual factors is discussed in the following subsections. 4.2.2 Market uncertainty: Volume and price risks versus likely competition
The first step in determining Gazprom’s export strategy and whether or not to invest strategically is to identify possible off-take markets.83 These markets (regional and/or sub-regional) are then analysed on the basis of their market uncertainty and the possible level and nature of competition in that market. The uncertainties in the off-take market are mainly related to the following: a. Oil and gas price risks: Volatile oil prices have an impact, albeit with a time lag, on gas
prices in long-term contracts. Gas hub prices may be volatile too, and these may feed into long-term oil-indexed contracts, which also include hub indexation.
b. The availability of substitutes: In the power generation sector especially, gas may have to compete with nuclear energy, coal and even renewable sources of energy. The de-mand for gas is thus affected by the availability of substitute powers sources.
c. Government policies: Government policies regarding the primary energy mix, regula-tory issues as well as the general investment climate (e.g., property rights, rule of law) may all impact the demand for gas.
d. Potential rival behaviour from other suppliers and/or entrants: Other gas exporters, ei-ther through pipeline volumes or by means of LNG, may have an incentive to capture a share in that future growth. The higher the degree of possible competition and the
81 In the model, included in Section 4.3, this trade-off is captured by the commitment versus postponement values.
82 Incomplete information can help explain why firms in practice may delay their entry beyond the breakeven trigger [Smit 2003].
83 Given the research questions posed in this study (see Chapter 1), the focus in this study is on Gazprom’s perspective.

82
higher the growth potential in volume terms, the greater the incentive is to make an early strategic commitment (in order to have a first mover’s advantage). However, if the level of growth potential is uncertain, varying by large degrees, the level of compe-tition is relatively low, meaning that a wait-and-see strategy based on delaying the in-vestment is likely to be a more prudent approach.
e. The degree of concentration: Competition may arise from a large amount of smaller players with small market shares or from few, comparatively large players with large market shares, i.e., depends on the structure of the market. Other players may also be prospecting market entry.
The matrix in Figure 4.1 illustrates the relationship between growth potential and uncer-tainty of demand on the one hand, and likely competition for a given market and/or shares in that market (and with that the level of concentration may vary as well) on the other. As shown in Figure 4.1, high upside demand potential may place emphasis on invest-ing. Investing strategically in an early phase of market development is the case particularly in the presence of likely competition from existing players or entrants and/or when these include large potential players (also see the next matrix below in Figure 4.2). Conversely, low upside demand potential or downside demand risk may do the opposite: place more emphasis on postponement value.84
The figure above basically states that the more fragmented potential competition is, i.e., there are many other existing or potential entrants, the less strategic commitment value a project may have to deter such mostly smaller players. The game theoretical element thus becomes less pressing and postponement of the strategic investment is more likely. How-ever, when competitors consist of few, very large players, or even only one player such that Gazprom would thus be part of a duopoly, then the greater the need to deter their entry. Hence the more oligopolistic the market structure, the greater the potential commitment value from Gazprom’s perspective.
84 The postponement value may rise with increased upside and downside market volatility while the commitment value may also rise relative to the postponement value under increased market volatility. Ultimately, the size of the initial or strategic investment to be made (‘K’ in the model) may also make a large difference between killing a project or giving it a green light to proceed.

83
Figure 4.1 Exploring a pro-active strategy towards new off-take markets
Low concentrationLow commitment value
High concentrationHigh commitment value
Demand
High market volatilityHigh postponement value
Low market volatility Low postponement value
Market structure
Source: own analysis, based on: Smit [1996]; Smit and Trigeorgis [2004]
Commitment value >
postponement value
Commitment value <
postponement value
4.2.3 Gas suppliers: Weighing rival cost structure versus production
capacity
The second consideration, which needs to be taken into account when deciding whether or not to invest strategically and thus commit to a certain market, is weighing the econo-mies of scale in gas transport versus potential upstream gas production capacity. Econo-mies of scale offers the possibility to reduce unit costs, though the extent to which unit costs are achieved depends on a pipeline’s utilisation rate (high utilisation rates lower unit costs): a. High gas production capacity, low average total transportation costs: Suppliers can bring
on-stream large amounts of gas at high economies of scale in transport; b. Low gas production capacity, high average total transportation costs: Suppliers can bring
on-stream smaller amounts of gas at low economies of scale in transport; c. Mismatch between gas production and transport capacity: Suppliers may have much gas
production capacity but a lack of infrastructure, or the availability of infrastructure but a lack of sufficient transport capacity at high economies of scale.
The level and intensity of competition is thus to a large extent determined by economies of scale in both up- and mid-stream production capacity. The matrix in Figure 4.2 ca-ptures this relationship; essentially it is an expression of economies of scale in transport versus upstream gas production capacity. The distance to market, especially for pipeline gas, is also an important factor: the shorter the distance, the greater the impact of pipeline gas in terms of lower unit costs, both in terms of SRMC and Long-Run Marginal Costs (LRMC).

84
Figure 4.2 Exploring the degree of concentration in possible new off-take markets
Low gas
production
capacity
High gas
production
capacity
Transport
High economies of scale
Low economies of scale
Production
Low degree of
concentration
High degree of
concentration
Source: own analysis, based on: Smit [1996]; Smit and Trigeorgis [2004]
4.2.4 Other investment variables
In addition to (1) market uncertainty and (2) possible competing gas suppliers, there are other investment variables to take into account conceptually when deciding whether or not strategic investments are viable or desirable. In addition, when the decision is being made whether or not to enter a specific market, there are other considerations at play than only the construction of mid-stream level projects. Decisions about the mid-stream are, for Russia, equally significant and interlinked with decisions about the development of upstream sources, i.e., across its entire resource base. Indeed one can think of these as ‘value chain’ level decisions involving primarily a portfolio of various ‘production’ possi-bilities. These value chains begin upstream and proceed mid-stream and onwards towards the final customer(s). Ultimately, Russia’s strategy hinges further on how far to integrate vertically, i.e. how close it sells its gas to the final customer. According to Barnes et al. [2006], the following factors have to be taken into account as well, in addition to market uncertainties, in order to explain investment decisions with regard to gas infrastructure:85 a. The general investment climate up- and downstream: Investments in the gas industry,
often involving large up-front investment costs, require a long period of predictable operation in order to recover the original investment and yield acceptable returns. Hence, investors have a large interest in the enforceability of contracts, a stable busi-ness environment (e.g., regulatory, fiscal stability and rule of law) as well as access to capital to finance investment projects via commercial banks and multilateral financial
85 Other considerations, regarding the rationality of decision-makers, may also have an impact on investment decisions; see Section 13.2.2 in Chapter 1.

85
institutions. The domestic security, political and macro-economic contexts in con-sumer and producer countries shape the general investment climate along the value chain.
b. The involvement of transit countries: The existence of transit countries may create sig-nificant obstacles (including permit risks) in constructing viable cross-border gas pipe-lines, but simultaneously create the incentive to invest in transit-avoidance pipelines. Essentially, transit countries have interests that may not necessarily coincide with those of exporting or importing countries. In addition, they may behave opportunisti-cally, because they only have their transit fees (and royalties) to lose. Conversely, tran-sit risks may encourage additional investments in transit avoidance gas infrastructure. Certain international institutions have been established after the collapse of the Soviet Union in an effort to mitigate these risks, an example being the Energy Charter.
c. Geopolitical relationships: According to Barnes et al. [2006], another point of concern is the geopolitical relationship between states and how this influences greenfield in-vestments. The geopolitical and geo-economic relationship between endogenous and exogenous actors can affect the feasibility of investments and thus also the likely mate-rialisation of gas flows. International financial institutions also play a pivotal role in the overall investment framework surrounding gas infrastructure projects (also refer to Section 4.2.5).
4.2.5 Organisational and financial institutionalisation
Ultimately, depending on Gazprom’s position vis-à-vis its competitors (i.e., market out-comes, see Section 4.2.6), different types of organisational institutionalisation of invest-ments can materialise amongst Gazprom and its would-be rivals, mid-streamers, etc. Also, as mentioned above, the financial institutionalisation of projects, as to how the project in question is likely to be financed and at what rate, also has bearing on project feasibility. Financial institutionalisation pertains to the type and source of financing whereas orga-nisational institutionalisation relates to the shape, form and structure mainly of inter-firm and -government agreements. Besides firm-level agreements, as has been argued in Chapter 2 and 3, government-to-government agreements can help institutionalise firm-level trade and investments. In addi-tion, such organisations can reduce risks along the value chain (e,g., transit risks or volume risks in the off-take markets).86 Because of the structure of the gas market (e.g., a region-nally traded commodity and high upfront costs, see Chapter 2), a strong path-dependency in mutual gas relations is a reality with which both producing and consuming govern-ments must deal, by working on a bilateral basis [Goldthau 2010]. This can be done
86 Most of the government-to-government deals are cut on a bilateral basis, although some multilateral institutions try to help institutionalise firm-level trade and investments and reducing risks along the value chain, such as the WTO, the Energy Charter Treaty (ECT) and the EU, for example via the Trans-European Network (TEN) Programs and the agreements and dialogues with third-party countries and regions (see Chapter 10 for multilateral energy cooperation between Russia and Europe).

86
through energy diplomacy, where the government takes on an active role in supporting its (national) firms at home and abroad.87 The role of energy diplomacy is especially impor-tant in an oligopolistic market environment. The aim of government support is not neces-sarily maximising business opportunities, but can also be national security goals. There-fore, diplomatic efforts to strengthen a firm’s presence in domestic and export markets reflect not necessarily identical interests of the government and the firm; see also Chapter 3 [Goldthau 2010]. The success of its organisational and financial institutionalisation, both on government and firm level, has an impact on the ability to realise strategic investments.
a. Organisational institutionalisation: The forms of institutionalisation on firm level are determined to a large extent by the market’s phase of evolution and structure – and as far as the model is concerned – by market outcomes (see Section 4.2.6 below). As already discussed in Chapter 3, De Jong [1989] distinguishes between three forms of institutionalisation on firm level: (1) M&A, (2) joint ventures and/or collusion and (3) direct competition via greenfield investments.
To increase the success of organisational institutionalisation through energy – and more specifically in this context – gas diplomacy, we have made a distinction be-tween ‘vertical’ and ‘horizontal’ gas diplomacy. Vertical gas diplomacy is related to pipeline diplomacy along the value chain, both in the mid- and downstream. In light of the model discussion in Section 4.3, pipeline diplomacy can help to fa-cilitate a firm’s first-mover advantage (i.e., its proprietary position) and to im-prove the change that a firm captures additional market share in a scenario of demand growth. In addition, gas diplomacy can help to reduce other risks, such as transit risk. Horizontal gas diplomacy is related to governmental efforts to sup-port firm’s (bilateral) deals with other gas-producing and exporting firms and/or governments. Horizontal energy diplomacy also pertains to multi-lateral producer organisations such as the Gas Exporting Countries Forum (GECF), OPEC and bilateral gas producer country relations. From the model’s perspective, horizontal gas diplomacy can facilitate forms of supply coordination (i.e., cooperation and/or collusion) and shared investments; see also Chapter 10 Boon von Ochssée [2010].
87 There is no consensus on the definition of energy diplomacy. However, according to Goldthau [2010], “[t]he term commonly connotes the way countries give their energy companies a competitive edge in bidding for resources by using the state’s power: consumer countries strengthen their supply situation by diplomatically flanking energy con-tracts, whereas producer countries use diplomacy to enhance access to markets or reserves”. According to Okano-Heijmans [2010], economic (energy) diplomacy includes a ‘commercial’ dimension and a ‘power play’ dimension (these dimensions are not mutually exclusive per se). For an in-dept analysis on energy and pipeline diplomacy, see for example Zhiznin [2007], Goldthau [2010], and Bahgat [2003].

87
b. Financial institutionalisation: The next issue to be considered in the value chain is the financial institutionalisation of various investment programs geared towards establishing components of the value chain: how will these multi-billion dollar projects be financed and how will the corresponding risks be mitigated? There are differences in applying various business models in up-, mid-, and downstream ac-tivities, as was mentioned in Chapter 2. Large sums of required capital are in-volved for even just one such large-scale production and transportation project.
A firm can finance its projects internal (tap into their own cash flow) and external (rely on external investors and lenders). In general, the government- or state-backed ultimately guarantees debt issued by national gas firms. In some cases, a government authority also guarantees the debt capital of privately owned energy firms [Myers Jaffe and Soligo 2010].88 The traditional means of risk mitigation and financing of large gas supply infrastructures is via long-term take-or-pay con-tracts; also see Chapter 2. Figure 4.3 The general structure of financial flows for Russian gas exports
Source: Komduur [2007, not published] , based on intervi ews.
Copies of contracts placed in warehouse
Gazprom OAO (credit rating: BBB)
Gazpromexport
Guarantees
Volume
Foreign bank deposit s of Gazprom outside
Russian Federation
$
Russian Federation
$
International b anks
International credit market
Contracts
$
$$
$
$
Gazprom’s foreign loans
European off takers:
• E.ON Ruhrgas
• Gaz de France
• ENI/SNAM
• GasTerra
• OMV
• MOL etc.
(Credit rating: (A)AA)
In the specific case for Gazprom, in addition to these take-or-pay contracts, it is using higher credit ratings of Western companies in order to realise better bor-rowing rates for debt via the so-called ‘warehouse’ construction (see Figure 4.3). The contracts between Gazprom and European mid-streamers are incorporated
88 See Myers Jaffe and Soligo [2010] for an in-depth analysis on state-backed financing in oil and gas projects.

88
into a ‘warehouse’, serving as collateral for the financing of the project as well as a source of cheaper credits. As discussed in Chapter 2, self-contracting as a form of new business models en-ables companies to integrate vertically, also resulting in higher financial exposure, because they must access capital markets on the basis of their own credit rating rather on the basis of the rating of their Western partners, i.e., mid-streamers [De Jong et al. 2010].
4.2.6 Possible market outcome scenarios
In accordance with steps 1 and 2 in Sections 4.2.2 and 4.2.3, the last step taken in the conceptual toolbox is making a rough assessment of which market outcomes may result from the situation Gazprom is confronted with in terms of possible entrants and their own characteristics in terms of market power. While the quantitative model leads, in its appli-cation, to its own various game theoretic equilibria, this component of the toolbox is de-signed to translate those equilibria into market outcomes. The application of the toolbox in each case will lead to separate market outcome scenarios after the application of the quantitative model, which itself is preceded by the application of the steps in the toolbox listed and explained above. So while the model uses a stylised approach to describe the various market outcomes in its own game theoretic fashion, the ‘real world’ requires a more loosely defined set of scenarios, which may for example explain situations involving oversupply despite oligopolistic market structures. For example, during the early 2000s the Turkish gas market was characterised by a gas oversupply despite a limited number of players in the market. Gazprom’s decision in each case which may range from investing in commercial projects to investing strategically early on, the following corresponding range of scenarios can result: (1) a (quasi-)monopolist scenario in a given market; (2) a domi-nant firm scenario; and (3) non-dominant or fringe firm scenario. These market outcomes are translated into model outcomes in Section 4.3.4 below, and both the conceptual mar-ket and model outcomes are summarised in Figure 4.7. In each of the three ‘real-world’ scenarios, Gazprom’s various potential rivals in the Euro-pean market are diverse, coming in the form of pipeline gas suppliers as well as LNG, varying largely in market power terms (also see Chapter 9). The competitors in this case may involve different groupings and behaviours: they may act as a ‘competitive fringe’, for example, sharing investments together in common infrastructures or projects (also see below). These competitors can be sub-divided roughly into two loose categories: (1) Fringe and non-dominant players, both pipeline gas and LNG suppliers, and (2) poten-tially dominant players (pipeline gas and LNG suppliers). In all three scenarios, oversup-ply is a real possibility. This is particularly plausible in the case of an economic crisis, which may precipitate a collapse in demand. The possible market outcomes are fed back into the beginning of the decision-making process, as is the case through backward induc-tion in the model, discussed below.

89
In conceptual terms, and in taking the market outcome scenarios a step further, Gazprom can end up in a different position in a number of different scenarios. Gazprom may end up as a dominant firm, on the one hand, and as a non-dominant firm on the other, both at regional and sub-regional levels. Simultaneously, either the industry sees the rise of a buyer’s or a seller’s market for gas as a market condition. The different market outcomes and market conditions lead to different combinations, e.g., Gazprom may become a dominant or non-dominant firm in either a buyer’s or a seller’s market. Each such diffe-rent combination has differing consequences for Gazprom’s investment strategy and merit order.
4.2.7 Interregional prices and shared investments
As was described in Chapter 2, the complexity of interregional gas trade and the nature of gas pricing (i.e., spot or ‘flexible’ volumes versus long-term oil-indexed volumes) preclude an independent pricing framework for gas. As was explained above, the framework used in this conceptual and quantitative model pertains to competition in quantities, not prices, because firms are assumed to compete in capacities before competing in prices in the longer run. In mature markets where excess or over-capacities are built up as firms com-pete for a stronger position in the market over time; firms ultimately are forced to compete through prices as demand growth slows down [Colell et al. 1995]. In order to avoid (interregional) price erosion, firms can engage in shared investments along the gas value chain, both at a regional level (e.g., pipelines) as well as at an interre-gional level (e.g., large-scale LNG projects). Indeed, according to Smit and Trigeorgis [2004] competitors may either act in a contrarian or reciprocating manner. If the competi-tor reciprocates and an investment is shared (such as both parties sharing the advantages of economies of scale of a shared value chain), it can lead to shared strategic benefits such as avoiding price rivalry by adopting a pricing standard, i.e., in the natural gas industry this could correspond to avoiding price competition in the long-run.
4.3 Whether or not to invest strategically: A real-option game model
As an extension of the review of the standard DCF approach, the real-options approach and the game-theoretic, entry-deterrence component captured by the overall net project value (see also equation 3.6), the scene is set to introduce the real-option game model. This is the quantitative, stylised counterpart to the toolbox included in the previous sec-tion. The model consists of a two-stage game involving a duopoly, i.e., Gazprom (the incumbent, or “firm A”) and an entrant or competitor (“firm B”). In stage I, firm A can decide whether or not to invest strategically before the game begins. In stage II, firm B is assumed to take part in the game, after which this entering firm may decide whether or not to invest. Stage II in turn consists of two periods, see Figure 4.5. The stylisation of the model implies that a wait-and-see strategy is a definitive deferral of the strategic invest-ment, which means firm A postpones the option to compete for good.
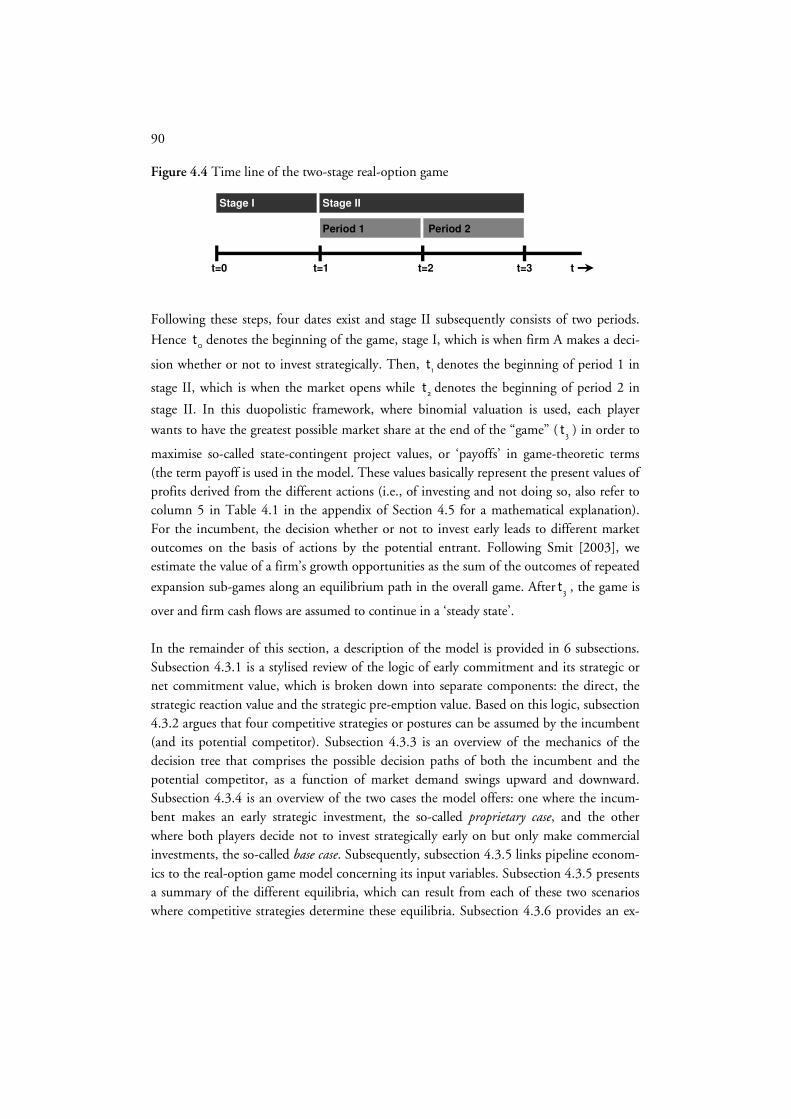
90
Figure 4.4 Time line of the two-stage real-option game
Stage IIStage I
Period 2Period 1
t=0 t=1 t=2 t=3 t
Following these steps, four dates exist and stage II subsequently consists of two periods.
Hence 0t denotes the beginning of the game, stage I, which is when firm A makes a deci-
sion whether or not to invest strategically. Then, 1t denotes the beginning of period 1 in
stage II, which is when the market opens while 2t denotes the beginning of period 2 in
stage II. In this duopolistic framework, where binomial valuation is used, each player
wants to have the greatest possible market share at the end of the “game” (3t ) in order to
maximise so-called state-contingent project values, or ‘payoffs’ in game-theoretic terms (the term payoff is used in the model. These values basically represent the present values of profits derived from the different actions (i.e., of investing and not doing so, also refer to column 5 in Table 4.1 in the appendix of Section 4.5 for a mathematical explanation). For the incumbent, the decision whether or not to invest early leads to different market outcomes on the basis of actions by the potential entrant. Following Smit [2003], we estimate the value of a firm’s growth opportunities as the sum of the outcomes of repeated
expansion sub-games along an equilibrium path in the overall game. After3t , the game is
over and firm cash flows are assumed to continue in a ‘steady state’. In the remainder of this section, a description of the model is provided in 6 subsections. Subsection 4.3.1 is a stylised review of the logic of early commitment and its strategic or net commitment value, which is broken down into separate components: the direct, the strategic reaction value and the strategic pre-emption value. Based on this logic, subsection 4.3.2 argues that four competitive strategies or postures can be assumed by the incumbent (and its potential competitor). Subsection 4.3.3 is an overview of the mechanics of the decision tree that comprises the possible decision paths of both the incumbent and the potential competitor, as a function of market demand swings upward and downward. Subsection 4.3.4 is an overview of the two cases the model offers: one where the incum-bent makes an early strategic investment, the so-called proprietary case, and the other where both players decide not to invest strategically early on but only make commercial investments, the so-called base case. Subsequently, subsection 4.3.5 links pipeline econom-ics to the real-option game model concerning its input variables. Subsection 4.3.5 presents a summary of the different equilibria, which can result from each of these two scenarios where competitive strategies determine these equilibria. Subsection 4.3.6 provides an ex-
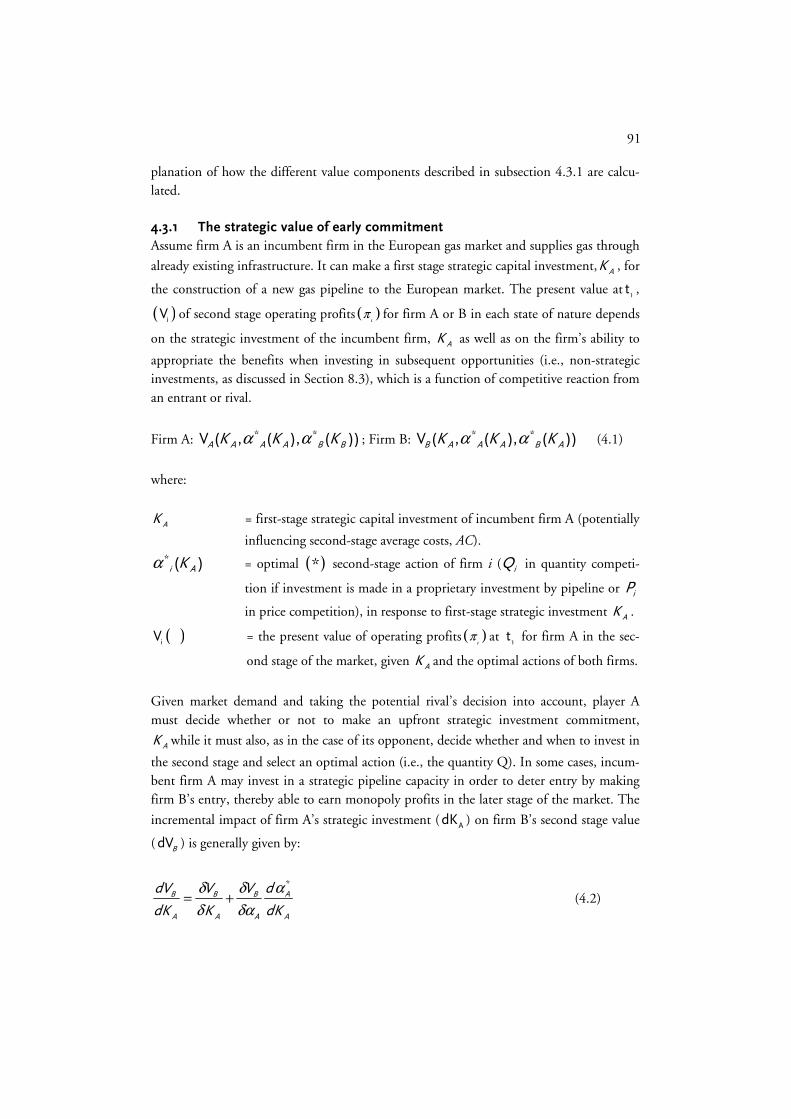
91
planation of how the different value components described in subsection 4.3.1 are calcu-lated. 4.3.1 The strategic value of early commitment
Assume firm A is an incumbent firm in the European gas market and supplies gas through
already existing infrastructure. It can make a first stage strategic capital investment, AK , for
the construction of a new gas pipeline to the European market. The present value at1t ,
( )iV of second stage operating profits ( )ι
π for firm A or B in each state of nature depends
on the strategic investment of the incumbent firm, AK as well as on the firm’s ability to
appropriate the benefits when investing in subsequent opportunities (i.e., non-strategic investments, as discussed in Section 8.3), which is a function of competitive reaction from an entrant or rival.
Firm A: * *V ( , ( ), ( ))A A A A B BK K Kα α ; Firm B: * *V ( , ( ), ( ))B A A A B AK K Kα α (4.1)
where:
AK = first-stage strategic capital investment of incumbent firm A (potentially
influencing second-stage average costs, AC). * ( )i AKα = optimal ( )* second-stage action of firm i ( iQ in quantity competi-
tion if investment is made in a proprietary investment by pipeline or iP
in price competition), in response to first-stage strategic investment AK .
( )iV = the present value of operating profits ( )
ιπ at
1t for firm A in the sec-
ond stage of the market, given AK and the optimal actions of both firms.
Given market demand and taking the potential rival’s decision into account, player A must decide whether or not to make an upfront strategic investment commitment,
AK while it must also, as in the case of its opponent, decide whether and when to invest in
the second stage and select an optimal action (i.e., the quantity Q). In some cases, incum-bent firm A may invest in a strategic pipeline capacity in order to deter entry by making firm B’s entry, thereby able to earn monopoly profits in the later stage of the market. The
incremental impact of firm A’s strategic investment (A
dK ) on firm B’s second stage value
(dVB ) is generally given by:
*
B B B A
A A A A
dV V V d
dK K dK
δ δ α
δ δα= + (4.2)

92
In order to deter entry, firm A must take a ‘tough’ stance that would inflict damage to its
competitor ( 0B AdV dK < ). If entry deterrence is too costly (i.e., the postponement
value being greater than the commitment value) firm A may find it preferable in some cases to follow an accommodating strategy, in which case it would by definition not be making a strategic investment. Firm A’s incentive to make the strategic investment then
depends on the impact of the incremental investment (A
dK ) on its own value from sec-
ond-stage operating profits, i.e.:
*A A B B
A A B A
dV V V d
dK K dK
δ δ α
δ δα= + (4.3)
The commitment value, which is explained in Chapter 3, can be broken up in the direct value, and the strategic reaction and pre-emption values (see Appendix 4.6 for the mathe-matical explanation):
• the direct value pertains to the direct incremental future cash flows resulting from the strategic investment, due mainly to lower marginal cost of production/transportations (gains from economies of scale);
• the strategic reaction value is the strategic value component of the investment which influences a potential competitor’s reaction. This enables the firm to conquer greater market share opportunities (due to a first-mover advantage);
• the strategic pre-emption value corresponds with a strategic investment which can in-fluence the competitive equilibrium at the end of the game or, the game’s final out-come. In some cases this may even involve changing the market structure altogether by deterring entry.
The net commitment value thus has a direct effect on the investment itself by increasing economies scale and a strategic effect expressed by the effect it has on a competitor’s scale of entry, if at all. A net commitment value indicates whether a strategic investment is to be
made at 0t , which may be seen as pursuing a strategic growth investment. The postpone-
ment value indicates at 0t whether a strategic investment should be postponed and that
therefore only commercial investments should be pursued, which may be seen as excising the postponement option rather investing strategically (see above). If the difference be-tween the net commitment value and postponement value is positive, then the incumbent invests; if the difference is negative, then the investment is postponed. The model is an extension of what was described in Chapter 3, namely an approach where standard NPV calculations are enhanced with flexibility options value and the strategic option-game value. This overall value is recapitulated as followed: The overall Net Project value (NPV*) = ‘direct’ (static) NPV + flexibility options value
+ net strategic option-game value (4.5)

93
As was explained in Section 4.2.7, the competitive setting used in the conceptual toolbox and above pertains to quantity competition. However, the real-option game approach can also be applied in a duopoly situation of price competition (see Smit and Trigeorgis [2004]), which goes beyond the scope of this study. 4.3.2 Competitive strategies
This subsection conceptually links the various possible competitive strategies of each player to the market outcomes, which are described in the next subsection. An offensive strategy is directed at undermining a competitors’ payoff in a later stage of the market, seriously impacting its ability to enter the market. An accommodating strategy may involve a deci-sion not to fully engage a potential entrant. The incumbent firm accommodates entry in that it accepts the entering firm’s entry as a fait accompli and merely tries to affect its sub-sequent behaviour. Conversely, as Colell et al. [1995] note, if deterrence is optimal, then even though entry does not occur, its threat nevertheless has an effect on the market out-come, raising the level of firm A’s output relative to a situation in which no entry is possi-ble. The effects of a decision to invest early or not are expressed mathematically in equa-tions 4.3 and 4.4. Based on these strategic effects, four competitive strategies or combina-tions of strategic actions can be imagined, involving competition and/or cooperation through proprietary and shared investments, respectively. The four different strategy com-binations are summarised in Figure 4.6. In the left two cases, competition occurs in vol-ume terms while in the second it occurs in price terms because the potential entrant can act in either a contrarian or reciprocating fashion, respectively. For the conceptual treat-ment of price games in this study, reciprocating competition is included as well, in addi-tion to contrarian competition. 1) Committing and offensive strategy (tough position with contrarian competition): An
offensive strategic investment, for example by building a large-diameter gas pipeline, can generate a proprietary an advantage, translating into a tough position, hurting the competitor’s chances in the second stage of the game. Under contrarian or vol-ume/quantity competition, competition will retreat and the incumbent firm can ex-pand its share and gain leadership as the market grows. At lower relative demand the competitor’s profit value is negative, and the incumbent firm may even enjoy mono-poly rents.
2) Flexible and offensive strategy (accommodating with contrarian competition): Under contrarian competition, a new entrant may take advantage of the incumbent’s ac-commodating position and capture most of the shared benefits of a strategic invest-ment. According to the model, there is no strategic advantage to pre-commit invest-ment since it would offer a rival firm with the opportunity to free ride on the incum-bent’s initial investment, if shared (see also subsection 4.2.1). In order to prevent the creation of valuable shared opportunities for the competition, the incumbent should maintain an offensive posture by postponing its investment (postponement value), all the while maintaining its option to invest at a later stage (maintaining managerial

94
flexibility value). In case future demand grows, two identical competitors would choose to invest simultaneously. If demand declines, both would abandon the market.
3) Flexible and inoffensive strategy (tough with reciprocating competition): A tough posi-tion through a strategic investment may hurt competition but can induce a tough re-action by a reciprocating competitor, which can result in intensified rivalry. Here competition would take place through prices. To avoid such intense second-stage competition, the firm will not invest in an early strategic investment, remaining flexi-ble and inoffensive. If demand develops later, both firms can invest, resulting in a du-opolistic price equilibrium.
4) Committing and inoffensive (accommodating with reciprocating competition): Now suppose that early strategic investment will also benefit demand for the competitor, who is ready to reciprocate. The incumbent firm should invest in the strategic project and be accommodating in a later stage of the market development, avoiding price competition, reaping shared benefits in the process. Though maintaining high prices and higher profit margins, both firms can enjoy more profitable follow-up invest-ments. The incumbent firm could act as a dominant player, with the competitor fol-lowing suit. Compared to the base case (see subsection 4.3.3), a strategic investment has positive strategic reaction and coordination effects but at the same time implies a flexibility loss (i.e., foregoing of postponement value).
Figure 4.5 Sign of strategic effect and competitive strategies under different position and competition
Contrarian(down-sloping
reaction/substitutes)
e.g. quantity competition
Reciprocating(up-sloping
reaction/complements)
e.g. price competition
Committing and offensive
Invest (strategic effect)
(Monopoly profits or duopolistic quantity competition)
Inc
um
be
nt
(Fir
m A
)
Tough positione.g. proprietary investment (hurt competition)
Accommodatinge.g. shared investment (benefit competition)
Competitor or potential entrant (Firm B)
Postponing and inoffensive
Do not invest
(postponement effect)
(Duopolistic price competition)
Postponing and offensive
Do not invest
(postponement effect)
(Duopolistic quantity competition)
Committing and inoffensive
Invest (strategic effect)
(Leader-follower/collusion or duopolistic price competition)
Source: adapted from Smit [1996]; Smit & Trigeorgis [2001].
Net commitment value > postponement value
Net commitment value < postponement value

95
4.3.3 The base case versus the proprietary case
Depending on which competitive strategy the incumbent and the entrant take in quantity terms, a base case and a proprietary case may result. In the base case, both the incumbent and the entrant do not invest strategically but rather invest only commercially against relative high operating transport costs per unit (see also subsection 4.3.5). By contrast, in the proprietary case the incumbent makes a strategic investment, for exam-ple by building a large-diameter pipeline. A large-diameter pipeline results in lower ave-rage operating transport costs per unit vis-à-vis the competition. In the case of shared investment (see subsection 4.2.1), the incumbent makes an upfront investment which it then shares with the entrant. This implies a mutual decrease in the operating transport cost per unit. For this research, shared investments are not taken into account as a possi-bility in the real-option game model. 4.3.4 Model outcomes, demand moves and the decision tree
Each different combination of strategic choices made by firm A, the incumbent, and firm B, the competitor, leads to various combinations of quantities supplied, profits and state-contingent project values for both firms. Table 4.1 (see the appendix in Section 4.6) con-tains the formulae needed to compute equilibrium quantities, the final profits and corre-sponding state-contingent project values. Each such combination corresponds to a differ-ent model outcome within this duopolistic market setting. It is useful to describe the es-sentials of these model elements in a step-by-step fashion, starting with the various model outcomes and moving on to the workings of the model’s so-called decision tree. Model outcomes Essentially, each market outcome (described conceptually in subsection 4.3.6) corresponds with various game-theoretic equilibria resulting from the interaction between the two firms in the model. Each equilibrium in the game is essentially a Nash equilibrium, where each firm pursues its own dominant strategy given what the other firm does. Because the game is based on interaction between two players, the market structure of the game re-mains duopolistic, in principal. However, at the end of the game (i.e., model outcomes), firm A and/or B may not remain in the market, which changes the overall market struc-ture at that stage. Changed market structures are implicitly valued for both firms in the state-contingent project values. Game theory prescribes to such situations various equilibria or outcomes, in which one or the other firm ‘ends’ the game in a certain position vis-à-vis the other firm. These equili-bria in the model can be described intuitively as various market structures in a two-firm world (see also Figure 4.6). In other words, in a duopoly, these outcomes explain the ba-lance of power between only two firms. We refer to these market structures as outcomes rather than structures, in order to avoid confusion, given the duopolistic nature of the model. Since a discussion about game-theoretic equilibria is beyond the scope of the ap-

96
plication of the real-option game model here, an intuitive description will suffice at this stage.89 Each type of market outcome hinges on the quantities supplied respectively by the two firms. These quantities vary according to the various combinations of actions taken by the two players (in terms of investing commercially or not in stage II, or also investing strate-gically or not in stage I, i.e., base versus proprietary case). Following mostly textbook in-dustrial organisation economics and game theory, this can be represented graphically by means of a figure depicting the so-called reaction curves of both firms, see Figure 4.6. Figure 4.6 Graphical representation of quantity competition90
Source: Smit and Trigeorgis [2004].
Action of firm B
(QB)
Action of firm A
(QA)
RA(αB)
RB(αA)
C
S
πB=0
πA= const.
α*A
α*B
B’
M
RA(αB)
RB(αA)
C
S
πB=0
πA= const.
α*A
α*B
B’
M
Influence of proprietary investment of firm A on its reaction curve
The two firms react to each other’s supply decisions, which are represented graphically by their reaction curves. Each firm’s reaction curve (RA for firm A and RB for firm B) repre-sents what it supplies given what its competitor produces, and is determined by solving the two firms’ production functions. The reaction curves can also be derived by determin-ing a firm’s iso-profit curve, a curve that represents the combinations of output that will
89 This is the case since essentially the research objective calls “only” calls for applications of the model, in order to provide insights that serve the research questions as mentioned in Chapter 1. The game-theoretic concepts nevertheless remain fundamental to understanding the link between model outcomes and the state-contingent project values. For a theoretical background on these game theoretic concepts, see for example, Tirole [1998] and Dixit and Nalebuff [1991], Colell et al. [1995], Rasmussen [2001] and Jacquemain [1987].
90 In a situation of reciprocating (Bertrand) competition, the reaction curves would be upward-sloping (e.g., price competition), see also Smit and Trigeorgis [2004]. For a more complete explanation of the various model outcomes and a more detailed explanation of the graph produced in Figure 4.8, see Figure 4.6 in Smit and Trigeorgis [2004], p. 195.

97
generate the same level of profit (iso-profit) for each firm.91 The farther a firm’s reaction curve is from the axes in the graph, the greater is its share of the market, and hence the greater its profits. The model outcomes should be interpreted at the end of stage II, where investment actions by firm A in stage I or by either of the two firms in stage II can lead to: 1) A duopoly outcome92 with two firms that roughly supply a similar portion of the
market (which is represented by point C in Figure 4.6) because they both end up in-vesting accordingly in such an outcome. This is represented in the decision tree (see Figure 4.8) and elsewhere by the letter ‘C’ (i.e., C for Cournot duopolists).
2) A monopoly for firm A on the one hand, where firm B is deterred from the market entirely, or on the other hand, where the converse is the case (which is represented by point M in Figure 4.6). This is represented in the decision tree and elsewhere by the letter M. For firm A, a monopoly for B means firm A deferred investment in both stages of the game while firm B invested, a market outcome denoted by the letter ‘D’ for deferral (also see Table 4.1 in the appendix).
3) A leader-follower outcome93 for firm A where it ends as a dominant firm (i.e., the leader) and where firm B invests in such a way that it ends as a non-dominant firm (i.e., the follower). This model outcome is represented by ‘S’ for firm A in Figure 4.6 and in the decision tree in Figure 4.8. In Figure 4.6, an outward shift of firm A’s reac-tion curve is a result of quantity competition in stage II, based on a strategic invest-ment made in stage I by firm A. Elsewhere in the text and throughout text pertaining to applications of the model, this outcome is represented by S-L for the leading firm and S-F for the following firm (this is applicable to both firms).
4) An outcome in which both firms defer their investments in both stages of the game, denoted by the letter ‘A’ in Figure 4.8 (i.e., A for abandon).
Figure 4.7 provides an overview of the different possible scenario market outcomes as discussed in Section 4.2.6 and their translation into model outcomes, which was discussed above. While Figure 4.7 includes the game-theoretic terms associated with these model outcomes, they are used here merely to illustrate the link between the toolbox and the model in terms of the outcomes.
91 There is a different iso-profit curve for each level of profit. The parabolic iso-profit curves drawn above are combina-tions with a higher quantity for the competitor (firm B), and consequently a lower profit for firm A.
92 This corresponds with a Nash-Cournot model outcome, see Figure 4.7.
93 This corresponds with a von Stackelberg Leader-Follower model outcome, see Figure 4.7.

98
Figure 4.7 Gazprom’s market outcomes in scenarios and model terms
• Market share of between 70-100 percent
• Competitor(s) are either non-dominant or fringe players with a share of between 0 and 30 percent
• The incumbent builds capacity early such that it is unprofitable for the competitor to enter
(Quasi-) monopolist
Dominant position
Note: the model-based market outcomes refer to equilibrium results from economic game theory. Section 4.3 provides an explanation of these results.Source: own analysis, based on Smit and Trigeorgis [2004]; De Jong [1989].
Monopolist
Von Stackelbergleader (S-L) or Nash-Cournot (C)
• Market share of between 30-70 percent
• Competitor(s) can be dominant, non-dominant or fringe players with a share of between 30 and 70 percent
• S-L: The incumbent invests first in a project and its competitor invests in a later period.
• C: Both firm invest simultaneously
Fringe/non-dominant position
Von Stackelbergfollower (S-F)
• Market share is less then 30 percent
• Competitor(s) take a quasi-monopolist, dominant and/or non-dominant firm position
• S-F: The incumbent ends up investing later in a (commercial) project while the entrant itself invests commercially before the incumbent does so.
• This outcome is the converse case of S-L (see above)
Market outcomes – model Market outcomes – scenarios
The decision tree Through the use of a decision tree (Figure 4.8), each of the strategy combinations men-tioned above in Subsection 4.4.2 and the model outcomes can be visualised. Each of these outcomes is tied to the valuations of the relevant investments (valued through the state-contingent project values), both initial as well as follow-up ones. The tree uses binomial real option valuation to compute the state-contingent project values. Figure 4.8 contains the binomial valuation tree, the letters at the bottom of which (i.e., at the ends of the
branches at 3t ) correspond with the model outcomes.
Demand moves The values or numbers lodged at the bottom of the decision tree are the state-contingent project values resulting from the competitive strategies each of the two firms can take (see Figure 4.6 for an overview of the various competitive strategies the two firms can take). The tree structure conveys the two-stage uncertainty and decision structure of the model, which has been described in subsection 4.3.1. The nodes at the bottom end of the branches in the tree contain the values of the various actions as a function of resulting model outcomes at the end of each period in the second stage, which in turn result from the decisions of each player (as described above). These values ultimately determine whether or not firm A is to make a strategic investment decision or not.

99
The state-contingent project values are factored into risk-neutral backward valuation for-mulae used to calculate values of investing and/or deferring under binomial upward and downward movements of demand between periods 1 and 2 (these formulae are included in the bottom half of Table 4.1 in the appendix, Section 4.5), discounted using a risk-free interest rate, r . This is the relevant rate within the applied approach of risk-neutral valua-tion. The approach has been described in Section 3.7.2 and is visualised by means of the decision tree in Figure 4.8 below. The state project values themselves are based on the equilibrium quantities derived from the relevant calculation framed in Table 4.1 (see Sec-tion 4.5) and are discounted back to t=0 as long-term expected cash flow annuities at end
of period 2 (at a risk-adjusted discount ratek ).
Figure 4.8 The two-stage game in extensive form under different market structures
Do not invest/wait (base case)
Make strategic investment Commitment (KG)
θθθθ
u
A
I D
B B
d
θθθθ θθθθ
I D I D
θθθθ
DI DI DI DI
du du du
B B A A A
DI DI
DI
B B
A
DI DI
DI
B B
A
A
I D
B B
θθθθ θθθθ
I D I D
θθθθ
DI DI DI DI
du du du
B B A A A
DI DI
DI
B B
A
DI DI
DI
B B
C M M A C M M A C M M AC M M AS M S M S M S M S M S M S M S M
C C
Sta
ge
II
Sta
ge
I
Pe
rio
d 2
Pe
rio
d 1
Notes: A or B ( ) represents a decision to invest (I) or defer (D) by firm A or B. θ ( ) represents the state of market demand or nature’s up (u) and down (d) moves.The combination of competitive decisions (from both A and B) and market demand (θ) may result in one of the following market structure game outcomes:C: Cournot Nash quantity competition equilibrium outcome (cf. Appendix 4.1)S: Stackelberg leader (S-L)/follower (S-F) outcome (cf. Appendix 4.1)M: Monopolist outcomeA: Abandon (0 value)D: Defer/stay flexible (option value) Source: Smit and Trigeorgis [2004].
When both firms decide to invest simultaneously, (I,I), the game ends in a duopolistic competitive equilibrium (C). When both firms choose to defer, (D,D), under low realisa-tions of demand, the nature of demand (θ ) moves again and the game is repeated in a sub-game. The different outcomes of each game and sub-game imply different state-contingent project values (for the different sets of firm actions, investing or not) at the end of each branch (node) in the binomial valuation tree, representing equilibrium outcomes: duopolistic competitive equilibrium competition, a duopolistic leader/follower outcome,

100
monopoly, a deferral in period 1 (which is ‘not yet’ a market outcome), and an abandon outcome; see also subsection 4.3.6. In the end, the model aims to answer the question as to whether the incumbent is to invest strategically or not at the outset of the first stage of the game. The final equilibrium out-comes resulting from strategic interaction at the end of each sub-game (i.e., each “path” through the tree) are used to reason backwards towards the first branches in order to pro-vide outcomes for the net commitment and flexibility values of the strategic investment. The stage II sub-game equilibrium outcomes are dealt with first, used to calculate optimal actions along the different branches of the tree backwards towards the initial point of deci-sion in stage I. The direct, strategic and postponement values of the strategic investment are then calculated on the basis of various quantity outputs and corresponding profit lev-els; see the appendix in Section 4.6. The stylised model formalises the relationship between the notions and attaches to the net commitment value its own components. 4.3.5 Input variables from the perspective of the gas industry
Pipeline economics are based on CAPEX, OPEX and are also subject to the pipeline’s utilisation rate and ramp-up period, see also Chapter 2. The CAPEX cover mainly the costs of building a pipeline (e.g., steel costs etc.), and the costs of building compressor facilities. The OPEX covers mainly the costs of maintaining the compressor and pipeline facilities for operational use. In addition fuel costs are taken into account. The economic lifetime of a pipeline investment is assumed to be 25 years. Below one can find an expla-nation and a calculation approach of a number of input variables from the perspective of the gas industry, in order to make gas infrastructure investments useable for a real-option game model.
• Calculation of the average operating transport cost (c): In order to calculate the average operating transport cost, the cash flows of operating costs (i.e., OPEX and fuel costs) are discounted over 25 years with the cost of capital (i.e., WACC). The present value of the operating costs is divided by the present value of the pipeline’s volumes multi-plied by the price index (i.e., in order to correct it for economies of scale). Both the price index, and the cash flows of costs are corrected partially for inflation.94 For sim-plicity, the calculations exclude any form of taxation. We assume the OPEX at 1.5 percent of the CAPEX of the pipeline and 3 percent of the CAPEX of the compres-sion facilities at yearly basis. The fuel costs per year are calculated through the fuel us-age by full capacity (i.e, 1160 mcm/y95; corrected with the utilisation rate) to the
94 According to expert interviews, inflation is partially passed on, defined as the indexation tariff (in this research assumed at 25 percent). This tariff increases marginally during time according to a specific formula.
95 The fuel usage by full capacity is calculated as follows: (MWpower/efficiency of compression in percentage)*(number of hours generator is working yearly/caloric value of gas in MJ/cm)*0.0036 = (564/0.35)*(8000/40)*0.0036= 1160 mcm/y.

101
power of the fuel versus flow ration (i.e., 1.5), multiplied by the gas price (corrected partially for inflation). In order to determine the gas volumes per year, we assume a technical ramp-up phase with an utilisation rate of 20 percent at year 1; 40 percent at year 2; 60 percent at year 3; 80 percent at year 4; and 100 at year 5.
• Calculation of the strategic investment (K) and commercial investment (I) from the theo-retical and project CAPEX: As mentioned above, a large part of the investment has to be realised upfront via the CAPEX of pipeline and compressor facilities. Generally speaking, it can be assumed that the CAPEX of a pipeline is 70 percent of the total CAPEX, while the CAPEX of compression 30 percent.
In order to define the CAPEX, public data will be used when applicable. In other cases, a theoretical CAPEX will be calculated for the pipeline section, and added with a CAPEX component of compression. In general, the CAPEX of a pipeline scales with the diameter of the pipeline, while the capacity of a pipeline scales with more than the square of the diameter [Correljé et al. 2009]. The throughput of a natural gas pipeline is thus a function of a pipeline’s diameter. An increase in the diameter of the pipeline generates an exponential rise in additional throughput capacity. This is an important determinant of economies of scale in pipeline economics; see above. According to ex-pert interviews, a constant factor (i.e., an average theoretical derivation) is derived from the relation between the diameter and the capacity (i.e, 0.0013).96 The average CAPEX of a pipeline is assumed to be 43 euro/inch/meter.97 The next step is to define the variables K and I. In the model, the variable I corre-sponds with investments pertaining to small-diameter pipelines with a short, technical ramp-up phase, i.e., a 8 bcm/y pipeline (with the same distance in case of a proprie-tary investment). By contrast, in the proprietary case the incumbent makes a strategic investment by building a large-diameter pipeline in order to lower the average operat-ing transport costs. The strategic investment, with a lower potential utilisation level under various market conditions, is denoted by K. As such, in modelling terms, a stra-tegic investment K can be defined as the difference between the total CAPEX for the
96 The theoretical formula according to Davis [1984], 2.55 2
( )T d d d= = , is adjusted by the constant factor, so that
the diameter of a pipeline is:
1
2.5
0.0013
Capd =
, where Cap = throughput capacity; and d = the diameter of the
pipeline).
97 For simplicity, offshore and onshore piplines are assumed to bear the same costs in terms of euro/inch/meter in this analysis.

102
large-diameter pipeline investment (e.g., the Nord Stream) and the ‘theoretical’ CAPEX for the investment of a 8 bcm/y pipeline (I), i.e., K – I.98 In a specific case, when the incumbent does not invest commercially (I=0) in either periods 1 or 2, a deferral and/or abandon outcome results, respectively. However, the incumbent invests in K at the beginning of the game. If in the end, the incumbent has invested K but did not actually use this strategic investment, K may be seen for the fu-ture as a comparatively cheap option, which requires a correction in the model. For this reason the incumbent is ‘punished’ in the model’s outcomes with the subtraction of a commercial investment amount (I) from the state-contingent project values at the
end of period 2, at �t . This substration is also made in order to come to a ‘correct’ to-
tal CAPEX for the gas pipeline project. This exceptioin holds for situations in which firm A did not invest commercially in periods 1 and 2.99
• Calculation of the theta at t=0 ( 0θ ) and u and d: For the purpose of this research, the
initial market demand 0θ is a function of the increasing gap between gas market de-
mand and volumes supplied through long-term contracts and indigenous production. As long-term gas contracts expire and indigenous production declines, combined with possible increase demand, additional demand or market opportunities are manifested,
thus increasing 0θ . New capacity (e.g., in the form of pipelines to be built by firm A
and/or firm B) is built based on and designed to capture this ‘widening gap in the
market’. In the model’s applications, 0θ is computed by taking an average of the dif-
ference between the level of demand and contracted volumes added to indigenous production per year. This amount is then discounted at the risk free rate. This is done in order to account for time value differences in market demand since satisfying de-mand today is worth more than doing so tomorrow.
In the model, demand is assumed to be stochastic, moving up or down with binomial
parameters u and d (where 1/d u= ). In light of the conceptual discussion above, we
assume the upward potential (which in the model as2 u× ) to coincide with an up-ward demand scenario after 25 years. For simplicity in the model, we define 2 u× as
the highest level of demand ( 2θ ) reached at 3t (see Figure 4.4). Starting at
3t , there is
98 Other options for defining K in gas industry terms have also been considered. This includes the aggregated opportu-nity costs arising from lower infrastructure utilisation levels under lower market demand conditions within the model (as a result of upward and downward moves in market demand). These opportunity costs in all the various outcomes at the end of the first and second periods of the game would then be valued back up through the tree through binomi-nal risk-neutral valuation. This results in an amount, which is equal to ‘K’. For simplicity after consulting experts, the ‘total CAPEX-I’ approach was opted for.
99 In reality, when a firm did not actually use a strategic investment, it can possibly abandon investments in compres-sion facilities.
103
a ‘steady state’ over 25 years, i.e., no more upward and downward moves. The data used as input in conceptual reasoning act as an annuity involving approximately linear growth. However, for simplicity given the purpose of the model, this is translated into the binomial evolution of demand periods 1 and 2 in stage II, with a steady state af-
ter3t .
• Maximum capacity of new pipeline investments and Qi: In a number of market out-comes in period 1 and/or 2, quantities supplied by both the incumbent (e.g., for firm A’s strategic investment in a proprietary case), and the competitor (e.g., for firm B’s commercial investment) may exceed the pipeline capacity of their investment, i.e.,
,A B MAXQ Q> . For example, as a dominant firm or a monopolist in a market outcome,
firm A may supply a quantity greater than the theoretical capacity of its strategic pipe-line investment in order to achieve this market position. As is explained in the concep-tual sections of the cases in Chapter 11, both the incumbent and its competitor are as-sumed to be supplying a given market through existing infrastructure. With the fall in flows provided through long-term contracts, existing pipeline infrastructure utilisation
falls gradually. When additional infrastructure is built, and ,A B MAXQ Q> in various
market outcomes, it is assumed that firm A and/or B can supply gas through already existing infrastructure (because of falling, already contracted supplies). When an ac-tion on the part of the incumbent squeezes the competitor out of the market, it is also assumed that the competitor’s infrastructure hereby becomes redundant.
Ultimately this formalised combination is a quantitative assessment of strategic invest-ments in the face of demand uncertainty and the impact of potential entry (and/or other actions) by a competitor. The stylised model fits into the toolbox where its quantitative essence is lodged inside a qualitative framework. A schematic overview of the conceptual toolbox and its relationship with the stylised model is provided in the Figure 4.9.

104
Figure 4.9 The conceptual toolbox and the stylised model
Position towards competition
Co
st
str
uc
ture
Pro
du
cti
on
c
ap
ac
ity
Market uncertainty
pri
ce
v
ola
tili
ty
Vo
lum
e
un
ce
rta
inty
Core (strategic) investment indicators
Other (strategic) investment indicators
General investment climate
• Domestic security and political context
• Domestic macro-economic context
• Rule of law
• Stability of regulatory, policy, and fiscal regime
• Structure/set-up of gas industry
Involvement of transit countries
• Number of transit countries (ownership structure)
• Risk of interruption of infrastructure and alternative routes
• Transit costs/tariffs and permit risks
Geo-economic and political relationships
• International institutional links
• Littoral & transit states
• Foreign & geostrategicpolicies of imp. players
• Ability of these actors to influence gas flows
• Mergers and Acquisitions
• Joint ventures or collusion
• Direct competition via greenfield investments
Financial feasibility
• Availability of financial resources
• Actors such as commercial banks and multilateral financial institution
• Guarantees from businesses and/or governments
Source: own analysis, based on Smit and Trigeorgis [2004]; Victor et al. [2006]; De Jong [1989].
Position towards competition
Market uncertainty
Core indicators of stylistic model
Organisational feasibility
Real-option approach
Postponement value
Game theory
Commitment value
4.4 Conclusion
The conceptual toolbox and the stylistic real option game model comprise a framework designed to analyse the issue of strategic investments. The real-option game model shows that pipelines with high economies of scale over longer distances can serve as tools to pre-serve or expand market share. Strategic investments are fundamentally different from commercial investments, the latter pertaining to pipelines with a more optimal utilisation profile. Investments may be proprietary or shared. The conceptual toolbox is designed to take into account those factors which cannot be taken into account quantitatively when assessing whether or not to invest strategically. These include the general investment climate, geo-economic and geopolitical relation-ships, difficulties involved in transit countries as well as organisational and financial feasi-bility of investments. Market demand uncertainty in terms of volumes and prices, as well as the nature of competition is also taken into account conceptually in the toolbox. The stylised real-option game model acts as a supplement where demand uncertainty and rival moves are taken into account more formally by quantitative means. The model’s added value lies in its mathematical underpinning for a more intuitive understanding of strategic investments. This value lies in its exact application, where the toolbox is more conceptual. The various outcomes yield preferences, expressed by large-scale investments from the perspective of this model, the ultimate aggregation of which helps determine the merit

105
order. Ultimately, the model also helps explain how gas suppliers may lean towards a ten-dency to compete on the one hand and cooperate on the other. 4.5 Appendix to Section 4.3
In Table 4.1, the equilibrium quantities, profits and state project values are in-cluded for the various market structures under contrarian (Cournot) quantity competition, based on the equilibria outcomes mentioned in Section 4.3.6 and 4.4.5. The formulae are derived from Smit and Trigeorgis [2004].
Smit and Trigeorgis [2004] attain higher values for the state-contingent project values due to the fact that they discount profits (see column 4 in Table 4.1 below)
simply by the variable �
, which implies that profits are discounted as perpetui-ties. The state-contingent project values have thus been adjusted because infra-structural investments in the gas world typically have a lifetime of 25 years.100 Therefore, rather than allowing the cash flows to take place in the form of a per-petuity, the state-contingent project values are discounted for that length of time by multiplying the contingent state project value by:
( )25
11
1 k−
+
, where k is the risk-adjusted discount rate.
The value components of the total net commitment value and the overall NPV The total net commitment value of gas infrastructure investments is broken down into three parts and calculated as follows: 101
1. a direct value resulting from direct reduction in future operating costs (i.e., economies of scale). The direct value is calculated from the reaction curves as explained in Section 4.4. (see Figure 4.7 of Section 4.3.6), re-
ducing ic to the cost level derived from the strategic investment (for the
incumbent):
Solve1
( ) ( )2
A B t A BR Q c Qθ= − − for QA (QB is known from the base
case), then solve the Cournot proprietary profit function: 2[( ]A t A B A Ac Q Q Qπ θ= − − − where cA < cB.
100 A constant perpetuity is an annuity that has no definite end, that is, a stream of expected cash flows that continues forever.
101 For the exact mathematical application and break down of the commitment and postponement values, refer to the quantitative numerical application of the model in Case study 1 in Chapter 11.

106
Then AVk
π= determines the direct profit value while subtracting from
this the base case profit value determines the direct value (because the base case reflects the situation in which both parties do not invest strate-gically).
2. a strategic reaction value reflecting the impact of the strategic investment made by the incumbent on the competitor’s reaction curve and profit value for a given market structure. It is obtained by subtracting the di-rect profit value from the total profit value (the total profit value func-tion used depends on the dominant equilibrium in question):
E.g., 2
/9
t A Bc ck
k
θ π− +−
.102
3. a strategic pre-emption value resulting from deterring competitive entry and causing a change in the market structure altogether (i.e., gaining a Stackelberg leader or monopoly position instead of a Nash-Cournot one). It is calculated simply by subtracting the resulting project value from the project value under a Nash-Cournot outcome.
Ultimately, the overall net project value described conceptually in Chapter 3, in the value components of expression 3.7, translates in model terms to the overall NPV (NPV*):103
NPV* = base case NPV + [-KA + (direct value + strategic reaction value + pre-emption value)] + postponement value (4.6)
102 Remember that the model assumes a duopoly. This implies that the total value to be gained by players in the market is to be distributed exclusively among the two firms (firm A, the incumbent and firm B, the competitor).
103 Also see Chapter 11 for an application of the formula described above.

107
Tab
le 4
.1 E
quili
briu
m q
uant
itie
s, p
rofit
s an
d st
ate
proj
ect
valu
es f
or v
ario
us m
arke
t st
ruct
ures
und
er c
ontr
aria
n (C
ourn
ot)
quan
tity
com
peti
tion
in
the
sec
ond
stag
e A
ctio
n10
4 M
odel
ou
tcom
e E
qu
ilib
riu
m q
uan
tity
Equ
ilib
riu
m p
rofi
t105
Sta
te-c
onti
nge
nt
Dem
and
sta
te
p
roje
ct v
alu
e106
(A, B
)
C/M
/S/A
/D10
7 *i
Q
* i
π
iNPV
t
θ
Sec
ond
-sta
ge g
ame
in p
erio
d 2
(co
ntin
ued
on th
e ne
xt p
age)
Nas
h C
ourn
ot (
N)
() (
)(
)(
) ()
2
22
1
ti
jt
j
ij
cq
c
θθ
−+
−−
++
−
()2
2
9
ti
jc
cθ
−+
(
)2
2 9
ti
jc
cI
k
θ−
+−
3
2i
jkI
cc
≥+
−
M
onop
olis
t (M
) (
)0
2ti
j
icQ
q
θ−
=+
()
()
2
04
ti
j
cθ
π−
≤
()2
4
ti
cI
k
θ−
−
3
2j
ikI
cc
<+
−
() (
)(
)(
) ()
2
22
2
ti
jt
j
ij
cq
c
θθ
−+
−−
++
−
()2
2
8
ti
jc
cθ
−+
(
)2
2'
8
ti
jc
cI
k
θ−
+−
4
2j
ikI
cc
≥+
−
104 D
urin
g pe
riod
1, t
he d
enot
atio
n (A
, B)
mea
ns th
at fi
rm A
took
act
ion
A w
hile
com
petit
ion
firm
B to
ok a
ctio
n B
. Dur
ing
the
enti
re s
econ
d st
age
the
deno
tati
on (
AA
’, B
B’)
mea
ns th
at fi
rm A
to
ok a
ctio
n A
in p
erio
d 1
and
A’ i
n pe
riod
2, w
hile
firm
B to
ok a
ctio
n B
in p
erio
d 1
and
B’ i
n pe
riod
2.
105 C
alcu
late
d fr
om(
)i
ii
iPQ
CQ
π=
−,
assu
min
g fo
r si
mpl
icit
y0
ij
q=
==
. In
the
app
licat
ion
of t
he m
odel
, ,
0A
Bq
q≥
, th
at i
s: w
hen
mod
el o
utco
mes
are
neg
ativ
e, t
hey
are
assu
med
to e
qual
zer
o, b
ecau
se fi
rms
do n
ot p
rodu
ce n
egat
ive
quan
titie
s.
106 T
his
stat
e-co
ntin
gent
pro
ject
val
ue i
s de
term
ined
in
the
last
sta
ge f
rom
()
max
,0i
iNPV
kI
π=
−,
whe
re
iπ
is a
per
petu
ity
cash
flo
w s
trea
m,
I is
the
req
uire
d ou
tlay
and
k th
e ri
sk-
adju
sted
dis
coun
t ra
te. I
n th
e fir
st p
erio
d, t
he s
tate
-con
ting
ent
proj
ect
valu
ee m
ay b
e de
term
ined
fro
m f
utur
e ex
pand
ed (
stra
tegi
c) n
et p
rese
nt v
alue
in t
he u
p an
d do
wn
stat
es u
sing
bac
kwar
d bi
nom
ial r
isk-
neut
ral v
alua
tion
. Whe
n A
or
B m
ake
an in
vest
men
t (I
) in
the
sec
ond
peri
od I
’ mus
t be
sub
trac
ted
in o
rder
to
calc
ulat
e th
e st
ate-
cont
inge
nt p
roje
ct v
alue
oth
erw
ise
this
doe
s no
t ap
ply.
107 M
odel
out
com
e sy
mbo
ls: C
: Cou
rnot
duo
poly
, M: M
onop
oly,
S: S
tack
elbe
rg L
eade
r or
Sta
ckel
berg
Fol
low
er, A
: Aba
ndon
, D: D
efer
.
(DI,
DI)
; (I
I, I
I)
(DI,
DD
);
(II,
DD
)
(II,
DI)
Sta
ckel
berg
Le
ader
(S-
L)/
M
onop
olis
t (M
)
(4
2)
ji
kI
cc
<+
−

108
Act
ion
M
odel
ou
tcom
e E
qu
ilib
riu
m q
uan
tity
Equ
ilib
riu
m p
rofi
t Sta
te-c
onti
nge
nt
Dem
and
sta
te
p
roje
ct v
alu
e
(A, B
)
C
/M/S
/A/D
*i
Q
* i
π
iNPV
t
θ
32
4
tj
ic
cθ
−+
(
)2
3 16
tj
ic
cθ
−+
(
)2
32
16
tj
ic
cI
k
θ−
+−
4
32
ji
kI
cc
≥+
−
(DD
, DD
) A
band
on (
A)
0
0
0 P
erio
d 1
(I, I
)
Nas
h C
ourn
ot (
N)
() (
)(
)(
) ()
2
22
1
ti
jt
j
ij
cq
c
θθ
−+
−−
++
−
()2
2
9
ti
jc
cθ
−+
(
)2
2 9
ti
jc
cI
k
θ−
+−
2ti ic q
θ− +
(
)2
4
ti
m
cθ
π−
=
()
**
1
11
ud
mpV
pV
Ir
k
π+
−−
++
+
Def
er (
D)
0
0
()
**
1
1
ud
pNPV
pNPV
r
+−
+
(DI,
II)
Sta
ckel
berg
Fo
llow
er (
S-F)
(I, D
)
M
onop
olis
t (M
)/
Stac
kelb
erg
Lead
er (
S-L
)
(D, D
);
(D, I
)

109
PART II

110

111
Chapter 5 Soviet Union’s gas export strategy to Europe
5.1 Introduction
Shortly after the Second World War, the Soviet Union began exporting natural gas to Poland on a very small scale.108 Only in the 1960s did the export of natural gas expand to include other European countries that fell under the Soviet sphere of influence through the CMEA109. Austria was the first capitalist country in Western Europe to purchase a small volume of gas from the Soviet Union, followed in the 1970s by larger Soviet sales to West Germany, Italy and France [Victor and Victor 2006]. In the Soviet period and be-fore the liberalisation of the gas market in the EU, the chosen institutional framework for Soviet gas supply to Western Europe was relatively stable, with an oligopoly of importers and exporters being connected to each other through long-term contracts. Governments were typically also directly involved in the realisation of gas projects, through ownership interests and investment guarantees (see also Chapter 2) [Finon en Midttun 2004]. In this chapter a description is given of the Soviet export strategy for natural gas in Europe before the disintegration of the Soviet Union and before the European liberalisation of the gas sector, which began in the 1990s. For Europe, a distinction is made between the Cen-tral and Eastern European countries that belonged to the CMEA and the Western Euro-pean countries. The export strategy is described in light of the rationale of the Soviet Un-ion for commencing gas production and marketing it. In the analysis, emphasis will be placed on economic aspects. The chapter starts with the internal (institutional) gas market developments in the Soviet Union, Western Europe and the CMEA countries. Section 5.2 looks at the developments in the Soviet Union gas market up until the fall of the Soviet empire and of the centrally planned economic model. Section 5.3 describes the structure of the gas market in Western Europe before the gas market liberalisation and that of the gas market in the CMEA under the Soviet Union’s sphere of influence. In Section 5.4 the supply and transport of Soviet gas to the CMEA and Western Europe are discussed. The chapter ends with a concluding section.
108 For an extensive description and analysis of the Soviet gas deliveries to Europe and the institutional development of Soviet gas, see: Maarse [1976]; Stern [1980]; Stent [1982]; Stein [1983]; Gustafson [1985]; Stern [1987]; Gustafson [1989]; Van der Linde [1991]; Stern [1993]; Victor and Victor [2006].
109 The unofficial designation is Comecon. The CMEA was an organisation that supported economic cooperation between the Central and Eastern European communist countries, largely under the command of the Soviet Union, and was a reaction by the Soviet Union to the Marshall Plan. The CMEA had to guarantee the implementation of financial assistance to these countries, initiated by the Cominform. In this research, the CMEA-6 is used as the collective term for six countries in central and Eastern Europe with a planned economy, namely East Germany, Poland, Czechoslova-kia, Hungary, Romania and Bulgaria. The Soviet Republic, Cuba, the People’s Republic of Mongolia and observers North Korea and North Vietnam, which also were part of the CMEA, fall outside the CMEA-6 group in this research. Former Yugoslavia, as associated member of the CMEA, and Albania are listed separately where relevant.

112
5.2 Rationale for Soviet’s gas production and exports and
its institutionalisation
In the 1820s, natural gas was used for the first time for central lighting on St. Petersburg’s Aptekarsky Island. In the course of the nineteenth century, other cities followed St. Pe-tersburg’s example.110 Gas was captured on a larger scale at oil production sites in Azerbai-jan in the 1870s [CE/CIEP 2007]. However, gas production in the Soviet Union re-mained limited to 3 bcm/y until after the Second World War [Victor and Victor 2006]. 5.2.1 Rationale for Soviet’s gas production and exports
During Stalin’s last governing years (1945-1953), energy consumption grew by more than 9 percent per year. The underlying causes were strong industrial growth in combination with inefficient use of energy. However, the share of gas in the Soviet energy mix remained limited (2 percent, or 9 bcm, in 1953) due to the dominant roles of coal and, to a lesser extent, oil, during this period [Victor and Victor 2006]. In 1942, gas fields were discov-ered in the Kuibyshev region and around the same time the development of the gas field near the village of Elshanka was commenced, largely to the benefit of the industry in Sara-tov, southeast of Moscow. In 1943, the first long-distance pipeline (160 kilometres) began to be used between Bouguruslan and Kuibyshev. Substantial transport of gas started three years later – shortly after the Second World War – with the realisation of the 843 kilome-tre-long gas pipeline between Saratov and Moscow. In the 1950s, other gas fields were linked to the gas network around Moscow.111 Until the mid-1950s, gas production in the Soviet Union was largely limited to the Saratov region and Ukraine [Victor and Victor 2006]. Under Khrushchev the position of gas gained importance, although at first oil was pre-ferred due to the flexibility with which it could be used in industry. In his first five-year plan112 (1956-1960) he formulated goals for equalling the American economy within 25 years. He intended to reach these goals through the modernisation of the economy, in which modern fuels received an important place because of their flexible and efficient application. In the seventh five-year plan (1959-1965) gas was increasingly consumed in the industry [Victor and Victor 2006]. The increased demand for gas by the Soviet Un-ion’s heavy industry needed to be met with new production from the gas fields in the Soviet republics in the Caspian region (mainly Turkmenistan). In order to link the gas fields to the markets around Moscow and elsewhere, in 1959 the North Caucasus Center
110 In the period that Russia was ruled by tsars, under the Romanov dynasty, the following important cities, among others, were supplied with natural gas (in addition to St. Petersburg and Moscow): Kiev, Kharkov, Rostov-on-Don, Odessa, Riga, Vilno, Tver en Kazan [Victor and Victor 2006; Gazprom 2008a].
111 This started with the gas pipeline Dashava-Kiev-Bryansk-Moscow in 1950, followed by the Tula-Moscow and the Stavropol-Moscow pipelines [Gazprom 2008a].
112 The sixth in a row in Soviet history. A five-year plan formulates the goals for five years and is an important instru-ment in the communist centrally-guided economy. In the Soviet Union, the Gosplan established roughly policies for economic growth. The plans were in principle focused on fast industrialisation (especially of heavy industry).

113
gas pipeline was brought into use; this was followed in the 1960s by a corridor from Cen-tral Asia and the Boukhara-Ural pipeline [Efegil and Stone 2001].113 Moreover, in the early 1960s gas was being used from the Ukrainian Soviet Republic, in particular the Shebe-linsky gas field [Victor and Victor 2006; Gazprom 2008a]. This turned the satellite repub-lics in the Caspian region and Ukraine into important areas of gas production and transit for the Soviet Union. In the eighth five-year plan (1966-1971) the importance of the western Siberian gas re-serves, located to the east of the Ural Mountains, was recognised by the then-ruling Soviet leader Brezhnev.114 In the same period, gas fields were also discovered in Orenburg (north of Kazakhstan), followed by the discovery of the gas fields on the Yamal Peninsula at the beginning of the 1970s (including the Bovanenko and the Kharasevey fields) [Stern 2005]. Due to the development of the gas fields in the Nadym Pur Taz (NPT) region in western Siberia, the centre of gravity of the Soviet gas sector shifted from the end of the 1970s on:
• the geography of the Soviet production portfolio changed because gas production in the regions east of the Ural Mountains exceeded the production west of the mountains [Victor and Victor 2006]; and
• the Soviet Union became a net exporter of natural gas. Up until the mid-seventies the Soviet Union even was a net importer due to imports from Afghanistan (2.9 bcm/y) and Iran (growing to 9.6 bcm/y) [Stern 1987].115
Because of the location in a permafrost area, the development of the enormous gas fields in the NPT region required new technology which at the time was available only in the West. [Victor and Victor 2006]. Due to the growing demand for natural gas in Europe, com-bined with an improved political climate, Europe was involved with the technical and financial realisation of the new gas projects. In addition, the increasing gas exports pro-vided additional hard currency revenues, with which the Soviet Union could finance new industrial projects domestically and in the CMEA-6 (see also Sections 5.3 and 5.4). The development of the new gas fields and the related trade with the West led to a bud-ding integration of the Soviet Union in the world economy. However, the cooperation and communication between the planning ministries and state corporations necessary to be able to manage the increased complexity of trading were lacking. The problems sur-
113 The development of these regions was supplemented by the gas production in Krasnodar, on the coast of the Black Sea.
114 For a closer view of the energy strategy under Brezhnev and Gorbachev, see among others Gustafson [1989]. Most of the discoveries in Western Siberia were in the region Nadym Pur Taz (NPT), where large gas fields such as Med-vezhe, Urengoy, Yamburg and Zapolyarnoye were located (see also Chapter 10).
115 The Iranian Gas Trunkline (IGAT) pipeline, with a capacity of 10 bcm/y, facilitated imports from Iran. There was mention of an IGAT II pipeline, but as a consequence of the Iranian revolution in 1979 this pipeline was never com-pleted. The imports were intended for the southern Soviet republics. The Afghan imports stopped after the Soviet invasion in 1979 [Stern 1999].

114
rounding economic planning, in combination with low productivity and product quality due to insufficient price incentives, led to stagnation during Brezhnev’s later years.116 In order to address these problems, Gorbachev launched economic reforms in the twelfth five-year plan (1986-1990).117 With his glasnost and perestroika, he respectively introduced openness and social-economic reforms in order to create a socialist market economy [Gor-bachev 1987]. Perestroika was also intended to guide the changes in the CMEA countries. However, the centrally-guided system no longer proved tenable due to internal and exter-nal factors, such as the declining export revenues due to decreasing oil and gas prices and the devaluation of the dollar in 1985 subsequent to the Plaza Agreement (see also Chapter 6).
Figure 5.1 The value of Soviet hard-currency incomes, including oil and gas exports (in millions of $)
Natural gas
Oil and oil products
Source: own analysis, Ericson and Millar [1979] for 1971 and 1975; Soviet Foreign Trade Yearbook for 1980 and 1985, in: Stern [1987].
3176
10803 10867
209
25584085
2040
4454
52529762
1971 1975 1980 1985
Other hard-currency earnings
20567
209
Due to the development of the western Siberian gas fields, the Soviet Union became the largest gas producer in the world, followed by the US, by the end of Brezhnev’s period [BP 2008]. In the period between 1970 and 1991, the annual gas production in the Soviet Union increased by an average of 4.6 percent per year, from 185 bcm in 1970 to 406 bcm in 1980 and 756 bcm in 1991, according to BP [2008]. Figure 5.1 shows that the gas revenues grew from $0.2 billion in 1975 to almost $4.1 billion in 1985. In total, the So-viet Union received nearly $15 billion from oil and gas exports in 1985.
116 For an extended analysis of the stagnation and subsequent policy, see among others Hanson [1992].
117 The policy period between Brezhnev and Gorbachev, during which Yuri Andropov (1983-1984) and Konstantin Chernenko (1984-1985) were the Soviet leaders, is not explicitly addressed in this research. During this period, the previous leader’s policy was continued due to these leaders’ poor health.
115
5.2.2 Institutionalisation of the Soviet gas sector
From 1948 to 1956, the Head Department of Natural Gas Production, which came under the Ministry of Oil Industry (Minnefteprom), was responsible for the production, trans-port and sales of natural gas. In 1956 this department was reorganised into the Head De-partment for Gas Industry under the Council of Ministers of the Soviet Union (Glavgaz). In 1963 the State Production Committee of the Gas Industry was established, which sub-sequently was placed under a ministry in 1965. The Ministry of Construction of Facilities for the Oil and Gas Industry (Minneftegazstroy) was separated in 1972, as a result of which the export of gas within this ministry came under Soyuzgasexport [Stern 1999].118 As a result of Gorbachev’s reforms, in 1989 the Ministries of the Oil and Gas Industries were merged into one ministry. The state company Gazprom119, which fell under the res-ponsibility of the Ministry of the Gas Industry, became responsible for the production, distribution and sales of gas within and outside the Soviet Union. In 1989, through the UGTS, Gazprom gained control over 160,000 km of gas pipelines and 350 gas compres-sors, which connected 270 field facilities, thousands of gas fields and two dozen under-ground gas storages [Gazprom 2008a]. Due to the disintegration of the Soviet Union, in 1991 Gazprom lost about a third of the pipeline capacity and a fourth of the original So-viet compressor capacity. During the Soviet period, the government continued to control all gas production in the different Soviet republics. In addition, it could influence the CMEA-6 through the CMEA energy agreements. This made coordination of the production in the different gas fields in the Soviet republics and the construction of gas pipelines within the Soviet system and to the CMEA-6 relatively easy. 5.3 Gas market developments in Western Europe and the CMEA-6
In order to be able to discuss the Soviet export strategy for natural gas, a distinction needs to be made within Europe between the CMEA countries, which were under Soviet influ-ence, and Western Europe. 5.3.1 Gas market developments in the CMEA-6
Since the Second World War, the countries in Central and Eastern Europe have arranged their economic relations within the frameworks of centrally-guided economies, of which the Soviet Union was the economic and political leader.120 As a result of the economic isolation from the West due to the Cold War and their relatively resource-poor under-
118 To this end export contracts were made by Soyuznefte Export, the export division for oil of the Ministry of Foreign Trade [Stern 1999].
119 The name ‘Gazprom’ is an abbreviation of the Russian word for ‘gas industry’. Minister Viktor Chernomyrdin was appointed as President and Chief Executive Officer (CEO) of the state company Gazprom [Gazprom 2008a].
120 This section is largely based on Van der Linde [1991]. During the Cold War, the countries in Central and Eastern Europe also depended on Moscow for the security that it offered through the membership of the Warsaw Pact.

116
grounds, the Central and Eastern European regions became dependent upon Soviet oil and gas resources. Only Romania, and to a lesser extent Poland, produced gas (and oil). Figure 5.2 Gas consumption in the CMEA-6 from 1965 to 1990 (in bcm)
Source: own analysis, based on BP [2008].
0
10
20
30
40
50
60
70
80
1965 1970 1975 1980 1985 1990
Year
Gas
consumption
In bcm
6869
46
34
19 Slovakia
Poland
Romania
Czech Republic
Hungary
Bulgaria
64
According to BP [2008], Romania already produced 23.3 bcm in 1965 and the Romanian gas production reached its peak in 1982 with 37 bcm, after which it declined to 28.3 bcm in 1990. In Poland, gas production peaked in 1978 at 6.6 bcm.121 Moreover, Czechoslova-kia and East Germany availed over lignite and Poland over hard coal. As a consequence, the electricity supply was largely based on coal. Hungary, Romania and, to a lesser extent, Czechoslovakia and East Germany, also used nuclear energy for electricity production. In an absolute sense, gas consumption grew fastest in Romania. Consumption in the other countries followed several steps behind that of Romania. The total size of the gas market in the CMEA-6, excluding East Germany, grew to over 70 bcm/y at the end of the 1990s (see also Figure 5.2) [BP 2008]. With respect to the external gas imports, the CMEA-6 depended completely upon supply from the Soviet Union. The trade relations within the centrally-guided economies were institutionalised through the CMEA. Trade within the CMEA framework was largely based on regional specialisa-tion and barter agreements (as parts of five-year plans), within which the regional energy systems also fell. In the standard barter transactions, the Soviet Union provided the CMEA-6 with raw materials and fuels in exchange for half-finished and finished products.
121 Polish gas production was 4.9 bcm in 1965 and 2.6 bcm in 1990 [BP 2008].

117
Until 1970, the CMEA played a relatively limited role in the economic and energy rela-tions between member states, because the trade was largely organised through bilateral agreements. From the 1970s onwards the role of the CMEA grew because:
• the extensive growth model could no longer be fed through domestic energy pro-duction, in particular because the industry required modern fuels (oil and gas) in an increasing degree; and
• a gap had developed with respect to the development of welfare and technology between the Western industrialised countries and the CMEA-6, including the Soviet Union. The economic structure needed to be adjusted, so their relative po-sition with respect to the West could be improved.
As a result, the economies of the CMEA-6 were opened, intensifying trade with the West, the Soviet Union and within the CMEA. The Soviet Union exported its development model of ‘heavy industry’ to the CMEA countries, within which the CMEA-6 was able to establish an energy-intensive industry, fed by the relatively cheap and reliable energy sup-ply from the Soviet Union. Until the 1980s, the CMEA-6 enjoyed relatively low prices for energy and other resources, compared to world prices, through the Bucharest price system. Until the energy crisis of 1973, the prices in this system were based on the average world price over the five previous years. The modernisation of the economies of the CMEA-6 countries was largely financed with oil dollars, as a result of which they started to take part in the recycling of oil dollars. In addition, Western banks financed part of the modernisa-tion through loans against the then low interest rate. The export of products to the West (in addition to the exports to the Soviet Union in exchange for the supply of fuel) was to yield hard, foreign currency with which the debts could be paid. The period after the energy crisis of the 1970s changed the situation. The success of the trade with the West turned sour when the increasing interest rate after 1979 caused the countries to enter a debt crisis. In addition, the nascent mercantilist policy of the Euro-pean Community (EC), combined with competition from the newly industrialised coun-tries, the new member states of the EC and the Soviet Union, had an adverse effect on the exports of the CMEA-6. As a consequence of the increasing energy prices, the Soviet Un-ion also was no longer able or willing to infinitely subsidise the economies of the CMEA-6 with cheap energy. The price system was revised by shortening the reference period to one year, as a result of which changes to the world price were noticed sooner. Moreover, the consumption of oil in the CMEA-6 was partly replaced by gas. Oil had become too valu-able as a result of the oil crisis and had to be reserved for the transport sector and exports to the West (see also Section 5.4). Due to the one-year delay in the Bucharest price system, the CMEA-6 was confronted with relatively high resource prices after the decline of the oil price in the 1980s. Due to a lack of hard foreign currency, the CMEA-6 could not cover its energy needs with imports, and it turned for this to its domestic energy resources. The Soviet Union lost its control over the economies of the CMEA-6 as a result of increasing

118
domestic production, which caused inefficiencies and weakened the economies.122 After the introduction of market prices as a result of integration with the West, the CMEA-6 coun-tries had to adjust their energy economies (see Chapter 7). 5.3.2 Gas market developments in Western Europe
As opposed to most CMEA-6 countries, several Western European countries had disposal over large gas reserves at the time the European gas market was introduced, starting with the discovery of the Groningen field (the Netherlands) in 1959. The gas market expanded in the first half of the 1970s due to internal production, regional imports from outside the EC and the fast establishment of an effective distribution industry [CIEP 2004; CIEP 2005]. After the 1973 energy crisis, which resulted in the development of a sellers’ market, Western policy focused on security of supply. This gave gas consumption a new impulse, where gas became an important source in the energy mix because it offered an alternative to oil from the Arabic countries (see also Figure 5.3) [De Jong et al. 2005].123 The growth in gas consumption slowed in the beginning of the 1980s due to the recession and energy conservation, as a result of which a buyers’ market developed.124 Figure 5.3 Total energy consumption in OECD Europe in 1973 and 1990
Energy mix OECD-Europe countries in 1973
100% = 1402 Mtoe
Energy mix OECD-Europe countries in 1990
100% = 1625 Mtoe
54%Oil
Coal
Natural gas
Oil
Coal
Others*
39%
30%
6%
10%
Others*
27%
16%
19%
Natural gas
* Nuclear, Hydro, Geothermal, Solar, Combustible Renewables & Waste, Electricity and Heat. In 1973 share of nuclear was 1.4%; in 1990 almost 15 percent. Source: IEA [2005].
The energy mix developed differently due to nationally-oriented policies. The traditionally industrial countries, West Germany and the UK, remained highly dependent upon their
122 In addition, the Warsaw Pact lost its influence in Central Europe after Poland and Hungary chose to have democ-ratic elections, thereby initiating the fall of communism, in 1989. However, other members of the Warsaw Pact, including the East Germany under the rule of Honecker, continued to see advantages in retaining the security system.
123 The share of gas in the electricity sector did not grow explosively because the European Commission considered natural gas as ‘noble’.
124 In the second part of the 1980s, the environmental aspect of energy policy became dominant due to the greenhouse issue [De Jong et al. 2005].

119
domestic coal production, in addition to oil and gas, even though the share of coal de-clined in favour of nuclear energy and natural gas. The energy mix in Italy and the Nether-lands was to a large extent based on gas and oil. France, Belgium and the Scandinavian countries Finland and Sweden built nuclear power plants for their energy needs in the 1970s. In the southern countries of Portugal and Spain, the energy mix was to a high de-gree determined by oil; in Spain nuclear energy also played a large role [BP 2008]. In an absolute sense, West Germany and the UK developed into the largest gas markets, followed by Italy and the Netherlands (see Figure 5.4). Due to the use of nuclear energy, the French gas market grew relatively less strongly. In the south of Europe, natural gas played a limited role until the 1990s. Total consumption in the Western European coun-tries grew from 21 bcm in 1965 to 255 bcm 1990 (an exponential growth of 10.5 percent per annum). Figure 5.4 Gas consumption in Western Europe from 1965 to 1990 (in bcm)
* Belgium and Luxemburg (10.6 bcm in 1990); Austria (6.4 bcm); Spain (5.6 bcm); Turkey (3.4 bcm); Finland (2.5 bcm); Ireland (2.1 bcm); Denmark (2.0 bcm) Switzerland (1.8 bcm); Sweden (0.7 bcm); and Greece (0.2 bcm). Source: own analysis, based on BP [2008].
0
50
100
150
200
250
1965 1970 1975 1980 1985 1990
Year
Gas
consumption
In bcm
255
221
172
79
21
Others*
Netherlands
UK
Italy
Germany
France
209
The intention of the EC to come to a joint energy policy, following the common agricul-tural policy, failed due to the conflicting interests of the member states during the oil crises and the following period [Matláry 1997].125 With respect to the institutionalisation, the European gas market was characterised by a buyers’ oligopoly of gas companies, which had full or quasi monopolies in the national wholesale markets. In addition, most countries
125 Within the framework of the Organisation for Economic Cooperation and Development (OECD), the Interna-tional Energy Agency (IEA) had the task of coordinating this. However, the EC proved only to be able to implement energy policies that were not very politically sensitive, such as the implementation of daylight savings time in order to save energy [De Jong et al. 2005].

120
had a long tradition of state ownership of energy companies [Feigenbaum 1985]. In sev-eral Western European countries a centralistic policy was conducted with respect to mar-ket design, while other countries had a decentralised policy. West Germany, for instance, was regionally organised, with utilities having monopoly positions. The UK was the first country within the EC that followed the US in liberalising the gas market [Matláry 1997]. The process of gas liberalisation and integration of the gas markets in continental Europe was postponed until the 1990s (see also chapters 2 and 7). Figure 5.5 Gas supply in Western Europe in 1990 (in bcm)
EU-15 suppliers of natural gas in 1990
100% = 255 bcm
EU-15 production in 1990
100% = 142 bcm
56%
Norway
Russia
45%
Algeria Others
10%
22%
11% 1%
31%
11%
8%5%
EU-15 production
Others*
Italy
Germany
UK
Netherlands
*Main contributors are Ireland, Denmark and Spain. Source: own analysis, based on BP [2008]; Global Insight [2006].
With respect to gas supply, Western Europe was largely self-sufficient until the 1990s. Fifty-six percent of total gas supply was provided by Western European countries, with the Netherlands and the UK responsible for more than 75 percent of that.126 Norway supplied an additional 10 percent of the total supply. Outside Western Europe, in 1990 Russia was responsible for 22 percent of total gas supply (see Section 5.4). Algeria exported part of its gas to the Southern European market, in particular to France, Spain and Italy (see also Figure 5.5).127 LNG from other regions was not competitive with respect to pipeline gas. Most of the export countries that supplied gas to Europe had a tradition of government control over the energy companies, varying from central-regional to local. Gas supplies were effectuated through long-term contracts, which placed the volume risk with the con-
126 The UK, Germany and Italy produced mainly for their own markets.
127 In the 1970s, Libya was partly responsible for the gas supply to Italy. This was stopped, however, in the first part of the 1980s due to a political conflict with the Libyan leader Muamar al-Qadafi. Algeria filled the gap [Arentsen and Künneke 2003].
121
sumer and the price risk with the producer. The involved governments typically provided investment guarantees (see also Chapter 2) [Finon en Midttun 2004]. 5.4 Soviet gas strategy in Europe
As was discussed in Section 5.2, the network inside the Soviet Union was gradually shaped under Stalin and later under Khrushchev. In 1946, gas delivery to Poland started through the Soviet Republic of Belarus, near Bialystok [Maarse 1976]. Until 1968, exports were limited to 0.3-0.4 bcm/y. At the end of the 1960s, the Soviet Union expanded its gas exports to the CMEA-6 and Western Europe. The first large Soviet gas corridor to Europe, ‘Brotherhood’ (Bratstvo), fed by the Shebelinka gas field east of Kiev, was de-ployed in 1967 and reached all the way to Prague, with links to the Polish and Austrian gas markets [Victor and Victor 2006]. In 1968, Czechoslovakia purchased Soviet gas for the first time (1.3 bcm). Poland increased its imports to 1 bcm/y, and Austria took 0.1 bcm/y (increased to 1.5 bcm/y in 1972), being the first capitalist country to do so [Stern 1987].128 Total Soviet gas exports amounted to 3.1 bcm in 1970. However, the Soviet Union was a net importer due to imports from Iran and Afghanistan (see also Section 5.2). In the 1970s, the Soviet Union started spreading its exports to other political-geographic ‘partners’ in the West. Through the so-called Transgas pipeline network, the ‘warm’ gas fields of western Siberia were linked with consumer markets. From 1974 on, the Trans Austria Gasleitung (TAG) I/II pipelines coupled this network to the gas markets in Czechoslovakia, Austria and Italy [Victor and Victor 2006]. The Italian gas company Società Nazionale Metanodotti (SNAM) was involved with a gas contract of 6.0 bcm/y [Stern 1987]. The Mittel-Europäische-Gasleitung (MEGAL) pipeline through Germany to France was also linked to the Transgas corridor, as a result of which (extra) capacity be-came available for Austria in 1974, in 1976 for West and East Germany, and in 1978 for France [Victor and Victor 2006]. Moreover, in 1974 the Soviet Union started with gas deliveries (1.4 bcm/y) to Neste, Finland, via a pipeline from Leningrad to Turku and Tampere in Finland [Stern 1980]. A year later the gas fields in Orenburg were linked to the gas markets of Bulgaria, Hungary and Romania through the Soyuz pipeline [Victor and Victor 2006].129
128 The prices of Soviet gas were higher than those of the gas fields in the North Sea and the Groningen field in the Netherlands. Converted to UK currency, Austria 4.33 pence per mcm for Soviet gas. Commonly, British gas from the North Sea yielded 2.87 pence and Groningen gas an equivalent of 3.11-3.48 pence [Maarse 1976].
129 From 1966 on, there was mention of developing the gas fields under Sachalin Island, in principle together with the Japanese. It would be brought to market by means of LNG (initially, delivery per pipeline was also considered). Two other concrete LNG projects were on the table. The first one was an LNG project, intended for the Japanese and US markets, which would be linked to the developments of the fields in Yakutia in Eastern Siberia. Secondly, an LNG project in Murmansk was being considered, intended for the US gas market and fed with the production of the Uren-goy field. The projects never materialised due to political and commercial obstacles [Kosnik 1975; Stern 1999].

122
Figure 5.6 Export volume of the Soviet Union to Western Europe and the CMEA (1960-1990, in bcm)
CMEA**
* Including Turkey (deliveries started in 1990; 3.3 bcm).** Including Former Yugoslavia (small deliveries started in 1980).† EU-27, excluding Estonia, Latvia and Lithuania to 1985 and Slovenia prior to 1991.Note: In European bcmSource: own analysis, based on Gazprom information; Maarse [1976] for Soviet gas volumes; BP [2008] for EU-27 gas consumption.
10
2734
49
7
49
28
22
1960 1965 1970 1975 1980 1985 1990
West Europe*
1
0.3
x% Soviet market share in EU-27†
<1% 1%3%
9%
19%
22%
31%
0.4 2
After the oil crisis, the Soviet strategy of only supplying political-geographic ‘partners’ in the West with gas was changed. The atmosphere of détente offered conditions for making additional gas deliveries possible, within which shared interests in the gas infrastructure helped bring together the two ‘blocks’. Through increased gas exports to the West, the Soviet Union was able to increase its hard currency revenues and realise additional gas deliveries to the CMEA-6 in order to partly replace oil consumption [Victor and Victor 2006; Stern 1987]. In addition, the Soviet Union needed Western technologies and fi-nancing for the long-distance pipelines, the compressors and for the development of the western Siberian gas fields under permafrost [Gustafson 1985]. After the oil crisis, Western Europe became more interested in gas because of the desire to diversify its fuel sources, in particular to reduce the dependence on oil from Arabic countries. Moreover, in the West, which was experiencing an economic crisis at the time, the supply of technologies and materials contributed to more employment opportunities [Victor and Victor 2006; Stein 1983]. The CMEA-6 increased its imports from the Soviet Union in the second half of the 1970s by 15 bcm/y. In addition, Yugoslavia began to consume Soviet gas (see Figure 5.6). In Western Europe, gas delivery to France started (for a total of 4 bcm/y) in 1976/78 through the above-mentioned MEGAL pipeline. Starting in 1978, West Germany, Austria and Italy increased their imports from the Soviet Union, respectively with 2.5 bcm/y, 1.0 bcm/y and 1.0 bcm/y [Stern 1987]. In 1980, total Soviet gas exports amounted to 49.2

123
bcm, of which 55 percent was imported by the CMEA-6 and 45 percent by Western Europe (see also Figure 5.6). However, the Soviet invasion of Afghanistan in 1979 and Reagan’s power politics from 1981 onwards caused a revival of the Cold War. This negatively affected Western consen-sus about the new oil and gas exports from the Soviet Union and led to a number of US sanctions.130 For the US, the Soviet gas deliveries to Western Europe provided a first op-portunity to stop part of the Soviet hard currency revenues, thus accelerating the collapse of the system [Victor and Victor 2006; Stein 1983]. Despite the resistance, negotiations for additional gas deliveries (40 bcm/y was being discussed) were commenced between Soyuzgasexport and West European companies, initially with Ruhrgas in West Germany [Gustafson 1985]. In the so-called ‘gas for pipe’ agreements, new gas projects were facili-tated which included export contracts for the materials that could be used by the Soviet Union for realising the gas infrastructure.131 Moreover, the infrastructure was largely fi-nanced by Western banks, supported by government guarantees or concessional loans. In addition to providing government guarantees, the Western governments were needed for political support. American resistance eventually led to the delay of the construction of the East-West gas corridor and that the goal became to achieve a limited growth of gas imports for the sake of security of supply [Stern 1987; Victor and Victor 2006].132 The end result in 1984 was a capacity expansion of 30 bcm/y to Western Europe, with Ruhrgas, Gaz de France, SNAM and the Austrian Österreichische Mineralölverwaltung (OMV) engaging in new contracts with Soyuzgasexport, respectively for 10.5 bcm/y, 8.0 bcm/y, 5.0 bcm/y and 1.5 bcm/y [Stern 1987].133 As a result, the Ukrainian Soviet Republic and Czechoslovakia developed into hubs for the gas flows from the Soviet Union to Europe (see also Map 8.2).134
130 By means of the sanction of December 1981, the US prohibited their corporations, such as General Electric, from supplying the Soviet Union with materials which could be used for gas production and compressors. This prohibition was later extended to Western Europe [Gustafson 1985; Victor and Victor 2006; Stein 1983].
131 The expansion of the capacity from Moscow to the CMEA-6 and Western Europe was realised through additional compressors and gas pipelines. In addition, the gas infrastructure between the western Siberian fields in the permafrost regions and the gas network around Moscow needed to be expanded and extended. The increased Soviet trade outside the sphere of influence of the Soviet Union created tension between both internal and external policies and between commercial and diplomatic policies. See also: Gustafson [1985].
132 The market share of the Soviet Union – and other countries outside the EC – should not be larger than 30-35 percent in order to prevent too high of a dependence on a single country.
133 The Soviet Union also expanded its contract with Finland with 1.1 bcm/y. In 1988, the contract with the Swiss Swissgas, which was signed in 1982, also started (0.36 bcm/y) [Stern 1987].
134 This was a choice against the shortest route to West Germany, which would have been through Belarus, Poland and East Germany. In addition to the fact that the existing network of pipelines and storages could be used, there were other economic and political factors. From the point of view of the Soviet Union, transit through Poland was politi-cally risky. In Poland, the Solidarity movement was causing instability. The thwarting of the new gas programme by the US might have been much more effective if a choice had been made for transit through an instable Poland, which was on a progressive course. Moreover, from the West German perspective, a pipeline through East Germany was

124
In the 1980s, the growth opportunities for Soviet gas export diminished as a result of in-creasing competition, especially from gas production in the North Sea, and the develop-ment of a buyers’ market in the 1980s. The Soviet Union tried to adjust its strategy with respect to three aspects [Stern 1987]:
• the Soviet Union entered into new long-term contracts with new countries and their state companies. In 1986, a contract with the Turkish state energy company Botas was closed for 3.3 bcm/y;135
• the Soviet Union investigated the opportunities for selling gas outside long-term contracts through the spot and short-term markets. However, due to the post-poned European gas liberalisation this did not (yet) happened; and
• the Soviet Union tried to increase the reliability of their gas supplies (in particular during winter periods) through additional investments in production and mid-stream facilities.
Altogether, the Soviet gas deliveries to Europe increased to almost 100 bcm in 1990, of which the CMEA-6 (including former Yugoslavia) and Western Europe (including Tur-key) both were responsible for about half of the exports. At that moment in Central and Eastern Europe, Czechoslovakia was the largest buyer of Soviet gas (11.3 bcm), followed by Poland (7.6 bcm) and Romania (6.6 bcm). In Western Europe, Germany took off most Soviet gas (23.9 bcm) in 1990, followed by Italy (12.9 bcm) and France (9.5 bcm). The Soviet share in the total EU-27 consumption rose from the 1980s to over 20 percent and in 1990 to 31 percent (see Figure 5.6). The percentages vary strongly by country, as the CMEA-6 countries were relatively dependent upon the Soviet Union for their gas supply, while in Western Europe Finland, Austria and Germany were most dependent upon the Soviet Union for their gas consumption (see also Chapter 10).
5.5 Conclusion
Gazprom’s strategy for the 21st century is partly the result of past choices, which to some extent determine the path-dependency of its current strategy making. During the Soviet period, Khrushchev brought gas to the fore of the energy mix in order to modernise the Soviet economy, whereas under Stalin gas was only used at a regional level. Because of this, the gas network and gas fields in Soviet states in Central Asia, the Caucasus region and the Ukraine were included in the European part of the Soviet Union. Under Brezhnev the gas production in western Siberia was started, as were exports to the CMEA-6 and a number of Western European countries. Gorbachev introduced reforms which, among other
unacceptable. In the gas programme, contracts were also signed with Italy and Austria, among others, as a result of which transit through the Ukraine was cheaper. However, this problem was not decisive for connecting the pipeline to the Ukraine. (After all, an extra branch line would have been sufficient.) [Victor and Victor 2006].
135 Negotiations with other countries were very slow or even removed from the agenda. Greece began as early as 1985 with negotiations. However, the first gas supplies were delivered only in 1996. Negotiations about gas exports to the Scandinavian countries, with the exception of Finland, kept disappearing from the agenda [Stern 1987].

125
things, placed the Russian gas interests under the control of the national gas company Gazprom. The CMEA-6 had the same economic model as that of the Soviet Union, in which the state was responsible for the planning of the gas sector. Up until after the energy crises of the 1970s, countries in Central and Eastern Europe could be ‘subsidised’ with cheap ener-gy and other natural resources due to the delaying effect of the price system. Starting in the 1980s the Soviet Union was no longer able or willing to continue subsidising the econo-mies of the CMEA-6 with cheap energy. The economies of the centrally planned states weakened as a result of, among other things, the lack of price incentives and the debt crisis that followed the oil dollar recycling. In contrast to the CMEA-6, the West had a greater capacity to restructure its economy due to the presence of a direct price signal. The Western European gas market was nationally organised until the liberalisation of the energy market at the end of the 1990s. The national gas market was (regionally) monopo-lised and the energy policy started to become determined by market circumstances. Gas took on an important position in the energy mix, partly due to diversification policies after the energy crises in the 1970s, even though the gas share varied widely per country. Through oil-indexed long-term contracts, Western Europe was dependent to a large de-gree on a number of large export producers for its gas supply, particularly from the Soviet Union, the Netherlands, Norway and Algeria. A number of countries, including the UK and the Netherlands, were largely able to provide for their own gas needs. The Soviet Union began its exports to Europe with Poland in 1946. Up until the 1970s the exports were expanded only marginally to include small volumes to other countries within the CMEA-6 in order to free up the oil export to the CMEA-6 for export to the West. Austria was the first in Western Europe to receive Soviet natural gas, in 1968. In the second phase, Soviet exports were expanded within the CMEA-6 and Western Europe. In the third phase, the gas supplies to these two regions were substantially increased via the so-called ‘gas for pipe’ agreements, despite delays due to American resistance. In the se-cond half of the 1980s consumption in both regions was disappointing as a result of the economic recession and the development of a buyers’ market in Western Europe. Due to the fact that a relatively small number of organisations and countries were involved with the financing and organisation, the realisation of the large gas projects was relatively sim-ple. The Soviet Union tried to increase its income of hard currency by selling gas to Western Europe. With these extra revenues it was able to finance gas delivery to the CMEA-6, whereby the economies of the CMEA-6 were modernised and the dependence on oil was reduced. Furthermore, Western technology was crucial for the development of the gas fields in West Siberian permafrost areas and for long-distance transport. Western banks largely provided loans, and governments gave guarantees and political support. After the

126
oil crisis, Western Europe was more interested in gas imports from Russia because of the drive for diversification of oil and extra employment opportunities. Soviet investments in the gas industry, including the exports to Europe, were part of a centrally-planned eco-nomy and were coupled with neither a ‘netback value’ nor a certain required rate of return. Thus the development of the Soviet gas industry was based primarily on a centrally-planned vision.

127
Chapter 6 Russia’s post-Soviet gas industry during the 1990s
6.1 Introduction
After the collapse of the Soviet Union, the international system was no longer determined by a bipolar international system of the US and Soviet Union. The US were the only he-gemony remaining, and for a while a unipolar international system existed. Moscow's sphere of influence was curtailed to a degree, and Soviet institutes such as the CMEA, the Warsaw Pact and the Soviet Union disappeared [Trenin 2007].136 Only the CIS137 could be regarded as a new organisation for retaining Russian influence in the former Soviet states [Zhiznin 2007; Amineh 2003]. Following the collapse of the Soviet Union, moreover, market concepts based on the Western model were introduced in Russia, which led to major reforms, including in the energy sector. The Russian economy collapsed during the transitional period (the Russian Gross Domestic Product, GDP, dropped by 44 percent between 1989 and 1998), which caused the demand for gas to drop by 16 percent in during the period from 1990 to 1997. Exports to the CIS also dropped by 31 percent. Since gas production only dropped by 8 percent, the resulting surplus had to find its way to Europe [Victor and Victor 2006]. The disintegration of the Soviet Union also led to the gas value chain breaking up, causing Russia to lose control over parts of the value chain outside Russia. The new transit regime that arose in Ukraine increased the risks attached to supplies of gas to Europe, among other things, as at the time 90 percent of the supplies of gas to Europe passed through Ukraine. Moreover, Moscow lost control over the gas fields in Central Asia, the Caucasus and Ukraine, some of which developed their own export strategies [Stern 2005; Victor and Victor 2006].138 The purpose of this chapter is to explain the reorganisation of the post-Soviet gas sector in a macro-economic context and the changing positions (and export positions in particular)
136 For a detailed analysis of the political and geopolitical position of Russia (and of the West) in the international system following the disintegration of the Soviet Union, see also Chapter 3 in Boon von Ochssée [2010].
137 The agreement that led to the formation of the CIS was signed in December 1991. That agreement is sometimes called the Belavezha Accords. The CIS is made up of ten former Soviet republics, viz. (2010) Armenia, Azerbaijan, Kazakhstan, Kyrgyzstan, Moldova, Ukraine, Uzbekistan, Russia, Tadzhikistan and Belarus. Turkmenistan left the Commonwealth as a member state in 2005, since when it has been an associate member. Georgia joined the CIS in 1993, but left again in August 2008, as a result of its conflict with Russia. The Baltic States (Estonia, Latvia and Lithuania) are not part of the CIS, and joined the EU in May 2004.
138 The dissolution of the CMEA also resulted in new, independent states, each of which had its own transit regime (see Chapter 7).

128
of the former Soviet republics and their relationships with Russia. During the 1990s, these changing circumstances impacted Russian export strategies (see also Chapter 7). Sec-tion 6.2 discusses the internal Russian gas market and the changing institutionalisation of the oil and gas sectors in more detail.139 Section 6.3 deals with the struggle for the gas re-serves and routes around the vacuum that was created in Central Asia and the Caucasus. The transit dealings with the former Soviet republics in Eastern Europe (Ukraine and Belarus) are addressed in Section 6.3, in which connection possible mitigation strategies for transit risks are also discussed. Section 6.4, finally, presents a conclusion.
6.2 The transition of the internal Russian gas market in the 1990s
As discussed in Chapter 5, Gorbachev launched a series of changes to the Soviet system in the 1980s, with perestroika and glasnost. In his view, those measures would allow the con-tinued existence of the system. However, according to Åslund [2007], the fall of the Soviet system seemed unavoidable despite those changes, owing to three internal economic pro-blems on top of the external difficulties, such as the declining export income (from oil and gas) resulting from the falling prices of oil and gas and the devaluation of the dollar in 1985:
• the change in policy resulted in a higher budget deficit;140
• the partial opening of the economy, both internally and externally, gave private parties more freedom, which led to value being withdrawn from public enter-prises and possibilities for arbitrage being sought out in the price and exchange rate differences between the Soviet Union and the West;141
• the system's increasing degree of openness led to a partial national and democratic empowerment, which in turn led a number of republics and regions to detach themselves from the central authority and, for example, no longer relinquish their income to Moscow.
Eventually, the CMEA countries were the first to detach themselves from the Soviet Un-ion (with Gorbachev's consent, it should be noted), followed by the other Soviet republics. As such, Gorbachev’s reforms ultimately led to the fall of a major power (through the collapse of the Soviet Union and the CMEA), an economic system (centrally-planned economy) and a political system (communism) [Åslund 2007].142
139 Other energy sectors, such as the nuclear and coal sectors, are not discussed. Those sectors also underwent a process of privatisation. See for example Zhizhin [2007].
140 Because, among other factors, the authorities could not exercise sufficient control over the expense patterns and the budget deficits were financed by printing and borrowing additional money.
141 The arbitrage was effected using the regulated commodities exports, subsidised grain imports, subsidised credit and state subsidies.
142 For a geographic presentation of the changes, see Map 8.1 in Chapter 8.

129
6.2.1 Transition of the Russian gas sector in a macro-economic context
After the peaceful dissolution of the Soviet Union in December 1991, Boris Yeltsin be-came President of Russia, because he understood that the Soviet Union was no longer politically tenable [Åslund 2007]. In the process of defining new Russian policy, the em-phasis was placed on economic reforms and on reorganising the Soviet states by means of the CIS. Western values were adopted for foreign policy, though conflicts and lack of communication between the various ministries meant that a uniform foreign policy was lacking during the Yeltsin years [Brezezinski 1997; Cummings 2001]. Starting in January 1992 ‘shock therapy’, as it is called, was used to propose radical market reforms based on neoliberal concepts, led mostly by Yegor Gaidar and Anatoly Chubais. Although several of the objectives of the shock therapy were achieved in milder forms, such as privatisation, price regulation and the opening of the market, radical reforms failed to appear and were slowed down by the strong industrial lobby.143 This allowed Russian managers of state enterprises to continue to withdraw value from the system. By 1992, this rent-seeking behaviour even accounted for 80-90 percent of the Russian GDP [Åslund 2007]. The gradual reforms, shortcomings in the way inflation was handled and the rent-seeking behaviour were some of the causes of the hyperinflation and the monetary crisis in 1993 [Åslund 2007; Dabrowski 1995]. The energy sector was also restructured during Russia's transitional process at the begin-ning of the 1990s. The first official energy policy was defined in 1992, as part of the shock therapy, stating among other things that the efficiency of the energy industry was to be increased and the first phase of privatising the energy sectors was to start [Fredholm 2005].144 Although Moscow hoped to form a single integrated national oil company, the industry was eventually broken up owing to the strong industrial lobby (similar to the other sectors). Besides a national oil company (Rosneft), other vertically integrated oil companies came about, such as Lukoil, Yukos and Surgutneftegaz. Those companies ex-panded their Russian portfolios further by means of acquisitions [Janssen 2004; Goldman 2008].145
143 Other objectives that were partially achieved were (1) uniform exchange rates; (2) the reduction of the military arsenal by 85 percent; and (3) legal status for small private enterprises, which is one of the defining conditions for a ‘normal’ market economy based on private ownership (although in practice the definition of private ownership in Russia was applied differently, owing to the absence of legislation [Åslund 2007]).
144 Russia introduced the principal measures of the ‘Concept for Energy Policy under New Economic Conditions’, covering the period until 2010. The energy policy was defined for the purpose of offering Russia a reliable supply of energy, guaranteeing the independence of that supply and promoting potential exports of energy [Fredholm 2005].
145 During the Soviet era, the responsibility for the oil sector was shared by various ministries. In 1987, regional admin-istrators were given greater powers, through state enterprises. In September 1991, the Russian Ministry of Fuel and Energy was transformed into the public limited liability company Rosneftegaz (Russian gas and oil) [IEA 1995].
130
As discussed in Chapter 5, in 1989 the responsibility for the Soviet gas industry was placed with Gazprom, as a state enterprise.146 After the disintegration of the Soviet Union, three key views of how to institutionalise the gas industry appeared [Stern 1999]:
• Gazprom's management wanted an integrated public limited liability company over all the former Soviet states;
• the individual republics favoured independent entities (i.e., fragmentation); and
• the economic reformers within the government advocated breaking up the gas in-dustry, based on the oil sector's example.
Eventually, the assets were divided between Belarus (1.5 percent), Ukraine (9.5 percent) and Russia (89 percent), with the government retaining full ownership [Victor and Victor 2006]. The nature of the industry, where control over the value chain yields benefits, and the strong political lobby of the management prevented the gas industry from being bro-ken up [Åslund 2007; Stern 1999]. Within the Kremlin, the lobby for Gazprom was rein-forced by Chernomyrdin's appointment as Deputy Prime Minister for Energy in May 1992 (he was later appointed Prime Minister). His protégé, Rem Ivanovich Viakhirev, succeeded Chernomyrdin at Gazprom [Goldman 2008; Panjoesjkin and Zygar 2008]. In November 1992, Gazprom was transformed into a Russian joint-stock company (RAO) [Gazprom 2008a]. Following the economic crisis, in 1993 Yeltsin wished to further reform the economy, but encountered stubborn resistance from the State Duma, which resulted in the threat of a coup. In the autumn of 1993, after military involvement, Yelstin succeeded in acquiring more power, by means of a new constitution, and replaced a number of radical reformers with professional industrialists such as Chernomyrdin and Soskovets, in order to start a process of stabilisation [Åslund 2007]. As early as in August 1992, reformer Chubais had reached a compromise with the managers of state enterprises for continuing the privatisa-tion. With the system of ‘voucher privatisation’, as it was known, the managers relin-quished a large part of their quasi-ownership in exchange for legal guarantees of a smaller part of the ownership. The secondary trade in vouchers was stimulated at a later point by the fact that many Russians failed to seal the vouchers [Åslund 2007]. In the autumn of 1994, the position of the managers of state enterprises was weakened by the drop in the values of commodity exports owing to the fall of the rouble (27 percent) and the contin-ued inflation.147 Chubais unsuccessfully tried to push through reforms, using credit assis-tance from the IMF (approximately 2 percent of the Russian GDP) and other measures such as reducing the budget deficit and liberalising large numbers of prices [Åslund 2007].
146 Although the gas contracts with Western gas companies initially remained under government control in 1990, through Soyuzgazexport, they were subsequently returned to Gazprom. In response to the state's retention of the export market, Gazprom temporarily created its own export division and strategy, with Zarubeshgaz [Victor and Victor 2006].
147 As a proportion of the GDP the rents dropped from 80-90 percent in 1992 to 10 percent in 1995 and 15 percent in 1998 [Åslund 2007].

131
The voucher privatisation of the oil sector in 1992 meant that it was primarily the mana-gers of state enterprises and government bodies that acquired the shares. Foreign parties were not permitted to own more than 15 percent of the shares. The privatisation gave rise to new enterprises; for example, Sidanko, Onako, Slavneft and VNK were formed in 1994, causing Rosneft's share in the production to drop to 4 percent [Goldman 2008; Janssen 2004]. Like the managers in the oil sector and elsewhere, Gazprom's management auctioned vouchers in order to privatise part of Gazprom (in 1993-94). In 1994, over 30 percent of the shares were held by private parties, while 15 percent of the shares had been sold directly to Gazprom employees (mainly managers) and the remainder was go-vernment-owned (40 percent) or held by Gazprom (10 percent) [Stern 1999; Goldman 2008].148 At the start of Russia's transitional period (1989-1995), Gazprom's management did not succeed in retaining full control over the Russian value chain. Management of important gas facilities fell to other Russian companies. Foreign companies such as Royal Dutch Shell, ExxonMobil and BP also gained entry to Russian gas reserves, by way of PSAs (mostly associated gas) [Goldman 2008; Victor and Victor 2006].149 Gazprom was granted an exemption from export taxes, some import tariffs and VAT, in exchange for a number of privileges relating to gas exports, among other things, and some obligations, such as an agreement to continue the generally loss-generating supplies to Russia and other CIS states [Åslund 2005].150 In addition, midway through the 1990s Gazprom's management was attracted by profitable trade through intermediaries, primarily between Turkmenistan and Ukraine (see sections 6.3 and 6.4) [Goldman 2008]. As a result of the new reforms in 1994, young entrepreneurs and bankers – more widely known as oligarchs – succeeded in generating more economic and political influence.151 The lack of financial resources led to further privatisation being initiated in 1995, using the loans-for-share programme, with oligarchs in particular acquiring control over the large enterprises in exchange for loans. They also helped Yeltsin win a second term in of-fice, in exchange for political and economic support after his re-election [Åslund 2007; Hoffman 2002].
148 Part of the shares in Gazprom were intended for sale abroad. To prevent the control over Gazprom from being lost to foreign parties, shares were only sold abroad with management approval [Goldman 2008].
149 However, Gazprom’s monopoly on gas transport meant that the efforts of other oil companies to market their associated gas were generally opposed. As a result, the gas that was released during the production oil (approximately 20 bcm/y) was flared [Victor and Victor 2006].
150 In 1993, the value of Gazprom’s tax exemptions equalled 1-2 percent of the Russian GDP [Åslund 2007].
151 Many of the oligarchs had become rich trading Western goods in the Soviet Union, during the reforms under Gorbachev. The oligarchs used the bank positions they had acquired to build up their capital, by such means as provid-ing capital to the government in exchange for government bonds carrying high interest rates. Their positions in the industry were reinforced by the voucher privatisation in 1992 [Åslund 2007; Hoffman 2002]. For a detailed (journalis-tic) discussion of the oligarchs' backgrounds, see for example Hoffman [2002] and Freeland [2000].

132
Moreover, the loans-for-share programme launched the privatisation of the oil sector, allowing the oligarchs and Western energy companies – albeit to a minor extent because of the partial exclusion of foreign operators – to acquire oil interests [Zhizhin 2007; Fred-holm 2005].152 However, an unfavourable economic climate for banks and the lack of proper competition (for example because of restrictions on the auction) meant that the auction of parts of the oil sector generated less than the government had expected [Janssen 2004]. Despite a number of proposals to deregulate the gas industry, Gazprom was excluded from the loans-for-share programme, largely because of the political lobby [Victor and Victor 2006; Åslund 2007]. Yet Itera's position as an intermediary became stronger and stronger, and as the 1990s progressed it became the second largest producer of gas after Gazprom, thanks in part to its close political and other ties with Viakhirev and Ukrainian politicians. This allowed Itera and several politicians to withdraw billions of dollars from Gazprom's profits [Goldman 2008; Panjoesjkin and Zygar 2008].153 After Yeltsin’s new term in office had been achieved, the reformers called for new reforms in order to stimulate a ‘normal’ market economy. However, that process was opposed by the oligarchs. The conflicts between the various sides helped bring about the financial crash of August 1998 [Åslund 2007]. In addition, Russia's fiscal and monetary policies were weak, owing among other factors to tax evasion, substantial expenditure to artificially maintain a high exchange rate for the rouble and the first war in Chechnya [Åslund 2007]. Moreover, as a result of the financial crisis in Asia in 1997 and 1998, which caused the demand and prices for energy to drop, Russian export income from gas and oil fell, and the growing budget deficit could no longer be financed. The financial crash in 1998, cou-pled with the subsequent devaluation of the rouble, also caused problems for the Russian government with its interest payments and repayments of government bonds. This caused instability in the banking system, and created difficulties for the oligarchs [Åslund 2007; Goldman 2008].154 The effects of the financial crisis and the low oil prices had a downward impact on the profitability of the oil sector, which meant that the export markets could no longer com-
152 The privatisation was also part of the first official post-Soviet energy strategy under Yeltsin, based on the document ‘On the Main Directions of Energy Policy and restructuring of Fuel and Energy Industry of the Russian Federation for the Period up to the Year 2010’. The decree from 1995 provides for ongoing privatisation in the upstream oil sector. How-ever, state influence in the midstream was increased: the transport elements remained under the supervision of the Russian state [Cors 1997].
153 For example, Gazprom sold gas to Itera for $4 per mcm, which was then sold in Ukraine for $80 per mcm (while the actual price in Ukraine was around $42 per mcm) [Goldman 2008].
154 A number of primarily young oligarchs managed to profit from the financial crisis, however, by acquiring interests commodity-producing companies, which had dropped far below their market values. Yukos, for example, increased its assets portfolio in this manner [Goldman 2008; Åslund 2007].

133
pensate the losses on the Russian market. Borrowings of foreign capital increased the Western influence [Åslund 2007; Janssen 2004]. At the same time, a process of consolida-tion took place following the privatisation process, and profitable divisions were demerged and transferred abroad. The consolidation made the oil sector more attractive to investors and made it possible to reduce tax liabilities [Janssen 2004; Goldman 2008]. The gas market's management lost some of its political protection when Chernomyrdin was no longer Prime Minister in 1998 [Panjoesjkin and Zygar 2008]. Gazprom's man-agement then proposed large-scale asset stripping, which led to parts of Gazprom’s assets being transferred to Itera and other companies that had close ties with Gazprom’s man-agement [Åslund 2007]. In addition, prices in the industrial sector were liberalised and Gazprom's tax evasion was addressed by tackling barter agreements and increasing tax rates [Stern 2005; Åslund 2007].155 Until 1997, state ownership remained at 40 percent.156 In June 1998, Gazprom became a Russian open joint-stock company (Otkrytoe Aktsionernoe Obschestvo – OAO), and in the same year Ruhrgas of Germany acquired a 2.5 percent interest in Gazprom, which was later increased [Stern 1999; Gazprom 2008a]. As a consequence of the financial crisis, a number of fiscal and regulatory reforms were implemented quite quickly, although major reforms were not implemented until Putin became Prime Minister in 1999 and shortly afterwards President (see also Chapter 10). In the same year, the effective policy of OPEC, combined with the recovery of the global economy, caused oil prices to start rising again in March 1999. The premise of the higher oil prices allowed Putin to increase his control over strategic sectors such as the energy sector. The higher oil prices also generated more export income and improved self-awareness [Åslund 2007; Goldman 2008].157 Although Putin was still working with the Yeltsin ‘family’ during his first period in office, he soon put forward former Komitet Gosoedarstvennoj Bezopasnosti (KGB) members and technocrats from his period in St. Petersburg [Goldman 2008].158 For the gas sector, Putin started to become actively in-volved in implementing reforms in Gazprom's management, in response to the corruption
155 In 1998, access rights to the Russian pipeline network were also given to third parties. Approximately 20 shippers made use of that possibility in 2000, and represented almost 17 percent of the total transit in the UGTS [Stern 2005].
156 Russian organisations held 35.3 percent of the shares in Gazprom in 1997, Russian individuals held 21.85 percent and the remainder was held by foreign investors (1.98 percent) and the Russian Federal Property Fund (0.87 percent). In 1996, 1 percent of the shares in Gazprom were made available to foreign investors, in the form of London Deposi-tory Receipts (LDRs) [Stern 1999].
157 In economic terms (1) market reforms were encouraged; (2) monetary policy was improved, in part through the influence of the IMF and the World Bank, causing the devaluation of the rouble; (3) legal and fiscal reforms were implemented; (4) deregulation was carried through to encourage small businesses; and (5) the possibility of joining the World Trade Organisation (WTO) was considered [Åslund 2007].
158 A distinction is made between initiates coming from the KGB (the Soviet Union's principal security and informa-tion service, known as siloviki) and technocrats from St. Petersburg: mostly young liberal economists and legal experts from St. Petersburg (such as Medvedev and Miller), who advocated private ownership and a free market economy. See also Goldman [2008; pp. 192-194].

134
there. In 2001, for example, Putin had Viakhirev replaced by Dmitry Medvedev and Alexey Miller [Goldman 2008]. As a result of the financial crisis in 1998, foreign investors managed to increase their share in Gazprom to 10.31 percent in 2000. The Russian gov-ernment also owned 38.37 percent of the shares [Stern 1999].159 6.2.2 Russia’s transition process: constraints and opportunities for
Gazprom’s strategy
The macro-economic developments in Russia and the institutional choices within the Russian gas sector imposed restrictions on and created opportunities for the strategy adopted by Gazprom in the 1990s. Owing in part to those institutional choices, Gazprom acquired control over approximately 70 percent of the gas fields during the 1990s, and it became largely responsible for Russia's gas production, alongside a number of oil compa-nies that also produced gas and independent or quasi-independent gas producers (see Chapter 10) [Zhiznin 2007].160 Following the disintegration of the Soviet Union, Gaz-prom lost a third of its pipeline capacity and a quarter of the original Soviet compression capacity. Over the years, Gazprom attempted to regain and retain control over the net-work [Victor and Victor 2006]. The decline in gas production was relatively minor after the Soviet Union collapsed: from 600 bcm in 1991 to 561 bcm in 1996 (6.5 percent) [BP 2008]. The demand for gas in Russia, conversely, dropped by 11.8 percent, from 431 bcm in 1991 to 380 bcm in 1996, while exports to the other Soviet states fell by 31 percent (from 110 bcm in 1990 to 76 bcm in 1998), one of the causes being the economic instability and the rising regulated gas prices [Stern 2005; BP 2008].161 The increasing difference between Russian production and consumption needed to make its way to other profitable growth markets, and North-western and Southeastern Europe in particular (see Chapter 7) [Victor and Victor 2006]. The surplus that had been created removed the need for large-scale investments in new fields, on the Yamal peninsula and in the Shtokman gas field for example. Moreover, the exports to the Western market matched the objective of increasing the profitability of the gas industry [Victor and Victor 2006]. It proved impossible to increase the profitability of the internal gas sector. It was politically inadvisable to raise Russian gas prices substantially and rapidly, and moreover not in Gaz-prom's interests, as a profitable domestic market would result in cries to break up and
159 The Russian Federation is represented by the Federal Agency for Federal Property Management (38.4 percent), state enterprise OAO Rosgazifikatiya (0.9 percent) and OAO Rosneftegas (10.7 percent). Russian organisations held 33.6 percent of the shares and Russian individuals held 17.7 percent [Stern 1999].
160 In the 1990s, non-Gazprom gas production was approximately 35-40 bcm/y [Stern 1999].
161 Conversely, the imports from Central Asia, and particular Turkmenistan, dropped sharply (see also Section 6.3). The electricity sector is responsible for a large part of the demand for gas in Russia (some 40 percent). Households represent around 20 percent of the Russian demand [Stern 2005].

135
reallocate Gazprom’s assets.162 However, Gazprom had a degree of latitude in the former Soviet states (see Section 6.4) [Victor and Victor 2006]. Political opposition to tackling payment defaulters prevented Gazprom from taking real measures.163 However, from 1999 onward, concrete measures were implemented to deal with the defaulters [Stern 2005]. During the 1990s, Gazprom entered into important strategic alliances with such partners as Ente Nazionale Idrocarburi (ENI), Shell, Ruhrgas, Badische Anilin- und Soda-Fabrik (BASF) and Lukoil of Russia. The Western alliances comprised various elements. Besides their financial resources and credit ratings, Western companies also provided technical support for the projects. They also mostly worked together to develop Gazprom’s oil and gas reserves. Strategic alliances were generally reinforced by asset-swaps along the value chain [Stern 2005; Stern 1999].164 6.3 Repositioning of the Caspian gas region
The collapse of the Soviet Union and the end of the Cold War had a substantial impact on the direction and organisation of gas flows from the Caspian region.165 Gas transports from the Caspian region during the Soviet era depended entirely on transport to Russia by pipe-line. Following the collapse, Russia wished to retain its influence over the gas corridors from the Caspian region [Olcott 1996]. However, because of the lack of demand from Russia and other Soviet republics, the Caspian countries, particularly Turkmenistan, opted for multiple gas transport routes. In addition, the partial opening of the gas market al-lowed Western companies access to the Caspian gas reserves [Kalyuzhnova et al. 2002]. In the search for new geographic markets and alternative routes, Turkmenistan and other Caspian countries encountered strategic competition between governments within the region and beyond and between national and international oil and gas firms. In this play-ing field, the various interests of the Western, Russian and other governments clashed.
162 As a result, the regulated Russian gas prices remained far below European wholesale gas prices (approximately 20 percent of the European wholesale gas price).
163 The economic recession, the higher domestic gas prices, the continued absence of proper government policy and problems in the banking system combined to create payment difficulties. Until the end of the 1990s, the payment ratio was between 40 and 50 percent. However, disconnecting customers on a large scale was socially and politically inadvis-able, particularly during winter. In 1996, Gazprom formed Mezhregiongaz in order to centralise sales in Russia, for the purpose of raising the payment ratio [Stern 2005].
164 Important business partnerships came about during the 1990s, for example with Gasunie of the Netherlands and with Statoil and Norsk Hydro of Norway. In addition, important business partnerships were built up with contractors, to construct and supply materials. For Western companies, partnership with Gazprom continued to represent risks, such as the lack of certainty about third-party access in Russia [Stern 1999].
165 See Chapter 9 for a detailed analysis of the statistics, strategies and pipeline projects in the Caspian region. The oil market is not included in that analysis. For an extensive analysis of the oil market, see for example Amineh [2003]. Kyrgyzstan and Tadzhikistan are also disregarded, as those countries were not major gas producers or consumers in the 1990s (less than 1 bcm/y). Uzbekistan was the principal exporter to those countries. Moreover, Kyrgyzstan and Tadz-hikistan did not play an important role in terms of gas transit (only small intra trade and possible to China) [Stern 2005].

136
Transit risks, political issues and conflicts also influenced the possible strategies [Amineh 2003]. In this study, the emphasis is on the countries that played an important role in the gas sector. In terms of production, Turkmenistan, Kazakhstan, Azerbaijan and Uzbekistan have notable oil and gas reserves, with Turkmenistan possessing by far the greatest export potential. In addition to these countries, Georgia also plays an important role in terms of transit. 6.3.1 Developments in the Caspian gas market
During the time of the Soviet Union, the Soviet republics in the Caspian region had only a limited degree of autonomy. Following the collapse of the Soviet Union in 1991, the new independent states were forced to refind their internal political legitimacy, which was mostly obtained by the autocratic former members of the Communist Party [Katz 1997; Kalyuzhnova et al. 2002]. During the process of transition, new alliances were formed within the region and across the international spectrum. Although Russia's absolute he-gemony over the Caspian region disappeared, Russia continued to play a dominant role in the new political alliances, for example through the CIS [Olcott 1996]. With the excep-tion of Turkmenistan, which retained its independent status, the countries in Central Asia focused primarily on cooperation with Russia.166 The countries in the Caucasus, Ukraine and Moldova, conversely, also formed regional organisations without Russian involve-ment. An example of such an organisation is the Georgia, Ukraine, Azerbaijan, and Moldova Organisation for Democracy and Economic Development (GUAM), that looked to European and Atlantic security structures such as the North Atlantic Treaty Organisa-tion (NATO) for partnerships [Amineh 2003]. On the side of the West, the US was inter-ested chiefly in the Caspian region. The involvement on the part of the Europeans was less than expected, except for a few initiatives such as Interstate Oil and Gas Transport to Europe (INOGATE) and the Technical Assistance for the Common Wealth of Indepen-dent States (TACIS) programme [Bossuyt 2008]. Besides approaching parties in the West, the Islamic countries around the Caspian region strengthened their ties with the predomi-nantly Islamic region, with such alliances as the Economic Cooperation Organisation (ECO) and the Organisation of Islamic Conference (OIC). Asia played an insignificant role in the Caspian region during the 1990s [Amineh 2003]. Moreover, there was no longer an integrated economic system in which Moscow used the Gosplan to plan the economy, resulting in communal infrastructures for water, roads, railroads and energy. The subsequent transition had major implications for, among other
166 Other security-focused and economic organisations besides the CIS that focused on cooperation with Russia and in which the Central Asian countries participated included the Shanghai Cooperation Organisation (SCO), known formerly as the Shanghai Five Group, the Collective Security Treaty Organisation (CSTO) and the Central Asian Union (CAU), which was later converted into the Central Asian Cooperation Organisation (CACO) [Lukin 2004; Kalyuzhnova et al. 2002; Amineh 2003].

137
things, the way in which the flows of gas from the former Soviet states were organised [CIEP 2008]. Owing to the decline in the demand in Russia and other CIS countries, discussed above, gas production from Central Asia became less crucial in the Russian ‘gas portfolio’. This development, combined with Russia's internal problems, meant that Mos-cow and Gazprom devoted less attention to gas from Central Asia during the first half of the 1990s.167 As a consequence, Central Asia started to look for a different strategy for marketing its gas and oil reserves [Victor and Victor 2006]. The removal of Moscow's absolute hegemony attracted other countries to the Caspian gas and oil reserves, such as the West (the US in particular) and its international energy firms [Forsythe 1996]. The gas supply of the Caspian region could compensate for the decline in the European gas production, and offered the region a way to diversify its gas supplies. However, the political instability and the poorly functioning legal system combined with low oil and gas prices to create an unfavourable investment climate for foreign parties. Of the Caspian countries in that time, Kazakhstan was most open to foreign investments [Amineh 2003; Kalyuzhnova et al. 2002].168 The unstable investment climate did not deter the national energy firms of the Caspian and surrounding countries to the same extent [Amineh 2003; Stern 2005]. Turkmenistan headed the list for the Caspian gas reserves and production, followed at some distance by Uzbekistan, Kazakhstan and Azerbaijan. At the end of the 1980s, Turk-menistan was producing over 80 bcm/y. In the 1990s, Turkmen production dropped, to 56.1 bcm to 1992 and to 12.4 bcm in 1998, as a result of the diminishing demand from Russia and the CIS and the difficulties with the gas trade between Turkmenistan and Ukraine, among other things [BP 2008; Stern 2005]. The recovery in demand after 1998 caused the Turkmen production to rise substantially, intended largely for Russia and Ukraine [BP 2008]. Gas production in Kazakhstan also declined in the 1990s, returning to its former levels of 6-7 bcm/y around 1997. Owing to the large domestic consumption volumes, Kazakhstan became a net importing country during the 1990s [Amineh 2003]. The Azeri gas production also dropped substantially: in 1985, during the Soviet era, Azer-baijan produced over 30 bcm, which had dropped to 8 bcm by 1991 and to 5.2 bcm by 1998 [BP 2008]. Contrary to the other countries in Central Asia, Uzbekistan increased its gas production from 39.1 bcm in 1991 to over 50 bcm/y by the end of the 1990s [BP
167 Other Russian gas and oil companies, such as Lukoil and Yukos, were interested. In July 2000, Lukoil, Gazprom and Yukos launched a joint venture to develop the Caspian reserves as part of the Eurasia Gas Alliance (EGA) [Amineh 2003; Zizhnin 2007].
168 Chevron set up the TengizChevroil to explore the Tengiz oil field in Kazakhstan. Western companies were subse-quently also granted access to other fields in Kazakhstan, including the Kashagan field. In 1994, the Azerbaijan Inter-national Operating Company (AIOC) was formed in Azerbaijan, in which BP and, from the US, ExxonMobil played leading roles [Baghat 2002]. The international energy firms from Europe – such as Total, Royal Dutch Shell, ENI and BP-Aramco – also held ownership interests in the upstream sector of the Caspian region [Amineh 2003].

138
2008]. In addition, Uzbekistan and Kazakhstan were, and still are, the most important transit countries for exports from Turkmenistan [Stern 2005]. 6.3.2 Caspian gas export flows: new pipeline routes in the 1990s
Because the Caspian region is surrounded by land mass and possibilities for transporting gas are generally missing, Turkmenistan and the other countries in the Caspian region were limited in their export options [Amineh 2003; Stern 1999]. The existing Soviet pipe-line network allowed Russia to retain control over three quarters of the Turkmen export [Stern 1999]. The pipeline network that had been developed during the Soviet era, the Central Asia Center (CAC) pipeline, connects the countries east of the Caspian Sea to the Russian market. The Western Corridor links the Turkmen fields near the Caspian Sea to the Russian UGTS. The Eastern Corridor connects the gas fields in the east of Turkmeni-stan and the south of Uzbekistan to the Russian gas pipeline network by way of Western Kazakhstan. From the Russian pipeline network the gas is shipped to the markets in Russia or outside (CIS and Europe). The maximum capacity that could be shipped from Turk-menistan and Uzbekistan to Russia was approximately 100 bcm/y, though the capacity was reduced by poor technical condition (see also Chapter 9) [EIA 2007]. Central Asia also possesses a solid internal network.169 Immediately after the ‘collapse’ Turkmenistan demanded that the other former Soviet republics started paying for the supplies of gas in hard currencies at global prices, which led to a large number of conflicts about payment defaults and interruptions in the gas supply. The Turkmen supply problems with Ukraine (up to 25 bcm/y) were the most noticeable. Because of these problems, trade based on bilateral barter was initially used between Ukraine and Turkmenistan, without any direct interference from Gazprom [Stern 1999]. Subsequently, from 1994 onward, Itera became increasingly involved in a large portion of the gas supplies, as an intermediary. Gazprom permitted this course of action, owing to continuing payment difficulties and the personal financial interests of the man-agement and politicians (see Section 6.2.1). In November 1995, Gazprom (45 percent), Turkmenneftegaz (51 percent) and Itera (4 percent) set up a joint venture (Turkmenros-gaz) for the purpose of selling gas [Stern 1999; Åslund 2007]. Mid-1997, Turkmenrosgaz was dissolved unilaterally by the Turkmen, owing to Itera's increasing debt, and the gas export to Ukraine was discontinued until 1999.170 In January 1999, the supplies were started up once more, with Itera becoming responsible for transit and sales to Ukraine, without Gazprom's involvement. The other Central Asian countries used similar methods
169 The principal export pipeline for gas from Uzbekistan is the Tashkent-Bishkek-Almaty gas pipeline. That pipeline passes through Kyrgyzstan to Kazakhstan, and has a maximum capacity of 4.5 bcm/y. The supplies of gas often en-countered difficulties caused by illegal tapping in Kyrgyzstan and by the irregular supply in Uzbekistan [EIA 2007].
170 In 1998, Uzbekistan exported a small volume to Ukraine when the Turkmen supplies ceased.

139
during the 1990s (with or without Gazprom's involvement), though their exports were very minor [Stern 2005; Stern 1999].171 Because of the diminishing exports to Russia and other former Soviet republics, Central Asia started looking for a different export strategy for marketing the gas and oil reserves, focusing initially on the Iranian, Turkish and Pakistani and Indian markets [Victor and Victor 2006]. The Turkmen gas pipeline to Iran was realised first, making it the first Cen-tral Asian export pipeline to circumvent Russian territory (with the exception of the pipe-lines within Central Asia). The Korpezhe-Kurt Kui gas pipeline, as it is called, was built in 1997 and has a maximum capacity of 13.5 bcm/y (Turkmenistan supplied 6 bcm/y to Iran). The pipeline was linked to the Turkish gas network through Iran's domestic gas network, using the Tabriz-Erzurum pipeline [EIA 2002].172 Starting in March 1995, the possibility of constructing a gas pipeline from Turkmenistan through Afghanistan to Pakistan (and India), being possible markets, was concretely exa-mined by the Central Asia Gas Pipeline Ltd. CentGas Consortium, which was led by Unocal of the US. That strategy was supported by the US government, though the politi-cal risks in Afghanistan caused Unocal to withdraw from the pipeline consortium in 1998 [Amineh 2003; EIA 2007]. The diversification of gas transport routes from Russia to the West, initially to Turkey, began midway through the 1990s, with Western help [Amineh 2003]. The Trans Caspian Gas Pipeline (TCGP) was the most concrete project, and tried to link the growing Turkish market with the gas fields in Turkmenistan (and Kazakhstan and Azerbaijan) by way of an offshore pipeline through the Caspian Sea, followed by an onshore pipeline through Azer-baijan and Georgia, without involving Russia or Iran. Despite a number of feasibility stu-dies, the TCGP project was not realised during the 1990s, owing to a proactive strategy on the part of Gazprom and Russia in the various parts of the value chain, transit uncertain-ties around the Caspian Sea and market uncertainties, among other factors. Following the discovery of the Shah Deniz field in Azerbaijan in 1999, Azeri exports were effected through the South Caucasus Pipeline (SCP) to Turkey [EIA 2007].173
171 At the end of the 1990s, Azerbaijan began to import gas from Turkmenistan, through Itera. Itera also supplied Georgia (up to 1.1 bcm/y) and Armenia (up to 1.51 bcm/y) with gas. It was not until 2003, following Itera's dissolu-tion, that Gazprom assumed the role of exporter. Twice, Gazprom supplied small volumes of gas to Georgia (in 1994: 0.4 bcm; in 1997: 0.1 bcm) [Stern 2005; Stern 1999].
172 The costs were $190 million. Of the Turkmen supplies, 35 percent was part of a barter agreement for the Iranian construction costs. The contract was not very solid. Iran's internal economic problems and its economic isolation (caused by the Iran and Libya Sanctions Act) prevented it from developing itself further as a transit country [Amineh 2003]; see also Case 1 in Chapter 11.
173 See Case study 1 in Chapter 11 for a detailed analysis of the planned pipeline projects to the Turkish gas market that competed with Russia's pipeline project Blue Stream.
140
There was not a great deal of interest in a gas corridor to the Orient during the 1990s. It was not until the mid-1990s that China started to import gas and oil. In 1995, an agree-ment was signed to have China's state-controlled oil and gas company China National Petroleum Corporation (CNPC), ExxonMobil and Mitsubishi carry out a feasibility study. However, financing, legal and political transit-related issues prevented the project from being realised during the 1990s [Amineh 2003].174 See Map 8.2 for a current geographic overview of the pipeline projects. 6.4 Gas sales and transit issues in Ukraine and Belarus
The disappearance of the Soviet Union and the CMEA meant that there was no longer a joint regulation model for gas transports.175 At the same time, ownership of parts of the UGTS reverted to new governments and national and private gas companies, increasing the risks associated with gas supplies and transit to all of Europe. During the 1990s, it gradually became apparent that the CMEA and Baltic countries would choose the EU's energy acquis, which resulted in contracts based on market conditions becoming more or less standard (see Chapter 7). The organisational transition of gas transports and sales in the former Soviet states (Ukraine, Belarus and Moldova) was different. The ‘old contracts’, under which the regulated prices were low, remained in effect, while moreover the eco-nomic and political influence from Russia continued to be felt, despite the fact that West-ern influences also increased [CIEP 2008]. Until 1994, Gazprom was exclusively responsi-ble for Russian exports to the CIS. Itera took over the role of provider and shipper of Cen-tral Asian (mostly Turkmen) gas to the former Soviet republics [Stern 2005]. The emphasis in this section is on the transit dealings between Russia and Ukraine and Belarus, since the transit and storage of gas in Ukraine (and Belarus) is vital to supplies to Europe. At the end of the 1990s, the Ukrainian transit represented more than 90 percent of Russia's gas exports in Europe.176 In 1999, additional gas supplies were started by way of Belarus, causing that share to drop slightly (to around 80 percent). Moreover, most of Russia's (and Turkmen) exports to former Soviet countries were destined for Ukraine and Belarus [Victor and Victor 2006].177
174 It was also thought that the gas from Central Asia might stimulate the development of the gas fields in China's Xinjiang region and the transport of that gas to the eastern and southern parts of China.
175 For a detailed and chronological analysis of the transit dealings between Ukraine and Russia and Belarus and Russia, see for example Stern [2005] and Pirani et al. [2009].
176 The gas flows to Belarus, the Baltic states and Finland did hardly involve any transit countries [Stern 2005].
177 Of the total gas trade within the CIS, Ukraine (and Belarus) represented 75 percent of the total import. The Russian transit is also very important for the economy of Ukraine (and later also for that of Belarus) [Stern 2005].

141
6.4.1 Gas transit and sales relation between Ukraine and Russia
The disintegration of the Soviet value chain caused commercial and political conflicts between Russia and Ukraine about the transit and sales of gas. The gas network in Ukraine was already well developed during the Soviet era, because:
• Ukraine historically produces its own gas, though the gas production dropped dramatically during the 1980s and 1990s (40 bcm in 1985, 26.2 bcm in 1990 and 16.7 bcm in 2000) [BP 2008].
• the consumption of gas in Ukraine was substantial, despite diminishing in the 1990s as a result of the economic decline and the increased prices of imported gas (from 127.8 bcm in 1990 to 73.1 bcm in 2000) [BP 2008]. The differences be-tween the volume consumed and the domestic production had to be imported from Russia and Turkmenistan, which called for pipelines.
• Ukraine's geographic position made it suitable for the Russian transit routes to Europe [Gustafson and Sager 2003]. Moreover, its geographic situation at the edge of the Soviet Union meant that Ukraine was also a suitable location for the storage facilities [Victor and Victor 2006].178
Ukrgazprom, and from 1998 onward state enterprise Naftogaz Ukraine, became responsi-ble for the gas market in Ukraine [Stern 2005]. Almost 95 percent of the domestic gas production was controlled by Naftogaz or its subsidiaries. Subsidiary Ukrtransgaz had a monopoly on gas transmissions and storage in and through Ukraine [IEA 2006].179 More-over, Naftogaz Ukraine was responsible for most of the gas imports from Russia and Cen-tral Asia [IEA 2006]. Besides the state enterprise, intermediaries such as Itera also played an important part in the supplies of gas in Ukraine [IEA 2006; Stern 2005]. Although Ukraine depended on Russian gas imports, the country's economic instability meant that it was unable to higher prices demanded. Russia was unable to take any hard measures to force Ukraine to pay the higher prices, because the transit of Russian gas to Europe depended on Ukraine, among other things. Despite various resolutions and agreements, involving independent gas traders and Turkmen gas, the relationship between Ukraine and Russia was not very strong during the 1990s. That relationship was character-ised by a series of seven ‘issues’ that were the cause or consequence of the problems in the relationship [Gustafson and Sager 2003; Stern 2005]. 1) During the process of transition to a market-driven system during the 1990s, the
former Soviet countries continued to profit from the low prices for gas from Russia
178 To ensure the certainty of supply of Russian export gas (originating mostly from the West Siberian gas fields) and to allow for the seasonal fluctuations in the European demand for gas, it was necessary to store gas relatively close to the market. In addition, gas storage was also necessitated by technical complications in the network, owing to the combi-nation of an area with difficult access and the poor quality of the materials [Victor and Victor 2006].
179 Chornomornaftogaz was responsible for gas transmissions in the Crimea.

142
and Turkmenistan. The gas prices were regulated and ‘linked’ to certain price zones in Russia. Most of the former Soviet economies were unable to absorb exponential price increases in their economies. In addition, Gazprom used the low regulated prices and barter agreements (generally through intermediaries) to create an ‘opening’ to regain control over the gas network [Victor and Victor 2006; Stern 1999].
2) Ukraine encountered difficulties paying its gas bills. Besides Russia's transit payments in kind (approximately 25 bcm/y), Gazprom also supplied gas to Ukraine commer-cially. Until 1992, that supply was substantial (65-85 bcm/y), though starting in 1993 that share was reduced to 15-25 bcm/y. Intermediary Itera gradually took over Gaz-prom's role during the 1990s (see below).
3) During the cold winters, the volumes of gas consumed often exceeded the volumes arranged contractually. Ukraine illegally tapped some of the gas intended for transit to Europe from the network. The illegal tappings are estimated to have been as high as 10 bcm/y in some years [Gustafson en Sager 2003; Stern 2005].
4) The payment defaults and the gas consumption above contractual limits meant that Ukraine's debts to Russia and Turkmenistan increased. The total debt was established in agreements, and repayment schedules were arranged using loans. The 1995 agree-ment established the debt as $1.4 billion. Payment defaults continued in the following years, which led Russia's claims to be adjusted upward [Stern 2005; Gustafson and Sager 2003].180
5) Ukraine occasionally ‘re-exported’ gas (through intermediaries) to Poland and other countries, despite the prohibition under the destination clause. According to Russian sources, the gas volumes concerned was minor. It is unclear how regularly gas was re-exported [Gustafson and Sager 2003].
6) In extreme situations, when the negotiations about the outstanding debts and illegal gas tappings ground to a halt, both Russia and Turkmenistan blocked the supply of gas to Ukraine. Other former Soviet countries (such as Georgia and Belarus) that could not fulfil their payment obligations also encountered, or were threatened with, boycott measures. Itera's increasing debts caused Turkmenistan to stop its gas supplies from 1997 to 1999 [Victor and Victor 2006; Stern 2005].
7) The intermediaries caused the system to become unstable and prevented a transparent, commercial relationship between Ukraine and Russia. In 1994, Itera became respon-sible a large part of the gas exports to Ukraine and other former Soviet states. The role of intermediaries was redefined frequently, and was based on complex barter agree-ments. Gazprom's management allowed these transactions because they had personal interests [Goldman 2008; Åslund 2007]. Gazprom's new management (from 2001 onward) shifted part of the exports to new entities working for their own (personal) advantage (Eural Transgaz from 2003 onward, and from 2005 on RusUkrEnergo)
180 At the end of the 1990s, Russian government sources determined that Ukraine's debt to Russia had risen to $1.95-3 billion. Gazprom calculated a debt of $3 billion. Ukrainian sources maintained that the debt was around $1.41-2.8 billion, with the government of Ukraine using the higher estimate [Stern 2005; Gustafson and Sager 2003].

143
and dismantled Itera [Åslund 2007]. Itera undermined Gazprom's control over the exports, and the Ukrainian industrial market became more profitable [Gustafson and Sagers 2003; Goldman 2008; Stern 2005].
During the 1990s, a series of intergovernmental and commercial agreements were signed, for example in 1994, 1998 and 2001, to resolve these problems. In 1998, the decline in foreign income from gas, caused by the low international oil and gas prices and the pay-ment defaults in Russia, combined with the Russian financial crisis, increased the pressure on Gazprom and Russia to make the gas exports to the former Soviet states more profit-able. The concept of active Russian policy was also stimulated by the continuing domestic problems (primarily political) in Ukraine, that country's gradual political reorientation toward the West, Putin's presidency and the change in management at Gazprom; see also Chapter 12 [Stern 2005]. 6.4.2 Gas transit and sales relation between Belarus and Russia
The bilateral gas dealings between Russia and Belarus were less significant than those be-tween Russia and Ukraine.181 In addition, production in Belarus was minimal (some 0.2 bcm/y) [EIA 2003]. Beltransgaz was responsible for import contracts and the Belarus transport network. In the 1990s, Gazprom's sales in Belarus dropped from 17.6 bcm in 1992 to 10.8 bcm in 2000, and were replaced largely by Itera. Part of the transit through Ukraine passed through Belarus, using the Northern Light gas pipeline with a capacity of approximately 25 bcm/y. Russia also supplied gas to Poland by way of Belarus (7 bcm/y). From 1999 onward, transit through Belarus became more important with the construction of the Yamal-Europe Pipeline. The strong political and economic ties between Russia and Belarus meant that it was easier to realise Gazprom's participation in new pipelines; see also Section 6.4.3 and Chapter 7 [Stern 2005]. By and large, Belarus had the same prob-lems with importing Russian gas as Ukraine did [Stern 1999; Stern 2005].182 6.4.3 Gazprom’s mitigation strategy for transit risks
Gazprom used a two-pronged strategy to mitigate the increased transit risks. Firstly, it tried to increase its control over the current pipeline network to Europe. Secondly, it low-ered the project risks by diversifying the transport routes to Europe.183
181 In addition to Ukraine and Belarus, Gazprom also supplies gas to Moldova, and depends on transit. However, Moldova's purchases of Russian gas are very minor (2-4 bcm/y). Moldova was encumbered by high debts owing to non-fulfilment of its obligations, though. The greatest problem of the TransDnestr region were payment defaulters. The volume of transit through Moldova is approximately 20 bcm/y, intended for the gas market of South-eastern Europe, including Turkey. In 1998, a consortium was put together to manage the existing assets in Moldova's gas market. The new entity, Moldova Gas, was owned by Gazprom (50 percent), Moldova (35.3 percent), the TransDnestr region (13.44 percent) and individual shareholders (1.23 percent; mostly employees) [Stern 1999; Stern 2005].
182 In 1998 estimates of the total debt varied from $250 to $500 million [Stern 2005].
183 Another method to reduce transit risks was to build additional gas storage facilities; see also chapters 10 and 12.

144
Throughout the 1990s, various pipeline consortiums were proposed for the purpose of mitigating the operational risks and risks of interruptions by dividing them between mul-tiple private and public parties. Initially, Gazprom tried to convince Ukraine's government to transfer operational control over the pipeline system to a joint venture or through di-rectly held ownership. However, the government and parliament of Ukraine rejected such propositions, based on considerations of security of supply (i.e. in order to reduce third-party influences) [IEA 2006; Gustafson and Sager 2003]. In 1996, Royal Dutch Shell proposed an international consortium in which Russia was also to participate, though that proposal was rejected in 1997, because Shell's bid was too low [Gustafson and Sager 2003; Stern 2005]. Three years later, Ukraine presented a serious proposal, suggesting that 50 percent of the shares less one share be sold to international operators. Gazprom re-quested part of the shares in exchange for repayment of the outstanding debts. The Rus-sian request caused a nationalist reaction in Ukraine, leading to the consortium proposal being rejected [Gustafson and Sager 2003].184 Another international consortium proposed later involved the Ukrainian and Russian parties, the German government and Ruhrgas [Gustafson and Sager 2003; Gustafson and Telyan 2007].185 Following the Orange Revo-lution in 2004/05 – which resulted in the election of pro-Western President Yushchenko – that consortium proposal disappeared from the agenda (see Chapter 12) [Stern 2005; Gustafson and Telyan 2007]. Various proposals were also put forward in Belarus to regain control over the network, either through ownership interest or else through a joint venture. Gazprom achieved suc-cess with the construction of the Yamal-Europe pipeline, by acquiring full ownership of the Belarus’ section. Agreements for gas sales and transit from 1993 and 1995 also in-cluded lease arrangements between Gazprom and transmission company Beltransgaz. Gaz-prom increased its supplies to Belarus in exchange for leasing the current Belarus gas net-work. During the 1990s, an ownership interest in the Belarus gas network was unrealistic, even in the form of a joint venture [Stern 2005]. It had not proved to be easy for Gazprom to regain control over the pipeline and storage system of Ukraine. To improve its bargaining position for purposes of determining the tariffs and royalties in dealings with transit countries, attempts were made to build up a diversified gas transport network [Gustafson and Sager 2003]. Essentially, the new pipe-line projects were not realised purely in order to avoid Ukraine [Stern 2005; Victor and Victor 2006].186 Midway through the 1990s, the first pipeline project not passing through
184 In 2001, the US Embassy presented a consortium proposal to block Russian participation, though that proposal was no longer mentioned when the relationship between the US and Russia improved after the terrorist attacks on 11 September 2001 [Gustafson and Sager 2003].
185 The initial consortium concept from 2002 concerned the entire gas pipeline network and storage facilities. That concept was modified in 2003, as a result of which the consortium would only gain control over the new pipelines.
186 In 2000, Gazprom put forward one pipeline proposal with the sole purpose of circumventing Ukraine, to provide a direct connection between Belarus and Poland (and continuing to Slovakia) and take over 25 percent – ultimately

145
Ukraine was launched: the Yamal-Europe pipeline, through Belarus and Poland. An alter-native to the Yamal-Europe pipeline was a direct connection between Russia and Ger-many, via the Baltic Sea, and continuing to the UK – the North European Gas Pipeline (NEGP) – which, however, failed to materialise during the 1990s.187 In the gas market of Southeastern European, the Blue Stream pipeline, as it was called, provided a direct con-nection between Russia and Turkey, without involving Ukraine or any other transit coun-tries (see Case study 1 in Chapter 11). However, Ukraine continued to play a vital role in the transit and storage of Russian gas to Europe. 6.5 Conclusion
After the disintegration of the Soviet Union, Moscow lost control over the former Soviet republics and the CMEA and a unipolar international system arose. One implication for the gas sector was that the pipeline system in that area was broken up. Ownership reverted to new governments and national gas companies. Similarly, the joint regulation model disappeared. Market concepts were introduced to Russia in the 1990s. The managers of state enterprises initially gained control over the Russian economy, as a result of what is called ‘voucher privatisation’, although the process of privatisation was slow. In 1995, the privatisation process gained momentum with the ‘loans for shares’ programme introduced to finance the budget deficit. Loans were granted to the Russian government, in exchange for shares in the state enterprises. As a result of this privatisation process, the financial and industrial groups, more commonly known as oligarchs, gained control over many sectors (including the oil sector) owing to their positions in the financial sector and their political connec-tions. The process of reform in the 1990s resulted in the oil sector being broken up during that time. Owing to the nature of the industry and the strong political lobby, the gas sec-tor remained reasonably centralised, although part of it fell into private possession. The demand for gas in Russia and the other former Soviet republics fell sharply, because of the economic decline and the rising regulated prices (though they remained below Euro-pean market prices). A further rise in the regulated prices was politically unacceptable, as
increasing to 50 percent – of the transit through Ukraine. The proposal proved impossible to finance, because Euro-pean companies could not utilise the capacity. Moreover, Poland, with its friendly relations with Ukraine, was not in favour of such a plan, which was seen to be anti-Ukrainian [Stern 2005; Victor and Victor 2006].
187 The first time this option was considered was around 1990, by British-Russian joint venture Sovgazco. According to Victor and Victor [2006], such a route would have been 50 percent more expensive than an onshore route and impos-sible to finance. The North Transgas joint venture (a partnership between Gazprom and Fortum of Finland) con-ducted a feasibility study into the offshore section of the project between 1997 and 1999. That project would provide Scandinavia, among other regions, with Russian gas from the offshore Shtokman field in the Barents Sea. Owing to the continuing transit problems in Ukraine, Belarus and Poland, the NEGP concept was once more examined at the beginning of the 21st century, this time with Germany and the Netherlands as the partners; see Case study 3 in Chap-ter 11 [Nord Stream 2008; Stern 2005; Gustafson and Sager 2003]. Other pipeline options that were considered went by way of Belarus and Kaliningrad and through the Baltic states and Belarus.

146
were hard measures against payment defaulters. As such, the only way in which the gas industry could be made more profitable was to turn to the profitable European export market. The fact that production remained relatively stable, moreover, made it possible to greatly increase the volumes without making any new large-scale investments in the pro-duction area. Because the internal demand for gas in Russia vanished, the imports from the Caspian region were less vital during the early 1990s. Since the Caspian countries were partially dependent on transport by pipeline to Russia, they started looking for alternative markets. That policy was supported by the West (and by the US in particular). Structural internal socio-economic problems, such as a poorly functioning legal system, caused delays in the investments. Combined with the low oil and gas prices, heavy competition in new off-take markets and transit risks, which had a downward effect on profitability, this meant that only a small number of alternative pipeline projects were realised. Because most of Russia's exports to Europe passed through Ukraine (and Belarus), the loss of control over the pipeline systems in Ukraine and Belarus increased the risks attached to supplies and transit of gas. The decline in the economy and the increased regulated gas prices led to payment defaults in the CIS. Combined with volumes of gas above contrac-tual limits during cold winters, the debts to Russia and Turkmenistan rose and the supply of gas was occasionally shut down (for short periods), or that possibility was threatened. During the 1990s, intermediaries (particularly Itera) gradually became responsible for part of the gas exports. Itera traded the gas using complex barter agreements, with most of the gas originating in Turkmenistan. Gazprom's management allowed these transactions be-cause they had personal interests, which delayed the transition to a transparent, commer-cial relationship between Ukraine and Russia. Attempts were made to mitigate the transit risks, by reinforcing the control over and own-ership of existing and new gas networks. Various (mostly international) pipeline consorti-ums were proposed during the 1990s, to divide the operational risks and risks of interrup-tion between supplier, shipper and if possible buyer. In Ukraine, this strategy met with little success, mostly because of political objections. The strategy was more successful in Belarus, and resulted in the Yamal-Europe pipeline, among other things. In addition, the specific country-related risk attached to transit through Ukraine was mitigated by con-structing a diversified network to Europe, using the Yamal-Europe pipeline and the Blue Stream pipeline to Turkey that crosses the Black Sea. However, those pipelines were not constructed purely for the purpose of circumventing Ukraine. In response to the lack of control over the economic crisis of the 1990s, Putin tried to regain the control over Russian society. Politically, Putin advocated centralised federal power. The impact of this policy was reinforced by improved coordination and communi-cation between separate parties. Economically, various measures were implemented, in-

147
cluding further market and tax reforms. The government’s control over the Russian energy market was increased. In addition, the higher oil prices (resulting from OPEC's stricter production policy from 1999 onward) generated more export income and an improved self-awareness. As such, the perception of decision-makers within Russian government was to make energy the central factor in Russia's strategy for stimulating its economy and con-ducting an effective foreign policy; see Chapter 10.

148

149
Chapter 7 Russia’s post-Soviet gas export strategy during the
1990s
7.1 Introduction
During the Soviet era, two legal and institutional agreements were in place supporting the way the gas value chain from East to West was organised. The CMEA agreements sup-ported the gas value chain from Moscow and the EU institutes (and their precursors) sup-ported that from Brussels. Following the fall of the Berlin Wall in 1989 and the collapse of the Soviet Union in 1991, the economic and political relations on the Eurasian continent changed. The new nations that arose developed their own national interests, which some-times conflicted with other national interests [CIEP 2008]. Western geopolitical and geo-economic influence expended into the area that was formerly under Soviet influence. Li-beral democracy became the dominant ideology, on the assumption that the global econ-omy would internationalise further [Van der Linde 2006].188 Besides expanding the sphere of influence, the intention was to increase the integration within the EU. As a result, the process of liberalisation and privatisation in Europe began in the 1990s, based on neoli-beral market concepts [George and Bach 2001; Trenin 2007]. In the East, Moscow's sphere of influence crumbled with the dissolution of security-oriented, political and eco-nomic organisations (Soviet Union, Warsaw Pact and CMEA). Russia entered into a weak transition phase and was forced to concentrate on its domestic policies (see Chapter 6) [Trenin 2007]. The changes in the economic and political relationships on the continent also impacted the East-West energy trade, regulation and diplomacy [CIEP 2008]. Gazprom adjusted its export strategy in response to the change in Europe, yet the lack of capital and central planning, among other factors, meant that the climate was not right for large-scale greenfield projects. As a result, Gazprom was forced to define a number of priorities for its growth strategy. In addition, the drop in the Russian demand, caused by the economic decline in Russia and the higher domestic prices, meant that new investments in produc-tion were less pressing [Victor and Victor 2006]. This chapter discusses Gazprom's strategy in Europe during the 1990s. That strategy is introduced by the changing policies in the West and the developments in the European gas market. Section 7.2 deals with the politico-institutional developments in Europe. Sec-tion 7.3 revolves around the developments in the gas market, distinguishing between the countries that fell within Moscow's sphere of influence prior to 1990 and Western Euro-pean countries. The changes in Gazprom’s strategy in response to those developments are
188 See also Chapter 3 and 11 in Boon von Ochssée [2010] for an in-depth analysis on geopolitical transition in Eurasia.

150
addressed in Section 7.4, using two concrete projects to illustrate Gazprom's proactive strategy. Section 7.5, finally, presents a conclusion. 7.2 Politico-institutional developments in Europe during the 1990s
Shortly after the Soviet Union and its institutes collapsed, the EU made a conceptual redi-vision of the area formerly within the Soviet sphere of influence.189 The concrete policy agendas differed greatly from one region to the next. After the fall of the Berlin Wall, the East Germany was reunited with the West Germany in 1990 and automatically became a member of the EU.190 Many of the other countries in Central and Eastern Europe were incorporated into the existing aid programme Poland and Hungary Assistance for Restruc-turing their Economies (PHARE). Between 1994 and 1996, the former CMEA states and the Baltic states applied for membership of the EU and were incorporated into the EU acquis pursuant to the ‘Europe agreements’. Many of the Central and Eastern European countries officially joined the EU in May 2004 or January 2007 [Bossuyt 2008].191 The TACIS programme was initiated for the former Soviet states. From 1994 onward, Partner-ship and Cooperation Agreements (PCAs) were concluded with those countries, an ap-proach that was subsequently transformed into the ‘Neighbourhood Policy’, involving economic and political cooperation at the bilateral level. The initiatives both for Central and Eastern Europe and for the former Soviet states included technical and financial sup-port in the transition to a market economy and democracy based on the Western model. However, for the EU Central and Eastern Europe was more important than the former Soviet states (with the exception of the Baltic states). Geographically, those countries were situated closer, and were more dependent, both economically and otherwise. They were also more willing to accept the Western ‘mores’ [Bossuyt 2008]. Besides the primarily European initiatives, other Western initiatives were also launched to gain an increased (geo-)political and economic influence in the countries that formerly fell within Moscow's sphere of influence. For economic purposes, a number of Central Euro-pean countries joined the OECD and the World Trade Organisation (WTO)192, and the influence of financial institutions (for example the IMF and the World Bank) was in-creased [Trenin 2007]. In the area of security, NATO gained increased influence in the former Warsaw Pact countries by signing the Partnerships for Peace in 1994-95. This led
189 Section 7.2 basically focuses on the European politico-institutional developments in the CMEA and the Soviet Union. See Section 8.2 for the current geo-strategic dimension of gas flows on the Eurasian continent.
190 During the 1980s and 1990s, other European countries joined the EU, and agreements and partnership arrange-ments were concluded with and ‘secondary’ programmes launched in the European countries and their southern and northern neighbours.
191 Poland and Hungary applied for membership in 1994. Estonia, Latvia, Lithuania, Slovakia, Bulgaria and Romania applied in 1995, the Czech Republic and Slovenia in 1996. Estonia, Latvia, Lithuania, Poland, Slovakia, the Czech Republic, Hungary, Slovenia, Malta and Cyprus officially became EU Member States in May 2004. Bulgaria and Romania followed in January 2007. Croatia, Turkey and Macedonia are candidates for membership (2009).
192 The WTO originated from the General Agreement on Tariffs and Trade (GATT).

151
to the Czech Republic, Hungary and Poland joining NATO in 1999, followed in 2004 by the Baltic states, Slovakia, Slovenia, Romania and Bulgaria.193 On some subjects and in some countries, the expansion of the Western sphere of influence clashed with the sphere of influence of Russia, which wished to retain its influence, particularly in the former So-viet states [Trenin 2007; see also Chapter 6]. The collapse of the Soviet Union and the CMEA also changed the institutionalisation of the East-West energy trade and diplomacy. Parts of the value chain now fell under the jurisdiction of new independent states. As a result, ownership of parts of the value chain also reverted to new entities (primarily state enterprises) and the uniform regulation system reaching to the boundaries of Western Europe disappeared [CIEP 2008]. Moreover, the energy dealings between Russia and the CMEA became more commercial. However, the relationships between the former Soviet states and Moscow retained some of their political charge. This politicisation of the energy dealings made the transit supplies of Russia and the rest of Europe unstable (see also Section 6.3) [CIEP 2008]. Both Europe and Russia attempted to gain, or regain, control over the lost parts of the value chain.194 A proposal was made in 1991 from Europe, to form a European Energy Community. This produced the Energy Charter, whose purpose was to coordinate the flows of energy from East to West. Under pressure from the US, among others, the geo-graphic scope was subsequently increased. Five countries have not ratified the Charter, including Russia, Belarus and Norway [Energy Charter Secretariat 2007].195 Particularly the transit protocol in the Charter is a point of contention, as granting access to third parties, as proposed in the protocol, will cause gas producing countries to lose control over the gas flows, see also Chapter 10 [Stern 2005; CIEP 2008]. In addition, when the Central European and Baltic states joined the EU in the 1990s, elements of the gas value chain became part of the European internal market. Beyond the EU's jurisdiction, the paradigm of the internal market was used for developing new insti-tutions and agreements. Those initiatives can be regarded as attempts to plug a hole in the regulatory control over the export pipelines.196 Initially, attempts were made to include Russia in the Energy Charter, and subsequently, through the energy dialogue, in the PSAs. However, Russia opted for its own approach, by controlling gas flows and export routes
193 All former Soviet and CMEA states also joined the Organisation for Security and Cooperation in Europe (OSCE). The OVSE has a wider sphere of operation than NATO.
194 Among other measures, Russia and Gazprom tried to transfer the ownership and management to a joint venture with Ukraine and possibly a Western partner (see Section 6.3).
195 In 2009, Russia renounced the Charter and has opted for a different system (see also Chapter 10).
196 Norway was included into a European regulatory system with the European Economic Area (EEA) and the Euro-pean Free Trade Association (EFTA). Algeria was included in a European regulatory system through the Barcelona Process.

152
and securing market access, and as such remained beyond the scope of the EU's policies [CIEP 2008]. Besides the expansion of the West's sphere of influence described above, the process of liberalisation and unification of the national markets in Europe also started in the 1980s, based on the examples of the US and the UK; see also Chapters 2 and 3 [Matláry 1997]. The liberalisation process had a number of implications for the way in which the Euro-pean gas market was organised, including the following:
• a process of consolidation in the European gas market toward ‘national cham-pions’, often supported by the various national governments in view of economies of scale that could be realised [Tönjes 2007; Lecarpentier 2006];197
• the possibilities for newcomers to access the European market improved [Lecar-pentier 2006];198
• the development of the spot market, allowing ‘gas-to-gas’ competition to arise, al-though the trading fraction on the spot market remained relatively minor (except in the UK), see also Chapter 8 [CIEP 2008; Dutch Energy Council 2005];
• greater flexibility in long-term contracts, for example in terms of price indexation;
• the admittance of secondary trade, following the abolition of destination clauses [Neumann and Von Hirschhausen 2005].
7.3 Developments in the European gas market in the 1990s
The release of new gas volumes in the 1980s, from locations such as the Soviet Union and the North Sea, combined with a downward readjustment of the European demand fore-casts during the second half of the decade, changed Continental Europe from a seller's market into a buyer's market. However, between 1990 and 2000 the share of gas in the European energy mix increased, at the expense of coal and oil, for various reasons [Stern 1999]:
• because of its wide availability, gas was once more used in the electricity sector (despite the argument that gas was too valuable);
• using gas offered environmental advantages that coal and oil did not;
• a new technology had been developed, the gas-fired Combined Cycle Gas Tur-bines (CCGT) power stations, which were relatively quick and easy to build and on top of that were relatively environmentally friendly.
The European gas market also changed institutionally, with the restructuring of Western Europe and the dissolution of the CMEA in Central and Eastern Europe [Finon and
197 The leading utilities are French (EDF and Gaz de France Suez), German (E.ON Ruhrgas and RWE), Italian (Enel) and Spanish (Iberdrola). Of the wholesale distributors of gas, E.ON Ruhrgas, Eni (Italy), GasTerra (Netherlands), Gaz de France and Centrica (UK) control approximately 70 percent of the market.
198 This allowed primarily gas-exporting companies outside Europe, such as Gazprom and Sonatrach, to acquire posi-tion in gas transport, storage and sales.

153
Midttun 2004]. As described earlier, the gas market within the EU was liberalised through several directives, aimed at lowering the thresholds for access, encouraging competition and integrating national markets into a European internal gas market [De Jong et al. 2010]. As described in Chapter 6, before the dissolution of the CMEA the countries in Central and Eastern Europe were integrated into the Soviet planned economy, and were largely dependent on imports from the Soviet Union. The dissolution of the CMEA had three consequences for the way in which the gas market in Central and Eastern Europe was organised:
• the Central European gas market was no longer within Moscow's direct sphere of influence, and from 1990 onward the countries were faced with market prices, paid in hard currencies [Stern 1999];199
• the Central European countries had the opportunity to build up diversified im-port portfolios, allowing them to increase their economic (and political) inde-pendence and improve their bargaining positions. However, the economic feasi-bility of becoming less dependent on Russian gas imports remained minor, since in most instances Russia was the cheapest option and possessed sufficient overca-pacity, which made alternative supply routes less profitable [Stern 1999; IEA 1997]. During the latter half of the 1990s, the economic growth made it possible for a series of initiatives to be realised in connection with contractual and physical diversification;200
• the Central and Eastern European countries were able to develop their own en-ergy policies, and opted for an energy system based on market principles, using the European liberalisation and privatisation process [Stern 1999; Stern 2005].
The European players attempted to retain their positions on the gas market by way of M&As, both domestic and cross-border. Western European gas companies also invested in the former state enterprises in Central Europe. In most countries, the degree of concentra-tion increased. In some countries, conversely, liberalisation lessened the degree of concen-tration, for example in the UK and Italy [Finon and Midttun 2004]. The focus of Euro-pean policy during the 1990s was on the internal market. An assertive external energy
199 However, the existing Soviet agreements, based on ‘soft’ currencies and/or barter, remained largely in place for some time, and delayed the transition to a commercial relationship with Gazprom [Stern 1999].
200 East Germany was the first to realise physical diversification, with the Netra pipeline from Norway. In 1997, a physical connection was also realised between the Norwegian gas field and the Czech gas market, based on a contract between Transgas and Norway's GFU. Poland and Slovakia, as well as Bulgaria, also considered the possibilities for physical diversification, while other countries such as Hungary realised contractual diversification. Contractual diversi-fication ensured that other parties had to provide an alternative supply if Gazprom physically interrupted the supply. Several countries were prepared to pay a premium for contractual and physical diversification [Wybrew-Bond 1999; Stern 2005].

154
policy was not needed, since there was ample access to reserves and the gas market was characterised by low prices [Van der Linde 2007; CIEP 2008].201 As described above, the supply of gas from the various regions to Europe increased, despite the low prices for oil and gas and other uncertainties such as the direction that European liberalisation policy would take. Sonatrach of Algeria increased its transport capacity and volume to Italy, Spain and Portugal, giving it a greater market share. The Nederlandse Aardolie Maatschappij (NAM) of the Netherlands was bound by production restrictions imposed by the government's small fields policy, meaning that the buyer of the gas, Dutch Gasunie, did not have sufficient opportunity for growth in terms of volume. As such, it started looking for other profitable activities, such as underground storage. Gasunie also concluded a purchase contract with Gazprom for 4 bcm/y to increase its possibilities for sales. Gazprom entered into joint ventures for downstream activities in many countries, with Wingas realising the most significant results. Russian volumes were increased in Northwestern Europe, Poland and Turkey (see also Section 7.3). The Norwegians did not deploy any downstream operations, and continued to sell their gas to the traditional buy-ers. Moreover, the cooperation between the gas-exporting countries was not very well developed [Stern 1999]. The total consumption in Western Europe (including Turkey) rose from 257 bcm in 1990 to 399 bcm in 2000, with the UK, Germany, Italy, France and the Netherlands as the principal markets (see also Figure 7.1) [BP 2008]. The total demand for gas dropped slightly in the CMEA-6 (from 68 bcm in 1990 to 57 bcm in 2000), primarily as a result of the collapse of the Romanian gas market. In the other countries, the demand for gas rose slightly, although the volumes of gas imported from Russia reduced, as the use of gas be-came more efficient in response to the continued pressure to pay in hard currencies [Stern 1999; Arentsen and Künneke 2003].202 A specific examination of the principal gas-consuming countries in Northwestern Europe shows that Germany had long-term contracts with Russian, Dutch and Norwegian suppli-ers. Ruhrgas occupied a dominant position in Germany's principal regional gas markets, with less dominant operators such as BEB and Rheinisch-Westfälisches Elektrizitätswerk (RWE). In 1991, Wingas broke through the traditional market structure by entering into a partnership with Gazprom (see Section 7.4). The energy mix did not change much, and remained largely dependent on coal and gas. The energy mix in France continued to be based on nuclear energy. In addition to small production volumes of its own Gaz de France, which together with Electricité de France (EDF) dominated the market, imported
201 In addition, it was assumed that countries exporting gas to Europe – in particular Russia, Norway and Algeria – would conform to the relevant arrangements in the acquis. However, that situation gradually changed during the first decade of the twenty-first century, when a seller's market arose [Van der Linde 2007].
202 Not including Former Yugoslavia but including the Baltic states.
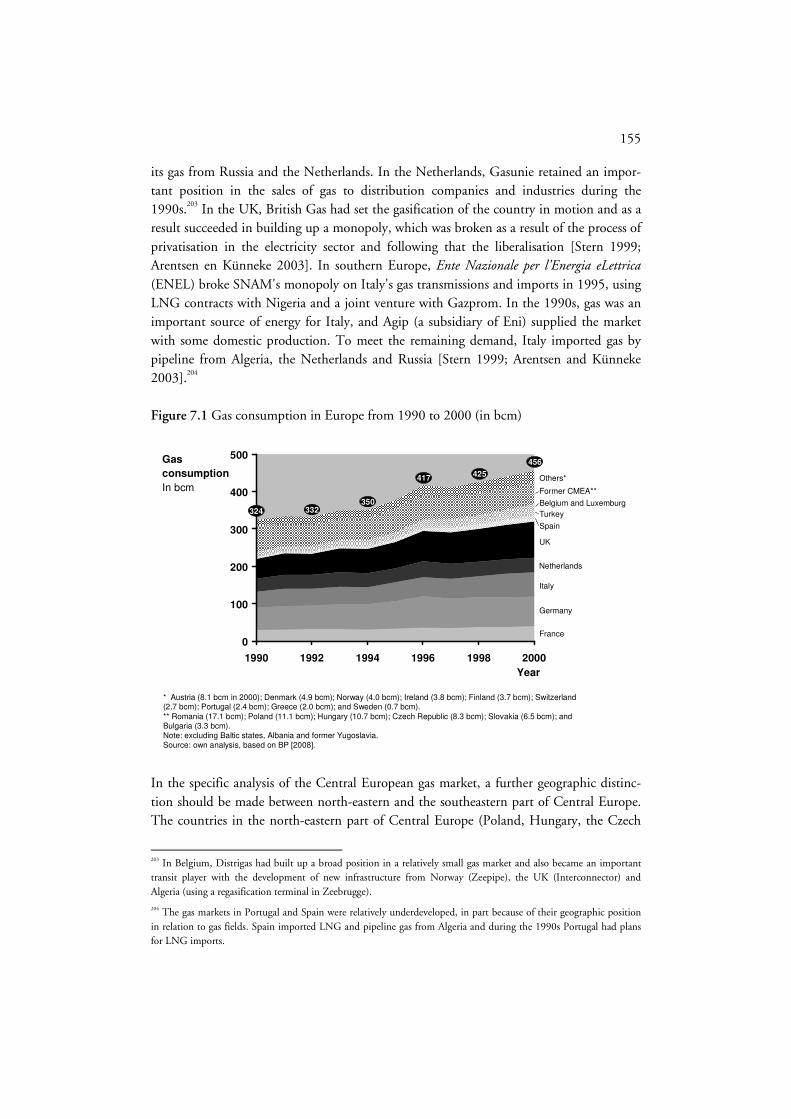
155
its gas from Russia and the Netherlands. In the Netherlands, Gasunie retained an impor-tant position in the sales of gas to distribution companies and industries during the 1990s.203 In the UK, British Gas had set the gasification of the country in motion and as a result succeeded in building up a monopoly, which was broken as a result of the process of privatisation in the electricity sector and following that the liberalisation [Stern 1999; Arentsen en Künneke 2003]. In southern Europe, Ente Nazionale per l'Energia eLettrica (ENEL) broke SNAM's monopoly on Italy's gas transmissions and imports in 1995, using LNG contracts with Nigeria and a joint venture with Gazprom. In the 1990s, gas was an important source of energy for Italy, and Agip (a subsidiary of Eni) supplied the market with some domestic production. To meet the remaining demand, Italy imported gas by pipeline from Algeria, the Netherlands and Russia [Stern 1999; Arentsen and Künneke 2003].204 Figure 7.1 Gas consumption in Europe from 1990 to 2000 (in bcm)
* Austria (8.1 bcm in 2000); Denmark (4.9 bcm); Norway (4.0 bcm); Ireland (3.8 bcm); Finland (3.7 bcm); Switzerland (2.7 bcm); Portugal (2.4 bcm); Greece (2.0 bcm); and Sweden (0.7 bcm).** Romania (17.1 bcm); Poland (11.1 bcm); Hungary (10.7 bcm); Czech Republic (8.3 bcm); Slovakia (6.5 bcm); and Bulgaria (3.3 bcm).Note: excluding Baltic states, Albania and former Yugoslavia.Source: own analysis, based on BP [2008].
0
100
200
300
400
500
1990 1992 1994 1996 1998 2000
Year
Gas
consumption
In bcm
456
425
350332324
in bcm
Others*
Netherlands
UK
Italy
Germany
France
417
Spain
Turkey
Belgium and Luxemburg
Former CMEA**
In the specific analysis of the Central European gas market, a further geographic distinc-tion should be made between north-eastern and the southeastern part of Central Europe. The countries in the north-eastern part of Central Europe (Poland, Hungary, the Czech
203 In Belgium, Distrigas had built up a broad position in a relatively small gas market and also became an important transit player with the development of new infrastructure from Norway (Zeepipe), the UK (Interconnector) and Algeria (using a regasification terminal in Zeebrugge).
204 The gas markets in Portugal and Spain were relatively underdeveloped, in part because of their geographic position in relation to gas fields. Spain imported LNG and pipeline gas from Algeria and during the 1990s Portugal had plans for LNG imports.

156
Republic, Slovakia and Slovenia), plus the Baltic states (Estonia, Latvia and Lithuania), joined the EU in 2004. Prior to joining, they implemented reforms in the 1990s, in ac-cordance with the aquis.205 The liberalisation and partial privatisation attracted both West-ern and Russian investors, with interests being acquired in the gas market. In addition to the potential possibilities for commercial growth, the north-eastern part of Central Europe fulfilled an important strategic function in Russia's gas transit to the Western European gas market. Of Russia's exports, 70 percent passed through Slovakia, from where part flowed to Austria and then on to Italy and part went to Germany and France by way of the Czech Republic. The Yamal-Europe pipeline also made Poland a transit country [Ar-entsen and Künneke 2003]. In the Czech Republic, Hungary and Slovakia, the energy mix consisted largely of gas, while in Poland, with its traditional coal industry, the share was relatively minor. In addition, Hungary and Poland possessed significant gas reserves, in-tended for domestic consumption. Environmental considerations, stimulated by the EU, encouraged most countries to turn to gas-fired power stations. However, the results were disappointing because coal-based power stations remained more attractive for economic reasons [Arentsen and Künneke 2003; Victor and Victor 2006]. Besides the countries of the north-eastern part of Central Europe, the countries in the southeastern part of Central Europe (Romania and Bulgaria) also played an important transit role for Russian gas destined for the Turkish and Greek markets and in the long term possibly also gas from the Caspian region and the Middle East. Although Romania and Bulgaria were Candidate Members of the EU, the reforms in the southeastern part of the Central European gas market were slower than those in the north-eastern part. More-over, the economic and political risks (primarily the corruption) meant that the degree of direct foreign investment in those countries was limited. What used to be Yugoslavia was characterised by political instability because of the Balkan Wars, preventing the gas market from developing. In the energy mix, Bulgaria and particularly Romania were highly de-pendent on gas. During the 1990s, Romania was self-sufficient, from its own production, and Bulgaria depended on Russian imports, with which it encountered transit difficulties [Arentsen and Künneke 2003; Stern 1999]. 7.4 Gazprom’s export strategy in Europe during the 1990s
The difficulties with payment defaulters, the relatively low regulated gas prices and the diminishing demand for gas in Russia and in the other former Soviet republics during the 1990s forced Gazprom to focus on the European export markets (in particular Western Europe) to generate hard currency income. However, the limited possibilities for growth caused by the buyer's market, combined with low oil and gas prices and lack of financial resources made it difficult for Gazprom to conduct a proactive expansion strategy.
205 The link to the internal European gas market also required additional network connections.

157
During the initial years, exports to Western Europe remained stable, after which they rose, owing to additional sales under long-term contracts in countries such as Germany and Turkey. Russian exports to Central and Eastern Europe increased slightly during the latter half of the 1990s (in Poland, for example), though the decline during the first half of the decade meant that they remained below the 1990 level (see also Figure 7.2). Gazprom’s market share in Europe remained more or less stable at around 25-30 percent [Stern 1999; Victor and Victor 2006].
Figure 7.2 Gazprom’s gas exports to Europe 1991-2000 (in bcm)
* Including Turkey.** Including Baltic and Balkan countries.Note: in European bcm’s.Source: own analysis, based on Gazprom annual reports and Stern [2005].
0
20
40
60
80
100
120
1990 1992 1994 2000
Year
Gas volume
in bcm
1996
22%
Central and Eastern Europe**
West Europe*
119115
999498
xx
x%
Export volume in bcm
Export growth 1990-2008
1998
113
7.4.1 Gazprom’s general export strategy in Europe during the 1990s
Against the backdrop of the limited possibilities for growth, Gazprom launched a process of vertical integration in order to increase its profit margins. Vertical integration also gave Gazprom more guarantees about its security of demand and gave it access to market in-formation. The process of vertical integration began in 1990 with the partnership with Wintershall, through Wintershall Erdgas Handelshaus (WIEH) and subsequently Wingas. The partnership principally focused on selling gas in the eastern half of Germany, subse-quently expanding to sell gas in other regions, the construction of a pipeline network in and to Germany and a storage facility in Rehden [Stern 2005; Stern 1999; Quest and Locatelli 1997].206 Gazprom also set up trading houses and sales entities in other European
206 The pipelines, for example the Mittel-Deutsche Anbindungs-Leitung (MIDAL), STEGAL, Jamal-Gas-Anbindungs-Leitung (JAGAL) and WEDAL pipelines in Germany, and gas storage were realised by Wingas. Until 2007, Gazprom held 35 percent of the shares in Wingas, while Wintershall held 65 percent. In 2007, Gazprom's share in Wingas increase to 50 percent minus 1 share.

158
countries, working with European partners other companies in order to gain direct access to the market.207 Gazprom also purchased ownership rights during the liberalisation and privatisation process, mostly in gas companies in Central and Eastern Europe [Stern 1999; Stern 2005].208 Besides the trading houses and sales companies, Gazprom also participated in pipeline projects, such as the Yamal-Europe, the Blue Stream pipeline and the North TransGas consortium (see below) [Stern 1999; Quest and Locatelli 1997]. Specifically in its dealings with several countries in Central and Eastern Europe, Gazprom encountered payment and transit difficulties, when market prices were introduced and the economy was restructured. The transit problems in Central and Eastern Europe were most noticeable in Bulgaria. In the Baltic states (Lithuania and Latvia in particular), debts in-creased as a result of payment defaults. Yet those debts were only a fraction ($80 million in 1995) of those of Ukraine, Belarus and Moldova (see also Section 6.4), and were largely repaid in the latter half of the 1990s. In Central Europe, Gazprom continued to enter into partially favourable barter agreements and other arrangements in order to maintain its position, for example in Slovakia [Stern 1999].209 Gazprom’s financial restrictions, the low prices for oil and gas, the limited possibilities for growth and other limitations and difficulties meant that two large-scale greenfield projects were eventually given priority abroad, with Western parties facilitating most of the fi-nances. The Yamal-Europe project was intended to supply gas to the Northwestern Euro-pean market, while the purpose of the Blue Stream project was to increase Russia's share in the Turkish market. No other large-scale capacity expansions were effected, and any addi-tional volumes were realised using the existing transport system [Victor and Victor 2006]. The pipeline proposals for North Transgas and the Nordic Gas Grid, which would cir-cumvent the former Soviet transit countries by way of the Baltic Sea and the Scandinavian countries, proved unfeasible at the time. The pipelines would be part of the development of the Shtokman field in the Barents Sea, which was also put off [Stern 1999; Victor and Victor 2006]. In addition, Russian LNG projects and the pipelines proposed to eastern Asia (China, Korea and Japan) were also postponed for economic and political reasons. The possibilities for LNG exports were beyond Gazprom’s technological and financial
207 Alliances were concluded with traditional partners in France (Fragas with Gaz de France), Italy (Promgas with SNAM), Austria (GWH with OMV), Finland (Gasum with Neste), Greece (Prometheus Gas with Kopelouzos) and Turkey (Gama Gazprom and Turusgaz with Botas). Partnerships with non-traditional parties, such as Wintershall, were realised in Italy for example (Volta with Edison Gas). In central and eastern Europe, joint ventures were entered into in Slovakia (Slovrusgaz), Poland (EuroPol Gaz and Gas Trading), Hungary (Panrusgas), Romania (Wirom) and Bulgaria (Overgas and Topenergy).
208 In the Baltic gas sector, for example, Gazprom acquired a 41 percent ownership interest in Estonian gas company Eestogaz and a 16.25 percent share in Latvian gas company Latvias Gaze. It later also acquired an interest in Lithua-nian gas company Lituvos [Stern 1999].
209 In other countries some new contracts, including with Slovrusgas of Slovakia, were still concluded based on barter and as payment for transit [Stern 1999].
159
capacities and were not competitive with other LNG projects, such as those of Indonesia, Qatar and Trinidad and Tobago. As a result, the development of LNG on Sachalin in Russia was left to Western and Japanese parties, for example Royal Dutch Shell. Although the pipeline proposals from Siberia to eastern Asia became more concrete towards the end of the 1990s, their realisation was postponed owing to lack of interest on the part of pro-spective buyers, the high level of capital expenditure and the geopolitical issues surround-ing transit through Mongolia [Paik 2002; Victor and Victor 2006]. As a result, the Euro-pean market remained Gazprom's principal export market. 7.4.2 Gazprom’s new gas infrastructure projects: the Yamal-Europe
and Blue Stream pipelines
As described above, two major gas infrastructure projects were realised in the 1990s. With the Yamal-Europe project, the focus was placed on breaking Ruhrgas's monopoly on the German market by contracting additional volumes through Wingas, and thus supplying additional volumes in the Northwestern European market [Stern 2005; Victor and Victor 2006].210 With the Blue Stream project, the objective was to supply the growing Turkish market with additional gas, using a direct pipeline from Russia to Turkey. The Blue Stream pipeline avoided transit countries and reached the Turkish market at an early stage, causing competing projects from Turkmenistan, Iran and other countries to be postponed or turned down. Case study 1 in Chapter 11 presents a more detailed analysis of the in-vestment decision surrounding the Blue Stream project. During the brief period in 1990 that Gazprom did not control the export contracts, Gaz-prom, in partnership with Wintershall, attempted to realise new sales in Germany in order to increase its export profits through volume and higher profit margins. This agreement allowed Gazprom and Wintershall to break up the German market [Stern 2005; Victor and Victor 2006].211 The original plan for the Yamal-Europe project was to construct six parallel 56-inch pipelines from the Bovanenko (onshore) and Kharasevey (offshore) fields on the Yamal peninsula.212 From Belarus, the capacity to eastern and northern Germany would then be expanded (66 bcm/y) by way of Poland to Germany, to link up with the Wingas network. In 1993, Russia, Belarus and Poland signed an intergovernmental agreement to construct the Yamal-Europe pipeline. The pipeline was also designated as a
210 For a further discussion of the Yamal-Europe project, see for example Victor and Victor [2006].
211 Wintershall is a division of German chemical enterprise BASF, which had a conflict with Ruhrgas about prices. Wintershall itself did not produce much gas and was dependent on imports for building up a position in the German gas market. Wintershall and Gazprom created three joint ventures – Wingas (a pipeline and wholesale company) and Wintershall Erdgas Handelshaus GmbH (WIEH) in Germany, and Wintershall Erdgas Handelshaus Zug AG (WIEE) in Switzerland (with WIEH and WIEE marketing gas in central Europe).
212 From Ukhta in western Siberia, the pipeline network was supposed to run along the existing network from Urengoy towards Moscow. From there, the network would follow the existing ‘Northern Light’ route through Belarus. The new pipelines on Russian soil were financed by Gazprom and Wintershall.
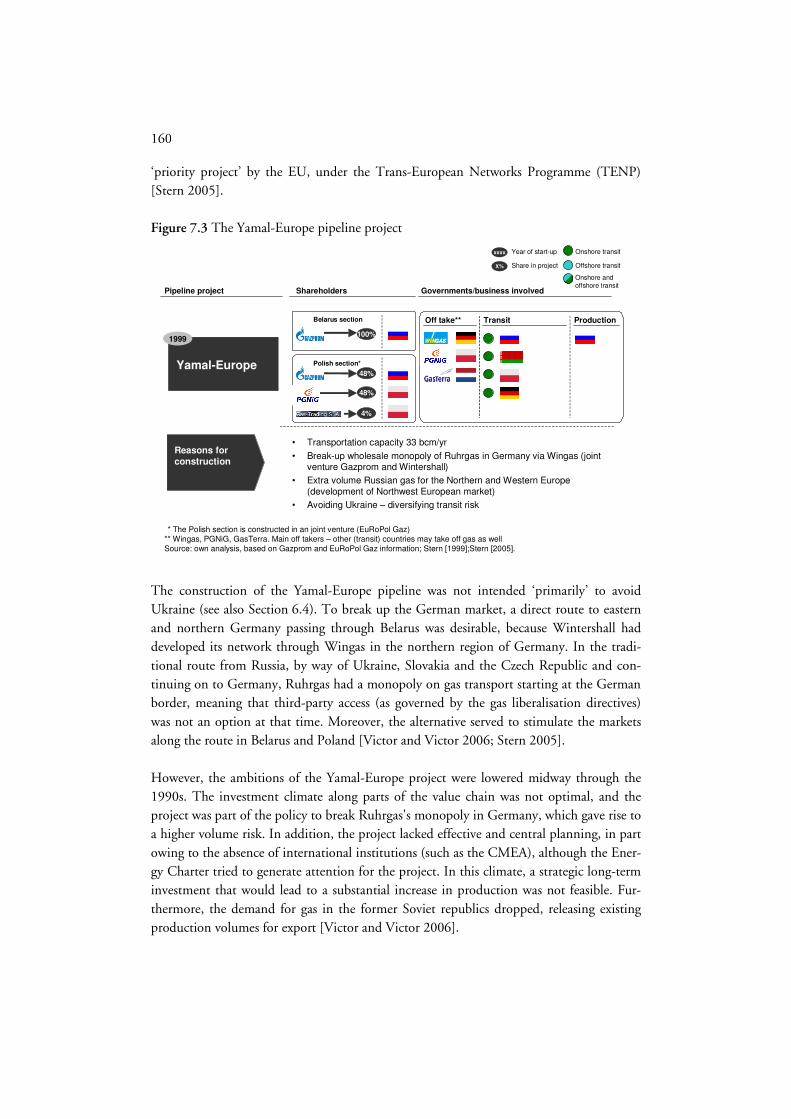
160
‘priority project’ by the EU, under the Trans-European Networks Programme (TENP) [Stern 2005]. Figure 7.3 The Yamal-Europe pipeline project
xxxx Year of start-up
Pipeline project Shareholders
X% Share in project
Governments/business involved
Off take** Transit Production
Onshore transit
Offshore transit
Onshore and offshore transit
Reasons forconstruction
1999
Yamal-Europe
Belarus section
100%
48%
4%
48%
Polish section*
** The Polish section is constructed in an joint venture (EuRoPol Gaz) ** Wingas, PGNiG, GasTerra. Main off takers – other (transit) countries may take off gas as wellSource: own analysis, based on Gazprom and EuRoPol Gaz information; Stern [1999];Stern [2005].
• Transportation capacity 33 bcm/yr
• Break-up wholesale monopoly of Ruhrgas in Germany via Wingas (joint venture Gazprom and Wintershall)
• Extra volume Russian gas for the Northern and Western Europe(development of Northwest European market)
• Avoiding Ukraine – diversifying transit risk
The construction of the Yamal-Europe pipeline was not intended ‘primarily’ to avoid Ukraine (see also Section 6.4). To break up the German market, a direct route to eastern and northern Germany passing through Belarus was desirable, because Wintershall had developed its network through Wingas in the northern region of Germany. In the tradi-tional route from Russia, by way of Ukraine, Slovakia and the Czech Republic and con-tinuing on to Germany, Ruhrgas had a monopoly on gas transport starting at the German border, meaning that third-party access (as governed by the gas liberalisation directives) was not an option at that time. Moreover, the alternative served to stimulate the markets along the route in Belarus and Poland [Victor and Victor 2006; Stern 2005]. However, the ambitions of the Yamal-Europe project were lowered midway through the 1990s. The investment climate along parts of the value chain was not optimal, and the project was part of the policy to break Ruhrgas's monopoly in Germany, which gave rise to a higher volume risk. In addition, the project lacked effective and central planning, in part owing to the absence of international institutions (such as the CMEA), although the Ener-gy Charter tried to generate attention for the project. In this climate, a strategic long-term investment that would lead to a substantial increase in production was not feasible. Fur-thermore, the demand for gas in the former Soviet republics dropped, releasing existing production volumes for export [Victor and Victor 2006].
161
The demand for gas in the potential markets in Germany and Poland also proved to have been overestimated. Although the German demand for Russian gas rose slightly, that in-crease was largely realised by Ruhrgas. In addition, the joint ventures between Gazprom and Wintershall encountered difficulties gaining access to the market, making it impossi-ble to realise the planned 24 bcm/y intended for Germany.213 In Poland, the demand for gas was less than projected because coal continued to dominate the energy system. Despite the willingness of the Polish government (supported by the West) to create opportunities for gas-fired power stations, based on environmental considerations, commitments from industry were lacking, for reasons of costs [Victor and Victor 2006; Stern 2005].214 In addition, Gazprom's export development was delayed by its lack of financial resources following the Russian financial crisis in 1998.215 Finally, several political issues in Poland and Belarus were also part of the reason why the ambitions were lowered. Opposition arose in Poland, because the consortium for the Polish pipeline section (EuroPol Gaz) was dominated by Russian entities (see also Figure 7.3).216 Moreover, the continuing transit problems with Belarus detracted from the project's appeal, and the ‘NEGP proposals’ (see also Section 6.4 and Case study 3 in Chapter 11) and other alternatives were considered [Victor and Victor 2006; Stern 2005]. Eventually, only a single pipeline was constructed and fewer compressor stations were built, ultimately providing a capacity of 33 bcm/y. The section through Belarus was con-structed by Gazprom, which still manages that part, while the Polish section is managed by Polish-Russian joint venture EuroPol Gaz [Victor and Victor 2006]. The limited do-mestic and foreign demand meant that the Yamal peninsula did not need developing. The Polish Petroleum and Gas Mining (PGNiG) took out a contract with Gazprom for 7 bcm/y; Wingas contracted 10 bcm/y and Dutch Gasunie 4 bcm/y [Stern 2005; Victor and Victor 2006]. Gas was first shipped through the Yamal-Europe pipeline in September 1999, and additional compressor stations were subsequently put into operation [Victor and Victor 2006; Stern 2005]. 7.5 Conclusion
Following the collapse of the Soviet institutions, Russia no longer possessed a uniform system regulating the organisation of the gas value chain up to the frontier with Western Europe. Europe initially tried to coordinate the way in which energy flows from East to
213 Over time, Wingas's position improved and by 2008 the company had obtained approximately a 10 percent share in the German gas market [Gazpromexport 2008].
214 This caused the demand for gas to rise to 18-20 bcm in 2006 and to 22-28 bcm in 2010 (as projected in 1996). At the start of the new century, the projections were raised to 12.7-13.7 bcm for 2006.
215 No financial resources were available in Belarus.
216 Gazprom and Polish gas company PGNiG each hold 48 percent of the shares. The remaining shares (4 percent) are held by a joint venture, Gas Trading, in which Russian entities hold a majority. Gas Trading is owned by PGNiG (43 percent), Gazexport (16 percent), Wintershall (2.73 percent), Weglokoks (2.27 percent) and Bartimpex (36 percent). Bartimpex has historical ties with Gazprom.

162
West were organised by way of the Energy Charter and subsequently using the EU's ac-quis. Besides exporting the ‘European model’, Europe also became more internally inte-grated. The process of liberalisation, privatisation and deregulation was intended to lower the barriers to entry, encourage competition and integrate national markets into an inter-nal European market for gas. When the Central European market opened up, both West-ern European companies and Gazprom acquired interests. Working together with other European companies, Gazprom initiated joint ventures to sell gas directly. Besides the institutional changes, the European gas market underwent a shift to a buyer's market, owing to the fact that the supply of gas during the latter half of the 1980s was ample. In addition, the demand forecasts in Europe were lowered, even though the envi-ronmental benefits of gas led to it becoming a more important element of the energy mix during the 1990s. The buyer's market that arose called for a proactive strategy on the part of gas-exporting countries if they wishes to retain and expand their market share. For Gaz-prom, the hard currency income made it attractive to serve the European growth mar-ket.217 The limited access to financial resources and the low gas prices caused Gazprom to com-mit itself to two projects; other greenfield projects towards European markets and other export markets were postponed. Firstly, an attempt was made to break Ruhrgas's mono-poly in the German market. Through a partnership with Wintershall, Gazprom formed a series of joint ventures to sell additional gas. The Yamal-Europe pipeline, passing through Belarus and Poland and continuing to Germany, was intended to facilitate an increase in sales. Gazprom opted not to allow Wintershall an ownership interest in the export pipeline of the Yamal-Europe project, a decision that delayed the project financing. As a result of the delay in the project, Russian sales in Germany (and Poland) were disappointing. Combined with a lack of effective and central planning and other political issues in Belarus and Poland, the ambitions of the pipeline project were lowered, and the plans for gas pro-duction on the Yamal Peninsula deferred as a result.218 Another objective besides the growth opportunities in Northwestern Europe was the grow-ing Turkish gas market, using a direct pipeline from Russia to Turkey (the Blue Stream pipeline). It became necessary to involve a Western partner with an interest in the Blue Stream project in order to improve the project's creditworthiness and funding. The pur-pose of the Blue Stream pipeline was to reach the Turkish market at an early stage, causing competing projects from Turkmenistan, Iran and other countries to be adjusted or turned
217 As mentioned in Chapter 6, in Russia and the other former Soviet states, Gazprom had to deal with chronic pay-ment defaults and non-transparent barter agreements. Moreover, the demand for gas in the former Soviet states dropped owing to the economic recession and the price increases.
218 Another factor that led to investments in new production on the Yamal Peninsula being postponed was the release of gas from existing Russian fields when the demand Russia and the other former Soviet states dropped.

163
down. The two Russian projects also avoided potential transit risks in Ukraine, improving Russia's security of demand in Europe.219 The security of demand was also improved when Wingas invested in storage facilities in Rheden in Germany and when Slovakian gas sto-rage was utilised.
219 Possible transit risks in Bulgaria were also avoided by the Blue Stream project.

164

165
PART III

166

167
Chapter 8 Politico-economic background of interregional gas
market developments
8.1 Introduction
In order to examine more closely the current and possible future gas export strategy of Russia in a dynamic gas market, the geo-economic and -political context as well as the relevant market patterns must be considered. The geopolitical context influences the gas sector (and energy in general), determined by the perceived necessity to control gas flows. This includes issues such as the flows themselves as well as the fashion in which they are traded. Economic (theoretical) models, which aim to explain business strategy and in-vestment behaviour in dynamic markets, alone cannot capture this intertwinement. Ne-vertheless, both the geopolitical as well as market development aspects are important and will be discussed in this chapter. Section 8.2 is a brief summary of the most important facets concerning the geo-economic and geopolitical balance of power in Eurasia and the differences in perception between, on the one hand the US and the European actors and Russia on the other.220 As far as gas flows are concerned, many of the geo-economic tugs-of-war occurring, find their origin in relations between these two major power blocks. Section 8.3 provides a short impression of the reserves and current production and export levels of the main gas exporting countries. In Section 8.4, the trade and price patterns of the main regional markets in the world will be discussed. This is because the gas markets are still regionally organised, although they are becoming increasingly more interregional. Section 8.5 outlines the growth opportunities in the main regional markets for net-exporting countries and companies. Finally Section 8.6 concludes.
8.2 A newly emerging geo-strategic dimension to gas flows221
There are two dimensions to Russia’s space and scope for its positioning in the energy landscape. First, there is the energy dimension itself, i.e., the development of the Russian gas sector and its exports, its place in the international energy markets, the links between Russia and other gas exporting countries, both political and economic, etc. Second, there
220 There is a clearly geographical dimension to this relationship (geopolitical and geo-strategic) accompanied by ‘layers’ covering this geographical setting, consisting of a materialistic one and an abstract one where perceptions and identities play a role, see Chapter 3 and 4 in Boon von Ochssée [2010].
221 This Section is largely based on Chapter 2, 3 and 11 in Boon von Ochssée [2010]. For an historical overview of the institutionalisation of Eurasian gas flows, see Part II. In this section the focus will be on the West-Russia relation, and will not give an in-depth analysis on Russia’s relation with Asian countries, such as China, Japan and India.
168
is the relationship between Russia and those geo-strategic players, in Brzezinski [1997] terms, with whom Russia has to share an increasingly multi-polar space. Because Russia is traditionally a great power, its choices and actions with regard to its position in the energy landscape will affect its relationship with the other geo-strategic players, namely the US and China, and to a lesser extent India, Japan, the EU and its member-states. These coun-tries themselves seek to affect this landscape to their own relative advantage (see Chapter 3).222 As far as this section is concerned, we focus primarly on Russia, the US and Europe, where the US and Europe together form a Euro-Atlantic bloc. However, the European countries, in particularly the large continental countries, formulated their own foreign policies and their energy strategies, which were not necessarily in line with Euro-Atlantic interests. The structure of international relations, the identities of the actors involved and their geo-strategic and -economic disposition sets the scene for an analysis of Russia’s gas export strategy. 8.2.1 Politico-economic background to West-Russian relations
To understand Russia’s position today and the structure of international relations as far as they have an impact on this position, it is necessary to acknowledge the path dependency and inertia of the pre-1991 patterns, which prevailed during the Cold War (see also Part II). During the Cold War, the globe largely lay divided between two powers: the Western bloc, dominated by the US, and the Soviet Union, dominated by Russia, with a group of non-aligned countries in between. The US led the NATO military alliance, while Russia led the Warsaw Pact in a confrontation between essentially two different ideologies about how societies and economies were to be organised (liberal capitalism and communism, respectively) [Gagné 2007; McCormick 1998]. The end of the Cold War marked the end of the Soviet Union as a superpower, disinte-grating in 1991 to leave in its place a sudden and vast vacuum. The US was left alone to act as the world’s hegemoon, i.e., the international political system became uni-polar [Waltz 2006]. The Western world expected the fundamentals of global politics to be based on ideals of market democracy and denationalised (i.e., globalised) free market competi-tion [Fukuyama 1989]. Russia under Yeltsin, in the meantime, at first desired to join the Western world wholeheartedly [CIEP 2004]. During the 1990s, the Clinton Administra-tion and its European allies within the EU and NATO did little to integrate Russia. The West preferred instead to keep a distance and began expanding the Euro-Atlantic com-munity (first through the NATO, latter also via the EU), including former CMEA mem-ber states and post-Soviet countries, which were still in Russia’s perceived sphere of influ-ence (see also Map 8.1). As early as 1994, first under Yeltsin and later under Putin, Rus-sia’s attitude began to change correspondingly. Since the late 1990s, Russia has pursued its
222 This relates to Kissinger’s concept of chess versus go (see Chapter 3), in which absolute advantage measured through zero-sum gains and losses has been transformed into relative advantage measured through relative geo-economic power, while in both geography plays an essential role.
169
own ‘identity’ in a decisive fashion, especially since but necessarily because of the advent of the Bush Administration. It began to turn away from what it saw as a system designed to further undermine its territorial and political integrity as well as the integrity of its sphere of influence in key post-Soviet countries (during the late 1990s) [Trenin 2007].223 With the radical turn in US foreign policy under Bush in 2001 after the attacks of 9/11, the US not only set out a unilateral foreign policy designed to secure US interests, it also aimed for democratisation by force in areas deemed important to US interests [Clarke and Halper 2005]. Russia under Putin ostensibly decided to pursue its own interests, taking an increasingly defensive line against what it began to perceive as a threat (in particularly Euro-Atlantic expansion into its sphere of influence). With this new course in trans-Atlantic relations, Europe appeared trapped in between, on the one hand, its American ally and on the other a resurgent and self-confident Russia. Europe itself experiencing structural change and being institutionally ill-equipped via the EU to deal with this situa-tion. Opposing the Iraqi war by some continental European countries opened the door for Russia to a further entente with France and Germany [Trenin 2007]. Additionally, the institutional foundations of globalisation have weakened substantially in recent years [Ab-delal and Segal 2007]. Strategic national priorities of states are increasingly taking the upper hand in different strategic sectors, such as the energy sector, which is often referred to and spoken of state capitalism [Van der Linde 2005]. After a period of transition during the 1990s, relations between the Euro-Atlantic bloc and Russia have changed considerably and have proven to be very dynamic. From a world with only two superpowers, one has moved to a new world order, initially dominated by the US. This world system involves not just the Euro-Atlantic community and what was left of the Soviet Union, namely the CIS countries with Russia as the former (Soviet) centre of this political constellation, but also China, India and other regional powers such as Brazil and Iran.224 The world, one could say, has become more multi-polar rather than strictly bi-polar or uni-polar. 8.2.2 Geo-economic and political interests in institutionalisation of Eurasian
gas flows
As and when the Soviet Union collapsed, it became clear that the Soviet Union’s oil and gas producing areas in Central Asia contained more resources than was previously thought to be the case. Based on today’s conventional gas reserve information, some 70 percent worth of the world’s gas reserves, as well as roughly the same amount of oil reserves are
223 The redefinition of Russia’s national interests, beliefs and foreign policy was largely based on two events: (1) the Russia’s first invasion of Chechnya in 1994; and (2) the announced expansion of NATO to the East in 1994 (despite an agreement between Bush Senior and Gorbachev not to expand NATO further beyond East Germany) [Cohen 2005].
224 China has expanded its own spheres of influence through its own style of soft power in various parts of the world beyond the Pacific.

170
located in the so-called ‘strategic ellipse’ stretching from West and Northern Siberia and parts of the Arctic Sea down to and around the Persian Gulf region across Central Asia (see Map 8.1 and Map 8.2 below) [BP 2009].225 The remainder of the world’s proven conventional gas reserves is located more or less randomly outside this ellipse. With the expected rising importance of imports of fossil fuels in the West (see Section 8.4), the strategic ellipse will increase in geo-strategic and -economic importance. The United States Aiming to secure its position by influencing the emerging geo-strategic dimension to gas flows as a result of the changing international political system, the US seeks to create spheres of influence in Eurasia. This in order to prevent that one single power or coalition of land powers is a dominant player in the Eurasian continent.226 This is done either in the form of military and economic alliances or by establishing key regimes politically receptive to US policies.227 US energy security policies and its foreign security policy traditionally focus on oil supply security. For natural gas, the story is different: the US does hardly import any gas volumes outside the American continent (see Section 8.3) and the interregional gas market is fun-damentally different from the oil market in terms of liquidity and end-uses. However, in American eyes, the energy dependence of Euro-Atlantic allies on a resurgent Russia is seen as a major liability to trans-Atlantic relations, even in post-Cold War terms. Furthermore, the freeing up of oil and gas resources in the Caspian Sea region (due to the break-up of the Soviet empire) became the centre of a wider post-1991 American campaign, which would bypass enemies such as Iran and would break Russia’s standing monopoly on these flows [CIEP 2004; Zhiznin 2007]. The US encouraged the participation of international energy firms in projects that could develop and transport oil and gas from the energy-rich from the countries around the Caspian Sea (by pipeline) and Middle Eastern region (principally by LNG) to Europe and other US allies.228 This process is encouraged through the integrated use of various politi-
225 Of these reserves, much is located in the former Soviet states around the Caspian Sea and in the Persian Gulf region (some 7 percent and 30 percent, respectively), see also Section 8.3 [BP 2009]. The increasing production from uncon-ventional gas, especially in the US, has changed the position of the ‘strategic ellipse’.
226 This is the basic premise of the Heartland-Rimland doctrine. The ‘Heartland’ happens to cover almost exactly the area once occupied by the Soviet Union, while the Rimland covers a band or region surrounding the Heartland. This crucial fact echoes the theories of Mackinder [1904] and Spykman [1944].
227 Expanding the Euro-Atlantic community broadly, into areas formerly occupied by the Eurasian foe became a natural follow-up for US foreign policy. The US has carefully maintained and – particularly since 9/11 – expanded its presence and spheres of influence, moving to expand its reach further into geopolitically critical areas such as the Caucasus (Georgia and Azerbaijan), Central Asia and Afghanistan: the Eurasian ‘middle ground’. In March 2003, the US inten-sified its presence in the Persian Gulf region, by invading Iraq.
228 The establishment of the Baku-Tbilisi-Ceyhan (BTC) pipeline, in the first place, and the SCP bear witness to this strategy. With a pro-US regime in place in Afghanistan, the US may ‘comfortably’ control one of the most important

171
cal institutions such as pro-US regimes, the NATO alliance, bi-lateral alliances, ‘protec-torates’ such as GUAM and international financial institutions (such as the IMF and the World Bank). This so-called rollback strategy refers specifically to parts of Eastern Europe (especially Ukraine) and the Caucasus, which may serve or actually serve as important transit corridors for gas from the Caspian region to Europe. The NATO expansion herein, the installation of US forces in new NATO member states and associations such as GUAM have been pivotal. The coloured revolutions of 2003-2004 have helped to further destabilise Russia’s sphere of influence. To put it briefly, Russia is able to use its gas resources in order to tie in important poten-tial US allies into the Russian sphere of influence. Therefore, the gas import dependence of its European – and in the future also other – allies is and has been a major concern for US strategists and threaten America’s long-run relative structural power. As a result, as it had done already under the Reagan Administration, the US tries to discourage and delay new Russian gas investments programmes towards Europe and cooperation between Rus-sia’s and European gas firms.229 However, Bressand [2010] argues that “the Obama Ad-ministration’s effort to ‘reset’ relations with Russia has reduced the divergences of views between key continental European countries and the US regarding the risks associated with dependence on Russian gas. Washington’s all-out opposition to the Nord and South Stream pipelines has been replaced” by an effort “to engage Russia constructively,” as stated by Richard Morningstar, the US Special Envoy for Eurasian Energy [Wall Street Journal Europe, 2009]. The Russian Federation Obviously, this US strategy comes as a serious challenge to a newly emerging Russia, which itself has only recently begun to recover from its post-1991 politico-economic shock. In this geo-economic game of pipeline politics, Russia has its own post-1991 insti-tutions, which it can use to influence the geo-economic flows of gas. Some of these have a security-based character, such as the Collective Security Treaty Organisation (CSTO) and the Shanghai Cooperation Organisation (SCO), the former being a Russian-led, post-Soviet effort to re-integrate countries of the CIS into a collective security organisation, thus more geopolitical driven. The latter is a Russian-Chinese effort to achieve a similar goal on a larger scale and to foster economic ties, although the relationship between the two countries remains fragile. The SCO, in addition, offers a platform for energy negotia-
potential gateways for energy flows from Central Asia to emerging economies such as India and China and to the Indian Ocean [Money Plus 2008]. The first and second case study discussed in Chapter 11 describes in greater detail the institutionalisation of the energy corridors discussed above.
229 For instance, the constructions of new pipelines towards Europe (such as the Nord Stream pipeline) were opposed by the Americans (see also Case 3 in Chapter 11). Although some authors refer to the US-Russian energy relation as a ‘cold energy war’, at the beginning of the 2000s an Energy Dialogue started between the US and Russia [Zhiznin 2007].

172
tions, both bilateral and multi-lateral ones [Lukin 2004]. Russia is currently intensifying efforts to concretise them further in Russia’s foreign and security policies. Russia’s own fossil fuels become the cornerstone of its newfound resurgence as an impor-tant geo-strategic player on the international arena, also encouraged by the rising oil and prices from 2004 until the autumn of 2008. Russia’s leaders thus have found in energy export, in the long-run gas in particularly (see Chapter 3), a central factor in developing its own economy and an effective foreign policy, institutionalised via Gazprom [Åslund 2007; Goldman 2008]. In its expansion strategy for gas to Europe and elsewhere, Russia makes use of its current diplomatic ties in an attempt to achieve political as well as busi-ness support in these regions in order to institutionalise new gas projects, i.e., pipeline diplomacy (see case studies 2 and 3 in Chapter 11) [Goldthau 2010; Zhiznin 2007]. From a value chain perspective too, Russia is pursuing a newly emerging post-Soviet strategy to secure gas flows on the Eurasian continent by acting as an aggregator for gas from the Caspian Sea region, also influenced by regional geopolitical motives. Since the late 1990s, these gas flows have become increasingly important to supplementing Russia’s gas export position in both CIS and European gas markets (see also Chapter 9 and 10) [CIEP 2008]. The EU and its member-states Until the end of the 1990s, as mentioned in Part II, the EU and its member states had not carried out a pro-active policy for the former Soviet States in the Caspian region and fo-cussed its policy on Central and Eastern Europe, except from the Energy Charter (see Chapter 7) [Bossyt 2008; Laumulin 2002]. What differed from the US strategy as well was the relatively ‘mild’ attitude towards Russia in handling its interests in the Caspian Sea region. The EU believed that its Caspian interests could be ensured in best through coop-eration with Russia [Amineh 2003; Laumulin 2002]. At the end of the 1990s – when the transition process in Central and Eastern Europe seemed advantageous to the EU – a more proactive policy towards the Caspian region was initiated [Laumulin 2002]. This was boosted by the Russia-Ukraine gas disputes (especially in 2006 and 2009) and Russia-Georgia conflict in 2008, which triggered a European debate on diversification of gas imports and transit routes [Zhiznin 2007; Pirani et al. 2009].230 As far as European relations with Russia are concerned, the EU has commenced different initiatives to work together, such as the EU-Russia Energy Dialogue, which started in
230 For instance, the planned Caspian Development Corporation (CDC), launched by the European Commission and supported by a number of member-states such as France, aims to create an entity to aggregate and catalyse gas produc-tion and infrastructure development by constructing a mechanism for co-ordinated gas purchasing. In addition, the Nabucco pipeline aims to diversify gas imports and routes from Russia, which is political and financial supported by the EU.

173
2000 [Zhiznin 2007].231 A multilateral approach towards the EU-Russia gas relations failed to the utmost extent, largely as a result of a lack of mutual trust and asymmetric interests between the EU and Russia as well as within the EU itself [Van der Linde 2007; Pirani et al. 2009]. Combined with the lack of a coherent foreign (energy) policy [Van der Linde 2007], ‘[a] number of EU countries, in particularly the so-called ‘Big Four’ (France, the UK, Germany and Italy) elaborate and implement their own foreign energy policy taking into account their national energy interests’ [Zhiznin 2007]. In particular, Ger-many, France and Italy encourage bilateral gas cooperation with Russia, both on a political and a business level, which were not per se in line with American interests. Conversely, Central European countries, which were previously within the Russian sphere of influ-ence, and some other pro-Atlantic countries (like, the UK and Sweden) tend to rely more on the trans-Atlantic relationship (NATO and the US) instead of the ‘soft’ power of the EU and the old member states. In particular, this applies to the relationship with Russia in becoming less dependent on Russia and its energy resources [Tymoshenko 2007]. It is therefore unclear whether, on the one hand, EU energy policy might focus on integrating Russia into its energy (and political) system. On the other hand, the EU may choose to diversify away from Russia through a set of different policy measures, either for geo-economic or geopolitical reasons.232 For Russia, gas plays an important long-run economic role as source of economic well-being. The developments in demand and competition in the interregional market (see Chapter 10 and Chapter 11) play a crucial role in determining a Russian export strategy for gas in capturing additional market share. However, the geopolitical competition for routes from the Caspian region, combined with US aim to undermine Russia’s strategy. In addition, the complexity of the EU, both in terms of political functioning, energy policies and level of gas penetration, influence Russia’s gas export policy. The question which will be addressed in this part, is how Russia is able to coordinate gas flows outside its control, outside the Eurasian continent, and specifically, from the Caspian and Persian Gulf re-gions. Any flows from this region to Europe (or other markets), either by LNG or pipe-line, can lead to market share loss for Gazprom in the long run. As will be shown, together with Russia, these countries boast national energy firms, which have control in the up-stream over vast gas resources as well as potential for downstream integration. In develop-ing an integrated gas strategy, Russia and Gazprom can either compete or can establish inter-governmental operation and regulatory bodies in order to coordinate competition, cooperation and off take [Zhiznin 2007].
231 For an overview of the EU-Russia energy relation, see for example Zhiznin [2007], Handke and De Jong [2007], and Monaghan and Montanaro-Jankovski [2006]. For an overview of and analysis on EU’s external energy policy, see for example Van der Linde [2007; 2008].
232 These measures include: (1) stimulating pipeline and LNG supplies from non-Russia sources; (2) focussing on other fuels (such as nuclear and renewables); and (3) stimulating energy savings and efficiency.

Rim
land
Hear
tland
Stra
tegi
cga
sel
lipse
II
I
I
II
I
II
II II
II II
II
I I
I
II
II
IIIIII
II
II
III
II
III
II
•St
okin
g an
‘ene
rgy
secu
rity’
deba
te o
ver R
ussi
an g
as in
Eu
rope
•
‘Ser
ving
’Eur
opea
n al
lies
with
no
n-Ru
ssia
n ga
s (fr
om C
aspi
an,
Qat
ar, e
tc.,
also
see
abo
ve)
III
III IIIIn
tens
ify R
ussi
an b
usin
ess
rela
tions
with
the
Wes
t and
Chi
na
•Fr
om C
aspi
an to
Eur
ope/
Turk
ey
(e.g
., SC
P, T
CGP,
Nab
ucco
) •
From
Cas
pian
to P
akis
tan/
Indi
a (e
.g.,
TAPI
)•
LNG
flow
s fro
m P
ersi
an G
ulf
•Fi
nanc
ial s
uppo
rt th
roug
h IF
Is(e
.g.,
thro
ugh
Wor
ld B
ank)
•Po
ssib
ly d
isco
urag
e Ru
ssia
’s
prop
osed
and
pla
nned
pip
elin
es
•Su
ppor
t pro
-Rus
sian
regi
mes
•Re
-inte
grat
e se
curit
y pr
esen
ce in
CIS
th
roug
h CS
TO: e
nerg
y &
sec
urity
ne
xus
in p
ost-S
ovie
t spa
ce•
Supp
ort a
ctiv
ities
of R
ussi
an
natio
nal e
nerg
y fir
ms
dom
estic
ally
an
d ab
road
•(e
xplo
ring
upst
ream
pos
sibi
litie
s in
No
rther
n co
ne o
f stra
tegi
c el
lipse
–Ar
tic re
gion
)
•Fr
om C
entra
l Asi
a vi
a Ru
ssia
to
Euro
pe (e
.g.,
CAC
–Br
ownf
ield
in
vest
men
ts)
•Pe
rhap
s fro
m A
zerb
aija
n to
Ru
ssia
(rev
erse
flow
)•
Coop
erat
ion
(e.g
., jo
int
vent
ures
) with
oth
er m
idst
ream
su
pplie
rs
•Jo
int v
entu
res
with
Eur
opea
n ut
ilitie
s (th
roug
h as
set-s
wap
s)•
Expl
orin
g do
wns
tream
act
iviti
es in
Eu
rope
•Co
oper
atio
n be
twee
n Ch
ina
and
Russ
ia in
SCO
–in
tens
ify e
nerg
y di
plom
acy
•Pu
rsui
t of p
ossi
ble
deal
with
Ch
ines
e na
tiona
l ene
rgy
firm
s: fi
rst
at a
gov
ernm
ent l
evel
, the
n at
a
com
pany
leve
l
Russ
ian
supp
ortf
or G
azpr
om in
ga
s flo
ws
over
Rus
sian
terr
itory
Russ
ian
influ
ence
in u
pstre
am o
f So
uthe
rn c
one
of s
trate
gic
ellip
se
Lim
it an
d/or
con
tain
dep
ende
ncy
of U
S al
lies
on R
ussi
an g
as
US s
uppo
rtof
non
-Rus
sian
gas
flo
ws
to b
reak
-up
its m
onop
oly
II •Fr
om C
aspi
an to
Eu
rope
/Tur
key
(Sou
ther
n co
rrid
or, e
.g.,
Nabu
cco)
•
Fina
ncia
l sup
port
thro
ugh
IFIs
for t
hese
(and
oth
er) p
ipel
ine
initi
ativ
es (e
.g.,
EBRD
) •
Supp
ort f
or N
ord
and
Sout
h St
ream
(esp
. fro
m la
rge
mem
ber s
tate
s an
d Eu
rope
an
mid
-stre
amer
s)
Euro
pean
sup
port
of n
on-R
ussi
an
and
Russ
ian
gas
flow
s
III
•EU
-leve
l pol
icie
s: u
nder
min
e Ru
ssia
n ga
s do
wns
tream
: suc
h as
th
e ‘G
azpr
omcl
ause
’in
EU
legi
slat
ion
in o
rder
to d
isco
urag
e G
azpr
om’s
dow
nstre
am a
ctiv
ities
in
Euro
pe•
At m
embe
r sta
te le
vel:
prov
ide
Gaz
prom
dow
nstre
am a
cces
s vi
a as
set-s
wap
s (e
sp. b
y la
rge
mem
ber
stat
es a
nd E
urop
ean
mid
stre
amer
s)
Conf
lictin
g Eu
rope
an p
olic
ies
tow
ard
Russ
ian
gas
I •Su
ppor
t pro
-US
regi
mes
•M
aint
aini
ng U
S m
ilita
ry
pres
ence
in k
ey a
reas
•Su
ppor
t act
iviti
es o
f in
tern
atio
nal e
nerg
y fir
ms
in
M&A
san
d jo
int v
entu
res
•(e
xplo
ring
upst
ream
po
ssib
ilitie
s in
Nor
ther
n co
ne o
f st
rate
gic
ellip
se –
Arct
ic re
gion
)
US in
fluen
ce in
ups
tream
of
stra
tegi
c el
lipse
I •Su
ppor
t act
iviti
es o
f in
tern
atio
nal e
nerg
y fir
ms
in
M&A
, ass
et s
wap
s, a
nd jo
int
vent
ures
, bot
h in
Rus
sia
and
othe
r reg
ions
•CD
C as
an
EU in
stru
men
t to
buy
gas
from
the
Casp
ian
regi
on
Euro
pean
pre
senc
e in
stra
tegi
c el
lipse
CIS
CIS
asso
ciate
GCC
Eura
sia
and
North
Am
eric
a:
Mai
n po
litic
al, e
cono
mic
and
secu
rity
allia
nces
EU NATO
Poss
ible
NAT
O e
xpan
sion
US a
llies
outs
ide
NATO
Pro-
US re
gim
e
‘Rog
ue’ s
tate
(vis-
à-vis
the
US)
SCO
SCO
obs
erve
r
Gas
flow
s se
rvin
g Ru
ssia
n in
tere
sts
Gas
flow
s se
rvin
g Eu
ro-A
tlant
ic in
tere
sts
Gas
flow
s se
rvin
g Ch
ines
e in
tere
sts
Oth
er s
ymbo
ls
US m
ilitar
y fa
cility
/bas
e
Note
s:
-Sch
emat
ic ov
ervie
w.-M
ap o
nly
incl
udes
rele
vant
inst
itutio
ns a
nd to
pics
for t
his
diss
erta
tion.
Sour
ce: o
wn a
nalys
is, i
nstit
utio
ns’w
ebsi
tes;
exp
ert
inte
rvie
ws.
Lege
nd
CIS
CIS
asso
ciate
GCC
Eura
sia
and
North
Am
eric
a:
Mai
n po
litic
al, e
cono
mic
and
secu
rity
allia
nces
EU NATO
Poss
ible
NAT
O e
xpan
sion
US a
llies
outs
ide
NATO
Pro-
US re
gim
e
‘Rog
ue’ s
tate
(vis-
à-vis
the
US)
SCO
SCO
obs
erve
r
Gas
flow
s se
rvin
g Ru
ssia
n in
tere
sts
Gas
flow
s se
rvin
g Eu
ro-A
tlant
ic in
tere
sts
Gas
flow
s se
rvin
g Ch
ines
e in
tere
sts
Oth
er s
ymbo
ls
US m
ilitar
y fa
cility
/bas
e
Note
s:
-Sch
emat
ic ov
ervie
w.-M
ap o
nly
incl
udes
rele
vant
inst
itutio
ns a
nd to
pics
for t
his
diss
erta
tion.
Sour
ce: o
wn a
nalys
is, i
nstit
utio
ns’w
ebsi
tes;
exp
ert
inte
rvie
ws.
Lege
nd
A P
DF
vers
ion
of th
is m
ap is
ava
ilabl
e at
<ht
tp://
ww
w.c
linge
ndae
l.nl/c
iep>
for m
agni
ficat
ion
purp
oses
onl
y
Wor
ld M
ap T
empl
ate:
©by
Le M
onde
Dip
lom
atiq
ue
A P
DF
vers
ion
of th
is m
ap is
ava
ilabl
e at
<ht
tp://
ww
w.c
linge
ndae
l.nl/c
iep>
for m
agni
ficat
ion
purp
oses
onl
y
Wor
ld M
ap T
empl
ate:
©by
Le M
onde
Dip
lom
atiq
ue
Map 8.1 Geopolitical spheres of influence, forces and gas flows

175
8.3 Reserves, current production and net-exporting countries
As described in Section 8.2, the bulk of the world’s proven conventional gas reserves are found in one massive cluster or ‘strategic ellipse’.233 The remainder of the world’s proven gas reserves is located randomly outside this ellipse, the latter containing more than 70 percent of the world’s proven gas reserves, and more than 70 percent of the world’s oil reserves (see also Map 8.2). Some of these countries (especially Turkmenistan and Russia in the Artic region) likely possess more reserves yet to be found. In addition, large uncon-ventional gas reserves in especially the US and the former Soviet Union changed the re-serve outlook, and they may change it further in the future. The world’s conventional gas reserves are more concentrated than is the case for the world’s oil reserves. Three coun-tries, Russia, Iran and Qatar dominate the reserve skyline, possessing the vast bulk of the world’s natural gas reserves: 43.3 tcm (23.4 percent), 29.6 tcm (16.0 percent) and 25.46 tcm (13.8 percent), respectively. This means that some 53.2 percent of global gas reserves are in the hands of just three countries [BP 2009]. In the case of oil, five countries are needed to reach the 60 percent mark for the world’s oil reserves. The next largest gas re-serve holders, which are also major oil producers, pale in comparison, none exceeding 8 tcm worth of reserves, or some 4 percent of the total.234 The result of these reserve facts is that the international gas market, regardless of how it actually functions in terms of tra-ding and pricing, is naturally predisposed to an oligopolistic market structure (see also Chapter 3). The supply side of the international gas market is therefore characterised by a limited number of very large – and potentially very large – suppliers and many smaller, heterogeneous players. One should hasten to add that the international gas market is es-sentially an interregional market, and as will be seen, far from global as of yet. The main production areas in the world are concentrated as well. Russia is the biggest gas producer of the world (657 bcm in 2008), whereas most of its gas is consumed in Russia [IEA 2009b]. For its export, Gazprom has a monopoly over export flows. According to Gazprom’s data, Gazprom’s gas export sales in the CIS were 83 bcm and in Europe 170 bcm in 2008 [Gazprom 2009]. Other major producing countries are the US (583 bcm in 2008), Canada (175 bcm in 2008) and Iran (121 bcm in 2008). Canada exports 58 per-cent of its production to the US and the remaining production is for internal use. The US
233 Gas reserve statistics changed substantially over time. Between 1988 and year’s end 2008, for example, the world’s total proven gas reserves rose from 109.72 tcm to 185.02 tcm, an increase of almost 70 percent in only 20 years [BP 2009]. New exploration technologies and the collapse of the Soviet Union have helped contribute to this revision in global gas reserves throughout the 1990s.
234 The next largest reserve holders include: Turkmenistan at 7.94 tcm (4.3 percent); Saudi Arabia at 7.67 tcm (4.1 percent); the US, 6.73 tcm (3.6 percent); the United Arab Emirates, 6.43 tcm (3.5 percent); Nigeria 5.22 tcm (2.8 percent); Venezuela, 4.84 tcm (2.6 percent); Algeria, 4.50 tcm (2.4 percent); Indonesia, 3.18 tcm (1.7 percent); Iraq 3.17 tcm (1.7 percent); Norway, 2.91 tcm (1.6 percent); Australia, 2.51 (1.4 percent); China, 2.46 tcm (1.3 percent); Malaysia, 2.39 tcm (1.3 percent); Egypt, 2.17 tcm (1.3 percent); Kazakhstan, 1.82 tcm (1.0 percent); and Kuwait, 1.78 tcm (1.0 percent). Noteworthy is the fact that of the world’s gas reserves, 9 percent (16.63 tcm) are located in OECD countries, while roughly 50 percent are located in OPEC countries (non-OECD), next to Russia’s non-OPEC 23.4 percent [BP 2009].

176
consumes most of its gas domestically. Although in potential, Iran may become a major exporter, by 2008 it is a net-importer of gas (1.7 bcm). Besides Russia and Canada, Nor-way and Algeria are major exporters (and producers) of gas. Norway produced 103 bcm in 2008 and exported a large share to Europe by pipeline, and in the near future also by LNG. Algeria consumes a larger share, 31 percent, of its production (82 bcm in 2008) domestically. The Netherlands is a traditional exporter of gas to European countries, which produced 85 bcm in 2008, of which 62 bcm was exported to other EU member states [IEA 2009b].
Figure 8.1 Historical export volume development of gas exporting countries: 1998-2008
Source: own analysis, based on IEA [2003]; IEA [2008]; IEA [2009].
0
100
200
300
400
500
600
700
800
900
1000
1998 1999 2000 2001 2002 2003 2004 2005 2006 2007 2008
Algeria
Norway
Canada
Russia
Year
Ga
s v
olu
me
in b
cm
The Netherlands
Turkmenistan
Qatar
Indonesia
Other exporting countries
The UK and Saudi Arabia consume most of their produced gas (respectively, 73 bcm and 70 bcm in 2008) domestically. Other major producers are China (76 bcm in 2007), Mex-ico (52 bcm in 2008) and Argentina (45 bcm in 2008) [IEA 2009b]. The upstream gas sectors in other upcoming exporters – mainly the Caspian region, Iran, Iraq and Qatar – are relatively under-developed. Traditionally, Central Asian countries play an important role in Russia’s current gas export flows, but from the mid-1990s onwards they have been in search of alternative pipeline routes. Qatar called for a moratorium in 2005 on the North field, halting further investment decisions on new projects while it is bringing to fruition some massive, committed LNG projects [CIEP 2008]. In the Asia-Pacific mar-kets, Indonesia, Malaysia, Australia and Brunei play an important role in LNG exports. The other major gas exporters (and producers) are outlined in Figure 8.1 and Map 8.2.

Exis
ting
pipe
line
expo
rt ca
paci
ty
Pros
pect
ive p
ipel
ine
expo
rt ca
paci
ty
Pipe
line
expo
rt ca
paci
ty to
be
over
haul
ed
LNG
flow
Gas
infra
stru
ctur
e
Pros
pect
ive g
as p
rodu
ctio
n pl
ant
Ope
ratio
nal L
NG
lique
fact
ion
plan
t
Pros
pect
ive L
NG
lique
fact
ion
plan
t
Ope
ratio
nal L
NG
rega
sific
atio
npl
ant
Pros
pect
ive L
NG
rega
sific
atio
npl
ant
Gas
fiel
d
Poss
ible
LN
G fl
ow
Ope
ratio
nal g
as p
rodu
ctio
n pl
ant
Russ
ia’s
exp
ort a
nd im
port
pipe
lines
x x x
Brot
herh
ood
Soyu
z/Tr
ans-
Balk
an
Yam
al-E
urop
e
Blue
Stre
am
Nor
dSt
ream
Sout
h St
ream
B CA D E F
Pre-
Cas
pian
Cen
tral-A
sia-
Cen
tre
Alta
i
East
-Sib
eria
-C
hina
-Sou
th K
orea
H IG J
Liqu
efac
tion
capa
city
pla
nned
/pro
pose
d
Liqu
efac
tion
capa
city
und
er c
onst
ruct
ion
Liqu
efac
tion
capa
city
in o
pera
tion
xxLege
nd
Not
es:
-Thi
s is
a s
chem
atic
ove
rvie
w th
at d
esig
ned
to p
rovi
de b
asic
in
form
atio
n on
a g
loba
l sca
le.
-Map
doe
s no
t inc
lude
all
infra
stru
ctur
es, f
lows
, gas
fiel
ds, g
as-
expo
rting
and
pro
duci
ng c
ount
ries.
-All f
igur
es a
re in
bcm
, unl
ess
othe
rwis
e in
dica
ted.
Sour
ce:o
wn
anal
ysis
, BP
[200
9]; I
EA [2
009a
]; IE
A [2
009b
]; C
edig
az[2
008]
; CIE
P [2
008]
; Pet
role
um E
cono
mis
t [20
08];
com
pany
web
site
s.
2712
883386
84155
30
A
31
E
6316
33C
105
20B
50
20
9020
3030
30
3010
10
12
30
10
2030
8**
Indo
nesi
a
40
Atla
ntic
Bas
inAs
ia-P
acifi
c Ba
sin
Nor
way
Net
herla
nds
Rus
sia
Kaza
chst
an
Turk
men
ista
n
Alge
riaLi
bya
Egyp
t
Azer
baija
n Ira
q Qat
ar
UAEIra
n
Nig
eria
Mal
aysi
a
Indo
nesi
a Au
stra
lia
Trin
idad
and
Tob
ago
Can
ada
FD
GH
I
J
Gas
bal
ance
-200
8 L
ique
fact
ion
rese
rves
(tc
m)
prod
uctio
n
expo
rt12
43.3
657 195
prod
uctio
n
expo
rt12
2008
2010
2015
44.7
651
7.9
2008
2010
2015
20
20
20
13
13
1
30
0
0
71
Gas
bal
ance
-200
8 L
ique
fact
ion
prod
uctio
n
expo
rt12
2008
2010
2015
44.7
651
1.8
0
0
0
26
Gas
bal
ance
-200
8 L
ique
fact
ion
Russ
iaTu
rkm
enis
tan
Kaza
khst
an
51
rese
rves
(tc
m)
rese
rves
(tc
m)
17
prod
uctio
n
expo
rt12
2008
2010
2015
44.7
651
1.2
0
0
0
16
Gas
bal
ance
-200
8 L
ique
fact
ion
5
rese
rves
(tc
m)
Azer
baija
n
Indo
nesi
a
Aust
ralia
Mal
aysi
a
Gas
bal
ance
-200
8 L
ique
fact
ion
prod
uctio
n
expo
rt12
2008
2010
2015
3.2 77 34
16
1
6
16
10 3950
50
Gas
bal
ance
-200
8 L
ique
fact
ion
prod
uctio
n
expo
rt20
0820
1020
15
2.5
45 19
98
98
98
6
6
26
26
Gas
bal
ance
-200
8 L
ique
fact
ion
prod
uctio
n
expo
rt20
0820
1020
15
2.5 62 29
10 31
41
41
rese
rves
(tc
m)
rese
rves
(tc
m)
rese
rves
(tc
m)
32
2
2
2
Gas
bal
ance
-200
8 L
ique
fact
ion
rese
rves
(tc
m)
prod
uctio
n
expo
rt12
2008
2010
2015
25.5
79 58
6411
41
9410
5
Gas
bal
ance
-200
8 L
ique
fact
ion
rese
rves
(tc
m)
prod
uctio
n
expo
rt12
2008
2010
2015
29.6
121
578
78
7
8
Iran
Qat
arUA
EIra
q
prod
uctio
n
expo
rt12
2008
2010
2015
44.7
651
3.2
0
0
0
1
Gas
bal
ance
-200
8 L
ique
fact
ion
0
rese
rves
(tc
m)
prod
uctio
n
expo
rt12
2008
2010
2015
44.7
651
6.4
51
Gas
bal
ance
-200
8 L
ique
fact
ion
7
rese
rves
(tc
m)
8
8
8
Nige
ria
Alge
ria
Egyp
t
Gas
bal
ance
-200
8 L
ique
fact
ion
prod
uctio
n
expo
rt12
2008
2010
2015
5.2
35 21
71
7
1
71
30
30
30
Gas
bal
ance
-200
8 L
ique
fact
ion
prod
uctio
n
expo
rt20
0820
1020
15
4.5 82 58
13
13
13
6
6
28
28
Gas
bal
ance
-200
8 L
ique
fact
ion
prod
uctio
n
expo
rt12
2008
2010
2015
2.2 58 18
16
16
16
34
Liby
a
Gas
bal
ance
-200
8 L
ique
fact
ion
prod
uctio
n
expo
rt12
2008
2010
2015
1.5
17 10
rese
rves
(tc
m)
1
1
1
rese
rves
(tc
m)
rese
rves
(tc
m)
rese
rves
(tc
m)
12
12
12
36
36
36
prod
uctio
n
expo
rt12
2008
2010
2015
44.7
651
1.6
0
0
0
175
Gas
bal
ance
-200
8 L
ique
fact
ion
103
prod
uctio
n
expo
rt12
44.7
651
0.5 35
Gas
bal
ance
-200
8 L
ique
fact
ion
17
Trin
idad
and
Tob
ago
Cana
da
rese
rves
(tc
m)
rese
rves
(tc
m)
Norw
ay
Gas
bal
ance
-200
8 L
ique
fact
ion
prod
uctio
n
expo
rt12
2008
2010
2015
2.9 10
3
96
rese
rves
(tc
m)
6
6
6
6
6
6
2008
2010
2015
21
21
21
7
7
7
Neth
erla
nds
Gas
bal
ance
-200
8 L
ique
fact
ion
prod
uctio
n
expo
rt12
1.4 85 62
2008
2010
2015
0
0
0
rese
rves
(tc
m)
Wor
ld M
ap T
empl
ate:
©by
Le M
onde
Dip
lom
atiq
ue
A PDF version of this map is available at <http://www.clingendael.nl/ciep> for magnification purposes only
Map 8.2 Main net-exporting countries and their gas infrastructures
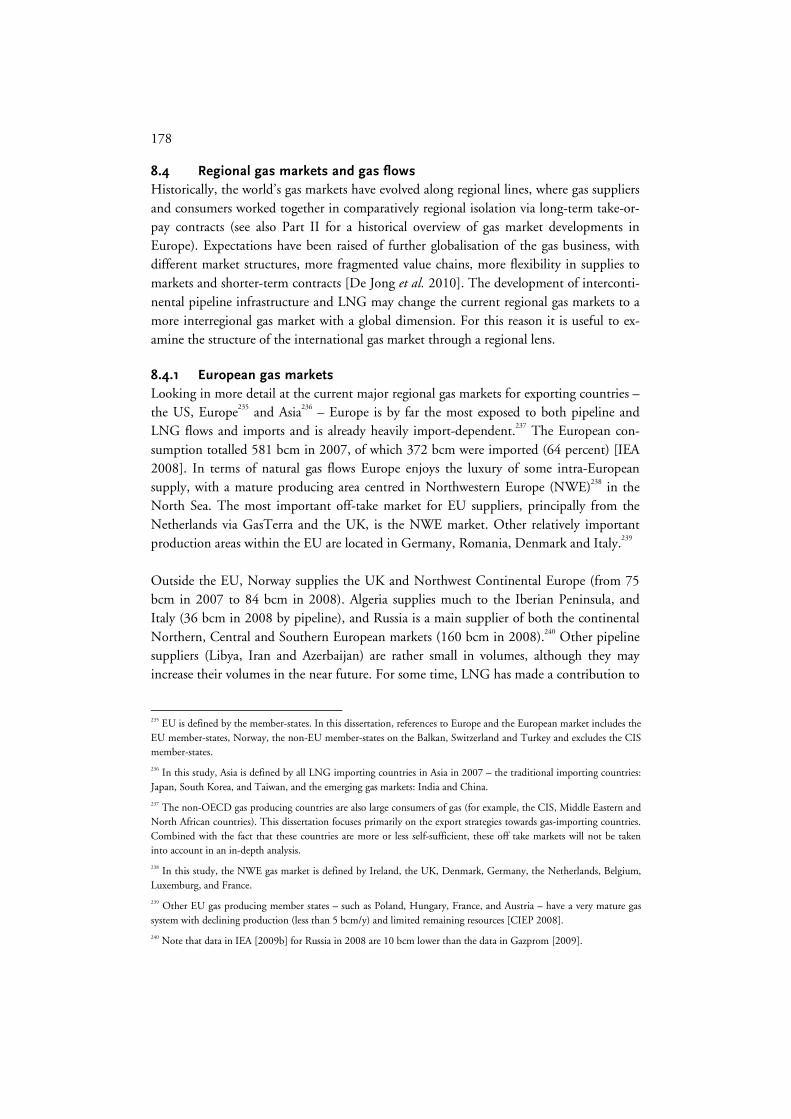
178
8.4 Regional gas markets and gas flows
Historically, the world’s gas markets have evolved along regional lines, where gas suppliers and consumers worked together in comparatively regional isolation via long-term take-or-pay contracts (see also Part II for a historical overview of gas market developments in Europe). Expectations have been raised of further globalisation of the gas business, with different market structures, more fragmented value chains, more flexibility in supplies to markets and shorter-term contracts [De Jong et al. 2010]. The development of interconti-nental pipeline infrastructure and LNG may change the current regional gas markets to a more interregional gas market with a global dimension. For this reason it is useful to ex-amine the structure of the international gas market through a regional lens.
8.4.1 European gas markets
Looking in more detail at the current major regional gas markets for exporting countries – the US, Europe235 and Asia236 – Europe is by far the most exposed to both pipeline and LNG flows and imports and is already heavily import-dependent.237 The European con-sumption totalled 581 bcm in 2007, of which 372 bcm were imported (64 percent) [IEA 2008]. In terms of natural gas flows Europe enjoys the luxury of some intra-European supply, with a mature producing area centred in Northwestern Europe (NWE)238 in the North Sea. The most important off-take market for EU suppliers, principally from the Netherlands via GasTerra and the UK, is the NWE market. Other relatively important production areas within the EU are located in Germany, Romania, Denmark and Italy.239 Outside the EU, Norway supplies the UK and Northwest Continental Europe (from 75 bcm in 2007 to 84 bcm in 2008). Algeria supplies much to the Iberian Peninsula, and Italy (36 bcm in 2008 by pipeline), and Russia is a main supplier of both the continental Northern, Central and Southern European markets (160 bcm in 2008).240 Other pipeline suppliers (Libya, Iran and Azerbaijan) are rather small in volumes, although they may increase their volumes in the near future. For some time, LNG has made a contribution to
235 EU is defined by the member-states. In this dissertation, references to Europe and the European market includes the EU member-states, Norway, the non-EU member-states on the Balkan, Switzerland and Turkey and excludes the CIS member-states.
236 In this study, Asia is defined by all LNG importing countries in Asia in 2007 – the traditional importing countries: Japan, South Korea, and Taiwan, and the emerging gas markets: India and China.
237 The non-OECD gas producing countries are also large consumers of gas (for example, the CIS, Middle Eastern and North African countries). This dissertation focuses primarily on the export strategies towards gas-importing countries. Combined with the fact that these countries are more or less self-sufficient, these off take markets will not be taken into account in an in-depth analysis.
238 In this study, the NWE gas market is defined by Ireland, the UK, Denmark, Germany, the Netherlands, Belgium, Luxemburg, and France.
239 Other EU gas producing member states – such as Poland, Hungary, France, and Austria – have a very mature gas system with declining production (less than 5 bcm/y) and limited remaining resources [CIEP 2008].
240 Note that data in IEA [2009b] for Russia in 2008 are 10 bcm lower than the data in Gazprom [2009].

179
European gas markets, mainly with supplies from Algeria (18 bcm in 2007) and Nigeria (14 bcm), but this has been a relatively small portion of the total gas consumption (9 percent). In recent years Qatar has also conquered some market share in the European continent (in 2008, 15 percent of LNG supplies). Northern, Central and Eastern Europe thus rely more on pipeline gas, while Southern and South-western Europe are traditionally dependent on LNG imports, as well as some pipeline imports from North African pro-ducers. Figure 8.2 shows the volumes by pipeline and LNG to Europe in 2008 [IEA 2009b; De Jong et al. 2010].
Figure 8.2 Gas supply to the European countries by type and source in 2008 (in bcm)
581
* Excluding Norway. ** Including CIS deliveries via Russia (through intermediate companies); expect from Azerbaijan, which delivers directly to Turkey. † Azerbaijan: 4.6 bcm; Iran: 4.1 bcm; non specified: 20.6 bcm. ‡ Egypt: 5.3 bcm; Trinidad and Tobago: 5.4 bcm; Oman: 0.2 bcm; non specified: 1.6 bcm.Note: Europe is defined by all European countries, including Turkey, excluding CIS. Totals may not add up due to rounding.Source: own analysis, based on IEA [2009].
NorwayIndigenous supply*
Russia** Other LNG imports‡
Total gas supply
209
160
3618
209
319
Libya Other pipeline imports†
Algeria
10
84
Pipeline imports in bcm
LNG imports in bcm
Indigenous supply in bcm
1 2914 8 12
53
Nigeria Qatar
Mostly all European gas imports materialised through traditional long-term take-or-pay contracts, with indexation to oil and oil products. However, due to different EU Direc-tives aimed at setting up an internal market in the EU, the evolution of shorter-term trade has been encouraged (see Part II). In the UK market, the spot market plays nowadays a dominant role in forming gas prices (via the gas hub National Balancing Point – NBP), as it was self-sufficient in the 1990s. In other markets, the spot market plays a less prominent role.241 These spot markets operate alongside and sometimes feed into the traditional LNG market as far as pricing is concerned. Consequently in the current situation, Europe has a hybrid pricing structure: a blend of spot prices and oil-indexed prices on wholesale level. More recently, European market players have started to trade in short-term LNG [De Jong et al. 2010]. In dynamic market terms, Europe is a relatively mature market in that it
241 In 2008 the total traded volumes on the Western European hubs (excluding NBP, with a traded volume of 961 bcm; and a physical volume of 67 bcm) increased by 58 percent to 188 bcm (physical volumes are estimated at an increase of 63 percent, 66 bcm) [IEA 2009].

180
has a low growth rate in total consumption (0.9 percent per year from 2004 to 2008) [IEA 2009b]. 8.4.2 The US gas market
The US market is an entirely different story comparing to Europe. The market was until recently almost self-sufficient. Looking at gas, in 2008 some 658 bcm worth was con-sumed in the US, while indigenous supply was 546 bcm and imports were 112 bcm [IEA 2009]. Of these 112 bcm, it imported 101 bcm from its North American neighbour Can-ada and 1 bcm from Mexico in the form of pipeline gas. As for LNG, it imported 7 bcm from Trinidad and Tobago, 2 bcm from Egypt, and 1 bcm from other countries [IEA 2009b]. Thus of the 112 bcm the US imported in 2008, 91 percent came from neighbouring pipeline gas exporters and 9 percent from LNG exporters. This means gas imports accounted for only 17 percent of total gas consumption, while LNG imports as a percentage of total consumption amounted only 1.5 percent. Figure 8.3 shows the gas supplies to the US by type and source in 2008. Figure 8.3 Gas supply to the US by type and source in 2008 (in bcm)
* Egypt: 1.6 bcm; Nigeria: 0.3 bcm; Qatar: 0.1 bcm; non specified: 0.5 bcm.Source: own analysis, based on IEA [2009].
Tinidad and Tobago
MexicoIndigenous supply
Canada Other LNG imports*
Total gas supply
546
101
7 3
546
658
102
10
Pipeline imports in bcm
LNG imports in bcm
Indigenous supply in bcm
1
The US market does not apply the business model of long-term contracts between ex-porter and importer, which is the case for Europe and (as shown below) in Asia. Accord-ing to De Jong et al. [2010], the US offers a market where any volume of gas can be sold at the current spot price via gas trading on liquid gas hubs, like Henry Hub. When addi-tional supplies from Canada were no longer available, US gas prices rose to higher levels than in other regional markets. LNG suppliers began ‘to find their way to the US market

181
on the strength of the gas prices at that time, particularly because existing LNG terminal capacity could be de-mothballed to access this increasingly attractive market’ [De Jong et al. 2010]. In view of its depth and liquidity, the US market thus remains the outlet for LNG suppliers, especially those in the Atlantic Basin. However, in recent years, due to higher gas prices and fiscal incentives, the development of unconventional gas has been stimulated, which has reduced the US call on LNG imports (in 2008, the LNG imports were less than half the level of 2007) [IEA 2009].242 In the coming years, gas prices in the US market will be set in essence by competition between LNG and unconventional gas production [IEA 2008b; De Jong et al. 2010].
8.4.3 Asian gas markets
Looking at the Asian gas markets, traditionally Japan, Korea and Taiwan are the most important net-importing countries. Other emerging gas markets, China and India, have been self-sufficient until the turn of the century, and are now facing the need of import gas. However, in China and India, gas still plays a small part in their energy needs (4-5 percent in 2008) [IEA 2009]. The above-mentioned countries are relying for all their imports on LNG. Japan is the world’s largest LNG importer and is completely import-dependency on a large number of LNG suppliers. The total gas consumption in these countries was 267 bcm in 2008. When considering the Asian market as a whole, except the Middle Eastern region and former Soviet states, gas consumption was around 475 bcm in 2008. The share of indigenous supply in the total Asian gas consumption (excluding intra-gas trade by pipeline and LNG) is around 60 percent, due to a small number of large producing countries in Southeast Asia (e.g., Indonesia, Malaysia and Brunei) [De Jong et al. 2010]. When focusing on the LNG importing countries, as mentioned in Figure 8.4, the share of LNG imports is much higher (60 percent) [IEA 2009b]. These countries are for obvious geographical reasons hardly interconnected with pipeline imports from other major gas producing countries. Only China has started to import pipeline gas from Turkmenistan in December 2009, and in the future probably from Myanmar, Kazakhstan and Russia as well (see also Chapter 10) [IEA 2009]. Depending on the price level discussion and geo-political relations, India could be connected with pipeline supplies from Turkmenistan and Iran, although this appears seems unlikely to occur before 2015 [IEA 2009].
242 The Barnett Shale in Texas is already contributing 6 percent to total production in the lower-48 states in the US [IEA 2008b]. Sources of unconventional gas consist of tight gas, deep gas, geo-pressurized zones, shale gas, coal bed methane and methane hydrates [IEA 2008]. Non-conventional gas embraces asset of gas resources that are generally contiguous in nature, sometimes referred to as ‘resource plays’ in the industry, requiring special drilling and stimula-tion techniques to release the gas from the formations in which they can be found. The combination of improved technology and higher gas prices has stimulated production of deepwater and non-conventional resources, which have previously been too difficult been too difficult and costly to extract [IEA 2008b].

182
Figure 8.4 Gas supply to the Asian LNG importing countries by type and source in 2008 (in bcm)
* Oman: 10.9 bcm; Brunei: 9.5 bcm; UAE: 7.9 bcm; Nigeria: 5.7 bcm; Egypt: 4.4 bcm; Trinidad and Tobago: 1.6 bcm; Equatorial Guinea: 3.7 bcm; Algeria: 2.5 bcm; United States: 1.0 bcm; non specified: 0.2 bcm. Note: LNG importing Asian countries in 2007: Japan, South Korea, Taiwan, India and China. Totals may not add up due to rounding.Source: own analysis, based on IEA [2009].
QatarIndigenous supply
Pipeline imports
Other LNG imports*
Total gas supply
108
32
2821
108
267
159
Indonesia AustraliaMalaysia
0
48
31
Pipeline imports in bcm
LNG imports in bcm
Indigenous supply in bcm
Given the high import dependence of the traditional LNG importing countries, the tradi-tional long-term contracts are essential to offer the necessary security of supply. Therefore, they do not seem to have an interest in a business model of flexible and short-term sup-plies, based on gas-to-gas competition. In recent years, due to high gas demand, some short-term trading occurred in good stead and the spot gas was priced at oil parity. As an emerging gas importer, China is also looking for firm supplies, strongly backed by gov-ernment support [De Jong et al. 2010]. Gas prices have been under government control, although there are some opportunities for price reforms (such as for its LNG imports) [IEA 2009]. Yet, until now, India has been relying more on short-term and flexible trade [De Jong et al. 2010]. It can be concluded that regional market structures differ immensely in terms of the dis-tance covered between markets and their suppliers, whether this distance is covered by pipeline or LNG and of course in terms of the geographic origin of the gas and what share of the market these molecules take up. Over the coming years and decades, this structure is expected to change as the LNG industry continues its expansion and as pipeline and LNG interact, particularly in Europe. 8.4.4 Trade and pricing patterns
Natural gas is traded in two ways: either through long-term take-or-pay contracts, i.e., the classic model, or any form of shorter-term trading. The latter type of trading can occur on the basis of short-term contracts, self-contracting (see Chapter 2) and on trading on spot
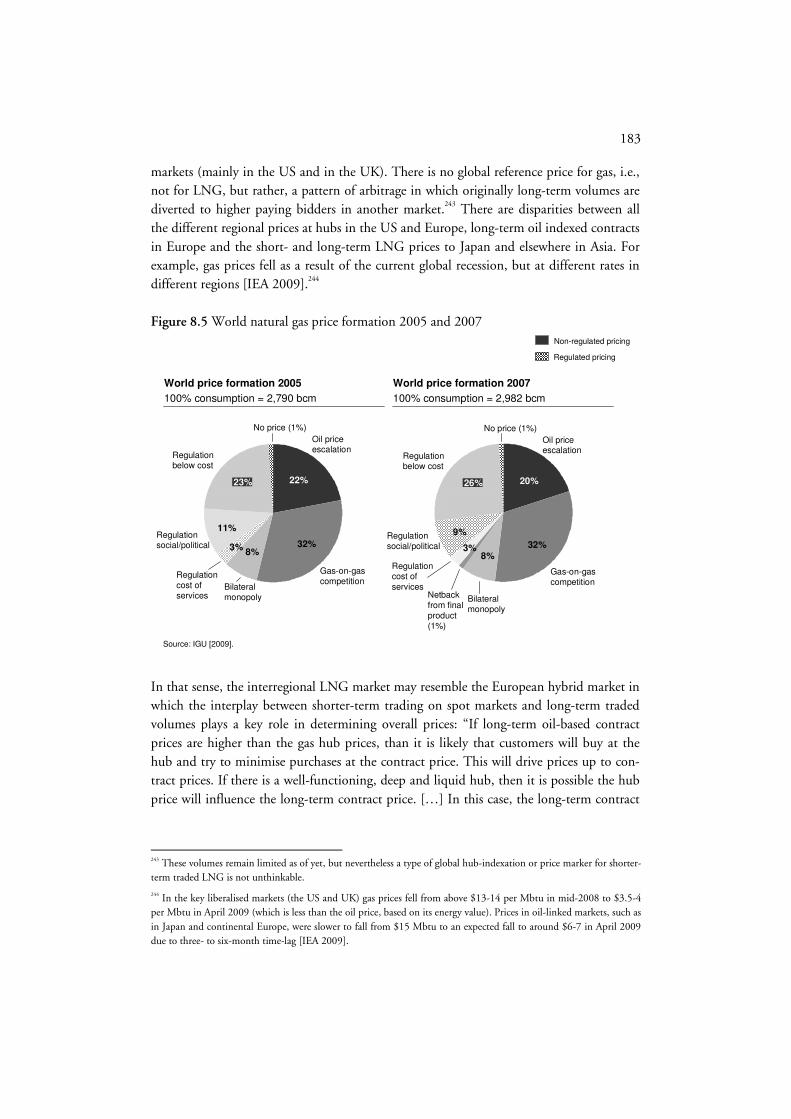
183
markets (mainly in the US and in the UK). There is no global reference price for gas, i.e., not for LNG, but rather, a pattern of arbitrage in which originally long-term volumes are diverted to higher paying bidders in another market.243 There are disparities between all the different regional prices at hubs in the US and Europe, long-term oil indexed contracts in Europe and the short- and long-term LNG prices to Japan and elsewhere in Asia. For example, gas prices fell as a result of the current global recession, but at different rates in different regions [IEA 2009].244 Figure 8.5 World natural gas price formation 2005 and 2007
Source: IGU [2009].
World price formation 2005
100% consumption = 2,790 bcm
World price formation 2007
100% consumption = 2,982 bcm
22%
32%
23%
No price (1%)
Gas-on-gas competition
Oil price escalation
11%
3%8%
Bilateral monopoly
Regulation cost of services
Regulation social/political
Regulation below cost
20%
32%
26%
No price (1%)
Gas-on-gas competition
Oil price escalation
9%
3%8%
Bilateral monopoly
Regulation cost of services
Regulation social/political
Regulation below cost
Netback from final product (1%)
Regulated pricing
Non-regulated pricing
In that sense, the interregional LNG market may resemble the European hybrid market in which the interplay between shorter-term trading on spot markets and long-term traded volumes plays a key role in determining overall prices: “If long-term oil-based contract prices are higher than the gas hub prices, than it is likely that customers will buy at the hub and try to minimise purchases at the contract price. This will drive prices up to con-tract prices. If there is a well-functioning, deep and liquid hub, then it is possible the hub price will influence the long-term contract price. […] In this case, the long-term contract
243 These volumes remain limited as of yet, but nevertheless a type of global hub-indexation or price marker for shorter-term traded LNG is not unthinkable.
244 In the key liberalised markets (the US and UK) gas prices fell from above $13-14 per Mbtu in mid-2008 to $3.5-4 per Mbtu in April 2009 (which is less than the oil price, based on its energy value). Prices in oil-linked markets, such as in Japan and continental Europe, were slower to fall from $15 Mbtu to an expected fall to around $6-7 in April 2009 due to three- to six-month time-lag [IEA 2009].

184
price is likely to be a floor price to the hub with players looking to buy additional gas in the traded market, driving prices up.” [Cronshaw 2008]. In turn, interregional demand in the Atlantic Basin interacts with interregional demand in the Pacific region, putting pricing pressure on LNG volumes, which may be available in small or great amounts. With the expected increasing import-dependency of different regions, the amount of inter-regionally available LNG is likely to become more price-sensitive, as they have been in the period 2006-2008. Located exactly between the Pacific and Atlantic basins and therefore ideally located to take advantage of such pressures in terms of netback pricing, Persian Gulf LNG exporters such as Oman, United Arab Emir-ates (UAE), Qatar and potentially Iran may have the greatest incentive to hold back LNG volumes for flexible trade or to divert originally long-term contracted cargoes in the fu-ture. These diversion effects demonstrate the tendency towards hub-based indexation, or gas-to-gas competition on an inter-regional basis (see also new business models in Chapter 3). In addition to the traditional pricing mechanism in the regional markets described above (accounting for more than 50 percent of the total world’s consumption), pricing based on regulation (e.g., cost of service, below cost and social and political) is responsible for al-most another 40 percent of the total world’s gas consumption. This pricing mechanism is largely applied in producing countries, where gas is (partially) consumed locally. Some countries in which price regulation is currently dominant, such as in Russia and Ukraine, are investigating other pricing mechanisms. The share of gas-on-gas competition-based pricing has grown from 2005 to 2007, largely as a result of it growth spot LNG imports in the traditional LNG importing countries in Asia and in Spain. Other pricing mechanisms are rather small [IGU 2009].
8.5 Growth opportunities for gas exporting countries
In the period stretching to 2015 and beyond, the OECD markets, i.e., the US and Can-ada, OECD Europe, Japan and Korea will remain the world’s deepest markets by volume, while demand in emerging gas markets such as China and India rises fastest in relative terms.245 According to the Reference scenario of the International Energy Agency (IEA), global gas demand is projected to increase by 41 percent between 2007 and 2030, from 3049 bcm in 2007 to 3678 bcm in 2020 and 4313 bcm in 2030, respectively [IEA 2009c]. In the mean time, most of these countries are expected to continue to become more im-port-dependent, due to possible higher gas demand and lower indigenous supplies. In a ‘post-Koyto’ world, gas is traditionally seen as the transition fuel towards more renewable
245 Of great significance, in addition, is the absolute rise in consumption in net-exporting regions and countries such as the Middle East and Russia, putting pressure on their export capacity [IEA 2009].
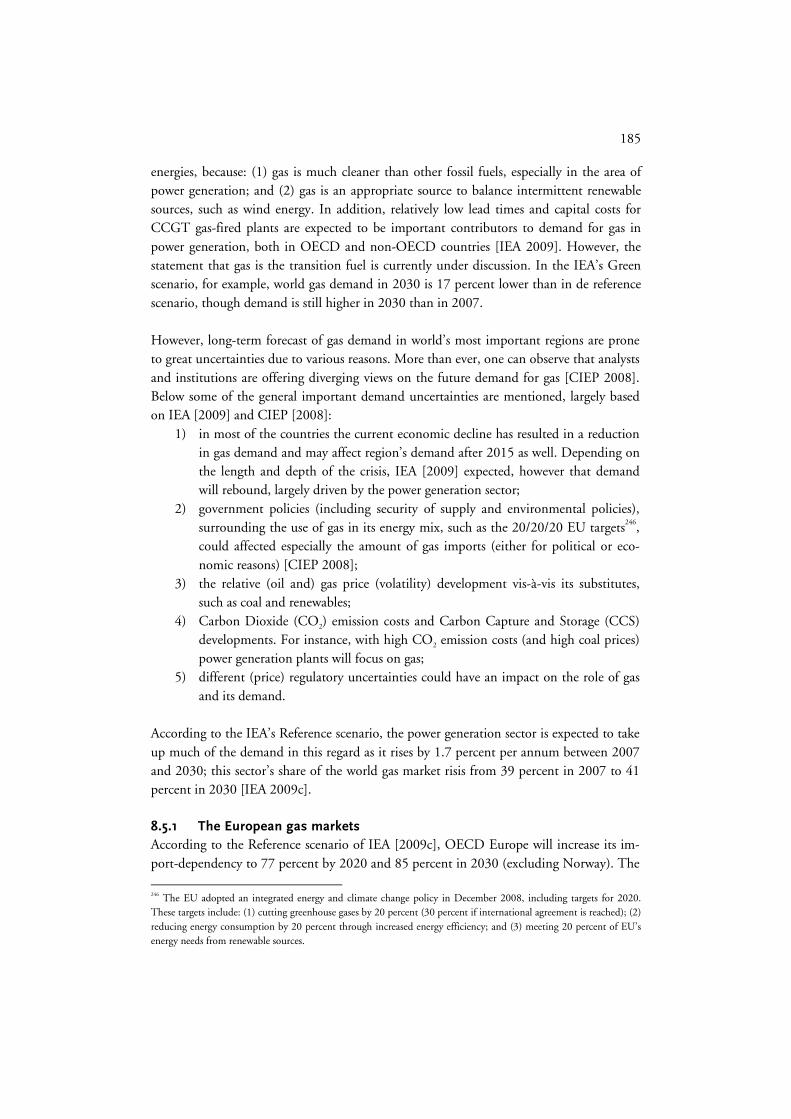
185
energies, because: (1) gas is much cleaner than other fossil fuels, especially in the area of power generation; and (2) gas is an appropriate source to balance intermittent renewable sources, such as wind energy. In addition, relatively low lead times and capital costs for CCGT gas-fired plants are expected to be important contributors to demand for gas in power generation, both in OECD and non-OECD countries [IEA 2009]. However, the statement that gas is the transition fuel is currently under discussion. In the IEA’s Green scenario, for example, world gas demand in 2030 is 17 percent lower than in de reference scenario, though demand is still higher in 2030 than in 2007. However, long-term forecast of gas demand in world’s most important regions are prone to great uncertainties due to various reasons. More than ever, one can observe that analysts and institutions are offering diverging views on the future demand for gas [CIEP 2008]. Below some of the general important demand uncertainties are mentioned, largely based on IEA [2009] and CIEP [2008]:
1) in most of the countries the current economic decline has resulted in a reduction in gas demand and may affect region’s demand after 2015 as well. Depending on the length and depth of the crisis, IEA [2009] expected, however that demand will rebound, largely driven by the power generation sector;
2) government policies (including security of supply and environmental policies), surrounding the use of gas in its energy mix, such as the 20/20/20 EU targets246, could affected especially the amount of gas imports (either for political or eco-nomic reasons) [CIEP 2008];
3) the relative (oil and) gas price (volatility) development vis-à-vis its substitutes, such as coal and renewables;
4) Carbon Dioxide (CO2) emission costs and Carbon Capture and Storage (CCS) developments. For instance, with high CO2 emission costs (and high coal prices) power generation plants will focus on gas;
5) different (price) regulatory uncertainties could have an impact on the role of gas and its demand.
According to the IEA’s Reference scenario, the power generation sector is expected to take up much of the demand in this regard as it rises by 1.7 percent per annum between 2007 and 2030; this sector’s share of the world gas market risis from 39 percent in 2007 to 41 percent in 2030 [IEA 2009c]. 8.5.1 The European gas markets
According to the Reference scenario of IEA [2009c], OECD Europe will increase its im-port-dependency to 77 percent by 2020 and 85 percent in 2030 (excluding Norway). The
246 The EU adopted an integrated energy and climate change policy in December 2008, including targets for 2020. These targets include: (1) cutting greenhouse gases by 20 percent (30 percent if international agreement is reached); (2) reducing energy consumption by 20 percent through increased energy efficiency; and (3) meeting 20 percent of EU’s energy needs from renewable sources.
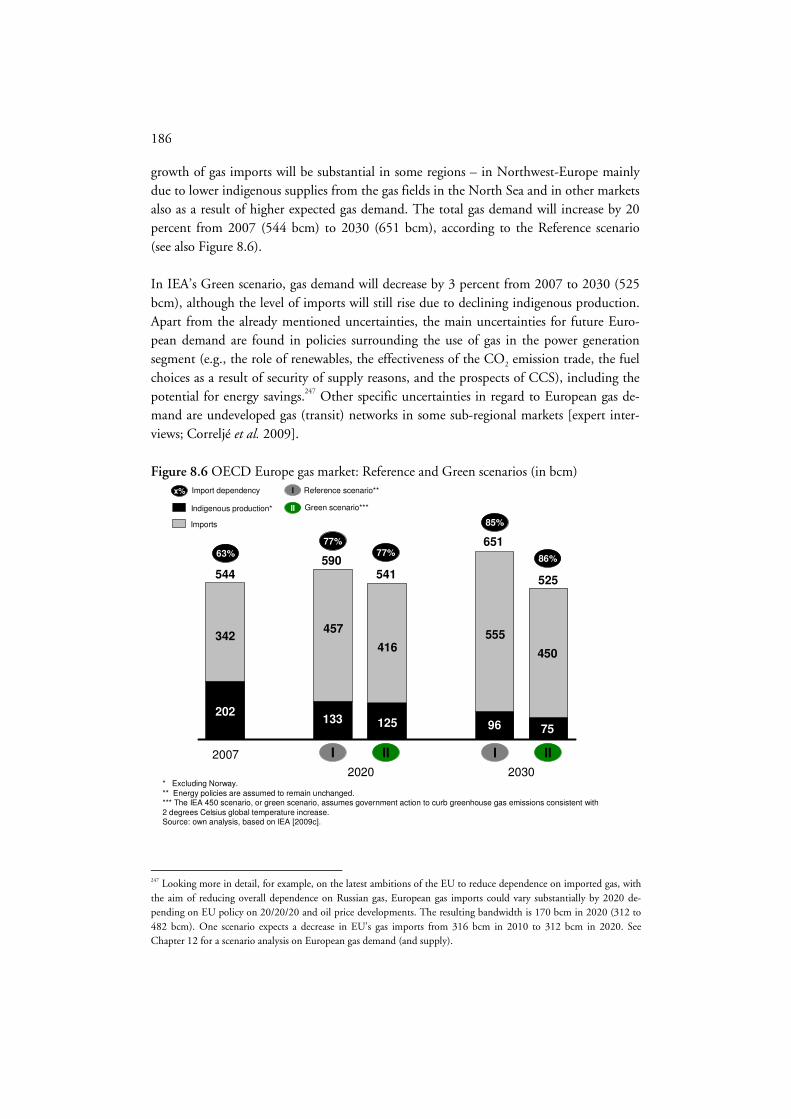
186
growth of gas imports will be substantial in some regions – in Northwest-Europe mainly due to lower indigenous supplies from the gas fields in the North Sea and in other markets also as a result of higher expected gas demand. The total gas demand will increase by 20 percent from 2007 (544 bcm) to 2030 (651 bcm), according to the Reference scenario (see also Figure 8.6). In IEA’s Green scenario, gas demand will decrease by 3 percent from 2007 to 2030 (525 bcm), although the level of imports will still rise due to declining indigenous production. Apart from the already mentioned uncertainties, the main uncertainties for future Euro-pean demand are found in policies surrounding the use of gas in the power generation segment (e.g., the role of renewables, the effectiveness of the CO2 emission trade, the fuel choices as a result of security of supply reasons, and the prospects of CCS), including the potential for energy savings.247 Other specific uncertainties in regard to European gas de-mand are undeveloped gas (transit) networks in some sub-regional markets [expert inter-views; Correljé et al. 2009]. Figure 8.6 OECD Europe gas market: Reference and Green scenarios (in bcm)
2007
* Excluding Norway.** Energy policies are assumed to remain unchanged.*** The IEA 450 scenario, or green scenario, assumes government action to curb greenhouse gas emissions consistent with 2 degrees Celsius global temperature increase. Source: own analysis, based on IEA [2009c].
544590
541
63%
77%77%
x%
Imports
Indigenous production*
Import dependency
125
342
2020
202
457
2030
133
416
I II I II
651
525
85%
86%
75
555
96
450
I
II
Reference scenario**
Green scenario***
247 Looking more in detail, for example, on the latest ambitions of the EU to reduce dependence on imported gas, with the aim of reducing overall dependence on Russian gas, European gas imports could vary substantially by 2020 de-pending on EU policy on 20/20/20 and oil price developments. The resulting bandwidth is 170 bcm in 2020 (312 to 482 bcm). One scenario expects a decrease in EU’s gas imports from 316 bcm in 2010 to 312 bcm in 2020. See Chapter 12 for a scenario analysis on European gas demand (and supply).

187
8.5.2 The US gas market
The US is likely to remain only modestly dependent on LNG imports. The EIA [2010] and IEA [2009c] takes into account the significant contribution of unconventional gas production in that region, affecting US demand for LNG imports, which may stabilise the indigenous supplies. The future unconventional gas production is the main specific uncer-tainty in the US (and global) gas markets, especially under currently low gas prices on the Henry Hub [IEA 2009a]. According to the Reference scenario of the IEA [2009c], the US is projected to consume some 635 bcm by 2020, and 649 bcm in 2030, which results in a small demand reduction between 2007 and 2030 [IEA 2009c]. According to the ‘Green’ scenario, the demand reduction is slightly higher (4 percent between 2007 and 2030). In absolute terms, over the course of the next decades, with pipeline imports from Canada en Mexico combined with some LNG supplies from Latin America, the Middle East and Africa, it will remain a possible important market for exporting countries. Figure 8.7 provides an overview of the import dependency of the US market in IEA’s Reference and Green scenario. Figure 8.7 US gas market: Reference and Green scenarios (in bcm)
2007
** Energy policies are assumed to remain unchanged.*** The IEA 450 scenario, or green scenario, assumes government action to curb greenhouse gas emissions consistent with 2 degrees Celsius global temperature increase. Source: own analysis, based on IEA [2009c].
655635 629
17%8% 12%
x%
Imports
Indigenous production*
Import dependency
551
114
2020
541
50
2030
585
78
I II I II
649626
7%10%
565
43
606
61
I
II
Reference scenario**
Green scenario***
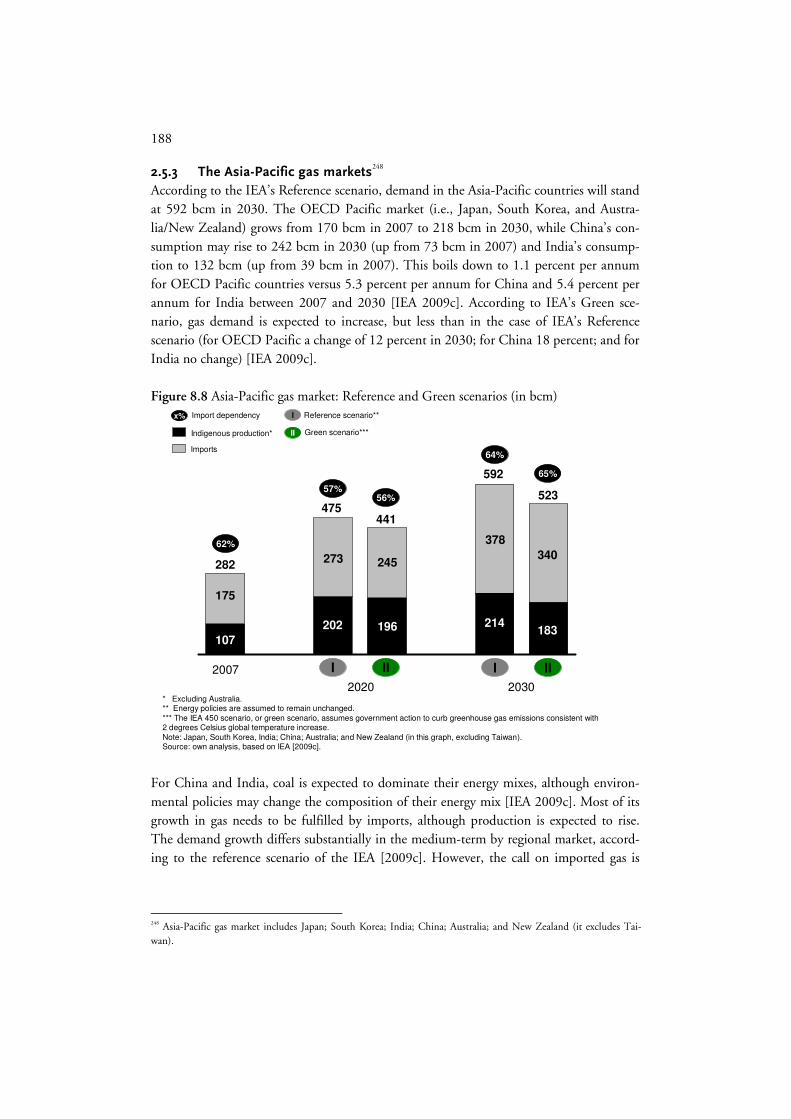
188
2.5.3 The Asia-Pacific gas markets248
According to the IEA’s Reference scenario, demand in the Asia-Pacific countries will stand at 592 bcm in 2030. The OECD Pacific market (i.e., Japan, South Korea, and Austra-lia/New Zealand) grows from 170 bcm in 2007 to 218 bcm in 2030, while China’s con-sumption may rise to 242 bcm in 2030 (up from 73 bcm in 2007) and India’s consump-tion to 132 bcm (up from 39 bcm in 2007). This boils down to 1.1 percent per annum for OECD Pacific countries versus 5.3 percent per annum for China and 5.4 percent per annum for India between 2007 and 2030 [IEA 2009c]. According to IEA’s Green sce-nario, gas demand is expected to increase, but less than in the case of IEA’s Reference scenario (for OECD Pacific a change of 12 percent in 2030; for China 18 percent; and for India no change) [IEA 2009c]. Figure 8.8 Asia-Pacific gas market: Reference and Green scenarios (in bcm)
2007
* Excluding Australia.** Energy policies are assumed to remain unchanged.*** The IEA 450 scenario, or green scenario, assumes government action to curb greenhouse gas emissions consistent with 2 degrees Celsius global temperature increase. Note: Japan, South Korea, India; China; Australia; and New Zealand (in this graph, excluding Taiwan). Source: own analysis, based on IEA [2009c].
282
475441
62%
57%56%
x%
Imports
Indigenous production*
Import dependency
196
175
2020
107
273
2030
202
245
I II I II
592
523
64%
65%
183
378
214
340
I
II
Reference scenario**
Green scenario***
For China and India, coal is expected to dominate their energy mixes, although environ-mental policies may change the composition of their energy mix [IEA 2009c]. Most of its growth in gas needs to be fulfilled by imports, although production is expected to rise. The demand growth differs substantially in the medium-term by regional market, accord-ing to the reference scenario of the IEA [2009c]. However, the call on imported gas is
248 Asia-Pacific gas market includes Japan; South Korea; India; China; Australia; and New Zealand (it excludes Tai-wan).

189
expected to increase in all above-mentioned regions. In Figure 8.8 the demand growth and the import-dependency is presented. Specifically, China’s regulatory landscape, combined with increasing domestic production (the Chinese government plans to double its domestic production to 160 bcm by 2015), uncertainties about price reforms, and other market uncertainties, may hinder an addi-tional call on imported gas [IEA 2008c; IEA 2009]. 8.6 Conclusion
In the last two decades, as mentioned in Part II, the world has moved to a more multi-polar international system. In such multi-polar space, Russia’s position in the energy land-scape will be affected by the other geo-strategic players, namely the US and China, and to a lesser extent India, Japan, the EU and its member-states. In the Eurasian continent, the geopolitical competition for routes from the Caspian region, combined with US goals to undermine Russia’s strategy, led to a drive on the part of mostly trans-Atlantic European countries to limit and/or contain their own (and European) dependencies on Russian gas. In addition, the complexity of the EU, both in terms of political functioning, energy poli-cies and level of gas penetration, influence Russia’s position. Conversely, continental European countries encourage further institutionalisation of Gazprom’s investments, driven by a perceived need of attaining greater upstream access to Russia’s gas sector in an effort to secure gas supplies. The three main importing regions are Europe, the US and Asia. In 2008, Europe relies mainly on pipeline gas, importing roughly 65 percent of its needs via pipeline, mostly from Norway, Algeria and Russia. LNG, mainly from Algeria and Nigeria, is becoming more important. In 2008, the US has to import 17 percent of its gas supply, although for a long time the US market was self-sufficient. Most came from Canada via pipeline, added by some pipeline gas from Mexico and LNG. As a result of the ongoing economic down-turn and the success of unconventional gas production, it is uncertain if the US needs large additional LNG imports. A few large producing countries in Southeast Asia are self-sufficient in their gas supplies. The emerging countries, China and India, were self-sufficient until the turn of the century, but are now importers of LNG and China started to import pipeline gas from Turkmenistan. Together with other Asian LNG-importing countries, like Japan and Korea, they are not well interconnected with gas pipelines from outside the region (although the potential exists). The share of LNG in the total gas con-sumption in Asian LNG-importing countries is around 60 percent. Gas trade in Asia and Europe is largely based on long-term take-or-pay contracts, with indexation to oil (and coal) products, with some spot sales based on gas-to-gas competition. The US market is characterised by hub-based, short-term trade. The expected rise in demand and import-dependencies in world’s main regional markets will precipitate the need for comparatively greater interregional gas flows in the medium-

190
term and beyond (2015-2030). However, long-term forecast of gas demand in world’s most important regions are prone to great uncertainties due to various reasons. These uncertainties are related to the current economic decline, government policies surrounding the use of gas in its energy mix, the relative (oil and) gas price (volatility) development vis-à-vis its substitutes, CO2 emission costs and CCS developments, and the development around different (price) regulatory regimes. Due to declining indigenous supplies in Europe, it is expected that European imports will grow. However, there are scenarios that suppose a decrease in gas imports. In the coming decades, though uncertain, largely due to the development of unconventional gas, some additional LNG import may be required in the US. It is expected that gas imports will grow in Asia. However, in absolute terms the consumption is expected to remain relative low, when comparing to the US and European markets.

191
Chapter 9 Gas export strategies of Russia’s main competitors,
cooperation and market power
9.1 Introduction
Based on the demand developments mentioned in Chapter 8, the structure of the interna-tional gas industry in terms of both pipeline and LNG flows will change during the course of the period between 2010 and 2020. Given the fact that there is huge mismatch between the location of reserves and the most important markets, the new gas flows will have to materialise through either long-distance pipeline gas or LNG. However, in addition to the above-mentioned demand and import uncertainties, there are supply specific uncertain-ties, which will also influence decision-making in brown and greenfield investments. These barriers to investment include possible financing problems, rising costs, Not In My Back Yard (NIMBY) issues, regulatory uncertainties, and geopolitical and transit risks [IEA 2009]. As will described in Chapter 10, Russia is shifting from a captive, regional European set-ting to a more global one as it enters the world of LNG with its own projects and plans to diversify its pipeline gas exports. However, Europe is expected to remain its main export market. Its positioning vis-à-vis the Caspian Sea countries, the strategies of other main gas-exporting countries and their own respective export strategies will determine to a large extent how Russia will fulfil this interregional role. Therefore, before analysing Russia’s current and future gas export strategies, it is important to provide a short overview of the strategies of and interaction with the main competitors of Gazprom’s markets. Section 9.2 is a short overview of strategies of gas-exporting countries and countries (ex-cept from Russia’s and Caspian one). Section 9.3 is an exposé of the gas export strategies of the former-Soviet countries in the Caspian region, when applicable. In Section 9.4, attention is paid to the market power of gas-exporting countries in the European and Atlantic market. Section 9.5 addresses the developments in the field of cooperation amongst gas-exporting countries. Finally Section 9.6 concludes. 9.2 Strategies of the main non-former Soviet gas-exporting countries
249
The various gas-exporting countries differ fundamentally in terms of the organisation of their gas sectors, domestic gas requirements, institutionalisation, destination of exports, and sales strategies (i.e., level of vertical integration and long- versus short-term sales, in which some explores new business models, see Chapter 2). The bottom line for these
249 See Chapter 6 and 7 in Boon von Ochssée [2010] for an in-depth analysis on the different strategies of the main gas-exporting countries.
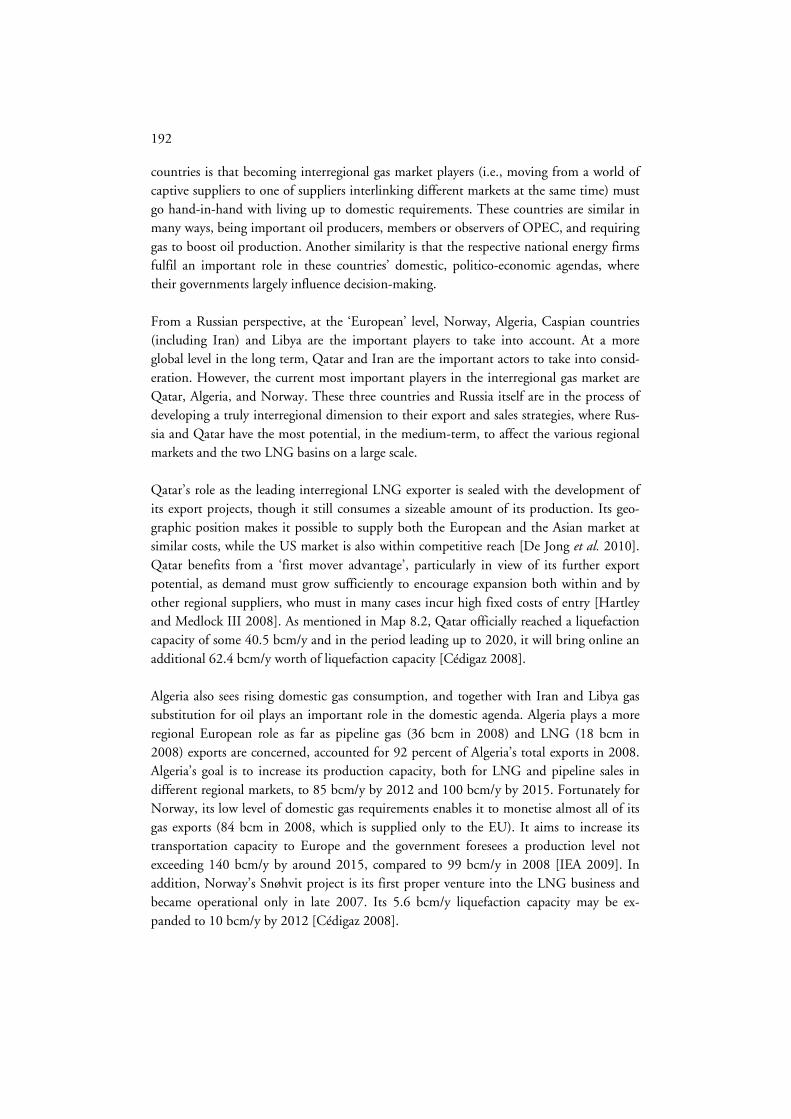
192
countries is that becoming interregional gas market players (i.e., moving from a world of captive suppliers to one of suppliers interlinking different markets at the same time) must go hand-in-hand with living up to domestic requirements. These countries are similar in many ways, being important oil producers, members or observers of OPEC, and requiring gas to boost oil production. Another similarity is that the respective national energy firms fulfil an important role in these countries’ domestic, politico-economic agendas, where their governments largely influence decision-making. From a Russian perspective, at the ‘European’ level, Norway, Algeria, Caspian countries (including Iran) and Libya are the important players to take into account. At a more global level in the long term, Qatar and Iran are the important actors to take into consid-eration. However, the current most important players in the interregional gas market are Qatar, Algeria, and Norway. These three countries and Russia itself are in the process of developing a truly interregional dimension to their export and sales strategies, where Rus-sia and Qatar have the most potential, in the medium-term, to affect the various regional markets and the two LNG basins on a large scale. Qatar’s role as the leading interregional LNG exporter is sealed with the development of its export projects, though it still consumes a sizeable amount of its production. Its geo-graphic position makes it possible to supply both the European and the Asian market at similar costs, while the US market is also within competitive reach [De Jong et al. 2010]. Qatar benefits from a ‘first mover advantage’, particularly in view of its further export potential, as demand must grow sufficiently to encourage expansion both within and by other regional suppliers, who must in many cases incur high fixed costs of entry [Hartley and Medlock III 2008]. As mentioned in Map 8.2, Qatar officially reached a liquefaction capacity of some 40.5 bcm/y and in the period leading up to 2020, it will bring online an additional 62.4 bcm/y worth of liquefaction capacity [Cédigaz 2008]. Algeria also sees rising domestic gas consumption, and together with Iran and Libya gas substitution for oil plays an important role in the domestic agenda. Algeria plays a more regional European role as far as pipeline gas (36 bcm in 2008) and LNG (18 bcm in 2008) exports are concerned, accounted for 92 percent of Algeria’s total exports in 2008. Algeria’s goal is to increase its production capacity, both for LNG and pipeline sales in different regional markets, to 85 bcm/y by 2012 and 100 bcm/y by 2015. Fortunately for Norway, its low level of domestic gas requirements enables it to monetise almost all of its gas exports (84 bcm in 2008, which is supplied only to the EU). It aims to increase its transportation capacity to Europe and the government foresees a production level not exceeding 140 bcm/y by around 2015, compared to 99 bcm/y in 2008 [IEA 2009]. In addition, Norway’s Snøhvit project is its first proper venture into the LNG business and became operational only in late 2007. Its 5.6 bcm/y liquefaction capacity may be ex-panded to 10 bcm/y by 2012 [Cédigaz 2008].

193
Though Iran has enormous interregional potential in the long run, the country faces seri-ous (political) constraints when it comes to harnessing its export potential. Domestic gas needs and international sanctions will continue to bedevil Iran for the foreseeable future, hampering its ability to come to the fore, expected until at least in 2015 [IEA 2009]. Ne-vertheless, the National Iranian Gas Company (NIGC) is estimated that by the end of 2010-2015, gas export could reach 248 bcm/y, both as LNG and through pipelines [Pe-troleum Economist 2007]. Before supplying the world market with LNG and Europe by pipeline, it is expected that Iran will first supply its regional neighbours, essentially for politico-strategic reasons [IEA 2008c]. Libya plays and will continue to play an important role mainly in the southern European market (11 bcm in 2008) via LNG and by the Greenstream pipeline to Italy. Nigeria is an important LNG supplier to the Atlantic Basin (15 bcm/y in 2008) [IEA 2008]. It aims to increase its liquefaction capacity and speculatively becoming a pipeline supplier to Europe via Algeria as well. Some of these countries too, however, face rising domestic require-ments. Iraq also has a potential to export gas, especially from associated gas fields. How-ever it is constrained by political and security-related uncertainty as well as domestic needs. No less important in the medium-term are gas-exporting countries such as Egypt, Austra-lia, the UAE, Oman and Yemen. In particularly, all new projects in Australia would bring Australia’s liquefaction capacity to 41 bcm/y by 2015 [Cédigaz 2008]. More traditional but waning LNG suppliers include Indonesia, Brunei, Malaysia and Trinidad and To-bago, which will continue to play a notable role in LNG supplies to both the Atlantic and Pacific LNG basins (see also Map 8.2). As mentioned in Chapter 8, domestic producers and intra-regional exporters are also an important category to take into account. For the North American market, Canada and Mexico will remain pipeline suppliers to the US, whereas the Netherlands, the UK and other small EU producers will have (some) market power in Europe. However, due to declining production their role is correspondingly marginalised. The strong presence of international energy firms especially in Qatar, Nigeria, Egypt and Australia has a fundamental impact on this group’s positioning vis-à-vis Russia, Algeria and Iran. Much of the output from these countries is purchased and distributed to various regional markets by international energy firms and mid-streamers operating with new business models designed to optimise short-term profits wherever possible. On the basis of the new business models (see also Chapter 2), the international energy firms potentially play a strong role in the arbitrage and optimisation of short-term LNG flows. Especially given their degree of vertical integration and their appetite for purely (short-term) com-mercial gains. While a core group of national energy firms sees only a small share of its output sold by foreign international energy firms, they stand in contrast to those players

194
where international energy firms have greater access to output, which correspondingly poses more of a risk to short-term supply-side shifts. 9.3 Gas strategies of former Soviet republics in the Caspian region
250
As mentioned in Part II, the break-up of the Soviet Union in the early 1990s has changed the institutional make-up of economic and political relations between the former Soviet-states. Given the geographical circumstances and Russia’s natural monopsony through the lack of alternative export infrastructures from the region251, the three Central Asian gas exporters have had, up to recently, little choice but to sell their gas to Russia. During the 1990s, the Caspian Sea countries formulated their own strategies, which were not necessarily in line with Russian interests, pursuing alternative export routes for gas to Asia and Europe to lessen their dependence on Russia. However, the success of a so-called multi-vector approach was ultimately rather limited. Internal, structural socio-economic problems, such as an ill-functioning legal system, led to investment delays. In the con-struction of alternative export pipeline projects, the Caspian Sea countries experienced strategic competition between governments and national and international energy firms. Combined with low oil and gas prices, intense competition for new possible off-take areas, issues of the legal status of the Caspian Sea252 and transit risks, which placed pressure on profitability, only a limited number of projects was realised. During the 1990s the Cas-pian Sea region became dependent to a large extent on the transport of their exports through Russia. During the second half of the 1990s, with the rise of Russia’s domestic gas demand (see Part II), Russia began to show more interest for Central Asian gas as volumes from the region correspondingly gained in (geo-)strategic significance.253
250 Although Russia and Iran are Caspian Sea littoral states, in this sub-section the ‘Caspian region’ is used to cover Kazakhstan, Uzbekistan, Turkmenistan, and Azerbaijan. Central Asia is defined here as the region consisting of Ka-zakhstan, Uzbekistan, Turkmenistan, Kyrgyzstan and Tajikistan. (For the purpose of this research, gas issues regarding Kyrgyzstan and Tajikistan will not be addressed. These countries are very minor gas producers and consumers, smaller than 1 bcm/y. Since the 1990s, Uzbekistan was the main exporter to these countries. From 2003 onwards, contracts have been signed with Gazprom. Moreover, Kyrgyzstan and Tajikistan play a very minor role in gas transit, only possibly for Caspian exports to China [Stern 2005; Pirani et al. 2009].) The three main exporters east from the Cas-pian Sea are all landlocked producers, encapsulated in the north by Russia, in the west by the Caspian Sea and the Caucasus, Iran and Afghanistan to the south and their Tajik and Kyrgyz neighbours to the east, and beyond these lie the emerging gas-importing economies, China and India. The Caucasus region includes parts of southern Russia, Azerbaijan, Georgia, Armenia, Turkey and northwestern Iran.
251 The physical inter-linkage between Russia’s current UGTS and the Central Asian states dates back to the days of the Soviet Union.
252 For an overview of the problematic development of a new legal status of the Caspian Sea, see for example [Zhiznin 2007].
253 Gazprom itself underscores this aspect explicitly: “As the groundwork for sustainable gas supply in the future, Gazprom is looking to tap into new fields in Yamal and the offshore fields in the Barents Seas. All these areas have exceptionally challenging climactic and geological conditions. Gas will cost much more to extract there compared to other regions. Meanwhile, Gazprom is keen to use the huge gas resources of Central Asia to optimize its gas supply for export.” [Gazprom 2008, p. 61.]

195
Figure 9.1 Natural gas balances of Caspian countries in 2007
Turkmenistan
100% = 72.3 bcm in 2007
Uzbekistan
100% = 65.3 bcm in 2007
25%
Export
Domestic consumption
Russia
Export
77%Russia
Other CIS
Iran
2007
2007
Kazakhstan*
100% = 12.9 bcm in 2007
Azerbaijan
100% = 11.0 bcm in 2007
Net-export
Domestic consumption
Turkey (71%)Russia (100%)Georgia (18%)
2007 2007
Iran (12%)
14.7 bcm
54.3 bcm
75% 13%
2.3 bcm
* Figures of Kazakhstan are estimates and are from KazMuniaGaz. Other sources (Gazprom and Kazakhstan Statistical Agency) estimate higher volumes. Totals may not add up due to rounding. Source: IEA [2008c]; IEA [2008].
1.7 bcm
Domestic consumption
18% 85% 15%
89%
11%
29%
71%
82%
Domestic consumption
Export
Collectively as a region, Central Asia and Azerbaijan hold almost 7 percent of total world’s gas reserves (12.54 tcm) [BP 2009]. The combined flows from the three Central Asian producers feed into the Russian UGTS and are re-exported mostly to CIS markets such as the Ukraine, totalling 77 bcm in 2007 [IEA 2008a].254 The ‘natural’ monopsony hereby afforded to Russia is a major advantage today for Moscow in its dealings with the sover-eign Central Asian suppliers, providing it with some bargaining power over them. Con-versely, they persistently seek alternative export options. This game involves Russia, China as well as a number of other regional and extra-regional players (Iran, Afghanistan, Paki-stan and India) and external powers, such as Europe and the US, see also Section 8.2 [Amineh 2003]. Currently, Turkmenistan is the biggest reserve holder, producer and exporter of gas in the Caspian region. Other countries produce a relatively small amount of gas (Azerbaijan and Kazakhstan) or consume their gas largely domestically (Uzbekistan). The bulk of Caspian exports goes to Russia. Turkmenistan is exporting some of its gas to Iran, whereas Azerbai-
254 In addition, an international legal framework for energy cooperation between Russia and Azerbaijan, Kazakhstan, Turkmenistan and Uzbekistan is being developed, in which the Eurasian Gas Alliance could be an important platform for the gas sector (besides Russia’s bilateral agreements with these countries) [Zhiznin 2007].

196
jan is supplying gas directly to the Turkish market (combined with minor exports to Iran and Georgia), see also Figure 9.1 [IEA 2008c]. 9.3.1 Azerbaijan
255
Azeri total gas reserves are estimated at 1.2 tcm [BP 2009]. Azerbaijan has one of the long-est traditions as a gas and oil producer [Bowden 2009]. In a relatively short amount of time, after the 1999 discovery of the offshore Shah Deniz gas field (450 bcm)256 in the Azeri shelf of the Caspian Sea, Azerbaijan changed its position from a net-importer to a net-exporter in 2007 [CIEP 2008]. As mentioned in Part II, during the 1990s the Bakhar gas fields were responsible for 40 percent of the Azeri total production. Other vital fields are Nikhichevan, Gunashli, Iman and Asheron. Most of these fields, except for Shah Deniz and the Azeri-Chirag-Gunashli (ACG) associated gas fields257, are operated by the State Oil Company of Azerbaijan Republic (SOCAR), which has close ties with the Azeri government [Amineh 2003; Bowden 2009]. In 2008, Total signed a MoU with Azerbai-jan, which covers the offshore Apsheron block [Bowden 2009]. In 2008, Azerbaijan produced a total of 16.3 bcm (10.8 bcm in 2007), including associ-ated gas production from the Azeri-Chirag-Guneshli oil field (2.4 bcm in 2007) and Shah Deniz (3.1 bcm in 2007) [IEA 2008c; Bowden 2009], while it consumes 11 bcm [IEA 2008b; 2009b]. In 2008, Azerbaijan had an energy mix of which 68 percent was satisfied by gas, 27 percent by oil and 4 percent by hydro-electricity [BP 2009]. Some of the gas production from phase I of the Shah Deniz field (8.6 bcm/y) is sold within Azerbaijan (1.5 bcm/y), the remainder is already fully contracted to Georgia (0.8 bcm/y) and Turkey (up to a maximum of 6.3 bcm/y), with small volumes re-exported from Turkey to Greece (up to a maximum of 0.75 bcm/y). Azerbaijan exports its gas through the SCP, which could eventually be extended to 20 bcm/y [IEA 2008c; Bowden 2009]. Gas is sold on a joint basis via a gas aggregator (the Azerbaijan Gas Supply Company) [Bowden 2009]. Azerbaijan has the potential to expand its gas production via the development of Shah Deniz Phase II and additional production from SOCAR’s fields. From 2012 onwards, phase II could bring around or above 12-15 bcm/y of additional gas to the market, of which 9-12 bcm/y could be available for export [IEA 2008c]. Europe (including Turkey), Iran, Russia and potentially Georgia have to compete with one another and the domestic market for these supplies (expected to increase to 13-15 bcm in 2015) [Bowden 2009]. Iran may possibly increase its Azeri imports substantially to 12 bcm in 2012, whereas
255 For a recent in-depth analysis on Azeri (future) gas sector, see for example Bowden [2009].
256 StatoilHydro (25.5 percent), SOCAR (10 percent), Total S.A. (10 percent), LukAgip, a joint company of ENI and LUKoil (10 percent), Oil Industries Engineering & Construction (10 percent), and Turkish Petroleum Overseas Company Limited (9 percent) are shareholders in the Shah Deniz consortium. Currently, BP is the operator.
257 The AIOC, an international consortium, operates these fields through a 30-year PSA signed in 1994 [Bowden 2009].

197
Russia offered to buy Shah Deniz phase II gas at ‘European-level’ prices.258 The Azeri gas to Russia could be shipped via a Soviet-era pipeline (design capacity is 13 bcm/y, although real operating capacity is plausible lower), which had to be reversed [IEA 2008c]. The Russian desire for Azeri gas makes sense from a strategic perspective, because it could moderate Azeri competition towards Turkey and other Southern and Southeastern Europe (SSEE) markets. In addition, Gazprom could use Azeri gas on a commercial basis for re-laying it to the Blue or South Stream pipelines (see Case study 2 in Chapter 11). Although Azerbaijan had a westward looking policy and there are Western companies involved in Azeri upstream developments, Russian and Iranian proposals provide additional leverage with regard to European transit and off-take countries and companies. 9.3.2 Turkmenistan
259
Until late 2006, the ‘neo-Stalinist’, flamboyant dictator Saparmurat Niyazov practically decided on all matters political and economic in Turkmenistan. Since his death in 2006, Berdymukhamedov has replaced him as the country’s leader and officially controls the process of decision-making over the gas and oil sector [Zhukov 2009]. Turkmenistan is still seen by Russia as part of its exclusive sphere of influence [Olcott 2006]. Speculations on the part of some observers that the country’s reserve base may be larger than officially held, one which has lingered ever since the fall of the Soviet Union, was vindicated with the recent discovery of new gas fields. Official sources in Turkmenistan put the country’s reserve base at 22.4 tcm [Zhukov 2009], far more than the recently updated 7.94 tcm reported in BP [2009], up from 2.43 tcm in 2007. The most sizeable and truly large de-posit discovered in 2008 includes the South-Yolotan-Osman gas field, estimated to con-tain between 4 tcm and 14 tcm.260 Turkmenistan is the region’s largest gas producer, producing 70.8 bcm in 2008, 2.2 per-cent of the world’s total, and thus also the most important Central Asian gas supplier to prospective importing countries [IEA 2009b]. The Dauletabad and the Yashlar fields are Turkmenistan’s major gas-producing areas, with the former forming the backbone of Turkmenistan’s gas production. Alongside the above-ground risks affecting gas production in Turkmenistan, there are likely to be significant challenges with the next generation of
258 In June 2009, Gazprom already signed an agreement with SOCAR for the annual purchase of 500 mcm from SOCAR's own gas fields [Eurasia Insight 2009]. In September 2009, Azerbaijan agreed to export gas to Iran 5 bcm/y. The gas is destined for consumption in Northern Iran.
259 For a recent in-depth analysis on Turkmen (future) gas sector, see for example Zhukov [2009].
260 The South Yolotan and Osman fields were discovered in 2006 and early 2007, respectively, and are located close to the Yashlar field, estimated to hold 0.7 tcm. The best estimate for the South-Yolotan-Osman field is 6 tcm, which is now considered to be a single structure, which would make it one of the biggest fields in the world, the fifth or fourth largest (c.f., North Field and South Pars) [Platts International Gas Report 2009]. Other discoveries include for exam-ple a large gas condensate field at the South Gutlyyak field [Platts International Gas Report 2008c]. Another recent find includes a field near Gurrukbil-Garabil, near the Dauletabad field [IEA 2009]. Its oil reserves (0.6 billion bbls) and production (205,000 bbls/d) are rather small when one compares it with Kazakhstan, the leading oil producer of the region (see below) [BP 2009].

198
gas production from these new fields.261 Two 100 percent government-owned companies, Turkmenneft and Turkmengaz, are responsible for the Turkmen oil and gas sector. The Turkmen gas sector is partly closed to foreign investors. In principal, onshore projects are exclusively allocated to the state companies. Two small projects are subjected to foreign partners from the US, Turkey and the UK, some of the partners operate through service contracts [Zhukov 2009]. An exception was made for Chinese CNPC, which has obtained drilling exploration wells at the South-Yolotan field since 2007 and already has a PSA in the Amu Darya basin [Platts International Gas Report 2008b].262 Turkmenistan is also looking for possibilities in terms of exports and swaps with Iran.263 Other foreign interests in onshore development are limited to service contracts, although offshore fields are cur-rently more open for foreign investors (e.g., Petronas, Dragon Oil, Wintershall, Maersk Oil and ONGS Mittal Energy. Some other projects are under negotiation).264 In 2008, Turkmenistan had an energy mix of which 76 percent was satisfied by gas and 24 percent by oil [BP 2009]. Turkmenistan’s total as well as per capita consumption is high, 15 bcm in 2007, because gas is supplied free of charge or largely subsidised. Its current exports are also significant (54.3 bcm in 2007). The Turkmen government had the inten-tion to raise production to 100 bcm in 2010, 160 bcm in 2015, 190 bcm in 2020, and 250 bcm in 2030, and indeed Turkmenistan has much potential [IEA 2008c].265 How-ever, the IEA [2008] estimates that Turkmenistan’s production cannot exceed 100 bcm/y in the mid-term. Zhukov [2009] projects a minimum production of 105 bcm in 2015 from the onshore fields and a maximum of 126.9 bcm. The projection of the offshore production on the Caspian shelf could increase from 3.5 bcm in 2008 to 14 bcm in 2015 [Zhukov 2009]. With an expected domestic consumption from 18 bcm in 2007 to 20-30 bcm/y in the mid-term [IEA 2008d], largely due to the development of gas-based industry in Turkmenistan, a significant amount of gas will remain available for exports.266
261 These challenges will likely come in the form of greater long-run extraction costs, mostly because of the depth of new reserves, high pressure and high temperature as well as the fact that the gas is mostly sour [IEA 2009].
262 However, the Turkmen government has announced that it will retain its (quasi-)monopoly over onshore deposits [Zhukov 2009].
263 Potentially, Gazprom, Turkmengaz and NIOC may find an arrangement in which Gazprom supplies northern Iran with small gas volumes from Turkmenistan under a swap agreement [WGI 2009a].
264 See also Table 9.6 in Zhukov [2009, p. 283] for an overview of the involvement of foreign companies in the Turk-men gas and oil fields. Currently, RWE is negotiating on development rights for an offshore block and underscores Turkmenistan’s growing and apparent readiness to export gas to Europe. If hydrocarbon reserves are found in the area, RWE might gain a license for production during 25 years [WGI 2009b].
265 The South Yolotan-Osman field alone could begin phased production at 10 bcm and move gradually to 70 bcm [Platts International Gas Report 2009].
266 Because of the use of other methodology, Zhukov [2009] estimates are much lower, namely 14-16.9 bcm in 2015. In order to meet its export commitments, gas production will need to increase to 119-141 bcm by 2015 [Zhukov 2009].

199
As a result of the importance of Central Asian gas in Gazprom’s supply balance, Russia secures additional volumes by means of new contractual agreements. Thus, in April 2003, Putin and Niyazov signed a 25-year agreement on the long-term cooperation in the gas industry between Gazprom and Turkmengaz, which was accompanied by a long-term gas supply contract between both parties (70-80 bcm from 2009 onwards until 2028) [Zhu-kov 2009; Gazprom 2008; WGI 2007]. In the face of Turkmen requests for price in-creases and in an effort to maintain its position in the region, Gazprom gradually increased the price paid for Turkmen gas. From $60/mcm in 2006 (which was still a 50-50 bar-ter/cash deal) [IEA 2008d], the price for Turkmen gas rose from $130/mcm to $150/mcm in 2008 and from $250/mcm to $270/mcm in 2009 [Kommersant 2008], moving in principle to ‘European’ market-based netback prices [IEA 2009].267 Russia has also offered to aid in improving the Soviet-era infrastructure that carriers Cen-tral Asian gas to Russia in a bid to tie in Turkmenistan and facilitate further flows.268 The system runs from Turkmenistan and Uzbekistan via Kazakhstan to Alexandrov Gai in Russia, to be boosted in capacity to 90 bcm/y by 2009-2010 (current capacity is estimated at 45-55 bcm/y). In order to boost the transport of additional gas production from West Turkmen gas fields (and Kazakh fields) to Russia, the associated countries signed an agreement to revamp a littoral Caspian Sea pipeline from 10 bcm/y to 30 bcm/y by 2012 in mid- and late 2007.269 In April 2009, Russia decided to stop buying Turkmen gas, fol-lowing an explosion in the Central Asia Center pipeline [WGI 2009]. Russia and Turk-menistan are still renegotiating lower volume and price terms in their contracts. For now, there is no official clarity what progress will be made further in this matter. From 1997 onwards until 2024, Iran has been importing gas at a minimum of 4 bcm and a maximum of 8 bcm/y via the Korpezhe-Kurt pipeline from Turkmenistan to Iran [Vic-tor et al 2006; Zhukov 2009]. Although historically speaking there have been price dis-putes between Turkmenistan and Iran, in January 2010 both countries inaugurated a new pipeline that has the potential to double flows to Iran to 20 bcm/y [WGI 2010d]. Exports to China through a new pipeline from gas fields in southeast Turkmenistan has started in December 2009, which should reach to full load factor (at least 30 bcm/y) by 2012.270 In
267 Gazprom’s earlier agreement with Turkmensistan included prices at the Kazakh border linked to the amount paid by Gazprom’s long-term European customers [WGI 2007].
268 Gazprom plans to modernise and upgrade its Soviet-era CAC pipeline system. The CAC pipeline system consists of four main pipelines (e.g., SATS 1, 2, 4, and 5), and was build in phases during the 1960s, 1970s and 1980s.
269 The objective is to revamp the existing Soviet SATS 3 branch of the CAC, a littoral section known as the “Pri-caspiskiye” pipeline, bringing the pipeline’s capacity to 20 bcm/y from 10 bcm/y, by 2012. This pipeline is linked to the CAC pipeline system in Kazakhstan, with volumes supplied consisting of 10 bcm/y from Turkmenistan and Kazakhstan, respectively. In 2008, Gazprom announced that this pipeline could be expanded to 30 bcm/y. Turkmen-gaz, Kazmuniagaz and Gazprom will upgrade the pipeline [IEA 2008c]. By mid-2008, Turkmenistan suggested that the line could be expanded even further to 40 bcm/y [WGI 2009c].
270 In August 2008, Turkmenistan agreed with China in principle to increase its sales volume to 40 bcm/y [IEA 2009].

200
China the pipeline will be connected with the West-East pipeline, which stretches from Xinjiang province. China’s regulatory landscape, combined with increasing domestic pro-duction and market uncertainties, may hinder an additional call on import gas [IEA 2008c]. After the fall of the Taliban regime the Turkmenistan-Afghanistan-Pakistan-India (TAPI) pipeline is back under discussion, but its realisation is still very uncertain and is discussed more in a geopolitical rather than a practical framework (the pipeline has a planned capacity of 30 bcm/y) [IEA 2008c; Zhukov 2009].271 In early 2008, the Turkmen president promised to commit 10 bcm/y worth of gas to Europe by 2009, though no commercial arrangements or agreements were made [WGI 2008]. Moreover, how this gas will be transported to Europe remains uncertain. The TCGP (see Case study 1 in Chapter 11) is still merely a speculative project, which is sub-ject to uncertainty over permits in offshore transport through the Caspian Sea and possi-ble political transit risks in Georgia [CIEP 2008; Zhukov 2009]. Europe and the US are also investigating different measures to import Turkmen gas (see Case study 1 and 2 in Chapter 11).272 When adding up the volumes from Turkmen export agreements under discussion, the agreed annual volume promised, is boosted to 118 bcm/y in total (exclud-ing the speculative TAPI pipeline and exports to Europe). In the most favourable scenario (which is uncertain), some 10-20 bcm/y could be available by 2015 for additional export commitments and, perhaps, even more export possibilities in the long run. 9.3.3 Kazakhstan
273
Kazakhstan, like Turkmenistan, is ruled by an ex-Soviet regime headed by Nazerbayev, although the regime is much less totalitarian. The regime was relatively open to foreign investment and international energy firms in its oil and gas sector. However, this has changed in recent years. In 2002, Kazmunaigaz became the Kazakh national gas company and in 2004 new legislation was introduced that gave Kazmunaigaz a minimum stake of 50 percent in new PSAs [Yenikeyeff 2009]. Kazakhstan’s ties with Russia are relatively close, but Kazakhstan is also opting for cooperation with foreign players.274
271 The pipeline would run from the Dauletabad gas fields in southeast Turkmenistan, either via a southern route through Heart and Kandahar in Afghanistan and Pakistan to India, or via a northern route. However, on this issue, Russia’s Gazprom maintains that the gas being proposed to be transmitted through TAPI pipeline is in fact owned by Gazprom through its agreements with Turkmenistan [Jalalzai 2003].
272 Currently, the EU, through its INOGATE programme, and the US Trade and Development Agency had and is financing (pre-)feasibility studies in exploring (non-)pipeline options via the Caspian Sea [IEA 2008c]. In addition, the EU floated the idea of consolidated a gas purchasing mechanism for gas east from the Caspian Sea (i.e., the Caspian Development Corporation, CDC) [IEA 2009]. Therefore, in line with the TAPI, the TCGP project is still more discussed in a geopolitical framework [Zhukov 2009].
273 For a recent in-depth analysis on Kazakh (future) gas sector, see for example Yenikeyeff [2009].
274 From 1997, Belgium’s Tractebel was responsible for Kazakh trunk pipelines via Intergaz Central Asia. But in 2000 Kaztrangaz took over the gas infrastructure [Yenikeveff 2009].

201
As far as oil reserves and production are concerned in 2008, Kazakhstan had reserves of 39 billion bbls and produced 1.5 mb/d, which was 1.8 percent of the world’s total. Kazakh-stan is therefore clearly an important oil producer and exporter, the largest in the Caspian region. Conversely, the country has 1.82 tcm worth of gas reserves (1 percent of the world’s total) [BP 2009]. Kazakstan is also a considerable producer: 25.9 bcm in 2008, according to IEA [2009b], although its upstream gas sector is relatively underdeveloped [CIEP 2008]. Most of the gas deposits are located in the west of the country, notably in associated gas fields such as Tengiz275 and Karachaganak276. Kashagan is another important associated gas field being developed by foreign partners (with the associated gas being under high pressure).277 Other significant fields include, for example, Zhanazhol and Uri-tau. Much of the gas produced in Kazakhstan is either re-injected for oil lifting or is flared, but some of it is also exported to Russia for further processing. Russia and Kazakhstan established the Kazrosgaz joint venture (50 percent is owned by Gazprom and 50 percent by Kazmunaigas) in 2002.278 In 2008, Kazakhstan had an energy mix (64.7 Mtoe) in which coal enjoyed the largest share at 52 percent, followed by natural gas at 29 percent oil at 17 percent and hydro-power at 3 percent [BP 2009]. Coal thus plays an important role in Kazakhstan’s domestic consumption, enabling it to export a large portion of its oil and some natural gas produc-tion. In 2007, it exported 5.5 bcm to Russia [IEA 2008c].279 Annual gas production in Kazakhstan could increase to 40 bcm by 2015 and 50 bcm by 2030 [IEA 2008c].280 Esti-mates are that the gas volumes for commercial use could reach between 30-40 bcm by 2020, against rising domestic demand of 18-20 bcm [IEA 2008c]. As a result, 10-22 bcm/y could be available for export by 2020, whereas Yenikeyeff [2009] estimates the
275 Tengiz is developed under a PSA (Tengizchevroil) with Chevron, ExxonMobil, Kazmunaigaz and the Russian-owned LukArco [Yenikeyeff 2009].
276 The deposit is being developed by Karachaganak Petroleum (KPO), an international consortium that includes British Gas, Chevron, ENI and Lukoil. The Karachaganak field is actually a condensate field located onshore, contain-ing an estimated 1.3 tcm worth of natural gas [US Department of Energy 2008]. In 2007-08, Tengizchevroil and KPO have been responsible for more than 70 percent of gas production in Kazakstan [Yenikeyeff 2009].
277 The consortium operating the field is the Agip Kazakhstan North Caspian Operating Company (Agip KCO), which includes the following shareholders: Kazmunaigaz; ExxonMobil; Royal Dutch Shell; Total; ENI; Conoco; Inpex [Yenikeyeff 2009].
278 This is centred on the giant Orenburg Gas Processing Plant (OGPP) complex in Russia (near the border with Kazakhstan) to market Kazakh gas internationally. In November 2005, Gazprom and Kazmunaigas’ transportation subsidiary, Intergas Central Asia also signed medium-term contracts dealing with the transportation of Russian and Central Asian gas through Kazakh territory from 2006 to 2010 [Gazprom 2008] Both countries agreed to process 16 bcm/y from Karachaganak (to be processed at the OGPP) in mid-2007, to be used domestically in Kazakhstan and re-exported through Russia [Gazprom 2009].
279 According to IEA [2008c], in 2007, Kazakhstan imported 3.2 bcm/y and exported 5.5 bcm to Gazprom. The Gazprom Annual Report [2007] mentions that Gazprom imported 8.5 bcm from Kazakhstan and exported 10 bcm to Kazakhstan.
280 The Kazakh government projects and production level of around 80 bcm by 2015 and 114 bcm by 2020 [Yeni-keyeff 2009].

202
availability of export at 19-20 bcm/y by 2015 (in the best case, probably 7-9 bcm/y higher when imports from Uzbekistan remains to be taken into account). Of these volumes, Yenikeyeff [2009] projects that 15 bcm/y will be sold to Gazprom, which is in line with preliminary agreements. In August 2008, Chinese CNPC and Kaza-munigaz agreed to build a gas pipeline (10 bcm/y), which will link to the Turkmen’s one. According to the IEA [2008c], Kazakhs gas deliveries to China are expected to be rather small, although an integrated pipeline system could offer swap opportunities [Yenikeyeff 2009]. However, the Chinese are also in talks with Kazakhstan over a pipeline similar to the one being built by between Turkmenistan and China, from Kazakhstan’s western provinces to China where it will also link up with China’s West-East pipeline (the West-South pipeline) [Middle East Economic Survey 2008; Platts International Gas Report 2008a].281 In the future, a small volume of gas might be transported directly to Europe via the TCGP. However, this is highly uncertain because of competition from potential ex-port routes for gas to Russia and China, as in the Turkmen case.282 9.3.4 Uzbekistan
283
Uzbekistan is also ruled by a former Soviet ruler, Karimov, and is the most reclusive and isolated of the four republics covered here. Uzbekistan has 1.58 tcm of gas reserves (0.9 percent of the world’s total) and is a significant gas producer, producing 67.4 bcm in 2008, (2.1 percent of the world’s total). Its production is consumed largely domestically (53.1 bcm in 2008) [IEA 2009b]. Uzbekistan is producing gas from approximately 50 gas fields, in which seven fields are responsible for more than 95 percent of the total produc-tion (which include Shurtan, Zevardy, Dengizkul’-Khauzak, Alan, Kokdumalak, Pamouk and Koultak fields) [Zhukov 2009b; Amineh 2003]. Uzbekistan’s energy mix in 2008 (52.2 Mtoe) relied for 84 percent on gas, 11 percent on oil, 3 percent on coal and 3 per-cent on hydropower [BP 2009]. Uzbekneftegaz is largely responsible for the country’s gas production (for about 95 percent). Some other foreign companies, such as Russia’s Gaz-prom and Lukoil and Zeromax joint ventures, operate in upstream (via joint ventures with Uzbekneftegaz). In order to boost its gas production, Uzbekistan has also signed new PSAs, primarily with Russian and Asian companies [IEA 2008c; Zhukov 2009b].284 Uzbekistan exported 10.5 bcm to Russia in 2007 and other Central Asian countries (4.2 bcm in 2007) [IEA 2008c]. Uzbekistan is also responsible for part of the Turkmen transit
281 This route will run parallel to the already operational Kazakhstan-China oil pipeline. For an extensive overview of the politico-economic factors involved in China’s oil import diversification strategy, in which Kazakhstan plays a central role, see Handke [2006].
282 This could change only if the Chinese project does not succeed and/or the amount of re-injections at Tengiz and Kashagan decrease [Yenikeyeff 2009].
283 For a recent in-depth analysis on Uzbek (future) gas sector, see for example Zhukov [2009b].
284 See table 11.11 in Zhukov [2009b, p.375] for an overview of projects with foreign participation in Uzbek gas sector.
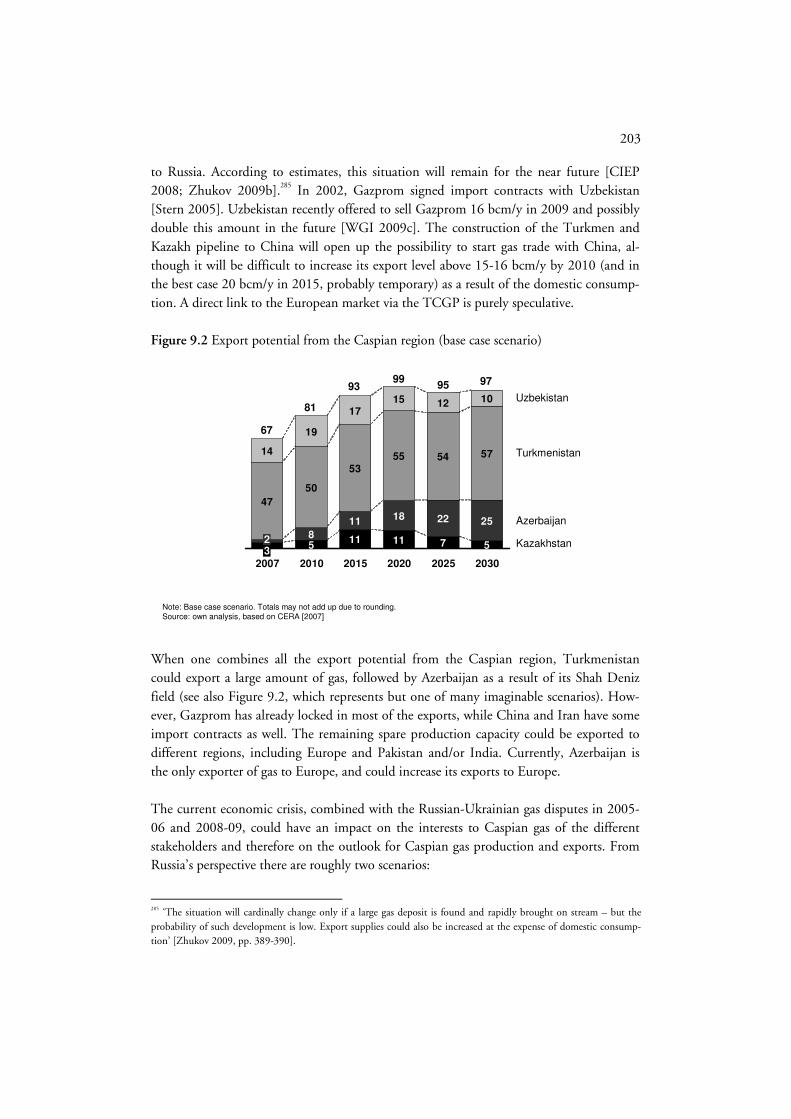
203
to Russia. According to estimates, this situation will remain for the near future [CIEP 2008; Zhukov 2009b].285 In 2002, Gazprom signed import contracts with Uzbekistan [Stern 2005]. Uzbekistan recently offered to sell Gazprom 16 bcm/y in 2009 and possibly double this amount in the future [WGI 2009c]. The construction of the Turkmen and Kazakh pipeline to China will open up the possibility to start gas trade with China, al-though it will be difficult to increase its export level above 15-16 bcm/y by 2010 (and in the best case 20 bcm/y in 2015, probably temporary) as a result of the domestic consump-tion. A direct link to the European market via the TCGP is purely speculative. Figure 9.2 Export potential from the Caspian region (base case scenario)
81
9399
95 97
Turkmenistan
Azerbaijan
Kazakhstan
Note: Base case scenario. Totals may not add up due to rounding.Source: own analysis, based on CERA [2007]
511 11 7 5
8
11 18 22 25
47
50
55 54 5714
19
1715 12 10
53
2007 2010 2015 2020 2025 2030
Uzbekistan
67
32
When one combines all the export potential from the Caspian region, Turkmenistan could export a large amount of gas, followed by Azerbaijan as a result of its Shah Deniz field (see also Figure 9.2, which represents but one of many imaginable scenarios). How-ever, Gazprom has already locked in most of the exports, while China and Iran have some import contracts as well. The remaining spare production capacity could be exported to different regions, including Europe and Pakistan and/or India. Currently, Azerbaijan is the only exporter of gas to Europe, and could increase its exports to Europe.
The current economic crisis, combined with the Russian-Ukrainian gas disputes in 2005-06 and 2008-09, could have an impact on the interests to Caspian gas of the different stakeholders and therefore on the outlook for Caspian gas production and exports. From Russia’s perspective there are roughly two scenarios:
285 ‘The situation will cardinally change only if a large gas deposit is found and rapidly brought on stream – but the probability of such development is low. Export supplies could also be increased at the expense of domestic consump-tion’ [Zhukov 2009, pp. 389-390].

204
1) First, as a result of the declining economic activity and gas demand within Russia and other CIS (principally, Ukraine)286, the pressure on Russia’s supply portfolio, and therefore Caspian imports, reduced in the short-run and will remain for the medium term. The reduction of the call on Caspian imports might be encour-aged by ongoing greenfield investments in Shtokman and possibly Yamal.
2) In a scenario involving the delay of new Russian (e.g., as a result of a lack in fi-nancial feasibility) combined with newly committed supplies (take-or-pay) to Europe, the importance of Caspian gas in Russia’s gas balance will persist. As a consequence of potentially declining economic activity in China, gas for power generation could be affected negatively, which may have an impact on additional gas import requirements from the Caspian region as well.
From a European view, the Russian-Ukrainian gas disputes accelerated the perceived need for greater imports from the Caspian Sea region in order to diversify away from Russia and Ukraine (in terms of both the origin of supplies and routes). However, current dam-pening European gas demand and imports may postpone the commitment of new gas supplies from outside Europe. Regardless of external factors such as oil prices and macro-economic conditions, the Cas-pian Sea countries (especially Turkmenistan and Kazakhstan) are likely to continue play-ing Russia, China and Europe off against one another. For now, on-the-ground export route diversification is limited. Yet, from late 2009, Turkmenistan (as well as Kazakhstan and Uzbekistan) is no longer be as reliant on export routes to Russia.287 As a result of the development of an alternative export route to China, the balance of bargaining power has changed. In a similar manner, Azerbaijan may continue to play off Russia, Iran and Euro-pean buyers as and when more of its gas becomes available.
9.4 Supply costs and market power in the Atlantic LNG basin and Europe
Existing and potentially new gas flows from Russia, Iran, Qatar, the Caspian region, Alge-ria, Norway, Libya, Nigeria as well as other countries reach the major markets (in the form of pipeline gas or LNG) at a certain cost. These gas flows are produced, transported and distributed through infrastructures, which require a long lead-time to build.288 From a theoretical point of view, the long-run marginal costs (LRMC, see Chapter 4 for a more complete definition) therefore need to be taken into account, i.e., the full cost of bringing an additional cubic meter to market. The LRMC determine, regardless of pricing in oil-
286 The gas demand within Russia could be not as much of affected as a consequent of reducing government’s drive to increase regulated prices. (Rising prices could stimulate inflation, which may have a negative impact on the economic development.)
287 This is the result mainly of the scheduled opening of a large-volume export route to China, in addition to existing smaller capacity link to Iran [IEA 2009a].
288 As is explained in Chapter 2, the realisation of these projects often requires long-term gas contracts, which play a crucial role as far as the financing of the entire value chain is concerned.

205
indexation versus spot terms, the floor price for gas. Chapter 3 contains a theoretical ac-count of market power both in terms of market share and cost (based on the LRMC), and it is applied here to provide an overview of the market power given current and future export potential of the most important gas-exporting countries (refer to it when interpret-ing the figures below). Large fields, large-diameter pipelines, large shipping capacity in LNG help breed economies of scale in gas flows, as large volumes of gas lower per-unit costs for each cubic meter. While the LRMC to bring these cubic meters to market include economies of scale, LRMC also encompass other costs, which are fixed in the short-run, such as capital costs. Gas transportation, whether by pipeline or LNG, remains very expensive and usually represents an important share of the overall cost of gas delivered to consumers [IEA 2008c]. Despite the potential for LNG to affect different regional markets on an interre-gional basis, pipeline gas, especially in Europe, can still greatly affect the competitiveness of LNG due to lower economies of scale. Attaining a clear grasp of the market power of gas suppliers in question requires a LRMC overview (including costs incurred from gas production, transportation as well as from transit fees and royalties) of the different gas suppliers. These costs are based on the various potential routes from these various gas sup-pliers to the different (sub-)regional markets by both pipeline and LNG. The importance of these figures lies more in their relative than absolute differences. An overview is pro-vided in Figure 9.3 below, which includes LRMC estimates in 2020, based on existing as well as future gas value chains to Europe, involving gas fields and provinces not yet cur-rently in use.

206
Figure 9.3 LRMC estimates for gas delivered to Europe in 2020 (in $/mcm)
Spain
Costs
177
161
95
83
Italy
SSEE
NWE
Main route
Medgaz
GALSI
LNG
LNG
Algeria
Destination
Greece
Costs
143
127
94
Italy
Austria
Main route
SCP
SCP/TGII/TAP
SCP/Nabucco
Azerbaijan
Destination
Greece
Costs
243
212
197
163
Italy
Austria
SSEE
Main route
AGP
AGP/TGII/TAP
AGP/Nabucco
LNG
Egypt
Destination
Greece
Costs
161
95
83
Italy
Austria
Main route
diff.
diff./TGII/TAP
diff./Nabucco
Iran
Destination
Greece
Costs
146
131
97
Italy
Austria
Main route
diff.
diff./TGII/TAP
diff./Nabucco
Iraq
Destination
Italy
Costs
197
109
Main route
Greenstream
Libya
Destination
LNG
Pipeline gas
Note: Gas production sites and fields are indicated only when specifically mentioned in the source.Source: IEA [2009c].
SSEE
Costs
175
173
NWE
Main route
LNG
LNG
Nigeria
Destination
Netherlands
Costs
286
92
NWE
Main route
Europipe (Troll)
LNG (Snøhvit)
Norway
Destination
SSEE
Costs
174
164
NWE
Main route
LNG
LNG
Qatar
Destination
Greece
Costs
200
130
127
Germany
Germany
Main route
Blue Stream
Ukraine system
Ukraine system
Russia
Destination
SSEE
Costs
146
223
220
NWE
Main route
LNG
LNG
Trinidad an Tobago
Destination
Greece
Costs
185
152
Main route
TCGP
Turkmenistan
Destination
Germany
Germany
Austria
Germany
Yamal-Europe
Nord Stream
South Stream
Nord Stream
215
208
204
300
234
LNGNWE TCGP/Nabucco
Ukraine system
South Stream
Italy
Germany
Austria 200
190
Main field
Astrakhan
Astrakhan
Yamal
Yamal
Yamal
Tukrmen imports
Shtokman
Shtokman
In Figure 9.4, the market shares of the various gas suppliers to both the Atlantic LNG Basin (the US and the LNG-importing countries in Europe) and Europe are shown. The bottom line in this figure is that the market structures of the Atlantic Basin and Europe and the market shares of the players on these markets differ substantially amongst one another. For example, Russia has a large share of the European market as a whole but plays no role at all in the Atlantic Basin market directly. Conversely, Qatar plays a signifi-

207
cant role in the Atlantic Basin market today but will enlarge its market share significantly by 2015 when its new liquefaction plants come on stream. Figure 9.4 Market shares of the various gas suppliers in the Atlantic Basin and Europe in 2007, compared with 2015 (LNG and pipeline)
* Europe is defined by all European countries, including Turkey, excluding CIS. Totals may not add up due to rounding.Source: own analysis; IEA [2008] for 2007; CIEP [2008] and privately disclosed company data for traditional pipeline (incl. LNG)suppliers to Europe in 2015, based on export ambitions (Russia LNG supplies in 2015 based on Argus Connection); Cedigaz [2008] for other LNG suppliers in 2015.
Market share of LNG supplies in Atlantic basin
Market share of LNG and pipeline suppliers in Europe
20152007
INDICATION
Trinidad and
Algeria
Egypt
Qatar
NorwayRussia
Tobago
31%
19%
12%
11%
18%
5%
6%
13%
42%
5%5%
5%
100% = 70 bcm 100% = 210 bcm
20152007
Netherlands
Russia
Indigenous
Algeria
Qatar
Others**
Norway
100% = 570 bcm 100% = 640 bcm
Nigeria 25%
3%Others*
supply
27%
26%
13%
10%
9%1%
12%
18%
29%
17%
6%
14%
13%
6%
The available LRMC information for the various supply routes to Europe and the US from a range of existing pipeline and LNG suppliers is combined with the figure above to provide a rough estimate of market power in the figures below. Market power can be measured in terms of price and marginal costs as well as in terms market shares (see Chap-ter 3). This is done on a regional basis level (i.e., European market) as well as an interre-gional level or Atlantic LNG Basin level as in Figure 9.4. An interesting observation is that in terms of the market share, using the Lerner yardstick, LNG players such as Nigeria and Algeria are pushed aside in 2015 by Qatar in the Atlan-tic LNG Basin, where it gains immensely in terms of market power as measure by market share in that basin. In other words, Qatar gains in terms of market power in a market where the European LNG importers and their LNG import shares are assumed to form one single market together with the share of LNG imports on the US side (Qatar attains a Lerner value of 0.21 in 2007, but this figure rises to 0.85 in 2015), while Algeria’s market power decreases from 0.62 to 0.35, see Figure 9.5. In terms of market power when using the price yardstick, the changes from an interregional perspective are only slight when
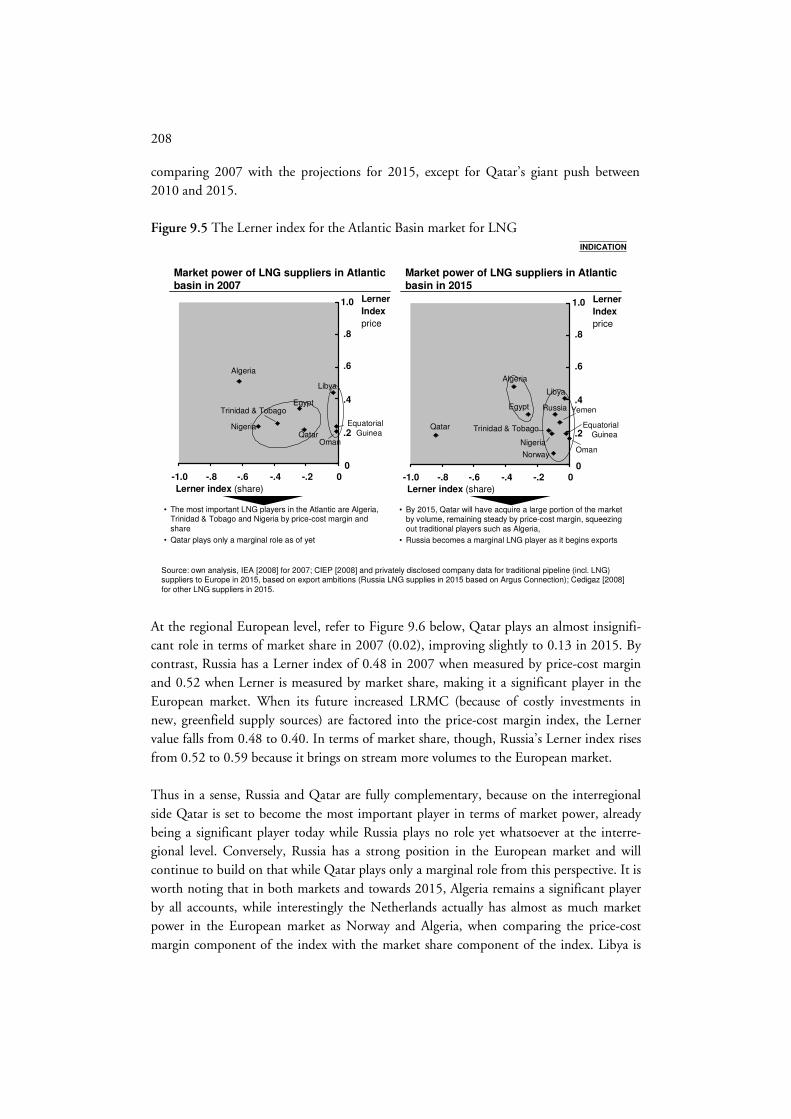
208
comparing 2007 with the projections for 2015, except for Qatar’s giant push between 2010 and 2015. Figure 9.5 The Lerner index for the Atlantic Basin market for LNG
Source: own analysis, IEA [2008] for 2007; CIEP [2008] and privately disclosed company data for traditional pipeline (incl. LNG) suppliers to Europe in 2015, based on export ambitions (Russia LNG supplies in 2015 based on Argus Connection); Cedigaz [2008] for other LNG suppliers in 2015.
Market power of LNG suppliers in Atlantic basin in 2007
Lerner index (share)
Lerner
Index
price
Market power of LNG suppliers in Atlantic basin in 2015
-1.0 -.8 -.6 -.4 -.2 0
1.0
.8
.6
.4
.2
0
Algeria
Libya
Egypt
QatarNigeria Equatorial
GuineaOman
Lerner index (share)
Lerner
Index
price
-1.0 -.8 -.6 -.4 -.2 0
1.0
.8
.6
.4
.2
0
Russia
Norway
Algeria
Libya
Egypt
Qatar
NigeriaOman
Trinidad & Tobago
• The most important LNG players in the Atlantic are Algeria, Trinidad & Tobago and Nigeria by price-cost margin and share
• Qatar plays only a marginal role as of yet
• By 2015, Qatar will have acquire a large portion of the market by volume, remaining steady by price-cost margin, squeezing out traditional players such as Algeria,
• Russia becomes a marginal LNG player as it begins exports
Trinidad & Tobago
INDICATION
Equatorial Guinea
Yemen
At the regional European level, refer to Figure 9.6 below, Qatar plays an almost insignifi-cant role in terms of market share in 2007 (0.02), improving slightly to 0.13 in 2015. By contrast, Russia has a Lerner index of 0.48 in 2007 when measured by price-cost margin and 0.52 when Lerner is measured by market share, making it a significant player in the European market. When its future increased LRMC (because of costly investments in new, greenfield supply sources) are factored into the price-cost margin index, the Lerner value falls from 0.48 to 0.40. In terms of market share, though, Russia’s Lerner index rises from 0.52 to 0.59 because it brings on stream more volumes to the European market. Thus in a sense, Russia and Qatar are fully complementary, because on the interregional side Qatar is set to become the most important player in terms of market power, already being a significant player today while Russia plays no role yet whatsoever at the interre-gional level. Conversely, Russia has a strong position in the European market and will continue to build on that while Qatar plays only a marginal role from this perspective. It is worth noting that in both markets and towards 2015, Algeria remains a significant player by all accounts, while interestingly the Netherlands actually has almost as much market power in the European market as Norway and Algeria, when comparing the price-cost margin component of the index with the market share component of the index. Libya is

209
an important regional gas exporter to Europe in terms of price-cost margin (0.4) despite its low level of production.
Figure 9.6 The Lerner index for the European gas market
Note: other indigenous EU producers are not incorporated, because they do not export. Source: own analysis, IEA [2008] for 2007; CIEP [2008] and privately disclosed company data for traditional pipeline (incl. LNG) suppliers to Europe in 2015, based on export ambitions (Russia LNG supplies in 2015 based on Argus Connection); Cedigaz [2008] for other LNG suppliers in 2015.
Market power of LNG and pipeline suppliers in Europe in 2007
Lerner index (share)
Lerner
Index
price
Market power of LNG and pipeline suppliers in Europe in 2015
-1.0 -.8 -.6 -.4 -.2 0
1.0
.8
.6
.4
.2
0
Russia
Norway
Algeria
The Netherlands
AzerbaijanLibya
Iran
Egypt
QatarNigeria
Oman
Trinidad & Tobago
Lerner index (share)
Lerner
Index
price
-1.0 -.8 -.6 -.4 -.2 0
1.0
.8
.6
.4
.2
0
Russia Norway
Algeria
The Netherlands
AzerbaijanLibya
Iran
Egypt
QatarNigeria
Oman
Trinidad & Tobago
• Russia, Norway, Algeria and the Netherlands have the most market power in terms of both market share and price-cost margin
• Some important LNG exporters play only a marginal role, e.g., Qatar, Nigeria and Trinidad & Tobago
• Russia’s market power shifts upwards only slightly in terms of share and actually falls by price-cost margin, similarly for Algeria and Norway
• The roles of Qatar and Egypt become somewhat more important
INDICATION
9.5 Cooperation in an interregional gas market
289
From an economic as well as a political point of view, gas-exporting countries, including Russia, may desire a form of managing their supply capacity and trade flows [CIEP 2008]. So far, cooperation in the interregional gas market has only just begun to take shape in the form of the Gas Exporting Countries Forum (GECF)290. The member states of the GECF together hold around two-third of world’s gas reserves. In 2008, they account for 36 per-cent of total production, which is expected to rise to 42 percent in 2030, according to the reference scenario of the IEA [2008b]. Together, they are responsible for almost 50 per-cent of total exports [IEA 2009].
289 See Chapter 10 and 11 in Boon von Ochssée [2010] and Chapter 12, for an extensive overview and analyses on cooperation in interregional gas market, also in light of international relations.
290 The official member countries are: Algeria, Bolivia, Egypt, Equatorial Guinea, Iran, Libya, Nigeria, Qatar, Russia, Trinidad & Tobago, and Venezuela. Kazakhstan, Norway and the Netherlands have the status of observer [GECF 2009]. In the past, Brunei, Indonesia, Malaysia, Oman, Turkmenistan, and the UAE have participated at different ministerial meetings [CIEP 2008].

210
Though long seen as an informal club with little to no cohesion [Hadouche 2006], the GECF has gained much traction since 2006 and decided in December 2008 to transform into an international organisation [IEA 2009]. However, the political aspect of differences of opinion over the charter appears to reflect some disparity between the interests of the member states.291 According to its mission statement, “[t]he GECF was set up with the objective to increase the level of coordination and strengthen the collaboration between member countries. The forum also seeks to promote dialogue between gas producers and consumers” [GECF 2009].292 In what has been called an effort to further reshape the GECF, Russia, Iran and Qatar established the Gas Troika in October 2008, holding more than half of world’s gas re-serves [BP 2009]. The aim of the Troika is officially to hold up to four meetings annually to discuss gas policy, including cooperation between the three countries covering explora-tion, gas processing, transportation and sale of gas in an effort to create to “create a fair market for producers and consumers” [Platts International Gas Report 2008]. The GECF and the Troika appear to be geared towards the regulation and coordination of long-run investments, which may – with the emphasis on ‘long-run’ – determine a certain level of gas supply, traded either in long- or short-term contracts. One may expect that the GECF and/or the Troika employ some form of tacit collusion, which is likely to remain ad-hoc, and informal, guided in large part by the largest reserve-holders, destined to shape the interregional market over a longer period of time. A certain level of coordination and cooperation for long-run investments and optimisation of capacity extensions in order to realise acceptable returns on investment (e.g., prevent over-sizing the gas industry) can be imagined in the form of ‘supply management’ [De Jong et al. 2010]. In addition, by shar-ing a common value chain with high economies of scale, the parties can effectively take advantage of upside possibilities in the case of a seller’s market. They must nevertheless take into account fringe competition (for example by international energy firms), and cooperation will be tested in times of a buyer’s market when downside risks materialise (e.g., the collapse of short-term prices, which can spill over into long-term contracts). It is therefore likely to be geo-economically driven over the longer run, with political factors possibly influencing the level of formality of cooperation (see also Section 13.1.5).
291 Venezuela and Iran, for example, favour a charter resembling that of OPEC, while Russia and Qatar wish to avoid allowing the GECF to resemble OPEC and appear to take a more commercial position rather than a political anti-Western one.
292 The direct comparison between the GECF and OPEC, or referring to it as a ‘gas-OPEC’, can be misleading because their structural market differences. The functioning of a group examining the common interests of gas exporting countries is not the same as a quota-driven OPEC, which regulates prices almost overnight in a global and liquid market. With the current structure of the gas markets, exporters’ market power is limited through their long-term contracts. In addition, other fuels can more easily substitute gas, relatively to oil. This decreases the possibilities of cartel-like behaviour [IEA 2009].

211
From Gazprom's perspective, a possible form of cooperation may be relatively more desir-able in the European and Atlantic LNG markets. These markets are one of the largest markets for gas and Gazprom’s current export market for gas, but also the most import-dependent. Remarkably, therefore, is that almost all members (except from Venezuela and Bolivia) are actual or viable future suppliers to the European and/or Atlantic LNG market [IEA 2009].293 In Gazprom’s export strategy, which has been backed by state support at the highest levels of the Russian government (see Chapter 10), Gazprom has begun to reach out to fellow gas exporting countries by offering to invest in certain stakes along the value chain in countries close to or important to the European market such as Norway, Algeria and Libya. In a similar strategy, Gazprom is pursuing cooperation with Iran and Qatar, which are important for the future long-run development and evolution of the interregional gas market, as mentioned above. Gazprom has approached each country with various kinds of offers to take part in the development of their resources, to contribute to ownership of their export links to Europe, or in the case of Qatar and Iran, to form joint ventures to jointly produce and sell LNG. See Map 9.1 for a map of the various commer-cial packages in which Russia and Gazprom play a role. Conversely, as will be discussed in Chapter 11, Russia may enhance its competitive stance in the interregional gas market (and regional gas markets) in order to capture additional market share or control capacity developments. 9.6 Conclusion
In its traditional European market, Russia faces competition mainly from other pipeline suppliers: Norway, Algeria, and the Netherlands. These countries, except from the Neth-erlands, are expected to retain their market power. Currently, other small pipeline suppli-ers, such as Libya and Azerbaijan, and LNG players in the Atlantic basin, such as Nigeria, Egypt and Qatar, play a less important role. In future, Qatar is set to become an impor-tant interregional player, both in the Atlantic and Pacific LNG market, and thus for Rus-sia increasingly important to take into account. The landlocked Caspian Sea gas producers, formerly belonging to the Soviet Union (e.g., Turkmenistan, Kazakhstan, Uzbekistan and Azerbaijan) continue to seek diversity in their exports to Europe, as well as Asia. Currently, Turkmenistan is exporting some of its gas to Iran, and recently to China, whereas Azerbaijan is supplying gas directly to the Turkish market. For the future the level of diversification is expected to increase, even they remain strongly tied to Russia and important in Russia’s gas balance. Although the various gas-exporting countries differ fundamentally in terms of the institu-tionalisation and strategies, most countries are becoming interregional gas market players. In addition, some countries are important oil producers and require gas to boost oil pro-
293 In the past, Brunei, Indonesia, Malaysia, Oman, Turkmenistan, and the UAE have participated at different ministe-rial meetings [CIEP 2008].

212
duction. In addition, their national energy firms fulfil an important role in these countries’ domestic, politico-economic agendas, where their governments largely influence decision-making. The strong presence of international energy firms, especially in Qatar, Australia and Nigeria, has also a large impact on Russia’s position. In managing these value chain related risks and avoiding oversupply, Gazprom appears to take an important position in the advent of greater project-level cooperation between the various gas-exporting countries’ national energy firms. This may be further institutional-ised through a newly formed international organisation of gas-exporting countries, the GECF, or the Gas Troika, consisting of the three main gas reserve-holders (e.g., Russia, Iran and Qatar).

GEC
F/G
as T
roik
a m
embe
r
GEC
F m
embe
r
GEC
F ob
serv
er
Poss
ible
frin
ge c
ompe
titor
*
Oil
and
gas-
expo
rting
cou
ntrie
s:
Mai
n pl
atfo
rms
for c
oope
ratio
n
OPE
C m
embe
r
OPE
C o
bser
ver
* Fig
ure
does
not
incl
ude
all c
ompe
titor
s, (e
.g.,
Trin
idad
and
Tob
ago
and
unco
nven
tiona
l pr
oduc
tion
in th
e U
S; g
as p
rodu
ctio
n fro
m
inte
rnat
iona
l ene
rgy
firm
s).
Not
e: O
ther
fore
ign
inte
rest
s/G
azpr
om’s
MoU
’sno
t inc
lude
d in
figu
re: e
.g.,
Alas
ka; B
oliv
ia; E
gypt
; In
dia;
Ven
ezue
la; a
nd V
ietn
am.
Sour
ces:
Gaz
prom
’s w
ebsi
te; c
ompa
ny w
ebsi
tes;
IE
A [2
009b
].
Gas
fiel
d
Lege
nd GEC
F/G
as T
roik
a m
embe
r
GEC
F m
embe
r
GEC
F ob
serv
er
Poss
ible
frin
ge c
ompe
titor
*
Oil
and
gas-
expo
rting
cou
ntrie
s:
Mai
n pl
atfo
rms
for c
oope
ratio
n
OPE
C m
embe
r
OPE
C o
bser
ver
* Fig
ure
does
not
incl
ude
all c
ompe
titor
s, (e
.g.,
Trin
idad
and
Tob
ago
and
unco
nven
tiona
l pr
oduc
tion
in th
e U
S; g
as p
rodu
ctio
n fro
m
inte
rnat
iona
l ene
rgy
firm
s).
Not
e: O
ther
fore
ign
inte
rest
s/G
azpr
om’s
MoU
’sno
t inc
lude
d in
figu
re: e
.g.,
Alas
ka; B
oliv
ia; E
gypt
; In
dia;
Ven
ezue
la; a
nd V
ietn
am.
Sour
ces:
Gaz
prom
’s w
ebsi
te; c
ompa
ny w
ebsi
tes;
IE
A [2
009b
].
Gas
fiel
d
Lege
nd
2 •A
sset
sw
aps:
up-
, mid
-, an
d do
wns
trea
m, s
ettin
g up
join
t ve
ntur
es to
sel
l gas
•E
&P
in A
lger
ia’s
Ber
kine
Bas
in
•P
ossi
ble
stak
e in
Tra
ns-S
ahar
a pi
pelin
e (w
hich
wou
ld in
clud
e a
deal
with
Nig
eria
)
Alg
eria
: Son
atra
ch
1 •A
sset
sw
aps
invo
lvin
g E
NI
•P
ossi
bilit
ies
of im
plem
entin
g jo
int p
roje
cts
in L
ibya
n en
erg
y se
ctor
•B
uyi
ng u
p al
l of L
ibya
’s o
il an
d ga
s pr
oduc
tion
for
one
year
•G
azpr
om s
take
in th
e G
reen
stre
ampi
pelin
e to
Ital
y
Liby
a: N
OC
•P
oten
tial c
oope
ratio
n th
roug
h LN
G-f
or-p
ipel
ine
swap
s•
Sou
th P
ars
join
t dev
elop
men
t (v
ia G
as T
roik
a)
Qat
ar: Q
atar
Pet
role
um
7
•P
ossi
ble
coop
erat
ion
in th
e co
nstr
uctio
n of
the
IPI p
ipel
ine
•S
ettin
g up
join
t com
pan
y to
do
E&
P w
ork
in Ir
an
•S
outh
Par
s jo
int d
evel
opm
ent
(via
Gas
Tro
ika)
•P
ossi
ble
mar
ket d
ivis
ion:
E
urop
e fo
r R
ussi
a an
d A
sia
for
Iran
Iran
: NIO
C
4
•Jo
int d
evel
opm
ent o
f Sht
okm
an•
Dow
nstr
eam
pot
entia
l gas
sw
aps
in n
orth
wes
tern
Eur
ope
•P
ossi
ble
acce
ss fo
r G
azpr
om to
S
tato
ilHyd
ro’s
reg
asifi
catio
nca
paci
ty in
the
US
Nor
way
: Sta
toilH
ydro
6
•Jo
int v
entu
res
in u
p-, m
id-,
and
dow
nstr
eam
(e.g
., K
azR
osG
az)
•Lo
ng-t
erm
sup
ply
cont
ract
s to
G
azpr
om (T
urkm
enef
tega
z,
Uzb
ekne
fteg
az, K
azm
unai
gaz)
Cen
tral
Asi
a: N
atio
nal
en
ergy
firm
s
5
Str
ateg
icga
s el
lipse
3 •S
ettin
g up
join
t com
pan
y (N
igaz
) to
do E
&P
and
oth
er
wor
k in
Nig
eria
•
Pos
sibl
e st
ake
in T
rans
-Sah
ara
pipe
line
(whi
ch w
ould
incl
ude
a de
al w
ith A
lger
ia)
Nig
eria
: NN
PC
Nor
way
Net
herla
nds
Rus
sia
Kaz
akhs
tan
Tur
kmen
ista
n
Alg
eria
Liby
aE
gypt
Aze
rbai
jan
Iraq
Qat
arU
AEIr
an
Nig
eria
Mal
aysi
a
Indo
nesi
a
Aus
tral
ia
Trin
idad
and
Tob
ago
Can
ada
Ven
ezue
la
Bol
ivia
A P
DF
vers
ion
of th
is m
ap is
ava
ilabl
e at
<ht
tp://
ww
w.c
linge
ndae
l.nl/c
iep>
for m
agni
ficat
ion
purp
oses
onl
y
Wor
ld M
ap T
empl
ate:
©by
Le M
onde
Dip
lom
atiq
ue
A P
DF
vers
ion
of th
is m
ap is
ava
ilabl
e at
<ht
tp://
ww
w.c
linge
ndae
l.nl/c
iep>
for m
agni
ficat
ion
purp
oses
onl
y
Wor
ld M
ap T
empl
ate:
©by
Le M
onde
Dip
lom
atiq
ue
Map 9.1 GECF, OPEC, and Gazprom’s selected shared investments and cooperation alongthe gas value chain

214

215
Chapter 10 Russia’s vantage point in a dynamic interregional gas
market
10.1 Introduction
Having concluded in Chapter 3 that Russia wants to build on its natural resources to achieve a relative advantage, this chapter is essentially a follow up of this line of argumen-tation. Both Russia, as a principal, and Gazprom, as an agent, operate in a space with geo-economic opportunities and constraints. Russia as a state can influence the boundary solu-tions for Gazprom, both in terms of domestic and foreign policies. This may help secure, for example, flows on the Eurasian continent, which was once part of the Soviet system of production and distribution. Understanding Russia’s priorities and goals as well as its export strategy with respect to current and new potential markets will enable one to under-stand how it should carefully balance internal versus external focal points. Internally, Russia has to ensure a stable and reliable revenue stream from its natural re-sources, partly in order to plan and guarantee investments in other sectors with the aim of modernising and diversifying the Russian economy. The Russian government has to pro-vide incentives so as to allocate gas production areas to both Gazprom and other Russian gas firms (i.e., independent gas producers294). In addition, Gazprom must live up to its public service obligation to supply Russian citizens with relative low-priced gas (although this is planned to change). Externally, Gazprom aims to maximise its revenues, which takes into account both access to markets (possibly via vertical integration), as well as possible moves to do the same by rivals. The growing import-dependence of the European market(s) presents Russia with an opportunity to maintain or expand market share even as it seeks to export to large and diverse gas markets, such as China and the US. Russia is shifting from a regional, captive supplier to a more global one, both by pipeline as well as LNG. Section 10.2 is an overview of Russia’s gas reserves and current gas balance. Section 10.3 provides an impression of Russia’s gas sector in terms of revenues, institutionalisation, decision-making, and foreign participation. In Section 10.4, attention is paid to Russia’s domestic gas needs and strategy. Next to this, Section 10.5 addresses Russia’s gas export ambitions by pipeline and LNG flows to the CIS, European, Asian, and the US markets. Section 10.6 provides the main uncertainties related to Russia’s merit order. Section 10.7 concludes.
294 The term ‘independent’ has become increasingly unsuitable since Gazprom formed strategic relationship with and has taken (minority) equity stakes in these companies [Stern 2009].

216
10.2 Russia’s current gas balance
Of the few major gas suppliers in the world, Russia is the largest in terms of conventional reserves, production and exports (see also Chapter 3 and 8). Domestically Russia is also a large consumer of gas, the second largest after the US (domestic Russian gas consumption amounted in 2008 to 462 bcm) [IEA 2009]. According to Gazprom’s data, Russia ex-ported 170 bcm and 83 bcm in 2008 to Europe and the CIS countries, respectively, through Russia’s export infrastructure, linking it first with CIS and then with European markets (see Chapter 12). These volumes were accompanied in 2008 by 59 bcm worth of imported Central Asian volumes by Russia and then either consumed domestically or re-exported [Gazprom 2009]. In 2008, Gazprom accounted for 75 percent of total Russia’s production, see Figure 10.1. Figure 10.1 Russia’s gas balance in 2008
* Imports: Turkmenistan (38.1 bcm); Uzbekistan (12.8 bcm); Kazakhstan (8.6 bcm).Note: Totals may not add up due to rounding. Gazprom’s data calculated in European bcm’s. Production from independents is assumed at: domestic production minus Gazprom’s productionSource: own analysis, IEA [2009] for domestic consumption and production; Gazprom [2009] for exports, imports and Gazprom’s production.
CIS Residual
170
Total supply
495
2
462
Domestic consumption
83
162
712
Europe
59Domestic gas production (Gazprom)
Domestic gas production (independents)
Export by pipeline
Domestic consumption
Residual/data error
Total imports*
As far as reserves within Russia are concerned, Gazprom controls roughly 56 percent (28.9 tcm), implying that it controls 13 percent of the world’s gas reserves. The so-called ‘inde-pendent’ gas producers control the remaining share of Russia’s reserves, 44 percent (18.9 tcm).295 The most important production areas in the Russian gas industry are those which have been producing for decades, located in Western Siberia, south of the Yamal area in the NPT area, good for some 80 percent of Russia’s gas production. The Russian gas in-dustry is at a cross-roads as it must shift production from these mostly mature production
295 75 Percent of Russia’s gas fields are concentrated in 20 (ultra) gigantic deposits (more than 1 tcm), mostly controlled by Gazprom. In addition, there are dozens of the ‘large-scale’ fields (0.3-1 tcm) and more than 600 medium and small fields (about 10 bcm) [Zhiznin 2007].

217
sites to the potential producing areas in parts of Eastern Siberia, the Far East and in the region north of the Arctic Circle as well as other parts of the Yamal peninsula [IEA 2008c]. There are three categories of major gas fields located in various provinces: (1) major gas fields which are in decline; (2) those which have reached a plateau production profile; and (3) the ‘new’ gas fields, often in new gas provinces at a considerable distance from Russia’s current infrastructure. See Map 8.1 for a geographical overview of the most important gas fields in (and outside) Russia. Mature fields and production areas The mature fields include the super giant gas fields south of the Yamal peninsula, which have provided the bulk of Russia’s gas production during the days of the Soviet Union, i.e., Medvezhe (2.69 tcm), Urengoy (2.5 tcm), Yamburg (2.6 tcm). These fields are also known as the ‘big three’ and are in a significant decline at a rate of some 20 bcm/y – ‘very mature’ in geological terms [Stern 2005; IEA 2009]. Fields with a flat production profile and brownfields Most of the relative ‘smaller’ fields have entered in a flat production profile. Some of these fields, mostly located in Western Siberia, offer possibilities of brownfield investments to increase production in order to hold up the decline in the big three fields (sometimes men-tioned as the Russia’s small field policy). Zapolyarnoye is the most significant, it has peaked as recently as 2005 at 100 bcm/y and is currently also entering its decline [Stern 2005]. Brownfield investments in the NPT area are another option in the shorter-term to accommodate falling production rates.296 Of additional importance are the resources at the Obskaya- en Tazovskaya bays, south of the Yamal peninsula, also in western Siberia near the ‘supergiant’ Yamburg field, which may add their weight of 2 tcm worth of reserves to supplementing production from the Yamal area [Gazprom 2006; 2008].297 The new gas provinces The main ‘new’ gas provinces are parts of Western Siberia, Yamal, East Siberia, Sakhalin and the Barents Sea, which includes the next generation of very large gas fields [Stern 2009].298 The Bovanenskovkoye (3.2 tcm) and Kovytka (1.9 tcm) gas fields, amongst a number of other, smaller gas fields and constellations of gas fields, are those currently earmarked for either domestic consumption or exports. The Shtokman gas field (3.6 tcm), the equivalent of Norway’s entire proven resource base, is located in the Barents Sea [Stern 2005; 2008]. According to the latest plans, gas from Shtokman is expected to come on
296 These fields are all close to the existing infrastructure, and as was mentioned also, they are therefore relative more “economically practicable to develop”. [Gazprom 2006; Gazprom 2008b, p. 40.].
297 These fields are estimated to have a production potential of up to 82 bcm/y [Stern 2009].
298 The location of the gas fields in remote areas far from the main UGTS areas are known for their harsh climactic conditions involving permafrost and, worse yet, thawing permafrost [Stern 2009].

218
stream in the late 2010s, in 2016 with pipeline and in 2017 with LNG volumes to Europe and the US [Platts LNG Daily 2010].299 Given their size, the reserves at Yamal (e.g., Bovanenkovskoye and Kharasavei) could form the bulk of Gazprom’s production well into the next decades. The collective output from Yamal at Gazprom’s accounts is estimated at 135-175 bcm/y by 2020, and 310-360 bcm/y by 2030 [Gazprom 2009; Stern 2009].300 The Yuzhno Ruskoye oil and gas deposit (1 tcm) is due to produce 25 bcm by 2009 at design capacity and is tied to the Nord Stream pro-ject (see also Case study 3 in Chapter 11) [Gazprom 2008]. Gas from the Kovytka field and other fields in Eastern Siberia and Far East (such as Chayandinskoye) may be put into production for the development of Russia’s domestic market. This is likely to be done in combination with exports by pipeline to Asian countries, such as China, South Korea and Japan (see Section 10.5.3). For a more detailed account of possible Russian gas production (including old, plateau and new fields) by region to 2030, see Figure 10.2. In addition, production from independents is estimated to become substantial in Russia’s supply portfolio: from 17 percent in 2008 to almost 25 percent in 2030.301 Imports from Central Asia, mainly from Turkmenistan and Kazakhstan, are also estimated to grow due to newly-signed contracts (70-100 bcm/y by 2010; see Chapter 9) [Stern 2009].302 By 2008, these imports had become relative more ‘expensive’ due to gradual price increases to match European levels in 2009. This means that gas from Central Asian can only be sold at a substantial loss within Russia [Stern 2009]. It should be noted that Figure 10.2 is but one possible projection. There are a mul-titude of scenarios imaginable, which may shape Russia’s supply portfolio differently, and these are subject to a number of uncertainties which will be discussed in Chapter 12.303
299 Previous plans for Shtokman called for gas production to start in 2013 and LNG production in 2014. The first phase was expected to reach total production of 23.7 bcm [Platts LNG Daily 2010]. The first phase of the field will be developed by the Shtokman Development Company, where Gazprom is the main shareholder (51 percent) and Total (25 percent) and StatoilHydro (24 percent) have minority stakes.
300 By 2011, production from Yamal’s Bovanenkovo field is expected to reach 8 bcm/y (which will increase to 140 bcm/y in the long-term, according to Gazprom) [IEA 2009].
301 The frontrunners amongst the independents in 2007 were Novatek (28.5 bcm), Rosneft (16.2 bcm), Lukoil (14.3 bcm), Surgutneftegaz (14.1 bcm), and TNK-BP (10.1 bcm) [Stern 2009]. A somewhat artificial division can be made between the independent gas companies as follows: companies whose main business is oil but have significant interests in (non)associated gas, which includes Lukoil, Rosneft, Surgutneftegas and TNK/BP. Then there are companies whose main hydrocarbon reserves and business are gas-related, these included mainly Itera and Novatek, but including all the companies that comprise the Union of Independent Gas Producers (Soyuzgaz). Another category includes companies in which Gazprom has a substantial shareholding, such as Sibur and Purgaz.
302 However, the amount is uncertain due to lower Turkmen exports to Russia following an explosion in the CAC pipeline. It might be possible that Russia will import a substantial amount of gas from the gas field Shah Deniz II in Azerbaijan (see Chapter 9). This is not included in Figure 10.2.
303 For instance, Cambridge Energy Research Associates (CERA) estimates that gas production will be lower after 2014, compared to UBS’s [2008] projection, largely as a result of lower production from the Yamal fields. Gazprom sets out targets of 610 bcm-615 bcm/y by 2015 and 650-670 bcm/y in 2020. By 2020, according to Gazprom, new fields will
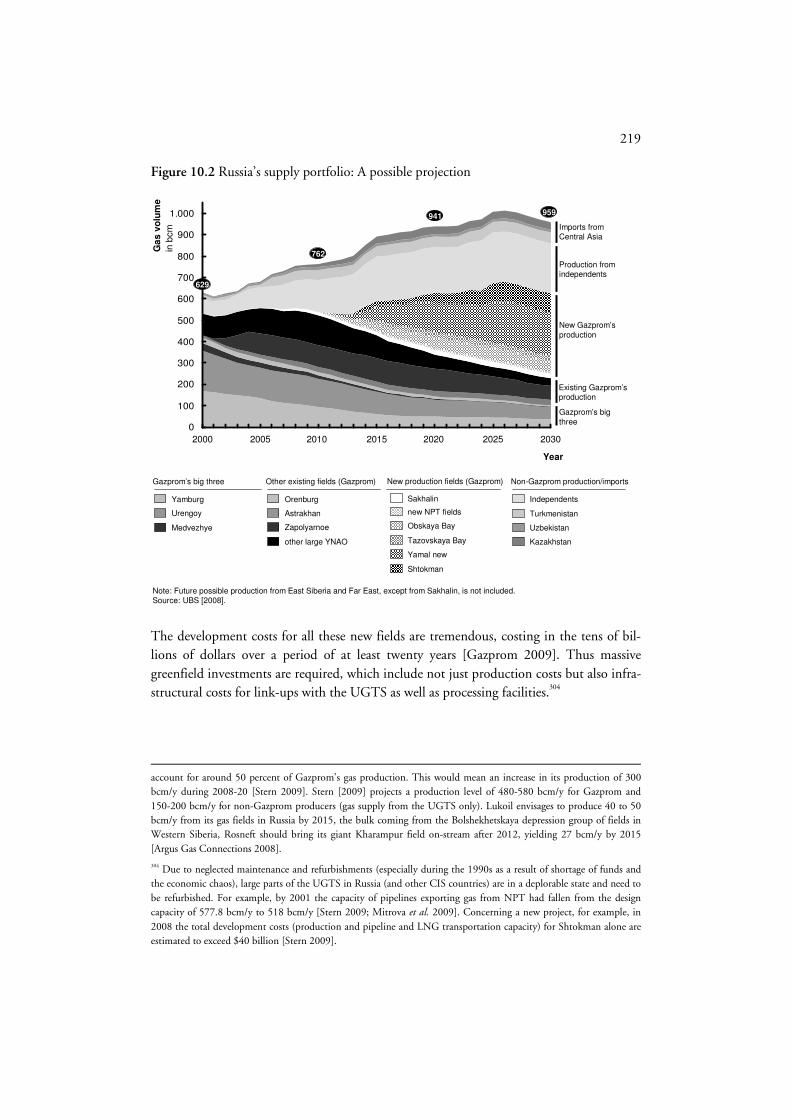
219
Figure 10.2 Russia’s supply portfolio: A possible projection
0
100
200
300
400
500
600
700
800
900
1.000
Year
Ga
s v
olu
me
in b
cm
2000 2005 2010 20202015 20302025
Imports fromCentral Asia
Production fromindependents
New Gazprom’sproduction
Gazprom’s big three
Existing Gazprom’sproduction
629
762
941 959
Yamburg
Urengoy
Medvezhye
Orenburg
Astrakhan
Zapolyarnoe
other large YNAO
Sakhalin
new NPT fields
Obskaya Bay
Tazovskaya Bay
Yamal new
Shtokman
Independents
Turkmenistan
Uzbekistan
Kazakhstan
Gazprom’s big three Other existing fields (Gazprom) New production fields (Gazprom) Non-Gazprom production/imports
Note: Future possible production from East Siberia and Far East, except from Sakhalin, is not included.Source: UBS [2008]. The development costs for all these new fields are tremendous, costing in the tens of bil-lions of dollars over a period of at least twenty years [Gazprom 2009]. Thus massive greenfield investments are required, which include not just production costs but also infra-structural costs for link-ups with the UGTS as well as processing facilities.304
account for around 50 percent of Gazprom’s gas production. This would mean an increase in its production of 300 bcm/y during 2008-20 [Stern 2009]. Stern [2009] projects a production level of 480-580 bcm/y for Gazprom and 150-200 bcm/y for non-Gazprom producers (gas supply from the UGTS only). Lukoil envisages to produce 40 to 50 bcm/y from its gas fields in Russia by 2015, the bulk coming from the Bolshekhetskaya depression group of fields in Western Siberia, Rosneft should bring its giant Kharampur field on-stream after 2012, yielding 27 bcm/y by 2015 [Argus Gas Connections 2008].
304 Due to neglected maintenance and refurbishments (especially during the 1990s as a result of shortage of funds and the economic chaos), large parts of the UGTS in Russia (and other CIS countries) are in a deplorable state and need to be refurbished. For example, by 2001 the capacity of pipelines exporting gas from NPT had fallen from the design capacity of 577.8 bcm/y to 518 bcm/y [Stern 2009; Mitrova et al. 2009]. Concerning a new project, for example, in 2008 the total development costs (production and pipeline and LNG transportation capacity) for Shtokman alone are estimated to exceed $40 billion [Stern 2009].

220
10.3 The Russian gas sector
Oil and gas revenues in the Russian economy Oil and gas revenues are vital to the Russian state budget, as in all oil and gas producing and exporting countries. As Gaddy and Ickes [2005] note, energy rents in the days of the Soviet Union peaked in 1981 at 40 percent of GDP, sinking to an all time low through-out the 1990s due to low oil and gas prices, the privatisation process and the lack of a stable tax regime. Despite higher oil and gas prices in the period 2004-2006, the contribu-tion of oil and gas to the Russian GDP was only 9 percent in 2006 (according to Russia’s official statistics). However, assuming nominal prices of energy in Russia, it would have contributed almost 20 percent of GDP in 2006 [World Bank 2007]. In 2006, the contri-bution of the gas industry to Russian GDP was 8-9 percent [Stern 2009]. Energy products accounted for 62.7 percent of Russia’s exports in 2006 ($189.2 billion in 2006, compared to $28.2 billion in 1998) and about 50 percent of its tax revenues. More specifically, pe-troleum products accounted for 46.8 percent of the total merchandise exports in 2006, whereas gas accounted for 14.2 percent.305 Other energy products, e.g., coal and electricity, accounted for only 1.8 percent of the total export revenues [CASE 2008]. Thus, oil reve-nues still account for the most important contribution to Russia’s energy incomes, whereas export revenues from gas are becoming comparatively more important. Figure 10.3 Gazprom’s sales and revenues in different markets in 2008
* In European bcm.** Excluding excise tax and customs duties. Source: Gazprom’s databook 2009.
RevenuesVolumes
Russia
Europe
100% = 511 bcm* 100% = RUR2728 bln**
CIS/Baltic states
51%
32%
17%
18%
14%
68%
305 Gazprom provides for around 20 percent of federal budget income and total currency earnings from foreign trade [Zhiznin 2007]. In 2007, Gazprom’s income ($93 billion) came to 7 percent of Russia’s GDP [Nemtsov and Milov 2008].

221
Russia is nowadays dependent on Europe for its gas exports, from which it earns hard currency income. During the last years, Gazprom accounts for almost a third of overall government revenues [Goldthau 2010]. Prices in the Russian domestic market and mar-kets in most CIS gas markets are regulated at relatively low price-levels, perhaps reaching export parity by 2011-2012 (see below). The result is that Gazprom’s sales and revenues differ immensely by export market sold, with European exports yielding 68 percent of its actual revenues in 2008, while these volumes themselves only account for a dispropor-tional 32 percent of the total volumes sold (see Figure 10.3). Conversely, domestic Rus-sian sales accounted for a mere 18 percent, while these volumes account for the remaining 51 percent of exported volumes. Note that the Baltic countries and some CIS countries pay already European-level gas prices. Current institutionalisation In order to try to balance earnings from the oil and gas sectors and the differences between CIS and European gas market, the Russian leadership under Putin intends to employ an integrated long-run energy strategy.306 Upon observation, one can discern that Russia has come to see gas as a spearhead for its long-run economic development. The lack of control exercised during the politico-economic crisis of the 1990s (see also Part II) led Putin to restore some measure of order through state-centred reforms, returning Russian society to a state of relative stability, see also Chapter 3 [Åslund 2007]. The reorganisation of the gas industry during the 1990s and Putin’s restructuring in-cluded a shift from the planned production system of Gosplan to a more market-based, profit-maximising system, embodied by Gazprom [Stern 2005]. In order to ensure a stable and reliable revenue stream from its natural resources, the Russian government has since 2004 increased state control over and ownership in its energy sector around national champions.307 The higher oil prices (due to stricter OPEC production policies towards the end of the 1990s) ensured the inflow of greater of export revenues, which led to a partial implementation of policies [Åslund 2007].
306 For a historical overview of the institutionalisation of the Russia’s gas sector, see Part II. In Putin’s dissertation (‘Strategic Planning of Replacement of Regional Mineral Reserves in Conditions of Forming Market Relations’), Putin argued already that the transfer of control of Russian strategic sectors, such as oil and gas, to private owners was a costly mistake. This experience from the nineties should be reversed – not necessarily by re-nationalisation. For Russia, from Putin’s point of view, the mixture of state-private ownership has to be the best solution for strategic companies, so that the state can regulate these sectors. According to his dissertation, Russia should welcome foreign investors for their knowledge and financial resources [RusEnergy 2005].
307 One of the most prominent cases was the arrest and conviction of Yukos’ chief executive Michael Chordorkovski. This led to the dismantling of the Yukos’ Empire. Moreover, Russia had limited the access to its resource for interna-tional energy firms [Fredholm 2005].

222
Figure 10.4 Shareholder’s structure OAO Gazprom in 2000 and 2008
* The Russian Federation is represented by The Federal Agency for federal property management (38.373%); statecompany OAO Rosneftegaz (10.74%); and OAO Rosgazifikatiya (0.889%).Source: Gazprom [2001]; and Gazprom [2009].
Shareholder’s structure OAO Gazprom
31 December 2000
Shareholder’s structure OAO Gazprom
31 December 2008
Russian
Federation*
ADR
holders
Other registered
persons and entities
50.002%
22.15%
27.848%
Russian
Federation
Russian
companies
Individual
Russian
citizens38.37%
33.64%
17.68%
Non-Russian
companies
10.31%
It is in this light that the creation of national champions was an effort, in the first instance to halt further asset stripping and embezzlement, and in the second place to reverse the overall trend of decentralisation which had set in under Yeltsin (see also Chapter 6).308 Russia’s national energy firms are Gazprom in the gas sector and Rosneft and Lukoil in the oil sector. The Kremlin has also tried to assert greater control over the oil industry via Gazprom, and thus forming Gazprom into a national energy firm [Victor 2008]. These state-controlled companies can be used by the state as an instrument of internal and exter-nal policies [Ministry of Energy of the Russian Federation 2003]. Decentralisation during the 1990s was felt especially in the oil sector, while the gas sector remained centralised with a large minority Russian government stake, changing little between 1993 and 2004.309 Putin had set out to strengthen the government’s control over Gazprom in an apparent conviction that privatisation and free market capitalism in key Russian sectors was not in Russia’s national interest. In addition, Gazprom argued that any degree of vertical separation would erode its economies of scale and the functioning of the entire production, transport and distribution system [Mitrova 2009]. With the new stake of 50.002 percent in the vertical-integrated company as of late 2005, the Russian Federation now had direct control of its operations and its management (see also Figure 10.4). The vision emerging in 2004 was that Gazprom should become a multinational oil and gas
308 However, Gazprom continues to spend its money in a questionable fashion by taking stakes in non-core businesses and selling some entities below market value [Hartley and Medlock III 2008; Nemtsov and Milov 2008]. Additionally, Putin established another way to ensure substantial incomes for members of government (and top managers in Gaz-prom) via secondary positions, besides their main (governmental) position [Business week 2009].
309 The ownership of the company changed remarkably little during this period, while Russian legal entities owned a further 35 to 40 percent, Russian individuals, including employees owning 15 to 20 percent and foreigners between 10 and 12 percent [Goldman 2008]. Former Gazprom’s CEO, Vyakhirev, however, was not in full control of the com-pany and significant asset stripping weakened the company as Gazprom executives established their own little empires at the expense of the company (see Part II).
223
company, representing interests of the government both domestically and internationally [Stern 2005]. Becoming a multi-market player is thus one of Gazprom’s purposes, and indeed, that of the Russian government [Gazprom 2009; Ministry of Energy of the Rus-sian Federation 2003; Fredholm 2005].310 Ultimately, merging Gazprom and Rosneft into one single very large national energy firm would have been the first step in giving this national energy firm a position in the international oil market as well as the interregional gas market. Yet, this step has not been taken.311 Gazprom as a firm must take into account Russian government priorities as well as make decisions in the interest of its business continuity. From a government perpective, Gaz-prom can be an engine for maximising social wealth by utilising gas revenues for fuelling domestic economic growth and diversity, padding the government budget and the stabili-sation fund. Developing a gas-based industry (in order to diversify its economy) may also shape Russia’s domestic gas strategy and policy. Maintaining relatively low regulated gas prices in Russia will like wise play a role. From a corporate perspective, Gazprom’s role consists of maximising (windfall) profits from domestic, CIS, and other export markets. Since 2006, Gazprom officially attained an export monopoly over the gas flows from Rus-sia to its foreign markets.312 Russia’s challenge in devising a gas strategy as is to balance and control a set of interlocked agents of which Gazprom is but one of several agents. Without the independent gas producers and the Central Asian producers (Turkmenistan, Kazakh-stan and Uzbekistan) and in the future possibly Azerbaijan, Gazprom may probably not fulfil its export obligations to Europe. Decision-making process within the gas sector Increasingly since Putin came into power, Gazprom’s strategy became an important prior-ity of Russia’s government. ‘Gazprom became the first business structure in which Putin by deliberate plan seized the commanding height’ [Nemtsov and Milov 2008, p. 4]. On a strategic level within the Russia’s gas industry, decision-making is very centralised, and
310 The strategic goal of OAO Gazprom is: ‘becoming a leader among global energy companies by conquering new markets, diversifying business activities and pursuing supply security.’ [Gazprom 2009]. At the same time ‘The main aim of the Russian Energy strategy is strengthening of competitive positions of the Russian energy industry in the world market.’ [Ministry of Energy of the Russian Federation 2003; Zhiznin 2007].
311 In 2005, the Gazprom-Rosneft merger was abandoned due to the complexities in the financial architecture of the transaction and resistance from Rosneft management and their sponsors within the government [Stern 2005].
312 In June 2006, the Russian Duma officially granted Gazprom an export monopoly, i.e., the exclusive control over gas exports from Russia. This gives Gazprom complete control over exports, naturally, and forbids any access by foreign rivals to its pipeline network. The Duma voted on legally solidifying a “single export channel for gas exports,” as the Duma Energy Committee said in a public explanatory note, because “gas should be considered a strategic raw material and therefore should be exported through a single export channel to protect the national interest.” [Platts International Gas Report 2006]. For Russian gas sales in CIS and Baltic states, besides Gazprom’s sales, some intermediaries also have supply contracts. In respect to Russia’s LNG sales, Gazprom has not the exclusive control over exports; see for example Sachalin I.

224
largely influenced by the government [Mitrova 2009]. As mentioned by Mitrova [2009], Gazprom operates in many ways as a ‘quasi-ministry’, like it was during the Soviet times. In principal, the administration of the Russian Federation (including the Kremlin) is re-sponsible for strategic decision-making. The administration is led by the president (cur-rently Dimitri Medvedev), which in turn is advised by the Presidential Secretariat. The Prime Minister’s Cabinet and relevant ministries, Duma and the Senate, influence this process, as well as members of Gazprom’s management board.313 Gazprom is largely res-ponsible for the implementation of Russia’s gas strategy. The chairman of Gazprom’s board of directors, Viktor Alexeevich Zubkov, is also the first Deputy Prime Minister of Russia.314 Informal links between the different governmental and corporate bodies, such as between the president and the Prime Minister (Medvedev and Putin respectively), make the process of decision-making comparatively opaque. Figure 10.5 gives an approximated overview of Russia’s decision-making in the gas industry.315 Figure 10.5 Approximated schematic schedule of the decision-making process in the Rus-sian gas industry
President
Administration of the Russian Federation*
50%†
Foreign partners††
Large gas projects
* Including Presidential Administration (Kremlin).** For all intents and purposes, also first Deputy Prime Minister.† 50.002 percent, see also Figure 10.5.†† For example: Royal Dutch Shell; E.ON Ruhrgas; ENI; Wintershall; Total; and StatoilHydro. Source: own analysis, based on company interviews; Gazprom information.
Share of state in entity
Chairman of the board of directors**
Gazprom
Presidential Secretariat
Prime Minister’s Cabinet
Duma Senate
Foreign participation in Russia’s gas sector
313 A large number of people working at Gazprom are part of Putin’s network.
314 The role of Sechin (Deputy Prime Minister and chairman of Rosneft’s board of directors) is relatively more impor-tant for decision-making within the oil sector.
315 This overview is designed to provide a simplified, perhaps even oversimplified impression of decision-making in the Russian gas sector. Informal and formal forces may also be at play to such an extent that it is beyond the scope of consideration for this study.

225
After the dissolution of the Soviet Union and the first years of transition until mid-1990, the Russian energy sector became relatively open for foreign investors, especially the oil sector.316 The gas sector remains largely centralised. However, some gas fields were devel-oped by foreign companies, such as Royal Dutch Shell, Mitsui and Mitsubishi in Sakhalin II (founded in 1994) and BP via TNK-BP (founded in 2003) in the Kovytka field. A number of foreign companies met difficulties and had to reduce (e.g., Royal Dutch Shell in Sakhalin II) or even cease their activities in Russia. The traditional form of foreign par-ticipation in development gas fields was subject to conditions specified in PSAs. Under Putin, the priority has been given to other contractual forms, particularly to public-private partnership (PPP), which is a means of better organising the development of resources under conditions determined by the state.317 In most of the large fields, Gazprom has a majority stake for strategic reasons [Zhiznin 2007; Mitrova 2009]. These foreign participa-tions are often part of a broader cooperation through vertical asset swaps (see below). Co-operation with major foreign corporations is desirable in terms of their large financial and technological potential and corporate experience [Zhiznin 2007; Stern 2005].318 The most important foreign partners, in addition to the above-mentioned companies, with stakes in the Russian gas sector are BASF/Wintershall, ENI, E.ON Ruhrgas, Total, ExxonMobil, Sakhalin Oil and Gas Development Corp. (SODECO), Indian Oil and Gas Corporation (INGC) and StatoilHydro [Zhiznin 2007; Mitrova 2009].
10.4 Domestic gas needs and strategy
Russia’s primary energy mix in 2008 (684.6 Mtoe) was composed as follows: 55 percent of gas, 19 percent of oil, 15 percent of coal, 5 percent of nuclear and 6 percent of hydro-power [BP 2009].319 Russia is thus a major gas consumer, where domestic demand in Rus-sia takes up almost three quarters of Russian production, see Figure 10.1 [IEA 2009]. Russian per capita consumption of gas is similar to that in Canada, but consumption per US dollar of GDP is roughly five times higher than IEA countries [IEA 2007], hinting at vastly less efficient consumption in Russia. Due to TPA and sales restrictions, oil compa-nies have to flare significant volumes (estimates are around 15-50 bcm/y or even more) [Stern 2005; Stern 2009]. Russia’s economic growth (when measured by GDP from 1999 until the economic crisis in 2008: 5-8 percent per annum), combined with relatively low, subsidised domestic prices resulted in a high gas demand [Stern 2009]. Gas prices are subsidised in order to provide Russian industrial and residential consumers with some
316 For an extensive overview of foreign participation in Russia, see for example Zhiznin [2007], Stern [2005; 2009] and Part II.
317 In addition, many of these PSAs were implemented solely by foreign partners [Mitrova 2009]. See also Van der Linde et al. [2007] for an overview of PPPs in Russia.
318 Another way to attract foreign investments is the (international) capital market though initial public offering (IPOs). Gazprom’s removal of limiting foreign shareholders in 2006 has resulted in a tenfold rise in market value (to more than $250 billion) [Mitrova 2009].
319 For an extensive analysis on the Russian gas strategy within Russia and CIS, see for example Pirani et al. [2009], Stern [2005], IEA [2008].
226
leeway. In addition, low gas prices have forced other fuels out of the power generation and industrial sectors, the share of gas in Russia’s grew from 43 percent in 1990 to 55 percent in 2008 [BP 2009]. The Russian gas market itself is in transition. During the 1990s, in the aftermath of the collapse of the Soviet Union and the economic chaos that ensued, demand for gas in Rus-sia fell substantially. With the Russian financial crises in 1993 and 1998, demand fell even further and the Russian domestic gas market was plagued with a default of payments by customers, both in the residential and industrial sector [Stern 2005; 2009]. After 1998, when the Russian economy picked up again owing in part to a devalued Russian rouble, gas demand began to rise to pre-1991 levels (from 418.2 in 1991, to 352.8 bcm in 1999 and 420.2 bcm in 2008) [BP 2009]. With the onset of the 2008-2009 financial and eco-nomic crisis, Russian domestic demand significantly dampened [WGI 2009b]. Stern [2009] projects a domestic demand of 385-440 bcm in 2015. Gazprom supplied Russia’s domestic market with 260 bcm, see Figure 10.3 [Gazprom 2009]. Further downstream, Gazprom holds ‘blocking-stakes’ in more than 70 percent of gas-distribution plants [Mitrova 2009]. The independent gas producers fulfill other do-mestic demand, although Gazprom is increasingly trying to control the Russian gas sector [Hartley and Medlock 2008].320 Deliveries from the independent gas producers are almost entirely concentrated in the power and industrial sector and are not delivered to residential customers or even distribution companies [Stern 2005]. Of Gazprom’s sales in 2008, the largest shares went to non-household sectors: 32.5 percent went to power generation, 16.8 percent to the utility sector and much of the remainder to the industry sectors. Russian household consumers were responsible for 16.8 percent of the total Gazprom’s sales in Russia [Gazprom 2009]. In the face of high domestic demand until recently, the difficulty for Gazprom has been to develop the required infrastructure to accommodate flows from the independent gas producers without running the risk of seeing empty pipelines long before they have been amortised [UBS Investment Research 2008]. Nevertheless, the in-dependent gas producers provide Gazprom with the opportunity to share the investment burden. A growing share of gas investments in Russia is expected to come from the inde-pendent gas producers, contingent upon them gaining access to Gazprom’s transmission system [IEA 2008c]. In 2006 the Russian gas exchange (Mezhregiongaz) was launched with the aim of liberalis-ing the Russian gas market and introducing market principles in the traditionally state centred Russian energy supply system. The volumes traded thus far are only at experimen-tal levels not exceeding 10 bcm in 2007 (less than 2 percent of gas sold in Russia) and
320 For example, in 2006, Gazprom purchased a 20 percent stake in Novatek and had established ‘strategic partnerships’ with Lukoil and Rosneft [Hartley and Medlock 2008].

227
constitutes thus only a small step towards liberalisation [Stern 2009].321 The liberalisation allow Gazprom and the independent gas producers to sell on spot terms when prices are well above those set for the domestic market and securing the independent gas producers’ access to the pipeline network.322 In addition, with the proper legislation and tax structures in place, it is possible to provide an incentive to the independent gas producers to develop non-strategic fields, channelling the volumes to foreign markets through Gazprom. Gazprom in turn could then be in charge of maximising the value of these volumes and distributing the resulting added value to the independent gas producers as a means of sharing the risks and benefits.323 The pro-posal for this mechanism has been put forward to the Russian Duma [CIEP 2008].324 The currently relative low domestic gas prices contribute to the overall importance of energy for the Russian economy, manifested in the national accounts, distorting efficiency incentives and discourage investment in Russia’s gas sector [Åslund 2007; Gazprom 2008a].325 Long demanded by the IMF, WTO and EU, in November 2006, the Russian government took the decision to gradually increase regulated gas prices (with a difference between the industrial and household prices), so that by 2011 they will reach export parity with Europe, excluding transmission costs and customs duties [Stern 2009; Gazprom 2008].326 According to Stern [2009], this policy will have some important consequences:
• sales of gas from the relatively more expensive new fields (such as Yamal) could be profitable on the domestic market;
• there will increasingly be an incentive for (particularly independent) producers to maximise its production and sales for the domestic market;
321 A gas exchange (or hub) will allow gas prices to float as they do on European hubs, properly reflecting demand and supply conditions. The amounts of gas exchanged should reach 15 bcm by the end of 2008 [Platts International Gas Report 2007].
322 Initial 2006 deals indicated an average price of $60/mcm, or $1.70/Mbtu, compared with the average domestic price of $1.25/Mbtu, reflecting the willingness of some industrial consumers to pay more for volumes than state-regulated prices for volumes beyond those provided by Gazprom on a long-term basis [WGI 2008b]. Besides the introduction of spot sales, long-term contracts for industrial customers were introduced. Gazprom insists that the general scheme on the country’s gas sector development until 2030 should be adopted before the implementation of regulations on non-discriminatory, third-party access for independent gas producers to the pipeline system [WGI 2009b].
323 Indeed, Russia’s FAS has been instructed by the cabinet to amend the Gas Export Act in order to enable Gazprom to share export profits with the independent gas producers [Kommersant 2008].
324 Gazprom has invested heavily over the last few years to expand the Urengoy transportation system to enable the independent gas producers to boost output from the region’s fields [UBS Investment Research 2008].
325 During the 1990s the gas sector moved away from a principle of ‘cost-plus’ pricing to de facto ‘price-cap’ regulation [Mitrova 2009].
326 See Table 2.9 in Stern [2009, p. 74] for the estimated average Russian gas prices from 2007 to 2011. The approach of relatively gradual and controlled increases aims to support the government’s general anti-inflationary policy, includ-ing tight monetary supply [Mitrova 2009].

228
• investments in efficiency and energy saving will be more profitable;327
• In the longer-term, a netback parity with West European prices would make the domestic Russian market more attractive than exports (due to additional trans-port costs).328
Russia’s export potential is thus directly linked to domestic developments not only in terms of domestic Russian prices but also Russia’s primary energy mix. The most impor-tant domestic concern of the Russian government is ensuring that domestic demand in Russia is met first, and Gazprom as an agent of the state, is tasked with a public service obligation in this respect. This is a political as well as an economic priority for the Russian government [Gazprom 2007]. Relatively high gas prices, e.g., by mid-2008, but also the current economic downturn could delay the current scheme of gradual price gas increases [Stern 2009]. 10.5 Gas export ambitions and strategy
During the late Soviet times, Russia was dependent on Europe as a hard currency-earning market, while providing its CMEA and Soviet allies with cheap, subsidised energy.329 Gaz-prom’s current exports should be seen as split into European and CIS exports. Within Europe, one can distinguish former CMEA countries and West European countries and Turkey. Russia benefits not only from its location and the size of its resource base, but also from its status as the key incumbent in Europe, where it can affect the supply-demand balance such that it can have knock-on effects in the Atlantic LNG basket [Baker Institute 2005; IEA 2007]. As mentioned above, Russia has, at the political level as well as in the commercial sense, more global ambitions. Specifically for its export markets, Gazprom aims to [Zhiznin 2007]:
1) secure its present market position in price and volume terms; 2) enter new regional markets, such as Asia-Pacific and the US market by pipeline
and LNG exports; 3) evolve new business models of sales, such as self-contracting and integrate verti-
cally by controlling storage and downstream activities closer to the market; 4) explore short-term contracts and spot trade in Europe; 5) minimise its reliance on troublesome transit countries such as the Ukraine and
Belarus330, collect debt from and increase the profitability in its CIS export mar-kets;
327 Mitrova [2009] suggests a rule of tumb for the power sector that gas-saving measures will become economically justified when prices are above $100/mcm.
328 From Russia’s governmental point of view, exports to the foreign markets, however, are still more attractive to Russia (as a government), due to export duty revenues (30 percent on exported gas), except for the member of the Customs Union (Russia, Belarus and Kazakhstan) [Mitrova 2009]. Nevertheless, in the short-and mid-term, import prices of Central Asian gas are expected to be higher than Russia’s domestic prices [Stern 2009].
329 For a historical overview of Russia’s export strategy, see Part II, Stern [1999; 2005].
330 Some 80 percent of Russia’s gas exports to Europe now travel through the Ukrainian network.

229
6) ensure that it remains the only economically viable transit route to Europe for Caspian gas; and
7) developing upstream exploration and production opportunities in other coun-tries.331
The diversification of Gazprom’s export activities is schematically portrayed in Figure 10.6.
Figure 10.6 Diversification of Gazprom’s export activities
(New) LNG facilities
(New) pipeline facilities
Export markets Level of market penetration
Types of contracts
Gazprom’s gas sources
Diversification of Gazprom’s export activities
• Own produced gas
• Gas produced by JVs with Gazprom (in and outside Russia)
• Gas from IGPs
• Gas from the Caspian region
• Ukraine transit
• Direct connections to CIS/Baltic/Finland
• Yamal-Europe
• Blue Stream
• Nord Stream*
• South Stream*
• Altai pipeline*
• Sakhali-Khabarovsk-Vladivostok pipeline*
• Far East pipelines*
• Sakhalin
• Shtokman*
• (Yamal)*
* Under construction/committed or planned/proposed. Source: own analysis, based on RPI [2005].
• CIS countries
• Europe
• Asia-Pacific
• North America*
• Wholesale gas sales
• Midstream activity
• Gas sales to end-users (f.e. Gazprom M&T)
• Long-term contracts
• Short-term contracts
• Spot sales
10.5.1 Near abroad: export to CIS markets
Gazprom’s gas sales in the CIS were 83 bcm in 2008 [Gazprom 2009].332 Most of the CIS sales is concentrated in Russia’s transit countries: Ukraine (61 percent) and Belarus (23 percent). Other less important export markets are Kazakhstan (10 percent), Moldova (2 percent), Armenia (2 percent) and Georgia (1 percent) [Gazprom 2009]. Although the energy mix differs by CIS country, gas is an important contributor to their energy needs. The share of gas in the Ukraine’s energy mix is more than 40 percent, whereas in the case of Belarus this is almost 70 percent [BP 2009]. These CIS countries are heavily dependent on Russia’s (and other CIS’s) imports [Pirani et al. 2009]. Gazprom’s strategic challenge in the CIS is about how to govern the increasingly complex interdependent relationships with three groups of countries in an effective way:
331 Additional aims of Gazprom, although less related to its export strategy, are (1) lower dependence on import equip-ment and services, and (2) attracting foreign investments [Zhiznin 2007].
332 Excluding the Baltic states. See Pirani [2009] for an extensive overview of CIS gas strategy.

230
1) Central Asian countries and Azerbaijan, on which Gazprom’s dependence for key gas supplies could rise, as well as countries which one in some cases necessary for transit purposes (see below);333
2) Caucasus countries where it had to compete with gas flows from Azerbaijan and Iran [Tokmazishvili 2009; IEA 2008c];
3) Ukraine, Belarus and Moldova where Gazprom will be selling gas as well as need-ing territory to ship gas to Europe (from Central Asia as well as Russia). Gazprom has a problematic transit relation with a number of CIS countries, which has led to various disputes (such as in 2006 and 2009) [Stern 2005; Mitrova et al. 2009].334
As the 2000s unfolded, several important developments in addition to a change in man-agement saw Gazprom take CIS gas trade back under its control. This includes moving away from barter and trading intermediaries (which sold gas from Central Asia and Rus-sia) [Pirani 2009]:
• a change in Gazprom’s supply position led to a corresponding rise in the strategic value of Central Asian gas in its future supply portfolio, although it becomes more expensive; and
• the economic recovery of CIS economies, combined with Gazprom’s new geo-economic framework (see Section 8.2), raising Russian prices and higher import prices from Central Asia, leading to a new commercial framework: more profit-ability and increasing export prices to the principal of European netback pricing [Stern 2005; Mitrova et al. 2009; Yafimava 2009].335
Due to the maturity of CIS markets, the desire to reduce its dependency on Russian gas and its increasing convergence to European gas price, in terms of volumes, there are rela-tively small market opportunities in CIS markets from Russia’s perspective.336 On the one hand, Gazprom is attempting to secure and maintain market share by buying equity in large gas consuming components of the value chain, such as transport, power and indus-
333 Russia’s strategy towards the Caspian region changed during the period after the collapse of the Soviet Union (see also Part II). During the 1990s, Gazprom replaced gas (barter) trade between Turkmenistan and other CIS countries (mainly Ukraine) by intermediates, like Itera. These middlemen companies captured most of Central Asian resource rents. As a result of increasing competition, combined with the strategic importance of Caspian production for Gaz-prom’s gas supply portfolio, Gazprom changed its strategy to a more commercial relation [Victor et al. 2006; Stern 2005].
334 See Part II and Case 4 in Chapter 11 for a (historical) overview of Russia’s transit relation with and its policy to-wards Ukraine, Belarus, and Moldova.
335 In addition, the Russia-Ukraine gas disputes (in 2006, 2008, and 2009) have accelerated European netback price implementation for Ukraine [Mitrova et al. 2009]. However, avoiding vulnerability to disruptions of Gazprom’s supplies to Europe in transit through the western CIS and geopolitical considerations may delay the implementation of its netback policy in the western CIS [Pirani 2009].
336 Although it is difficult to predict, Stern [2009] estimates similar volumes (75-85 bcm in 2015), excluding Azerbai-jan and Kazakhstan, to those of the mid 2000s.

231
trial enterprises.337 On the other hand, it may want to keep its current contractual flexibil-ity (e.g., Gazprom’s current volume contract with Ukraine need to be signed every year) as a tool of managing Gazprom’s supply portfolio [Parani et al. 2009].338 Figure 10.7 Gas prices for Gazprom’s gas in different markets: 2003-2008
0
50
100
150
200
250
300
350
2003 2004 2005 2006 2007 2008
Year
Average
gas price
In US$/mcm
51
269
111
Note: Average exchange rate RUR/US$ in 2007: 25.6; and in 2008: 24.8. Source: Gazprom’s databook 2007; Gazprom [2009].
42
262
89
36
192
61
29
138
47
22
132
44
Russia
Europe
CIS/Baltic states
67
313
149
As far as Gazprom’s export markets are concerned, prices differ immensely by market (see Figure 10.7). As mentioned above, prices in Russia itself are regulated, and amounted to $67/mcm in 2008. CIS and Baltic prices were $149/mcm on average, while European prices stood at $313/mcm [Gazprom 2009]. Much of these price differences are attribut-able to the path-dependency aspects of a transition from Soviet-era gas pricing and subsi-dies to the current, more market oriented setting (see Part II).
10.5.2 Far abroad: export to European markets
Gazprom’s supply to Europe has increased by around 73 percent between 1990 to 2008. The sales to Western Europe (including Turkey) have more than doubled, with a rela-tively sharp climb since 2002 (almost 5 percent per year growth). This is not the case for Central and Eastern Europe, where Gazprom’s gas sales increased by only 1 percent be-tween 1990 to 2008. The total sales of Gazprom in Europe were 170 bcm in 2008. In Western Europe, Germany (34 bcm), Turkey (21 bcm), Italy (20 bcm), the UK (19 bcm), France (10 bcm) were the largest European markets for Gazprom. In Central and Eastern
337 For example, it has taken equity stakes in Armenian, Kazakh, Moldovan and Belarusian transportation assets [Mi-trova et al. 2009].
338 Gazprom’s contract with Belarus will end in 2012 [Yafimava 2009]. The ‘commercialisation’ of Russia’s trading relation with western CIS countries could, however, entail long-term contracts [Pirani 2009].

232
Europe, Hungary (8 bcm), Czech republic (7 bcm), Poland (7 bcm) and Slovakia (6 bcm) are also significant markets for Gazprom. Figure 10.8 shows the development of Gaz-prom’s gas sales in Europe form 1990 to 2008, whereas Figure 10.9 gives an overview of Gazprom’s sales and markets share per country.
Figure 10.8 Export volume of Gazprom to Europe: 1990-2008
* Including Turkey.** Including Baltic and Balkan countries.Note: in European bcm’s.Source: own analysis, based on Gazprom annual reports and Stern [2005].
0
25
50
75
100
125
150
175
1990 1995 2000 2008
Year
Gas volume
in bcm
2005
73%
Central and Eastern Europe*
West Europe*
170
145
119110
98
xx
x%
Export volume in bcm
Export growth 1990-2008
From a Russian point of view, the European gas market as a whole can be fallen into four different categories, or sub-regions: SSEE, NWE, North and Northeastern Europe (NNEE) and other Central and Eastern European (CEE) countries.339 Each of these differ-ent sub-regions exhibits different gas use intensity, depends to differing degrees on Russian gas and each region has its own infrastructural level of development. As a result, Russian gas plays a disproportionally large role in terms of share and end-usage in a number of countries. Some of these countries may try to curb their dependency, which implies a decrease or limit of Russian gas imports. Figure 10.9 includes Gazprom’s market share in total gas consumption and in power generation. The absolute values of Gazprom’s market shares are greater in countries of Western Europe than in Central and Eastern Europe. In Germany and Italy, for example, Russian gas enjoys a larger market share but on average, in terms of power generation, the share is actually quite small (expect from Turkey). Both countries’ gas markets may be heavily reliant on Russian gas, but in power generation
339 Southwest European countries (including Spain and Portugal) could not be reach economically by pipeline with Russian gas. In the future, Russian LNG might be shipped to this region. For instance, in October 2009, Gazprom and Spanish oil and gas company Repsol have signed a MoU on cooperation in oil and gas projects [RIA Novosti 2009].
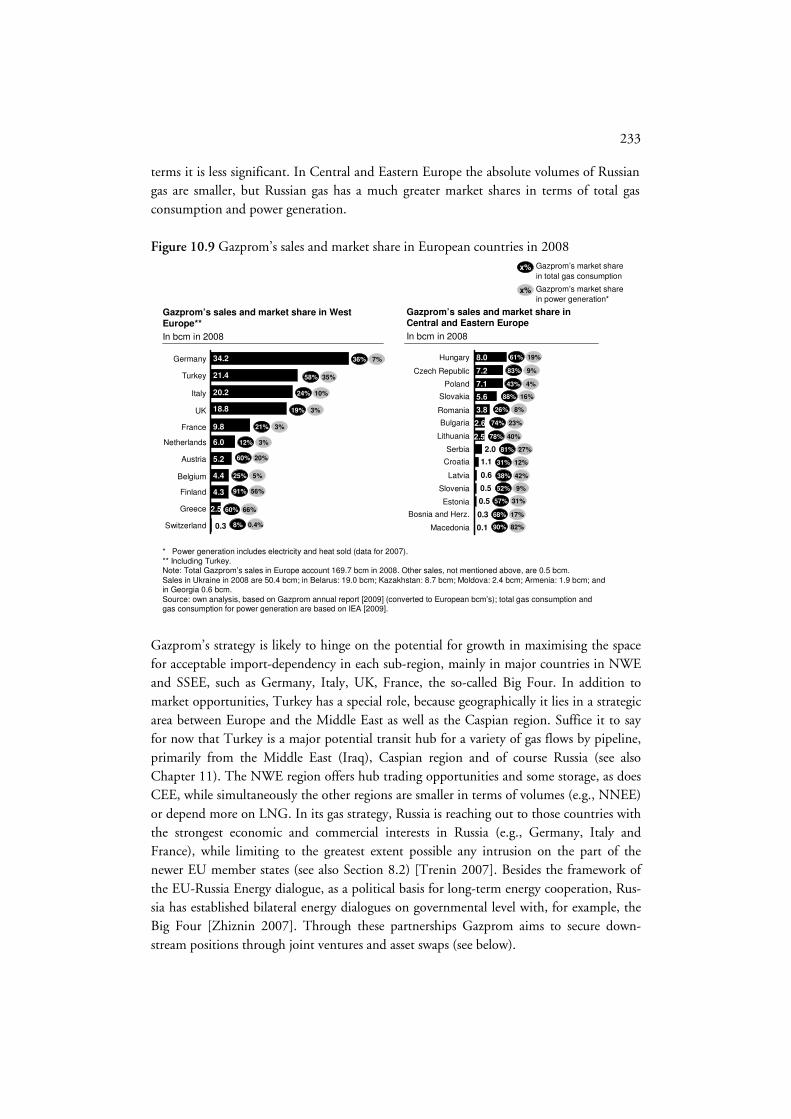
233
terms it is less significant. In Central and Eastern Europe the absolute volumes of Russian gas are smaller, but Russian gas has a much greater market shares in terms of total gas consumption and power generation.
Figure 10.9 Gazprom’s sales and market share in European countries in 2008
* Power generation includes electricity and heat sold (data for 2007).** Including Turkey.Note: Total Gazprom’s sales in Europe account 169.7 bcm in 2008. Other sales, not mentioned above, are 0.5 bcm. Sales in Ukraine in 2008 are 50.4 bcm; in Belarus: 19.0 bcm; Kazakhstan: 8.7 bcm; Moldova: 2.4 bcm; Armenia: 1.9 bcm; and in Georgia 0.6 bcm. Source: own analysis, based on Gazprom annual report [2009] (converted to European bcm’s); total gas consumption andgas consumption for power generation are based on IEA [2009].
UK
Italy
34.2
Turkey
Germany
Gazprom’s sales and market share in West Europe**
In bcm in 2008
Gazprom’s sales and market share in Central and Eastern Europe
In bcm in 2008
21.4
20.2
18.8
9.8
6.0
5.2
4.4
4.3
2.5
0.3
36%
Finland
Austria
Netherlands
France
Switzerland
Greece
Belgium
Slovakia
Poland
8.0
Czech Republic
Hungary
7.2
7.1
5.6
3.8
2.5
2.0
1.1
0.5
0.3
0.1
Croatia
Serbia
Bulgaria
Romania
Macedonia
Bosnia and Herz.
Estonia
Slovenia
Latvia
Lithuania
2.6
0.6
0.5
x% Gazprom’s market share
in total gas consumption
x%
7%
58% 35%
24% 10%
19% 3%
21% 3%
12% 3%
60% 20%
25% 5%
91% 56%
60% 66%
8% 0.4%
61% 19%
83% 9%
43% 4%
88% 16%
26% 8%
74% 23%
78% 40%
81% 27%
31% 12%
38% 42%
52% 9%
57% 31%
68% 17%
90% 82%
Gazprom’s market share
in power generation*
Gazprom’s strategy is likely to hinge on the potential for growth in maximising the space for acceptable import-dependency in each sub-region, mainly in major countries in NWE and SSEE, such as Germany, Italy, UK, France, the so-called Big Four. In addition to market opportunities, Turkey has a special role, because geographically it lies in a strategic area between Europe and the Middle East as well as the Caspian region. Suffice it to say for now that Turkey is a major potential transit hub for a variety of gas flows by pipeline, primarily from the Middle East (Iraq), Caspian region and of course Russia (see also Chapter 11). The NWE region offers hub trading opportunities and some storage, as does CEE, while simultaneously the other regions are smaller in terms of volumes (e.g., NNEE) or depend more on LNG. In its gas strategy, Russia is reaching out to those countries with the strongest economic and commercial interests in Russia (e.g., Germany, Italy and France), while limiting to the greatest extent possible any intrusion on the part of the newer EU member states (see also Section 8.2) [Trenin 2007]. Besides the framework of the EU-Russia Energy dialogue, as a political basis for long-term energy cooperation, Rus-sia has established bilateral energy dialogues on governmental level with, for example, the Big Four [Zhiznin 2007]. Through these partnerships Gazprom aims to secure down-stream positions through joint ventures and asset swaps (see below).

234
Midstream: Cooperation in storage and export route diversification pipelines340 Gazprom’s Yamal-Europe, Blue Stream, Nord Stream341, and the newer planned South Stream342 pipelines are all ostensibly part of a strategy aimed at ensuring Gazprom’s market position in price and volume terms, as well as reducing reliance on Ukrainian transit. Notwithstanding some of the risks, miscalculations and costs, gas supplies through the Yamal-Europe pipeline have broken up Ruhrgas’ monopoly in the German market, while the Blue Stream pipeline helped establish a strong position in Turkey. The Nord and South Stream is aimed to ensure its market position at the NWE and, respectively, SSEE sub-regions. In addition, by having a combination of different export routes to the Euro-pean market, Russia can, in theory (and as Norway already does with its various pipelines), shift its volumes intra-regionally as and when spot and short-term prices shift, mitigate transit risks, and/or increase its bargaining position towards western CIS countries, see also Chapter 12. Additionally, the transit risks in western CIS countries could also be solved by taking ma-jority ownership stakes and/or by Russian ratification of the Energy Charter Treaty and its Transit Protocol. However, currently Ukraine refuses to allow Russia to have a controlling stake. Meanwhile, Russia refuses to ratify the Energy Charter Treaty (ECT) treaty due to (1) the current political climate between Russia and EU; and (2) it is seen in Moscow as a threat to Gazprom’s commercial interest [Pirani 2009]. Therefore, this governance system to mobilise investment is being reviewed in Russia (in addition by other stakeholders too), by treating foreign investments in its energy sector at its own sovereign discretion. As a result, in April 2009 Russia launched a new conceptual approach to a legal framework for energy cooperation. In July 2009, it subsequently decided to withdraw from the ECT, see also Van Agt [2009]. Another focal point for securing capacities in pipeline and storage is to create flexibility and arbitrage opportunities. Gazprom owns pipeline capacity in Germany via Wingas, in the Interconnector (10 percent) between Belgium and the UK and has an option on 9 percent in the BBL pipeline (from the Netherlands to the UK).343 Various countries in Europe have storage capacities, with Austria and Hungary being important focal points in
340 Gas transit and, in particularly, the strategic-economic role of pipelines and decision-making will be dealt with further in Chapter 11 and 12.
341 The offshore pipeline Nord Stream (2 times 27.5 bcm/y), connecting Russia directly to Germany via the Baltic Sea, will be linked to the UGTS in Russia, with the reserve base being the Yuzhno Ruskoye field and Shtokman. See Case study 3 and 4 in Chapter 11 for an extensive overview and analysis on this investment.
342 South Stream, with a planned capacity of 63 bcm/y up from the initially planned capacity of 31 bcm, is a planned and proposed pipeline running from Russia over the Black Sea to Bulgaria. Two possible routes are under review for South Stream’s onshore section from Bulgaria – one, northwestwards and the other, southwestwards. The resource base for the South Stream pipeline is likely to be the Urengoy field in West Siberia or Caspian reserves [Gazprom 2008; WGI 2009a]. See Case study 2 in Chapter 11 for an extensive overview and analysis on this investment.
343 In exchange for a 9 percent stake of Dutch Gasunie in the Nord Stream pipeline.

235
Central Europe and Germany and Benelux being focal points in NWE. Gazprom has commercial interests in both storage markets, mostly via Wingas. It is expected that Gaz-prom will develop more storage capacity in Europe.344 Sales strategy in Europe Having dealt with the volumes, more attention can be paid here to the actual Russian sales strategy in Europe in terms of long- versus short-term sales and vertical integration (i.e., business models). Gazprom’s export subsidiary ‘Gazprom Export’ is responsible for Gaz-prom’s exports. Based on Gazprom’s current long-term contractual agreements to Europe the export volumes are about 180-200 bcm/y in 2015 (minimum and maximum deliveries respectively), an increase of 10-20 bcm/y from 2008. Most of these current, additional contracts are related to the construction of the Nord Stream pipeline (see also Case study 3 in Chapter 11) [Stern 2009]. In Europe, Gazprom is currently in renegotiation of sup-ply contracts (e.g., the long-term contract with E.ON Ruhrgas) to the effect that mini-mum off-take obligations were lowered.
1) Traditional long-term take-or-pay contracts. Gazprom has historically sold gas to European consumers at their respective borders using netback pricing (linked to oil prices) in long-term take-or-pay gas contracts (with a duration of 20-30 years) with European mid-streamers (see also Part II) [Stern 2009]. Many of Gazprom’s contractual commitments have been signed in the 1980s and 1990s, some of which will continue well into the 2010s. Gazprom signed new long-term agree-ments with a number of countries in 2005-2007.345
2) Direct sales: Cooperation and (vertical) asset swaps. As a result of liberalisation in Europe, an effort can be seen on Gazprom’s part of to sell its gas further down-stream.346 As mentioned in Chapter 7, Gazprom’s downstream activities in Europe started through the creation of a joint venture with BASF/Wintershall (Wingas). The amount of gas sales of Wingas has increased significantly: from 3.4 bcm in 1995 to 27.4 bcm in 2008 (an average annual growth of more than 17 percent) [Wingas 2006; 2008]. Other joint ventures have been formed, for exam-ple, with Italian (ENI) and French (Gaz de France) companies, in order to sell gas directly in these markets [Zhiznin 2007]. In most of the cases, joint operation in
344 Storage is an essential tool in the gas value chain for handling (seasonal) variations in consumption. Demand is particularly high during the winters, while storage can be used during summers to pick up the stock in demand. Stor-age can come in the form of LNG storage tanks, ‘linepacking’ (storage in the pipeline itself), in underground caverns and in depleted gas fields or aquifers. In late 2008, Gazprom signed a MoU with Taqa to “pursue a partnership to jointly develop the Bergermeer gas storage facility” in the Netherlands. In addition, it will provide cushion gas to the Bergermeer gas storage project in the Netherlands. (Cushion gas refers to the gas injected into the underground storage facility to bring it up to operating pressure.) This is an interesting development since this would constitute an impor-tant storage joint venture with another national energy company in northwestern Europe [Platts LNG Daily 2008].
345 Long-term contracts have been signed with various European countries: Italy (until 2035), France (until 2031), the Czech Republic (until 2035), Austria (until 2027), and Germany, with four long-term contracts extended until 2035 for a total of 20 bcm [Gazprom Export 2008].
346 For an overview of Gazprom’s interests in various EU countries as of late 2007, refer to [Meijknecht 2008].

236
gas storages and transport routes to and within Europe (see above) and vertical as-set-swaps are part of this business model when it comes to cooperation with mid-streamers. Through vertical swaps, Gazprom has gained direct access to European markets by cooperating with European mid-streamers. Two cases stand out here: Gazprom’s swaps with partners in Germany centred on the Nord Stream pipeline and Gazprom’s cooperation with ENI from Italy centred on the Blue and South Stream pipeline. In both cases, Russian gas ends up on the German and Italian markets, ownership stakes are exchanged across the chain (also in Russia’s up-stream sector) and the parties involved share the profits.347 In addition to this model of cooperation, other business models of selling gas directly to European customers are: (1) wholly-owned greenfield operations or (2) M&As.
3) Direct sales: Greenfields. In one of the first steps of taking a foreign position out-side Russia, Gazprom set up the wholly-owned Gazprom Marketing and Trading (Gazprom M&T)348 in 1999. The focus of Gazprom M&T is to optimise the us-age of its capacities on the Interconnector pipeline as well as on leasing and natu-ral gas trade, involving spot–based sales and non-Russian gas. It is designed to fo-cus on its own trading activities in NWE on the NBP, Zeebrugge, Title Transfer Facility (TTF), and PEG hubs. Gazprom M&T sells gas to end consumers through subsidiary (retail) companies in the UK and France [Gazprom 2008]. According to Gazprom M&T [2009], Gazprom M&T’s gas sales increased from 1.2 bcm in 2003, to 4.1 bcm in 2005 and 25.1 bcm in 2008.
4) Direct sales: Acquisitions. Gazprom is attempting to secure and maintain market share by buying equity in power and industrial enterprises, which are large gas us-ers. This M&A strategy is mostly occurring in mature markets, while greenfields are likely to be explored in growth markets [De Jong 1989]. Due to Gazprom’s high market capitalisation a merger with a European mid- and downstream player seems not applicable (if desirable, only with international energy firms, such as BP or Royal Dutch Shell). Most of the past and current acquisitions are occurring in Russia and in Central and Eastern Europe, also in order to control its transit pipeline network. Gazprom is increasingly bidding for (retail) assets in Western
347 Wintershall (a subsidiary of BASF) is an important stakeholder in a joint venture with Gazprom, centred on the Siberian Yuzhno Russkoye gas field: Gazprom owns 51 percent, while Wintershall owns 24 percent in Serverneftegaz-prom (the Russian license-holder to the exploration of the Yuzhno Russkoye gas field) as well as 10 percent worth of no-voting right preferred shares. Wintershall is also engaged in the joint venture Achimgaz, in which Wintershall owns 50 percent and Gazprom the other 50 percent, an upstream venture in which Wintershall provides some of the techni-cal expertise. In exchange for its minority stake in Yuzhno Russkoye, they have agreed to increase Gazprom’s minority stake to 49 percent and to swap oil interest in Libya. The two partners will also take up a 50-50 percent share in Wingas Europe, a venture designed to market Russian gas in Europe at large, outside Germany [see also Case study 3 in Chapter 11].
348 Gazprom Marketing & Trading Ltd is a 100 percent subsidiary of ZMB GmbH, which is a 100 percent subsidiary of Gazprom Germania GmbH. Gazprom Germania is 100 percent owned by OOO Gazprom export, which is a 100 percent subsidiary of OAO Gazprom. The headquarter of Gazprom Marketing & Trading Ltd is based in London. Other 100 percent subsidiaries of Gazprom Marketing & Trading Ltd are Gazprom Marketing & Trading France SAS in Paris and Gazprom Marketing & Trading USA, Inc in Houston [Gazprom Marketing & Trading Ltd 2009].

237
Europe as well, for example in the UK [Argus Gas Connections 2007a]. In these markets, Gazprom is exploring both a strategy of horizontal and diagonal (e.g., the power and/or the oil sectors) integration.
From the schedule mentioned above, one can discern that Gazprom combines a long-term sales strategy with a short-term, optimisation-based one [CIEP 2008]. A possible gap may provide room for volumes through the renewal of potential long-term contracts and any volumes traded above that level can be traded on a short-term basis, either in the form of shorter-term contracts or on spot markets at hubs such as NBP, TTF and/or Baumgar-ten.349 In a seller’s market, as and when Gazprom increases its share on European hubs, Gazprom could push these prices upwards as it increasingly becomes a marginal supplier in shorter-term European markets [Komduur 2007].
10.5.3 Far abroad: export to the Far East markets
Russia aims to develop, export and integrate its eastern gas resources with those in western Siberia by means of extensive greenfield investments.350 The Far East also encompasses Northeastern China (Manchuria) and Japan as well as the Koreas. According to Stern and Bradshaw [2008], the gas market in East Siberia and the Far East is expected to grow to 27 bcm in 2020 and 32 bcm in 2030, which could rise to 41 and 46 bcm, respectively (when account is taken of the rising demand of gas-processing industries). In the mean time, pipeline gas exports to China and Korea could reach 25-50 bcm by 2020, and LNG ex-ports to the Asia-Pacific region could reach 21 bcm by 2020 and 28 bcm by 2030, which would imply a doubling of Sakhalin 2’s 12.8 bcm/y LNG export capacity. The vast major-ity for Russian domestic consumption and exports is expected to be produced at Yakutia and Sakhalin, while Irkutsk and Krasnoyarsk will themselves play a marginal role [Stern and Bradshaw 2008]. From a Russia’s point of view, pipeline exports to the Far East are part of the regional Russian gasification strategy. Gazprom’s drive to integrate reserves is expected to be a major policy priority for the period 2010-2020 in a massive greenfield-based drive to optimise Russia’s hitherto untouched eastern resources from Western Sibe-ria (Yamal and Shtokman), to Siberia (with Kovytka as the centrepiece) and the Far East (where Sakhalin forms the main reserve base). Indeed, Gazprom’s internationalisation is based on three rationales: (1) attempting to vertically integrate into Europe’s downstream gas market; (2) globalisation of its gas ex-ports to markets other than Europe; while (3) diversifying its reserve base [Locatelli 2008]. Gazprom has at its disposal several options for diversification: ‘going east’ as far as a re-
349 Gazprom has acquired a 50 percent stake of the Baumgarten hub in mid 2007. It co-owns the hub with the Austrian gas company [Argus Gas Connections 2007b]. The hub is the end point of Gazprom’s planned and proposed South Stream pipeline and is located near some of Austria’s main distribution pipelines. It also possesses storage facilities with a combined capacity of 2.1 bcm.
350 For a detailed overview of developments and plans concerning Russia’s Eastern Siberian and Far Eastern resources, refer to [Stern 2008].

238
gional initiative is concerned within Russia itself (gasification) and the accompanying export development to China, in order to add a third export market to Gazprom’s portfo-lio. However, it is LNG that potentially offers Gazprom the means of becoming a more (flexible) global player. The 2003 ‘Russian Energy Strategy’ placed significant emphasis on the development of Far Eastern gas resources, with the possibility of expanding production up to 106 bcm/y by 2020. During the same year, it is stated that the region will become accountable for 15 percent of total Russian gas exports [Stern and Bradshaw 2008]. Russian volumes to China On the pipeline side, China has pursued a gas import and pipeline construction deal with Turkmenistan as well as Kazakhstan and this has a major impact on potential volumes from and deals with Russia, which would have to compete with Central Asian volumes.351 Indeed, with a Chinese choice for Central Asian gas instead of Russian gas through the Altai pipeline (for China’s West-East pipeline) from Western Siberia seems to have im-proved China’s bargaining position vis-à-vis Russia and have diminished the prospects for the Russian Altai pipeline (30 bcm/y when completed) [Stern and Bradshaw 2008]. If Russia’s Far East projects will be realised, the Kovytka field is the most obvious choice for forming the basis for Russia’s far eastern export route [Stern and Bradshaw 2008]. In addi-tion to the Altai pipeline from Eastern Siberia to China’s Xinjiang province, plans have been drawn up for two pipelines to enter China’s Manchuria province from Russia’s Far East, fed by Sakhalin I and surrounding resources. A MoU was signed between Gazprom and CNPC at the meeting of the Chinese and Russian presidents in Beijing, in March 2006, regarding two gas pipeline projects: one from Western Siberia and the other from gas fields further east with a projected 68 bcm/y worth of Russian gas to be exported to China in 2020 [WGI 2006]. A renewed understanding was made in October 2009 on the supply of 70 bcm of gas starting in 2014-15, with pricing issues still not resolved to a con-clusive agreement (although China accepted market prices on gas from Australia) [WGI 2009]. Gazprom is already planning to start with construction of the Yakutia-Khabarovsk-Vladivostok, in operation in 2012 at the earliest [WGI 2009]. One of these pipelines is in fact the Yakutia-Khabarovsk-Vladivostok pipeline, linking Sakhalin to Russia’s Far East, planned to form the backbone of Russia’s far eastern gas supply network in the region (for exports to China and South Korea). The other pipeline branches off from the Chayandinskoye-Khabarovsk pipeline (from eastern Siberia to the Far East) and is to enter China near the Russian town of Blagoveshchensk. Ultimately, this entire network is planned to be connected to existing infrastructure in eastern Siberia as well as planned infrastructure in that region. Finally, this will be interconnected with the network in West Siberia (and Urengoy) from which the Altai pipeline is to branch off. It is
351 China had build the Turkmenistan-China pipeline stretching from eastern Turkmenistan to Xinjiang Province, with a capacity of some 30 bcm/y; which started to operate by the end of 2009 [WGI 2008a].

239
questionable however if, from a commercial logic, it is necessary to build all these inter-connections within Russia. South Korea Russia agreed on a supply contract with South Korea at a government-to-government level in September/October of 2008, with the formal signing of the agreement is planned in 2010. South Korea would be supplied through the pipeline from Yakutsk and Sakhalin from 2015 onwards with 10 bcm/y. This represents the equivalent of 30 percent of South Korea’s annual LNG consumption. South Korea is the biggest LNG importer after Japan and gas is good for 13 percent of its primary energy mix. Russian pipeline supplies appear to be in favour with the South Korean government, these volumes seen as a reliable com-plementary source of gas with respect to a LNG market. 10.5.4 Far abroad: export to different regional markets by LNG
The LNG trade is, in the coming decade and beyond, likely to reposition Gazprom from being a regional player (in either Europe and/or Asia), to a more global one. Only Sakhalin II now provides Gazprom with the opportunity to sell LNG to the Pacific Basin, which is seen by Gazprom as part of a global strategy [Stern and Bradshaw 2008, p. 239.].352 As far as proper Russian LNG is concerned, there are three main areas of attention: Sakhalin II for the short-term and Sakhalin III and IV353, Shtokman and Yamal for the longer-term. The exchange of technology between Gazprom and LNG-oriented players (such as Royal Dutch Shell) takes place in the Sakhalin II project, and it could be intensified along the value chain on the whole of Sakhalin island. This may involve further integration, for example also, with the Sakhalin I project, led by ExxonMobil. With the apparent onset of climate change and, specifically, global warming, in the long-term, Murmansk and Yamal LNG may increasingly have a global reach with the melting of the ice in the Arctic Ocean giving way to shorter and thus less costly routes to both East and West. Then, both locations will be within an economically acceptable distance of both the Atlantic and Pacific basins. The distance between Russia’s north Siberian liquefaction areas and US and Asian markets will be almost equal and will give Gazprom thus favour-able arbitrage possibilities (as Qatar already does today).
10.6 Uncertainties related to Russia’s merit order
There are many uncertainties with respect to the development of a new merit order for Russia (and Gazprom).354 First, there are uncertainties concerning the level of domestic
352 Gazprom’s export chief, Alexander Medvedev, has said that “joining the Sakhalin-2 project provides a powerful impetus for accomplishing a large-scale project in the energy supply sector to Asia Pacific countries and North Amer-ica. It will stimulate implementing a stage-by-stage entering strategy on the world LNG market.” [Gazprom, 2007].
353 Royal Dutch Shell was invited in mid-2009 to help develop Sakhalin III and IV.
354 In this section, some main uncertainties will be outlined. In Chapter 12 a detailed analysis will be presented.

240
demand in Russia. The availability of gas from existing sources of production may increase due to the rise in domestic gas price levels, energy conservation and reducing dependency on gas fired power generation. The growing Russian economy may on balance require more gas for its domestic market, although this has become more uncertain due to the economic instability since the autumn of 2008. From a government perspective, supply to this market will be given priority over exports. Second, the levels of gas imports from Cen-tral Asia to Russia and gas production of independent gas companies are uncertain. There is increasing competition from Asia and Europe for Central Asian gas, which makes it not self-evident that the gas flows will go to Russia. Uncertain government policy towards independent and foreign gas producers within Russia makes the production from these producers also more volatile. Third, the present uncertainty about future gas demand in Europe and Asia, stimulated also by the recent economic instability, may delay new com-mitments on contractual agreements and therefore new investments. There are also price uncertainties, especially in China, which negatively influence Gazprom’s investment pro-grammes. Uncertain government policy measures and regulator affairs (in Europe) will also increase uncertainty in respect of new investments for Gazprom [CIEP 2008; Correljé et al. 2009]. All these uncertainties, combined with the current economic crisis which has a large im-pact on Gazprom (as a result of exposure to short-term liabilities), will influence new in-vestments along the Russian gas value chain as far as investment decisions currently on the table are concerned.355 In the upstream for example the pace of additional gas production from new gas fields (mainly Zapolyarnoye, Yuzhno-Russkoye, Shtokman and Yamal Pen-insula) in order to replace declining production from the four giant gas fields (Medvezhye, Yamburg, Urengoy, and Orenburg) and increase production for the export market. In the midstream, green- and brownfield projects in order to allocate new supplies to growth markets, like the Nord and South Stream, could be suspended. Also new Russian LNG projects could be delayed due to the above-mentioned uncertainties. In the downstream, new greenfield investments for direct sales (in corporation with foreign companies) may be deferred [CIEP 2008]. Map 8.1 gives an overview of the existing and possible projects of Gazprom. 10.7 Conclusion
Russia has the largest gas reserves in the world (roughly a quarter of the world’s gas re-serves), which vastly exceed its oil reserves (in tons of oil equivalent). For Russia, gas plays an important long-run economic role as source of economic well-being. Against the back-drop of record-breaking energy prices during the period of 2004-2008, the Russian State began a process of restoring majority state control and ownership over the Russian energy sector, in order to use export oil and gas revenues for fuelling and diversifying its economy.
355 The position vis-à-vis foreign participation in Russia’s upstream gas sector could positively changed as a result of the economic crisis of 2008/09.

241
Through Gazprom as government-controlled entity, Russia wants to benefit from value-maximising gas revenues as a long-run source of hard currency earnings, just as oil has done up to today and still does so. It must carefully balance internal, e.g., politico-economic agendas and domestic gas de-mand, with external focal points in order to develop a gas strategy capable of dealing with momentous investment challenges. Its positioning vis-à-vis the Caspian Sea countries, other gas-exporting countries and their own respective export strategies will determine to a large extent how Russia will fulfil its interregional role as a major pipeline gas exporter. In addition, the geopolitical dimension, as well as regional market aspects (including market uncertainties, among others), offer opportunities as well as constraints in Gazrom’s growth strategy. In order to maintain and capture additional market share in a dynamic inter-regional gas market, Gazprom has repeatedly announced their new gas export investment strategy for new gas production areas (e.g., Yamal Peninsula, the Barents Sea, and Eastern Siberia) and midstream projects, including those to mitigate country and transit risks (e.g., Nord and South Stream, LNG and Asian pipeline projects). Furthermore, besides its traditional long-term contracts with mid-streamers, Gazprom is taking increasingly stakes in down-stream markets and explores new business models, involving flexible, intra- and in the long-run interregional supplies. Nevertheless, developing Russia’s merit order is a dynamic process (see also Chapter 3), with great uncertainties, including domestic demand, levels of imports from the Caspian region, government policies in export markets and other market uncertainties (encouraged by the current economic down-turn). With regard to competition in the different (sub)regions, it could be profitable for Gazprom in the long-run to sequentially invest in new project(s), such as Yamal and Shtokman, so as not to loose market share. These new investment commitments will also depend on its success or failure of cooperation with international energy firms and mid-streamers. A portfolio analysis of Russia’s investment policy on a project- and macro-level and the institutionalisation of strategy will be further discussed in Chapter 11 and 12.

242

243
Chapter 11 Gazprom’s investment strategy in an uncertain, com-
petitive gas market∗∗∗∗
11.1 Introduction
This chapter contains the application of the real-options game model discussed in Chapter 4. By means of exploratory research in the form of separate case studies, Gazprom’s in-vestment strategy will be ascertained in light of market outcomes on a sub-regional level by applying the Chapter 4 toolbox and the model. Written from Gazprom’s perspective, the case studies pertain to the Turkish and various sub-regional European gas markets. This chapter opens with Case study 1, an assessment of Blue Stream, a historical or ex post case. Subsequently, Case study 2 deals with the South Stream pipeline and Case study 3 with the Nord Stream pipeline. The case studies each have a similar structure: they begin with a brief background descrip-tion of the market in question, followed by a conceptual discussion about market uncer-tainty. Market uncertainty involves demand-side factors such as potential market demand itself as well as pricing. Then, the various potential gas suppliers to the sub-regional market in question are reviewed and assessed. Other investment variables are then considered in accordance with the conceptual toolbox, such as geopolitical factors, regulatory barriers, etc. This is followed by an overview of the possible or planned institutionalisation of the project in question (and in the case of the Blue Stream its institutionalisation as it really occurred). In all three case studies the real-options game model is then applied, which is a stylised approach to market demand uncertainty and potential gas supply competition in the form of a potential entrant. The model’s outcome, namely the overall value of the various pro-jects in question, is then provided. In Case study 1, where the Blue Stream is discussed, the application of the model is followed by a discussion of the gas market’s structure as it has evolved since the start of operations of that pipeline in the Turkish gas market. As for the South and Nord Stream pipelines, which are yet to be constructed, potential scenarios (from Gazprom’s perspective) concerning ex-post market structures in the respective sub-regional gas markets are then discussed. Each case study ends with a reflection on the use of the model, the respective outcomes, the model’s assumptions and their limits.
∗ This chapter was co-authored with Timothy Boon von Ochssée. We thank Christiaan van der Kwaak, student assis-tant at the Faculty of Economics of the University of Groningen, for his assistance in regards to the modelling work.

244
11.2 CASE STUDY 1: Gazprom versus competition in the Turkish gas market
during the 1990s
This case study pertains to the Turkish market as it was during the late 1990s. Booming gas demand in Turkey and the construction of the oil Baku Tbilisi Ceyhan (BTC) pipe-line through the Caucasus prompted Russia (Gazprom) to build the Blue Stream pipeline. The pipeline’s construction had a major impact on Turkey’s gas market structure while the pipeline’s commercial value still hangs in the balance, years after its final investment was made (in 2008, approximately half of the total capacity was utilised). Set in the 1990s, this case study is a reconstructive investigation of the strategic value of Blue Stream in view of possible gas flows from newly sovereign Central Asian states and Iran to Turkey (and beyond, as will be shown in Case study 2). 11.2.1 Background
According to many projections made during the early 1990s, the Turkish gas market was to become a booming growth market. Russian gas already played a role early on during this period. The Soviet Union had become an important gas supplier to the Turkish mar-ket in 1987, after it started its gas exports to large numbers of European countries during the 1960s. In order to accommodate these Soviet supplies, a trunk line was constructed from the Bulgarian border to Ankara in 1986. In 1990, the Turkish government an-nounced that they also desired to purchase LNG from Algeria (and from Nigeria later on), a move that would help to counterbalance Turkey’s large purchases from the Soviet Union [Hacisalihoglu 2008]. After the break-up of the Soviet Union in 1991, the Central Asian states of Kazakhstan, Uzbekistan and Turkmenistan became independent and started acting as sovereign net gas-exporting countries with their own goals and strategies. In the early to mid-1990s, their general attitude reflected a desire to break away from Russia. Russia itself entered a brief period of politico-economic chaos. As a result, combined with higher domestic gas prices, gas for Russian demand decreased during the first part of the 1990s. The key aspect to the behaviour of the Central Asian countries is that they correspond-ingly sought to export their resources, both oil and gas, through routes other than the ones that led to and through Russia, which dated from the old Soviet days. This was the heri-tage from the Soviet Union as described in Chapter 5 and 6. A westward export strategy seemed a real possibility for the Caspian countries, particularly for Turkmenistan, because Turkey (and Europe) were recognised as the closest hard currency markets. These were expected to have a significant increase in demand for gas in the years following the collapse of the Soviet Union. In the same period, Iran was also expected to start its export to Tur-key and Europe and to become a considerable supplier. The threat of these projects to Gazprom’s revenues in Europe, combined with increasing pressure on the Russia’s gas balance, encouraged Gazprom to take pro-active action in developing its value chain. Si-multaneously, Turkey was seeking to strengthen its relations with Iran and other Caspian countries [Akdeniz et al. 2002; Hacisalihoglu 2008]. Besides its increasing gas demand,

245
Turkey could and can also be considered as a bridge for gas (and other energy flows) to connect European off-take markets with the Caspian region and the Middle East, see also Case study 2 [Kilic and Kaya 2007]. For a schematic overview of the various export routes from the Caspian Sea region to Turkey, see Figure 11.1.
Figure 11.1 Schematic overview of competing gas supply and transport routes to the Turkish gas market in 1999
NIOC
SCP/TCGP
Gazprom
Azerb.
Azer-baijan SCP/TCGP
Georgia
Blue Stream
Russia
Majorsales options
Iran
Turkey
* Iraqi supplies were held up due to UN sanctions aimed at Saddam Hussein’s regime.Note: The overview is schematic (1999) and therefore not accurate. Source: own analysis, company information; figure adapted from StatoilHydro information.
Ka
za
ch
sta
n
Turkmenistan
Black Sea
Iraq*
Egypt
China/ others
Uzb
ek
ista
n
CAC
Caspian Sea
TCGP
Trans-Balkan pipeline
Possible delivery points
Possible markets
Existing transport route
Planned/proposed transport route
LNG
• Algeria
• Nigeria
• Yemen
• Qatar
• Egypt Mediterranean Sea
Ukraine Moldova
Ro
ma
nia
Bu
lga
ria
11.2.2 Market demand in Turkey: A booming gas market during the late 1990s
Natural gas became important for Turkey during the 1980s, as a new emerging economy, having been introduced in 1981 as a primary fuel. Turkey’s economic activity has spurred on the need for primary energy, and gas had a substantial share in the primary energy mix in 1999: approximately 15 percent. Power generation played (and still plays) an important role in the demand for gas (in 2000, 60 percent of the total demand for gas, according to Botas). Much of this demand was and is concentrated in the Western (Marmara area) and Southern parts of Turkey, specifically around Ankara, Izmir and Istanbul.356 For a number of reasons, including environmental, geographic, energy security, economic and political ones, Turkey had chosen natural gas as the preferred fuel for power generation, of which new capacities were to be added [Hacisalihoglu 2008]. Turkey’s gas demand was therefore expected to grow by 5 to 8 percent annually between 2000 and 2020, one of the highest
356 In 1988, gas began to be exploited for residential and commercial purposes in Ankara [Ozturk and Hepbasli 2003]. In the first part of the 1990s, it continued with Istanbul and Bursa, and then in the mid-1990s with Eskisehir and Izmir [Aras and Aras 2004].

246
growth rates in the world during that period [privately disclosed company data; Stern 2005]. Domestic gas production in Turkey is not significant: less than 3 percent was com-ing from domestic gas supply sources, increasing the pressure to import. Government-owned entities dominated the Turkish gas sector, so government policies had a large impact on fuel choices. The Turkish gas company Botas had a monopoly on gas imports. After Turkey’s financial crisis in 1999, substantial reforms were pushed through by the IMF, which had resulted in liberalisation and a partial privatisation of the gas sec-tor. A key element of the IMF reforms was a requirement for a phased divestment of im-port contracts by Botas, which will be discussed later on in this case study [Hacisalihoglu 2008; OECD 2002]. Figure 11.2 Turkey’s natural gas consumption from 1984 to 2000
Source: own analysis, based on BP [2008]; MENR [2007].
0
2
4
6
8
10
12
14
16
1984
1986
1988
1990
1992
1994
1996
1998
2000
Year
Gas
consumption
In bcm
14.6
7.9
4.5
1.2
0.01
In order to appreciate the possible strategic significance of the Blue Stream pipeline, one needs to look back at the period of time when the investment decision was made. In 1999, Turkey was consuming 12.4 bcm, up from only 8 mcm in 1983, consuming 9.7 bcm by 1997, see also Figure 11.2 [Ministry of Energy and Natural Resources 2007; BP 2008]. According to various projections, gas demand was projected to grow rapidly, from be-tween 16.4 and 16.5 bcm in 2000 to between 57.2 and 65.7 bcm in 2020 (which corre-sponds with a 4.7 to 6.3 percent growth per annum from 2000-2020; see also Figure 11.6). It was by all accounts projected to be a booming gas market. Therefore, the pros-pects for various potential gas suppliers to the market appeared favourable. Supplying the Turkish market however was by no means a risk-free venture. The possibility always ex-isted that demand in Turkey could remain sluggish or even fall, resulting in a potential oversupply of the Turkish gas market (see also Figure 11.6).

247
Price risks associated with additional supplies to the Turkish gas market also influence the level of market uncertainty, besides the aforementioned volume (or demand) risk. During the 1990s, (Brent) oil prices were quite volatile and low, which encouraged a deferral of investment and therefore the stimulation of a wait-and-see strategy. Some forecasts at the time (1999) estimated a constant Brent oil price (in real terms) of $17.00/bbl. This would imply a Turkish gas price around Ankara of approximately $55-60/mcm in 1999 dol-lars.357 Because of the low and relatively volatile gas prices, investors may indeed be en-couraged to defer their investments, i.e., a wait-and-see strategy, if their total cost for, e.g., supply and transport are below the actual gas price and/or relatively high when compared with the gas supply costs of potential competitors. 11.2.3 Various potential gas suppliers to the Turkish market (1991-1999)
Gas suppliers to Turkey were few in the immediate post-Cold War period from 1991 to 1999. Russia delivered a maximum of 16.2 bcm via two contracts with the Turkish gas company Botas. These volumes travelled through its Trans-Balkan pipeline, running via the Ukraine, Moldavia, Romania and Bulgaria. In 1987, the Soviet Union began supply-ing Turkey with 5.66 bcm, resulting in a 25-year contract for 6 bcm/y until 2011. In 1997, Gazprom and Botas agreed to increase gas supplies via a 50/50 joint venture, Tu-rusgaz, with a maximum of 8 bcm/y, starting in 1998 and lasting until 2021 [Hacisalihoglu 2008]. Modest LNG imports began with Algerian and Nigerian LNG volumes (respectively, a maximum of 4 bcm/y, from 1994 to 2014, and 1.2 bcm from 1999 to 2021). As mentioned above, Turkish domestic gas production accounted for less than 3 percent (around 0.7-1 bcm/y), which was not expected to increase in the coming decades, and thus gas imports had to increase in tandem with demand.358 During the late 1990s, some ten gas-exporting countries had announced pipeline and LNG projects in order to supply the growing Turkish gas market. The Turkish govern-ment was encouraging these plans in order to promote the diversification of its gas suppli-ers. Several infrastructure projects to bring pipeline gas from Iran, Iraq, Egypt and the Caspian area were announced. In addition, plans were drawn up to increase (pipeline) imports from Russia and LNG supplying countries, such as Egypt, Yemen and Qatar [Demirbas et al. 2004; Hacisalihoglu 2008]. All the gas import agreements were held by Botas, which had signed eight long-term sales and purchase contracts with six different supply sources (contracting a total of 67.8 bcm, which were higher than some demand forecasts) [Ozturk and Hepbasli 2003].
357 Additional transportation costs should also be take into account for transport from the off take centres to the bor-ders of Turkey. In that time, Cedigaz suggests that for long-distance gas transportation $17.50/mcm would be a conservative approximation for each 1,000 km. For example, extra costs of circa $20/mcm from Ankara to the eastern border.
358 Major gas producers in Turkey include Arco, the Turkish State Petroleum Company (TPAO) and Shell [Hacisali-hoglu 2008].
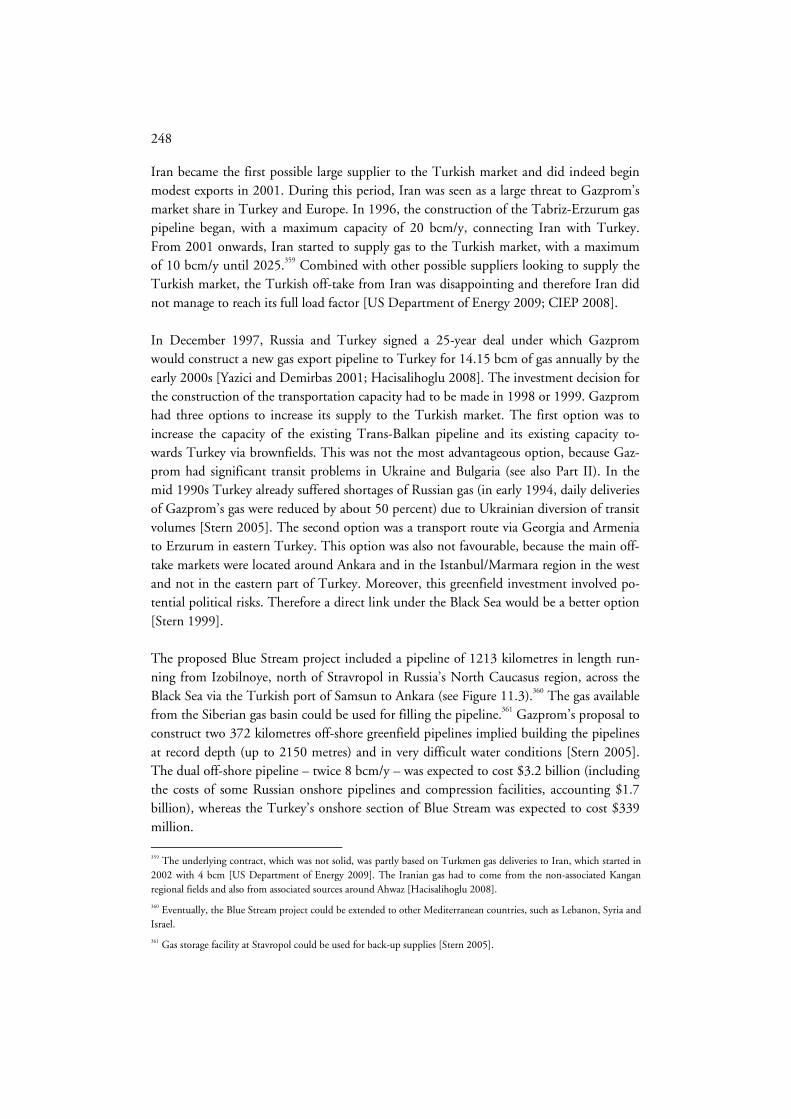
248
Iran became the first possible large supplier to the Turkish market and did indeed begin modest exports in 2001. During this period, Iran was seen as a large threat to Gazprom’s market share in Turkey and Europe. In 1996, the construction of the Tabriz-Erzurum gas pipeline began, with a maximum capacity of 20 bcm/y, connecting Iran with Turkey. From 2001 onwards, Iran started to supply gas to the Turkish market, with a maximum of 10 bcm/y until 2025.359 Combined with other possible suppliers looking to supply the Turkish market, the Turkish off-take from Iran was disappointing and therefore Iran did not manage to reach its full load factor [US Department of Energy 2009; CIEP 2008]. In December 1997, Russia and Turkey signed a 25-year deal under which Gazprom would construct a new gas export pipeline to Turkey for 14.15 bcm of gas annually by the early 2000s [Yazici and Demirbas 2001; Hacisalihoglu 2008]. The investment decision for the construction of the transportation capacity had to be made in 1998 or 1999. Gazprom had three options to increase its supply to the Turkish market. The first option was to increase the capacity of the existing Trans-Balkan pipeline and its existing capacity to-wards Turkey via brownfields. This was not the most advantageous option, because Gaz-prom had significant transit problems in Ukraine and Bulgaria (see also Part II). In the mid 1990s Turkey already suffered shortages of Russian gas (in early 1994, daily deliveries of Gazprom’s gas were reduced by about 50 percent) due to Ukrainian diversion of transit volumes [Stern 2005]. The second option was a transport route via Georgia and Armenia to Erzurum in eastern Turkey. This option was also not favourable, because the main off-take markets were located around Ankara and in the Istanbul/Marmara region in the west and not in the eastern part of Turkey. Moreover, this greenfield investment involved po-tential political risks. Therefore a direct link under the Black Sea would be a better option [Stern 1999]. The proposed Blue Stream project included a pipeline of 1213 kilometres in length run-ning from Izobilnoye, north of Stravropol in Russia’s North Caucasus region, across the Black Sea via the Turkish port of Samsun to Ankara (see Figure 11.3).360 The gas available from the Siberian gas basin could be used for filling the pipeline.361 Gazprom’s proposal to construct two 372 kilometres off-shore greenfield pipelines implied building the pipelines at record depth (up to 2150 metres) and in very difficult water conditions [Stern 2005]. The dual off-shore pipeline – twice 8 bcm/y – was expected to cost $3.2 billion (including the costs of some Russian onshore pipelines and compression facilities, accounting $1.7 billion), whereas the Turkey’s onshore section of Blue Stream was expected to cost $339 million.
359 The underlying contract, which was not solid, was partly based on Turkmen gas deliveries to Iran, which started in 2002 with 4 bcm [US Department of Energy 2009]. The Iranian gas had to come from the non-associated Kangan regional fields and also from associated sources around Ahwaz [Hacisalihoglu 2008].
360 Eventually, the Blue Stream project could be extended to other Mediterranean countries, such as Lebanon, Syria and Israel.
361 Gas storage facility at Stavropol could be used for back-up supplies [Stern 2005].
249
Figure 11.3 The Blue Stream project
50%
50%
xxxx Year of start-up
Pipeline project Shareholders
X% Share in project
Governments/business involved
Off take Transit Production*
Onshore transit
Offshore transit
Onshore and offshore transit
Reasons forconstruction
2003
Blue Stream
* Some ‘Russian’ gas exports through Blue Stream to Turkey may possibly be imported by Russia from Central Asian countries.Source: own analysis, based on Gazprom; Eni; Stern 2005; Mabro and Wybrew-Bond 1999.
• Transportation capacity 16 bcm/yr
• Extra volume Russian gas for Turkey
• Blockade new gas volumes from Iran and Central Asia
• Avoiding Ukraine, Moldavia, Romania and Bulgaria – taking out transit risk
In mid-1998, Turkey and Egypt announced a plan to construct a gas pipeline from Egypt to Turkey under the Mediterranean. However, this was too ambitious an idea, and Egypt opted for supplying the Turkish market through LNG (4 bcm/y) [Hacisalihoglu 2008; OECD 2002]. Other LNG supplies from Yemen and Qatar were under consideration as well (4 bcm/y, respectively 3.1 bcm/y). According to expert interviews, gas supplies from Iraq (10 bcm/y) via a greenfield pipeline were also proposed, however, the Iraqi supplies were on hold during this time due to United Nations (UN) sanctions. As was noted, during the 1990s, plans were proposed for the diversification of gas export and transport routes from the Caspian Sea region to Western markets, with the aim spe-cifically of circumventing Russia. One of these projects focused on the Turkish gas mar-ket. A possible pipeline to the West – the so-called TCGP – had been on the table for serious consideration by different investment consortia of national and international oil firms as far as implementation was concerned. The proponents of the TCGP were ready to push the project forward and feasibility studies on the possible pipeline route had been carried out, such as a joint venture including Bechtel, General Electric and Royal Dutch Shell and a joint venture including Royal Dutch Shell, ChevronTexaco, ExxonMobil and Kazakh the national oil company, Kazakhoil. The bottom-line of these studies were a gas pipeline from Turkmenistan (close to Turkmenbashy), underneath the Caspian Sea, across Azerbaijan and Georgia, and on to Turkey (see also Figure 11.4).

250
Figure 11.4 Trans-Caspian Gas Pipeline project
xxxx Year of start-up
Pipeline project Shareholders*
X% Share in project
Governments/business involved
Off take** Transit*** Production****
Onshore transit
Offshore transit
Onshore and offshore transit
Reasons forconstruction
n.a.
n.a.
n.a.
n.a.
* First planned consortium. (Later, Chevron, Kazakhoil and Mobil were involved as well). Bechtel and Turkish Botaş did feasibility studies. Amoco – initially shareholder – is part of BP.** Main off takers – other (transit) countries may take off gas as well.*** For EU off taking countries, other transit countries are involved (see Nabucco)
**** Uncertainty about production capacity in Central Asia to fill TCGPSource: own analysis, based on: expert interviews; EIA [2007].
n.a.
TCGP
• Planned transportation capacity 30 bcm/yr
• Diversification from Russian gas supply – direct route Central Asia to Turkey for extra gas supply in hard-currency markets (e.g. Turkey and EU)
Some studies also explored Kazakh and Azeri supplies alongside the Turkmen one.362 The TCGP presented Turkmenistan with a valuable opportunity to export gas westwards, underneath the Caspian Sea and away from Russia, both increasing its bargaining power vis-à-vis Russia as well as offering the closest hard currency market to the Caspian coun-tries that was expected to have a significant increase in demand for gas. Figure 11.5 pro-vides an overview of the potential exports from the Caspian region in a base case scenario (e.g. Turkmenistan, Kazakhstan and Azerbaijan), taken into account domestic demand. From the mid-nineties four other ‘calls’ on Caspian gas were under consideration: to Iran, Pakistan (and Afghanistan), China and Russia.363 It was debatable, however, whether Turkmenistan and other Caspian countries could fulfil all these projects, totalling some 160 bcm/y, which is significantly higher than the estimates made in Figure 11.5. Some groups within the Turkish government stated that a pipeline from Turkmenistan was a top priority, although the pipeline would compete against the proposed Blue Stream pipe-line, as well as possibly against Iranian and LNG supplies [Demirbas et al. 2004; Hacisali-hoglu 2008].
362 The costs associated with the TCGP were estimated at $3.8 to 4.1 billion (including CAPEX compressor capacity and a Kazakh section along the Caspian Sea of $0.57 billion).
363 In Case study 2 and Chapter 9, a more in-depth analysis of the Caspian region is presented.

251
Figure 11.5 Potential exports from the Caspian region in 1999 – base case scenario
2005 2010 20152000 2020
Turkmenistan
Azerbaijan
Kazakhstan
Note: Base case scenario. Totals may not add up due to rounding. In 2000 and 2005, Azerbaijan was still a net-importing country (2000: -3.3 bcm; 2005: 0.9 bcm).Source: own analysis, based on privately disclosed company data.
10 18 22 19
1118
13
11
54
9296
76
4
15
64
104
132128
However, it was questionable whether Turkish demand would grow rapidly enough to absorb all proposed volumes of natural gas from Iran, Caspian region, Russia and LNG supplying countries, in addition to gas slated to be supplied by Russia, Algeria, and Nige-ria [Hacisalihoglu 2008]. Figure 11.6 presents an overview of the existing and pending supply distribution over Turkey’s demand projections in 1999. Indeed, if all projects would have been realised, the Turkish gas market would have been oversupplied, even in the mid-term scenario of Botas.364 Referring now to Figure 4.1 in Chapter 4, the growth potential of Turkish gas imports was high, while Turkey was in close proximity to two very large potential pipeline gas suppliers besides Russia: Iran and Turkmenistan (and possibly other Caspian countries), and some smaller potential LNG suppliers. This high degree of competition could induce Gazprom to maintain a pro-active investment strategy in order to preserve and increase its market share in the Turkish gas market. Yet, the low and relatively volatile gas/oil prices at that moment may also encourage a wait-and-see strategy. In order to better grasp the trade-off between the commitment and postponement values, regarding the uncertainty about price and volume, one should focus more in detail on the cost structure of the dif-ferent competitors towards the Turkish gas market.
364 Turkey could become an important transit centre for gas exports to Greece and beyond in case of oversupply [Hacisalihoglu 2008].

252
Figure 11.6 Existing and pending supply distribution over Turkey’s demand projections in from 1999 onwards
0
20
40
60
80
100
2000 2005 2010 2015 2020 2025
* Indigenous production level varies, in this figure assumed at 0.8 bcm/y.** Turusgas contract (8 bcm/y) and Gazexport contract (6 bcm/y).*** Algeria LNG contract (4 bcm/y) and Nigeria LNG contract (1.2 bcm/y). † Base case scenario: Supply from Kazakhstan (7.5 bcm/y), Turkmenistan (15 bcm/y) and Azerbaijan (7.5 bcm/y).†† Egypt LNG (4 bcm/y); Yemen (4 bcm/y); Qatar (3.1 bcm/y).Note: Linear trend extrapolation (via the method of least squares) after 2020 for demand (based on 2015-2020). Other possible pending volumes: Egypt pipeline gas (very uncertain) and Iraq pipeline gas (10 bcm/y – supplies were on hold due to UN sanctions). Source: own analysis, based on Gazprom information; Stern [2005]; Victor and Victor [2006]; privately disclosed company data.
Gas volume
in bcm
Year
Existing contracts Gazprom**
Existing contract LNG Algeria/Nigeria***
Pending TCGP – Caspian region†
Pending Blue Stream – Russia
Pending Tabriz-Erzurum – Iran
Pending LNG – Egypt/Yemen/Qatar††
High demand scenario
Base case demand scenario
Low scenario
Botaş demand projection
16
31
54
74
54
80
Indigenous production*
As described in Chapter 9, the long-run marginal cost of (new) supplies, influenced largely by economies of scale in transport and upstream production capacity, consists of produc-tion and transportation costs, transit fees and royalties, the latter two types of cost are included when applicable. Based on available data on gas supply costs involved in the Caspian Sea region, OME [1999] and privately disclosed company data, one can roughly conclude that four suppliers could deliver gas to the Turkish market on a profitable basis, taking into account the forecasted gas prices in Turkey in 1999 (around $60/mcm, see also Figure 11.7).365 Due to low transportation costs, Iran, Iraq, Russia and Azerbaijan could deliver gas at a cost of below or around $60/mcm. Other proposed pipeline suppli-ers, Turkmenistan and Kazakhstan, had a unit cost level above $60/mcm: $67/mcm, and $81/mcm respectively. In the case of higher gas prices and/or an optimistic scenario of (transport) costs, supplies from this region could therefore become profitable. The possible entry of LNG played a smaller, fringe role with smaller volumes and lower economies of scale: LNG from Algeria, for example, has a unit cost of roughly $92/mcm to Turkey, whereas Egypt LNG costed $97/mcm and Nigerian over $110 per mcm. LNG supplies were not competitive under these price circumstances.
365 A said before, the gas price at that moment was based on an oil price of $17 bbl in 1999$.

253
Figure 11.7 Comparative unit costs to deliver gas to the Turkish gas market in Ankara – base case scenario in 1999 $/mcm
*A value of US$20 per mcm has been assumed as the cost to transport the gas from Erzerum (East Turkey) to Ankara. Source: own analysis, based on OME [1999]; privately disclosed company data.
19
17
23
23
19
11
39
39
75
91
74
85
88
8
8
11
19
18
25
12
41
63
17
55 67Turkmenistan
42Azerbaijan
81Kazakhstan
60Russia
50Iran
LNG Algeria
LNG Egypt
LNG Nigeria
LNG Qatar
LNG Yemen
Iraq
92
114
97
112
107
58
Production cost
Transport cost
Transit fees
Forecasted gas price (high case)
(US$60 per mcm)
Iran and, to a (much) lesser extent Iraq, had considerable potential to become a large sup-plier to the Turkish market. However, Iranian supplies to the West were unlikely, given due the ILSA sanctions, while Iranian production capacity remained uncertain. Similarly, Iraqi supplies were ‘on hold’ as well during this period due to UN sanctions. As described in Figure 11.5, Turkmenistan (and Kazakhstan) also had a large export potential, but the TCGP had and has to compete with other pipeline projects (for example, from Iran in terms of source but also from Russia in terms of gas volume availability as a result of Rus-sian initiatives to secure Turkmen gas volumes). At the time, Azerbaijan had a limited export potential (see also Figure 11.5). The TCGP and the possibility of seeing Turkmen (possibly to match up with Azeri and Kazakh gas) gas flows materialise to Turkey was significant for Gazprom from a strategic point of view, because it represented major new sources of gas from newly independent and sovereign states upon which Russia now de-pended for those same volumes. Simultaneously, the same gas would compete with Rus-sian gas, potentially loosing market share beyond Turkey in the process. Referring to Figure 4.2 in Chapter 4, the nature of competition potentially emanating from the Caspian region (including Iran) was therefore significant in terms of economies of scale in transport and production capacity as well as in terms of distance to market. Given the sensitive role of Central Asian gas volumes in Russia’s own supply and export balance, the urgent need for a strategic investment ostensibly legitimised an aggressive strategy. Section 11.2.6 of this case study includes the application of the real-option game
254
model in an effort to assess this urgency and measure the strategic impact of the decision regarding the Blue Stream pipeline Gazprom ultimately took. 11.2.4 Other investment variables relevant to the Caspian pipelines
and Blue Stream
Other factors besides the geo-economic considerations played an important role in the Blue Stream case as far as new gas supplies are concerned. These should be considered in a conceptual matter in line with Barnes et al. [2006], which has been outlined in the con-ceptual toolbox in Chapter 4. It will focus mainly on supplies from the Caspian region and Russia. Some of these issues are already mentioned under Section 11.2.3. The invest-ment climate for private investors in the Caspian region for instance, especially Turkmeni-stan and Iran with a great export potential, was not that favourable. The government of Turkmenistan under president Niyazov was perceived as an unreliable partner, offering little protection in guaranteeing the sanctity of contracts. The political future, the rule of law and legal regime of the country were not stable and unfavourable [Olcott 2006]. The Iranian gas sector was also severely under-developed and it suffered from a lack of invest-ment capital due to the different sanctions in place, including the ILSA sanctions, severely undermining any export ambitions. The general investment climate in Russia was also unfavourable. Private (Western) investors had little means to secure investments in the Russian gas sector, in which Gazprom had a quasi-monopoly. As a result of Russia’s finan-cial crisis in 1998, modest capital was available for financing greenfield projects [Victor and Victor 2006]. Besides the generally flawed investment climate, the possible Turkmen, Kazakh and Azeri supplies were subject to possible transit risks in the south-Caucasus. After the break-up of the Soviet Union, the Caspian Sea was exposed to legal struggles of ownership, whereby Russia delayed the possible realisation of the TCGP underneath the Caspian Sea by insist-ing that the project did not satisfy environmental regulations [Amineh 2003]. Possible Central Asian transport routes to Turkey via Iran were blocked by the US and the sanc-tions in place. In the process of assessing the TCGP’s feasibility, different external go-vernmental actors were involved for geo-economic reasons. As described in Chapter 8, the US sought to break-up Russia’s transport (and production) monopoly over gas flows from the Caspian Sea region. This strategy was supported by political instruments and interna-tional organisations such as the World Bank (this will be discussed under Section 11.2.5 in this case study). The Blue Stream was a direct offshore link between Russia and Turkey without any in-volvement of third parties, which resulted in a minimum level of transit risks and political interference. As described earlier, transit risks were growing in Ukraine and Bulgaria dur-ing the 1990s. According to expert interviews, various political factions in Turkey had diverging preferences when it came to the different potential suppliers for the Turkish gas market. In the meantime, according to some sources, unconventional measures were per-
255
haps taken by Russia to influence Turkey’s political dialogue in its favour. There is some speculation as to whether this included providing Bulgaria (as a trans-Balkan transit coun-try) with some form of financial incentive in exchange for manipulating the physical flows to Turkey and thus encouraging policy-makers in Turkey to opt for the construction of the Blue Stream. Combined with a possible time delay in attaining transit permits, Gazprom (and Turkey) desired to have a direct route towards the Turkish market, instead of boosting the existing capacity to Turkey [Stern 2005]. Russia also had geo-strategic and -economic interests in the Caspian region (see also Chapters 9). Combined with existing transit problems this provided a positive incentive for a pro-active investment policy with respect to the Turkish market. 11.2.5 Institutionalisation of the Blue Stream and Caspian pipeline projects
Before the model will be applied, it is necessary to assess the organisational and financial institutionalisation of (strategic) pipeline investment from a practical point of view. The strategy and instruments of the Blue Stream and Caspian projects, varied substantially, which could influence the capability to make a strategic investment. The Blue Stream project was part of a strategic alliance between the Italian gas and oil company ENI and Gazprom. The involvement of a Western partner, backed by both governments, was deemed necessary to make the project bankable, because of financial and technical reasons. The project was an exponent of ultra deep-water pipeline technology (up to 2150 metres) and therefore also a technically risky commercial project [Victor and Victor 2006]. ENI could mitigate these technical risks due to earlier experiences. Gazprom and ENI hold a 50 percent interest in the joint venture each and ENI also attained a 50 percent share in the pipeline’s capacity, allowing ENI to sell gas from its Astrakhan gas field on the North West shore of the Caspian Sea [Stern 2005].366 In the growing Turkish gas market, a direct sales strategy seemed the most advantageous option from Gazprom’s perspective, which is in line with De Jong’s [1989] competitive coordination mechanism. However, as a result of Gazprom’s relatively weak organisational capabilities and Botas’ monopoly in the Turkish market, a business model of long-term contracts seemed the most viable one in order to ensure Gazprom’s position. As men-tioned in section 11.2.4, some political factions in Turkey supported the construction of the Blue Stream pipeline and new flows from Russia at a political level. ENI provided the majority of the $3.2 billion financing. Its return on equity has been realised from the margin between purchase and sales gas price. For strategic reasons, ENI
366 The joint development of the Astrakhan gas field was also part of the strategic alliance between Gazprom and ENI. So far, no ENI produced equity gas was going through the Blue Stream. In addition, no really significant new devel-opment of that gas field has since taken place [Stern 2005].

256
accepted a lower return and took greater risks. Gazprom’s return on equity and loss of income from repayment of both onshore and offshore loans could have been made from gas sales to Botas and ENI and the equity what was provided by ENI. The equity invest-ment, the distribution of risks, and reward allocation between Gazprom, ENI and SNAM were complex. The repayments of the loans were based on gas contracts between SNAM (a subsidiary company of ENI) and Gazprom, thus being completely de-coupled from the project itself. This resulted in less expensive loans via the so-called warehouse construction (see also Figure 4.3 in Chapter 4), provided by five commercial banks and in which Min-istry of International Trade and Industry of Japan (MITI) and the Italian export credit agency Servizi Assicurativi del Commercio Estero (SACE) had given guarantees. Figure 11.8 is a detailed overview of the likely financial structure of the Blue Stream project. In late 2001, the laying of the offshore lines started and it was completed in October 2002, which was within acceptable limits for such a risky project [Stern 2005]. Figure 11.8 Likely reconstruction of financial structure of the Blue Stream project
In addition, according to expert interviews, in order to ensure its strategic success on the Turkish market and to moderate Iranian supplies, Gazprom had engaged in an aggressive negotiation strategy with regard to the price setting. The National Iranian Gas Export Company (NIGEC) and National Iranian Oil Company (NIOC) had offered Botas an import price of $65/mcm (with Ankara as the delivery point), whereas Gazprom had set-tled a gas import price of $75/mcm. After Iran’s offer, Gazprom reduced its price substan-tially by treating the Blue Stream project as a sunk cost, therefore willing to bear the full
Snam
(100% ENI)
Commercial Banks I
SACE
Commercial Banks II
JBIC
MITI
BluestreamCompany
Bouygues
Japanese Trading Houses
ENI (36% IRI)
gas to Italy
Escrow Account
$
repayment
gas payments
comprehensive guarantees
Gazprom
Loan guarantees
gas to Turkey
$ gas $
Equity + company loans
Equity + company loans
Engineering, Procurement and
Construction contract
Onshore Russian pipeline
Ilva (Steel from Italy)
Saipem
(43% ENI)
Procurement contract
Onshore Turkey pipeline
($350 mln)
Botas
Equity, company loans and loan proceeds
gas payments
Contract + loans
Contract + loans
Source: expert interviews.
comprehensive guarantees
257
gas transport cost. In other parts of the value chain, the Russian government and Gazprom had embarked on a pro-active policy as well, including the use of political instruments, including pipeline diplomacy. Russia has also been able, as mentioned, to delay the possi-ble realisation of the TCGP across the Caspian Sea on environmental grounds. Mean-while, according to expert interviews, Gazprom locked in new Turkmen supplies at more favourable rates than its TCGP competition, which reduced the availability of gas supplies to that project. The institutionalisation of the pipeline of Gazprom’s competition differs from the Blue Stream project. The TCGP project had to be financed on a purely commercial basis through project financing. As mentioned previously, joint ventures included the participa-tion of both national and international oil firms. These entities had no strategic interest in a pipeline, except for shipping gas on a purely commercial basis. However, via political instruments and institutes, such as the Bretton Woods institutions, Western countries were able press forward with the realisation of a direct gas corridor from the Caspian re-gion. Besides the attempt at breaking up the Caspian upstream sector for international energy firms, the US introduced some instruments for realising alternative transport routes from the region. New pipeline routes from the Caspian region directly to the West were stimulated via the ‘East-West-corridor policy’, which was backed up by a transit policy document of the former Clinton Administration.367 According to expert interviews, inter-national financial institutions, such as the World Bank and the EBRD, were also encou-raged to help finance pipeline projects from the Caspian region directly to the West.368 Also some political factions in Turkey favoured the Trans-Caspian pipeline as an alterna-tive to the Russian proposal. During the 1990s, Europe had a relatively passive policy towards the Caspian region and its gas reserves. The EU only signed an umbrella agreement in 1999 under its INOGATE programme, based on the European Energy Charter of 1991 in order to reduce European dependency on OPEC countries and to guarantee access to energy supplies (see Part II, chapters 6 and 7). 11.2.6 Application of the real-options game model to the Blue Stream case
The essence of the application of the model is an analysis of Blue Stream as a potential strategic investment for Gazprom, by employing an embedded real-options game frame-work described in Section 4.4 of Chapter 4. The application of this model pertains to the Turkish gas market discussed descriptively in the previous subsections, taking into account
367 This policy was supported by a supra-department through a direct advisor (Richard Morningstar) to the president, currently the US Special Envoy for Eurasian Energy.
368 An example of this financing concept was the BTC oil pipeline. The economic feasibility became under discussion by uncertainties in the upstream, as a result of questions about the availability of oil. Financing of the BTC pipeline were covered mostly by financing agencies and development banks. They offered favourable interest tariffs to make the pipeline economically profitable for its shareholders [Amineh 2003].

258
both opportunities and threats (i.e., vis-à-vis potential competitors). Given the presence of potential competitors on the one hand and demand uncertainty on the other, the goal is to ascertain the overall expanded value of the Blue Stream pipeline project using a simpli-fied model, in other words, the descriptive analysis above must therefore be stylised. To the greatest degree possible, the assumptions below are designed to approximate real world figures and numbers in the context of specific market circumstances and gas infrastructure investments. 11.2.6.1 Assumptions and parameter values
Operational assumptions: a. We assume that the Turkish gas market consists of a duopoly, with Gazprom on the
one hand and a potential competitor on the other, with the latter acting as a potential entrant for new market demand with an 8 bcm/y pipeline, both on a distance of 1,213 km to the off-take market (offshore section: 470 km; onshore section in total: 753 km). (No account is taken of potential LNG suppliers at this stage.)
b. Gazprom faces the choice in 1999 (i.e., stage I) of building or deferring the construc-tion of the Blue Stream pipeline across the Black Sea to Turkey in the face of poten-tial entry by a competitor (see Figure 4.8 in Chapter 4).
Parameter value assumptions:369 a. Average operating gas transport costs in the base case: In the base case, both players
are assumed to make commercial investments only, i.e., constructing small-diameter pipelines with a capacity of 8 bcm/y, which only have a technical ramp-up phase. In this case it means both players do not undertake early strategic commitment (in the
market), meaning the operational unit costs remain at: $9.93/mcmG Ec c= = .
At this point, neither player yet benefits from economies of scale. b. Average operating gas transport costs in the proprietary case: The construction of
the Blue Stream is a proprietary investment. Gazprom decreases its average opera-tional unit costs from $9.93/mcm to $8.54/mcm as the pipeline has greater econo-mies of scale (from 8 bcm/y in the base case to 16 bcm/y in the proprietary case). This represents the move away from the base case and towards the proprietary case. The competitor is assumed to use an 8 bcm/y commercial pipeline capacity at the same distance (i.e., the base case situation with an average operational unit costs of $9.93/mcm).
c. First-stage strategic pipeline investment (K): The initial cost of building the Blue Stream, K (totalling $2.245 billion), is defined as the difference between the CAPEX for Blue Stream minus the ‘theoretical’ CAPEX for a normal 8 bcm/y commercial in-vestment, I (totalling $0.955 billion).370
369 See the conceptual discussion on definitions held in the toolbox in Chapter 4.
370 In order to calculate the ‘theoretical’ CAPEX as well as the average breakeven operating costs per unit, account is taken of steel price indices, inflation, the WACC (k), the risk-free rate (r), fuel and compression costs, etc. (see Chapter
259
d. Follow-up investment outlay by either Gazprom or the competitor (I): Follow-up investment outlay, made after stage I and thus after the incumbent’s strategic invest-ment, corresponds with a base case commercial 8 bcm/y pipeline investment ($0.955 billion).
e. Initial demand parameter ( 0θ ): For simplicity, initial gas market demand in the
Turkish gas market is assumed to be 18.25 bcm ( 0 18.25θ = ) at 0t as detailed in
Section 4.3.5. f. Binomial up or down demand parameters (u and d): In the model, demand is as-
sumed to be stochastic, moving up or down with binomial parameters u = 2 and u =
0.5, both at the beginning of periods 1 and 2 in stage II. Starting at 3t there is a
‘steady state’ of 25 years, i.e., no more upward and downward moves, as detailed in Section 4.3.5.
g. The risk-free interest rate: The risk-free discount rate is assumed to be 5.5 percent ( 0.055r = ).371
h. The risk-adjusted discount rate: The rate at which profits in the last stage are to be
discounted is set at 8.5 percent ( 0.085k = ).372 The project’s expected annual cash
flows extend over a period of 25 years, acting as an annuity. i. Risk-neutral probabilities: Given u, d, k and r, it can be determined that p = 0.32
and 1-p = 0.68. Figure 11.9 is an overview of the various payoffs to Gazprom and the competitor in a decision tree, which is a direct application of Figure 4.8 in Chapter 4. Each node cor-responds an up- or downward move in demand and the resulting decisions of Gazprom (denoted in Figure 11.9 and elsewhere by the letter G) and the competitor (or potential entrant, denoted in Figure 11.9 and elsewhere by the letter E), respectively, to invest or
defer (further) commercial investments ( { , }G I D and { , }E I D ) in stage II while in stage I
only Gazprom is assumed to invest as an incumbent. The highlighted (red) branches along the tree indicate the optimal actions along the equilibrium path.
4). The real, historical figures are used for the proprietary case here. The base case ‘theoretical’ pipeline CAPEX calcu-lation is based on 2009 input data; including a steel price index correction (primarily for inflation) obtained from privately disclosed company sources. The inflation is assumed at 1.1 percent, according to Eurostat data for the Euro area.
371 The risk free rate is based on the yield-to-maturity in October 1999 of a 10-year Euro-denominated (or the equiva-lent thereof) German government bond [Tradingeconomics.com 2009].
372 For lack of historical data, we have used the actual risk-adjusted discount rate (the WACC). We therefore do make a distinction here between the rate prevailing in 1999 and 2009 (see case studies 2 and 3). Given the availability of the sensitivity analyses (see Figure 11.12), such changes in the WACC do not have a crucial impact, though it remains an important element in determining the overall net project value. The WACC is based on information provided in expert interviews, where a WACC of between 8 and 9 percent was proposed as being appropriate, which is in line with the regulated pipeline business.

260
Figure 11.9 The proprietary case for Blue Stream vis-à-vis the competitor
Do not invest/wait (base case)
Make strategic investment commitment (KG)
θθθθ
u
I D
E E
d
θθθθ θθθθ
D I D
θθθθ
DI DI DI DI
du du du
E E G G G
DI DI
DI
E E
G
DI DI
DI
E E
G
I D
E E
θθθθ θθθθ
I D I D
θθθθ
DI DI DI DI
du du du
E E G G G
DI DI
DI
E E
G
DI DI
DI
E E
C M M A C M M A C M M AC M M AS M S M S M S M S M S M S M S M
C C
Sta
ge
II
Sta
ge
I
Pe
rio
d 2
Pe
rio
d 1
20-239
1048411
26708
7321014
-959-960
-8870
-880-941
-8370
55481365
106310
158 -940
2410
19334866
-96010177
-86061
-960177
39723366
96720
-9609217
-9600
-819-905
-7180
-960-783
-9600
158-940
2410
0-960
00
-86061
-960177
-9600
-9600
-819-905
-7180
-960-783
-9600
-960-960
-9600
-960-960
-9600
-321305
-2516305
I
G G
323323
6 5
1 2 3 4
Assumptions:First-stage strategic pipeline investment by Gazprom: KG = 2,240 mln$Follow-up (second-stage) investment outlay by either Gazprom or its competition: IG = IE = I = 960 mln$Initial demand parameters: θ0 = 18.25 bcm (with θ1 = uθ0 or dθ0)Binomial up or down demand parameters: u = 2.00; d = 1/u = 0.50Risk-free interest rate: r = 0.055Risk-adjusted discount rate: k = 0.085 Operating costs: cG cE
No investment (base case) 9.93 9.93 $/mcmProprietary investment 8.54 8.54 $/mcm
Note: monetary amounts are in million$.Source: own analysis.
The model is now explained in 6 distinct steps (steps a. through f.). For period 2 in stage II, we take the case in which demand has moved upward in period 1 (i.e., branch u), and do not elaborate here on either the case in which demand falls or the base case. Notice that Figure 11.9 will be approached through backward induction, i.e., bottom-up.
11.2.6.2 Model application and backward induction373
a. Stage II, Period 2, Sub-game 1 (in Figure 11.9; frame ) State of demand in the Turkish market: At the beginning of period 2 in stage II, demand has already shifted upwards once in period 1, from 18.25 bcm to 36.5 bcm. In period 2 in
stage II demand either shifts upwards again, to 73 bcm, i.e., 2 0(i.e., )x u x uθ θ , or
falls back to 18.25 bcm, 2 0(i.e., d)x u xθ θ .
373 All state project values are noted in $ millions.
1

261
• State of demand in period 2 in stage II: 2 0(i.e., )x u x uθ θ = 73 bcm
If demand rises to 73 bcm in period 2 in stage II, the two model outcomes with the opti-mal payoffs for Gazprom are the ones where it ends, respectively, as a dominant firm or leader (S-L) and as monopolist (M), respectively. From the competitor’s perspective it is compelled in this sub-period either to invest in the case when demand rises in period 2, becoming a follower (S-F) in the process and obtaining a payoff of 1,365, which is greater than deferring and obtaining 0. So the competitor ends this particular sub-game with its own decision to invest even though Gazprom may prefer to obtain 10631.374
• State of demand in period 2 in stage II: 2 0(i.e., d)x u xθ θ = 18.25 bcm
If demand shifts to 18.25 bcm in period 2 in stage II, the competitor will lose on its in-vestment, obtaining -940 as a follower. Therefore, the competitor subsequently opts for deferral, obtaining 0 rather than -940, which implies that Gazprom is able to become a monopolist (M) in this particular sub-game if demand falls, deterring entry altogether in the Turkish gas market. In this situation, Gazprom is able to severely limit the competi-tor’s profitability (thanks to its strategic investment), compelling it to choose between 1) not entering the market or 2) being compelled to accept substantially lower profits as a follower (S-F), while Gazprom obtains a payoff of 241.
b. Stage II, period 2, sub-game 2 (in Figure 11.9, frame )
• State of demand in period 2 in stage II: 2 0(i.e., )x u x uθ θ = 73 bcm
Referring to Figure 11.9, sub-game 2 yields dominant payoff values of 1933 and 4866 for Gazprom and the competitor, respectively. In this particular sub-game, Gazprom makes the last move of the game, as it deferred investment in the first period and demand has yet to shift, its actions themselves acting as a constraint on what the competitor can choose for. Thus the competitor may have preferred obtaining 10,177 rather than 4,866, however Gazprom is able to invest commercially, adding commercial pipeline capacity, ending as a leader (S-L) with a payoff of 1933.
• State of demand in period 2 in stage II: 2 0(i.e., d)x u xθ θ = 18.25 bcm
Sub-game 3 yields payoffs of -860 and 61 for Gazprom and the competitor, respectively. Here it is Gazprom which ends the game as a follower (S-F) while conversely the competi-tor ends as a leader (S-L).
374 Gazprom would thus become a monopolist in outcome (M) in the event that the competitor defers in the case of a rise in demand in period 2, obtaining 0 instead of 1,365. So the competitor, having the last word in this sub-game (for it still has a chance to invest with a rise and/or fall in demand), will obviously choose 1,365 rather than 0, in which
case it invests ( { , }E D I ) in follow-up capacity, i.e., in a pipeline with only a technical ramp-up phase, making gas
available to the market quickly in order to earn a commercial return on investment.
2

262
c. Stage II, Period 2, sub-games 3 and 4 (in Figure 11.9, frame and ) In the same manner as has been done in the first two sub-games discussed above, the op-timal strategies are derived for sub-games 3 and 4.
• Sub-game 3: State of demand in period 2 in stage II: 2 0(i.e., )x u x uθ θ = 73 bcm
The competitor is now again in a position to make the last move in the sub-game, which acts as a constraint on Gazprom’s choices. However, in this panel of the sub-game (frame 3), Gazprom did not invest commercially in period 1 and neither did the competitor (see below). Both Gazprom and the competitor have the incentive to invest, ending in a du-opoly model outcome (C), with payoff values 3,972 for Gazprom and 3,366 for the com-petitor, respectively.
• Sub-game 4: State of demand in period 2 in stage II: 2 0(i.e., d)x u xθ θ = 18.25 bcm
Given the additional penalty that arises in the case of a deferral twice in periods 1 and 2, Gazprom has the dominant strategy to supply a quantity at a negative state project value. Conversely, the competitor has a dominant strategy to defer, which leads to a monopoly outcome for Gazprom. Gazprom ends with a payoff of –718 and the competitor with 0. d. Stage II, Period 1, games 1 and 2 (in Figure 11.9, frame and ):
• Game 1: State of demand in period 1 in stage II: 1 0{ } x uθ θ= = 36.5 bcm
The results listed above for the various sub-games are fed back into the first period of the second stage by backward induction. Here Gazprom has built a strong position by invest-ing strategically in stage I. In this first period of stage II, the payoffs include values 20, 1,048, 26 and 732 for Gazprom and -239, 411, 708 and 1,014 for the competitor, result-ing from the state-contingent project values above (i.e., from the various sub-games). A duopoly model outcome results in period 1, when Gazprom and the competitor both decide to invest already in the first period (in period 1, stage II) yielding payoffs 20 for Gazprom and -239 for the competitor. Both parties opt for deferral at this stage, obtaining values 732 and 1,014, respectively, despite and initial rise in demand. e. Backward induction of period 1 (stage II), to stage I:
Finally, the period 1 payoffs for Gazprom help determine, again via a next step of back-ward induction, whether the strategic investment is worth making net of its initial capital
investment cost, GK , the amount invested in excess of a base case pipeline of 8 bcm/y.
The stage I payoff for Gazprom is -321 while for the competitor it is 305. When the stra-tegic investment is subtracted as well, i.e., the amount obtained from K – I, the overall NPV for Gazprom of building Blue Stream is –2,516. Thus, according to the real-option game model, the Blue Stream case demonstrates that the pipeline has an overall negative Net Project Value of $2,516 million, which is far below to the overall NPV (i.e., including the option value) under the base case of $305 million (refer to the top right two numbers in Figure 11.9).
4 3
5 6

263
f. The various value sub-components
As noted in the model, the total value of the early strategic investment can be measured by using formula 4.6. The composition of a total value into the different strategic value com-ponents is discussed below. The game is initiated at an initial demand level of 18.25, and the binomial parameters u = 2 and d = 0.5 determine a number of different demand levels. Table 9.1 shows how the
equilibrium actions ( *GQ ), profits ( *
Gπ ), the state-contingent project values (NPV*
G),
and the various value components (the direct, reaction, pre-emption and postponement values) vary with different levels of demand. As has been shown in the games and sub-games above, every demand level leads to dominant strategies on the part of both players. For simplicity, the following numerical explanation is based exclusively on the model’s results in the last row in panel B, Table 11.10, specifically the case in which demand has risen twice to 73. Here, Gazprom ends up as a leader firm (S-L), where it supplies 33 bcm/y with a profit of 542. In this specific case, Gazprom uses its existing infrastructure adjacent to the capacity of the Blue Stream pipeline. At this level of demand, and given the cost functions as a result of the proprietary investment, Gazprom has effectively been able to ensure a large share of the market as a dominant or leading firm. The competitor ends as a follower producing 15 bcm/y, merely half of what Gazprom supplies. Table 11.1 Second-stage equilibrium state project values and strategic effects for different market structures and states of demand for the base and proprietary pipeline investment case
Panel A – Base Case
Demand Market Structure Quantity Profit NPVG Market Structure Postponement Base Case (Static) (Dynamic) value NPV*G
5 Cournot Nash 0 0 (960) Abandon 960 0
9 Cournot Nash 0 0 (960) Defer 960 0
18 Cournot Nash 3 8 (881) Defer 881 0
37 Cournot Nash 9 78 (157) Defer 1230 1073
73 Cournot Nash 21 442 3563 Cournot Nash 0 3563
GQ*
G*π
Panel B – Proprietary Pipeline Strategic Investment
Demand Market Structure Quantity Profit Direct Reaction Pre-emption Commitment Postponement NPV*G
(Dynamic) value value value value value
5 Abandon 0 0 4 (40) 960 960 (960) 0
9 Defer 0 0 1 0 122 123 (960) (837)
18 Monopoly 5 24 12 17 1078 112 (881) 241
37 Defer 0 0 131 46 758 889 (1230) 732
73 Stackelberg 33 542 305 104 1576 1984 0 5548
GQ*
G*π
Strategic
Note: Totals may not add up due to rounding. Monetary amounts are in million$.Source: own analysis.
θ
θ

264
The proprietary case must be compared with the base case (panel A of Table 11.1) in order to determine the difference between making the strategic investment commitment and remaining at the original level of economies of scale, i.e., not building Blue Stream and sticking to an 8 bcm/y pipeline. In the base case, at the same level of demand, the NPV is 3,563 and both firms produce 21 bcm/y via existing and new infrastructure. Since the overall NPV is positive in the base case, the postponement value of investing strategi-cally is zero. The direct and strategic value As was explained in the Section 4.6 of Chapter 4, the net commitment value consists of various components: the direct, reaction and pre-emption values (refer to the appendix in Chapter 4 for a detailed explanation of how these values are calculated). These values are shown in panel B of Table 11.1: The direct value of Blue Stream for Gazprom, attained due to the benefits of economies of scale alone is 305. The additional value of undermin-ing the profitability of the potential entrant’s investments is 104, i.e., the strategic reaction value, while the value of altering the structure of the market altogether, the pre-emption value of Blue Stream, is 1,576. This last value is the value attained by shifting from a model outcome involving duopoly (C) to one where Gazprom ends as the leading firm (S-L). The postponement and net commitment values The strategic reaction value and the pre-emption values together determine the strategic value. The net commitment value, which is computed by adding the direct to the strategic value, is therefore 1,984 (= 305+104+1,576). In this case the postponement value is zero, because in the base case scenario the NPV is also positive as a result of strong upward demand potential. The overall Net Project value Finally NPV*
G of Blue Stream for Gazprom is the NPV in the base case (3,563), added to the net commitment value (1,984) and the postponement value (0), which is 5,548 in total, i.e., $5,548 million.375 Note that this is not the Overall Net Project Value of the Blue Stream pipeline to Gazprom (which has been determined as –$2,516 million; see the end of the previous step e.). The value of $5,548 million, which has been reconstructed here as illustration of the sub-component analysis, is to be found as one of the end-of-period-2 values in Figure 11.9 (see in bottom-left box, indicated as frame 1). 11.2.6.3 Sensitivity analysis
Sensitivity analyses are designed in this context to measure the effect of changes in input variables, such as the binomial upward-move parameter (u), the risk-adjusted discount rate
375 The postponement value is a negative number in case the static NPV is below zero for the base case, added, when applicable, by the option value when deferring a commercial investment (I) in period 1 in stage II.
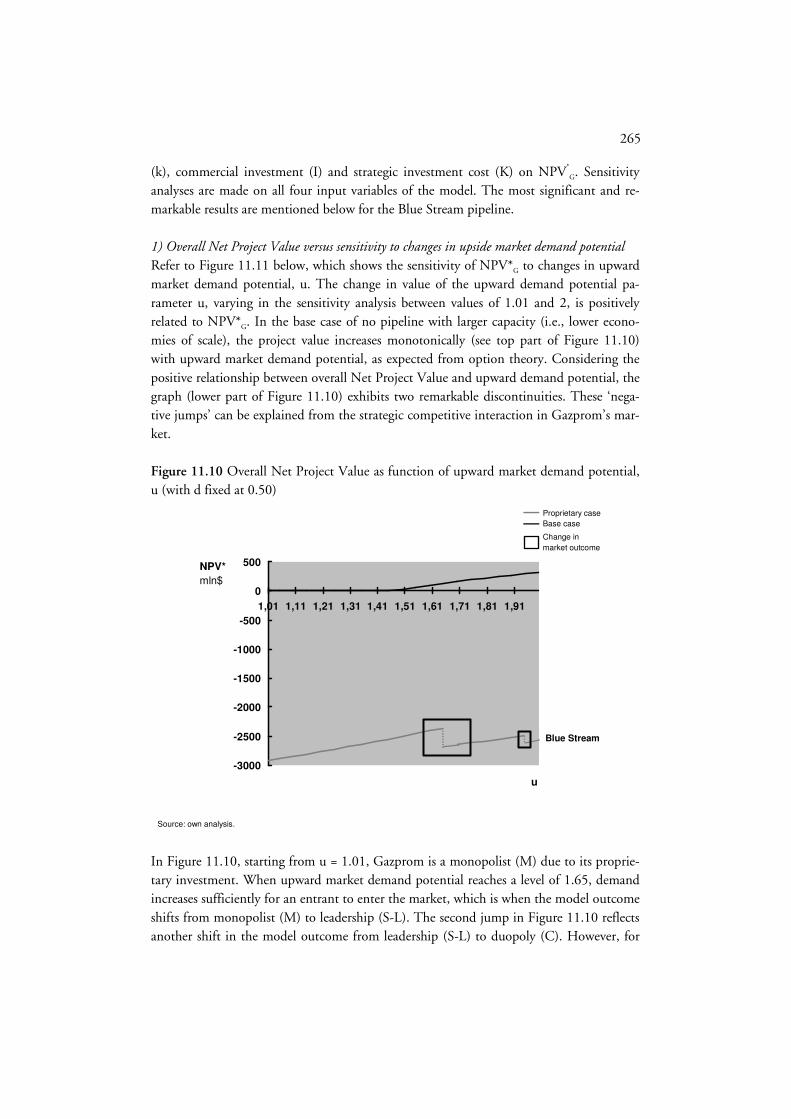
265
(k), commercial investment (I) and strategic investment cost (K) on NPV*
G. Sensitivity analyses are made on all four input variables of the model. The most significant and re-markable results are mentioned below for the Blue Stream pipeline. 1) Overall Net Project Value versus sensitivity to changes in upside market demand potential Refer to Figure 11.11 below, which shows the sensitivity of NPV*G to changes in upward market demand potential, u. The change in value of the upward demand potential pa-rameter u, varying in the sensitivity analysis between values of 1.01 and 2, is positively related to NPV*G. In the base case of no pipeline with larger capacity (i.e., lower econo-mies of scale), the project value increases monotonically (see top part of Figure 11.10) with upward market demand potential, as expected from option theory. Considering the positive relationship between overall Net Project Value and upward demand potential, the graph (lower part of Figure 11.10) exhibits two remarkable discontinuities. These ‘nega-tive jumps’ can be explained from the strategic competitive interaction in Gazprom’s mar-ket. Figure 11.10 Overall Net Project Value as function of upward market demand potential, u (with d fixed at 0.50)
-3000
-2500
-2000
-1500
-1000
-500
0
500
1,01 1,11 1,21 1,31 1,41 1,51 1,61 1,71 1,81 1,91
u
Source: own analysis.
Proprietary case
Base case
NPV*
mln$
Blue Stream
Change in
market outcome
In Figure 11.10, starting from u = 1.01, Gazprom is a monopolist (M) due to its proprie-tary investment. When upward market demand potential reaches a level of 1.65, demand increases sufficiently for an entrant to enter the market, which is when the model outcome shifts from monopolist (M) to leadership (S-L). The second jump in Figure 11.10 reflects another shift in the model outcome from leadership (S-L) to duopoly (C). However, for

266
all parameters of u, NPV*G remains negative for Blue Stream given the model’s applica-tion. 2) Overall Net Project Value versus sensitivity to changes in the WACC Refer to Figure 11.11 below, which shows the sensitivity of NPV*G to changes in the risk-adjusted discount rate k (i.e., the WACC). From the rise in the slope of the curve, it can be derived that the NPV*
G rises substantially with a small decrease in k, both in the base and proprietary cases. This result is logical, because future cash flows are discounted at a lower rate (i.e., a higher present value), with the NPV*
G rising most rapidly in the interval (0 < k < 11), in both the proprietary and base cases. This sensitivity analysis shows that when Gazprom accepts a lower risk-adjusted rate of return, the strategic value components rise in the overall Net Project value. In the proprietary case, NPV*
G experiences two jolts at separate values for k of 10 and 23 percent. These small jumps in the curve are related to the change in market outcome as result of the competitor’s entry. Figure 11.11 Overall Net Project Value as function of the WACC
-3000
-2500
-2000
-1500
-1000
-500
0
500
1000
1500
2000
1% 11% 21%
NPV*
mln$
Source: own analysis.
WACC
%
Proprietary case
Base case
Change in
market outcome
Blue Stream
3) Overall Net Project Value versus sensitivity to changes in average operating costs per unit Refer to Figure 11.12, which shows the sensitivity of NPV*G to changes in OPEX (c). With an increase in c, the NPV*G of the project decreases in the various value components of the pipeline: both in the direct value of attaining greater economies of scale, as well as in the deterrence effect. The small jumps in the curve are related to the change in market outcome from monopolist (M) to leadership (S-L) after $60-65/mcm for Gazprom.

267
Figure 11.12 Overall Net Project Value as function of unit operating costs, c
-3000
-2500
-2000
-1500
-1000
-500
0
500
0 20 40 60 80
Source: own analysis.
Proprietary case
Base case
NPV*
mln$
c
$/mcm
Change in
market outcome
Blue Stream
11.2.7 A reflection on Blue Stream and competitors’ projects outcomes: ex-post
Turkish gas market structure
The model: Limitations The model is able to provide a quantitative assessment of the Blue Stream project regard-ing market demand uncertainty and potential entry. The model helps explain the strategic value, which transcends the commercial value as far as deterring entry is concerned. The overall value that the model has determined for the Blue Stream project is highly negative at approximately –$2.5 billion. Apart from the precise value, this implies a clearly negative verdict on the project. In support of this model verdict, we have learnt from various expert interviews that Blue Stream is generally felt to be a commercial disaster, though it did lock out other potential gas suppliers from the Turkish gas market in the process. Of course the application of the model has its shortcomings. The most important ones are listed below:
a. The model only accounts for two players; it cannot simulate or account for a greater number of gas suppliers, while in the real world obviously there are many more existing and/or potential gas suppliers.
b. The model, composed of a two-stage game, only lasts for a limited number of pe-riods. After the game has taken place, the situation is assumed to remain in a steady state, where developments remain frozen. Of course, real world develop-ments are highly dynamic, not static as the model suggests, and continue long af-ter the ‘game’ is finished.

268
Model results: Discussion The application of the real-option game model in the Blue Stream case demonstrates that the pipeline is has a negative overall NPV of $2.5 billion, given of course the various as-sumptions and simplifications that have been made when introducing the model. This means the project was a financial fiasco both commercially, as well as strategically. Never-theless, the pipeline did have some deterrence effect in the real world, since it locked other important suppliers in the region, such as Turkmenistan and Iran, out of the Turkish market. On the basis of the sensitivity analysis above, the pipeline may well have had a greater direct value if its economies of scale had been higher (i.e., a pipeline capacity greater than 16 bcm/y), combined with higher initial market demand. According to expert interviews, the 16 bcm/y capacity was the highest possible technically achievable limit of offshore capacity in the late 1990s, exacerbated by the complex nature of the Black Sea’s sea floor. Furthermore, expert interviews reveal that the pipeline’s low utilisation rate after its completion (as it occurred historically in the real world) added to the pipeline’s loss in commercial value. According to these interviews, Gazprom treated Blue Stream as a sunk cost (i.e., by not charging its customers part of the total transport costs of the pipeline), which artificially enhanced the economies of scale. In this way it (still) serves as a deterrent. This underlines the importance Gazprom may perhaps attrib-ute to deterring entry in the Turkish market. The Blue Stream project in real world thus was successful with respect to potential long-run competition. However in hindsight, the anticipated growth in gas market demand was too optimistic and other (legal) aspects came into play, which may have rendered Gaz-prom’s investment in the Blue Stream premature. With regard to the real world, the model naturally has its limitations (see the end of this chapter). Ex post analysis: was Blue Stream a premature investment? By 2004, Turkey was consuming 22.4 bcm of gas, importing 13.1 bcm worth of those volumes from Russia through the Blue Stream and via the ‘longer’ route through the Trans-Balkan pipeline. In 2008, Turkey consumed 37.2 bcm, 21.4 bcm of which came from Russia (through the two aforementioned pipelines).376 This afforded Gazprom a stable 58 percent share of the emerging Turkish gas market in 2004 and 2008 market. Other pipeline gas contenders in Turkey in 2008 included Azerbaijan (through the South Caucasus Pipeline – SCP, see also below) at 4.6 bcm (12 percent), Iran at 4.1 bcm (11 percent). Turkey’s LNG imports included 4.1 bcm from Algeria (11 percent) and 1.0 bcm from Nigeria (3 percent). Other supplies were produced domestically (1 bcm) [IEA 2009a; Gazprom 2009]. After the US invasion of Iraq in 2003, Iraq also became a poten-tial source, but by no means a secure gas exporter to Turkey and beyond.
376 Russia’s deliveries are measured in European bcm’s from Gazprom [2009]. IEA [2009b] estimates Russia’s exports to Turkey at 22.5 bcm in 2008.

269
Had Gazprom ignored the potential of Turkey’s dynamic demand growth and given up on the risky Blue Stream project, Turkey’s demand may well have been satisfied by a greater share of gas from the other suppliers mentioned, by means of both pipeline and LNG flows as well as possible Trans-Caspian gas flows from Turkmenistan. Gazprom’s move thus resulted not only in a large market share; it limited other suppliers’ penetration in the Turkish market. Essentially, combined with Gazprom’s price setting policy and Russia’s pro-active policy in the Caspian upstream sector, Gazprom pre-empted flows originating from Turkmenistan through the TCGP. Additionally, Turkmen gas flows to Russia were contracted. To a more limited extent, Iran’s possible exports were also pre-empted. However, according to the results of the model application, the Blue Stream project was a very expensive strategy in order to preserve its position in the Turkish (and European) market. Blue Stream did not discourage market entry of small Iranian(/Turkmen’s) supplies, en-tered via the construction of pipeline from Iran to Turkey in 2001, respectively LNG re-gasification terminals. However, these volumes are not substantial (by case, circa 1-7 bcm/y in 2007). The pipeline also has not discouraged market entry of Azeri gas. Namely, after the (unexpected) discovery of the Shah Deniz field in 1999 in Azerbaijan, another pipeline project became subject of discussion, the so-called SCP. The SCP runs parallel to the BTC pipeline from Baku via Georgia and connects with the Turkish gas network, close to Erzurum. However, the volumes were not substantial and therefore not a signifi-cant threat to Gazprom (a maximum of 6.6 bcm/y from 2006 to 2020).377 Given the negative value of the overall NPV, we could be compelled to conclude that Gazprom’s investment in the Blue Stream pipeline has just as well been premature, given Turkey’s market uncertainty and relative small absolute market volume. Among other factors, as a result of the political crisis and the economic recession in Turkey during the beginning of the 2000s, the previously expected growth of the Turkish gas market proved to be too optimistic. Combined with all new signed import contracts, this resulted in a period of contractual oversupply of the Turkish gas market. Moreover, in 2001, Turkey passed a Natural Gas Market Law, with the intent of ending government control of the natural gas sector; in order to eliminate inefficiencies and harmonize its energy policy with that of the EU. The IMF also pushed for the liberalisation of the Turkish gas sector. This included the break up of Botas into separate units for natural gas import, export, storage and distribution by 2009. Pressing Botas’ break-up might also be seen as a countervailing move on the part of the IMF to reduce Gazprom’s strategic advantage. Botas was not allowed to sign new import contracts until its share in imports fell below 20 percent of the national consumption [State Planning Organisation 2005; Hacisalihoglu 2008].
377 The current capacity is 8.8 bcm/y. After 2012 the capacity could still be raised to 16-20 bcm/y (see also Case study 2). The pipeline has approximately cost $1 billion. At a later stage Georgia wanted to off take Azeri gas as well, partly as a compensation of the right to transit through the country. Moreover, Georgia wanted to diversify away from Russia’s gas [US Department of Energy 2009; Stern 2005].

270
Consequently, both the management of Botas and the Turkish Ministry in charge wanted to renegotiate their contract with Gazprom and halted Turkish off-take. At the end of 2003, a new contractual agreement had been signed for 8 bcm/y in which the correspond-ing price was reduced and the tax regime amended. Due to these problems, the rela-tionship between Botas and Gazprom was undermined. Hence, Gazprom examined possi-ble exports via the Blue Stream pipeline to Syria and Israel, in which case Turkey would become a transit country. From a theoretical point of view, Gazprom expanded its strate-gic growth option geographically. The same can be said for the European market: securing the Turkish market may be seen as an important stepping stone in capturing future Euro-pean demand. Moreover, Gazprom bought an interest of 40 percent in the distribution company Bosphorus gas, in order to sell its gas directly on the Turkish gas market [Victor and Victor 2006; Stern 2005]. The Blue Stream pipeline was subject to financing and organisational feasibility issues too. Notably, it was built in the immediate aftermath of Russia’s 1998 financial crisis. In order to mitigate off-take risks, Gazprom signed long-term contracts with Botas. By using Eni, these and other country risks were partially mitigated. Moreover, the Blue Stream pipeline also reduced the transit risks for Russia’s gas supplies to Turkey, particularly with regard to the longer Balkan route. The Blue Stream case offers the benefit of hindsight, being a historical example that can be used to better understand examples of future potential strategic moves, such as those de-scribed in case study 2 and 3. In Case study 2, the Blue Stream pipeline is also dealt with on a sub-regional rather than at a regional, country level.

271
11.3 CASE STUDY 2: Gazprom versus competition in the South Southeast
European gas market
Case study 2 is an investigation of how Gazprom’s Blue Stream strategy in Turkey can be repeated, this time on a larger scale. The market under consideration is SSEE378, a region where consumption is expected to rise and where import-dependency already stands at 80 percent. In addition, this region is the potential gateway for pipeline gas flows from the Caspian Sea region to other parts of Europe through Turkey (c.f., Case study 1). For Gaz-prom, the stakes are thus high.New Russian gas flows could materialise via slated Gaz-prom’s midstream projects such as South Stream and maybe via current overcapacity in the Blue Stream (and/or a new extension). Given the historical case of Blue Stream and other existing infrastructure and flows within the SSEE gas market, the period of analysis is set in the future. Gazprom faces a newer, yet similar, threat to the one presented in Case study 1 through a possible aggregation of Caspian (and Iranian, Middle East) supplies via the so-called ‘southern corridor’.379 In addition, Gazprom faces possible competition from LNG and North African pipeline gas suppliers in SSEE markets. 11.3.1 Background
Composed of a diverse set of gas markets, the SSEE gas market is a relatively immature market, compared to the NWE market. There are two sides to this gas market in terms of maturity. On the one hand there are the Italian, Austrian and Hungarian gas markets, which are quite mature in terms of infrastructure as well as the connection between these two markets and the remainder of the European gas market as a whole. The Italian market itself accounts for the bulk of gas consumption in this sub-region, equalling more than all the remaining gas markets in it combined. On the other hand, there are much smaller, comparatively less well-developed gas markets in infrastructural terms, such as Greece and gas markets of the former Yugoslavian countries (Slovenia, Croatia, Serbia, Bosnia-Herzegovina, and Macedonia), Bulgaria and Albania. Romania is a mature gas market, but not well interconnected with the remainder of the European gas market. In addition, some countries such as Greece and the Balkan countries, still have embryonic gas markets, com-bined with relatively low absolute demand. All these countries, except Greece, were once part of the CMEA system of gas distribution. In a category of its own is the Turkish gas market, which was discussed at length in the previous case study. The Turkish gas market is geographically farther removed from the remainder of the European gas market. With the likely increasing import-dependence of the SSEE gas market on sources of pipe-line gas and LNG outside Europe, due to possibly rising demand and lower indigenous
378 In this study, SSEE is defined by Austria, Hungary, Former Yugoslavian countries (Slovenia, Croatia, Serbia, Bos-nia-Herzegovina, and Macedonia), Rumania, Bulgaria, Albania, Greece, Italy and Turkey.
379 The most quoted proposal is the Nabucco project, planned to start from the Turkish border. Other midstream projects are also under consideration (or are already under construction) to connect pipeline capacity from the Eastern border of Turkey with the off-take markets in Europe, such as White Stream, Interconnector Greece Italy (IGI) and TAP.

272
supplies, room is made for other existing and/or potential suppliers. As was briefly men-tioned in Chapter 8, this sub-region of the European gas market is primarily dependent on pipeline supplies from Russia and Algeria, and, to a more limited extent, from Norway, Iran, the Netherlands, Libya and Azerbaijan. LNG producers, such as Qatar and Nigeria, are also shipping modest gas volumes to the some of the SSEE markets. It is mainly these pipeline and LNG suppliers, which could more deeply penetrate this section of the Euro-pean gas market, as can other gas suppliers farther away. Figure 11.13 provides a schematic overview of gas transport and supply to SSEE (see also Map 8.2 in Chapter 8). Figure 11.13 Schematic overview of competing gas supply, transport routes and delivery points, from the Caspian region and Russia to the SSEE market
NIOC
SCP
Gazprom
Azerb.
Azer-baijan
4th Corridor
Georgia
Turkeytransit
South Stream
Blue Stream
Russia Bulgaria
TGI IGI
Greece
Baumgarten
Italy
Alb.
Nabucco
TAP
Majorsales options
Iran Turkey
Note: excluding existing and planned/proposed supplies and transport routes from Europe, Algeria, Libya, and LNG suppliers; not all transit countries are included; The overview is schematic and therefore not accurate. Source: own analysis, company information; figure adapted from StatoilHydro information.
Ka
za
ch
sta
n
Turkmenistan
Black Sea
Iraq
Egypt
AGPChina/ others
Uzb
ek
ista
n
CAC
Caspian Sea
TCGP
Ukrainian transit routes
Possible delivery points
Possible markets
Existing transport route
Planned/proposed transport route
Pre
-Ca
sp
ian
Option 1
Option 2
11.3.2 Demand-side factors in the South Southeast European gas market
From Gazprom’s perspective, the first step in assessing whether or not to invest strategi-cally in the South Stream project is ascertaining market uncertainty on the demand side. This first step is prescribed in the conceptual toolbox in Chapter 4. In this particular case, the demand of all the various countries in the SSEE region is aggregated into one single whole for analytical simplicity. Volume (and price) risks play an important role in the SSEE market. It holds much potential in the way of additional import requirements, a fact which fits into the overall pattern of declining pan-European gas production and rising import-dependency. Capitalising on rising SSEE import-dependency by capturing the increased market potential in this market may provide an incentive for suppliers to com-petitively establish a position in there.

273
Though at an aggregate level oil is the dominant fuel in the primary energy mix in the SSEE markets, the potential for gas is rising, in both the power generation and industrial sectors. Indeed, currently, most of SSEE’s natural gas is used for power generation and industry. Turkey has large growth opportunities, both in absolute and relative terms and relies currently almost equally on oil, gas and coal for its energy consumption [BP 2009].380 The gas markets in Hungary, Austria, Bulgaria and Italy are mature, whereas Italy is by far the largest gas market (around 80 bcm in 2008) in SSEE [BP 2009]. Roma-nia’s gas market is highly mature, natural gas being the most prominent energy source in this country; its domestic production is expected to decline from around 10 bcm/y to almost nil over next two decades. For Hungary too, gas has an important share in the primary energy mix, followed by oil and coal. In Italy and Austria, gas also has a signifi-cant share, although oil is the most dominant primary energy source, whereas coal is the traditional energy source in Bulgaria. Figure 11.14 shows that Italy, Turkey and Romania developed as the largest consumers of gas in SSEE in terms volume. Combined with the other relatively small gas markets, gas consumption in the SSEE markets has increased from 26 bcm in 1965 to 165 bcm in 2008 [BP 2008; BP 2009]. Figure 11.14 Natural gas consumption in SSEE markets until 2008 per country
Note: Excluding former Yugoslavian countries and Albania until 2000. Source: own analysis, based on BP [2008; 2009]; privately disclosed company data.
0
50
100
150
200
1965 1970 1975 1980 1985 1990 1995 2000 2005
Year
Gas
consumption
In bcm 165
104
86
60
26
Turkey
Italy
Romania
HungaryGreeceBulgariaAustria
Former Yugoslavia/Albania
Government-owned monopolies dominated the gas sector in SSEE for decades and still do so in most SSEE markets. As a result of EU-level liberalisation and privatisation processes, combined with the adjoined goal of creating a single internal gas market within the EU, the different markets were forced to open their markets to competition. In Italy, SNAM (part of the ENI group), Enel and Edison dominate the Italian gas sector. In Austria and Greece, OMV and Public Gas Corporation of Greece (Depa), respectively, still have a
380 Only Serbia relies on coal instead of oil [IEA 2009].
274
monopoly over import contracts. In some former CMEA-countries, which became EU-members in the period 2004-2007, Gazprom and West-European gas companies have entered the markets through greenfields, M&As, and joint ventures with existing govern-ment-owned gas companies.381 Most of the Balkan countries and Turkey are not subject to EU legislation, and therefore are still dominated by government-owned monopolies. In 2008, Gazprom acquired a controlling stake in Serbia’s government-owned oil and gas monopoly National Energy Services (NES) [Financial Times 2008]. Turkey, however, as described in Case study 1, was forced to liberalise and partially privatise its gas sector by the IMF [OECD 2002; Hacisalihoglu 2008]. Nevertheless, Botas is still the dominant player in Turkey. According to industry estimates, gas will remain important in the region and it will in-crease in importance in the energy mix of the different SSEE gas markets. In absolute terms, Italy and Turkey are identified as the most attractive markets by volume. Relatively, other markets are expected to grow faster, but in absolute terms they are less significant (some only reaching a consumption level of 6 bcm between 2008 and 2030). Due to de-clining domestic production in Romania, the growth of imports in this market is substan-tial. Nevertheless, there still are volume risks in these SSEE markets (for some suppliers, rela-tively even more risks). At first, the fundamental volume risk is related to uncertainty about GDP development and the corresponding gas demand growth. The economic crisis of 2008/09 had resulted in a demand reduction and may have an impact on gas demand in the mid-term, depending on the length and depth of the crisis (see also Figure 11.15). Secondly, the Balkan countries still have embryonic gas markets and there are limited interconnections and distribution networks to connect new trunk lines with the main off-take centres. Although the EU and the US financed feasibility studies during the 1990s to stimulate cross-border initiatives, the Balkan region is not yet well-developed in terms of cross-border pipeline networks [SECI 1998]. These littoral states and the related risks may lead to a passive attitude on the part of gas exporters when considering whether to invest in greenfield projects. Thirdly, in some former CMEA-countries there is discussion about the (supplementary) role of Russian (Gazprom’s) gas in the primary energy mix for secu-rity of supply reasons. This is largely a result of the Russia-Ukraine gas disputes of 2005/06 and 2008/09 and the absence of interconnections (and other crisis management mechanisms) to manage possible supply cuts.382 Finally, some contracts are still based on subsidised prices in several countries (e.g. Romania and Bulgaria) as a barter deal for Gaz-
381 For example, Hungary’s gas company MOL has accomplished a joint venture (Panrusgaz) with Gazprom. Govern-ment-owned gas companies still play an important role in these markets (MOL in Hungary, Bulgargaz in Bulgaria, and Romgaz and Conef in Romania).
382 See Chapter 12 for a deeper analysis on the Russia-Ukraine transit relation and the impact on Russian supplies and transport to Europe.

275
prom’s transits via these countries [Stern 2005]. Introducing market prices that conform to these contracts may lead to lower gas demand since they may be driven up as a result. On the price side as a whole, market uncertainty is relatively high. Gas prices are largely tied to oil and oil product prices in the SSEE markets. Oil prices are volatile and have fallen from $147/bbl to $40/bbl in late 2008, and back to $70-80/bbl in the winter of 2010. These oil prices have their impact on long-term contracts in Europe, albeit with a six-month lag. However, the long-run marginal and unit costs of the different supply and transport options of most of the various suppliers are still lower than the current gas prices. Gas trading on a short-term basis via gas-to-gas competition is less prevalent than is the case in the NWE market. The Central European Gas Hub (CEGH) at Baumgarten (in Austria) and Punto di Scambio Virtuale (PSV) in Italy are European gas trading hubs, which are less liquid than the UK’s gas hub (NBP). 11.3.3 Various potential gas suppliers to the South Southeast European market
The SSEE market is supplied by a number of different suppliers in the form of both pipe-line gas and LNG. Traditionally, the SSEE gas market as a whole is not an LNG import-ing region, though some countries, such as Italy and Turkey, have begun to import mo-dest amounts of LNG (see below). Existing pipeline gas supply flows come from indige-nous production and mainly from two major pipeline gas suppliers outside this sub-region: Algeria and Russia (see Figure 11.15). 1) Volumes which are produced and consumed domestically:
From 2008 to 2040, the level of indigenous production has decreased from 23 bcm in 2008 to 20 bcm in 2020, and is projected to decrease further to 4 bcm and 0 bcm by the years 2030 and 2040, respectively. Nearly all produced gas is consumed domesti-cally.383
2) Volumes which are supplied through existing LNG and pipeline contracts from outside the SSEE market and outside the EU: Algeria supplies Italy and Slovenia by pipeline and it exports small LNG volumes to Turkey (in total 31 bcm in 2008). Russia supplied a total of 68 bcm to the region in 2008 (see also Figure 10.9 in Chapter 10). Despite the ability of Turkey and Italy to afford a greater diversity of supplies, the countries in SSEE rely mostly on Russian gas. Norway (8 bcm in 2008) and the Netherlands (9 bcm in 2008) have some long-term contracts with companies in the northern periphery of SSEE (mainly in Italy). Libya supplied 10 bcm in 2008 to Italy via the Greenstream pipeline. Azerbaijan and Iran are carrying some gas to the Turkish market (both around 4-5 bcm in 2008), al-
383 The domestic production is largely concentrated in Romania (11.4 bcm in 2008), Italy (9.3 bcm in 2008), and to a lesser extent Croatia (2.9 bcm in 2008), Hungary (2.6 bcm in 2008), and Austria (1.5 bcm in 2008). Other SSEE countries produced less than 1 bcm in 2008 [BP 2009].

276
though these contracts are not solid. Finally, Nigeria supplied 1 bcm worth of LNG in 2008 to the Turkish market. According to privately disclosed company data, other supplies not included above which may have changed hands were part of contractual swaps (mainly between German and French gas companies and Gazprom).
3) Volumes which could arrive in the SSEE gas market through new capacity in the form of LNG and/or pipeline gas: Most of the existing contracts will expire in the second decade of this century. Only Gazprom is likely to maintain substantial contractual obligations (and thus also the volumes) in the SSEE market as a whole. Based on the available information about contracts, a certain amount will doubtlessly be renewed, holding mostly for pipeline gas from existing producers, such as Algeria. However, assuming that the contracted volumes will expire in the coming years, there is space for new supplies, due to possi-ble increasing demand and decreasing domestic production (circa 75 bcm in 2020 and 200 bcm in 2030). As a result, a large number of pipeline and LNG projects are planned and proposed for the coming decades.
Figure 11.15 Existing and pending supply distribution over SSEE demand projection (2001-2040)
0
50
100
150
200
250
300
350
2001 2006 2011 2016 2021 2026 2031 2036
Gas volume
in bcm
Year
214
264
125
161
179
xxx
xxx
Demand projection
Demand projection with correction
of economic crisis
Existing pipeline contracts Russia
Existing contracts Algeria*
Other existing contracts**
Possible pipeline capacity from Libya***
Possible pipeline capacity from Russia†
Indigenous production
Possible pipeline capacity on Eastern Turkish border‡
Possible pipeline capacity from Algeria††
Regas capacity under construction‡‡
Regas capacity under study/proposal‡‡
Existing pipeline contracts Iran
* Both pipeline (up to 42.8 bcm/y) and LNG (7.9 bcm/y) volume contracts.** Among others, the Netherlands (up to 10 bcm/y); Libya LNG (8 bcm/y); Norway (7.5 bcm/y); Azerbaijan (6.6 bcm/y); Qatar LNG (6.3 bcm/y); Egypt LNG (4.8 bcm/y); Nigeria LNG (4.6 bcm/y); Germany (2.6 bcm/y). *** Extension of the Greenstream (3 bcm/yr). † South Stream (63 bcm/yr).†† Extension of Transmed (6.5 bcm/yr) and Galsi (8 bcm/yr).‡ Iran-Turkey pipeline (up to 20 bcm/yr); SCP (up to 20 bcm/yr); Trans-Arabic (up to 10 bcm/yr), some of the capacity has already been used. To be extended by midstream project, such as Nabucco (31 bcm/yr).
‡‡ In Italy, but also one in Croatia.
Note: Existing contracts are based on ACQ bcm/y. Linear trend extrapolation (via the method of least squares) after 2030 for
indigenous production (based on 2020-2030) and demand (based on 2025-2030). Source:own analysis, based on IEA [2009]; Cedigaz [2009]; CIEP [2008]; MEES [2008]; privately disclosed company data.

277
Referring to Figure 11.15, a high degree of oversupply can be discerned when adding all the various potential projects up to volumes provided through existing supply contracts, as well as the volumes arising from the possible extension of these contracts. The flows mate-rialising on the basis of existing contracts from suppliers outside Europe alone account for some 138 bcm in 2020 (including indigenous production of 10 bcm), that is to say with the exclusion of possible volumes rolled-over from existing supply contracts. In addition, aggregating all re-gas and pipeline capacity under construction, study or proposal, export-ing countries can supply the SSEE market with an additional potential of 205 bcm in 2020. The market structure of competition from a Russian perspective (by using the first matrix in Chapter 4, Figure 4.1) in SSEE appears fairly oligopolistic. Below is a more detailed analysis of the various gas infrastructure and suppliers likely to play key roles in the SSEE market vis-à-vis Russian gas.
Possible new pipeline supplies from Russia As described in Case study 1, the Trans-Balkan pipeline was one the first pipelines which catered first Soviet, and now Russian gas to SSEE markets, followed by the Blue Stream pipeline to Turkey at turn of the century. Before the construction of the Trans-Balkan pipeline, other Soviet pipelines (e.g., the Transgas pipeline) were connected to Italy, Aus-tria and Hungary through the Ukrainian pipeline system. The latest of Gazprom’s propo-sals for a new gas pipeline to Europe is South Stream; this initiative was announced in June 2007. This proposed gas pipeline would become the second offshore pipeline to cross the Black Sea (and of course Blue Stream is the first one to do so).384 The South Stream pipeline increases the Europe’s gas import capacity, particularly for Italy, and to a lesser extent Austria, Bulgaria, Hungary and the Balkans (and probably Romania). South Stream’s initially projected offshore capacity was 31 bcm/y, gradually scaled up to 47 bcm/y in March 2009 and then even to 63 bcm/y in May 2009 [WGI 2009a], respectively, in an apparent bid to improve its economies of scale. The South Stream is scheduled to be finalised before the end of 2015, subject to a degree of uncer-tainty.385 South Stream is slated to transport gas from Russia, Turkmenistan and Kazakh-stan. However, it is unclear whether sufficient gas volume will be available for South Stream (see also Chapter 10). Figure 11.16 provides an overview of the various stake-holders of the project and other details pertaining to the South Stream pipeline.386 From
384 The pipeline runs from Beregovaya on the Russian Black Sea coast to Varna in Bulgaria and from there onwards, splitting up between two proposed branches: southwards via Greece (or Macedonia and Albania) to Italy; and north-wards via Serbia to Hungary and (via Slovenia) to Austria in Baumgarten. Discussions are also underway that may see the pipeline land in Romania rather than in Bulgaria. Gazprom had also purchased 50 percent of Austria’s CEGH in Baumgarten, also see Chapter 10.
385 The offshore section is expected to cost EUR2.3 billion, while the total cost of the entire route would be EUR8.6-20 billion, according to the latest estimations of Gazprom and ENI [WGI 2009a].
386 ENI and Gazprom hold a 50 percent interest each in the offshore section. It is expected that EDF will attain a 20 percent stake in the offshore section by reducing ENI’s and Gazprom stake by 10 percent, although negotiations are still underway [WGI 2009a].

278
the point at which the pipeline lands ashore in Bulgaria onwards, South Stream would in principal be subject to EU legislation (except for some Balkan countries). This implies TPA for the pipeline’s capacity, which eliminates the exclusive right of using the capacity by the pipeline’s owners (Gazprom and ENI). Possibly, the project may be exempted from TPA.
Figure 11.16 The South Stream project
50%
50%
xxxx Year of start-up
Pipeline project Shareholders
X% Share in project
Governments/business involved
** Contracts n.a. Main off takers – other (transit) countries may take off gas as well.** Some ‘Russian’ gas exports through South Stream to Europe could possibly be imported by Gazprom from Central Asian countries. Source: own analysis, based on Gazprom and ENI information.
Off take* Transit Production**
Onshore transit
Offshore transit
Onshore and offshore transit
25%
50%
25%
Bulgarian section
Offshore section
2015+
South Stream
49%
51%
Serbian section
49%
51%
Hungarian section
Reasons for construction
• Planned transportation capacity 63 bcm/y
• Extra volume Russian gas for Southern Europe
• Deters new gas volumes from the Caspian region
• Avoiding Ukraine and Turkey – diversifying transit risk
Possible new pipeline supplies from Turkey’s eastern border In the public debate about European gas imports much discussion has arisen concerning the export potential of the Caspian Sea region for European gas markets.387 In the Caspian Sea region, Turkmenistan and Azerbaijan could potentially supply Europe with additional gas. However, Europe must compete with Iran, Russia and China for volumes from the region (also see Chapter 9). Gazprom also committed itself to purchasing new gas supplies from Turkmenistan, and possibly other Caspian suppliers against market-based prices, which will reduce the availability of gas supplies to Europe. Iran may one day become a major potential gas exporter to Europe, though this currently is theoretical and a long-term prospect. According to IEA [2008d], there is unlikely to be enough production capacity to supply additional volumes to Europe in the mid-term, as a
387 Chapter 9 provides an overview of the export potential in the Caspian region.

279
result of a lack of investment capital due to the Iran Sanction Act (ISA) sanctions, and other political risks.388 In the mid-term, other feasible trans-Turkey gas supplies could materialise from Egypt and Iraq, and possibly other Middle Eastern gas exporting countries in the longer-term. Egypt may become a pipeline supplier to Europe, with a volume of around 2 bcm/y through the Arab Gas Pipeline (AGP).389 Although Iraq has relatively low-cost (associated) gas reserves, and some (unofficial) agreements are signed, Iraqi gas available for exports is still subject to a great deal of uncertainty due to country and legal risks and increasing domestic demand [CIEP 2008]. From the area of Georgia, Iran, Iraq, Syria and Turkey, there is also competition in terms of gas flows (i.e., gas shipping) destined further downstream into the European (and SSEE) markets, i.e., the southern corridor, also see Figure 11.13 above. 1. The possible Caspian and Middle Eastern supplies on the Eastern border of Turkey
could feed the domestic system of Turkey for its rising demand. According to Botas, demand could reach 56 bcm/y by 2015 and 76 bcm/y by 2030. Turkey’s current con-tractual surplus is set to become a deficit from 2012 onwards, although the current economic crisis could change this outlook [IEA 2008c].
2. Turkey could re-export Caspian and Middle Eastern gas to other European markets via two proposed pipelines using Turkey’s domestic gas pipeline network (foreign shippers may perhaps ship these volumes as well). Once having arrived at this point, these flows could tap into the Turkey-Greece-Italy Interconnector (TGII) and/or the Trans-Adriatic Pipeline (TAP) [IEA 2008c].390
3. The Nabucco pipeline does not connect new gas fields with the European market. It should be seen starting from the Baumgarten hub in Austria in the EU en route to Turkey via Bulgaria, Romania, and Hungary, ‘in search’ of new supplies from both the Caspian region. These could include Iran and potentially other Middle Eastern gas sources. It is a joint venture of gas companies of the mentioned five countries, to-
388 Iran is currently only exporting a small amount of gas to Turkey via the Tabriz-Erzurum gas pipeline (a maximum of 9 bcm/y, and there were significant difficulties in fulfilling this gas contract) [IEA 2008d]. The only pipeline com-mitment to a European supplier was made in March 2008 with the Swiss energy company Elektrizitäts-Gesellschaft Laufenburg AG (EGL) for gas deliveries (5.5 bcm/y) via the existing Iran-Turkey pipeline and the aforementioned Trans-Adriatic pipeline to EGL’s power plants in Italy [IEA 2008d].
389 The AGP pipeline has a maximum capacity of 10 bcm/y and links Syria via Jordan to Egypt, and then extended to Turkey and Iraq by 2009. Egypt supplies are very uncertain given the increasing domestic demand and planned LNG liquefaction capacity [CIEP 2008].
390 The TGII pipeline aims to link Turkey, Greece and in a second stage, Italy, the first leg between Turkey and Greece already being in operation, with an initial capacity of 3.5 bcm/y (to be extended to 11 bcm/y). The TAP pipeline would connect Greece to Italy via Albania, estimated to be operational in 2012 with an initial capacity of 10 bcm/y (up to 20 bcm/y) [IEA 2008c]. StatoilHydro’s participation in Azeri Shah Deniz field, combined with a 50 percent share in the TAP pipeline may improve project’s bargaining power in acquiring Azeri supplies [IEA 2008c].

280
gether with German RWE [CIEP 2008].391 It is designed to construct a gas corridor that realises transmission and supply diversification, primarily independent of Russian influence and therefore heavily backed diplomatically by the US and the EU [De Jong 2008].392 Figure 11.17 provides an overview of the Nabucco project and its sharehol-ders.
Figure 11.17 The Nabucco project
xxxx Year of start-up
Pipeline project Shareholders
X% Share in project
Governments/business involved
Off take* Transit** Production***
Onshore transit
Offshore transit
Onshore and offshore transit
Reasons for construction
* Main off takers – other (transit) countries may take off gas as well.** Depending on gas source for Nabucco, also other transit countries involved (see for example TCGP).*** The gas sources for Nabucco are highly uncertain, either for political reasons (e.g. Iran) or available production capacity(e.g., Central Asia). Source: own analysis, based on Nabucco information.
2014+
Nabucco
16.7%
16.7%
16.7%
16.7%
16.7%
16.7%
• Planned transportation capacity 31 bcm/yr
• Diversification from Russian gas supply – additional gas supply for Europe
• Increasing bargaining power EU versus Russia
4. The White Stream393 pipeline aims to bring Caspian gas across the Black Sea from
Georgia either to directly to Romania, or via the Crimea in the Ukraine (Ukraine ac-tively promotes the project), independent from transit (and supplies) through Russia and Turkey. The initial capacity is slated at 8 bcm/y, which could rise to 32 bcm/y. The commercial and supply feasibility of White Stream is still subject to much uncer-tainty [IEA 2008d].
Possible new pipeline supplies from North and West Africa (excluding Egypt) During the 1980s, Algeria, Tunisia and Italy constructed the TransMed pipeline from Algeria to Sicily in Italy (and Slovenia) via Tunisia. In 2008 the TransMed gas pipeline
391 The initial stage of 8-10 bcm/y is expected to come on stream by 2014, whereas full planned capacity (at 31 bcm/y) is expected to be reached by 2019 [IEA 2009b].
392 The total expected cost are EUR7.9 billion. The six shareholders have granted a third-party access exemption for 50 percent of the total capacity, whereas the other 50 percent are open for third-parties [De Jong 2008].
393 The White Stream is formerly known as the Georgia-Ukraine-European Union (GUEU) pipeline.

281
was extended from 27 bcm/y to 33.5 bcm/y [CIEP 2008]. Another planned gas pipeline, the Gasdotto Algeria Sardegna Italia (GALSI) pipeline, will connect the Algerian supply sources with Sardinia and further to Livorno in Toscana (Italy). Its design capacity is 8 bcm/y and is expected to be operational in 2012 [CIEP 2008].394 The availability of gas in the Algerian gas system might increase if the Trans-Saharan Gas Pipeline (TSGP) from Brass in Nigeria via Niger to Algeria were to be built.395 Libya has built only one gas pipeline (the Greenstream) directly to Sicily in Italy, which has a transportation capacity of 8 bcm/y (the pipeline could be extended to 11 bcm/y by mid-2010s) [CIEP 2008]. New re-gasification capacity in the SSEE market During the late 1970s, the first SSEE’s LNG re-gasification terminal was built in Pani-gaglia in Italy (capacity of 3.5 bcm/y). This project was followed by two re-gas terminals in Turkey (in the Marmara region and Izmir, respectively 6.5 bcm/y and 6.0 bcm/y) and one in Greece (Revithoussa, 1.4 bcm/y, with an expansion of 3.8 bcm in 2007). The LNG market in SSEE is still embryonic, but is likely to expand in the coming decades (mainly in Italy). Two re-gas terminals are already under construction in Italy (with a combined capacity of 11.8 bcm). On Krk Island in Croatia, one re-gas terminal is planned with a capacity of 8 bcm/y, while other planned and proposed re-gas terminals are located in Italy (i.e., in Sicily, Brindisi, an extension of Panigaglia, Le March, and Rosignano).396 This capacity is no guarantee for actual LNG supplies, so it still uncertain as of yet whether LNG is available in order to fill the re-gas terminals (see also Chapter 12). Following the conceptual procedure designed to assess whether or not to invest strategi-cally, developed in Chapter 4, demand is assessed given the information above along with the slated supplies (which includes potential LNG flows). Given the base case scenario of demand growth, one can discern a high degree of oversupply in SSEE markets by 2010. This can be deduced by adding existing supply contracts. Added to this are newly forth-coming volumes arising from the new possible supply contracts, volumes pertaining to which could be provided via midstream greenfields to Europe. The market structure of competition from a Russian perspective (by using the first matrix of the conceptual tool-box in Chapter 4, Figure 4.1) in SSEE appears fairly oligopolistic.
394 Sonatrach works in partnership with four Italian companies in constructing the pipeline (Sonatrach’s share in the consortium is 41.6 percent). According to the agreement between Sonatrach and Gazprom, it is possible that Gazprom will have a stake in the GALSI pipeline.
395 The TSGP has a maximum volume of 20-30 bcm/y and is planned to operate in 2015 onwards. Gazprom, Total and Sonatrach have expressed an interest to participate in a planned Trans-Saharan gas pipeline (in order to gain access to Nigeria’s vast gas reserves) [Financial Times 2009].
396 Outside Italy some LNG regas terminals are also under consideration, such as in Albania, which is part of the Trans-adriatic pipeline project [Cédigaz 2008]. However, these are still too speculative to taken into account.

282
An examination of the different levels of economies of scale attainable for gas volumes channelled to the SSEE markets helps assess to what extent certain sources can compete with Russian gas, depending on the netback prices involved. In terms of gas supply costs, Azerbaijan, Iran, Iraq, Algeria and Egypt by pipeline are all competitive sources of gas for Russia in the SSEE market. Other Caspian countries (e.g. Turkmenistan) and Libya are also competitive for Russia, with their unit costs undercutting those of Russia. These po-tential suppliers therefore impose a threat in market power terms (price-cost margin) vis-à-vis Russia. Moreover, the next generation of gas production in Russia (but also, for in-stance, in Turkmenistan) will have to come at higher unit costs, which may reduce Rus-sia’s relative market power in price-cost terms. In terms of unit costs, the possible entry of LNG played a smaller role, largely due to lower economies of scale (although this tends to differ by source). Iranian, Turkmen, Algerian and, to a lesser extent, other Caspian and North African sup-pliers have the potential to become important suppliers to the SSEE markets. However, Iranian supplies to Europe are highly uncertain due to ISA sanctions. In addition, Iran and other Caspian countries already have other export commitments. Referring to the second matrix in Chapter 4.2, the competition level of Algerian and aggregated Caspian and LNG supplies is significant. Therefore, combined with the strategic importance of the Caspian production capacity in Gazprom’s gas balance, and the relatively low market uncertainty, Gazprom may again consider a strategic investment. This will be examined on the basis of the application the quantitative model (see Chapter 4.3) in the next section of this case study. Gas supply costs to the SSEE market In terms of total or long-run marginal gas supply costs, of which the economies of scale in transport and upstream production are key determinants (see Figure 4.2 in Chapter 4), Libya and Algeria are the most competitive sources of gas in the SSEE market (respectively $109/mcm and $95/mcm), due mainly to the proximity of these countries to the SSEE market by pipeline, especially in the case of the Italian market. Sources such as Iran and Iraq clock in at $85/mcm and $97/mcm for new gas for SSEE. The long-run marginal costs of supply costs for LNG from Qatar and Nigeria are significantly slightly higher (also see Section 9.4 on market power). Indicative long-run marginal costs in 2020 for gas from Turkmenistan through South Stream costs $215/mcm compared with $152/mcm for gas from Turkmenistan to Greece and $185/mcm to Italy. In terms of LNG, Nigerian LNG costs $172/mcm and from Qatar $154/mcm. Algerian LNG for the SSEE market costs $161/mcm [IEA 2009c]. 11.3.4 Other investment variables in relation to new investment projects
Before applying the model, other factors with regard to new gas supplies should be consi-dered in a qualitative matter, in line with Barnes et al. [2006].

283
1) Foreign investment climate in gas supplier countries As an extension of Case study 1, the focus here is primarily on supplies from the Caspian region and Russia.397 The most important gas-rich regions that could potentially supply the SSEE gas market(s), where the investment climate could have a considerable impact on available supplies (and most relevant for South Stream) are the Caspian Sea region, Iran and Iraq, the southern corridor countries. As has been highlighted in Chapter 9, the in-vestment climate for private investors in the Caspian Sea region is not favourable, few companies have established a firm presence in the region. As covered in Chapter 6 in Boon von Ochssée [2010], due to international sanctions, political risks and an unattractive buy-back scheme in place for foreign investors in the oil and gas sector, Iran’s investment cli-mate also leaves much to be desired.398 In Russia, private (Western) investors perceive relatively limited access to secure invest-ment terms and ownership rights. In addition, Gazprom has a monopoly over Russia’s gas exports. Inasmuch as this perception has an impact on Gazprom’s access to Western know-how and technological expertise in dealing with difficult projects, it can affect the potential for the development of a number of upstream resources. In order to mutually share benefits and risks, foreign investments in Russia are in general based on asset-swap constructions and joint ventures [Victor and Victor 2006]. Conversely, Gazprom is often impaired in its access to downstream assets by EU-level initiatives, such as those included in the Third Energy Package, which specify a limit on foreign holdings within the Euro-pean gas markets; consider for that matter the ‘Gazprom clause’ [De Jong 2008]. 2) Transit, permit and regulatory risks Both Russian and Caspian gas flows are exposed to transit risks. Central Asian supplies are subject to uncertainty over permits concerning offshore transport via the Caspian Sea, because the Caspian Sea does not suit simply into any existing categories offered by inter-national law. The uncertainty surrounding the definition of the Caspian basin either as a sea or a lake, combined with environmental concerns (which Russia has sounded, see be-low), may result in delaying the construction of any offshore pipeline [IEA 2008c]. Iranian transit offers no alternative, because of US-driven political sanctions. The political instabi-lity in the South Caucasus, meanwhile, was exacerbated by the Georgia-Russia conflict in August 2008. This brief clash increased perceived transit risks and made it more difficult to finance new pipeline projects in this region. The role of Turkey cannot be understated, it is the lynch-pin for gas volumes from the Caspian Sea region to European markets, playing an important strategic role as a key po-tential transit state for a number of sources. A possible new gas corridor via Turkey is ex-
397 Most of these issues are already covered in Chapter 9 and 10, and in particular in Case study 1.
398 For instance, in 2008 a number of foreign investors (Total, StatoilHydro, Shell and Repsol) backed out of Iran [IEA 2008d].

284
posed to direct security risks when it comes to impact of separatist Kurdish activities in Southeastern Turkey. More importantly, however, Botas is not satisfied with the transit role it is has been relegated to (on a cost plus basis). Turkey wants to create a gas hub, where it can act as a middleman, buying and selling gas and capturing the resulting eco-nomic rents [De Jong 2008].399 South Stream would bypass Ukraine and Turkey–in which the strategy underlying South Stream differs from the Blue Stream strategy–and insulates Gazprom’s gas supplies to SSEE from any political risk in transit countries (e.g. Ukraine, Moldova, and Turkey) between Russia and the EU [CIEP 2008].400 Possibly transit in Balkan countries outside the EU may also result in some problems, because these countries are not subject to all EU and/or international legislations. Within the EU, pipeline investments are subject to regu-lation and other EU legislation, which expose a pipeline investor to policy and regulatory risks. For instance, TPA may undermine strategic investments, because a pipeline investor is forced to ‘share’ its capacity with potential competitors unless an exemption is awarded. 3) Geopolitical factors Geopolitical factors most certainly play a central role in the South Stream case. Two im-portant geo-economic forces compete with one another in terms of gas flows: on the one hand, the US and some factions within Europe want to break-up Russia’s transport (and production) control over the Caspian gas, thus weaning European gas markets off their dependence on Russian gas (for an extensive discussion on the geo-strategic roles of the Euro-Atlantic community, see Chapter 8 and chapters 3 and 11 in Boon von Ochssée [2010]. On the other hand, Russia aims to maintain its control over volumes from the Caspian Sea region and their flow to European gas markets.401 These opposing forces are
399 Turkey, well aware of its vital geographic position between the Caspian Sea region and South Eastern Europe, has sought to capitalise on it by acting as a reseller of gas transiting or due to transit through its territory. It refuses merely to act as a transit country, but sees itself as a resell hub akin to Russia for the Central Asian countries (also see Chapter 9). Turkey’s relationship with Russia has long dogged by commercial disagreements since the economic problems arising after the Blue Stream’s construction (also see Case 1). Ironically, this also acts as a barrier for Russia to export its gas via the Blue Stream pipeline to Europe. After a recent visit to Ankara by Putin, an improvement of relations ap-pears to be materialising between [MEES 2009].
400 Instead, the South Stream pipeline must transit the territorial waters of Ukraine and Romania, which could result in construction delays (owing to necessarily permit rights). As a result of commercial problems between Gazprom and Turkish Botas, of which Botas is not satisfied with its ‘only’-transit role, Gazprom currently abandoned to build addi-tional capacity via the Blue Stream for European destiny [De Jong 2008]. Nevertheless, Gazprom is studying on building extra capacity via the Blue Stream to boost its supplies to Turkey and probable Middle Eastern countries and Israel. Thus in addition, Russian gas strategy appears to take into account the need to prolong the deadlock between Turkey, Azerbaijan and the Nabucco consortium and the need to avoid a confrontation with Ukraine over the routing of the pipeline through the Black Sea [MEES 2009].
401 As former deputy CEO Komarov of Gazprom stated: “I would also highlight the developing process of the return of Gazprom to the gas markets of the countries of the CIS both from the point of view of inclusion in our portfolio of Central Asian gas (Kazakhstan, Turkmenistan and Uzbekistan), as well as from the point of view of broadening co-operation with importing countries (Ukraine, Moldova, and Trans-Caucasia). I believe this to be very important both

285
the result of broader geo-strategic agendas. As far as the potential institutionalisation of pipeline initiatives backed by the US are concerned, the various actors have some political instruments to stimulate (non-commercial) investments in the Caspian region, which were already mentioned in earlier chapters and will be further discussed below. 11.3.5 Organisational and financial institutionalisation of the South Stream
and Caspian pipeline projects
The strategy and instruments designed to realise possible pipeline investments varies both for the South Stream and the southern corridor, Where in the case of South Stream, Rus-sia uses vertical energy diplomacy to ensure the project’s success. Russia employs foreign policy tools such as government-backing of Gazprom’s investment initiatives. In South Stream’s case, Russia has nurtured close bilateral ties with Italy and Bulgaria, for example, and has important traditional ties with Serbia, to which the South Stream is to branch off.402 Agreements between government officials in various transit countries and Russia has subsequently facilitated business-to-business progress. In a way similar to Nord Stream (see Case study 3) political commitment could act in support of long-term take-or-pay con-tracts between Gazprom and mid-streamers in the SSEE market (e.g., ENI, OMV, Magyar Olaj és Gázipari Részvénytársaság – MOL), where government support in the off-take countries can alleviate demand uncertainty. In model terms, Gazprom as a firm employed Russia’s vertical energy diplomacy to secure upward demand potential. At the firm level, Gazprom’s potential vertical agreements with mid-streamers in the SSEE market(s) are in line with De Jong’s [1989] joint venture coordination mechanism. Ma-ture markets often feature greater tendencies towards cooperation between firms (also refer to Section 4.4), where the most important off-take countries in the SSEE market are still experiencing development toward a more mature market. Different from the Nord Stream strategy, no gas contracts have been concluded as of yet [De Jong 2008]. The South Stream project, in line with the Blue Stream, is part of a strategic alliance between the ENI and Gazprom, possibly added by EDF. Gazprom and ENI hold a 50 percent interest in the joint venture of the offshore section each. The mid-streamers, such as ENI and EDF, play a critical role for Gazprom in the Italian and other markets through their posi-tion as incumbents in that market, and their political backing from their respective go-vernments. The involvement of a Western company is necessary in the project, for financing and technical reasons. In line with the Blue Stream project, the repayments of the loans could be based on gas contracts between SNAM (a subsidiary company of ENI) and Gazprom,
from the perspective of guaranteeing the geopolitical interests of Russia as well as to assist in the integration process of the post-Soviet area” [IEA 2008d, pp. 16 - 17].
402 In the onshore transit countries, Gazprom cooperates with the national gas companies and in Bulgaria it also coop-erates with ENI. Intergovernmental agreements have been signed between Russia and Bulgaria, Serbia, Hungary and Greece. Negotiations are underway to sign the relevant agreements with Austria and Slovenia.

286
thus completely de-coupled from the project itself. This may result in less expensive loans via the so-called ‘warehouse’ construction (see Figure 4.3 in Chapter 4). However, it is uncertain whether these largely strategic commitments can be reasonably financed, espe-cially in light of the economic crisis in 2008/09. Linking Western ‘cash-rich’ mid-streamers to these projects in exchange for upstream interests appears to be a workable solution. As for horizontal energy diplomacy, Gazprom is actively involved in up- and midstream projects in other gas supplying surrounding Europe’s southern flank, such as Libya and Algeria, which were mentioned in Section 11.3.3. Russia has important traditional politi-cal ties with these two countries dating from the days of the Soviet Union. Russian go-vernment officials join Gazprom delegations in facilitating business arrangements. In the cases of both Libya and Algeria, Gazprom has expressed extensive interest in further in-volvement along the gas value chain, For example. Gazprom has announced an interest in taking a stake in the Greenstream pipeline consortium (also see above) and buying Libya’s total gas export portfolio [Argus Gas Connections 2007]. As explained extensively in Chapter 7 in Boon von Ochssée [2010], Russia is also involved in Algeria and appears to perceive North African gas suppliers as strategically important partners. By means of hori-zontal energy diplomacy, government-level relations help spearhead shared investments between Russia and Algeria as well as Libya. Egypt is another potential partner in this regard. Moreover, the Russian government is actively involved in acquiring Caspian pro-duction of Gazprom’s supply portfolio [Goldthau 2010].403 As for the institutionalisation of the southern corridor pipeline(s), different mechanisms come into play. Project supported by the US and the EU (i.e., Euro-Atlantic) are based on a different, more market-orientated agenda. Therefore, these projects preclude vertically integrated, government-backed solutions as portrayed by the Russian approach described above. In general, the TSOs have no economic-strategic interests in a pipeline (i.e., they have no stake in the actual commodity), the only interest they have is shipping gas on a commercial basis. For instance, the Nabucco pipeline is intended to be owned by mid-streamers, which do not have any significant upstream interests (yet). Such a business model limits Nabucco’s bargaining position and its overall feasibility, particularly with regard to attaining supplies and reducing the strategic viability of these projects. Some pipeline projects, as mentioned above, are (partly) owned by up-streamers, which could stimulate their feasibility. In recent years, through both political instruments and financial institutions, such as the IMF, the World Bank and the EBRD, the Euro-Atlantic community attempts to stimulate
403 For Russia, this has come as an expedient in delaying the possible realisation of the Trans-Caspian route underneath the Caspian Sea (also discussed in Case study 1). Russia concluded a deal with Kazakhstan on the countries’ division of the Caspian Sea). Additionally, although it was likely not the reason, the Russo-Georgian conflict in August 2008 has resulted in additional perceived investment risks with regard to Georgian transit.

287
gas flows from the Caspian Sea region. The US mainly has a geo-strategic and economic interest to moderate Russia’s influence in the West, as mentioned in Chapter 8 and Chap-ters 3 and 11 in Boon von Ochssée [2010]. The World Bank and the EBRD could facili-tate pipeline investments by means of favourable loans for projects that aim to secure a European stake in the Caspian Sea region. Whereas the EU and its institutions maintained a relatively passive stance towards the Caspian Sea region and its gas reserves, since 2006 the EU has a more proactive policy towards the region. For instance, the planned Caspian Development Corporation (CDC) aims to create an entity to aggregate and catalyse gas production and infrastructure development by constructing a mechanism for co-ordinated gas purchasing.404 In this manner, a cluster of Western organisations, companies and insti-tutions aim to replicate the ‘warehouse’ model, mainly by using Western loans from inter-national financial institutions for financing such projects instead of long-term gas con-tracts. Although this is a significant change from Europe’s earlier classical approach, pro-ducers in Caspian region may not accept the creation of ‘middlemen’, because such enti-ties may capture large resource rents.405 11.3.6 Application of the model to the South Stream case
As a next step, we apply the real-option game model to the South Stream case. From a country-level application, we move to a sub-regional one. The goal is the same as in the Blue Stream: to assess the overall value of the South Stream pipeline in the face of market uncertainty and potential rival moves. An important aspect to take into consideration is that South Stream is a project, which is yet to be built and the effects of which, at the time of this writing, still lie far into the future (i.e., it is an ex ante analysis). To the greatest degree possible, the assumptions below are designed to approximate real world figures and numbers in the context of the relevant market circumstances and gas infrastructure in-vestments. 11.3.6.1 Assumptions and parameter values
Operational assumptions: a. We assume the SSEE gas markets collectively consist of a duopoly, with Gazprom on
the one hand and a potential competitor on the other, with the latter acting as a po-tential entrant for new market demand with an 8 bcm/y pipeline, both on a distance
404 Endorsed by the European Council, the Energy Council and the European Parliament, the CDC is a mechanism designed to act as a purchasing consortium for Europe gas buyers, though the concept is still rather ambivalent. The terms of reference of a feasibility study which is being promoted by the European Commission, the World Bank and the European Investment Bank (EIB) are outline the goal of providing gas producers in the Caspian Sea region with the “visibility on prospective aggregated gas demand from the EU, in order to trigger a firm commitment on their side to supply natural gas to the EU in sufficient quantities and for the long-term [Eurogas 2009].
405 Another proposal to encourage the Nabucco project was launched by the EU as well, in which it decided to allocate EUR200 million from the European Economic Recovery Plan [Euractiv.com 2010]. A pro-active policy of (continen-tal) Europe towards the Caspian region or cooperation with Russia’s infrastructure proposals may undermine US predominance in the region.

288
of 3,212 km to the off take market (offshore section: 908 km; onshore section in to-tal: 2,304 km). (No account is taken of potential LNG suppliers at this stage.)
b. Gazprom faces the choice in 2009 (i.e., stage I) of starting to build or deferring the construction of the South Stream pipeline across the Black Sea to Bulgaria onwards in the face of potential entry by a competitor.
Parameter value assumptions:406 a. Average operating gas transport costs in the base case: In the base case, both players
are assumed to make commercial investments only, i.e., constructing small-diameter pipelines with a capacity of 8 bcm/y, which only have a technical ramp-up phase. In this case it means both players do not undertake early strategic commitment to the
market, meaning the operational unit costs remain at: $80.4 /mcmG Ec c= = . At
this point, neither player yet benefits from economies of scale. b. Average operating gas transport costs in the proprietary case: The construction of
the South Stream is a proprietary investment. Gazprom decreases its average opera-tional unit costs from $80.4/mcm to $15.4/mcm as the pipeline has greater econo-mies of scale (from 8 bcm/y in the base case to 63 bcm/y in the proprietary case). This represents the move away from the base case and towards the proprietary case. The competitor is assumed to use an 8 bcm/y commercial pipeline capacity at the same distance (i.e., the base case situation with an average operational unit costs of $80.4/mcm).
c. First-stage strategic pipeline investment (K): The initial cost of building the Blue Stream, K (totalling $11.275 billion), is defined as the difference between the CAPEX for South Stream minus the ‘theoretical’ CAPEX for a 8 bcm/y commercial invest-ment covering the same distance, I (totalling $8.788 billion).407
d. Follow-up investment outlay by either Gazprom or the competitor (I): Follow-up investment outlay, made after stage I and thus after the incumbent’s strategic invest-ment, corresponds with a base case commercial 8 bcm/y pipeline investment covering the same distance ($8.788 billion).
e. Initial demand parameter ( 0θ ): For simplicity, initial gas market demand in the
SSEE gas market is assumed to be 120.6 bcm (0
120.6θ = ) at 0t as detailed in the
conceptual description in Chapter 4. j. Binomial up or down demand parameters (u and d): In the model, demand is as-
sumed to be stochastic, moving up or down with binomial parameters u = 1.48 and d
406 See the conceptual discussion held in the toolbox in Chapter 4.
407 In order to calculate the ‘theoretical’ CAPEX as well as the average breakeven operating costs per unit, account is taken of inflation, the WACC (k), the risk-free rate (r), fuel and compression costs, etc. (see Chapter 4). In this case, the ‘theoretical’ value of the CAPEX for South Stream is used (see Chapter 4 for a definition of ‘theoretical’ values), which approximates the average of publically listed figures for the pipeline. The base case ‘theoretical’ pipeline CAPEX calculation is also based on 2009 input data, obtained from privately disclosed company sources. The inflation is assumed at 2.8 percent (based on the first half year of 2009), according to Eurostat data for the Euro area.

289
= 0.68, both at the beginning of periods 1 and 2 in stage II. Starting at 3t there is a
‘steady state’ of 25 years, i.e., no more upward and downward moves, as detailed in Section 4.3.5.
f. The risk-free interest rate: The risk-free discount rate is assumed to be 3.4 percent ( 0.034r = ).408
g. The risk-adjusted discount rate: The rate at which profits in the last stage are to be
discounted is set at 8.5 percent ( 0.085k = ).409 The project’s expected annual cash
flows extend over a period of 25 years, acting as an annuity. h. Risk-neutral probabilities: Given u, d, k and r, etc., it can be determined that p =
0.35 and 1-p = 0.65. Figure 11.18 Gazprom’s proprietary case for South Stream vis-à-vis the competitor
Do not invest/wait (base case)
Make strategic investment commitment (KG)
θθθθ
u
I D
E E
d
θθθθ θθθθ
D I D
θθθθ
DI DI DI DI
du du du
E E G G G
DI DI
DI
E E
G
DI DI
DI
E E
G
I D
E E
θθθθ θθθθ
I D I D
θθθθ
DI DI DI DI
du du du
E E G G G
DI DI
DI
E E
G
DI DI
DI
E E
C M M A C M M A C M M AC M M AS M S M S M S M S M S M S M S M
C C
Sta
ge
II
Sta
ge
I
Pe
rio
d 2
Pe
rio
d 1
50-8
680
40-0.6
472
2-9
40
3-9
30
125-7
1570
28-9
280
8318
-986
190
-94
1037
1490
-977
-90
19-9
190
-9-5
-90
28-9
280
4-9
40
190
-94
-40
-90
19-9
190
-9-5
-90
-5-9
-50
-9-9
-90
250
140
I
G G
33
Assumptions:First-stage strategic pipeline investment by Gazprom: KG = 11.2 mln$Follow-up (second-stage) investment outlay by either Gazprom or its competition: IG = IE = I = 8.8 bln$Initial demand parameters: θ0 = 120.26 bcm (with θ1 = uθ0 or dθ0)Binomial up or down demand parameters: u = 1.48; d = 1/u = 0.68Risk-free interest rate: r = 0.034Risk-adjusted discount rate: k = 0.085 Operating costs: cG cE
No investment (base case) 80.35 80.35 $/mcmProprietary investment 15.42 15.42 $/mcm
Note: monetary amounts are in billion$.Source: own analysis.
408 The risk free rate is based on the yield-to-maturity in October 2009 of a 10-year Euro-denominated (or the equiva-lent thereof) German government bond [Tradingeconomics.com 2009].
409 The risk-adjusted discount rate (the WACC) is based on information provided in expert interviews, where a WACC of between 8 and 9 percent was proposed as being appropriate, which is in line with the regulated pipeline business

290
Figure 11.18 is an overview of the various payoffs to Gazprom and the competitor in a decision tree, which is a direct application of Figure 4.8 in Chapter 4. Each node cor-responds with an up- or downward move in demand and the resulting decisions of Gaz-prom (denoted in Figure 11.18 and elsewhere by the letter G) and the competitor (or potential entrant, denoted in Figure 11.18 and elsewhere by the letter E), respectively, to
invest or defer (further) commercial investments ( { , }G I D and { , }E I D ) in stage II while
in stage I only Gazprom is assumed to invest as an incumbent. The highlighted (red) branches along the tree indicate the optimal actions along the equilibrium path.
Just as in Case study 1, for period 2 in stage II, we take the case in which demand has moved upward in period 1 (i.e., branch u), and do not elaborate here on either the case in which demand falls or the base case. Notice that Figure 11.18 will be approached through backward induction, i.e., bottom-up. 11.3.6.2 Model application and backward induction410
a. Stage II, Period 2
The upward and downward movements in demand in the leftmost branch of the tree (see Figure 11.18 above) and corresponding decisions to invest in follow-up capacity by Gaz-prom and the competitor (after a strategic investment has been made by Gazprom) yield the following dominant routes based on the state-contingent project values: • Sub-game 1: For Gazprom: 157 and 28 and 0 on both accounts for the competitor. • Sub-game 2: For Gazprom: 83 and 18; for the competitor: 19 and 0. • Sub-game 3: For Gazprom: 103; for the competitor: 7. • Sub-game 4: For Gazprom: 19; for the competitor: 0. b. Stage II, Period 1
The values listed above are fed back into period 1, on the basis of which Gazprom invests commercially, while the competitor defers. The competitor is unable to obtain its highest possible payoff in period 1 of stage II, i.e., 2, given Gazprom investment in this period for a payoff of 68. In Game 2, rather than investing, both players opt for a deferral in order to avoid a duopoly outcome in period 1 in which both would be worse off than under a deferral. Gazprom obtains 3 rather than 4 and the competitor obtains 0. As Smit and Trigeorgis [2004] argue, Gazprom may also prefer to remain unpredictable. c. Backward induction of period 1 (stage II), to stage I
Finally, the period 1 payoffs for Gazprom help determine, again via a next step of back-ward induction, whether the strategic investment is worth making net of its initial capital
investment, GK , the amount invested in excess of a base case pipeline of 8 bcm/y. The
410 All monetary amounts are noted in $billions rather than $millions as in Case study 1.

291
stage I payoff for Gazprom is 25 while for the competitor it is 3. When the strategic in-vestment is subtracted as well, i.e., the amount obtained from total CAPEX – I, the overall NPV (NPV*
G) for Gazprom of building South Stream is $14 billion into which has been factored all the upward and downward movements in demand, rival moves and resulting the NPVs resulting from each market outcome. The NPV*
G under the proprietary case is greater than under the base case (i.e., $14 billion for the proprietary case is higher than $3 billion for the base case). According to the result from the model, Gazprom should thus invest in the South Stream. d. The various value sub-components
The model’s application to South Stream yields value components in the same manner as in the Blue Stream case, using formula 4.6. The game is initiated at an initial demand level of 120.6 bcm, and the binomial parame-ters u = 1.48 and d = 0.68 determine a number of different demand levels over the model
periods. Table 11.2 shows how the equilibrium actions ( *GQ ), profits ( *
Gπ ), the state-
contingent project values (NPV*
G), and the various value components (the direct, reaction, pre-emption and postponement values) vary with different levels of demand. Hence, as has been shown in the games and sub-games above; every demand level leads to dominant
strategies on the part of both players. The example is taken of 2 0(i.e., )x u x uθ θ ,
where demand is 263 bcm/y. Table 11.2 Second-stage equilibrium state project values and strategic effects for different market structures and states of demand for the base and proprietary pipeline investment case
Panel A – Base Case
Demand Market Structure Quantity Profit NPVG Market Structure Postponement Base Case (Static) (Dynamic) value NPV*G
55 Cournot Nash 0 0 (9) Abandon 18* 9
81 Cournot Nash 0 0 (9) Defer 9 0
120 Cournot Nash 13 0.2 (7) Abandon 7 0
178 Cournot Nash 33 1 2 Defer 8 10
263 Cournot Nash 61 4 29 Cournot Nash 0 29
GQ*
G*π
Panel B – Proprietary Pipeline Strategic Investment
Demand Market Structure Quantity Profit Direct Reaction Pre-emption Commitment Postponement NPV*G
(Dynamic) value value value value value
55 Monopoly 20 0.4 4 0 9 13 (18)* (5)
81 Defer 0 0 11 0.1 1 12 (9) 3
120 Stackelberg 52 3 20 7 9 35 (7) 28
178 Monopoly/Stackelberg 81 7 32 16 18 66 (8) 68
263 Monopoly 124 12 51 22 55 128 0 157
GQ*
G*π
Strategic
* Additional 6 bln$ to postponement value because of additional investment (I) in order to realise total project’s CAPEX. Note: Totals may not add up due to rounding. Monetary amounts are in billion$.Source: own analysis.
θ
θ

292
For simplicity, the following numerical explanation is based exclusively on the model’s results in the last row in panel B, Table 9.2, specifically the case in which demand has risen twice to 283 bcm. Here, Gazprom ends up in a monopolist market outcome (M), supplying 124 bcm/y via its existing infrastructure and the South Stream pipeline with a profit of 12. At this level of demand, and given the cost functions as a result of the pro-prietary investment, Gazprom has effectively been able to ensure its position as a monopo-list, the competitor locked out of the market altogether. The proprietary case must be compared with the base case (panel A of Table 11.2 above) in order to determine the difference between making the strategic investment commit-ment and remaining at the original operating unit costs, i.e., not building South Stream and sticking to an 8 bcm/y pipeline. In the base case, at the same level of demand, the NPV is 29 for Gazprom, supplying 61 bcm/y via its existing and new infrastructure, while the competitor supplies 61 bcm/y as well (also at an NPV of 29). The direct and strategic value The net commitment values are shown in panel B of Table 11.2: The direct value of South Stream for Gazprom, attained due to the benefits of economies of scale alone is 51. The additional value of undermining the profitability of the potential entrant’s invest-ments is 22, i.e., the strategic reaction value, while the value of then altering the structure of the market altogether, the pre-emption value of South Stream, is 55. This last value is the value attained by shifting from a model outcome involving duopoly (C) to one where Gazprom ends as a monopolist (M). The postponement and net commitment values The strategic reaction value and the pre-emption values together determine the strategic value. The net commitment value, which is computed by adding the direct to the strategic value, is therefore 128 (= 51+22+55). In this case the postponement value is zero, because in the base case scenario the NPV is also positive as a result of strong upward demand potential. The overall Net Project value Finally NPV*
G of South Stream for Gazprom is the NPV in the base case (29), added to the net commitment value (128) and the postponement value (0), which is 157 in total.411 Note that this is not the overall Net Project value of South Stream to Gazprom.
411 The postponement value is a negative number in case the static NPV is below zero for the base case, added, when applicable, by the option value when deferring a commercial investment (I) in period 1 in stage II.

293
11.3.6.3 Sensitivity analysis
Pursuant to the approach used in Case study 1, the most significant and remarkable results are mentioned below for South Stream: 1) Overall Net Project Value versus sensitivity to changes in upside market demand potential As in the Blue Stream case, the change in value of the upward demand potential parameter u, varying in the sensitivity analysis between values of 1.01 and 2, is positively related to NPV*G. Considering the positive relationship between overall Net Project Value and up-ward demand potential, the graph (higher part of Figure 11.19) exhibits two remarkable discontinuities. These ‘negative jumps’ can be explained from the strategic competitive interaction in Gazprom’s market (notably, a shift in the model outcome from monopolist (M) to leadership (S-L), and from S-L to duopoly (C)).
Figure 11.19 Overall Net Project Value as function of upward market demand potential, u (with d fixed at 0.65)
0
5000
10000
15000
20000
1.01 1.11 1.21 1.31 1.41 1.51 1.61 1.71 1.81 1.91
u
Source: own analysis.
Proprietary case
Base case
NPV*
mln$
Change in
market outcome
South Stream
2) Overall Net Project Value versus sensitivity to changes in the WACC Refer to Figure 11.20 below, which shows the sensitivity of NPV*G to changes in the risk-adjusted discount rate k (i.e., the WACC). From the rise in the slope of the curve, it can be derived that the NPV*
G rises substantially with a small decrease in k, both in the base and proprietary cases. This result is logical, because future cash flows are discounted at a lower rate (i.e., a higher present value), with the NPV*
G rising most rapidly in the interval (0 < k < 13), in the proprietary case, while the base cases NPV*
G rises only slowly. This difference is very pronounced here, much more than in the Blue Stream case. This sensi-tivity analysis shows that when Gazprom accepts a lower risk-adjusted rate of return, the

294
strategic value components rise in the overall Net Project value. The critical value of k (the internal rate of return) is around 13 percent.
Figure 11.20 Overall Net Project Value as function of the WACC
-20000
0
20000
40000
60000
80000
1% 11% 21%
WACC
%
Source: own analysis.
Proprietary case
Base case
NPV*
mln$
South Stream
3) NPV*
G versus sensitivity to changes in unit operating costs Refer to Figure 11.21, which shows the sensitivity of NPV*G to changes in OPEX (c). With a decrease in c, the NPV*G of the project rises in the direct various value compo-nents of the pipeline: both in the direct value of attaining greater economies of scale, as well as in the deterrence effect. Direct value rises strongly, given upward market potential and the absolute size of the SSEE gas market. The jump in the curve is related to the change in market outcome from monopolist (M) to leadership (S-L) after $40-45/mcm for Gazprom.
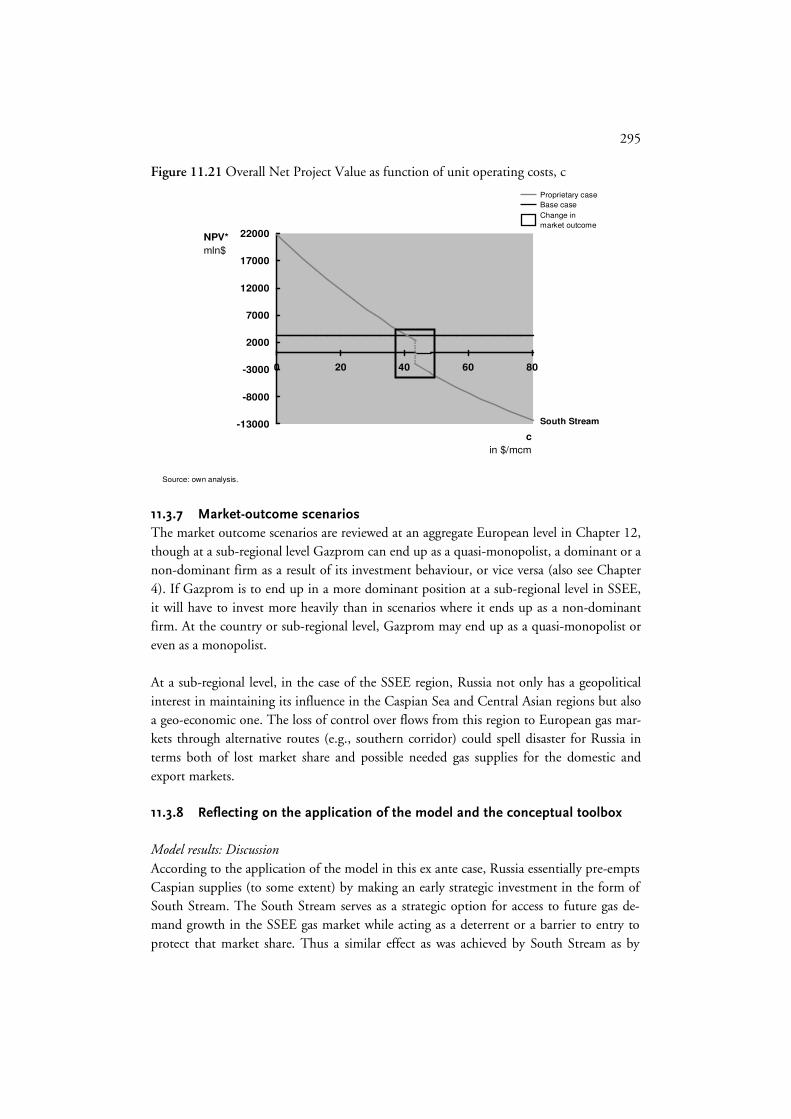
295
Figure 11.21 Overall Net Project Value as function of unit operating costs, c
-13000
-8000
-3000
2000
7000
12000
17000
22000
0 20 40 60 80
c
in $/mcm
Source: own analysis.
Proprietary case
Base case
NPV*
mln$
Change in
market outcome
South Stream
11.3.7 Market-outcome scenarios
The market outcome scenarios are reviewed at an aggregate European level in Chapter 12, though at a sub-regional level Gazprom can end up as a quasi-monopolist, a dominant or a non-dominant firm as a result of its investment behaviour, or vice versa (also see Chapter 4). If Gazprom is to end up in a more dominant position at a sub-regional level in SSEE, it will have to invest more heavily than in scenarios where it ends up as a non-dominant firm. At the country or sub-regional level, Gazprom may end up as a quasi-monopolist or even as a monopolist. At a sub-regional level, in the case of the SSEE region, Russia not only has a geopolitical interest in maintaining its influence in the Caspian Sea and Central Asian regions but also a geo-economic one. The loss of control over flows from this region to European gas mar-kets through alternative routes (e.g., southern corridor) could spell disaster for Russia in terms both of lost market share and possible needed gas supplies for the domestic and export markets. 11.3.8 Reflecting on the application of the model and the conceptual toolbox
Model results: Discussion According to the application of the model in this ex ante case, Russia essentially pre-empts Caspian supplies (to some extent) by making an early strategic investment in the form of South Stream. The South Stream serves as a strategic option for access to future gas de-mand growth in the SSEE gas market while acting as a deterrent or a barrier to entry to protect that market share. Thus a similar effect as was achieved by South Stream as by

296
Blue Stream, except that in the case of the former it is essentially repeated on a larger scale and with lower unit costs, with a pipeline covering a longer distance. The application of the real-options game model shows that there is an overall NPV value that goes beyond the mere static NPV value for the South Stream project, with an overall NPV of $14 billion. This result is obtained despite the considerably high first stage strate-gic pipeline investment, which Gazprom is compelled to make (i.e., the irreversible of early commitment for South Stream). Yet as opposed to Blue Stream, South Stream yields a positive final, overall NPV. The sensitivity analysis of the overall NPV to unit costs pro-vides an explanation for why this is the case: with a capacity of 63 bcm/y (and assuming optimal utilisation of the pipeline), unit costs are reduced to such an extent that sufficient direct value results. With an 8 bcm/y ‘base case’ pipeline covering the same distance, the overall NPV would have been negative (lower than -$10 billion) at unit operating costs of some $80/mcm. The contribution of the model to the South Stream case is to serve as a contrast to the Blue Stream case. Where Blue Stream possessed only limited economies of scale over its length, South Stream possesses four times the capacity, accessing a market several times larger than the Turkish gas market in volume terms. Thus, if the upward potential, initial demand and economies of scale are great enough, the project can serve its potential role as an option on further growth and as a tool to shape the market structure to one’s advan-tage. Results in the sensitivity analyses show that at lower levels of demand, the project naturally becomes unprofitable in overall NPV terms. The conceptual toolbox: additional factors to take into consideration and scenarios The conceptual toolbox helps to assess what other investment variables may be at play, such as regulatory risk. The toolbox specifies that Gazprom should only consider a strate-gic investment in the pipeline if it can attain a TPA exemption for its pipeline capacity within EU territory. Without a TPA exemption Gazprom has to release its capacity to third parties. Then, its investment can be seen as a ‘shared’ investment. According to Smit and Trigeorgis [2004], shared investments in a contrarian, competitive setting (i.e., quan-tity competition) never have a substantial value from a strategic point of view. In the gas industry it is even detrimental without binding commitments with competitor(s). The possible strategic value can only be achieved by aggregating supply flows from different suppliers (e.g., direct strategic value via economies of scale). Moreover, encouraged by the current financial-economic crisis in 2008/09, Gazprom is dependent on strong European mid-streamers in order to finance and organise its strategic investments. In summary, Gazprom’s investment policy with respect to the SSEE market could have different outcomes, given its competition, the prevailing market uncertainty, government policy and its ability to finance and organise its investment. Institutionalising the South Stream investment together with its partner(s) is an essential prerequisite for Gazprom if it

297
wishes to successfully realise the project’s success. Signing long-term contracts with Euro-pean buyers, backed by vertical gas diplomacy, enables Gazprom to ensure its market posi-tion in volume term in the SSEE market. Alternatively, Gazprom may reserve (additional) capacity for short-term deals, contracting its own production through wholly owned sub-sidiaries such as Gazprom M&T, for example. As a business model, the latter is driven more by a price-based strategy. In a scenario involving a wait-and-see strategy, Gazprom may at least temporarily abandon its investment until a gas volume contract is signed to cover the pipeline investment. Post-poning the investment may certainly also be motivated by European policies (e.g., involv-ing TPA). Gazprom may still see South Stream as a priority in terms of it acting as a deter-rent to its competitor(s). Depending on the level of competition, Gazprom may pursue a proactive strategy with regard to its competitors, in order to ensure its market position in SSEE. As will be covered in Chapter 12, Gazprom could decide to invest in additional capacity in South Stream, partly on a commercial basis (i.e., additional supply contracts) and partly strategically in order to diversify transit country risk (mainly in Ukraine), which gives Gazprom the option to divert gas flows from existing transit countries. In order to evalu-ate gas infrastructure investment decisions, a decision and/or policy-maker should con-sider the infrastructure’s commitment value vis-à-vis postponement value, in addition to its static value. However, it should also take into account ‘practical’ issues with respect to gas infrastructures, which is captured by the conceptual toolbox.
In the second case study, Gazprom, with the support of the Russian government, may deter jointly packaged Azeri, Turkmen, Iranian entry into the SSEE market (e.g., through the Nabucco pipeline). Here too, Gazprom may be inclined to act aggressively yet again in order to protect its position in the SSEE market and deter entry. Given its repeated an-nouncements of enlarging the capacity (and thus the economies of scale) of the South Stream pipeline, one could see this as a form of signalling or coordination, i.e., a tacit message to potential competitors in this market. Deterring Iran, a large gas reserve-holder within economic reach of the SSEE market, may well be an important driving force be-hind South Stream (besides Blue Stream). By contrast, Gazprom and Russia appear to cooperate with North African exporters such as Algeria and Libya through shared invest-ments along the value chain.

298
11.4 CASE STUDY 3: Gazprom versus competition in the Northwest
European gas markets
Case studies 1 and 2 consider Russia and the Caspian region at country- and sub-regional levels. In Case study 3, the roles of pipeline gas versus LNG will be considered in terms of volume, also at a sub-regional level, with price risks discussed at the conceptual level. Us-ing the same principles as was set out in the first two cases, the NWE412 market can now be analysed from Gazprom’s perspective. The case is used to argue why Gazprom faces the same type of strategic problem in a market such as NWE as it does in SSEE, even though different factors are at play here. The focus in this case is on Gazprom and a major up and coming LNG exporter, Qatar, which itself pursues a multi-market export strategy. For Gazprom, the prize in this case is a large market share in NWE, a situation in which it can draw the market structure to its advantage. Just as in the second case involving an aggregation of Caspian gas exporters potentially bundling their export volumes through a pipeline such as Nabucco, strategic interaction is likely. Indeed, competition is possible between Gazprom and Qatar for market share in the NWE market, with pipeline gas on the one hand and LNG on the other shaping the balance of future possible supply scena-rios. Following the same procedure as was carried out in Case studies 1 and 2, one can sequentially use the conceptual toolbox and the stylistic model developed in Chapter 4 to assess whether or not to invest strategically. 11.4.1 Background
Centred on the North Sea, the NWE market is the most mature gas producing area in Europe. Gas production picked up after the discovery of the Groningen field (the Nether-lands) in the late 1950s and Norway and the UK became important producers during the 1970s and thereafter. Gas consumption in this part of the European market increased steeply throughout the 1970s, spurring the development of infrastructure and sub-regional trading from Norway to the UK and the continent. The NWE market is, for all intents and purposes, a mature one in terms of infrastructure. Norway is linked to European mar-kets through a network of sub-sea pipelines, while the UK is connected to the European continent through the Interconnector and the BBL. Both the UK and Norway are linked to the Netherlands which itself is an important supplier to the region. Germany, France, Belgium (and even Austria and Italy) are all off-takers of gas from the NWE region. Tradi-tionally a supplier, the UK became import dependent in the early 2000s.
The European gas market in general, but NWE in particular, has undergone immense structural changes with the opening up of national markets to competition as the new EU regulations, sector-wide directives of 1998 came into effect. The aim of EU policy-makers is to create one single European internal gas market open to competition from within and
412 For this research, NWE is defined by Ireland, the UK, Denmark, Germany, the Netherlands, Belgium, Luxemburg, and France. In line with Case study 2, the demand for gas in NWE is aggregated for simplicity.

299
outside the Union. This has fostered the view that there should be more spot trade, even though long-term contracts are expected to remain the bedrock for much of Europe’s gas flows [CIEP 2008]. Of all the sub-regional European markets, spot trading has achieved the greatest level of evolution in the NWE market and short-term prices here have deve-loped accordingly. Figure 11.22 provides a schematic overview of gas transport and supply to NWE (see also Map 8.2 in Chapter 8).
Figure 11.22 Schematic overview of competing gas supply and transport routes from pipeline and LNG suppliers to NWE market
BBL
Interconnector
Netherlands
Norway
Baltic Sea
Continental NWE*
UK
Ireland
Russia
LNG
• Qatar
• Algeria
• Egypt
• Nigeria
• Others
Nord Stream
* Denmark; Germany; the Netherlands; Belgium; Luxemburg; and France.Note: excluding intra-NWE trade and production (except from the Netherlands). The overview is schematic and therefore not accurate. Source: own analysis, based on company information.
Norway-UK pipelines
Norway-Continental pipelines
Possible delivery points
Possible markets
Ukraine transit
Yamal-Europe
Poland Belarus
CZ/SK Ukraine
Existing transport route
Planned/proposed transport route
Neth.-Continental pipelines
Nord Stream and (possible) gas flows of its competitors
11.4.2 Demand-side factors in the Northwest European gas market
Per reference to the conceptual toolbox in Chapter 4, assessing market uncertainty is an important first step in ascertaining whether to make a (strategic) investment in new up- and midstream projects, as has been done in the previous two case studies. As is the case for the SSEE market in Case study 2 (and indeed for any market), volume (and price) risks play an important role in the NWE market as well, though relatively less so than is the case in the SSEE market. The NWE market holds much potential in the way of additional import requirements, a fact which fits into the overall pattern of declining pan-European gas production and rising import-dependency. Capitalising on rising Northwest-European import-dependency by capturing the increased market potential in this market may pro-vide an incentive for suppliers to competitively establish a position in there. After all, Europe’s Northwest European markets, such as Germany, the UK and France, include some of the most important economies in Europe.

300
One of the more traditional gas consuming regions in Europe and a natural hub for shorter-term gas trade due to its maturity, the NWE market is an important centre of consumption as far as gas is concerned. Gas enjoys a primary energy share of 40 percent in the UK, 38 percent in the Netherlands, 30 percent in Ireland, 24 percent in Germany, 24 percent in Denmark, 21 percent in Belgium and Luxemburg and 15 percent in France [BP 2009]. In absolute terms too, these national markets combine to form a very large market with considerable future needs, particularly in the face of the projected decline in regional production. According to BP [2009], the NWE market accounted for some 285 bcm worth of gas consumption in 2008, which accounts for 60 percent of total gas con-sumption in the EU, see Figure 11.23.
Figure 11.23 Natural gas consumption in Northwest Europe (1965-2008)
Source: own analysis, based on BP [2008; 2009].
0
50
100
150
200
250
300
350
1965 1970 1975 1980 1985 1990 1995 2000 2005
Year
Gas
consumption
In bcm 285
233
181
145
11
UK
IrelandNetherlands
Germany
FranceDenmarkBelgium/Luxemburg
Almost in all countries, national champions, such as E.ON Ruhrgas and RWE in Ger-many and GDF Suez in France, are responsible for gas imports from outside their respec-tive countries. The relative differences between the various NWE markets are noteworthy: The UK, Germany, the Netherlands and France account for the largest amounts of con-sumption. These facts and figures should lead one to believe that any Gazprom export strategy to this region (and to Europe in general) is likely to focus on these markets. In-deed, Gazprom’s ambitions to gain access to the British market (via its 100 percent wholly-owned subsidiary Gazprom M&T) and its direct, already existing position in the German market (through a joint venture with Wintershall–Wingas) bear witness to Gaz-prom’s interest in these markets and their possible place in its export strategy. For com-parison’s sake, these markets are comparable in importance to the Italian market in the SSEE market (see Case study 2).

301
Still, there are some uncertainties regarding additional (Russian) volumes to the NWE gas market. First, the current economic crisis of 2008/09 has resulted in a demand reduction in the short-term and probably in the mid- to long-term as well (see Figure 11.24 below). Second, the newly imported gas from remote areas, via long distance pipelines and LNG, will also require additional cross-border transmission capacity within the EU and thus also in NWE. However, EU regulatory barriers and uncertainties may hamper the correspond-ing investments, a factor which also impacts major greenfield investments upstream. This will increase the investment risks of the export pipelines from outside the EU to the EU member states as well [Correljé et al. 2009].413 Third, there are some political debates about the (supplementary) role of Russian (Gazprom’s) gas in the primary energy mix for security of supplies reasons (see also Figure 10.9 in Chapter 10), largely as a result of the Russia-Ukraine gas disputes in 2005/06 and 2008/09. Though this is a more pressing ‘issue’ in East European EU member states, it could become an issue in the NWE region as well.414 On the price side, market uncertainty is substantial. Gas prices are tied to oil and oil product prices in Germany and the Netherlands as well as France (and indeed this is the case for much of the bulk of Europe’s imported and indigenously produced gas). In the UK and to a more limited extent in the continental countries, gas is traded on spot mar-kets where spot price markers are an indication of short-term, gas-to-gas prices which respond more sharply and in a more volatile way to demand or supply shocks than do prices in long-term contracts. With oil prices rising almost inexorably from $40/bbl on-wards in 2004, reaching $147/bbl in mid-2008, only to come crashing down to around $40/bbl again in late 2008, and back to $70-80/bbl in the winter of 2010, volatility in oil prices is high when taken over a period of five years. Oil prices have their impact on long-term contracts in Europe; though with a six-month time lag. Long-term contracts help cushion the effects of sudden demand movements on gas spot markets. Spot markets are centred on trading hubs, which have achieved different levels of liquidity as well as volume (also see Chapter 8). A new trend is for LNG and pipeline gas suppliers to reserve capacity for short-term supplies to the wholesale markets and via the hubs, notably LNG producers and from Norway and Russia by pipeline, though volumes are still small [CIEP 2008]. The NBP, TTF and Zeebrugge are the region’s most important spot markets, with physi-cally trade volumes at NBP having reached 67 bcm in 2008, or around a quarter of total NWE consumption [IEA 2008a].415 Indeed, an important difference between the SSEE
413 See also Correljé et al. [2009] for an in-depth analysis of the current hurdles in cross-border transmission invest-ments within the EU, with a focus on NWE.
414 However, in reality NWE is better prepared for supply disruptions – compared to Central and (South-)Eastern Europe – owing to a sufficiently developed gas network and storage facilities. According to expert interviews, gas storage facilities within the NWE market could supply gas with a minimum of 3 months in case of supply disruptions.
415 The NBP hub saw physically traded volumes rise to 67 bcm and 961 bcm worth of traded volume in 2008 [IEA 2009]. The TTF and Zeebrugge each reached a level of 19 and 9 bcm of physically traded gas and traded gas 60 bcm and 45 bcm, respectively [IEA 2009]. The CEGH reached physical trade occurring at a level of 5 bcm in 2008, while

302
and NWE markets is the presence and role of relatively well-developed spot markets, of which NBP is the most important and liquid one. 11.4.3 Various potential gas suppliers to the Northwest European market
The NWE market is supplied by a number of different suppliers in the form of both pipe-line gas and LNG. Traditionally, NWE is not an LNG importing region. Only when France is included in the total LNG import balance is the share of LNG is worth men-tioning.416 Existing pipeline gas flows come from indigenous production, being greater in relative terms than corresponding domestic indigenous supplies in SSEE. Another major difference between NWE and SSEE which is worth noting is that while Algeria is impor-tant in SSEE (particularly with regard to Italy), it is Norway which is an important to-gether with Russia as far as pipeline gas flows are concerned. Per reference to Figure 11.24, there are four ‘types’ of gas supplies which shape and will continue to shape the NWE market: 1) Volumes which are produced and consumed domestically:
From 2008 to 2036, the level of indigenous production, is projected to decrease from 173 bcm in 2008 to 91 bcm in 2020 and onwards to 45 bcm and 14 bcm by the years 2030 and 2036, respectively.417
2) Volumes which are produced and consumed mainly within the NWE market but exported in an intra-European fashion: The first layer in Figure 11.24 also includes those volumes, which are delivered through existing supply contracts. Volumes here include gas from the UK (to Bel-gium, Germany, France through the Interconnector) and from the Netherlands and Denmark to other NWE markets. The share of the volumes is set to shrink unless they are extended, and some of these extensions are likely.
3) Volumes which are supplied through existing LNG and pipeline contracts from outside the NWE market and outside the EU: The third category of flows includes volumes from Norway, Russia, Qatar, Algeria, Egypt and Nigeria. These account for a significant portion of total volumes con-tracted in the projection period (volumes from these countries are set to reach 170 bcm in terms of contracted volumes by 2015). For this category of volumes, the utili-
traded volumes rose to 15 bcm [IEA 2009]. The yardstick for hub pricing is the replacement value of the gas rather than the market value principle; contractual prices for natural gas are always geared to the energy content of the gas involved [Energy Charter Secretariat 2008; Davis 1984].
416 France imported 7.3 bcm from Algeria, 1.0 bcm from Egypt, 2.3 bcm from Nigeria and almost 0.4 bcm from Qatar, for example. Belgium also imports LNG, importing 2.3 bcm from Qatar in 2008. The UK is one of the ‘newer’ LNG importers, importing 0.3 bcm in 2008 from Algeria and 0.5 bcm from Trinidad and Tobago in 2008 [IEA 2009].
417 This level of gas production includes what the Netherlands produces and consumes domestically.

303
sation rate of some existing pipeline and re-gas capacities is often below 100 percent. Suppliers could use the spare capacity in order to increase volumes, without any large greenfield investments. If the demand growth is substantial enough and if it is possi-ble, suppliers could decide to increase the capacities of the current pipeline system via additional compression.
4) Volumes which could arrive in the NWE gas market through new capacity in the form of LNG and/or pipeline gas: These volumes are yet to be secured through long-term contracts or through diverted or ‘flexible’ supplies. The last category of gas flows have yet to materialise and the relevant infrastructure is either under construction or has yet to be built especially as far as Norwegian, Russian and LNG flows originating from currently slated greenfield projects. A total of some 117 bcm worth of re-gas capacity (both under construction and proposal) is likely to be available in the NWE market from 2020 onwards. This capacity is provided by a number of new LNG terminals in France, the UK, the Netherlands, and to a lesser extent Germany, Belgium and Ireland. Not all 117 bcm worth of capacity is likely to be utilised fully, with some currently planned utilisation resulting from newly signed long-term contracts. However, one must assume they represent a certain potential market share because the capacity in place makes throughput available. So as a rule of thumb, it is assumed here that, in order to provide a picture of what could come on stream, all slated re-gasification and pipeline capacity is included in the overall supply assessment.418
Consider Figure 11.24, here one can discern a high degree of oversupply when adding all the various potential capacities of infrastructural projects up with volumes provided through existing supply contracts as well as the volumes arising from the possible exten-sion of these contracts (in a manner similar to Case study 2). The flows materialising on the basis of existing contracts from suppliers outside Europe alone account for some 320 bcm in 2015 (including indigenous production of 120 bcm), i.e., with the exclusion of possible volumes rolled-over from existing supply contracts. In addition, aggregating all regas and pipeline capacity under construction, study or proposal, exporting countries can supply the NWE market with an additional potential of 221 bcm in 2015. The market structure of competition from a Russian perspective (by using the first matrix in Figure 4.1, Chapter 4,) in NWE appears (again) fairly oligopolistic. Below is a more detailed analysis of the various gas suppliers likely to play key roles in the NWE market vis-à-vis Russia.
418 On average, around 70 percent for pipeline flows, and the average utilisation faction of re-gasification terminal is even lower.

304
Figure 11.24 Existing and pending supply distribution over SSEE demand projection (2001-2036)
* Including some flexible LNG volumes (up to 1.6 bcm/y).** Including new signed long-term volume contracts via Nord Stream (up to 16.5 bcm/y) *** Among others, Egypt LNG (up to 5.7 bcm/y); Equatorial Guinea LNG (4.5 bcm/y); Nigeria LNG (4.3 bcm/y).
† Nord Stream (over capacity or self contracted via GMT: 11-51 bcm/y).
†† Europipe III (23.6 bcm/y) and Skanled (9 bcm/y).‡ Mainly in France, UK and the Netherlands, but also one in Germany. Note: Existing volume contracts are based on ACQ bcm/y. Linear trend extrapolation (via the method of least squares) after 2030 for indigenous production (based on 2020-2030) and demand (based on 2025-2030). Source: own analysis, based on GIE [2009]; Cedigaz [2009]; CIEP [2008]; privately disclosed company data.
0
50
100
150
200
250
300
350
400
450
500
550
2001 2006 2011 2016 2021 2026 2031 2036
Gas volume
in bcm
Year
Existing pipeline contracts Norway*
Existing pipeline contracts Russia**
Existing LNG contracts Algeria
Existing LNG contracts Qatar
Other existing contracts***
379363
Indigenous production
311
381
Regas capacity under construction‡
Possible pipeline capacity from Russia†
Possible pipeline capacity from Norway††
299
353
xxx
xxx
Demand projection
Demand projection with correction
of economic crisis
Regas capacity under study/proposal‡
Possible new pipeline supplies from Russia Currently, Gazprom is transporting its gas to NWE via the old Soviet pipeline system through Ukraine and via the Yamal-Europe pipeline, which is connected to the Wingas network in Germany and onwards. The Yamal-Europe pipeline has not reached its full load factor (currently utilisation is around 70 percent). Gazprom could decide to increase its volumes through the existing Yamal-Europe pipeline (by also building additional com-pression on that route). This investment decision offers the option to stall major invest-ments with regard to new greenfield investments. The Nord Stream gas pipeline is de-signed to bring additional gas to Western and Northwest Europe from Russia. The gas pipeline runs across the floor of the Baltic Sea, avoiding the existing transit countries of Ukraine and Belarus with which Gazprom has recently clashed over gas contracts (2008/2009). Instead, the pipeline must transit the territorial waters of a host of North European nations, some or most of whom have reservations about the planned project [CIEP 2008] (see Section 11.4.4 below). In Nord Stream’s first phase, the plan for the project is for the pipeline to be connected with the Shtokman gas field in the Barents Sea, once brought on-stream, even though Nord Stream likely to be completed before the Shtokman project is brought on stream. Initially, one of Nord Stream’s two pipelines will

305
be operational from 2011 onwards, with a transport capacity of 27.5 bcm/y.419 A parallel pipeline will be laid to double the annual transport capacity to around 55 bcm/y – ex-pected to come on stream as early as 2012, see Figure 11.25 [CIEP 2008]. Figure 11.25 The Nord Stream project
xxxx Year of start-up
Pipeline project Shareholders
X% Share in project
Governments/business involved
Off take** Transit*** Production
Onshore transit
Offshore transit
Onshore and offshore transit
Reasons forconstruction
51%
20%
20%
9%
2011+*
Nord Stream
* From 2011 a transport capacity of 27.5 bcm/y, full capacity in 2012 (expected).** Wingas, E.ON Ruhrgas Gazprom M&T, GDF Suez, Dong. Main off takers – other (transit) countries may take off gas as well.*** The project could be extended to the UK. Then, Germany and the Netherlands will become transit countries.Source: own analysis, based on Gazprom and Nord Stream information.
• Planned transportation capacity 55 bcm/y
• Extra volume of Russian gas for Northern and Western Europe
• Avoiding Ukraine and Belarus – diversifying transit risk
For Russia, the UK, France and Germany are key markets simply in terms of size, and so they form part of Gazprom’s expansion drive in the NWE market. Being the largest mar-kets by volume, these three markets’ rising import needs offer valuable market share yet to be captured. From a Russian perspective, leaving any additional investments aside which it may need to build further economies of scale and expand its market share may relinquish Gazprom’s market share to possible entrants. Through its subsidiary, Gazprom M&T, Gazprom is aiming to expand its gas trading activities (e.g., self-contracting) mainly in the UK. At the same time, Gazprom’s long-term contractual volume commitments with
419 Currently, 16.5 bcm/y worth of the capacity line currently under construction is already sold to companies by means of long-term contracts. A part of the remaining 39 bcm/y worth of capacity is already ‘self-contracted’ by Gaz-prom M&T (6 bcm/y). The remaining capacity (33 bcm/y) is not coupled to any concrete gas flows, at least not yet [Nord Stream AG 2009]. However, this capacity could well be coupled to volumes in the pipeline if Gazprom chooses to commit such volumes, either through self-contracting or long-term contracts with buyers. Gazprom has signed an agreement with the following European companies: Dong Energy, Denmark (1 bcm/y); E.ON Ruhrgas, Germany (4 bcm/y); GdF Suez, France (2.5 bcm/y); Wingas, Germany (9 bcm/y). Gazprom holds a 51 percent interest in the joint venture, Dutch Gasunie 9 percent (in exchange for an option to Gazprom to buy a 9 percent stake in the BBL pipeline from the Netherlands to the UK), and the German companies BASF/Wintershall and E.ON Ruhrgas hold 20 percent each. Other parties have shown interest in buying a stake in the Nord Stream project. For example, Gaz de France Suez is negotiating its participation [Nord Stream AG 2009].
306
European mid-streamers, which are seen falling from 70 bcm in 2015 to 68 bcm in 2020 and 2025, respectively, may be renewed. If Gazprom chooses to extend these contracts and the buyers are willing to do so, then this will help secure Russia’s overall market share in the region. The Nord Stream alone will carry 16.5 bcm worth of long-term gas volume contracts in its first phase, while from 2012 onwards the pipeline could potentially carry another 39 bcm worth of gas, now held as excess capacity booked by Gazprom itself (6 bcm/y already contracted to Gazprom M&T). All-in-all, the large number of potential gas-exporting entrants in the NWE market, at supply costs similar and often lower than those of Gazprom (especially per reference to greenfield investments with high long-run marginal costs, such as Yamal and to a lesser extent Shtokman) through LNG is likely to provide Gazprom with an incentive to make an investment in capacity expansion. Additionally, market uncertainty is low, with import needs for the NWE market certain to grow and prices remaining as unpredictable as they have historically always been. Possible supplies from Norway and Algeria Based on the available information about contracts, a certain amount will almost doubt-lessly be renewed, holding mostly for pipeline gas from existing producers, such as Nor-way. Norway’s exports are not likely to exceed 115 bcm by 2012. Almost all Norwegian gas will be exported to Europe in the coming decade(s). Newly produced gas from the Ormen Lange will be sold in the spot and short-term markets in the UK via the Langeled pipeline (around 20 bcm/y according expert interviews). Only gas from the Snøhvit field can potentially be exported as LNG to markets outside Europe (around 6-11 bcm/y in 2010-15). By making use of excess transport capacity, Norway could optimise its export revenues from gas sales [CIEP 2008]. Depending on fiscal and regulatory conditions and gas prices, StatoilHydro’s oil and gas export strategy may yet shift, possibly resulting in an increase of Norwegian production and export [OME 2007; CIEP 2008]. As mentioned in Case study 2, According to expert interviews, Algeria is currently focusing on a growth strategy via pipeline supplies to Italy. Therefore, Algeria is not likely to exceed exports of 20 bcm/y to the entire French market, having either limited or fixed LNG export ambi-tions to that and other markets. Norway and Algeria, though they are considerable and mature gas suppliers, are thus not likely to pose as much a threat as LNG flows do. Re-gasification: Possible LNG flows to NWE Indeed, the most important single threat in terms of volumes comes from the theoretical 130 bcm/y worth of volumes (assuming full utilisation of the corresponding re-gasification capacity). This capacity is owned either by mid-streamers (e.g., GDF Suez, E.ON Ruhr-gas) or by vertically integrated international energy firms with a strong position in the LNG value chain through, for example, self-contracting strategies or a combination of

307
both. Value chains such as those managed by ExxonMobil and Qatar Petroleum (from Qatari projects) can also form a threat in that Russian gas in the NWE market may have to compete with additionally contracted LNG from this joint venture (in excess of what is currently contracted).420 Assuming all the 130 bcm/y worth of re-gasification capacity are built, this capacity can make possible a vast flow of LNG to the NWE market. This could represent a major threat to Gazprom’s potential market share in NWE. Since these flows could come from a number of different players, from Qatar to Nigeria, the competition can be said to be somewhat oligopolistic. In the long-run, however, only Qatar, Nigeria and Algeria have significant market power in the Atlantic Basin and this has a direct bearing on market structure in the NWE market (also see Chapter 9). The NWE market will increasingly become part and parcel of the trans-Atlantic LNG market. Market power in the Atlantic Basin therefore also translates into market power in the NWE market. From an oligopolis-tic point of view, any amount of future LNG imports in NWE may act as a form of com-petitive entry with respect to Russian gas (in volume terms). As is explained in Chapter 9, Qatar pursues a multi-market LNG export strategy and much of its LNG volumes have yet to make their impact on the NWE market. Of the various potential players in the European market(s), and especially also in the NWE market, Qatar is the most significant newcomer in LNG terms. Qatar chose for a strategy involving economies of scale in its LNG shipping and liquefaction, not only in the US and in Asian markets, but also in Europe (for a more extensive overview of Qatar’s sales and market strategy, refer to Chap-ter 7 in Boon von Ochssée [2010]).421 Gas supply costs to the NWE market In terms of total or long-run marginal gas supply costs, of which the economies of scale in transport and upstream production are key determinants (see Figure 4.2 in Chapter 4), the UK and Norway are the most competitive sources of gas in the NWE market, due mainly to the proximity of production sites in the North Sea to the NWE markets. Sources such as Snøhvit LNG from Norway and Yamal are the more expensive possible
420 South Hook LNG, Milford Haven, and Grain LNG terminal. Qatar Petroleum (67.5 percent), ExxonMobil (24.15 percent), and Total (8.35 percent) are the shareholders of South Hook LNG and the shareholders of Grain LNG are National Grid, BP, Sonatrach, E.ON, Iberdrola, Centrica, Gaz de France, part of a broader multi-market LNG strat-egy on the part of this ‘NOC-IOC’ partnership.
421 According to expert interviews, Qatari LNG arrives in the NWE market at a cost of $3,29/mmbtu in 145,000 cubic meter tankers, $3.05/mmbtu in 210,000 cubic meter tankers and $2.96/mmbtu in the supergiant 250,000 cubic meter tankers, a ten percent total reduction in unit costs. Indeed, Qatargas chief al-Suwaidi has claimed that “we knew we would have to compete with pipe gas in a number of countries, especially Europe. So this was one of the drivers for pushing up sizes [of] trains and ships. We really wanted to compete in those markets” [WGI 2009b]. As in Europe, LNG is positioned to take market share away from current pipeline suppliers, which deliver gas mainly through short-term contracts, with al-Suwaidi seeing further opportunities to expand market share [WGI 2009b]. As a matter of fact, with the onslaught of comparatively cheaper LNG in Europe at low spot indexation, Qatar’s sales have increased in Europe broadly while Russia’s have fallen [WGI 2010].
308
sources of new gas for NWE, and if brought on stream in sufficient capacity, they could benefit from economies of scale. The total gas supply costs for LNG from Qatar and Ni-geria are slightly lower (also see Section 9.4 on market power). According to the IEA [2009], indicative long-run marginal costs in 2020 for gas from Shtokman through Nord Stream costs $234/mcm compared with $204/mcm from Yamal, $91/mcm from Norway, $175/mcm from Nigeria (by LNG), $174/mcm from Qatar (by LNG), $177/mcm from Algeria (by LNG) for the NWE market. 422 11.4.4 Other investment variables concerning Nord Stream supplies
Before applying the model, other factors which influence new gas supplies should be con-sidered in a qualitative matter, in line with Barnes et al. [2006]. A number of investment variables should be taken into account with regard to the Nord Stream project, listed be-low. 1) Foreign investment climate in gas supplier countries The factors to be taken into consideration as far as Russia’s investment climate is con-cerned, have already been covered in Case study 2. For a more of detailed overview of the investment climate in Qatar, for example, refer to Chapter 7 in Boon von Ochssée [2010].
2) Transit, permit and regulatory risks Although the Nord Stream pipeline circumvents onshore transit through third countries, the Nord Stream project leaders still had to consult with all nine countries around the Baltic Sea; and in five of these the project still requires (environment) permits. These con-sultations can delay the construction process, though the construction process appears to be underway [WGI 2010b]. The Nord Stream project also faces significant uncertainty about the timing of investments in German pipelines due to EU regulatory matters [Cor-reljé et al. 2009]. Pipelines originating from outside the EU, landing on EU territory, where gas exits the pipeline and enters the EU pipeline grid may also be subject to TPA. While subjection to TPA can act as brake on the strategic and proprietary value of its capacity, Nord Stream is not subject to TPA legislation. The Nord Stream companies are thus able to use Nord Stream’s capacity in a proprietary manner.423
422 Based on expert interviews, an indication of the long-run marginal costs for the NWE market is given by the relative values of the long-run marginal costs of various sources. Take the Norwegian Troll gas field, for example, in the North Sea. It is the most expensive source of gas for the NWE market. LNG from Snøhvit, offshore Norway’s northern coast, costs roughly half per unit as gas from Troll. Gas from Nigeria, also in the form of LNG, costs roughly a quarter as much as Troll gas while LNG from Qatar clocks in at 18 percent of Troll in per unit terms, comparable with LNG from Algeria. The cheapest source of gas in the NWE market is gas from the Netherlands’ Groningen field, costing roughly 10 percent as much as gas from Troll. The long-run marginal cost of gas from Shtokman in the form of LNG and new sources in Yamal are likely to be a great deal higher relative to Troll.
423 For some of the LNG re-gas facilities in the NWE market, such as South Hook re-gas terminal in the UK, TPA exemption is also granted, which provides LNG re-gas terminals with a similar, proprietary value. As for LNG, it is not exposed to any major transit risks in the same way as pipeline gas volumes are. However, re-gas terminals do face Not In My Backyard (NIMBY) issues in certain specific local municipalities.

309
3) The geopolitical dimension For a more extensive review of the broader geo-strategic context in which Russia’s pipeline investment strategy fits (including Nord Stream), including the extra-regional role of the US, see Section 8.1 and Chapter 11 in Boon von Ochssée [2010]. Suffice it to be said here in the specific case of Nord Stream that within Europe, there is a rough division between European countries with a traditionally more trans-Atlantic relation with the US and the more continental actors. On the one hand, trans-Atlantic countries, such as the Nether-lands, support the construction of the Nord Stream, while others such as the Baltic coun-tries, Sweden and Poland generally oppose the project.424 France, Germany (and Italy, as was mentioned in Case study 2), the more continental countries, but also the Netherlands tend to favour the project. Moreover, the European Commission assigned to the Nord Stream project a Trans-European Network (TEN-E) status, making Nord Stream a key project for European security of supply [Gazprom 2009].
11.4.5 Organisational and financial institutionalisation of
the Nord Stream project
Since the mid-seventies, the German-Russian gas relationship solidified through the estab-lishment of the so-called Orenburg pipeline deal, backed largely by the German govern-ment, as mentioned in Chapter 6. An important element in how Gazprom pursues the institutionalisation of the Nord Stream lies in how it uses vertical energy diplomacy to secure Nord Stream’s success, see Section 4.2.5. Russia employs foreign policy tools such as government-backing of Gazprom’s investment initiatives. In Nord Stream’s case, Russia has nurtured close bilateral ties with Germany (and other off-take countries, such as the Netherlands and France), and agreement between government officials subsequently facili-tated business-to-business progress. Thus political commitment acted in support of long-term take-or-pay contracts between Gazprom and German mid-streamers such as E.ON Ruhrgas at the firm level, where government support in the off-take countries can alleviate demand uncertainty. In model terms, Gazprom as a firm employed Russia’s vertical energy diplomacy to secure upward demand potential. At the firm level, Gazprom’s vertical agreements with mid-streamers are in line with De Jong’s [1989] joint venture coordination mechanism. Mature markets often feature greater tendencies towards cooperation between firms (also refer to Section 3.4). The mid-streamers, E.ON Ruhrgas and BASF, play a critical role for Gazprom in the German mar-ket through their position as incumbents in that market, and their political backing from the German government. The Nord Stream project can be seen as part of a public-private ‘win-win framework’ between government-controlled companies in Russia on the one hand, and private entities
424 The Baltic countries favour overland alternatives, on the grounds of the Nord Stream’s environmental risks, com-plaining simultaneously about deprivation of transit revenues the Nord Stream causes them.

310
or counterparts in off-take countries on the other, such as in Germany, via ‘vertical swaps’ value chain and joint ventures.425 This type of agreements provides an upfront economic value and incentivises greenfield investments (also for smaller gas fields) [van der Linde 2007]. The public-private partnership between Russia and off take countries can ensure Gazprom’s market share in Europe and deter (to some extent) the flexible LNG flows. In addition to the business model of long-term contract backed by governments, Gazprom increasingly engages in selling ‘flexible supplies’ not committed to country and regional markets, see also Chapter 10. Gazprom also applies this new business model in respect to the Nord Stream via gas sales of Gazprom M&T in mainly liberalised markets, such as the UK. This business model is in the in line with De Jong’s [1989] competitive coordination mechanism, which is mostly applied in growth markets, such as the UK (also refer to Section 3.4). However, it is uncertain if Gazprom may increase substantial volume growth via Gazprom M&T due to possible difficulties of managing downside risks of this business model, particularly in light of the buyers’ market since the end of 2008.426 The first business model of long-term contracts backed by governments fits into Russia’s perception of the central role of the state in general, and the government in particular, in energy-related and strategic matters important to the national interest. In a broader sense, this approach also fits into Russia’s perception of the importance of gas as a source of relative advantage, see Chapter 3. Since this case study is about the interaction between pipeline gas and LNG flows, hori-zontal energy diplomacy in the case of Nord Stream is relevant insofar as Russia is expan-ding ties with fellow gas-exporting LNG countries. Russia pursues greater ties with these countries on both a bilateral basis and through the GECF (also see Chapter 10 and Chap-ter 11 in Boon von Ochssée [2010]). Currently the Nord Stream is privately funded, and officially it has not applied for any public funding. In line with Case study 2, the Nord Stream may be financed by means of
425 The asset swaps and joint ventures offer German companies security of supply in the form of access to upstream resources, while Gazprom could improve its security of demand by integrating in the EU downstream, towards end-consumers. Wintershall and E.ON Ruhrgas have a 24 percent share each in Serverneftegazprom, which is a Russian license-holder to the exploration of the Yuzhno Russkoye gas field, whereas Gazprom owns 51 percent. E.ON Ruhrgas and Gazprom also develop the Russian power market in another joint venture and E.ON Ruhrgas has a 6.5 percent stake in OAO Gazprom. E.ON Ruhrgas received further natural gas produced at the wellhead in Russia and is deliv-ered through the joint venture by Gazprom, based on prices comprised of an average value of domestic Russian sales and Russian export sales. With Wintershall’s agreement, Gazprom increased its stake in Wingas 49 percent. Wingas is active in transport, direct sales and storage in and outside Germany. In exchange for E.ON Ruhrgas upstream inter-ests, Gazprom received minority stakes (up to 49 percent) in E.ON Ruhrgas’ subsidiaries in Central European gas markets (e.g., Hungary). For an overview of these firm-level agreements, see also Boon von Ochssée [2009b].
426 For Gazprom, another driver may be the need to maintain open its options in its supply position, given its possibly tight supply balance in the mid-term [De Jong et al. 2010]. Even though it should be noted that recently domestic demand has fallen markedly.

311
a warehouse construction (also see the conceptual toolbox in Chapter 4), where the re-payments of the loans of the greenfields are based on gas contracts between European mid-streamers and Gazprom. Such a construction facilitates access to a guaranteed income stream and therefore higher credit rating for the project, and therefore less expensive loans as a result of higher credit ratings. The business model of flexible supplies is exposed by relative higher financial risks. 11.4.6 Application of the model to the Nord Stream case
Similar to the South Stream case, the real-option game model can also be applied to the Nord Stream case. The goal is the same as in the previous two cases. Nord Stream is a project which is still under construction, whose effects, at the time of this writing, still lie far into the future, which is in line with the South Stream case (i.e., it is an ex ante analy-sis). In this particular case, entry is assumed to take place in the form of LNG. To the greatest degree possible, the assumptions below are designed to approximate real world figures and numbers in the context of specific market circumstances and gas infrastructure investments.
11.4.6.1 Assumptions and parameter values
Operational assumptions: a. We assume the NWE gas markets collectively consists of a duopoly, with Gazprom
on the one hand and a potential competitor on the other, with the latter acting as a potential entrant for new market demand with an 8 bcm/y pipeline, both on a dis-tance of 2137 km to the off take market (offshore section: 2220 km; onshore section: 917 km). An LNG supplier is assumed to act as a potential entrant. For simplicity, the operating unit costs for LNG entry are assumed similar to that of an 8 bcm/y pipeline.
b. Gazprom faces the choice in 2009 (i.e., stage I) of committing to building or defer-ring the construction of the Nord Stream pipeline across the Baltic Sea to Germany onwards in the face of potential entry by a competitor (see Figure 4.8 in Chapter 4).
Parameter value assumptions:427 a. Average operating gas transport costs in the base case: In the base case, both players
are assumed to make commercial investments only, i.e., constructing small-diameter pipelines with a capacity of 8 bcm/y. In this case it means both players do not under-take early strategic commitment to the market, meaning the operational unit costs
remain at: $72.4 mln/bcmG Ec c= = . At this point, neither player yet benefits
from economies of scale. The competitor is assumed to have unit costs associated with a typical 8-10 bcm/y LNG train (e.g., such as those operated by the Ras Laffan LNG Company, RasGas, and Qatar LNG Company, Qatargas, ventures in Qatar), the op-
427 See the conceptual discussion held in the toolbox in Chapter 4.

312
erating unit cost of which is comparable to some pipeline gas sources in the NWE market (assuming full utilisation of facilities, of course).428
b. Average operating gas transport costs in the proprietary case: The construction of the Nord Stream is a proprietary investment. Gazprom decreases its average opera-tional unit costs from $72.4/mcm to $18/mcm as the pipeline has greater economies of scale (from 8 bcm/y in the base case to 55 bcm/y in the proprietary case). This represents the move away from the base case and towards the proprietary case. The competitor is assumed to use an 8 bcm/y commercial pipeline capacity at the same distance (i.e., it does not invest strategically) resulting in similar operating unit costs as an LNG chain (from liquefaction to re-gasification, see above).
c. First-stage strategic pipeline investment (K): The initial cost of building the Nord Stream, K (totalling $14 bln), is defined as the difference between the CAPEX for Nord Stream minus the ‘theoretical’ CAPEX for a 8 bcm/y commercial investment covering the same distance, I (totalling $6 billion).429
d. Follow-up investment outlay by either Gazprom or the competitor (I): Follow-up investment outlay, made after stage I and thus after the incumbent’s strategic invest-ment, corresponds with a base case commercial 8 bcm/y pipeline investment covering the same distance ($6 billion).
e. Initial demand parameter ( 0θ ): For simplicity, initial gas market demand in the
NWE gas market is assumed to be 95.83 bcm ( 0 95.83θ = ) at 0t as detailed in the
conceptual description in Chapter 4. f. Binomial up or down demand parameters (u and d): In the model, demand is as-
sumed to be stochastic, moving up or down with binomial parameters u = 1.84 and d
= 0.54, both at the beginning of periods 1 and 2 in stage II. Starting at 3t there is a
‘steady state’ of 25 years, i.e., no more upward and downward moves, as detailed in Section 4.3.5.
g. The risk-free interest rate: The risk-free discount rate is assumed to be 3.4 percent ( �����r = ).430
h. The risk-adjusted discount rate: The rate at which profits in the last stage are to be discounted by in the last stage, the risk-adjusted discount rate, is set at 8.5 percent
428 LNG from Qatar, for example, possesses roughly the same unit costs as pipeline gas from the UK and Norway according to expert interviews. In reality LNG is more flexible and price-sensitive between regional gas markets rather than produced and sold on the basis of quantity alone, see Chapter 4.
429 In order to calculate the ‘theoretical’ CAPEX as well as the average breakeven operating costs per unit, account is taken of inflation, the WACC (k), the risk-free rate (r), fuel and compression costs, etc. (see Chapter 4). In this case, the real value is used for the offshore pipeline section, excluding the CAPEX for the compression. The ‘theoretical’ value of the CAPEX is used for the Russian onshore pipeline section to connect on the Russia’s UGTS (see Chapter 4 for a definition of theoretical versus actual values of the different projects). The base case ‘theoretical’ pipeline CAPEX calculation is also based on 2009 input data, obtained from privately disclosed company sources. The inflation is assumed at 2.8 percent (based on the first half year of 2009), according to Eurostat data for the Euro area.
430 The risk free rate is based on the yield-to-maturity in October 1999 of a 10-year Euro-denominated (or the equiva-lent thereof) German government bond [Tradingeconomics.com 2009].

313
( ����k = ).431 The project’s cash flows are discounted over a period of 25 years, ac-ting as an annuity.
i. Risk-neutral probabilities: Given u, d, k and r, it can be determined that p = 0.32 and 1-p = 0.68.
Figure 11.26 is an overview of the various payoffs to Gazprom and the competitor in a decision tree, which is a direct application of Figure 4.8 in Chapter 4. Each node corre-sponds with an up- or downward move in demand and the resulting decisions of Gazprom (denoted in Figure 11.26 and elsewhere by the letter G) and the competitor (or potential entrant, denoted in Figure 11.26 and elsewhere by the letter E), respectively, to invest or
defer (further) commercial investments ( { , }G I D and { , }E I D ) in stage II while in stage I
only Gazprom is assumed to invest as an incumbent. The highlighted (red) branches along the tree indicate the optimal actions along the equilibrium path. Figure 11.26 Gazprom’s proprietary case for Nord Stream vis-à-vis the competitor
Do not invest/wait (base case)
Make strategic investment commitment (KG)
θθθθ
u
I D
E E
d
θθθθ θθθθ
D I D
θθθθ
DI DI DI DI
du du du
E E G G G
DI DI
DI
E E
G
DI DI
DI
E E
G
I D
E E
θθθθ θθθθ
I D I D
θθθθ
DI DI DI DI
du du du
E E G G G
DI DI
DI
E E
G
DI DI
DI
E E
C M M A C M M A C M M AC M M AS M S M S M S M S M S M S M S M
C C
Sta
ge I
IS
tag
e I
Pe
rio
d 2
Pe
rio
d 1
46-3
612
3812
5012
-3-6
-0.60
-0.7-6
-0.70
1677
2400
16-6
160
10450
-6163
100
-61
14239
2340
-6157
-60
10-6
100
-6-4
-60
16-6
160
0.3-6
0.30
100
-61
-60
-60
10-6
100
-6-4
-60
-6-6
-60
-6-6
-60
612
40.7
I
G G
66
Assumptions:First-stage strategic pipeline investment by Gazprom: KG = 14.0 bln$Follow-up (second-stage) investment outlay by either Gazprom or its competition: IG = IE = I = 5.8 bln$Initial demand parameters: θ0 = 95.83 bcm (with θ1 = uθ0 or dθ0)Binomial up or down demand parameters: u = 1.84; d = 1/u = 0.54Risk-free interest rate: r = 0.034Risk-adjusted discount rate: k = 0.085 Operating costs: cG cE
No investment (base case) 72.39 72.39 $/mcmProprietary investment 17.39 17.39 $/mcm
Note: monetary amouts are in billion$.Source: own analysis.
431 The risk-adjusted discount rate (the WACC) is based on information provided in expert interviews, where a WACC of between 8 and 9 percent was proposed as being appropriate.

314
Just as in Case study 1, For period 2 in stage II, we take the case in which demand has moved upward in period 1 (i.e., branch u), and do not elaborate here on either the case in which demand falls or the base case. Notice that Figure 11.18 will be approached through backward induction, i.e., bottom-up.
11.4.6.2 Model application and backward induction432
a. Stage II, Period 2
The upward and downward movements in demand in the leftmost branch of the tree (see Figure 11.26) and corresponding decisions to invest in follow-up capacity by Gazprom and the competitor (after a strategic investment has been made by Gazprom) yield the following dominant routes based on the state-contingent project values: 433 • Sub-game 1: For Gazprom: 167, 16; for the competitor: 7, 0. • Sub-game 2: For Gazprom: 104, 10; for the competitor: 50, 0. • Sub-game 3: For Gazprom: 142; for the competitor: 39. • Sub-game 4: For Gazprom: 10; for the competitor: 0. b. Stage II, Period 1
The values listed above are fed back into period 1, on the basis of which Gazprom invests commercially, while the competitor defers. In Game 1, the competitor is unable to obtain its highest possible payoff in period 1 of stage II, i.e., 2, given Gazprom investment in this period for a payoff of 61. In Game 2, rather both investing, both players opt for a deferral in order to avoid a duopoly outcome in period 1 in which both would be worse off than under a deferral. Gazprom obtains -0.7 rather than -0.6 and the competitor obtains 0. As Smit and Trigeorgis [2004] argue, Gazprom may also prefer to remain unpredictable. A similar result was obtained at this stage in Case study 2. c. Backward induction of period 1 (stage II), to stage I
Finally, the period 1 payoffs for Gazprom help determine, again via a next step of back-ward induction, whether the strategic investment is worth making net of its initial capital
investment, GK , the amount invested in excess of a base case pipeline of 8 bcm/y. The stage
I payoff for Gazprom is 61 while for the competitor it is 6. When the strategic investment is subtracted as well (i.e., the amount obtained from total CAPEX – I) the overall NPV (NPV*
G) for Gazprom of building Nord Stream is $4 billion, which is lower than the value under the base case (i.e., $4 billion for the proprietary case is lower than $6 billion for the base case). The model’s application to the Nord Stream case conveys an overall NPV for Nord Stream that is lower than the base case NPV. This result suggests that it is better to postpone the strategic investment.
432 All monetary amounts are noted in billions$.
433 See Figure 11.15 for dominant routes in the rightmost branch of the tree.

315
d. The various value sub-components
The model’s application to Nord Stream yields value components in the same manner as in the Blue and South Stream cases, using formula 4.6. The game is initiated at an initial demand level of 95.83 bcm, and with the binomial parameters u = 1.84 and d = 0.54 determine a number of different demand levels result as in the previous two cases. For simplicity, the following numerical explanation is based exclusively on the model’s results in the last row in panel B, Table 11.3, specifically the case in which demand has
risen twice to 324 0( . ., )i e x u x uθ . Here, Gazprom ends up as dominant leader firm
(S-L), supplying 180 bcm/y via its existing infrastructure and the Nord Stream pipeline with a profit of 16. At this level of demand, and given the cost functions as a result of the proprietary investment, Gazprom has effectively been able to ensure its position as a dominant firm, the competitor compelled to follow with 36 bcm/y (S-F). Table 11.3 Second-stage equilibrium state project values and strategic effects for different market structures and states of demand for the base and proprietary pipeline investment case
Panel A – Base Case
Demand Market Structure Quantity Profit NPVG Market Structure Postponement Base Case (Static) (Dynamic) value NPV*G
28 Cournot Nash 0 0 (6) Abandon 12* 6
52 Cournot Nash 0 0 (6) Defer 6 0
96 Cournot Nash 8 0.06 (5) Abandon 5 0
176 Cournot Nash 35 1 6 Defer 14 20
324 Cournot Nash 84 7 66 Cournot Nash 0 66
GQ*
G*π
Panel B – Proprietary Pipeline Strategic Investment
Demand Market Structure Quantity Profit Direct Reaction Pre-emption Commitment Postponement NPV*G
(Dynamic) value value value value value
28 Monopoly 5 0.03 0.3 0 6 6 (12)* (6)
52 Defer 0 0 3 0 2 5 (6) (-0.7)
96 Monopoly 39 2 12 3 6 21 (5) 16
176 Monopoly/Stackelberg 79 6 27 12 16 55 (14) 61
324 Stackelberg 180 16 54 21 24 100 0 167
GQ*
G*π
Strategic
* Additional 6 bln$ to postponement value because of additional investment (I) in order to realise total project’s CAPEX. Note: Totals may not add up due to rounding. Monetary amounts are in billion$.Source: own analysis.
and proprietary pipeline investment case
θ
θ
The proprietary case must be compared with the base case (i.e., panel A with panel B of Table 11.3) in order to determine the difference between making the strategic investment commitment and remaining at the original level unit costs, i.e., not building Nord Stream and sticking to an 8 bcm/y pipeline. In the base case, at the same level of demand, the NPV is 66 for both Gazprom and its competitor with each supplying 84 bcm/y via its existing and new infrastructure. In the proprietary case, Gazprom goes ahead with the strategic investment, creating a shift, which cannot occur when neither firm invests in

316
additional economies of scale, remaining at the original operating unit costs
( $72.4mln/bcm)G Ec c= = .
The direct and strategic value The net commitment values are shown in Table 11.3: The direct value of Nord Stream for Gazprom, attained due to the benefits of economies of scale alone is 54. The addi-tional value of undermining the profitability of the potential entrant’s investments is 21, i.e., the strategic reaction value, while the value of then altering the structure of the market altogether, the pre-emption value of Nord Stream, is 24. This last value is the value at-tained by shifting from a model outcome involving duopoly (C) to one where Gazprom ends as a leader (S-F). The postponement and net commitment values The strategic reaction value and the pre-emption values together determine the strategic value. The net commitment value, which is computed by adding the direct to the strategic value, is therefore 100 (=54+21+24). In this case the postponement value is zero, because in the base case scenario the NPV is also positive as a result of strong upward demand potential. The overall Net Project value Finally NPV*
G of Nord Stream for Gazprom is the NPV in the base case (66), added to the net commitment value (100) and the postponement value (0), which is 167 in total.434 Note that this is not the overall Net Project value of Nord Stream to Gazprom.
11.4.6.3 Sensitivity analysis
Pursuant to the approach used in Case studies 1 and 2, the most significant and remark-able results are mentioned below for Nord Stream pipeline. 1) Overall Net Project Value versus sensitivity to changes in upside market demand potential As in the previous case studies, the change in value of the upward demand potential pa-rameter u, varying in the sensitivity analysis between values of 1.01 and 2, is positively related to NPV*G. In the base case of no pipeline with larger capacity (i.e., lower econo-mies of scale), the project value increases monotonically (see top part of Figure 11.27) with upward market demand potential, as expected from option theory. Considering the positive relationship between overall Net Project Value and upward demand potential, the graph (lower part of Figure 11.27) exhibits a remarkable discontinuity. This ‘negative jump’ can be explained from the strategic competitive interaction in Gazprom’s market. Gazprom is in a monopolist (M) zone due to its proprietary investment. That is, it enjoys being a monopolist until upward market demand potential reaches a value of 1.65, de-
434 The postponement value is a negative number in case the static NPV is below zero for the base case, added, when applicable, by the option value when deferring a commercial investment (I) in period 1 in stage II.
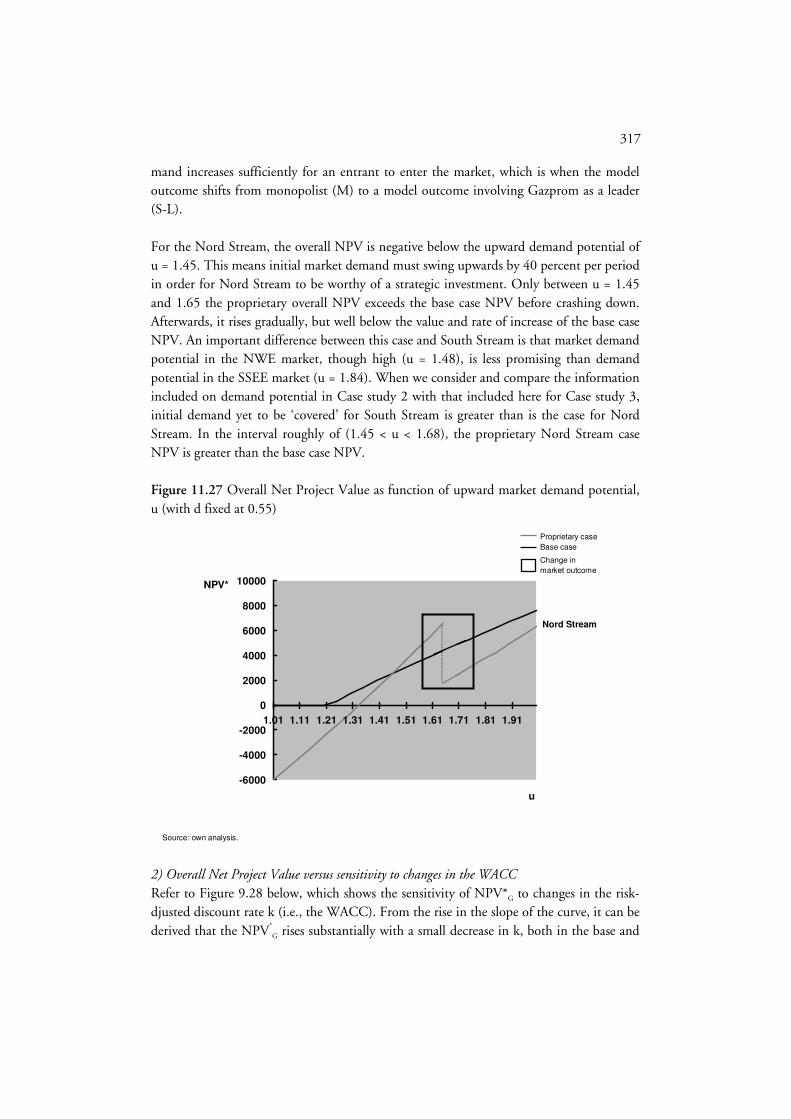
317
mand increases sufficiently for an entrant to enter the market, which is when the model outcome shifts from monopolist (M) to a model outcome involving Gazprom as a leader (S-L). For the Nord Stream, the overall NPV is negative below the upward demand potential of u = 1.45. This means initial market demand must swing upwards by 40 percent per period in order for Nord Stream to be worthy of a strategic investment. Only between u = 1.45 and 1.65 the proprietary overall NPV exceeds the base case NPV before crashing down. Afterwards, it rises gradually, but well below the value and rate of increase of the base case NPV. An important difference between this case and South Stream is that market demand potential in the NWE market, though high (u = 1.48), is less promising than demand potential in the SSEE market (u = 1.84). When we consider and compare the information included on demand potential in Case study 2 with that included here for Case study 3, initial demand yet to be ‘covered’ for South Stream is greater than is the case for Nord Stream. In the interval roughly of (1.45 < u < 1.68), the proprietary Nord Stream case NPV is greater than the base case NPV.
Figure 11.27 Overall Net Project Value as function of upward market demand potential, u (with d fixed at 0.55)
-6000
-4000
-2000
0
2000
4000
6000
8000
10000
1.01 1.11 1.21 1.31 1.41 1.51 1.61 1.71 1.81 1.91
u
NPV*
Source: own analysis.
Proprietary case
Base case
Change in
market outcome
Nord Stream
2) Overall Net Project Value versus sensitivity to changes in the WACC Refer to Figure 9.28 below, which shows the sensitivity of NPV*G to changes in the risk-djusted discount rate k (i.e., the WACC). From the rise in the slope of the curve, it can be derived that the NPV*
G rises substantially with a small decrease in k, both in the base and

318
proprietary cases. This result is logical, because future cash flows are discounted at lower rates (i.e., a higher present value), with the NPV*
G rising most rapidly in the interval (0 < k < 7) in the proprietary case. Thus, the critical value of k to invest strategically is around 7 percent. In the base cases NPV*
G rises less steeply, though faster than it does in the corre-sponding graph for South Stream. This sensitivity analysis shows that when Gazprom accepts a lower WACC, the strategic value component values rise in the overall Net Pro-ject value. In the proprietary case, NPV*
G experiences a jolt at k ≈ 21 percent. This small jump in the curve is related to the change in market outcome as result of the competitor’s entry, as a result of an increase in the WACC for both players. The main difference between Nord and South Stream is that upward market demand potential is lower in the former case. A much lower WACC is required for the Nord Stream in order for it to be attractive from a strategic point of view.
Figure 11.28 Overall Net Project Value as function of the WACC
-15000
5000
25000
45000
1% 11% 21%
Source: own analysis.
Proprietary case
Base case
WACC
%
NPV*
mln$
Change in
market outcome
Nord Stream
3) Overall Net Project Value versus sensitivity to changes in unit operating costs Refer to Figure 11.29, which shows the sensitivity of NPV*G to changes in OPEX (c). Also similar to the South Stream case is the relationship between a fall in operating unit costs and overall NPV. Lower unit operating costs have an overall strategic impact on potential competition. Yet only at $14.48/mcm and below does Nord Stream’s overall NPV exceed the base case NPV (at a level of $6,200 billion). South Stream, by contrast, becomes more attractive than its own base case version at a level of $40.18/mcm. The small jump in the curve is related to the change in market outcome from monopolist (M) to leadership (S-L) after $75/mcm for Gazprom.

319
Figure 11.29 Overall Net Project Value as function of unit operating costs, c
-13000
-8000
-3000
2000
7000
12000
0 20 40 60 80
Source: own analysis.
Proprietary case
Base case
c
$/mcm
NPV*
mln$
Change in
market outcome
Nord Stream
11.4.7 Market outcome scenarios
The market outcome scenarios are reviewed at an aggregate European level in Chapter 10. At a sub-regional level Gazprom can end up as a quasi-monopolist, a dominant or a non-dominant firm as a result of its investment behaviour, or vice versa (also see Chapter 4/8). At a sub-regional level, in the case of the NWE region, can end up in a more dominant position at a sub-regional level in SSEE. Gazprom would have to invest more heavily than in scenarios where it ends up as a non-dominant firm. Investing in brownfield rather in greenfield projects may enable Gazprom to take a more passive role and become a less-than-dominant firm. At the country or sub-regional level, Gazprom is not as likely to end up even as a quasi-monopolist in the NWE market. In this specific sub-region, the NWE market, Gazprom faces greater potential LNG flows and entry than in SSEE markets.
11.4.8 Reflecting on the application of the model and the conceptual toolbox
Model results: Discussion The model’s application for Nord Stream demonstrates that LNG can act as a powerful competitor in the NWE market (and other regional markets in general, for that matter) when it achieves unit costs similar to a base case pipeline of 8 bcm/y. Of course, this may lead one to think Case study 3 is essentially a pipeline-to-pipeline competition game (as in Case study 2). However, the relationship between the various sources and in what form gas is supplied is based here on unit cost, so that it becomes irrelevant whether gas arrives in the form of LNG or pipeline gas, in volume terms. LNG has an interregional dimen-

320
sion that pertains to pricing rather than quantity or volume (see in this regard Chapter 10, Boon von Ochssée [2010]).435 The main model’s main result is that Nord Stream’s overall NPV (some $4.3 billion, un-der the proprietary case) is less than the base case NPV ($6.3 billion). The sensitivity analysis shows that with a substantial upward potential in market demand, Nord Stream becomes more profitable in overall NPV terms. In addition, the acceptance of a lower WACC by Gazprom vastly aids in facilitating a strategic investment and improves its over-all NPV at a steep rate. In such a case, Gazprom sees gas pipeline transport as an option to ensure its position on the commodity market. Even as far as unit costs are concerned, the base case has more favourable chances at success than the Nord Stream does up to unit operating cost level of some $20/mcm, below which Nord Stream becomes attractive vis-à-vis the base case. It is interesting to note that Nord Stream appears to enjoy some of the same benefits as South Stream does, primarily in terms of economies of scale and the size of the initial market demand. Yet despite a surge in market demand due to the upward potential of u = 1.84, Nord Stream remains less attractive than the base case in an important set of inter-vals (see figures above). Nord Stream’s overall NPV, for example, exceeds that of the base case only when demand rises by 1.45 upwards to roughly 1.68, as the base case maintains its value and as the model outcome changes from monopoly (M) to leadership (S-F). The base case pipeline for the Nord Stream case remains as attractive as the proprietary case at around 7 percent. Nevertheless, the impact on the market’s overall structure (i.e., the model outcomes discussed), may imply considerable value of the Nord Stream project. The conceptual toolbox: additional factors to take into consideration and scenarios The conceptual toolbox also helps assess what other investment variables may be at play, such as regulatory risk, just as in the case of South Stream. The effect of EU regulations as far as TPA is concerned may make such a wait-and-see approach more attractive, even though for now, Nord Stream is not treated by TPA legislation of the EU. In order to ensure its market position in volume term in the NWE market, Gazprom has already signed long-term contracts for 16.5 bcm/y, backed by vertical pipeline diplomacy. In addition, Gazprom has contracted 6 bcm/y of its own production via Gazprom M&T for short-term deals. The latter business model, see also Chapter 2, is more driven by a price-
435 The novelty of an increasingly interregional gas market is that large volumes of gas, which could previously not be exported over long distances, are now within economic reach of the various regional gas markets and in sufficient quantities to support economies of scale. The choices Gazprom makes, particularly with regard to market uncertainty and the potential threat of entry on the part of LNG, are likely to affect the regional gas balance in NWE and therefore also in the Atlantic Basin (i.e., through interregional volumes). Competition does not necessarily manifest itself for Gazprom in the form purely of pipeline gas from potential competitors in the Caspian Sea region. Yet here only true giants reserve-holder such as Qatar or Iran able to sustain such large flows to regional gas markets. Gazprom may either compete with Qatar as an LNG entrant or it may cooperate with Qatar by postponing investment or jointly coordinat-ing flows through a shared investment.

321
based strategy. As will be discussed in Chapter 10, Gazprom could decide to invest in additional Nord Stream capacity, partly on a commercial basis (e.g., additional supply contracts) and partly in a strategic manner in order to diversify transit country risk (mainly in Ukraine). This provides Gazprom with additional benefit of having an option to divert gas flows from existing and troublesome transit countries. In order to evaluate gas infrastructure investment decisions, a decision and/or policy-maker should consider the infrastructure’s commitment value vis-à-vis postponement value, in addition to its static value. However, it should also take into account ‘practical’ issues with respect to gas infra-structures, which is captured by the conceptual toolbox. Pipeline gas flows versus LNG-driven gas flows The flexible nature of the LNG value contrasts sharply with the rigidity of pipelines: the capacity of a re-gas terminal can be more flexibly used than a pipeline’s capacity because of the added benefits of interregional LNG arbitrage and the negligible costs of reserving capacity in a re-gas terminal (versus the sensitivity of maintaining free capacity in a pipe-line). Exclusive ownership of re-gas terminals (such as the one owned by ExxonMobil and Qatar Petroleum, see above) in various markets acts as a strategic option on future growth in various markets at the same time (from an interregional perspective). This reflects the added value of LNG which pipelines only have intra-regionally (in the case of several pipe-lines serving as alternative routes to different parts of a regional market, see also Chapter 12). Of course, LNG flows as such are also exposed to downside interregional price risks. In the end, the balance of demand and supply in the NWE market affects the interre-gional availability of LNG, particularly in the Atlantic Basin.
11.5 Case studies: conclusion
The case studies act as illustrations of how uncertain demand and the potential entry of a competitor can be taken into account by combining real-options with game-theoretic principles. For all intents and purposes, the application of the real-option game model has shown that value can be derived from an increase in economies of scale in transport capa-city for long-distance gas pipelines, which can act as a deterrent against possible entry (if unit costs are indeed actually brought down, which depends on the utilisation of the pipe-line). These gas pipelines can be employed by Gazprom to protect and/or expand market share making early strategic investments. Regional gas market structures can thus be influ-enced by individual projects, which is inherent to an industry characterised by an oligopo-listic market structure and a capital-intensive value chain. Such strategic reasoning attributes to the Blue Stream, the South Stream and Nord Stream pipelines, as we have argued in the case studies, a strategic value beyond merely commer-cial elements involved. As a result, we argue that pipelines (and other such gas transport infrastructures and value chains) can serve as tools to ensure Gazprom’s position as ‘market maker’. Via the application of the real-option game model, we contribute the notion that such infrastructural investments are never isolated phenomena; they may fit into a broader,

322
regional or extra-regional strategic agenda that is not simply about short-term profit-maximising behaviour. Simultaneously, the application and use of the real-option game model highlights the importance of a wait-and-see approach, i.e., a postponement strategy where large lumpy investments are mothballed until they may appear to be necessary to compete with others after all. From the model’s perspective, the Blue Stream emerges as a failure both from a commer-cial as well as an economic-strategic point of view. Greater economies of scale, combined with a greater initial demand, may have made the project more successful from the outset. Yet South Stream is accorded a positive overall NPV, owing partially to larger economies of scale and greater upward demand potential. Despite high economies of scale, the Nord Stream, by contrast, is accorded an overall NPV inferior to its base case NPV. Lower up-ward demand potential is an important factor in Nord Stream’s overall Net Project value. The Nord Stream is important in that, conceptually, it takes into account LNG entry. Though LNG is assumed to correspond with an 8 bcm/y pipeline for reasons of simplicity, LNG entry in Case study 3 is less about a volume-oriented approach and more on a price-oriented one. In the South and Nord Stream cases, the acceptance on the part of the inves-tor of a lower return on investment vastly contributes to facilitating a strategic investment and improves its overall NPV at a steep rate. The sensitivity analyses with regard to the different input variables demonstrates that there is no single answer and highlight the importance of investigating changes in the value of overall NPV vis-à-vis input variables. In principle, the greater the probability of downside demand, the greater the value of post-poning strategic investment. The case studies convey this point from a conceptual and a model perspective. It should be emphasised again that the model is clearly a gross and crudely fashioned sim-plification of real world developments. The model can explain some of the strategic aspects of why Gazprom has constructed and may still construct various pipelines. These pipelines potentially serve as deterrents, which can alter market structures within regional gas mar-kets, particularly in Europe. The case studies explain the nature and potential results of competition in regional and sub-regional gas markets and helps us to better comprehend the dynamics involved. However, the model cannot account for the interaction amongst more than two suppliers, where the gas industry is invariably characterised by more than two suppliers in any given market. Other model assumptions, which remove it further from real world gas industry considera-tions, include the restriction to optimisation of quantities, whereas pricing plays an equally important role. The model also considers competition at a sub-regional and regional level whereas an interregional dimension is left out. Other issues such as taxes are also excluded. At the project level, the model cannot account for factors such as the financial and organ-isational feasibility. Another important omission in the model is inherent in the two-stage

323
nature of competition between gas suppliers: while the model consists of only two stages, real world developments are often indefinite. Alternative fuels, such as nuclear energy, for example, may or may not become more at-tractive than gas as a function of political or economic preferences, especially when one player has a real dominant role in the gas market. This can adversely impact the potential of gas in wider energy markets.436 A politically determined course, which seeks to exclude Russian gas, poses a serious risk to capturing additional gas market share for Gazprom, as do regulatory barriers and permit risks (e.g., TPA, antitrust regulation). On that note, the general investment climate also plays an important role in the various regional and sub-regional gas markets. Vertical energy diplomacy helps Gazprom ensure, at a government level, to secure access to possible gas market demand growth and to minimise the likelihood of downward de-mand moves as prescribed in the model. European mid-streamers and off-takers play an important role in this regard, being the actors, at a firm level, that purchase Russian gas and have substantially interests in the value chain such as vertical swaps. Moreover, signing long-term contracts with European buyers enables Gazprom to ensure its market position in volume terms in the European market. Such a strategy is most likely in (near-)mature markets. Alternatively, Gazprom may reserve (additional) capacity for short-term deals, contracting its own production through wholly owned subsidiaries such as Gazprom M&T, for example. As a business model, the latter is driven more by a price-based strategy and used to be applied growth markets. Gazprom also shares pipeline investments and other components of the value chain with regional European gas-exporting countries (par-ticularly in North Africa), using government-level instruments, which pertains to horizon-tal energy diplomacy. Geo-economic and geopolitical factors are also forces which the stylised model cannot account for and which can underpin strategic investments. The toolbox in Chapter 4, and the conceptual discussions in the case studies themselves, are an effort to account for these factors conceptually. Some of the factors the model leaves out may incline Gazprom to-wards making strategic investments. The individual games depicted by the case studies each lead to various sub-regional gas balances and market outcomes, such as quasi-monopoly, dominant and non-dominant outcomes. As will be shown in Chapter 11 in Boon von Ochssée [2010] geopolitical forces may incline Gazprom towards a more aggres-sive investment strategy. An aggregate European level, these outcomes feed back into in-vestment decisions, and ultimately have an important impact on the merit order, as will be
436 In contrast, the model ascribes a substantial value in the event that a player becomes dominant or a monopolist. From a practical point of view, such outcomes also have their drawbacks, resulting in lower corresponding values and other practical difficulties (e.g., by competition authorities and the pressure of substitutes).

324
discussed in Chapter 12. In order to achieve the various outcomes, various levels of in-vestment (both up- and mid-stream) can be made, depending on the outcome in question.

325
Chapter 12 Russia’s export strategy in the dynamic European
market as a whole∗∗∗∗
12.1 Introduction
In case studies 1 through 3, an analysis was made of the various strategic moves available to Gazprom, primarily as an incumbent in sub-regional European markets. Attention was paid to the SSEE and NWE markets, in which various strategic situations were analysed from a historical vantage point (Case study 1) while the other two are more prospective in the sense that the model is used to derive inferences about expected strategic behaviour in the real world (ex ante perspective). The case studies show, amongst other issues, that strategic investments can lead to first-mover advantages, but can also run into situations of market oversupply. The purpose of this chapter is to recapitulate case studies 1 through 3 with a focus on the rationale behind Gazprom’s (intended) investments and the impact on market structure in the European gas market as a whole. This recapitulation serves as a backdrop to a conceptual discussion on possible demand and supply scenarios involving extremes of either undersupply or oversupply. Further-more, the question will be addressed why exporters may wish to avoid the extremities in these scenarios. Section 12.2 aggregates supply and demand for Europe from a Russian perspective against the background of cases studies 2 and 3. Section 12.3 provides a sce-nario analysis on Gazprom’s market position in Europe and the implications thereof for its investment and Russia’s export strategy. Section 12.4 addresses the rationale for overcapac-ity in Russia’s export pipeline system to Europe in order (1) to reroute and diversify flows from the existing (Ukrainian) system; and (2) to capture additional economic rents through arbitrage opportunities, combined with a multi-market entry point strategy. 12.2 Aggregated supply and demand outlooks for Europe:
A Russian perspective
A pan-European perspective is required to bring into view the various possible export strategies, and to ultimately determine Gazprom’s and Russia’s optimal investment portfo-lio. When considering the European market as a whole, pipeline investments such as Nord Stream and South Stream, become potential investments not only with regard to separate sub-regional markets but also to the European market as a whole. In this European mar-ket, the NWE and SSEE markets still form the bulk (84 percent) of European demand, see Figure 12.1. Seen from a Russian vantage point too, the NWE and SSEE markets form the bulk of European demand and growth potential.
∗ This chapter was partially been co-authored with Timothy Boon von Ochssée.
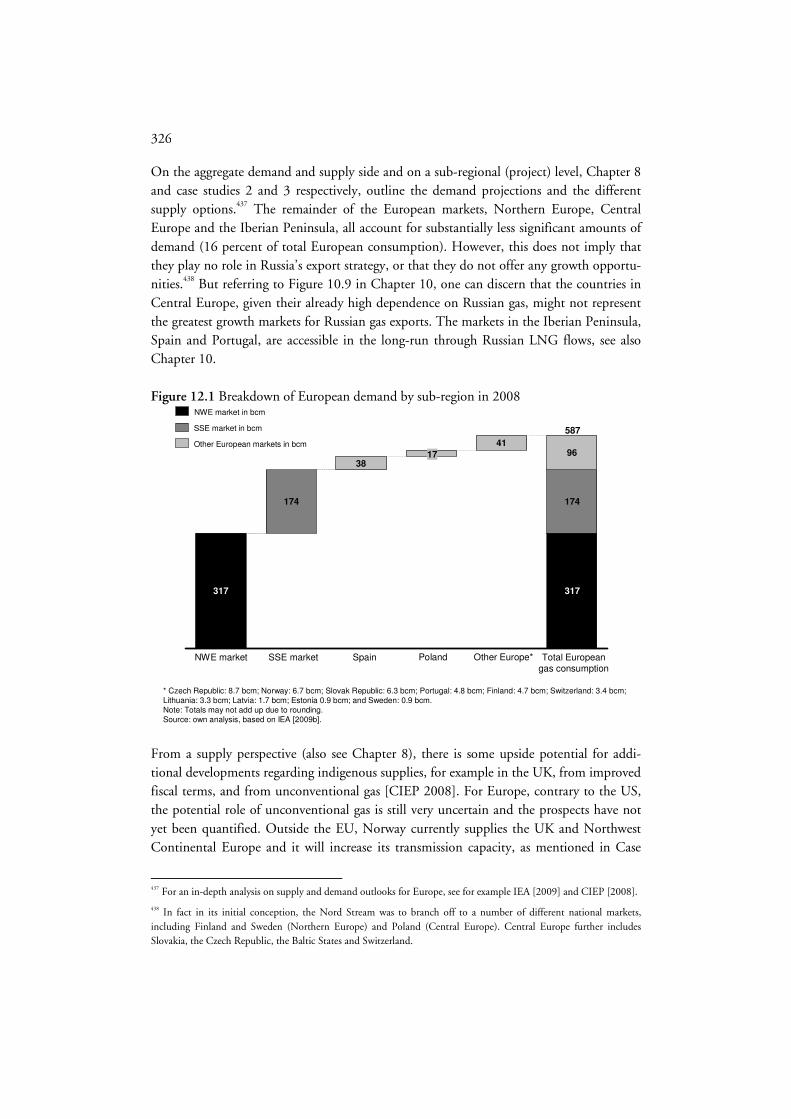
326
On the aggregate demand and supply side and on a sub-regional (project) level, Chapter 8 and case studies 2 and 3 respectively, outline the demand projections and the different supply options.437 The remainder of the European markets, Northern Europe, Central Europe and the Iberian Peninsula, all account for substantially less significant amounts of demand (16 percent of total European consumption). However, this does not imply that they play no role in Russia’s export strategy, or that they do not offer any growth opportu-nities.438 But referring to Figure 10.9 in Chapter 10, one can discern that the countries in Central Europe, given their already high dependence on Russian gas, might not represent the greatest growth markets for Russian gas exports. The markets in the Iberian Peninsula, Spain and Portugal, are accessible in the long-run through Russian LNG flows, see also Chapter 10.
Figure 12.1 Breakdown of European demand by sub-region in 2008
38
4196
317
174
317
174
* Czech Republic: 8.7 bcm; Norway: 6.7 bcm; Slovak Republic: 6.3 bcm; Portugal: 4.8 bcm; Finland: 4.7 bcm; Switzerland: 3.4 bcm;Lithuania: 3.3 bcm; Latvia: 1.7 bcm; Estonia 0.9 bcm; and Sweden: 0.9 bcm.Note: Totals may not add up due to rounding. Source: own analysis, based on IEA [2009b].
PolandSpainNWE market SSE market Other Europe* Total European gas consumption
SSE market in bcm
Other European markets in bcm
NWE market in bcm
17
587
From a supply perspective (also see Chapter 8), there is some upside potential for addi-tional developments regarding indigenous supplies, for example in the UK, from improved fiscal terms, and from unconventional gas [CIEP 2008]. For Europe, contrary to the US, the potential role of unconventional gas is still very uncertain and the prospects have not yet been quantified. Outside the EU, Norway currently supplies the UK and Northwest Continental Europe and it will increase its transmission capacity, as mentioned in Case
437 For an in-depth analysis on supply and demand outlooks for Europe, see for example IEA [2009] and CIEP [2008].
438 In fact in its initial conception, the Nord Stream was to branch off to a number of different national markets, including Finland and Sweden (Northern Europe) and Poland (Central Europe). Central Europe further includes Slovakia, the Czech Republic, the Baltic States and Switzerland.
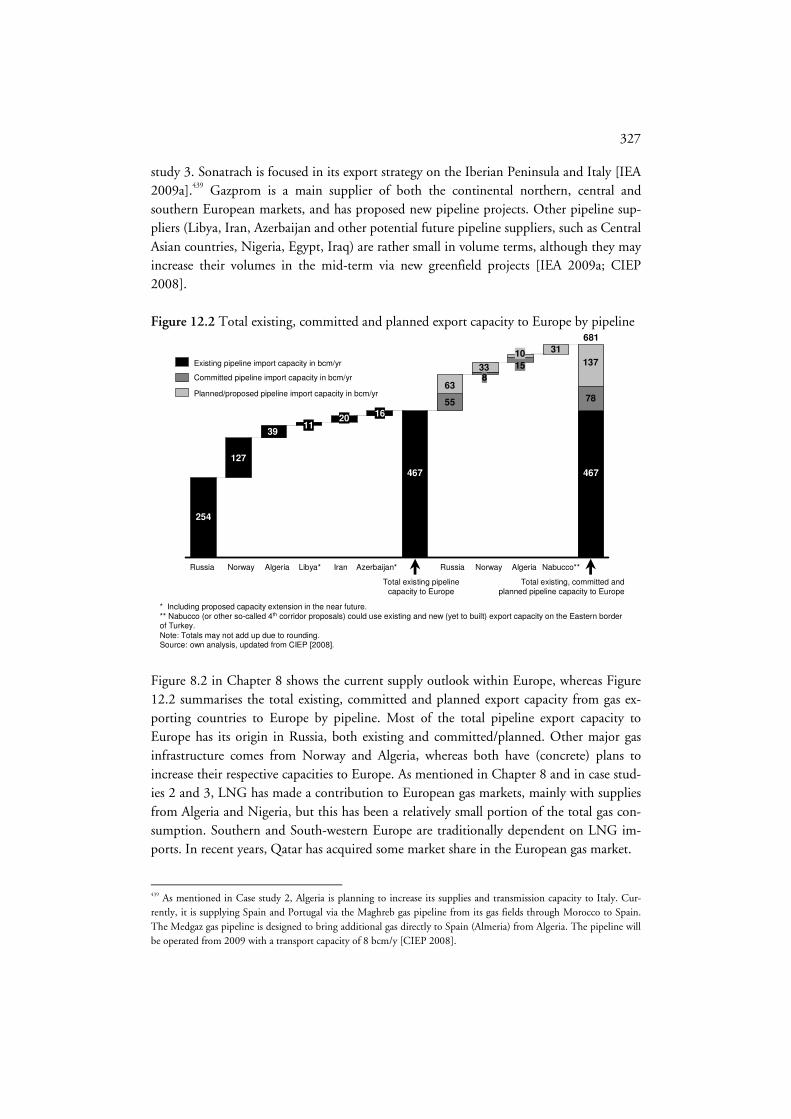
327
study 3. Sonatrach is focused in its export strategy on the Iberian Peninsula and Italy [IEA 2009a].439 Gazprom is a main supplier of both the continental northern, central and southern European markets, and has proposed new pipeline projects. Other pipeline sup-pliers (Libya, Iran, Azerbaijan and other potential future pipeline suppliers, such as Central Asian countries, Nigeria, Egypt, Iraq) are rather small in volume terms, although they may increase their volumes in the mid-term via new greenfield projects [IEA 2009a; CIEP 2008]. Figure 12.2 Total existing, committed and planned export capacity to Europe by pipeline
* Including proposed capacity extension in the near future.** Nabucco (or other so-called 4th corridor proposals) could use existing and new (yet to built) export capacity on the Eastern border of Turkey.Note: Totals may not add up due to rounding.Source: own analysis, updated from CIEP [2008].
Azerbaijan*IranLibya*Russia AlgeriaNorway Nabucco**Algeria
Total existing pipeline capacity to Europe
NorwayRussia
Total existing, committed and planned pipeline capacity to Europe
254
127
3911
2016
55
467
33 15
31
467
681
Existing pipeline import capacity in bcm/yr
Committed pipeline import capacity in bcm/yr
Planned/proposed pipeline import capacity in bcm/yr63
8
10
78
137
Figure 8.2 in Chapter 8 shows the current supply outlook within Europe, whereas Figure 12.2 summarises the total existing, committed and planned export capacity from gas ex-porting countries to Europe by pipeline. Most of the total pipeline export capacity to Europe has its origin in Russia, both existing and committed/planned. Other major gas infrastructure comes from Norway and Algeria, whereas both have (concrete) plans to increase their respective capacities to Europe. As mentioned in Chapter 8 and in case stud-ies 2 and 3, LNG has made a contribution to European gas markets, mainly with supplies from Algeria and Nigeria, but this has been a relatively small portion of the total gas con-sumption. Southern and South-western Europe are traditionally dependent on LNG im-ports. In recent years, Qatar has acquired some market share in the European gas market.
439 As mentioned in Case study 2, Algeria is planning to increase its supplies and transmission capacity to Italy. Cur-rently, it is supplying Spain and Portugal via the Maghreb gas pipeline from its gas fields through Morocco to Spain. The Medgaz gas pipeline is designed to bring additional gas directly to Spain (Almeria) from Algeria. The pipeline will be operated from 2009 with a transport capacity of 8 bcm/y [CIEP 2008].
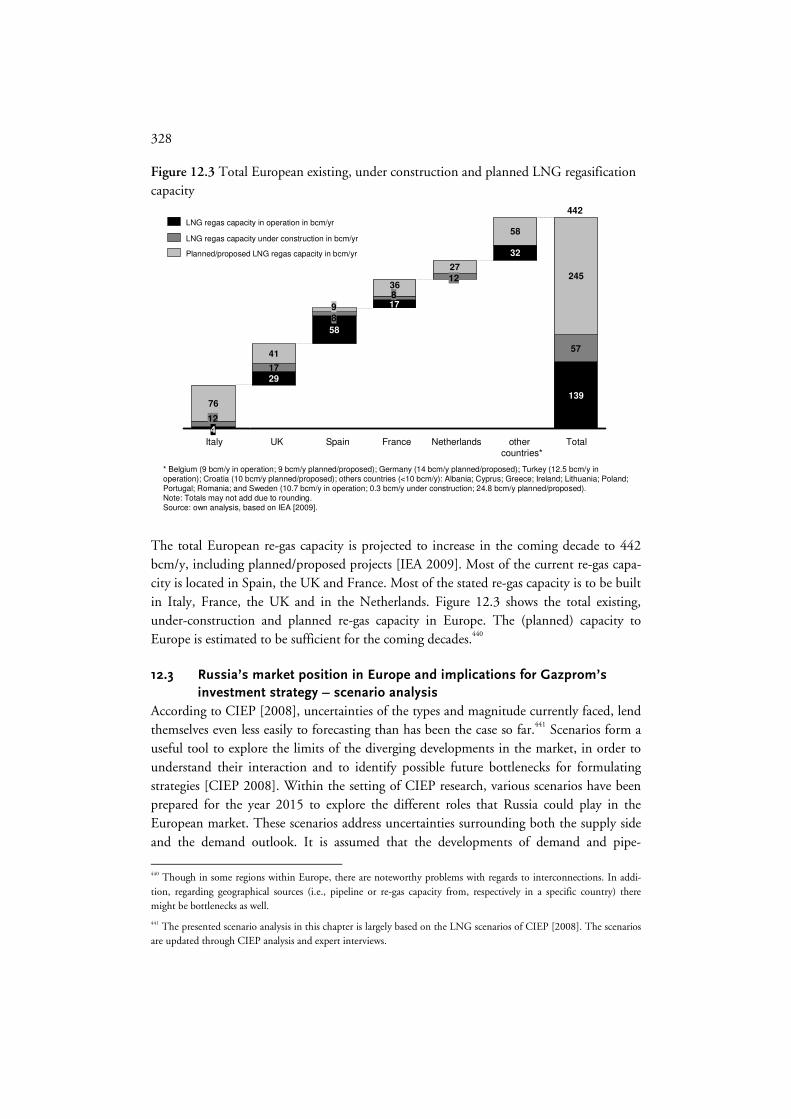
328
Figure 12.3 Total European existing, under construction and planned LNG regasification capacity
29
58
17
32
17
245
76
41
27
58
139
4
57
36
* Belgium (9 bcm/y in operation; 9 bcm/y planned/proposed); Germany (14 bcm/y planned/proposed); Turkey (12.5 bcm/y in operation); Croatia (10 bcm/y planned/proposed); others countries (<10 bcm/y): Albania; Cyprus; Greece; Ireland; Lithuania; Poland; Portugal; Romania; and Sweden (10.7 bcm/y in operation; 0.3 bcm/y under construction; 24.8 bcm/y planned/proposed). Note: Totals may not add due to rounding. Source: own analysis, based on IEA [2009].
NetherlandsSpainItaly
LNG regas capacity in operation in bcm/yr
LNG regas capacity under construction in bcm/yr
Planned/proposed LNG regas capacity in bcm/yr
TotalUK France other countries*
124
8
8
12
9
442
The total European re-gas capacity is projected to increase in the coming decade to 442 bcm/y, including planned/proposed projects [IEA 2009]. Most of the current re-gas capa-city is located in Spain, the UK and France. Most of the stated re-gas capacity is to be built in Italy, France, the UK and in the Netherlands. Figure 12.3 shows the total existing, under-construction and planned re-gas capacity in Europe. The (planned) capacity to Europe is estimated to be sufficient for the coming decades.440
12.3 Russia’s market position in Europe and implications for Gazprom’s
investment strategy – scenario analysis
According to CIEP [2008], uncertainties of the types and magnitude currently faced, lend themselves even less easily to forecasting than has been the case so far.441 Scenarios form a useful tool to explore the limits of the diverging developments in the market, in order to understand their interaction and to identify possible future bottlenecks for formulating strategies [CIEP 2008]. Within the setting of CIEP research, various scenarios have been prepared for the year 2015 to explore the different roles that Russia could play in the European market. These scenarios address uncertainties surrounding both the supply side and the demand outlook. It is assumed that the developments of demand and pipe-
440 Though in some regions within Europe, there are noteworthy problems with regards to interconnections. In addi-tion, regarding geographical sources (i.e., pipeline or re-gas capacity from, respectively in a specific country) there might be bottlenecks as well.
441 The presented scenario analysis in this chapter is largely based on the LNG scenarios of CIEP [2008]. The scenarios are updated through CIEP analysis and expert interviews.

329
line/LNG supply are largely independent of one another. Russia (and Gazprom) chooses roughly its level of market penetration in Europe based on these variables [CIEP 2008]. In the following, it is assumed that Gazprom will retain its gas export monopoly for Russia. 12.3.1 European demand: Scenario cases
Different assumptions, mainly varying with the effectiveness of the 20/20/20 EU targets and the impact of the current economic crisis, suggest a range of gas demand levels in Europe in 2015, ranging from 595 bcm/y to 640 bcm/y, implying limited, reduced and substantial demand growth. Figure 11.4 provides an overview.
Figure 12.4 Different demand scenarios for the European gas market in 2015
• Security of supply and 20/20/20 feature high on the political agendas of the EU
• Diversification of fuels generate support for ‘capture-ready’ coal-fired generation, which gives CCS a momentum (combined with low coal prices are low)
• Renewables 15 percent of final energy consumption, energy efficiency programmes become very effective
• The limited demand growth because of the economic crisis of 2008/09
Assumption
Low case (595 bcm)
Source: CIEP analysis; IEA [2009]; expert interviews
5
590
2015
• Efficiency and energy saving programmes take effect
• Renewables grow well beyond 10 percent of final energy consumption
• A mix of coal- and gas-fired power generation develops in the European markets
• The economic crisis of 2008/09 could also have an effect on the demand level of growth
Base case (630 bcm)
40
590
2015
• Restoring economic growth takes precedence over 20/20/20 targets
• Renewables grow to some 10 percent of final energy consumption and limit savings
• Concerns about the effective introduction of CCS reduces the support for ‘capture-ready’ coal-fired power plants
• High CO2 emission costs and high coal prices
High case (640 bcm)
50
590
2015
Demand in 2008Additional demand
12.3.2 Pipeline and LNG supplies from Russia’s competitors: Scenario cases
On the supply side, for the purpose of this chapter, different scenarios have been deve-loped for international supplies to Europe from pipeline and LNG competitors, from a Russian perspective. These competing pipeline and LNG supplies offer a large range of between 255 bcm and 385 bcm in 2015. Adding an estimated indigenous production of some 130-140 bcm in 2015, the competing supplies lie in the range of between 385 and 525 bcm/y. Figure 12.5 provides an overview of the different scenarios for pipeline and LNG supplies from Russia’s competitors in 2015, based on availability/export ambitions and flexibility on annual contracted quantities (ACQ). Note that all country-related gas flows (including indigenous supplies) described in Figure 12.5 correspond with pipeline flows.
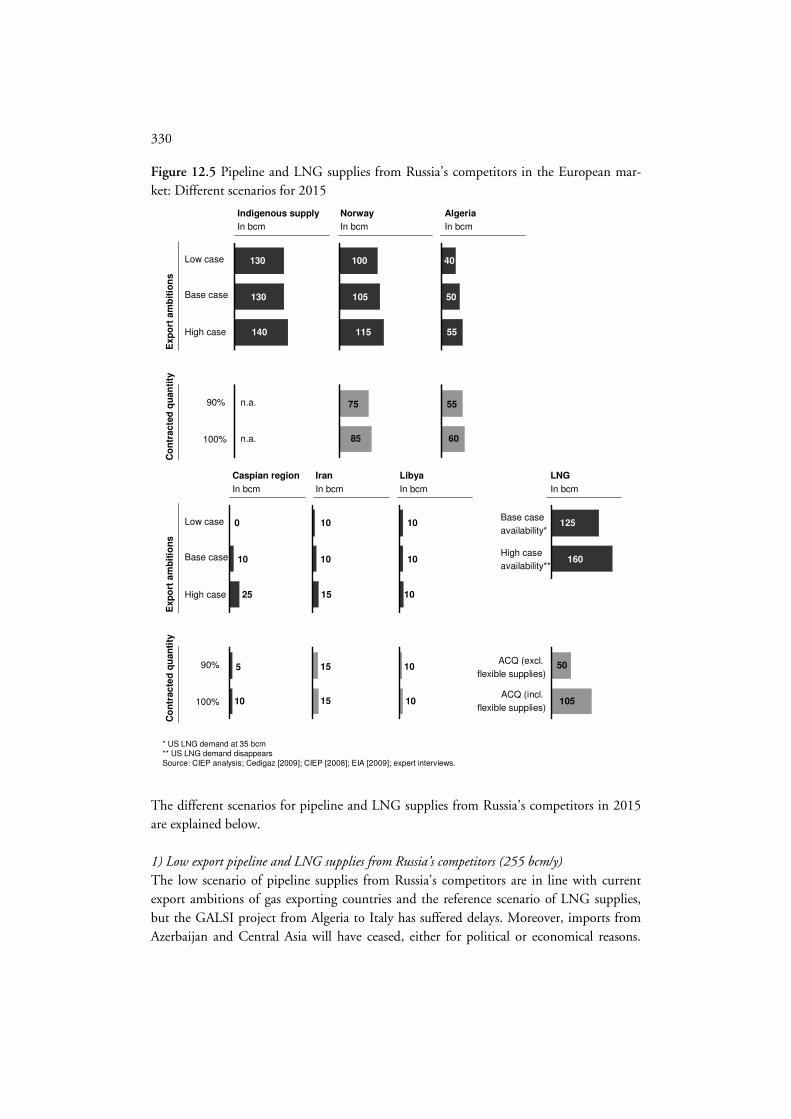
330
Figure 12.5 Pipeline and LNG supplies from Russia’s competitors in the European mar-ket: Different scenarios for 2015
100%
90%
140
130
130
High case
Low case
Base case
Indigenous supply
In bcm
Norway
In bcm
Algeria
In bcm
115
105
100
85
75
55
50
40
60
55
Exp
ort
am
bit
ion
sC
on
tracte
d q
uan
tity
n.a.
n.a.
* US LNG demand at 35 bcm** US LNG demand disappearsSource: CIEP analysis; Cedigaz [2009]; CIEP [2008]; EIA [2009]; expert interviews.
100%
90%
25
10
0
High case
Low case
Base case
Caspian region
In bcm
Iran
In bcm
Libya
In bcm
LNG
In bcm
15
10
10
15
15
10
10
10
10
10
55
160
125
105
50
10
5ACQ (excl.
flexible supplies)
ACQ (incl.
flexible supplies)
Exp
ort
am
bit
ion
sC
on
trac
ted
qu
an
tity
Base case
availability*
High case
availability**
The different scenarios for pipeline and LNG supplies from Russia’s competitors in 2015 are explained below. 1) Low export pipeline and LNG supplies from Russia’s competitors (255 bcm/y) The low scenario of pipeline supplies from Russia’s competitors are in line with current export ambitions of gas exporting countries and the reference scenario of LNG supplies, but the GALSI project from Algeria to Italy has suffered delays. Moreover, imports from Azerbaijan and Central Asia will have ceased, either for political or economical reasons.

331
Therefore, fourth corridor’s prospects have not matured into physical gas supplies in 2015, see also Case study 3. The development of ‘unconventionals’ in the US will be on hold, so that only the currently contracted LNG in 2015 (including flexible supplies) will find its way to Europe (105 bcm). The US market will absorb remaining LNG available in the LNG Atlantic market. Moreover, new supplies of LNG are slow to come on stream. 2) Current export ambitions of Russia’s competitors (310 bcm/y) Producers achieve their stated plans and commitments. The fourth corridor is modestly successful. Norwegian pipeline sales are limited to 105 bcm/y, including spot trade. LNG supplies will find their way to the European market and some 20 bcm additional volumes have been contracted. The US demand for LNG will be 35 bcm in 2015 [EIA 2009]. 3) High LNG and pipeline supply from Russia’s competitors (385 bcm) All planned import pipelines to Europe have been laid and are used for additional supplies. For example, the first phases of the Nabucco pipeline and/or TAP/TGII are successful taking in mainly Shah Deniz II gas in Azerbaijan and possibly other Caspian gas (includ-ing Iran and Iraq). Libya has increased its exports with 3 bcm to 11 bcm in 2015, because of an extension of the Greenstream. Norway also increases its exports to Europe with the new Europipe III (to 115 bcm in 2015). Algeria focuses its export strategy at pipeline supplies to the south European markets, which means 56 bcm in 2015, according to ex-pert interviews. The call on LNG imports in North America is zero, resulting from more indigenous production of unconventional gas and a drive towards sustainable energy. Europe offers higher spot prices than the US and can take the LNG it needs out of the Atlantic Basin at market prices. Additional re-gasification capacity has been built to facili-tate these supplies. Indigenous supply For the low and base cases, indigenous supply has been kept at the level of 130 bcm in 2015. In the high case, there is some possible upside potential (10 bcm), mainly from the UK. 12.3.3 Combined scenarios of demand and supply
It is assumed that the total of contracted Gazprom supplies in 2015 are in the order of 180 bcm/y, based on 90 percent of the standing and already signed long-term contracts (also see Chapter 10). Taking the level of competitors’ supplies as given, one can outline scena-rios with respect to the level of possible Gazprom’s supplies to Europe. The scenario-contingent outcomes of Gazprom’s supply in Figure 12.6 are simply derived by ‘plugging in’ Gazprom as a residual supplier. Either Europe is additionally supplied with LNG and competitors’ pipeline volumes such that it is oversupplied to a certain degree, or LNG and competitors’ pipeline volumes remain marginal. In the latter case, Russian volumes are assumed to dominate the European market at undersupply, with Russia free to seize re-maining or residual demand. The result of combining the three demand cases with the

332
three possible competitors’ pipeline gas-versus-LNG combinations is shown in Figure 12.6, in the form of a three-by-three matrix. Based on Gazprom’s supplies of 180 bcm in 2015, in four scenarios, Gazprom has over-contracted (25-110 bcm) unless Gazprom increases its level of flexibility within its take-or-pay contracts (i.e., lower minimum ACQ). The other five scenarios in Figure 12.6 suggest that possible additional supplies from Gazprom to Europe can increase to 75 bcm in 2015. Figure 12.6 Gazprom’s possible gas supply in Europe, based on combined scenarios of European gas demand and competition supply in 2015
Non-dominant market position
Dominant market position
market balance
Possible undersupply
* Including Norway.** Low case: contracted supplies (incl. flexible supplies); base case: available LNG, with US LNG demand at 35 bcm; high case: available LNG with no US LNG demand. † 90 Percent of Gazprom’s ACQ to Europe in 2015. Source: own analysis, based on Cedigaz [2009]; EIA [2009]; IEA [2009]; privately disclosed company data.
Current export
ambitions suppliers
Total required bcm of Gazprom 2015
Contracted supply by Gazprom†
Low High
Eu
rop
ean
gas
dem
an
d
High growth
Reduced growth
Limited growth
Gas supply by competition
Additional market opportunities
Over contracted
Gazprom supply
130 130 140
640
630
595
150 185 225
Indigenous supply Europe
Gas imports by pipeline*
oversupply
105 125 160Gas imports by LNG**
Gazprom supply
Gazprom supply
xx
Gazprom supply
Gazprom supply
Gazprom supply
Gazprom supply
Gazprom supply
Gazprom supply
D
ND
D
ND
115115 65
105105 75
70 70110
200180 20
190180 10
155 15525
255180 75
245180 65
180 21045
12.3.4 Investment variables in mid- and upstream
All these different scenarios have an impact on Russia’s export position in Europe and Gazprom’s optimal investment policy in the mid- and upstream, i.e. the merit order (see also Chapter 3). In order to transport additional gas to Europe, Gazprom has different transport options to do so:
1) it can use overcapacity of the existing network of Gazprom; 2) it can contract transmission capacity with TSOs; 3) it can realise brownfield investments in existing transmission networks (e.g., addi-
tional compressor investments, such as in the Yamal-Europe pipeline); 4) it can invest in new greenfields, such as Nord Stream, South Stream, Blue Stream
II, and/or other new (not yet) proposed pipeline projects;

333
5) it can develop an LNG business for Europe, either by building its own regas ca-pacity or by contracting capacity in Europe; and finally
6) Gazprom can decide to stay away from Europe (and possibly develope LNG and/or pipelines to other regional markets, such as Asia and the US).
In order to make gas available for Europe, Russia (including Gazprom) has several options to increase its own available gas volumes too. The optimal supply portfolio, or merit order of supply, is highly dynamic, influenced by numerous external factors (e.g., economic growth, cost structure, domestic governmental policy, and geopolitical factors). Not all options mentioned below are feasible on a commercial basis. For instance, long-term commitments, such as buying gas volumes outside Russia on a large scale, may be exposed to downside (financial) risks. In addition, it is difficult to ascertain which combination of gas sources will be adopted for export volumes to Europe in each scenario. Gazprom and Russia have roughly the following options in making additional gas volumes available for Europe (besides its existing production, see also Chapter 10):
1) Gazprom can decide, if possible, to raise its production from the ‘Big Three’ (e.g., Urengoy, Yamburg and Medvezhye gas fields) as a short and/or mid-term solu-tion;
2) Gazprom can decide to make additional gas available from new production of Gazprom’s ‘small’ fields in different areas, e.g., a so-called ‘small-field policy’. The institutionalisation of this policy might be realised through joint ventures with foreign gas companies and Russian independents;
3) Gazprom can decide to start developing giant gas fields in various phases with high economies of scale, probably together in joint ventures with foreign investors and Russian independents via (minor) stakes (e.g., as planned, Yamal Peninsula and Shtokman);442
4) Gazprom can increase its dependence on gas imports in order to free up addi-tional gas for exports as a short and/or mid-term solution: a) from the former Soviet republics (i.e., Central Asian countries and Azerbai-
jan) via long-term contracts; b) other non-Russian areas, either via long-term contracts (e.g., gas purchase
proposals from Libya) or via spot and/or short-term contracts (e.g., non-Russian LNG purchases via Gazprom M&T);
5) the Russian government can take measures in order to reduce the call for domes-tic use and CIS exports (e.g., increasing regulated domestic and CIS export prices to netback-pricing and measures with respect to stimulate efficiency of gas use)443;
and finally
442 Gas available from these sources could be transported either via LNG or pipeline. Other proposed greenfields are located in Eastern part of Russia (e.g., East Siberia and Sakhalin), mostly identified for the Asian (and US) market.
443 Other external factors, e.g., Russian current economic crisis, may reduce also domestic and CIS consumption of gas. Moreover according to IEA analysis in 2008, Russia could save almost 100 bcm/y of gas by (1) increasing the efficiency of combined heat and power (circa 40 bcm/y); (2) introducing more advanced available technology (at least 30 bcm/y);

334
6) the Russian government can take measures to stimulate production from inde-pendents (e.g., providing better infrastructure, access profit sharing and reducing gas flaring) and/or Gazprom can purchase more gas from independents.
12.3.5 Different market position and market condition scenarios for Russia
The resulting market structure depends, in principle, on the investment decisions of Gaz-prom and/or its potential rival(s) with respect to their investments, actions and coordina-tion games along the gas value chain.444 On a regional European level, there are two scena-rios with respect to Russia’s market position in volume terms: (1) a dominant firm and (2) a non-dominant firm or fringe scenario (see also Figure 12.7). These scenarios are resulting from the demand and supply (pipeline gas and LNG) combinations, derived from the outcomes in Figure 12.6. Figure 12.7 Different market position and market condition scenarios for Russia
Buyer’s market Seller’s market
Ru
ss
ia’s
ma
rke
t p
os
itio
n*
Quasi-monopolist/dominant
Non-dominant
Gas market condition in Europe
* Gazprom’s position as a gas supplier in Europe at a firm level.Source: own analysis.
A quasi-monopoly scenario, which implies a market share above 70 percent, is a purely theoretical scenario on an aggregated European level, when one refers to Figure 12.6.445 Also from a practical Russian point of view, such a market position in the European gas market may not be desirable, because of regulatory backlash, the threat of substitutes and possible organisational and financial problems regarding projects’ institutionalisation (see also Box 12.1). On a sub-regional and/or country level, a (quasi-)monopoly position may
(3) reducing the volumes of associated gas flared (at least 15 bcm/y); (4) greater savings are available in distribution systems and buildings (at least 15 bcm/y) [IEA 2008].
444 On a sub-regional level, see also the model and conceptual results in case studies 2 and 3 in Chapter 11.
445 In the most extreme scenario in Figure 12.6, Gazprom has a market share of 40 percent on aggregated European level (see also a dominant market position scenario).

335
be possible; see also case studies 1-3. The market position scenarios are derived from the conceptual toolbox in Chapter 4. The level of success of Russia’s investments depends on the market condition in Europe, which is essentially influenced by the dynamics on the demand side and actions of com-petitor’s suppliers and Russia itself. The likelihood of oversupply (i.e., a buyer’s market as a market condition) rises as the number of rivals rises in volume terms, whether these vol-umes are supplied by a limited number of large firms or by more numerous firms. Re-gional oversupplies, in turn, can spill over in an interregional (price) dimension. Other market condition scenarios in addition to a buyer’s market are: undersupply (i.e., seller’s market) and market balance. In reality of course, there are an endless number of scenarios or market outcomes imagi-nable with different combinations of pipeline gas and LNG volumes. Moreover, due to changing market circumstances, both on the supply and demand side, Russia’s strategy outcome, and therefore Gazprom’s investment actions, is part of a dynamic process. How-ever, the essence here lies in the reasoning behind each type of scenario and the implica-tions for Russia’s gas export strategy to Europe. The market is no longer assumed to consist of only two players (as was assumed in the stylistic model in case studies 1 through 3), but of Gazprom, on the one hand, and LNG suppliers on the other, some of whom also supply pipeline gas. There are essentially two possible market position scenarios to be sketched out for Russia regarding its position in the European gas market, where Russia is faced with either a buyer’s or seller’s market. The different scenarios, involving different market outcome positions for Gazprom, corre-spond with different levels of feasibility and different forms of coordination mechanisms with governments and firms in off-take markets and other gas-exporting countries.446 If Gazprom ends as a dominant player in Europe’s gas market in the medium to long-term, it will behave differently than it would as a non-dominant firm. 1) Russia as dominant supplier in Europe In the dominant (or leader-follower) firm scenario, Gazprom’s market share is between 30 and 70 percent. This market position occurs in 5 scenarios in Figure 12.6 (delimited col-lectively by a dark line), in which it has a market share of 30-40 percent in the European gas market. In these scenarios it is assumed that Gazprom further employs its market op-portunities (10-75 bcm/y), e.g., supplying more than the 180 bcm/y, which is already contracted from 2015 onwards.447 In such a dominant firm scenario, little additional LNG
446 Chapter 10 in Boon von Ochssée [2010] covers the different levels of feasibility and different forms of coordinated cooperation with gas-exporting countries and firms.
447 From a theoretical point of view, which is not included in the scenario-figure, if Gazprom decides to supply more than the market requires, the European gas market will be oversupplied.

336
arrives in the European market and some competitors’ pipeline supplies are postponed or abandoned. Especially in the most extreme scenario, in which Gazprom supplies 255 bcm/y in 2015 onwards (40 percent market share), there is much pressure on Gazprom’s investment abil-ity to expedite the construction of its production and transmission capacity to Europe. In such a scenario, despite new investments in transmission capacity such as South and Nord Stream, Gazprom will remain dependent on Ukrainian transit.448 Yet, the large-diameter pipelines can be seen as strategic tools designed to ‘coordinate’ other gas flows in the form of either pipeline or LNG (see the results of case studies 1-3 in Chapter 11). In addition, Gazprom has to take a large number of measures, on both the domestic and export sides. For example, Gazprom can start exploring new giant gas fields on the Yamal Peninsula and/or the Shtokman gas field, combined with increasing its imports from Central Asia and Azerbaijan and additional storage capacities in Europe. The Russian government can also stimulate energy efficiency on the domestic market to free up Russian molecules for the export market(s); see also Section 12.3.4. It is questionable, however, whether Gaz-prom could coordinate and finance these investments. Additionally, from a regulatory and substitute perspective, it may also not be desirable to have such a high market share (see Box 12.1). In a seller’s market with Russia as a dominant supplier in Europe, Gazprom is the main balancing supplier; its marginal prices set price levels in Europe. In return, Europe will continue to be well supplied under current price regimes [CIEP 2008]. In a seller’s market, new business models of flexible supplies present Gazprom with opportunities to optimise their profits not through quantity-based decisions but rather through such pricing discrep-ancies (i.e., additional revenues via short-term and spot sales of Gazprom M&T) [De Jong et al. 2010]. In the situation of a buyer’s market, Russia has to compete heavily with other pipeline and LNG suppliers in order to remain a dominant supplier to Europe. Such a scenario could have a negative impact on Russia’s market share, as well as on its price regime of oil-linked prices due to tension of lower prices on trading hubs (see also Chapter 8). The develop-ments in the last years’ gas market illustrate this fact. Due to the combined impact of a demand reduction and developments around unconventional gas in the US (and LNG) altered the seller’s market into a buyer’s market. The lower prices on the European spot market resulting from the availability of uncommitted LNG (and pipeline gas) have weak-ened the rationale of oil-linked prices [Stern 2009]. Consequently, Gazprom was forced to renegotiate some contracts with European off takers, where it allowed temporarily lower off-take levels and an element of gas indexation in its take-or-pay contracts for a period of
448 If the total capacity of South and Nord Stream is available from 2015 onwards, the aggregated load factor of Russian gas transmission capacity to Europe is approximately 70 percent (see also Figure 11.9).
337
time to balance the market [WGI 2010]. By means of this action, however, Gazprom creates the opportunity to postpone new greenfields (e.g., new giant gas fields on the Ya-mal Peninsula) until demand is sufficient. In order to mitigate the possible downside risks of Russia’s dominant position in Europe in the mid- and long-term, especially in a buyer’s market, Russia has different options to do so, both in relation with off-take countries and with other gas-exporting countries. In its relation to its off-take countries in the different sub-regional markets in Europe, Rus-sia’s export strategy may be different as well. In mature markets with solid incumbents, a business model of long-term contracts seems most feasible. In addition, to ensure Russia’s market position in terms of volumes (i.e., mitigating the downside volume risks), it may develop new greenfields as part of a public-private ‘win-win framework’ via ‘vertical swaps’ and joint ventures along the value chain, see also case studies 2 and 3 in Chapter 11. Po-litical commitments act here in support of deals between Gazprom and European mid-streamers at the firm level, where government support in the off-take countries can allevi-ate demand uncertainty. In growth markets a direct sales strategy seems the most desirable strategy from a Russian perspective, especially when such a market is open to foreign companies. In order to miti-gate the downside volume risks, Russia has to ensure its position on the mid- and down-stream market via M&As or greenfields. As a short-term solution in order to mitigate the negative effects of a buyer’s market, mid-streamers and Gazprom (and other gas exporting companies) can renegotiate the price regime and reduce their contracted volumes within long-term take-or-pay contracts with a certain percentage to accommodate the increasing LNG and pipeline supplies from competitors. The level of cooperation (including supply management) between gas-exporting countries in a dominant firm scenario for Russia is more likely to be ad hoc and tacit, especially in a seller’s market. Only a small number of players are likely to concentrate market power in the European gas market, of which Gazprom has the largest market share. At sub-regional level, as argued in case studies 2-3 in Chapter 11, Russia can be seen as playing a number of different ‘coordination games’. Therefore, the shape, form and nature of supply man-agement may differ; see also Chapter 10 in Boon von Ochssée [2010]. 2) Russia as a non-dominant supplier in Europe In a non-dominant (or follower/fringe) scenario, Russia’s market share is lower than 30 percent. This market position occurs in 4 scenarios in Figure 12.6 (marked by the grey frame). In theory, referring to Figure 12.6, Russia has a market share of 12-26 percent in order to balance the European gas market. However, in reality, Gazprom has already con-tracted 180 bcm/y, which automatically results in an oversupply of 25-110 bcm/y in 4 scenarios because of an abundance of other sources of gas coming on stream (unless Gaz-prom increases its flexibility within the contractual obligations to balance the market, see

338
above). In such a scenario, significant diversification into LNG and pipeline supplies from the Caspian region and others will follow, be it for political or for industry-related reasons. Being a non-dominant or fringe player, Gazprom does not invest heavily in the mid-term in new projects to bring gas on stream. This implies not making investments or postpon-ing investments, which could be the result of different factors, including difficulties in-volved with institutionalisation aspects, political backlash, TPA, etc. In such a scenario, Gazprom is likely to concentrate more on existing sources of gas from brownfields, such as from Central Asia and allowing only one single (part of a) value chain, e.g., Yuzhno Russkoye gas field and Nord Stream, with high economies of scale and feasible institution-nalisation to go ahead in order to fulfil on its commercial obligations. This leaves thus major new gas provinces, such as the Yamal Peninsula, Shtokman, etc., stranded. In addi-tion, the South Stream project and/or LNG infrastructural projects may not be con-structed or postponed.449 As a non-dominant supplier in Europe, Russia foregoes a host of counter-measures at a European level. In addition, the threat of substitutes is relatively low. It is also imaginable for Russia to choose to go ahead with LNG investments and/or pipeline investments in East Siberia to Asian market, and leave pipeline-driven value chains to Europe aside.450 As a reaction on the market condition of a buyer’s market in Europe, Russia could decide to postpone new greenfields and become a non-dominant supplier. The risk mitigation strategies along the value chain of a non-dominant firm scenario are roughly equal to that as a dominant firm. The implications for cooperation of a non-dominant firm scenario are that as a dominant firm as well, of which Gazprom is only one significant party with a market share roughly equal to that of others. Especially in buyer’s market, where spot prices fall below oil-indexed prices, binding cooperation becomes all the more pressing, as above (see also Chapter 10 in Boon von Ochssée [2010]).
449 Still, additional pipeline capacities may be built in order to mitigate political risk in transit countries (i.e., Ukraine), thus serving as transit-avoidance pipelines. New business models involving flexible supplies require additional overca-pacity as well (see Section 12.4).
450 An expanding strategy towards the Asian market may also be explored in a dominant market position in Europe, although coordinating problems with respect to institutionalisation could be arisen when Gazprom is responsible to such an investment programme.
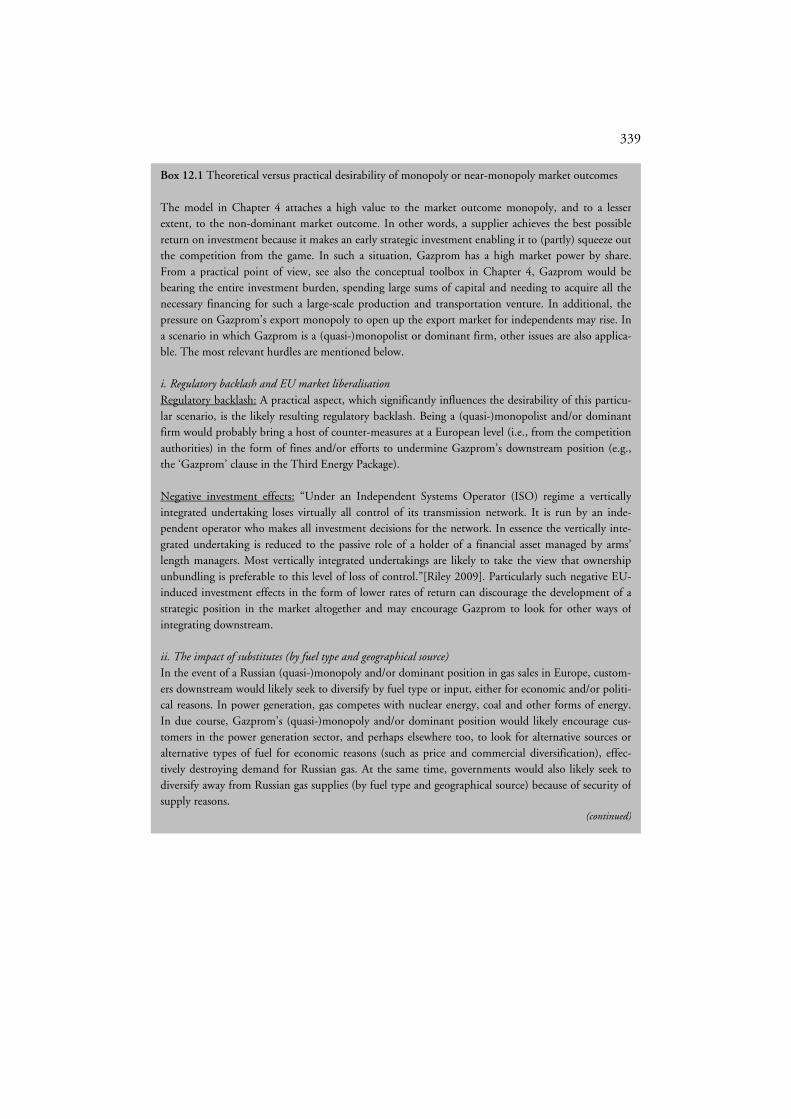
339
Box 12.1 Theoretical versus practical desirability of monopoly or near-monopoly market outcomes The model in Chapter 4 attaches a high value to the market outcome monopoly, and to a lesser extent, to the non-dominant market outcome. In other words, a supplier achieves the best possible return on investment because it makes an early strategic investment enabling it to (partly) squeeze out the competition from the game. In such a situation, Gazprom has a high market power by share. From a practical point of view, see also the conceptual toolbox in Chapter 4, Gazprom would be bearing the entire investment burden, spending large sums of capital and needing to acquire all the necessary financing for such a large-scale production and transportation venture. In additional, the pressure on Gazprom’s export monopoly to open up the export market for independents may rise. In a scenario in which Gazprom is a (quasi-)monopolist or dominant firm, other issues are also applica-ble. The most relevant hurdles are mentioned below. i. Regulatory backlash and EU market liberalisation Regulatory backlash: A practical aspect, which significantly influences the desirability of this particu-lar scenario, is the likely resulting regulatory backlash. Being a (quasi-)monopolist and/or dominant firm would probably bring a host of counter-measures at a European level (i.e., from the competition authorities) in the form of fines and/or efforts to undermine Gazprom’s downstream position (e.g., the ‘Gazprom’ clause in the Third Energy Package). Negative investment effects: “Under an Independent Systems Operator (ISO) regime a vertically integrated undertaking loses virtually all control of its transmission network. It is run by an inde-pendent operator who makes all investment decisions for the network. In essence the vertically inte-grated undertaking is reduced to the passive role of a holder of a financial asset managed by arms’ length managers. Most vertically integrated undertakings are likely to take the view that ownership unbundling is preferable to this level of loss of control.”[Riley 2009]. Particularly such negative EU-induced investment effects in the form of lower rates of return can discourage the development of a strategic position in the market altogether and may encourage Gazprom to look for other ways of integrating downstream. ii. The impact of substitutes (by fuel type and geographical source) In the event of a Russian (quasi-)monopoly and/or dominant position in gas sales in Europe, custom-ers downstream would likely seek to diversify by fuel type or input, either for economic and/or politi-cal reasons. In power generation, gas competes with nuclear energy, coal and other forms of energy. In due course, Gazprom’s (quasi-)monopoly and/or dominant position would likely encourage cus-tomers in the power generation sector, and perhaps elsewhere too, to look for alternative sources or alternative types of fuel for economic reasons (such as price and commercial diversification), effec-tively destroying demand for Russian gas. At the same time, governments would also likely seek to diversify away from Russian gas supplies (by fuel type and geographical source) because of security of supply reasons.
(continued)

340
12.4 The rationale for overcapacity in the Russian export pipeline system to
Europe
The case studies in Chapter 11 focus mainly on the (strategic-)economic aspects of mid-stream investments in capturing market share on the commodity market, given the possi-ble competition and market uncertainties. This section will focus on the rationale for over-capacity in Russia’s export pipeline system to Europe from Russia’s perspective, in order to reroute and diversify flows from the existing (Ukrainian transit) system and to capture additional economic rents through arbitrage opportunities, combined with a multi-market entry point strategy. However, creating substantial overcapacity for these reasons could be an expensive strategy.
12.4.1 Background on Gazprom’s transit issues in Ukraine and elsewhere
After the break-up of the Soviet-Union, Gazprom lost control over major transit routes to and gas storage capacity in Europe.451 During the 1990s almost all the gas flowed through the Ukrainian system. Starting in the late 1990s, Gazprom had constructed additional capacity for new flows circumventing Ukraine. Yet, almost 70 percent of Gazprom’s ex-port to Europe is currently flowing through the Ukrainian system, making the Ukraine a lynch-pin in Russian exports to Europe (see also Figure 12.8). The lack of control over transit resulted in significant transit risks through the Ukraine (and Belarus) and in adjustments to Gazprom’s strategy. After the presidential election of
451 For a historical overview of CIS transit issues, see Part II, mainly Chapter 6.
Box 12.1 Theoretical versus practical desirability of monopoly or near-monopoly market outcomes (continued)
iii. Strategic investments and the problem of organisation and financing A proactive investment and export strategy is subject to financing and organisational feasibility issues. This is exacerbated by scarcity of capital and high interest rates. These expensive and risky projects usually require foreign partners, such as European mid-streamers or other private parties (e.g., ENI, E.ON Ruhrgas, etc.), in order to share the financial and organisational burden. This helps reduce Gazprom’s proprietary position, as it can no longer wholly own a project. In addition, in most cases, these international projects need political assistants in Europe and Russia (i.e., pipeline diplomacy), which implies a stable relation between the European countries and Russia. iv. Geopolitical and geo-economic considerations As a result of geopolitical and geo-economic considerations, the call on additional Russian gas could reduce and non-Russian gas flows could be stimulated, particularly by the US and some trans-Atlantic oriented European countries. In addition, the complexity of the EU, both in terms of political func-tioning, energy policies and level of gas penetration, influences Russia’s position. Conversely, conti-nental European countries may encourage further institutionalisation of Gazprom’s investments, driven by a perceived need of attaining greater upstream access to Russia’s gas sector in an effort to secure gas supplies, see also Chapter 8.2 and Chapter 11 in Boon von Ochssée [2010].
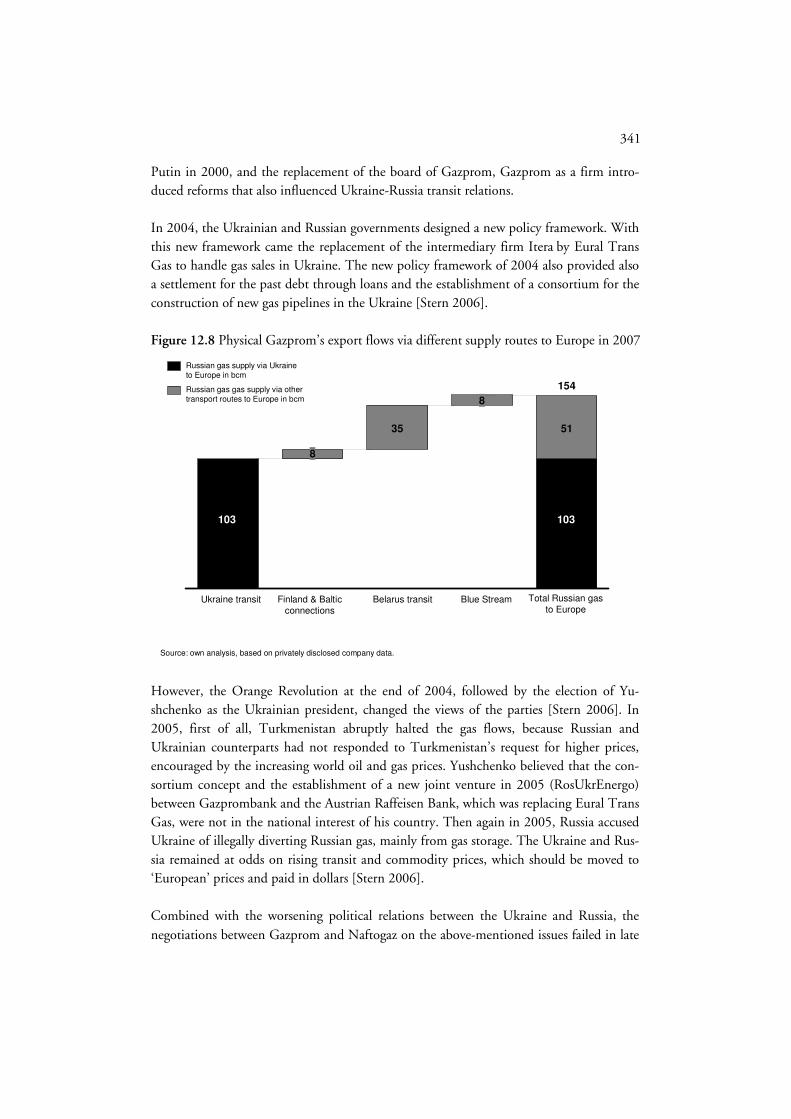
341
Putin in 2000, and the replacement of the board of Gazprom, Gazprom as a firm intro-duced reforms that also influenced Ukraine-Russia transit relations. In 2004, the Ukrainian and Russian governments designed a new policy framework. With this new framework came the replacement of the intermediary firm Itera by Eural Trans Gas to handle gas sales in Ukraine. The new policy framework of 2004 also provided also a settlement for the past debt through loans and the establishment of a consortium for the construction of new gas pipelines in the Ukraine [Stern 2006].
Figure 12.8 Physical Gazprom’s export flows via different supply routes to Europe in 2007
Source: own analysis, based on privately disclosed company data.
Blue StreamBelarus transitUkraine transit Finland & Baltic connections
Total Russian gas to Europe
103
154
35
8
8
51
103
Russian gas supply via Ukraine to Europe in bcm
Russian gas gas supply via other transport routes to Europe in bcm
However, the Orange Revolution at the end of 2004, followed by the election of Yu-shchenko as the Ukrainian president, changed the views of the parties [Stern 2006]. In 2005, first of all, Turkmenistan abruptly halted the gas flows, because Russian and Ukrainian counterparts had not responded to Turkmenistan’s request for higher prices, encouraged by the increasing world oil and gas prices. Yushchenko believed that the con-sortium concept and the establishment of a new joint venture in 2005 (RosUkrEnergo) between Gazprombank and the Austrian Raffeisen Bank, which was replacing Eural Trans Gas, were not in the national interest of his country. Then again in 2005, Russia accused Ukraine of illegally diverting Russian gas, mainly from gas storage. The Ukraine and Rus-sia remained at odds on rising transit and commodity prices, which should be moved to ‘European’ prices and paid in dollars [Stern 2006]. Combined with the worsening political relations between the Ukraine and Russia, the negotiations between Gazprom and Naftogaz on the above-mentioned issues failed in late

342
2005, which resulted in gas cut-offs to the Ukraine, as a result, some European customers reported reduced gas pressure in the beginning of 2006.452 Although new agreements were concluded, the two parties remained in conflict over the level of prices, the lack of trans-parency and the position of trading companies RosUkrEnergo and UkrGazEnergo, illegal diverts, and related debt issues, which were underlying the conflicts. These re-emerged in October 2007, February 2008 and most recently in 2009.453 In 2009, a new ten-year con-tract between Gazprom and Naftogaz was signed, in which market prices for transit and commodity (minus a 20 percent discount for 2009) were agreed upon. Intermediaries were abolished, representing progress in the commercialisation of their gas relations [Chow and Elkind 2009]. Recently in March 2010, the new elected president, Yanukovich, made possible a new deal under which Naftogaz would pay for gas with a discount equal to the abatement in the export duty set for gas supplies to Ukraine by the Russian Government (in exchange for the continued use of the Sebastopol military base on the Crimea, where Russia houses its Black Sea fleet). In April 2010, moreover, Putin proposed that Gazprom and Naftogaz should merge [Financial Times 2010; Gazprom 2010].454 12.4.2 Mitigation of Gazprom’s transit risk: Rerouting and diversifying flows
In mitigating possible transit and country risks, Gazprom can strengthen its control and ownership over existing and new transit routes through Ukraine or lower the project risks by diversifying the transport routes to Europe (see Chapter 6). After the completion of the Yamal-Europe pipeline and Blue Stream pipeline, Gazprom proposed two pipelines, Nord Stream and South Stream, which involved (almost) no third country transit risks outside the EU. All these additional pipelines were and will not be laid merely to circumvent the Ukraine. After the completion of the Nord and South Stream projects, and if Gazprom decides to use the Ukrainian transit route as a last resort, the transit through Ukraine could fall to 0-17 bcm/y. However, storage in Ukraine is expected to remain important for Russia [Mitrova et al. 2009; own estimates]. The combined strategy of ownership and diversification may increase the odds for Gaz-prom of decreasing its dependence on the transit role of the Ukraine and could also com-
452 On 4 January 2006, Gazprom, Naftogaz and RosUkrEnergo came to a new agreement, which settled the end of the barter trade. Russian gas and gas from Central Asia were sold indirectly to Naftogaz via RosUkrEnergo. Additionally, these two companies have formed a joint venture, UkrGazEnergo, to sell gas directly in Ukraine [Stern 2006].
453 The global recession in 2008-09 and conflicting interests within elite Ukrainian circles encouraged the gas crisis and negotiations between the Ukraine and Russia in 2009 as well [Chow and Elkind 2009]. The gas crisis in 2009 had resulted in a short fall in Russian exports via Ukraine to Europe, mostly Central European countries (around 80 per-cent). According to Financial Times [2009], Russian gas exports via Ukraine to Europe as a whole fall from 300 mcm per day to 65 mcm per day.
454 The merger proposal is not related to the idea of creating a trilateral gas transmission consortium embracing Russia, Ukraine and European companies [Gazprom 2010].

343
mercialise and streamline the relationship. Looking in more detail at the option to build additional capacity (and flows) circumventing the Ukraine, one can argue that it may increase Gazprom’s leverage/bargaining power towards the Ukraine in realisation market-based prices (and non-payments/debt settlement).455 An interesting perspective on gas infrastructure is offered by Hubert and Suleymanova [2008], who argue that it is easier to avoid overinvestment than underinvestment. Cali-brating the theoretic model of Hubert and Suleymanova [2008] to the Eurasian pipeline system for natural gas, they find that the potential to improve efficiency through dynamic cooperation is large. Other academics argue that, for instance, the Yamal-Europe pipeline through Belarus decreases Ukraine’s monopoly profits from Belarus’ market entry and resulting in additional profits for Gazprom, in particular when it unites its gas transmis-sion network with Belarus and Ukraine, a strategy pursued by Gazprom [Chollet et al. 2001]. These kinds of analyses only take into account the bargaining power with regard to transmission/transit costs and do not consider the commodity market: relatively low gas prices in Ukraine, and the risk of supply disruption (generating penalties and opportunity costs as a result of not fulfilling commercial contracts between Gazprom and European mid-streamers). From a more pragmatic point of view, if cooperation were to fail for political reasons, one can argue that additional capacity would create supplementary bargaining power in achieving higher export prices in Ukraine (and other CIS transit countries). Moreover, additional overcapacity will provide Gazprom with the option to reroute its flows in case of a supply disruption. Yet, it remains an open question whether a diversified but under-utilised network is the least costly way to achieve a better bargaining position. 12.4.3 Flexible supplies and overcapacity
As mentioned in Chapter 8, the growing trend of increasing physical spot and short-term trades and swaps, suppliers are shifting spot and short-term volumes from one market or buyer to another in order to arbitrage (and swap) between different price levels within and between different markets, both intra- and inter-regionally. This section explores Gaz-prom’s position on the spot and short-term market within Europe via pipeline supplies.456 As mentioned in Case study 3, Gazprom M&T is responsible for Gazprom’s short and spot trade. Combining all current and future pipeline capacities, Gazprom might supply – assuming a full load factor – approximately 372 bcm/y to Europe (additional capacity of 118 bcm/y; see also Figure 12.9).
455 The Nord Stream company even argues that the price tag over 25 years will be some 15 percent lower for an off-shore route than for an equivalent route onshore [Nord Stream AG 2009]. Comparing Gazprom’s sales revenues in CIS transit countries to its sales revenues in Europe, Gazprom’s opportunity costs in the CIS were US$14.0 bln in 2007 due to their relatively low prices [EC 2008].
456 Norway is already carrying out this new business model on regional (pipeline) basis. Around 20 percent of its total supply portfolio is short and spot traded (also see Chapter 8).
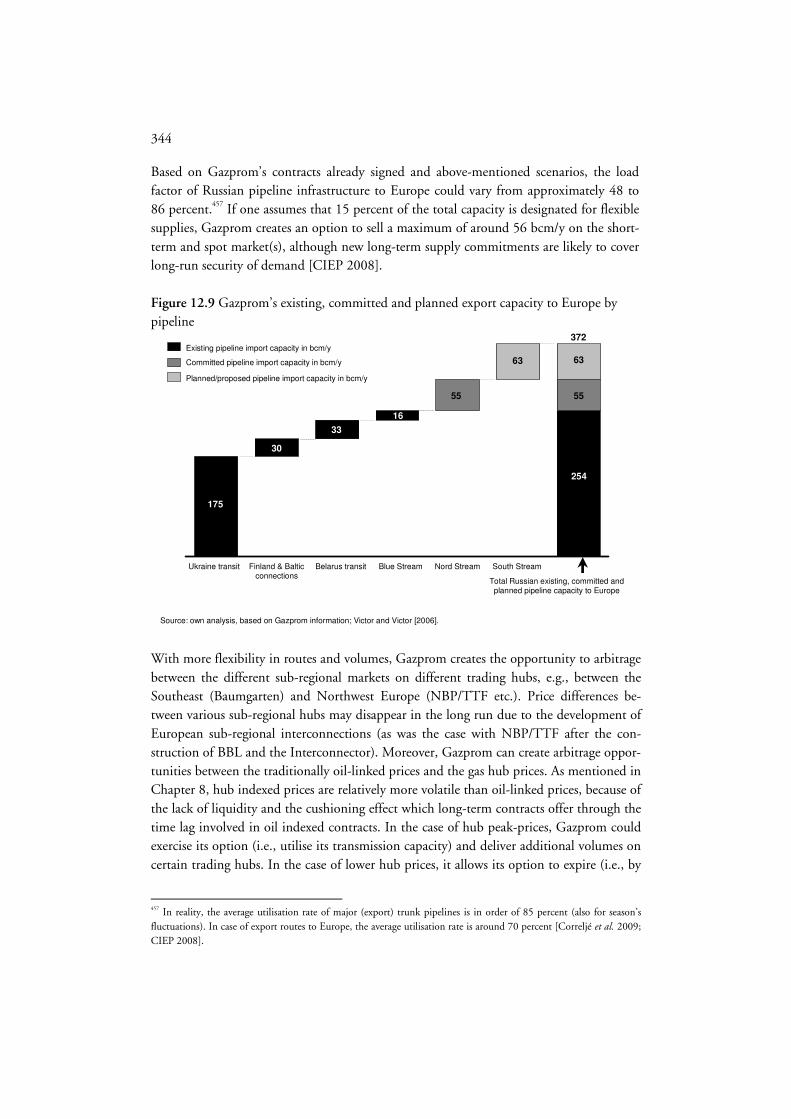
344
Based on Gazprom’s contracts already signed and above-mentioned scenarios, the load factor of Russian pipeline infrastructure to Europe could vary from approximately 48 to 86 percent.457 If one assumes that 15 percent of the total capacity is designated for flexible supplies, Gazprom creates an option to sell a maximum of around 56 bcm/y on the short-term and spot market(s), although new long-term supply commitments are likely to cover long-run security of demand [CIEP 2008]. Figure 12.9 Gazprom’s existing, committed and planned export capacity to Europe by pipeline
Source: own analysis, based on Gazprom information; Victor and Victor [2006].
Blue StreamBelarus transitUkraine transit Finland & Baltic connections
South StreamNord Stream
Total Russian existing, committed and planned pipeline capacity to Europe
175
16
30
33
55
254
372Existing pipeline import capacity in bcm/y
Committed pipeline import capacity in bcm/y
Planned/proposed pipeline import capacity in bcm/y
63
55
63
With more flexibility in routes and volumes, Gazprom creates the opportunity to arbitrage between the different sub-regional markets on different trading hubs, e.g., between the Southeast (Baumgarten) and Northwest Europe (NBP/TTF etc.). Price differences be-tween various sub-regional hubs may disappear in the long run due to the development of European sub-regional interconnections (as was the case with NBP/TTF after the con-struction of BBL and the Interconnector). Moreover, Gazprom can create arbitrage oppor-tunities between the traditionally oil-linked prices and the gas hub prices. As mentioned in Chapter 8, hub indexed prices are relatively more volatile than oil-linked prices, because of the lack of liquidity and the cushioning effect which long-term contracts offer through the time lag involved in oil indexed contracts. In the case of hub peak-prices, Gazprom could exercise its option (i.e., utilise its transmission capacity) and deliver additional volumes on certain trading hubs. In the case of lower hub prices, it allows its option to expire (i.e., by
457 In reality, the average utilisation rate of major (export) trunk pipelines is in order of 85 percent (also for season’s fluctuations). In case of export routes to Europe, the average utilisation rate is around 70 percent [Correljé et al. 2009; CIEP 2008].

345
not utilising its reserved transportation capacity) and keeps its supply for domestic use or for oil-injection, for example. Additional overcapacity in Gazprom’s export pipeline system to Europe thus generates an economic option in order to capture additional economic rents through arbitrage, combined with a multi-market entry point strategy. In exploring such a strategy, Gazprom may be exposed to downside risk emanating from newly emerg-ing LNG business models (see also Chapter 2).
12.5 Conclusion
In this chapter, the various market structure scenarios and Gazprom’s position within these scenarios are aggregated to a level involving the entire European gas market. The two resulting scenarios vis-à-vis market structures are: (1) a dominant firm (i.e., a leading firm among followers) and (2) a non-dominant firm or fringe scenario, involved different out-comes for Gazprom and conversely for its competition. A very dominant position is not a desirable one for Russia from a practical-economic per-spective, explained through the conceptual toolbox in Chapter 4. This is largely as a result of coordination problems, financing requirements, regulatory backlash, and possible geo-political hurdles. The different possible and feasible market outcomes feed back into Rus-sia’s merit order for its export market. In a situation of a high level of market penetration, Gazprom must start new large greenfield investments, like Yamal and Shtokman, and ensure Caspian imports for the longer term. Energy savings and/or demand reduction in Russia in combination with the boosting of the production of the independents through corresponding incentives could also free-up substantial volumes. In a scenario without additional Russian exports, for whichever political and/or economic reason, Gazprom may be inclined to invest only in some small(er) fields in order to keep-up production and fulfil existing contracts. In order to mitigate the possible downside (volume) risks of Russia’s position in Europe in the mid- and long-term, especially in a buyer’s market, Russia can coordinate new invest-ments via ‘vertical swaps’ and joint ventures with European incumbents, supporting by the corresponding governments. Russia can also ensure its position via the mid- and down-stream investments in Europe, especially in growth markets. In addition, Gazprom may aim for new investments in alternative transport routes to Europe in order to mitigate country and transit risks, especially Ukraine en Belarus. This strategy implies a diversification of pipeline routes for additional supplies and rerouting existing flows, despite the high costs associated with this. Furthermore, new business mod-els such as those pursued by Gazprom M&T, involving flexible, intra-regional supplies, which could rationalise overcapacity for different entry points for gas into the pipeline network for arbitrage reasons.

346

347
Chapter 13 Conclusions and discussion This dissertation reports on a study of Gazprom’s investment strategy regarding Russia’s gas exports and export market behaviour, with a focus on European infrastructure projects, in a geopolitical context. For Russia’s gas sector, gas infrastructures such as pipelines and LNG trains act as options in gaining, maintaining or expanding access to new markets or consolidate positions in existing ones. The planned and proposed export investment stra-tegy of the government-controlled firm Gazprom was assessed by economic-strategic theo-retical approaches. As mentioned in Chapter 1, the politico-strategic implications of Gaz-prom’s investment strategies and decisions are bound to have a long-lasting impact on Europe’s energy balance in general, and its gas balance in particular. Additionally, Russia’s gas export position in Europe has both geo-economic and ultimately geopolitical conse-quences. In this chapter, Section 13.1 provides a summary and conclusions of the disserta-tion. Section 13.2 deals with a discussion and with recommendations for further research. 13.1 Summary and conclusions
The research objective of this study has been stated as: “To identify, evaluate and extrapo-late Gazprom’s investment strategy regarding Russia’s gas exports and export market be-haviour, with a focus on European infrastructure projects and the relevant geopolitical context.” From this research objective, four research questions have been derived. This section is organised into five subsections, aiming to give answers to the four research ques-tions. Firstly, the institutional and theoretical background of this research is discussed. Secondly, the historical-institutional background with respect to Russia’s, and Gazprom’s, investment strategy regarding its export markets is summarised and discussed. Thirdly, Russia’s position in the rapidly evolving interregional gas market will be discussed. Finally, we review how the theoretical framework, combined with the descriptive analysis of Rus-sia’s export strategy, is applied through several case-study analyses in order to provide an answer to the fourth research question. As mentioned in the introduction, this dissertation focuses primarily on gas transport capacity extension in light of quantity competition. In an epilogue at the end of this section (subsection 13.1.5), we will discuss price competition and collusion on project and macro-level. 13.1.1 Theoretical and institutional aspects and valuation tools in relation to
gas infrastructure investments
Part I helped us understand the first research question in Chapter 1: “What are the differ-ent institutional and theoretical aspects and relevant valuation tools in relation to the gas infrastructure investments in light of business strategies and markets?”

348
The transmission and supply of natural gas is a complex issue, involving the interplay amongst many actors and involving capital-intensive projects, subject to major risks for both government and private sectors. Moreover, once a gas value chain or any of its com-ponents is built, its costs are sunk and can only be recovered by its ‘profitable’ exploitation. Generally therefore, the dominant risk for gas infrastructure investments (e.g., LNG trains and pipelines) is the perceived market (volume and price) risk. Other major risks are of a policy (i.e., regulation), macro-economic, financing, transit and/or geopolitical nature. In order to mitigate these risks, contractual instruments appear to be the most universal ones available given current legislation of unbundling in the US and European markets. The common approach is that potential users of the system commit to capacity contracts for a duration of 10 to 20 years at predetermined tariffs. In addition, the liberalisation process has resulted in the evolution of new business models, including those of flexible supplies, i.e., supplies not committed to any markets for the long-term. The government plays an important role in shaping the gas sector and its value chains due to the risks and benefits (i.e., economic rents) along the value chain, both in consuming and producing countries. The modern variant of international political economy argues that it is necessary to integrate international relations and (political) economy in order to explain, for example, complex issues in the gas market and the interplay between govern-ments and markets. It states that when a country or nation is blessed naturally with re-sources, or raw materials, it already holds a major relative advantage. However, it remains an open question whether a country can translate its wealth generated from these resources into other structural powers, such as financial wealth and intellectual capital, given the risks of a resource curse, for example. In most of the gas-producing and exporting coun-tries, national gas or energy firms act as caretakers of the nation’s sovereign gas resources, doing so under the auspices of the government. Strategies of these national gas firms acting in the export market have to anticipate the dynamics in regional gas markets. Depending on the phase of the market these firms ope-rate in, they are likely to interact in different ways by competing or colluding. Generally speaking, private gas firms have a duty towards their shareholders to maximise the (short-term) value of their gas reserves and their exploitation. In a similar fashion, national gas firms have the task of maximising the present value of long-term revenues from a country’s gas reserves. In addition, most of the government-controlled energy firms have to take into account the government’s wider socio-economic policy goals. However, in the long run it can be argued that a national gas firm aims to maximise the aggregated export value of gas available for its export markets, in particularly when domestic prices are not competitive with export prices. The sequence of investments that have to be made for country’s desi-rable export position are based on a merit order among all available gas resources and transportation routes, which is constrained by socio-economic issues.

349
Along the product life cycle, firms compete in the first instance on capacity extension in order to deliver new volumes to the market, and thereby potentially capturing additional market share. In a later stage, price competition becomes more important. In the case of long-distance transport in general, the largest part of the total costs in the value chain is related to the transport component. Therefore, both in relative and absolute terms, the economies of scale in this component, at a project level and in general, help to decrease the average cost of gas vis-à-vis competition. The exclusive ownership of the capacity (i.e., no third-party access) ensures that gas infrastructure investments may be seen as creating an option today in order to expand commodity trade in the future, especially for vertically integrated gas firms. Because the infrastructural investment opportunities do not exist in a vacuum, they must be considered in their strategic and competitive context. In Chapter 4, we therefore argue that in order to ascertain the overall value of gas transport infrastructure investments, ac-count must be taken of both demand uncertainty and possible competition through a strategic-economic approach. The real-option game model, developed by Smit and Trigeorgis [2001], is a two-stage entry deterrence model that captures, in a duopolistic setting and from the incumbent’s perspective, both the aspects of potential competitor’s entry and the prevailing uncertainty in gas market demand. This model discounts the overall value of gas infrastructure investments to the beginning of the game as a function of market outcomes at the end of the second stage. The framework is based on three levels of planning that have an effect on the overall value of a firm’s project:
• the project appraisal from corporate finance, which aims to determine the effect on the net present value of the projected cash flows resulting from the establish-ment of a competitive advantage. It assumes that all operating decisions are set in advance and defines an investment decision as a ‘now or never’ choice;
• the strategic planning of growth opportunities, which aims to capture flexibility (option) value, resulting from the firm’s adaptive capabilities through real-option valuation;
• the competitive strategy, which aims to capture the strategic value from establish-ing, enhancing, or deferring a strategic position vis-à-vis possible competitor(s) based. This value is derived using game theoretic analysis and industrial organisa-tion economics. This approach captures the notion of an early mover’s advantage.
By integrating real-options valuation with game-theoretic principles, we can make an inte-grated assessment of strategic growth options value in an interactive, competitive setting. Given demand uncertainty and possible actions taken by entrants, a firm may thus choose to invest early to pre-empt a potential competitor. However, a fundamental aspect of the real-option game approach is that the combination of interaction between downside de-mand risk and potential entry may, in various scenarios, warrant a wait-and-see approach, i.e., postponement of investment in gas transport infrastructure. As a result, the corre-

350
sponding investment decisions involve a trade-off between the values of postponement and pre-commitment. In Chapter 4, we argued that the decision to invest in accordance with the aforementioned three levels of planning is, therefore, based on an overall NPV criterion that integrates the net strategic (game-theoretic) value and the flexibility (option) value. Based on these value components, we can distinguish between the value of having a strategic option to compete (strategic ‘option-game’ value) and foregoing this option to compete now (the value of the option to postpone strategically). These values collectively are an addition to the traditional direct (static) net present value, which is equal to the future expected cash flows from investing immediately. The trade-off between these two values is a particularly important aspect of the real-option game approach, in light of the costly and capital-intensive nature of gas infrastructures as a strategic option on the growth in gas demand, i.e., the commodity itself. A firm should invest in a strategic project when the total sum of the overall net project value is positive, whereby the net strategic option value is higher than the postponement value of making a strategic investment. In such a case, a strategic option on future gas demand translates into a commitment value. Yet, the real-option game model is a stylised ‘product’ of industrial organisation theory, economic game theory, and financial theory concerning the valuation of investments. Because of this stylised nature of the model, a conceptual toolbox has also been introduced in Chapter 4, to accompany the model. This toolbox is an effort to explain the myriad of other factors at play outside the stylised model and its application. Other investment de-terminants which have an impact on investment decisions, and hence also on the merit order, in the gas industry include: (1) the financial and organisational achievability, in-cluding types of business models and governmental assistance, of a gas infrastructure pro-ject, (2) general investment climate, such as macro-economic developments and fiscal regimes, (3) transit risks, and (4) geopolitical and geo-economic issues. The model’s added value lies in the quantitative underpinning of a more intuitive under-standing of strategic investments. The value lies in its exact application, whereas the tool-box is more conceptual. A joint application of the two broadens our insight into the phe-nomena under consideration. Moreover, dynamic market theory, the theoretical insights from institutional economics and international political economy, are useful in under-standing gas infrastructural investments in light of business and governmental strategies and markets. Such an approach therefore contributes to pursuing the research objective. 13.1.2 Russia’s gas strategy: A historic-institutional background
Part II helped us understand the second research question in Chapter 1: “What is the historical-institutional background with respect to Russia’s, and Gazprom’s, investment strategy regarding its export markets?”

351
Russia’s current gas export orientation towards Europe by pipeline is the result of more than half a century of gas developments. The first Soviet gas exports materialised just after the Second World War to Poland, followed in 1968 by Austria as the first market-orientated destination in Europe. The Soviet westward gas export campaign saw a substan-tial increase throughout the 1970s and 1980s, despite US objections against increased European gas imports from Russia during the Cold War period. Large-scale Soviet exports materialised throughout the 1970s and 1980s via so-called ‘gas-for-pipe’ agreements. The West European gas contracts and the accompanying financial and technological know-how, allowed the Soviet Union to free up oil deliveries to the Central and Eastern Euro-pean countries within the Council for Mutual Economic Assistance (CMEA) for exports to the West, resulting in additional hard currency earnings. At the same time the aim was to achieve gasification in the economies of the CMEA, effectively shoring up that alliance. Until after the energy crises in the 1970s, CMEA countries were subsidised with cheap energy and other raw materials. A lag in the Soviet pricing system further helped artificially subsidise energy, but in the 1980s, the Soviet Union could no longer afford these subsi-dies. During the second half of the 1980s, the off take of gas fell below expectations be-cause of the economic recession and the rise of a buyer’s market in Western Europe. With the construction of the Brotherhood pipelines through the Ukraine from the late 1960s onwards, Russia’s future export dependence on the Ukraine and Europe was sealed. The collapse of the Soviet Union and its related institutes has changed the institutional make-up of economic and political relations on the Eurasian continent, as well as the insti-tutionalisation of the gas value chain. As a result of the economic reform process, Russia’s gas sector was partially privatised, though not entirely broken-up. The government-owned firm Gazprom, which had become responsible for Russia’s gas production, distribution and sales from 1989 onwards, suffered from the Russian economic hardship in the form of reduced gas sales and defaulting customers. In addition, Gazprom lost its absolute control over the gas fields and production areas in the Caspian region. During the 1990s, these countries began pursuing alternative export routes for gas to Asia and Europe in order to lessen their dependence on Russia. However, the success of a so-called multi-vector ap-proach for the Central Asian countries was limited at the time and is still limited, with the exception of a pipeline from Turkmenistan to China that was inaugurated in December 2009. Moreover, Gazprom’s loss of control over Ukrainian transit routes to Europe, which at that moment were responsible for almost all gas transit to Europe, had resulted in major transit problems and risks. The decline in the economy in the wake of the collapse of the Soviet system and a slow and complex transition to a market-economy and increasing gas prices led to payment defaults and debt issues in Ukraine and other CIS countries. Com-bined with volumes of gas above contractual limits during cold winters, the supply of gas was occasionally shut down (for short periods), or with that possibility was threatened. During the 1990s, intermediaries gradually became responsible for part of the gas exports,

352
using complex barter agreements. Gazprom's management allowed these transactions be-cause they had personal interests, which delayed the transition to a normal, commercial relationship between Ukraine and Russia. Gazprom tried to strengthen its control and ownership over existing and new transit routes though Ukraine, without any success due to political obstacles. In Belarus, Gazprom has been more successful in gaining some con-trol, mainly due to indebtedness of Belarus and the relative political isolation of Belarus that exposed its strategic-economic interests to the increasing market leverage of Russia. Low energy prices during the 1990s, combined with a lack of financial sources, con-strained Gazprom’s growth opportunities for its export markets. Ultimately two projects – i.e., the Yamal-Europe and the Blue Stream pipeline – received priority, which aimed to serve the growing Northwest European and Turkish markets, respectively. The Yamal-Europe’s export ambitions were revised downwards, amongst other things due to lack of solid financing. Gazprom’s early investment in the Blue Stream project accessing the Turkish market had reduced the feasibility of competing projects from Iran and other Caspian countries. However, the Blue Stream investment could just as well have been premature, given Turkey’s market uncertainty (see below). Moreover, the Blue Stream and the Yamal-Europe pipeline projects diversify away from the Ukrainian transit route. Russia’s path-dependency towards Europe as a gas export market determines which in-vestment alternatives are open to Gazprom today, but it also constrains its future choices. The Soviet Union was and today’s Russia is highly dependent on the (West-)European market(s) for its export and hard-currency earnings. These earnings play an important role in subsidising Russia’s domestic market (during the Soviet period also CMEA and other Soviet markets). The Soviet Union’s (and Russia’s) relationship with West-European in-cumbents (e.g., in Germany, Italy and France), which had a monopoly position in their domestic market before liberalisation, was – and still is – crucial in realising new gas infra-structure and flows. Moreover, the governments assisted their firms in conducting busi-ness, even though the US opposed (further) European gas imports first from the Soviet Union and later also from post-Cold War Russia. Gas trade between Russia and European off-takers has become more complex, due among others to political developments, such as the breaking up of the single integrated Soviet system after the dissolution of the Soviet Union. The liberalisation process in European gas markets rendered this situation more complex. Yet, the realisation of new gas projects still requires strong, government-backed firms; often achieved through vertical asset-swaps (see below). Although the emphasis of investment incentives within Russia’s gas industry shifted away from maximising output towards maximising profits, the industry’s perspective is still inspired more by long-term visions instead of short-term profit maximisation. The histori-cal-institutional background of Russia’s gas export strategy contributes to pursuing the

353
research objective by addressing the similarities and differences from the past. Moreover, the success and failures of historical investment cases, such as the Yamal-Europe and the Blue Stream project, offer the benefit of hindsight in order to understand investment pro-grammes currently underway. 13.1.3 Russia’s position in a rapidly evolving interregional gas market
Chapters 8, 9, and 10 in Part III helped us understand the third research question in Chapter 1: “What is Russia’s, and Gazprom’s, position in the rapidly evolving interre-gional gas market that pertains to Europe?” In line with gas sector recentralisation in Russia from 2000 onwards, Gazprom was in principle awarded a monopoly over Russian gas exports in 2006. The process of decision-making is centralised, and largely influenced at the government level. Russia’s positioning vis-à-vis the Caspian Sea countries and other gas-exporting countries will determine to a large extent how Russia will fulfil its interregional role as a major pipeline gas exporter. In addition, the geopolitical dimension, as well as (inter)regional market aspects, will have an impact on Russia’s growth strategy. The expected rise in demand and import-dependencies in the world’s main regional mar-kets will precipitate the need for comparatively greater interregional gas flows in the me-dium-term and beyond (2015-2030). However, the overall reduction in demand because of the economic downturn of 2008/2009, combined with the development of unconven-tional gas in the US and (flexible) LNG coming on stream, resulted in an oversupplied market since 2009. This oversupply has led to a reduction in prices and renegotiations in long-term (pipeline) contracts in Europe. It is expected that the situation of plentiful sup-plies will continue for several years. If demand does not recover soon, competition be-tween gas exporting countries may lead to further price erosion. Long-term forecasts of gas demand in the world’s most important regions are also prone to great uncertainties, due to various reasons. These uncertainties are related to the level of economic growth, government (climate) policies regarding the use of gas in its energy mix, the relative (oil and) gas price development vis-à-vis its substitutes, CO2 emission costs and CCS developments, and the development of different (price) regulatory regimes. Due to declining indigenous supplies in Europe, it is expected that European imports will grow. However, there are also scenarios that assume a decrease in European gas imports in the mid term, illustrating the great uncertainty in the market. In the coming decades, though uncertain, largely due to the development of unconventional gas, some additional LNG import may be required in the US. It is expected that gas imports will grow in Asia. However, in absolute terms Asian consumption is expected to remain relative low, when comparing to the other markets. Gas trade in Asia and Europe is largely based on long-term take-or-pay contracts, with indexation to other energy products, with some spot sales based on gas-to-gas competition. The US gas trade is based on short-term and spot sales.

354
In the meantime Gazprom’s emerging export strategy shows that Russia is also shifting from a captive, regional European setting to a more global one, as it plans to diversify its pipeline gas exports (to Asia and within Europe) and to enter the LNG markets with its own projects. However, for Gazprom, Europe still offers the most of growth opportunities in the long run. In its traditional European market, Gazprom faces competition mainly from other pipeline suppliers: Norway, Algeria, and the Netherlands. These countries, except for the Netherlands, are expected to retain their market share and power. Cur-rently, other small pipeline suppliers, such as Libya and Azerbaijan, and LNG players in the Atlantic basin, such as Nigeria, Egypt and Qatar, play a less important role. In the future, Qatar is set to become an important interregional player, both in the Atlantic and Pacific LNG market. In addition, the landlocked Caspian Sea gas producers, Turkmeni-stan, Kazakhstan, Uzbekistan and Azerbaijan, continue to seek diversity in their exports to Asian markets as well as Europe. However, they are still strongly tied to Russia and are important in the latter’s gas balance. In managing value chain related risks and avoiding oversupply, Gazprom appears to take an important position in the advent of greater project-level cooperation between the vari-ous gas-exporting countries’ national energy firms. Supply coordination may be further institutionalised through a newly formed international organisation of gas-exporting coun-tries, the GECF, or the Gas Troika, consisting of the three main gas reserve-holders (i.e., Russia, Iran and Qatar), see Section 13.1.5. Thus, Russia’s, and Gazprom’s, investment policy is a dynamic process, with great uncer-tainties, stemming from domestic demand, levels of imports from the Caspian region, government policies in export markets and other market uncertainties. The answer to the third research question, that Russia must operate in an uncertain and competitive gas market, supports the theoretical approach described in Section 13.1.1. 13.1.4 Russia’s, and Gazprom’s, appropriate investment strategy towards gas
infrastructure into possible growing (sub)regional export markets
Chapters 11 and 12 in Part III helped us understand the second research question in Chapter 1: “How can we identify, evaluate and extrapolate Gazprom’s investment strategy regarding Russia’s gas exports and export market behaviour, based on empirical analysis of a number of case studies?” Through different case studies in Chapter 11 an analysis has been made of various strate-gic investment fields available to Gazprom, primarily as an incumbent in sub-regional European markets. The case studies 1-3 include the application of the real-option game model and the conceptual toolbox. One case study was analysed from a historical (ex post) perspective and offers the benefit of hindsight. The other case studies are about strategic behaviour in the current and future markets (i.e., use the model to observe possible ex ante moves). The case studies started from a country- or project-level, moving on to a sub-

355
regional, and then ultimately in Chapter 12 moving to a European regional level. The applications and Chapter 12 aim to address the fourth research question. Early commit-ments in the form of early gas infrastructure investments ensure for Gazprom access to its commodity position in its export markets. However, market and other uncertainties may encourage a less pro-active strategy. Attention has been paid to the SSEE in Case study 2 and NWE markets in Case study 3. These sub-regions are responsible for almost 85 percent of the current European demand. Their expected import requirements are making these regions potential growth markets for Gazprom via the existing Blue Stream and the proposed South Stream, respectively via the existing Yamal-Europe and the Nord Stream pipeline (which is planned and currently under construction, respectively). The SSEE markets are exposed to potential competition from pipeline suppliers in North Africa and the Caspian region (especially Azerbaijan and Iran), and LNG supplies. Yet, Caspian supplies are uncertain due to (geo)political factors and the influences of other geo-strategic competitors. In terms of market power, the future threat to Gazprom’s position in NWE markets will come from LNG supplies (especially Qatar and Nigeria), where it currently competes with indigenous (especially Dutch and British) and Norwegian pipeline supplies. Chapter 12 provides the rationale behind Gaz-prom’s investments and the impact on market structure in the European gas market as a whole. As a recapitulation, this chapter serves as a backdrop to a conceptual discussion on possible demand and supply scenarios involving extremes of either undersupply or over-supply. The application of the real-option game has shown that value can be derived from an in-crease in economies of scale in transport capacity for long-distance gas pipelines, which can act as a deterrent against possible entry. The economies of scale bring average cost per unit of gas output down (i.e., the direct strategic value of the project). Due to the economies of scale of its pipelines and the corresponding value chains, Gazprom is in a strong position to deter a potential entrant’s investment (i.e., the strategic reaction value). In the end, it can capture a relatively high market share and influence the market structure ex-post over a long period of time (i.e., the strategic pre-emption value). Conversely, postponing in-vestment may prove to be just as attractive in the face of downside demand risk(s), for example. These elements together make up the real value of such investments, in addition to the actual static value. Gas pipelines can be employed by Gazprom to protect and/or expand market share by investing strategically early on. Regional gas market structures can thus be influenced by individual projects, which is particularly inherent to an industry characterised by an oligopolistic market structure and a capital-intensive value chain. As mentioned above, during the late 1990s decisions taken by Gazprom in Turkey as far as Blue Stream pipeline is concerned have had their impact on the structure of the Turkish (and European) market. According to the application of the real-options game model, the project was not successful both commercially as well as strategically, due in part to the

356
pipeline’s limited economies of scale and the pipeline’s utilisation rate after its completion. Additionally, in hindsight, the actual demand growth war far lower than expected as a result of the political and economic instability among other factors. Nevertheless, in prac-tice the pipeline did have some deterrence effect, since it kept Turkmenistan and, to a lesser extent, Iran out of the Turkish market. The pipeline may well have had a greater direct and strategic value if its economies of scale had been higher (and thus its operating costs per unit would have been lower), combined with higher gas demand growth in Tur-key. By using the same real-option game model, one can discern that Gazprom is currently considering a similar move in SSEE markets vis-à-vis the potential threat of other, more recent midstream projects, which could potentially bundle flows from the Caspian and Middle Eastern region. Via the South Stream pipeline, which involves Gazprom’s coop-eration with the Italian gas firm ENI and other European mid-streamers, it aims to capi-talise on an early mover’s advantage. Nord Stream pipeline (with a planned capacity of 55 bcm/y), which involves Gazprom’s cooperation with, e.g., German companies, also serve as a strategic option for access to future gas demand growth in the NWE market, largely vis-à-vis LNG competitors such as Qatar. According to the model-application’s results, when Gazprom decides to build the South Stream pipeline early on, the overall net project value is positive, owing partially to larger economies of scale and great upward demand potential. Depending on the upward de-mand potential in NWE, the Nord Stream pipeline may also have a deterrence effect on LNG flows for example. Additionally, the acceptance on the part of the investor of a lower required rate of return vastly aids in facilitating this strategic investment and improves its overall net project value at an almost exponential rate. Though an important explanatory tool, the stylised model has its limitations. The model can explain some of the strategic aspects of why Gazprom has constructed and may con-struct various pipelines. The case studies explain the nature and potential results of compe-tition in regional and sub-regional gas markets and help us to better comprehend the dy-namics involved. The model assumes the interaction amongst only two suppliers, where the gas industry is characterised by more than two (interregional) suppliers. Moreover, it assumes a two-stage game and a steady state after the end of the game, while in reality strategic interaction and demand uncertainties continue dynamically. Other model as-sumptions, which remove it further from real world gas industry considerations, include optimisation focussed on quantities, whereas actually pricing plays an equally important role. The model also considers competition at a sub-regional and regional level, whereas an interregional dimension is left out. Other issues such as taxes are also excluded. Notwith-standing the limitations of the stylised model, in reality Gazprom faces various difficulties in developing a pro-active strategy, for example by investing in gas infrastructure, which is covered by the conceptual toolbox. These difficulties include:

357
• a proactive investment and export strategy is subject to financing and organisa-tional feasibility issues;
• in light of the competitive nature of potential substitute fuels, policy measures might be put into place to encourage and/or impose the use of such substitutes (e.g., nuclear and solar power);
• in liberalised markets, TPA can undermine the strategic exclusivity of pipeline ca-pacity;
• regulatory on the part of the competition authorities on EU level could backlash, discouraging in the process a proactive investment strategy;
• as a result of geopolitical and geo-economic considerations the call on additional Russian gas could be reduced, and non-Russian gas flows could hence be stimu-lated.
These difficulties may stall a pro-active strategy on Gazprom’s part. Signing long-term contracts with European buyers, possibly accompanied by vertical asset-swaps, enables Gazprom to ensure its market position in volume terms in the European market. More-over, vertical gas diplomacy helps Gazprom to ensure, at a government level, market access and reduce the likelihood of downward demand risks. In particular, such a business model is desirable in (near-)mature market. By means of horizontal gas diplomacy, government-level relations with other gas-exporting countries can help to manage supply and to reduce competition. Besides Gazprom’s market growth opportunities in volume terms, Gazprom may aim for new investments in alternative transport routes (i.e., capacity) to Europe in order to miti-gate country and transit risks, especially Ukraine and Belarus. The diversification of pipe-line routes for additional supplies and the possibility to reroute existing flows, despite the high costs associated herewith, create additional strategic value, including improving Rus-sia’s security of demand. Furthermore, new business models via Gazprom M&T, involv-ing flexible, intra-regional supplies, could rationalise overcapacity into different entry points for gas into the network for arbitrage possibilities (especially in growth markets). In the midstream, from a practical point of view, the Nord Stream pipeline seems to have relatively more strategic value, because its proprietary status and therefore its strategic value is not undermined by third-party regulation. In addition, Gazprom has already se-cured a part of the Nord Stream’s capacity through long-term volume contracts. On the basis of whether Gazprom invests strategically or not, several scenarios can be drawn up of what the market outcome and structure would resemble ex-post, both at the sub-regional and at European levels. These scenarios could also result from a postpone-ment of strategic investment by Gazprom, followed by commercial investments later on. The possible market outcomes include: (1) a (quasi-)monopoly (market share above 70 percent); (2) a dominant, or leader, position (market share between 30 and 70 percent); and (3) a non-dominant or fringe position (below 30 percent).

358
A real possibility in all three scenarios is oversupply as a market condition, as is expected to be the case in the coming years, for example. The extreme market outcomes and condi-tion, such as a monopoly, a dominant outcome or oversupply, are the least desirable ones from a practical-economic perspective. This is largely a result of coordination problems, financing requirements, regulatory backlash, and possible geopolitical hurdles. While the non-dominant and near-dominant outcomes provide a range of possibilities and are also more realistic, especially at a regional level. The different possible and feasible market outcomes feed back into Russia’s merit order for its export market. In a situation of a high level of market penetration, Gazprom must start new large greenfield investments, like Yamal and Shtokman, and ensure Caspian imports, which are more expensive than the past and current gas imports and production fields. Energy savings and/or demand reduction in Russia in combination with the boost-ing of the production of the independents through corresponding incentives, could also free-up substantial volumes. As mentioned above, long-term contracts and vertical asset-swaps, accompanied with government assistance, could help reduce the down-side volume risks. In a broader sense, energy provides Russia with an important role in international affairs, where especially gas may be regarded as a potential tool to resurrect some of its geo-strategic position (i.e., a source of relative advantage). In this respect, in the first in-stance, Russia is concerned with protecting its territorial integrity and regional economic and political interests within the post-Soviet space. In a scenario without additional Russian exports, for whichever political and/or economic reasons, Gazprom may be inclined to invest only in some small(er) fields in order to keep-up production and fulfil existing contracts. In addition, Gazprom could also venture into an LNG export programme as well as exporting gas by pipeline to the Asian markets, if such a major export programme were at all feasible from a financing and organisational point of view. In trying to address to last research question, and therefore to pursue the research objec-tive, we can conclude that Russia’s investment strategy can be rationalised to a largely extent by economic-strategic approaches. However, the theoretical toolbox was not fully sufficient in identifying, evaluating and extrapolating Gazprom’s investment strategy re-garding Russia’s gas export strategy, because of the its limitations (see above). Although, the conceptual toolbox tries to fill gap between theories and the practical application, further research is required, such as games involving prices and other dynamics, in order to understand better Gazprom investment behaviour (see also Section 13.1.5 and Section 13.2.2 for further research).
359
13.1.5 Epilogue: Oversupply and avoiding price competition458
Given the discussion above, there is an overall tendency in the gas industry to enhance economies of scale for long-distance pipelines and LNG facilities. Depending on market circumstances, aggressive quantity competition can spill over into price competition. The gas infrastructure investment cases described above can be seen as ‘coordination games’, involving different balances between Gazprom’s pipeline gas flows and those of its would-be gas-exporting rivals. Cooperation begins with coordination games between Gazprom and its potential rivals, which involve different imaginable market structures as outcomes. In each coordination game, trade-offs between commitment and postponement values perpetually determine the tendency towards competing for market share and cooperating to avoid oversupply and thus price. The interregional gas market is characterised by various regional gas markets that are in some cases mature, while in others much room for expansion still remains. This also holds for various potential gas suppliers. Given the level of development of regional gas markets and the interregional LNG market, a long road of development yet remains for the gas market. With the continuing expansion of capacities witnessed in the interregional gas industry, firms may eventually have to compete through price when the industry matures at an interregional level, which is when collusion is most likely to occur. The GECF and the Gas Troika (see Section 9.5) appear to be geared towards the regula-tion and coordination of long-run investments, which may–with the emphasis on ‘long-run’–determine a certain level of gas supply, traded either in long- or short-term contracts. Besides sharing information, the mechanisms for further cooperation in the GECF and/or the Troika can consist of the following: (1) limiting flexible supplies (on a short-term basis)459; (2) coordinating capacity expansions; (3) coordinating pricing regimes in con-tracts; (4) sharing the economies of scale by developing their resources together. In this respect, national gas firms can reduce long-run competition in pricing through over-capacity as they jointly sell output in multiple markets; (5) market division of regional and sub-regional markets is a possibility for long-run pipeline and LNG flows. Whether these developments will progress further into institutionalisation depends on a number of fac-tors, including the financial and organisational capabilities of firms involved, the level of cheat behaviour and overall gas market conditions. On a state-level, Russia may hence opt for collusion in whichever form with fellow gas-exporting countries, such as the GECF and Gas Troika. There are various reasons why
458 For a discussion on Russia’s, and Gazprom’s, desirability of coordination and what types and forms under different circumstances of institutionalisation occur with regard to coordination, see Chapter 10 and 11 in Boon von Ochssée [2010].
459 Algeria’s proposal to attempt a reduction in gas production to limit spot volumes, in light of the oversupplied market from 2009 onward, was rejected by Russia and Qatar on the grounds that it may lead to a loss in market share, amidst Russian calls for the support of long-term contracts [WGI 2010c].

360
Russia may opt for more formal collusion, including avoiding overcapacities and price competition. However, as a Russian government-controlled firm, Gazprom is likely to pursue an independent course of action. From a political point of view, Russia is unlikely to make fully binding commitments, given its status as an important stakeholder in global affairs [Finon 2007]. Combined with the inherently unstable nature of collusive agree-ments, this desire to remain independent may induce Gazprom to prefer ad hoc, tacit collusion. In the end, interregional gas market collusion is likely to be geo-economically driven over the longer run, with political factors possibly influencing the level of formality of cooperation. 13.2 Discussion and future research
This section evaluates and positions the findings, which are yielded from the underlying research objective. The objective also serves as a way to contribute to the decision-making process of policy- and strategy-makers in respect to Gazprom and Europe (in understand-ing Gazprom’s investment strategies and the role of Russian gas in European energy mix). Therefore, a number of recommendations are made. Moreover, various recommendations for future research are provided, based on the limitations of this study. 13.2.1 Discussion and recommendations
The question whether Gazprom’s investment policy is politically or economically driven remains a vividly debated one. Based on our findings we have concluded that Russia’s investment strategy can be rationalised to a large extent by economic-strategic approaches. Compared to the existing literature, we use an alternative approach, where we integrate a real-option game model alongside qualitative tools in order to evaluate strategic infrastruc-tural investments. The real-option game model is able to provide a quantitative assessment of infrastructural projects of Gazprom regarding market demand uncertainty and potential entry. In addition, the qualitative tools try to get a grip on the institutionalisation of the gas (investment) strategy and on the limitations of the model and variables that are not covered by the model. We find that our approach leads to different outcomes, and may therefore be an important step in improving our understanding of Gazprom’s investment strategies. In a dominant strand of the literature within the field of political science, gas infrastruc-tural investments are largely rationalised from a political point of view, whereas economic reasons are given less attention. In the dominant strand of the economic literature, stylised models are applied in order to understand investment strategies of Gazprom. However, these models have limitations to analyse real-world cases. Our results tell a different story. The model helps to explain the economic-strategic value, which transcends the commercial value as far as deterring entry and the option value are concerned. In addition, our qualita-tive tools offer a reality check on the model results. This result explains Gazprom’s invest-ment behaviour in respect to Russia’s export markets. In particular, this study has begun to fill the gap between finance and strategic-economic and (geo)political aspects of Gaz-

361
prom’s investments regarding Russia’s gas exports. Moreover, institutional aspects in an historical context offer an insight on Russia’s strategy evolution. The application of the conceptual and real-option game framework have yielded a number of recommendations to Gazprom’s strategy-makers within the decision-making process of evaluating strategic gas infrastructure projects. Moreover, lessons can be learned of this study for European policy- and strategy-makers.
1) Recommendations with regard to the decision-making process of Gazprom.
• The real-option game model and real-world restrictions. Strategic invest-ments have practical hurdles in realising these investments, e.g., gas has to compete with other substitutes and regulatory bodies force pipeline owners to share their investments via TPA. In addition, political restrictions influ-ence Russia’s, and Gazprom’s, room to manoeuvre (although Russia’s gas di-plomacy may also pay out first-mover advantages); see also Section 13.1.4. Hence, if decision-makers within Gazprom consider applying a stylised model for real-world strategic investments, they should embed this model in a conceptual framework, which covers other internal and external investment indicators. For instance in reality, a purely monopolistic position is in prac-tice undesirable from a consumer perspective, but also from Russia’s perspec-tive because of counter measures in off-take markets. Moreover, Russia, and Gazprom, should be aware of the limitations of strategic investments in order to avoid an excessively risky financial exposure and organisational difficulties, both in the midstream and upstream section (especially in the case of a buyer’s market).
• Russia’s, and Gazprom’s, choice of business models. As described in Section 2.5 and in the application of the conceptual toolbox in Chapter 11 and 12, there are different business models in order to institutionalise new gas sup-plies alongside its strategic capacity extensions. In practice, Gazprom tradi-tionally applies the business model of long-term supply contracts to ensure gas infrastructure investments. Increasingly, Gazprom explores new forms of flexible supplies in order to balance price and quantity effects on its supply portfolio, which is in line with the strategy of other LNG and pipeline gas-exporting countries. If Russia, and by extension Gazprom, want to focus on a volume-driven strategy in their export markets, Gazprom should sign long-term (oil-linked) contracts with European mid-streamers alongside its capac-ity extensions. In order to share the burden of investments, Gazprom may form consortia with (foreign) firms along the value chain, accompanied by government support. This business model fits mainly in mature markets in Europe, see also Chapter 12. The business model of flexible supplies has sub-stantial downside risks. Especially in a scenario of a buyer’s market, Gazprom

362
faces lower margins, lower spot prices, uncertain demand, and stricter finan-cing requirements. Russia and other gas-exporting countries should be aware of the possibilities to coordinate (strategic) capacity extensions in order to protect their investments by not oversizing the market and avoid price ero-sion, especially in the case of the evolving role of new business models.
2) The role of Russian gas in the European gas portfolio: implications of this re-
search for Europe and policy-makers. Russian gas to Europe can achieve different positions within the European gas markets, as described in case studies 2 and 3 in Chapter 11 and in Chapter 12. Russia is a potentially important gas supplier in the long run for Europe, where policy-makers take Russia’s share in the total European and sub-regional energy mix into account. If Russia’s market power remains at an acceptable level in the energy mix, cooperation with Russia should be sought by policy-makers and European energy firms. Alternatively, in case Russia’s market power should ex-ceed certain thresholds in the total energy mix (such as 30-40 percent), a tougher line should then be taken, both for economic and political reasons. Either the en-ergy mix can then be changed, so as to enable other fuels to compete more effec-tively with gas [Van der Linde 2008], or EU energy policies could be created to encourage competition between various gas-exporting countries. Policies are imaginable which could encourage long-term contracts to make coordination be-tween gas-exporting countries for the European gas market less necessary. Energy firms should also diversify their gas supplies when they are economically too de-pend on Russian gas.
In a seller’s market scenario, a successful energy policy depends on obtaining competitive supplies from outside Europe, i.e., a focus on external policy of the EU and its member-states. Europe must find a delicate balance between avoiding an overbearing Russian dominance in European gas markets and securing enough gas supply. Encouraging EU-level policies that induce competition could backfire and lead to more coordination between gas-exporting countries (see Chapter 12.2.1 in Boon von Ochssée [2010]).
13.2.2 Future research
Further study of the aspects regarding Russia’s export strategy and its relationship with the international relations is certainly worthwhile, which are not covered in the research ques-tions, mentioned in Chapter 1. It also appeared that some problems, that have emerged when addressing research questions, should require further research. Therefore, we have the following recommendations for future research:
• Volume-based modifications of the real-option game model. As mentioned in Section 11.5 and Section 13.1.4, the application of the real-option game model

363
to gas infrastructural investments has shown some clear limitations. For example, the model is limited to only two players and the dynamics in the model is re-stricted to a two-stage game. In addition, both players are fully informed about their dominant strategies and cost information, i.e., there is no asymmetric in-formation involved. The incumbent makes an investment decision on the basis of information it fully possesses. It is a dynamic game with complete information, relatively simple in game-theoretic terms. The basic structure of Smit and Trigeorgis’ [2004] real-option game model, that combines valuation of strategic moves with market structure outcomes, could be expanded to take into account more complexities. Multi-stage games involving more than two players, with in-complete information about each other’s cost functions and strategies, and in-volving more than two sub-games, could be combined with Smit and Trigeorgis’ [2004] valuation approach.
• Market dynamics, price competition and shared investments. Just as in many other industries, gas firms must develop strategies in anticipation of market de-velopments that are dynamic. That firms compete in the first instance on the ba-sis of capacities, or volumes, before way is given to price competition coincides with a widely held view in industrial organisation (see also Chapter 3). Given the research objective, this study focuses primarily on capacity expansions. In light of evolution of the different regional gas markets, a hybrid form of research may of-fer additional insights, i.e., both price and volume games are considered. In the context of price competition, further quantitative research is desirable on shared investments between gas-exporting countries in order to mitigate price competi-tion. Research on price competition is also interesting in light of the current gas demand crunch as well as uncertainty about the long-term gas market develop-ments.
• Valuation incentives. As mentioned in the conclusion in Section 13.1.1, national energy firms and international energy firms have different incentives to invest. Given the research objective, this study presumes primarily rational behaviour of the actors that maximise the value of investments. A further elaboration on the evaluation of investments is desirable in order to get grip on the market beha-viour of government-supported energy firms, which may not be maximising the value of their resources per se, because of, e.g., socio-economic considerations. In addition to the value-maximisation of shareholders, other rational and bounded-rational behaviour on the part of Gazprom’s decision-makers may be in place. Personal motivations may also play a role. Aspects of behavioural corporate fi-nance, which assumes that markets are imperfect and that actors are bounded ra-tional, could offer additional insights. In particular, relevant aspects in relation to Russia’s decision-making process, besides value-maximisation of shareholders, are: (1) agency costs; (2) asymmetric information; (3) psychologically-induced
364
motives (due to bounded-rationality and emotions) aspects; and (4) geopolitical aspects. As a result of these aspects, decision-makers may, e.g., suffer from ‘over-commitments’ towards certain gas export projects involving new gas infrastruc-ture.
• Gas-importer perspective and behaviour of gas-exporting countries. In this re-search we are restricted on the perspective of a gas-exporting country, specifically Russia and Gazprom. However, further research is desirable from the perspective of a gas-importing or consuming country. In particularly, it is interesting to ana-lyse which business models and government policies should be considered by European firms and policy-makers, respectively, in their relation with Russia and other gas-exporting countries.
365
Bibliography∗ Abdelal, R. and A. Segal [2007], Has globalization passed its peak?, Foreign Affairs, no. 1, pp. 103-114.
Adelman, M. A. [1990], Mineral depletion, with special reference to petroleum, Review of Economics and Statistics, vol. 72, no. 1, pp. 1-10.
Akdeniz, F., C. Atila, and D. Gullu [2002], Recent energy investigations on fossil and alternative non-fossil resources in Turkey, Energy Conservation and Management, vol. 43, pp. 575-589.
Akerlof, G. A. [1970], The Market for "Lemons": Quality Uncertainty and the Market Mechanism, The Quarterly Journal of Economics, vol. 84, no. 3, pp. 488-500.
Alnaswari, A. [1985], OPEC in a Changing World, Baltimore and London: Johns Hopkins University Press.
Amineh, M. P. [2003], Globalisation, Geopolitics and Energy Security in Central Eurasia and the Caspian Region, The Hague: CIEP.
Aras, A. and N. Aras [2004], Forecasting residential natural gas demand, Energy Sources, vol. 26, pp. 463-472.
Arentsen, M.J., and R.W. Künneke eds. [2003], National Reforms in European Gas, El-sevier.
Armstrong, M., S. Cowan, and J. Vickers [1994], Regulatory Reform, Economic Analysis and British Experience, Cambridge, MA: MIT Press.
Arrow, K. J. [1963], Uncertainty and Welfare Economics of Medical Care, The American Economic Review, vol. 58, no. 5, pp. 941-973.
Åslund, A. [2007], Russia's Capitalist Revolution: Why Market Reform Succeeded and De-mocracy Failed, Washington, D.C.: Peterson Institute for International Economics.
Axelrod, R. [1984], The Evolution of Cooperation, New York: Basic Books.
Bain, J. S. [1951], Relation of profit rate to industry concentration: American manufactur-ing, 1936 - 1940, The Quarterly Journal of Economics, vol. 65, no. 3, pp. 293-324.
Bain, J. S. [1956], Barriers to New Competition, Cambridge, MA: Harvard University Press.
∗ This bibliography includes books, book chapters and articles in academic journals. Reports, articles in professional journals and news magazines and other citations are included in a separate section at the end of this bibliography.
366
Bain, J. S. [1972], Conditions for entry and the emergence of monopoly, in: Essays on Price Theory and Industrial Organization, Boston: R E. Caves.
Balzer, H. [2005], The Putin Thesis and Russian Energy Policy, Post-Soviet Affairs, vol. 21, no. 3, pp. 210-225.
Barnes, J., M. H. Hayes, A. M. Jaffe, and D. G. Victor [2006], Introduction, in: D. G. Victor, A. M. Jaffe, and M. H. Hayes [Eds.], Natural Gas and Geopolitics: From 1970 to 2040, Cambridge, MA: Cambridge University Press, pp. 3-26.
Barnett, T. P. M. [2009], Great Powers: America and the World After Bush, New York, NY: G. P. Putnam's Sons.
Barney, J.B. [1986], Strategic Factor Markets: Expectations, Luck, and Business Strategy. Management Science, vol. 32, pp. 1231-41.
Baumol, W. J. and A. S. Blinder [2000], Economics Principles and Policy, Mason, OH: South Western College.
Belleflamme, P. and F. Bloch [2004], Market sharing agreements and collusive networks, International Economic Review, vol. 45, no. 2, pp. 387-411.
Bentham, R. W. and W. G. R. Smith [1986], State Petroleum Corporations: Corporate Forms, Powers and Control, Dundee: Centre for Petroleum and Mineral Law Studies, Uni-versity of Dundee.
Berman, I. [2004], The New Battleground: Central Asia and the Caucasus, The Washing-ton Quarterly, vol. 28, no. 1, pp. 59-69.
Black, F., and M. Scholes. [1973], The Pricing of Options and Corporate Liabilities. Jour-nal of Political Economy, vol. 81, pp. 637-54.
Boon von Ochssée, T.A. [2010], Unveiling the Political and Economic Scope for Gas Supply Coordination. Cooperation or competition between gas-exporting countries from a Russian perspective, The Hague: Clingendael International Energy Programme.
Bossuyt, F. [2008], De Europese Unie in Centraal Azië: doet de EU nu ook mee in machtsspel? (The European Union in Central Asia: is the EU taking part in the power game?), Internationale Spectator, vol. 62, no. 9, pp. 469-473.
Bowden, J. [2009], Azerbaijan: from gas importer to gas exporter, in: S. Pirani [Ed.], Rus-sian and CIS Gas Markets and their Impact on Europe, Oxford: Oxford University Press, pp. 203-234.
Brealey, R. and S.C. Myers. [2005], Principles of Corporate Finance, 8th ed., New York: McGraw-Hill.

367
Bremmer, I. [2009], State Capitalism Comes of Age, Foreign Affairs, vol. 88, no. 3, pp. 40-55.
Brennan, M, and E. Schwartz. [1985], Evaluating Natural Resource Investments, Journal of Business, vol. 58, no. 2, pp. 135-57.
Brown, A. [1996], The Gorbachev Factor, Oxford: Oxford University Press.
Brzezinski, Z. [1997], The Grand Chessboard: American Primacy and its Geostrategic Im-peratives, New York: HarperCollins.
Bulow, J., J. Geanakoplos, and P. Klemperer [1985], Holding Idle Capacity to Deter Entry, Economic Journal, vol. 95, no. 178-182.
Burchill, S. [2001], Liberalism, in: S. Burchill, A. Linklater, R. Devetak, J. Donnelly, M. Paterson, C. Reus-Smit, and J. True [Eds.], Theories of International Relations, New York, NY: Palgrave Macmillan, pp. 55-83.
Burchill, S. [2005], The National Interest in International Relations Theory, Melbourne: Palgrave Macmillan.
Carlton, D. W. and J. M. Perloff [2000], Modern Industrial Organization, New York: Addison Wesley.
Case, K. and R. Fair [2006], Principles of Economics, Upper Saddle River, NJ: Prentice Hall.
Caves, R. and M. Porter [1977], From Entry Barriers to Mobility Barriers, Quarterly Jour-nal of Economics, vol. 9, no. 241-267.
Chamberlin, E. [1933], The Theory of Monopolistic Competition, Cambridge, MA: Harvard University Press.
Clarke, J. and S. Halper [2005], America Alone: The Neo-conservatives and the New Global Order, Cambridge, NY: Cambridge University Press.
Coase, R. H. [1937], The Nature of the Firm, Economica, New Series, vol. 4, no. 16, pp. 386-405.
Cohen, B. J. [1973], The Question of Imperialism, the Political Economy of Dominance and Dependence, New York, NY: Basic Books.
Cohen, S. B. [2003], Geopolitics of the World System, New York, NY: Rowman and Little-field Publishers.
Cohen, S. F. [2005], Gorbachev's Lost Legacy, National Interest.

368
Colell, A., Whinston, M. D., and J. R. Green [1995], Microeconomic Theory, Oxford: Oxford University Press.
Copeland, T., T. Koller, en J. Murrin [2000], Valuation, Measuring and Managing the Value of Companies, New York.
Correljé, A., C. van der Linde, and T. Westerwoudt [2003], Natural Gas in the Nether-lands: From cooperation to competition, Amsterdam: Oranje Nassau Groep.
Cors, D. [1997], Breaking the Bottleneck of Russia’s oil pipelines, Duke Journal of Com-parative and International Law, vol. 7, pp. 597-628.
Cox, J.C., S.A. Ross, and M. Rubinstein. [1979], Option Pricing: A Simplified Approach, Journal of Financial Economics, vol. 7, pp. 229-63.
Cox, R. [1987], Production, Power and World Order, New York, NY: Columbia University Press.
Criekemans, D. [2007], Geopolitiek: 'Geografisch geweten' van de buitenlandse politiek? (Geopolitics: 'Geographic conscience' of foreign policy?), Antwerp: Garant Publishers.
Cummings, S. N. [2001], Happier Bedfellows? Russia and the Central Asia under Putin, Asian Affairs, vol. 32, no. 2, pp. 412-30.
Daoudi, M. S. [1985], The Politactics of International Cartels: Economic Illusions, Political Realities, and OPEC, Ann Arbor: University Microfilms International.
d'Aspremont, C. and J. J. Gabszewicz [1986], On the Stability of Collusion, in: J. E. Stiglitz and G. F. Mathewson [Eds.], New Developments in the Analysis of Market Structure, Cambridge, MA: The MIT Press, pp. 243-264.
Davis, J. D. [1984], Blue Gold: The Political Economy of Natural Gas, London: George Allen and Unwin.
De Jong, D., C. van der Linde, and T. Smeenk [2010], The Evolving Role of LNG in the Gas Market, in: A. Goldthau and J. M. Witte [Eds.], Global Energy Governance: The New Rules of the Game, Baltimore, MD: Brookings Institution Press, pp. 221-245.
De Jong, H. W. [1989], Dynamische Markttheorie (Dynamic Market Theory), Leiden: H. E. Stenfort Kroese.
De Jong, J. [2008], The 2007 Energy Package: The start of a new era?, in: M. Roggenk-amp and U. Hammer [Eds.], European Energy Law Report V, Antwrpen: Intersentia, pp. 95-108.

369
De Jong, J., E. Weeda, T. Westerwoudt, and A. Correljé [2005], Dertig Jaar Nederlands Energiebeleid (Thirty Years of Dutch Energy Policy), The Hague: Clingendael International Energy Programme.
Dekmejian, R. H. and H. H. Simonian [2003], Troubled Waters: The geopolitics of the Caspian Region, London: I.B. Taurus and Company, Ltd.
Demirbas, A., A.S. Demirbas, and A.H. Demirbas [2004], Turkey's Natural Gas, Hydro-power, and Geothermal Energy Policies, Energy Sources, vol. 26, pp. 237-248.
Demsetz, H. [1974], Two Systems of Belief about Monopoly, in: D. Goldschmid, H. Mann, and J. Weston [Eds.], Industrial Concentration: The New Learning, Boston: Little, Brown, pp. 164-184.
Dixit, A. K. and B. J. Nalebuff [1991], Thinking Strategically, New York: W.W. Norton and Company.
Dixit, A., and B.J. Nalebuff [1991], Thinking Strategically: The Competitive Edge in Busi-ness, Politics, and Everyday Life, New York: Norton Press.
Donnelly, J. [2001], Realism, in: S. Burchill, A. Linklater, R. Devetak, J. Donnelly, M. Paterson, C. Reus-Smit, and J. True [Eds.], Theories of International Relations, New York, NY: Palgrave Macmillan, pp. 29-54.
Efegil, E. and L. Stone [2001], Iran's Interest in Central Asia: A Contemporary Assess-ment, Central Asian Survey, vol. 20, no. 3, pp. 353-365.
Finon, D., and A. Midttun eds. [2004], Reshaping European Gas and Electricity Industries, Elsevier.
Flower, A. [2008], Appendix 2: LNG Pricing in Asia - Japan Crude Cocktail (JCC) and 'S'-Curves, in: J. P. Stern [Ed.], Natural Gas in Asia: The Challenges of Growth in China, India, Japan, and Korea, Oxford: Oxford Institute for Energy Studies, pp. 405-409.
Forsythe, R. [1996], Politics of oil in the Caucasus and Central Asia, Oxford: The Interna-tional Institute for Strategic Studies.
Freeland, C. [2000], Sale of the Century: Russia's Wild Ride from Communism to Capitalism, New York: Crown Business.
Friedman, M. [2002], Capitalism and Freedom, Chicago: University of Chicago Press.
Fukuyama, F. [1989], The End of History? The National Interest, vol. 16, pp. 3-18.
Fukuyama, F. [1992], The End of History and the Last Man, London: Avon Books.
Gaddy, C. G. and A.C. Kuchins [2008], Putin's Plan, The Washington Quarterly, vol. 31, no. 2, pp. 117-129.

370
Gaddy, C. G. and B.W. Ickes [1998], Russia's Virtual Economy, Foreign Affairs, vol. 77, no. 5, pp. 53-67.
Gaddy, C. G. and B.W. Ickes [2005], Resource Rents and the Russian Economy, Eurasian Geography and Economics, vol. 46, no. 8, pp. 559-583.
Gaddy, C. G. and Ickes, B. W. [2002], Russia's Virtual Economy, Washington, DC: Brookings Institution.
Gaidar, Y. T. [1999], Days of Defeat and Victory, Seattle, WA: University of Washington Press.
George, S., en I. Bach [2001], Politics in the European Union, Oxford: Oxford University Press.
Gilpin, R. [1981], War and Change in International Politics, Cambridge: Cambridge Uni-versity Press.
Gilpin, R. [2001], Global Political Economy: Understanding the international economic or-der, Princeton: Princeton University Press.
Goldman, M. I. [2008], Petrostate: Putin, Power, and the New Russia, Oxford: Oxford University Press.
Goldthau, A. [2010], Energy Diplomacy in Trade and Investment of Oil and Gas, in: A. Goldthau and J. M. Witte [Eds.], Global Energy Governance: The New Rules of the Game, Baltimore, MD: Brookings Institution Press, pp. 25-48.
Gorbachev, M. [1987], Perestroika: New Thinking for Our Country and the World, New York: Harper & Row Publishers.
Grant, R.M. [1995], Contemporary Strategy Analysis, Oxford: Blackwell Business.
Grieco, J. [1988], Anarchy and the Limits of Cooperation: A Realist Critique of the New-est Liberal Institutionalism, International Organization, vol. 42, no. 3, pp. 485-508.
Grieco, J. [1990], Cooperation Among Nations, Ithaca, NY: Cornell University Press.
Griffin, J. M. and D. J. Teece [1982], Introduction, in: J. M. Griffin and D. J. Teece [Eds.], OPEC: Behavior and World Oil Prices, London: George Allen and Unwin.
Grigoriev, L., and M. Belova [2009], EU-Russia gas relations, in: K. Liuhto [Ed.], The EU-Russia gas connection: Pipes, politics and problems, Turku: Pan-European Institute.
Grinblatt, M., and S. Titman [2002], Financial Markets and Corporate Strategy, 2nd ed. McGraw-Hill Irwin.

371
Haase, N., [2009], European Gas Market Liberalisation. Competition versus security of sup-ply? Groningen: Energy Delta Institute/Castel International Publisher.
Hacisalihoglu, B. [2008], Turkey's Natural Gas Policy, Energy Policy, vol. 36, no. 1867-1872.
Hashimoto, K., J. Elass, and S. L. Eller [2006], Liquefied Natural Gas from Qatar: the Qatargas project, in: D. G. Victor, A. M. Jaffe, and M. H. Hayes [Eds.], Natural Gas and Geopolitics: From 1970 to 2040, Cambridge, MA: Cambridge University Press, pp. 234-267.
Hayes, M. H. [2006], The Transmed and Maghreb projects: Gas to Europe from North Africa, in: D. G. Victor, A. M. Jaffe, and M. H. Hayes [Eds.], Natural Gas and Geopoli-tics: From 1970 to 2040, Cambridge, MA: Cambridge University Press, pp. 49-90.
Helm, D. [2003], Energy, the State, and the Market, Oxford: Oxford University Press.
Helm, D. [2007], The New Energy Paradigm, in: D. Helm [Ed.], The New Energy Para-digm, Oxford: Oxford University Press, pp. 9-35.
Hoffman, D.E. [2002], The Oligarchs, New York: Public Affairs.
Hotelling, H. [1931], The economics of exhaustible resources, The Journal of Political Economy, vol. 39, no. 2, pp. 137-175.
Hull. J.C. [2003], Options, Futures, and Other Derivates, Upper Saddle River, New Jersey: Prentice Hall.
Ingersoll, J., and S. Ross. [1992], Waiting to Invest: Investment and Uncertainty, Journal of Business, vol. 65, no. 1, pp. 1-29.
Jacquemain, A. [1987], The New Industrial Organization, Oxford: Oxford University Press.
Jaffe, A. M. and R. Soligo [2006], Market Structure in the New Gas Economy: Is Carteli-zation Possible?, in: D. G. Victor, A. M. Jaffe, and M. H. Hayes [Eds.], Narural Gas and Geopolitics: From 1970 to 2040, Cambridge, MA: Cambridge University Press, pp. 439-466.
Jalalzai, M. [2003], The Pipeline War in Afghanistan, Lahore: Sang-e-Meel Publications.
Kalyuzhnova, Y., A.M. Jaffe, D. Lynch and R. Sickles eds. [2002], Energy in the Caspian region: Present and Future, New York: Palgrave.
Katz, M.N. [1997], Central Asian stability: Under threat? School of Advanced International Studies Review, vol. 17, no.1, pp. 31-46.
372
Keohane, R. O. and J. Nye [1977], Power and Interdependence: World Politics in Transi-tion, Boston, MA: Longman.
Kilic, F. C. and D. Kaya [2007], Energy Production, Consumption, Policies and Recent Developments in Turkey, Renewable and Sustainable Energy Reviews, vol. 11, pp. 1312-1320.
Koller, T., M. Goedhart, and D. Wessels [2005], Valuation, New York: John Wiley & Sons, Inc.
Komduur, R. [2007], Anti-Gazprom Policy May Force Up Gas Prices, European Energy Review, vol. 1, no. 1, pp. 46-49.
Konoplyanik, A. [2008a], Regulating energy relations: Acquis or Energy Charter?, in: K. Barysch [Ed.], Pipelines, Politics and Power: The Future of EU-Russia relations, Brussels: Center for European Reform, pp. 107-115.
Konoplyanik, A. [2008b], Box: What is the Energy Charter?, in: K. Barysch [Ed.], Pipe-lines, Politics and Power: The Future of EU-Russia relations, Brussels: Centre for European Reform, pp. 103-105.
Kreps, D. and J. Schneikman [1983], Quantity Pre-Commitment and Bertrand Competi-tion Yield Cournot Outcomes, Bell Journal of Economics, vol. 14, no. 326-337.
Lefeber, R. and C. van der Linde [1987], Europese integratie vergt een energie(k) beleid (European integration requires an energetic policy), SEW, vol. 6, pp. 452-470.
Legvold, R. [2007], Russian Foreign Policy During Periods of Great State Transforma-tion, in: R. Legvold [Ed.], Russian Foreign Policy in the Twenty first Century and the Shadow of the Past, New York, NY: Columbia University Press, pp. 77-144.
Levenstein, M. C. and V. Y. Suslow [2004], Studies of Cartel Stability: A Comparison of Methodological, in: P. Z. Grossman [Ed.], How Cartels Endure and How They Fail, Chel-tenham, UK: Edward Elgar.
Lieberman. M.B., and D.B. Montgomery. [1988], First-Mover Advantages, Strategic Management Journal, vol. 9, pp. 41-58.
Maarse Nzn, W., [1976], Het gas- en oliebeleid van de USSR en enige externe effecten (Gas and oil policy in the USSR and some external effects), Internationale Spectator, Octo-ber 1976, pp. 3-10.
Mackinder, H. J. [1904], The Geographical Pivot of History, The Geographical Journal, vol. 23, no. 4, pp. 421-437.
Majd, S. and R. Pindyck. [1987], Time to build, Option Value, and Investment Deci-sions, Journal of Financial Economics, vol. 18, pp. 7-27.

373
Malmendier, U. and G. Tate [2005], Does Overconfidence Affect Corporate Investment? CEO Overconfidence Measures Revisited, European Financial Management, vol. 11, no. 5, pp. 649-659.
Marcel, V. [2005], Oil Titans: National Oil Companies in the Middle East, London: Royal Institute of International Affairs.
Matláry, J. H. [1997], Energy Policy in the European Union, Oslo: Palgrave Macmillan.
McCormick, J. M. [1998], American Foreign Policy and Process, Itasca, IL: F.E. Peacock Publishers.
Merton, R.C. [1973], Theory of Rational Option Pricing, Bell Journal of Economics and Management Science, vol. 4, pp. 141-83.
Milgrom, P. and J. Roberts [1992], Economics, Organization and Management, Upper Saddle River, NJ: Prentice Hall.
Mitrova, T. [2009], Natural Gas in Transition: Systemic reform issues, in: S. Pirani [Ed.], Russian and CIS Gas Markets and their Impact on Europe, Oxford: Oxford University Press, pp. 13-53.
Mitrova, T., S. Pirani, and J. P. Stern [2009], Russia, the CIS and Europe: Gas trade and transit, in: S. Pirani [Ed.], Russian and CIS Gas Markets and their Impact on Europe, Ox-ford: Oxford University Press, pp. 395-441.
Moïsi, D. [2008], La Géopolitique de l'Emotion (The Geopolitics of Emotion), Paris: Flam-marion.
Myers, S.C. [1987], Finance Theory and Financial Strategy, Midland Corporate Finance Journal vol. 5, no. 1, pp. 6-13.
Myers, S.C., and S. Majd. [1990], Abandonment Value and Project Life, Advances in Futures and Option Research, vol. 4, pp. 1-21.
Neumann, A. and C. von Hirschhausen [2004], Less Long-Term Gas in Europe? A Quan-titative Analysis of European Long-Term Gas Supply Contracts, Zeitschrift für Ener-giewirtschaft, vol. 28, no. 3, pp. 175-182.
Nielsen, J. U., E. S. Madsen, and K. Pedersen [1995], International Economics: The Wealth of Open Nations, Berkshire: McGraw-Hill.
Noreng, O. [2006], Crude Power, London: I.B. Tauris.
Okano-Heijmans, M. [2010], Hantering van het begrip economische diplomatie (Using the notion of eocnomic diplomacy), Internationale Spectator, vol. 64, no. 2, February 2010.

374
Olcott, M. B. [2006], International Gas Trade in Central Asia: Turkmenistan, Iran, Rus-sia and Afghanistan, in: D. G. Victor, A. M. Jaffe, and M. H. Hayes [Eds.], Natural Gas and Geopolitics: From 1970 to 2040, Cambridge, MA: Cambridge University Press, pp. 202-233.
Olcott, M.B., Central Asia’s new states: Independence, foreign policy, and regional security, Washington D.C.: United States Institute of Peace Press.
Olorunfemi, M. A. [1991], The Dynamics of National Oil Companies, OPEC Review.
OSCE [2006], Gazprom: Stratégie de la Russie (Gazprom: Russia's Strategy), Brussels: Édi-tions Luc Pire.
Ozturk, H. K. and A. Hepbasli [2003], The Place of Natural Gas in Turkey's Energy Sources and Future Perspectives, Energy Sources, vol. 25, pp. 293-307.
Paik, K.W. [2002], Natural Gas Expansion in Korea, in: Ian Wybrew-Bond and Jonathan Stern [Ed.], Natural Gas in Asia: The Challenges of Growth in China, India, Japan and Korea, Oxford: Oxford University Press, pp. 188-229.
Panjoesjkin, V., and M. Zygar [2008], Gazprom. Ruslands Nieuwe Wapen (Gazprom. Rus-sia’s New Weapon), Houten: Spectrum.
Perloff, J. M. [1999], Microeconomics, Reading, MA: Addison Wesley.
Pindyck, R. [1988], Irreversibility Investment, Capacity Choice, and the Value of the Firm, American Economic Review, vol. 78, pp. 969-85.
Pindyck, R. S. [1978], Gains to producers from the cartelization of exhaustible resources, The Review of Economics and Statistics, vol. 60, no. 2, pp. 238-251.
Pindyck, R. S. and D.L. Rubinfeld [2001], Microeconomics, Upper Saddle River, NJ: Pren-tice Hall.
Pirani, S. [2009], Introduction: Political and Economic Factors in the Russian and CIS Gas Trade, in: S. Pirani [Ed.], Russian and CIS Gas Markets and their Impact on Europe, Oxford: Oxford University Press, pp. 1-12.
Pirani, S. [2009], Ukraine: A gas dependent state, in: S. Pirani [Ed.], Russian and CIS Gas Markets and their Impact on Europe, Oxford: Oxford University Press, pp. 93-132.
Porter, M.E. [1980], Competitive Strategy, London: Macmillan.
Quast, O., and C. Locatelli, Russian natural gas policy and its possible effects on European gas markets, Energy Policy, vol. 25, no 2, pp. 125-133.
Rasmusen, E. [2001], Games and Information, Malden, MA: Blackwell Publishing Ltd.

375
Razavi, H. [1996], Financing Energy Projects in Emerging Economies, Oklahoma: PennWell Books.
Roberts, P. [2004], Gas Sales and Gas Transportation Agreements. Principles and Practice, London: Sweet & Maxwell.
Ross, M. L. [1999], The Political Economy of the Resource Curse, World Politics, vol. 51, no. 2.
Ross, S.A., R.W. Westerfield, J. Jaffe [2005], Corporate Finance, 7th ed., New York: McGraw-Hill/Irwin.
Rumelt, R.P. [1984], Towards a Strategic Theory of the Firm. In: R.B. Lambrecht [Ed.], Competitive Strategic Management, Englewood Cliffs N.J.: Prentice Hall.
Salop, S. C. [1986], Practices that (Credibly) Facilitate Oligopoly Co-ordination, in: J. E. Stiglitz and G. F. Mathewson [Eds.], New Developments in the Analysis of Market Structure, Cambridge, MA: The MIT Press, pp. 265-294.
Schelling, T. [1960], The Strategy of Conflict, Cambridge, MA: Harvard College.
Schmalensee, R. [1988], Industrial economics: An overview, The Economic Journal, vol. 98, no. 643-681.
Schwartz, E.S., and L. Trigeorgis, eds. [2001], Real Options and Investment under Uncer-tainty: Classical Readings and Recent Contributions, Cambridge: MIT Press.
Shapiro, A. C. [2005], Capital Budgeting and Investment Analysis, New Jersey: Pearson Prentice Hall.
Shapiro, A.C. [1991], Modern Corporate Finance, London: Macmillan.
Shefrin, H. [2001], Behavioral Corporate Finance, Journal of Applied Corporate Finance, pp. 113-124.
Shleifer, A. [1998], State versus Private Ownership, Journal of Economic Perspectives, vol. 12, no. 4, pp. 133-150.
Shleifer, A. and D. Treisman [2004], A Normal Country, Foreign Affairs, vol. 83, no. 2, pp. 20-38.
Shleifer, A. and R.W. Vishny [1998], The Grabbing Hand, Government Pathologies and their Cures, Cambridge, MA: Harvard University Press.
Smit, H. T. J. [2003], Infrastructure Investment as a Real Options Game: The case of European Airport Expansion, Financial Management, pp. 5-35.

376
Smit, H. T. J. and L. Trigeorgis [2001], Flexibility and Commitment in Strategic Invest-ment, in: E. S. Schwartz and L. Trigeorgis [Eds.], Real Options and Investment under Un-certainty, Cambridge, MA: MIT Press, pp. 451-498.
Smit, H. T. J. and L. Trigeorgis [2004], Strategic Investment: Real Options and Games, Princeton, NJ: Princeton University Press.
Smith, A. [1991], The Wealth of Nations, Amhurst, NY: Prometheus Books.
Spykman, N. J. [1938], Geography and Foreign Policy, I, The American Political Science Review, vol. 32, no. 1, pp. 28-50.
Spykman, N. J. [1944], The Geography of the Peace, New York, NY: Harcourt, Brace and Company.
Stein, J. [1983], The Soviet bloc, Energy, and Western Security, Toronto: Lexington Books, D.C. Heath and Company.
Stent, A.E. [1982], Soviet Energy and Western Europe, Washington DC/New York: Center for Strategic and International Studies, Gertown University.
Stern J.P. [1980], Soviet Natural Gas Development to 1990. The Implications for the CMEA and the West, Toronto: Lexington Books, D.C. Health and Company.
Stern, J.P. [1987], Soviet Oil and Gas Exports to the West. Commercial Transaction or Secu-rity Threat, Croft Road, Aldershot, Hants: Policy Studies Institute and Royal Institute of International Affairs, Gower Publishing Company Limited Gower House.
Stern, J. P. [1998], Competition and Liberalisation in European Gas Markets: A diversity of market models, London: Royal Institute of International Affairs.
Stern, J. P. [1999], Soviet and Russian Gas: The origins and evolution of Gazprom's ex-port strategy, in: R. Mabro and I. Wybrew-Bond [Eds.], Gas to Europe, Oxford: Oxford Institute for Energy Studies.
Stern, J. P. [2005], The Future of Russian Gas and Gazprom, Oxford: Oxford University Press.
Stern, J. P. [2008], Conclusions, in: J. P. Stern [Ed.], Natural Gas in Asia: The Challenges of Growth in China, India, Japan, and Korea, Oxford: Oxford Institute for Energy Studies, pp. 379-409.
Stern, J. P. [2009], The Russian Gas Balance to 2015: Difficult years ahead, in: S. Pirani [Ed.], Russian and CIS Gas Markets and their Impact on Europe, Oxford: Oxford University Press.

377
Stern, J. P. and M. Bradshaw [2008], Russian and Central Asian Gas Supply for Asia, in: J. P. Stern [Ed.], Natural Gas in Asia: The Challenges of Growth in China, India, Japan, and Korea, Oxford: Oxford Institute for Energy Studies, pp. 220-278.
Stigler, G. [1964], A theory of oligopoly, The Journal of Political Economy, vol. 72, no. 1, pp. 44-61.
Stiglitz, J. E. [1989], Markets, Market Failures, and Development, The American Economic Review, vol. 79, no. 2, pp. 197-203.
Strange, S. [1989], Toward a Theory of Transnational Empire, in: E. O. Czempiel and J. N. Rosenau [Eds.], Global Changes and Theoretical Challenges: Approaches to World Politics for the 1990s, Lexington: Lexington Books, pp. 161-193.
Strange, S. [1994], States and Markets, London: Continuum.
Stuckey, J., White, D. [1993], When and when not to vertically integrate, The McKinsey Quarterly, no. 3.
Suslow, V. Y. [2005], Cartel contract duration: Empirical evidence from inter-war interna-tional cartels, Industrial and Corporate Change , vol. 14, no. 5, pp. 705-744.
Tarr, D. and P. Thompson [2009], The Merits of Dual Pricing of Russian Natural Gas, The World Economy, vol. 27, no. 8, pp. 1173-1194.
Teece, D. J., D. Sunding, and E. Mosakowski [1993], Natural Resource Cartels, in: A. V. Kneese and J. L. Sweeney [Eds.], Handbook of Natural Resources and Energy Economics, Amsterdam: Elsevier, pp.
Teece, D.J., G. Pisano, and A. Shuen [1997], Dynamic Capabilities and Strategic Man-agement, Strategic Management Journal, vol. 18, pp. 509-34.
Thompson, A.A. and A.J. Strickland [2001], Strategic Management. Concepts and Cases, 12th ed., McGraw-Hill, New York.
Tirole, J. [1988], The Theory of Industrial Organization , Cambridge, MA: MIT Press.
Tokmazishvili, M. [2009], Georgia’s gas sector, in: S. Pirani [Ed.], Russian and CIS Gas Markets and their Impact on Europe, Oxford: Oxford University Press.
Tompson, W. [2005], The Political Implications of Russia's Resource-Based Economy, Post-Soviet Affairs, vol. 21, no. 4, pp. 335-359.
Tönjes, C. [2007], Duits energiebeleid in 2007 (German energy policy in 2007), Interna-tionale Spectator, vol. 61, no. 1, pp. 30-33.
Trenin, D. [2007], Getting Russia Right, Washington, D.C.: Carnegie Endowment for International Peace.

378
Trenin, D. [2008], Energy geopolitics in Russia-EU relations, in: K. Barysch [Ed.], Pipe-lines, Politics and Power: The Future of EU-Russia relations, Brussels: Center for European Reform, pp. 15-24.
Trigeorgis, L. [1988], A Conceptual Options Framework for Capital Budgeting, Advances in Futures and Options Research, vol. 3, pp. 145-67.
Trigeorgis, L. [1991], Anticipated Competitive Entry and Early Preemptive Investment in Deferrable Projects, Journal of Economics and Business, vol. 43, no. 2, pp. 143-56.
Trigeorgis, L. [1993], The Nature of Option Interactions and the Valuation of Invest-ments with Multiple Real Options, Journal of Financial and Quantitative Analysis, vol. 28, no. 1, pp. 1-20.
Trigeorgis, L., and S.P. Mason [1987], Valuing Managerial Flexibility, Midland Corporate Finance Journal, vol. 5, no. 1, pp. 14-21.
Van der Linde, C. [1991], Dynamic International Oil Markets: Oil Market Developments and Structure, 1860 - 1990, Dordrecht: Kluwer Academic Publishers.
Van der Linde, C. [1991], Empty Barrels Make the Most Sound, World Competition, vol. 15, no. 2, pp. 127-162.
Van der Linde, C. [1999], The State and the International Oil Market, New York, NY: Springer.
Van der Linde, C. [2008], Managing Energy Security Risks in a Changing World, in: P. Bracken, I. Bremmer, and D. Gordon [Eds.], Managing Strategic Surprise, Cambridge, MA: Cambridge University Press, pp. 228-264.
Varian, H. R. [1992], Microeconomic Analysis, New York: W. W. Norton & Company.
Verma, S. K. [2007], Energy Geopolitics and Iran-Pakistan-India gas pipeline, Energy Policy, vol. 35, pp. 3280-3301.
Victor, N. M. and D. G. Victor [2006], Bypassing Ukraine: Exporting Russian gas to Poland, in: D. G. Victor, A. M. Jaffe, and M. H. Hayes [Eds.], Natural Gas and Geopoli-tics: From 1970 to 2040, Cambridge, MA: Cambridge University Press, pp. 122-168.
Viotti, P. R. and M.V. Kauppi [1999], International Relations Theory: Realism, Pluralism, Globalism, and Beyond, Boston, MA: Allyn and Bacon.
Viscusi, W. K., J.M. Vernon, and J.E. Harrington Jr. [2000], Economic Regulation and Antitrust, Cambridge, MA: MIT Press.
Waltz, K. N. [1979], Theory of International Politics, New York, NY: Random House.

379
Waltz, K. N. [2006], Structural Realism after the Cold War, in: R. Little and M. Smith [Eds.], Perspectives on World Politics, New York: Routledge, pp. 90-98.
Wernerfelt, B. [1984], A Resource-Based View of the Firm, Strategic Management Journal, vol. 5, no. 2, pp. 171-80.
Yafimava, K. [2009], Belarus: The domestic gas market and relations with Russia, in: S. Pirani [Ed.], Russian and CIS Gas Markets and their Impact on Europe, Oxford: Oxford University Press, pp. 133-169.
Yazici, N. and A. Demirbas [2001], Turkey's Natural Gas Necessity and Turkey's Natural Gas Consumption, Energy Sources, vol. 23.
Yenikeyeff, S. [2009], Kazakhstan's Gas Sector, in: S. Pirani [Ed.], Russian and CIS Gas Markets and their Impact on Europe, Oxford: Oxford University Press, pp. 316-354.
Yergin, D. [1991], The Prize: The Epic Quest for Oil, Money and Power, New York, NY: Simon and Schuster.
Yescombe, E.R. [2002], Principles of Project Finance, London: Academic Press.
Zhiznin, S. [2007], Energy Diplomacy, Moscow: East Brook Publishing Com-pany/Clingendael International Energy Programme.
Zhukov, S. [2009], Turkmenistan: An exporter in transition, in: S. Pirani [Ed.], Russian and CIS Gas Markets and their Impact on Europe, Oxford: Oxford Institute for Energy Studies, pp. 271-315.
Zhukov, S. [2009], Uzbekistan: A domestically oriented producer, in: S. Pirani [Ed.], Russian and CIS Gas Markets and their Impact on Europe, Oxford: Oxford University Press, pp. 355-394.
Reports, articles in professional journals and news magazines and other cita-
tions
Aftenposten [7 April, 2006], Hydro and Statoil may team up on Shtokman project.
Algemene Energieraad (Dutch Energy Council) [2005], Gas voor Morgen (Gas for Tomor-row), The Hague: Algemene Energieraad.
Argus Global LNG [May, 2007], US, Qatar focus on LNG.
Argus Global LNG [June, 2008], Decision time approaches for Shtokman project.
Argus Gas Connections [31 May, 2007], Gazprom Wins Austrian Hub Stake.
380
Argus Gas Connections [24 July, 2007], Libya tightens Russian ties.
Argus Gas Connections [15 November, 2007], Gazprom Bids for UK Supplier Stake.
Argus Gas Connections [8 February, 2008], Gazprom Takes Stake in Austria's Baumgarten hub.
Argus Gas Connections [17 April, 2008], Gazprom Revises Up Production Targets.
Argus Gas Connections [24 July, 2008], US keen to help Europe tap Central Asian gas.
Argus Gas Connections [2 October, 2008], New Yamal Plan Put Forward.
Barrett, A. [2007], Models for Structuring Midstream Gas Projects, in: Cambridge Energy Research Associates, The Great Turning Point in Russian Gas, Cambridge: CERA, pp. 152-162.
Boon von Ochssée, T. A. [October 2009], ExxonMobil and Qatar Petroleum: An Exam-ple of Successful IOC-NOC Cooperation, International Gas Union Magazine.
Boon von Ochssée, T. A. and Shahryar, N. [October 2009], Gas Market Integration Case Study: The Iran-Pakistan-India pipeline, International Gas Union Magazine.
BP [2008], Statistical Review of World Energy 2008, London: BP.
BP [2009], Statistical Review of World Energy 2009, London: BP.
Bressand [2010], European Integration and the Development of a European External Energy Policy in Eurasia, Berlin: Global Public Policy Institute.
Cambridge Energy Research Associates [2007], The Great Turning Point in Russian Gas, Cambridge: CERA.
CE/Clingendael International Energy Programme [2007], Zoeken, vinden en winnen (Ex-ploring, finding and producing), Delft/The Hague: CE/CIEP.
Cédigaz [2008], LNG Trade and Infrastructures, Rueil Malmaison: Cédigaz.
Cédigaz [2008], LNG Trade and Infrastructures: LNG Contracts, Paris: Cédigaz.
Cédigaz [2008], LNG Trade and Infrastructures: Re-gasification Plants, Paris: Cédigaz.
Cédigaz [2008], Pipeline Long-Term Gas Contracts by Exporter, Paris: Cédigaz.
Cédigaz News Report [9 April, 2008], Gazprom's commitments facing decrease of West Siberia gas fields production (CNR/47/13/26).

381
Centre for Social and Economic Research [2008], The Economic Aspects of the Energy Sector in CIS Countries (Economic Papers 327), Brussels: European Commission: DG Economic and Financial Affairs.
Chabrelie, M.F. [2007], Prospects for LNG in Europe and the implications for gas trading, Paris: Cédigaz.
Chollet, A., B. Meinhart, C. von Hirschhausen, and P. Opitz [2001], Options for Transporting Russian Gas to Western Europe (Discussion Paper 2001/10), Berlin: Deutsches Institut für Wirtschaftsforschung.
Clingendael International Energy Programme [2004], Study on Energy Supply Security and Geopolitics, The Hague: CIEP.
Clingendael International Energy Programme [2005], Tomorrow's Mores, The Hague: CIEP.
Clingendael International Energy Programme [2008], Pricing Natural Gas: The outlook for the European market, The Hague: CIEP.
Clingendael International Energy Programme [2008], The Gas Supply Outlook for Europe: The Roles of Pipeline Gas and LNG, The Hague: CIEP.
Clingendael International Energy Programme [2010], Shifting Strategies in the EU Energy Market: In search of alignment between government and industry goals, The Hague: CIEP.
Correljé, A., D. De Jong, and J. de Jong. [2009], Crossing Borders in European Gas Net-works: The missing links, The Hague: Clingendael International Energy Programme.
Cronshaw, I., J. Marstrand, M. Pirovska, D. Simmons, and J. Wempe [2008], Develop-ment of Competitive Gas Trading in Continental Europe, Paris: IEA/OECD.
Dabrowski, M. [1995], The reasons of the collapse of the Ruble zone, Warsaw: Centre for Social and Economic Research.
Dickel, R., G. Gönül, T. Gould, M. Kanai, Konoplyanik, and Y. Selivanova [2007], Put-ting a Price on Energy: International Pricing Mechanisms for Oil and Gas, Brussels: Energy Charter Secretariat.
Economist Intelligence Unit [2007], Country Report: Russia at a Glance, 2007-2008, Lon-don: The Economist.
Egging, E., F. Holz, C. von Hirschhausen, and S. A. Gabriel [2008], Representing GASPEC with the World Gas Model (Discussion Paper 845), Berlin: Deutsches Institut für Wirtschaftsforschung.

382
Energy Information Administration [2010], Shale Gas. A Game Changer for U.S. and Global Gas Markets? Presentation R. G. Newell at Flame – European Gas Conference March 2, 2010, Amsterdam.
European Commission [2007], European Union and Neighbouring countries, Brussels: DG- TREN.
Euractiv.com [5 March, 2010], EU throws EUR2.3bn at gas, power connections.
Federal Reserve [December 1996], The Challenge of Central Banking in a Democratic Soci-ety. Available at: <http://www.federalreserve.gov/econresdata/releases/statisticsdata.htm>.
Financial Times [24 December, 2008], Gazprom clinches gas deal with Serbia.
Financial Times [25 February, 2009], Total to back Trans-Sahara Gas Pipeline.
Financial Times [18 May, 2009], Nabucco hopes grow after $8 billion Iraqi gas deal.
Financial Times [26 June, 2009], Gazprom's $2.5 billion gas deal with Nigeria raises European concerns.
Financial Times [2 October, 2009], Russia: Gazprom faces problems at home and abroad.
Financial Times [14 October, 2009], Russian gas supply deal with China hits deadlock.
Financial Times [13 November, 2009], Medvedev calls for reforms.
Financial Times [18 May, 2010], Medvedev covets Ukraine gas as relations improve.
Finon, D. [2002], The Liberalisation of the European gas market and its consequences for Russia, Grenoble: Institut d'Economie et de Politique de l'Energie.
Finon, D. [2007], La Russie et l'"OPEP du gaz": Vraie ou fausse menace? (Russia and "gas OPEC": A real or perceived threat?), Paris: Intitut Français des Relations Internationales.
Fredholm, M. [2005], The Russian Energy Strategy and Energy Policy: Pipeline diplomacy or mutual dependence, Watchfield: Conflict Studies Research Centre.
Gagné, J. F. [2007], Geopolitics in a Post-Cold War context: From geo-strategic to geo-economic considerations? Montréal: Raoul Dandurand Chair of Strategic and Diplomatic Studies.
Gas Exporting Countries Forum [December 2009], GECF - Promoting dialogue and coop-eration. Available at: <http://www.gecforum.org/>.
Gas Matters [June, 2008], Shell and Repsol accept Iran's South Pars realities.
Gas Matters [June, 2008], Gazprom seeks a share in ENI's Greenstream pipeline.

383
Gas Matters [April, 2009], When is a gas cartel not a gas cartel? When it's an LNG cartel.
Gas Strategies [2006], The Outlook for European Gas, London: Gas Strategies Group Ltd.
Gazprom [2006], OAO Gazprom Annual Report 2005, Moscow: Gazprom.
Gazprom [2007], OAO Gazprom Annual Report 2006, Moscow: Gazprom.
Gazprom [2008], Gazprom in Questions and Answers, Moscow: Gazprom.
Gazprom [2008], OAO Gazprom Annual Report 2007, Moscow: Gazprom.
Gazprom [2009], Gazprom in Questions and Answers, Moscow: Gazprom.
Gazprom [2009], OAO Gazprom Annual Report 2008, Moscow: Gazprom.
Gazprom [April 2007], Gazprom Becomes Shareholder of Sakhalin 2 Project. Available at: <http://www.gazprom.com/>.
Gazprom [March 2008], History of the gas branch. Available at: <http://www.gazprom.com/about/history/>.
Gazprom [May 2010], On working meeting between Alexey Miller and Yury Boiko. Available at: <http://www.gazprom.com/>.
Gazprom Marketing and Trading [2009], Annual Report 2008, London: Gazprom Mar-keting and Trading.
Gazpromexport [2008], Special Issue: The 35th Anniversary of OOO Gazprom Export, Mos-cow: Gazprom.
Global Insight [2006], European natural gas supply and demand report; outlook to 2030, London: Global Insight.
Gustafson, T. [1985], Soviet Negotiating Strategy, Santa Monica, CA: RAND Corporation.
Gustafson, T. and C. Telyan [2007], Russia’s Gas Transit Strategy, 1995-2007. The Great Turning Point in Russian Gas, Cambridge: Cambridge Energy Research Associates.
Gustafson, T., and M.J. Sager [2003], Gas Transit Through Ukraine: The Struggle for the Crown Jewels, Cambridge: Cambridge Energy Research Associates.
Hallouche, H. [2006], The Gas Exporting Countries Forum: Is it really a Gas OPEC in the making?, Oxford: Oxford Institute for Energy Studies.
Hartley, P. R. and K. B. Medlock III [2008], The Future of Russian Natural Gas Exports, Houston: James A. Baker III Institute for Public Policy of Rice University.

384
Hill, F. [2004], Energy Empire: Oil, Gas and Russia's Revival, London: The Foreign Policy Centre.
Hubert, F. and I. Suleymanova [2008], Strategic Investment in International Gas Transport Systems: A Dynamic Analysis of the Hold-up Problem (Discussion Paper 846), Berlin: Deutsches Institut für Wirtschaftsforschung.
International Energy Agency [2005], World Energy Outlook 2005, Paris: IEA/OECD.
International Energy Agency [2006], Ukraine. Energy Policy Review 2006, Paris: IEA/OECD.
International Energy Agency [2007a], Natural Gas Market Review 2007, Paris: IEA/OECD.
International Energy Agency [2007b], Natural Gas Information 2007, Paris: IEA/OECD.
International Energy Agency [2007c], World Energy Outlook 2007, Paris: IEA/OECD.
International Energy Agency [2008a], Natural Gas Market Review 2008, Paris: IEA/OECD.
International Energy Agency [2008b], Natural Gas Information 2008, Paris: IEA/OECD.
International Energy Agency [2008c], World Energy Outlook 2008, Paris: IEA/OECD.
International Energy Agency [2008d], Perspectives on Caspian Oil and Gas Developments, Paris: IEA/OECD.
International Energy Agency [2009a], Natural Gas Market Review 2009, Paris: IEA/OECD.
International Energy Agency [2009b], Natural Gas Information 2009, Paris: IEA/OECD.
International Energy Agency [2009c], World Energy Outlook 2009, Paris: IEA/OECD.
Janssen, E. [2004], Russische olie: groeimarkt of valkuil? Olie-industrie, investeringsklimaat en buitenlandse investeerders in Rusland (Russian oil: growth market or pitfall? Oil-industry, investment and foreign investors in Russia), The Hague: Clingendael International Energy Programme.
Jensen, J. T. [2004], The Development of a Global LNG Market: Is it likely? If so when? Oxford: Oxford Institute for Energy Studies.
Jaffe, A. M. and R. Soligo [2010], State-backed Financing in Oil and Gas Projects, in: A. Goldthau and J. M. Witte [Eds.], Global Energy Governance: The New Rules of the Game, Baltimore, MD: Brookings Institute Press, pp. 107-132.

385
Joode, de J., F. van Oostvoorn [2007], Investing in gas and electricity corridors in Europe. An analysis of investment conditions, Petten: Energieonderzoek Centrum Nederland (En-ergy research Centre of the Netherlands).
Journal of Energy Security [14 December, 2008], Gas Exporting Countries Forum: The Russian-Iranian Gas Cartel.
Khajehpour [February 2009], Iran's Strategic Considerations in Assessing the Nabucco Pro-ject, Clingendael International Energy Programme. Available at: <http://www.clingendael.nl/ciep/events/20090213/>
Kommersant [12 March, 2008], Central Asia's gas to become European for Ukraine.
Lecarpentier, A. [2006], Liberalization of Gas Markets in Europe, Institut Français du Pétrole [IFP], The Panorama technical reports.
LNG Journal [June, 2007], LNG futures contract could emerge as hub plans multiply.
LNG Journal [May, 2007], Transatlantic LNG arbitrage activity will grow as market trad-ing system matures.
LNG Journal [April, 2008], LNG market may soon see emergence of regular auctions for spot cargoes.
Locatelli, C. [2008], EU Gas Liberalization as a driver of Gazprom's Strategies, Paris: Insti-tut Français des Relations Internationales.
Meijknecht, J. [2008], Bedrijfsbelangen Gazprom in EU-27 in 2007 (Gazprom's Business Interests in EU-27 in 2007), The Hague: Clingendael international Energy Programme.
Middle East Economic Survey [14 August, 2006], Sonatrach signs MoUs with Russia's Lukoil and Gazprom.
Middle East Economic Survey [22 January, 2007], TAQA Buys Talisman Stake in North Sea Brae Area Fields For $550Mn.
Middle East Economic Survey [11 June, 2007], US remains keen on Trans-Caspian Gas Pipeline.
Middle East Economic Survey [10 March, 2008], Algeria pursues gas export plans ahead of production hike.
Middle East Economic Survey [28 April, 2008], Dubai LNG Début to Set New Regional and Global Benchmarks.
Middle East Economic Survey [26 May, 2008], Azerbaijani, Turkmen leaders meet in Baku for Caspian Energy Talks.
386
Middle East Economic Survey [14 July, 2008], Sonatrach targets better pricing terms through short-term gas sales contracts.
Middle East Economic Survey [21 July, 2008], Kazakhstan-China Gas Pipeline Construc-tion Under Way.
Middle East Economic Survey [6 October, 2008], Kazaisadeh Picks Up Loose Ends of Iran's Gas Export Plans.
Middle East Economic Survey [27 October, 2008], "Big Gas Troika" formed by Russia, Iran, and Qatar to coordinate gas policy.
Middle East Economic Survey [2009], Turkmen gas reserves hike.
Middle East Economic Survey [5 January, 2009], GECF takes first step towards pursuing international gas agenda.
Middle East Economic Survey [24 August, 2009], Putin's visit to Ankara signals partial shift in Russian gas strategy.
Ministry of Energy and Natural Resources [2007], Energy Statistics of Turkey, Ankara: Ministry of Energy and Natural Resources.
Nefte Compass [20 November, 2008], Gazprom extends global reach.
Nefte Compass [20 August, 2009], Turkmens put Iran pipe on fast track.
Nemtsov, B. and V. Milov [2008], Putin and Gazprom: An independent expert report, Mos-cow: Institute of Energy Policy.
Newsweek [8 November, 2004], America's Assignment.
Newsweek [6 April, 2006], War of wills.
Nord Stream AG [2009], The Pipeline: Contractual Information. Available at: <http://www.nord-stream.com/en/press0/publications.html>.
Observatoire Méditerranéen de l'Énergie [2007], Supply and Market Security Issues: Europe and its suppliers (OME Discussion Paper), Nanterre: OME.
Organisation for Economic Cooperation and Development [2002], Reviews of Regulatory Reform: Regulatory Reform in Turkey, Paris: OECD.
Organisation for Economic Cooperation and Development [2002], Reviews of Regulatory Reform: Regulatory Reform in Turkey, Paris: OECD.
Platts LNG Daily [5 December, 2008], UAE's Taqa, Russian Gazprom form Netherlands gas storage joint venture.

387
Petroleum Economist [January, 2007], What is the South Caucasus Pipeline?
Petroleum Economist [January, 2007], All eyes turn to Yamal.
Petroleum Economist [May, 2007], The struggle to market.
Petroleum Economist [May, 2007], Breaking all records.
Petroleum Economist [June, 2007], More gas, anyone?
Petroleum Economist [April, 2008], Pearl GtL: A gem of a project, so long as it works.
Petroleum Economist [October, 2008], Gas and Gazprom.
Petroleum Economist [May, 2009], Dreams of Gazprom.
Platts International Gas Report [6 June, 2006], Russia Grants Export Monopoly.
Platts International Gas Report [3 December, 2007], Central Asia, Russia compete for China.
Platts International Gas Report [December, 2007], Russian Gas Exchange: 8.5 bcm sold.
Platts International Gas Report [28 January, 2008], Turkmenistan finds giant field.
Platts International Gas Report [7 April, 2008], Turkmenistan-Pakistan line: Recalled to life.
Platts International Gas Report [21 April, 2008], Russia ties the knot with Libya.
Platts International Gas Report [30 June, 2008], Gazprom sets out its short-term vision.
Platts International Gas Report [25 August, 2008], Libya's minister meets Gazprom.
Platts International Gas Report [25 August, 2008], Turkmenistan finds major field.
Platts International Gas Report [3 November, 2008], Kazakhstan, China link gas deal.
Platts International Gas Report [3 November, 2008], Russia, Iran and Qatar Form Gas-OPEC's Core.
Platts International Gas Report [17 November, 2008], Iran, Qatar and Russia mull South Pars.
Platts International Gas Report [20 November, 2009], Turkmen audit finds a giant.
Platts LNG Daily [5 February, 2010], Shtokman delayed three years; LNG seen in 2017.
Reuters [15 November, 2007], Russia's Gazprom ups Shtokman reserves to 3.8 tcm.
RIA Novosti [10 March, 2006], Russia to write off Algeria's entire $4.7 billion debt.
388
RIA Novosti [27 June, 2006], Putin reaches out to China, India.
RIA Novosti [14 August, 2006], Gazprom, Kazakhstan Discuss Gas Processing Plant JV.
RIA Novosti [21 January, 2007], Algerian company picks up four Gazprom offered depos-its for asset swap.
RusEnergy [2005], Putin and Gazprom: Decision-making on gas projects in Russia, Moscow: RusEnergy.
Russian Ministry of Industry and Energy [2003], A Summary of the Energy of Russia for the Period up to 2020, Moscow: Russian Ministry of Industry and Energy.
Southeast European Co-operative Initiative [1998], Interconnection of Natural Gas Net-works, Diversification of Gas Supply and Improvement of Security of Supply in Southeast Europe, Washington, D.C.: US State Department/SECI.
State Planning Organisation [2005], Pre-Accession Economic Programme, Ankara: State Planning Organisation.
Stern, J.P. [1993], Oil and Gas in the Former Soviet Union. The Changing Foreign Invest-ment Agenda, London: Royal Institute of International Affairs.
Stern, J. P. [2005], Gas Pipeline Cooperation between Political Adversaries: Examples from Europe, London: Chatham House.
Stern, J. P. [2006], The Russian-Ukrainian Gas Crisis of January 2006, Oxford: Oxford Institute for Energy Studies.
Stern, J. P. [2009], Continental European Long-Term Gas Contracts: Is a transition away from oil product-linked pricing inevitable and imminent?, Oxford: Oxford Institute for En-ergy Studies.
Stiglitz, J. E. [1995], Whither Socialism, Cambridge, MA: MIT Press.
The Economist [18 July, 2009], Face value: Turning up the gas.
The Moscow Times [1 February, 2007], Gas find could threaten Kovytka.
The Moscow Times [23 February, 2007], Putin's Middle East tour in the context of the Munich speech.
The Moscow Times [10 April, 2007], Khristenko backs gas pricing group.
The Moscow Times [17 April, 2007], Russia opposes IMF move to regulate windfall funds.
UBS Investment Research [2006], Russian Gas - Gas Everywhere... But Enough to Burn?, Zurich: UBS.

389
UBS Investment Research [2008], "Gazprom" Stands for Gas Industry, Zurich: UBS.
UNIDO and Chiyoda Corp. [1994], Premises Development Study on a Gas Trunkline Loop over Middle Eastern Countries. Unpublished work; available from the dissertation's author on request.
US Department of Energy [2008], Kazakhstan: Country Information Analysis, Washington, D.C.: Energy Information Administration.
Van Agt [2009], Tabula Russia. Escape from the Energy Charter Treaty (Clingendael Briefing paper), The Hague: Clingendael International Energy Programme.
Van der Linde, C. [2005], Energy in a Changing World - Inaugural Lecture (Clingendael Energy Papers No. 11), The Hague: Clingendael International Energy Programme/Energy Delta Institute.
Van der Linde, C. [2007], Turning a Weakness into a Strength: A Smart External Energy Policy for Europe, Paris: Institut Français des Relations Internationales.
Van der Linde, C., A. Correljé, J. De Jong, and C. Tönjes [2006], The Paradigm Change in International Natural Gas Markets and the Impact on Regulation (Report for the WGC), The Hague: Clingendael International Energy Programme.
Van der Linde, C., R. van Dorssen en G. Greving [2007], Public-Private Partnership and the Dutch Small Field Policy. Certain Dutch elements applied in the Russian Federation, The Hague/Moscow: Energy Delta Institute.
Van der Linde, C. [15 March, 2007], Een Nuttig Reisje (A Useful Trip), Energie Neder-land.
Van der Linde, C. [6 November, 2007], Rusland Weet Energiediplomatie en Commercie te Combineren (Russia Knows how to Combine Energy Diplomacy and Business), Energie Nederland.
Van der Linde, C. [8 April, 2008], Machtspolitiek (Power politics), Energie Nederland.
Van Witteloostuijn, A., S. Brakman, M. Haan, and C. Van Marrewijk [2004], The Future of the Dutch Natural Gas Market: Regulatory policy, market reform and international compe-tition in a turbulent Europe, Groningen: Research School Systems, Organization and Man-agement (SOM).
Victor, N. M. [2008], Gazprom: Gas Giant Under Strain, Stanford, CA: Stanford Univer-sity: Program on Energy and Sustainable Development.
Wall Street Journal Europe [27 November, 2009], Russian pipelines gets acceptance from US.

390
WINGAS GmbH [2006], Annual report 2005. E=mc². More energy – together, Kassel.
WINGAS GmbH [2008], Annual report 2007, Kassel.
World Bank [2004], Russian Economic Report, Washington, D.C.: World Bank.
World Bank [2007], Russian Economic Report, Washington, D.C.: World Bank.
World Bank [2008], Russian Economic Report 16, Washington, D.C.: World Bank.
World Bank [April 2008], Economy-Wide and Sector Effects of Russia's Accession to the WTO, World Bank. Available at: <http://web.worldbank.org/WBSITE/EXTERNAL/TOPICS/TRADE/0,,contentMDK:20126383~menuPK:207652~pagePK:148956~piPK:216618~theSitePK:239071,00.html>.
World Gas Intelligence [12 March, 2006], Gazprom, China Deal Has Western Angle.
World Gas Intelligence [23 July, 2006], Floating LNG storage play afoot in LNG market.
World Gas Intelligence [16 May, 2007], Russia's Central Asian Score.
World Gas Intelligence [25 July, 2007], Qatar, Russia Eye Super Swap.
World Gas Intelligence [30 January, 2008], Russia's Independent Gas Exchange Grows.
World Gas Intelligence [16 April, 2008], South Stream not looking so invincible.
World Gas Intelligence [14 May, 2008], Qatargas almost done diverting.
World Gas Intelligence [3 September, 2008], China Signs Turkmen, HK Deals.
World Gas Intelligence [12 November, 2008], Gas Troika ambitions.
World Gas Intelligence [31 December, 2008], Troika outshines GECF.
World Gas Intelligence [4 February, 2009], Turkmenistan supply for South Stream?
World Gas Intelligence [11 March, 2009], Qatargas sales strategy.
World Gas Intelligence [25 March, 2009], Russia seeks outlets as sales plummet.
World Gas Intelligence [22 April, 2009], Blast Exposes Russian, Turkmen Tensions.
World Gas Intelligence [22 April, 2009], Qatar East Europe Foray.
World Gas Intelligence [13 May, 2009], No Troika for Qatar.
World Gas Intelligence [20 May, 2009], Questions surround Kurdish gas deal.
World Gas Intelligence [20 May, 2009], Gazprom's latest South Stream push.

391
World Gas Intelligence [27 May, 2009], Qatar raring to compete.
World Gas Intelligence [1 July, 2009], GECF's peculiar popularity.
World Gas Intelligence [22 July, 2009], RWE's Turkmen upstream progress.
World Gas Intelligence [14 October, 2009], Russia Going After China Deal – Hard.
World Gas Intelligence [9 December, 2009], Gazprom LNG rivals?
World Gas Intelligence [9 December, 2009], Time ripe for GECF - or is it?
World Gas Intelligence [16 December, 2009], South Stream revolution.
World Gas Intelligence [27 January, 2010a], Nord Stream Finds Financing.
World Gas Intelligence [24 February, 2010b], Gazprom Blinks.
World Gas Intelligence [21 April, 2010c], GECF falls short of spot sales deal.
World Gas Intelligence [6 January, 2010d], Russia Set To Resume Turkmen Imports.

392
393
Index
A
Algeria
• and Sonatrach | 3, 15, 33, 44, 120, 125, 154, 155, 176, 178-179, 189, 192-193, 204, 207-208, 211, 244, 251-252, 268, 272, 275-276, 280-282, 286, 297, 302, 306-307, 327, 330, 354.
Arab Gas Pipeline (AGP) | 279, 279.
Azerbaijan | 15, 112, 136-137, 139, 178, 195, 196-197, 203-204, 211, 223, 230, 249-250, 252-253, 268-269, 272, 275, 278, 282, 327, 330-331, 333, 336, 354-355. B
Base case | 90, 94-95, 105-106, 258-260, 262, 264-266, 281, 288, 290-293, 296, 311-312, 314-320, 322. Binomial valuation | 65, 90, 98-99. Brezhnev | 113-114, 124. Brotherhood | 121, 351. C
Capital Expenditures (CAPEX) | 25, 79, 100-102, 250, 258-259, 288, 291, 312, 314-315.
Cartel | 53, 75, 86, 94, 104, 210, 347, 359-360. Caspian Development Corporation
(CDC) | 172, 200, 287. Central Asia Center (CAC) pipeline | 138, 199, 218, 245, 272.
Central European Gas Hub (CEGH) | 275, 277, 301. Centrally-planned economy | 126, 128. Chernomyrdin | 115, 130, 133. Collusion, see cartel.
Commercial investment | 73, 79-81, 90, 92, 101-104, 258-259, 264-265, 285, 288-290, 292, 311-313, 316, 357.
Commitment value | 71, 82-83, 90, 92, 94, 100, 104-105, 264, 292, 297, 316, 321 350. Commonwealth of Independent States
(CIS) | 2-3, 43, 127, 129, 131, 136, 137-138, 140, 146, 169, 171-172, 175, 178-179, 195, 204, 207, 215-216, 219-221, 223, 225, 228-231, 234, 284, 333, 340, 343, 351, 366.
Competitive fringe | 88. Corporate finance | 8, 38, 56-57, 60-62, 64, 72, 74-75, 77-78, 349, 363.
D
Decision tree | 67, 70, 90, 95, 97, 98, 99, 259, 290, 313.
Direct competition | 53, 86, 104.
Direct value | 92, 105-106, 264, 266, 268, 292, 294, 296, 316.
Discounted Cash Flow (DCF) method | 62-66, 89. Dynamic market theory
• definition of Coordination
mechanisms | 52.
• Coordination mechanisms | 38, 255, 285, 309-310, 335.
E
Economic rent | 26, 35, 37, 46-48, 56-57, 60, 61, 63, 74, 284, 325, 340, 345, 348.
Energy Charter (Treaty) | 85, 151, 160, 162, 172, 234, 257, 302. Euro-Atlantic | 10, 168-170, 284, 286.
Entry deterrence | 4, 62, 71, 75, 78, 89, 92, 349.

394
F
Five-forces model | 58.
G
Gas
• corridor | 15, 19, 23, 31, 43, 113, 121, 123, 135, 138, 140, 171, 257, 271-272, 279-280, 283, 285-286, 295, 327, 331.
• unconventional | 1, 3, 5, 170, 175, 181, 187, 189, 190, 254, 326, 331, 336, 353.
• value chain | 4, 8, 15-18, 20, 26, 35, 44-45, 74, 77-78, 89, 127, 149, 151, 205, 213, 235, 240, 286, 334, 348, 351.
Gas for pipe agreement | 123, 125, 351. Gas-to-gas competition | 34, 152, 182, 184, 189, 275, 353. Gas Exporting Country Forum (GECF)
| 86, 209, 210, 212-213, 310, 354, 359, 359, 382.
• and Gas Troika | 210, 212, 354, 359, 386.
Gazprom • and independent gas produc-
ers | 134, 215-216, 218, 223, 226-227.
• Marketing and Trading | 229, 236, 297, 300, 305-306, 310, 320, 323, 333, 336, 343, 345, 357.
Glasnost | 114. Gorbachev | 128. H
Henry Hub | 22, 180, 187. I
Institutionalisation
• organisational | 85-86.
• financial | 85-87, 255, 285, 309.
Integration
• horizontal | 22, 26, 28, 35, 50.
• vertical | 8, 22, 26, 27-28, 32, 44, 47, 49, 52, 52, 75, 157, 191, 193, 215, 235.
International Monetary Fund (IMF) | 41, 130, 133, 150, 171, 227, 246, 269, 274, 286, 388.
International political economy (IPE) | 37, 39, 348, 350. Intermediary
• Eural Transgaz | 142. • Itera | 132-133, 138-143, 146, 218, 230, 341.
• RosUkrEnergo | 341, 342. Iran
• and National Iran Oil Com-
pany (NIOC) | 198, 245, 256, 272.
• and ISA sanctions | 279, 282. K
Kazakhstan | 113, 127, 136-139, 175, 181, 194-195, 197, 199, 200-204, 209, 211, 216, 218-219, 223, 228-230, 233, 238, 244, 250-253, 277, 284, 286, 354. Khrushchev | 112, 121, 124. L
Lerner index
• definition of | 54.
• application of | 207-209. Loans-for-share programme | 131-132.
Long-Run Marginal Costs (LRMC) | 83, 204-208.

395
M
Managerial flexibility | 56, 62, 64-66, 69, 73, 81.
Market outcomes |
• and equilibria | 52, 61, 70, 88, 90, 92, 94-95, 98-100, 105-108, 259, 263, 290-291, 313, 315.
Medvedev | 4, 133-134, 224, 239, 382.
Mergers and Acquisitions (M&As) | 28, 52-53, 75, 86, 153, 236, 274, 337.
Merit order | 10, 38, 54, 74, 77, 89, 215, 239, 241, 323, 332, 333, 345, 348, 350, 358. Miller | 133-134. Moscow | 112, 115, 123, 127-129, 136-137, 145, 149, 151, 159, 195, 234. N
Naftogaz | 141, 341-342.
National Balancing Point (NBP) | 22, 179, 236-237, 275, 301-302, 344, 344. North Atlantic Treaty Organization
(NATO) | 136, 150-151, 168-169, 171, 173.
Netback | 16-17, 22, 126, 183-184, 199, 228, 230, 235, 282, 333.
Netherlands, the | 15, 55, 118-121, 125, 135, 145, 152, 154-155, 176, 178, 193, 206-209, 211, 233, 234, 235, 272, 275-276, 298-305, 308-309, 328, 354. Norway
• and StatoilHydro | 58, 196, 218, 224, 225, 245, 272, 283.
O
Oil price indexation | 179, 189, 204-205, 353. Oligopoly | 69, 111, 119.
Operational Expenditures (OPEX) | 25, 79, 100. 266, 294, 318.
Option-pricing model | 65. Orange Revolution | 144, 341. Organisation of Petroleum Exporting
Countries (OPEC) | 42, 86, 133, 175, 192, 210, 213, 221, 257.
Overall Net Project value | 73, 89, 92, 106, 259, 263-267, 291-295, 315-319, 322, 350, 356. P
Path dependency | 9, 48, 57, 77, 85, 124, 168, 231, 352. Perestroika | 114, 128, 370.
Postponement value | 82-83, 92-93, 94, 104, 106, 264, 291-292, 297, 315-316, 321, 350. Pre-commitment | 70, 78, 350, 372.
Price competition | 5-6, 60, 70, 89, 91, 93-94, 96, 347, 349, 359, 363.
Principal-agent relationship | 47, 52, 74.
Production Sharing Agreement (PSA) | 17, 196, 198, 201.
Proprietary case | 90, 95, 96, 101, 103, 258-260, 267, 288-289, 291-295, 312-315, 317-320.
Proprietary investment | 91, 94, 96, 101, 258, 260, 263, 265, 288-289, 292, 312-313, 315-316. Putin | 41-43, 133-134, 147, 168-169, 199, 221-225, 284, 341, 342, 366, 368, 370, 386, 388. Q
Qatar
• and Qatar Petroleum | 307, 321, 380.
R
Ramp-up period | 25-26, 80, 100-101, 258, 261, 288.

396
Real-options approach | 8, 56-57, 62, 64, 66, 69, 75, 89, 104.
Real-option game model | 6, 9-10, 56, 62, 67, 72, 77-78, 89-90, 95-96, 100, 104, 262, 268, 287, 311, 321-322, 349-350, 354, 356, 360-363.
Relative advantage | 38-40, 42-43, 74, 168, 215, 310, 348, 358. Risk
• commercial | 21, 27.
• macroeconomic | 21, 35.
• political | 20-21, 28, 31, 139, 156, 248, 279, 283-284, 338.
• profile analysis | 21.
• mitigation | 8, 15, 18, 22, 26, 29, 87, 338.
Risk-neutral probability |67-68. Rosneft | 2, 42, 129, 218-219, 222-223, 226. Russia
• 1998 financial crisis | 132-134, 143, 161, 246, 254, 270.
• and Central Asia | 136-141, 169-171, 194, 201, 219, 230, 240.
• and debt-for-equity swap | 135, 225, 283, 233, 235-236, 310, 352, 357.
S
Scenario analysis | 186, 325, 328.
Shah Deniz | 139, 196, 196-197, 203, 218, 269, 279, 331. Shanghai Cooperation Organisation (SCO) | 136, 171.
Shared investment | 53, 80-81, 86, 89, 93-95, 213, 286, 296-297, 320, 363.
Shipper | 16-19, 22-26, 29, 31-32, 35, 133, 140, 146, 279. Shock therapy | 129.
Short-Run Marginal Costs (SRMC) | 79, 83. Shtokman | 134, 145, 158, 204, 206, 217-219, 229, 234, 237, 239-241, 304, 306, 308, 333, 336, 338, 345, 358. Siberia | 4, 113, 121, 124, 159, 170, 216, 217-219, 234, 237-238, 241, 333, 338, 380.
Socio-economic agenda | 1, 11, 37, 38, 44, 47, 54-55, 74, 146, 194, 348, 363.
Sovereign Wealth Fund (SWF) | 48.
South Caucasus Pipeline (SCP) | 139, 170, 196, 206, 245, 268-269, 272, 276. Soyuzgasexport | 115, 123. Spot market | 33, 152, 179, 183, 237, 301-302, 336, 344. Stalin | 112, 121, 124, 197.
Strange | 38-40, 43, 74.
Strategic pre-emption value | 90, 92, 106, 355.
Strategic reaction value | 90, 92, 106, 264, 292, 316, 355.
Structural power | 39-43, 74, 171, 348. Sunk cost | 44, 71, 256, 268. T
Tabriz-Erzurum pipeline| 139, 248, 252, 279.
Title Transfer Facility (TTF) | 22, 236-237, 301, 344.
Third party access (TPA) | 23, 81, 225, 247, 278, 284, 296-297, 308, 320, 323, 338, 357, 361.
Transmission system operator (TSO) | 19-20, 286, 332. Trans-Caspian Gas Pipeline (TCGP) | 139, 200, 202-203, 206, 245, 249-250, 252-254, 257, 269, 272, 280.
Trans-Sahara Gas Pipeline (TSGP)| 281. Turkmenistan-Afghanistan-Pakistan-
India (TAPI) pipeline | 200.

397
U
United Gas Transmission System (UGTS) | 2, 20, 115, 133, 138, 140, 194-195, 217, 219, 234, 312. Uzbekistan | 127, 135-138, 194-195, 199, 202-204, 211, 216, 219, 223, 244-245, 272, 284, 354, 379. V
Viakhirev | 130, 132, 134. Voucher privatisering | 130-131, 145.
W
White Stream | 271, 280. World Trade Organisation (WTO) | 85, 133, 150, 227. Y
Yamal | 4, 113, 134, 159, 161-162, 194, 204, 206, 216-219, 227, 229, 237, 239-241, 306-308, 336-338, 345, 358. Yamal-Europe pipeline | 31, 143-146, 156, 158-162, 206, 229, 234, 299, 304, 332, 342-343, 352-353, 355. Yeltin | 129-133, 168, 222. Z
Zero-sum game | 69.


Published by the Clingendael International Energy Programme
of the Netherlands Institute of International Relations Clingendael
This study deals with Gazprom’s investment strategy regarding Russia’s gas exports and export market behaviour, with a focus on European infrastructure projects, in a the geopolitical context.
Because of its large gas reserves, Russia is well-positioned to take advantage of gas exports even as it faces possible competition from other gas suppliers and uncertain gas demand. Gas export earnings are an important source of income for Russia. As a government-controlled firm, Gazprom depends to a large extent on Europe for its hard-currency income.
For Russia and Gazprom, the stream of income from gas exports and its expansion are economically vital. In this regard, gas export infrastructures such as Nord and South Stream could act as important instruments to expand Gazprom’s market share in current markets and in growth markets. This study uses a real-option game model to assess the overall value of gas infrastructures in the face of demand uncertainties and potential competition. The result of this approach illustrates the strategic-economic character of Gazprom’s infrastructure investments in possibly creating a first-mover’s advantage.
Yet, the model is of a highly stylised nature. Therefore, other aspects should be taken into account in assessing gas infrastructure investments. Besides the goal of possibly expanding Gazprom’s market share, infrastructure investments could serve to mitigate overall transit risks. However, Gazprom’s organisational constraints in realising gas infrastructures could put into question the rationale of such investments. In addition, Gazprom’s position as well as that of Russian gas may be pressured by European (regulatory) policy in favour of alternative gas and other energy sources. The desired market outcomes for Gazprom have an impact on the prioritisation of Russian investments in the gas value chain.