Embed Size (px)
Citation preview
July 2012
Russian Market of Agro Products
Desk Research
1
Ru
ssia
n M
arke
t o
f A
gro
Pro
du
cts
| 20
12
TABLE OF CONTENTS ABSTRACT .......................................................................................................................................... 2
KEY FACTS ABOUT RUSSIA .................................................................................................................... 3
CROP RAISING AND FOOD PROCESSING INDUSTRIES ................................................................................. 5
GRAIN CROPS ...................................................................................................................................... 6
WHEAT ........................................................................................................................................... 7
RYE ................................................................................................................................................ 8
BARLEY .......................................................................................................................................... 8
RICE ............................................................................................................................................. 10
GRAIN CROPS PROCESSING .............................................................................................................. 17
BREWING INDUSTRY ....................................................................................................................... 21
OIL-BEARING CROPS .......................................................................................................................... 23
OIL-BEARER CULTURES PROCESSING ................................................................................................ 25
VEGETABLE CROPS ............................................................................................................................ 27
POTATO CROPS ............................................................................................................................. 30
ETHANOL AND ETHYL ALCOHOL INDUSTRY ........................................................................................ 32
SUGAR INDUSTRY ........................................................................................................................... 34
GARDENING AND WINEGROWING ....................................................................................................... 37
MEDICAL HERBS ............................................................................................................................. 41
TOBACCO ..................................................................................................................................... 42
FLAX ............................................................................................................................................ 45
LIVESTOCK BREEDING ......................................................................................................................... 47
MEAT PRODUCTION ............................................................................................................................ 47
BEEF ............................................................................................................................................ 50
PORK ........................................................................................................................................... 54
POULTRY ...................................................................................................................................... 56
MEAT PROCESSING ..........................................................................................................................57
DAIRY MARKET .............................................................................................................................. 59
EGG MARKET ..................................................................................................................................... 65
FISH PRODUCTION .............................................................................................................................. 68
STATE SUPPORT FOR AGRICULTURE ...................................................................................................... 74
INVESTMENT POTENTIAL ...................................................................................................................... 77
INVESTMENT ATTRACTIVENESS EVALUATION WITH A BREAKDOWN INTO INDUSTRIES ................................ 78
EXPERTS OPINION ON THE PROSPECTS OF RUSSIAN-INDIAN RELATIONS IN TRADE AND INVESTMENTS ............. 83
APPENDIXES .................................................................................................................................. 85
REFERENCES .................................................................................................................................... 110
EXPERTS ...................................................................................................................................... 110
OFFICIAL RESOURCES AND STATISTICS ............................................................................................. 110
ANALYTICAL REVIEWS ................................................................................................................... 110
INTERNET RESOURCES ................................................................................................................... 111
2
Ru
ssia
n M
arke
t o
f A
gro
Pro
du
cts
| 20
12
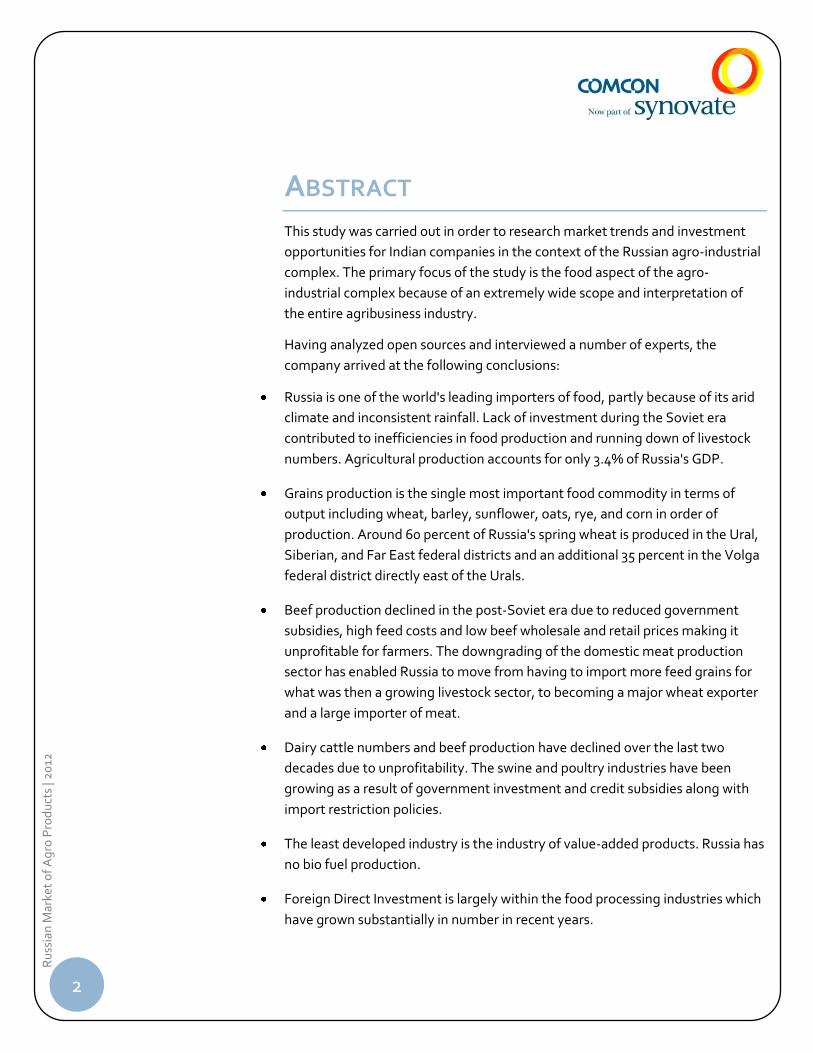
ABSTRACT This study was carried out in order to research market trends and investment
opportunities for Indian companies in the context of the Russian agro-industrial
complex. The primary focus of the study is the food aspect of the agro-
industrial complex because of an extremely wide scope and interpretation of
the entire agribusiness industry.
Having analyzed open sources and interviewed a number of experts, the
company arrived at the following conclusions:
Russia is one of the world's leading importers of food, partly because of its arid
climate and inconsistent rainfall. Lack of investment during the Soviet era
contributed to inefficiencies in food production and running down of livestock
numbers. Agricultural production accounts for only 3.4% of Russia's GDP.
Grains production is the single most important food commodity in terms of
output including wheat, barley, sunflower, oats, rye, and corn in order of
production. Around 60 percent of Russia's spring wheat is produced in the Ural,
Siberian, and Far East federal districts and an additional 35 percent in the Volga
federal district directly east of the Urals.
Beef production declined in the post-Soviet era due to reduced government
subsidies, high feed costs and low beef wholesale and retail prices making it
unprofitable for farmers. The downgrading of the domestic meat production
sector has enabled Russia to move from having to import more feed grains for
what was then a growing livestock sector, to becoming a major wheat exporter
and a large importer of meat.
Dairy cattle numbers and beef production have declined over the last two
decades due to unprofitability. The swine and poultry industries have been
growing as a result of government investment and credit subsidies along with
import restriction policies.
The least developed industry is the industry of value-added products. Russia has
no bio fuel production.
Foreign Direct Investment is largely within the food processing industries which
have grown substantially in number in recent years.
3
Ru
ssia
n M
arke
t o
f A
gro
Pro
du
cts
| 20
12
KEY FACTS ABOUT RUSSIA With a total area of over 17 million km2, the Russian Federation is the largest
country in the world. It covers the eastern part of Europe and the northern part
of Asia. It has access to the Arctic Ocean in the north, the Pacific Ocean in the
east, the Black Sea and the Caspian Sea in the southwest, and the Baltic Sea in
the northwest. It borders 14 countries: Korea DPR, China, Mongolia,
Kazakhstan, Azerbaijan, Georgia, Ukraine, Belarus, Latvia, Estonia, Finland,
Norway and, with the province (oblast) of Kaliningrad, Poland and Lithuania.
In 2010, agriculture employed 7.9% of the economically active population, or
5,5 million of people. In 2011, agriculture accounted for 3,4% of GDP.
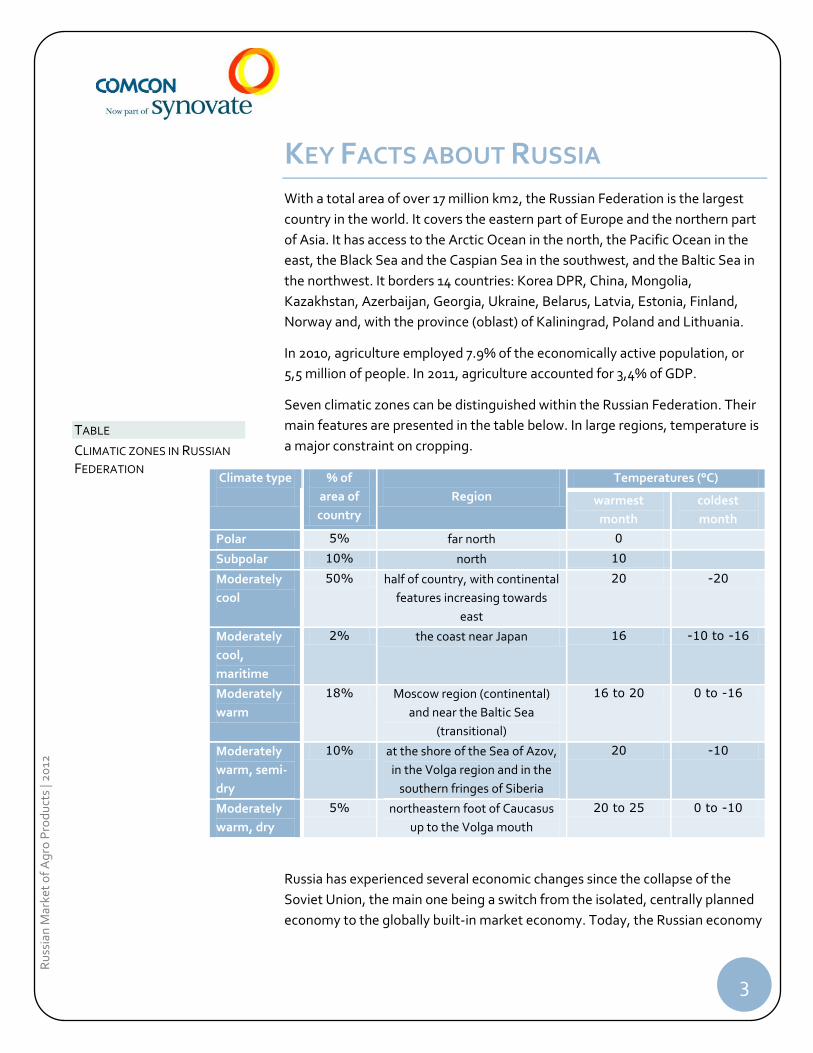
Seven climatic zones can be distinguished within the Russian Federation. Their
main features are presented in the table below. In large regions, temperature is
a major constraint on cropping.
Climate type
% of
area of
country
Region
Temperatures (°C)
warmest
month
coldest
month
Polar 5% far north 0
Subpolar 10% north 10
Moderately
cool
50% half of country, with continental
features increasing towards
east
20 -20
Moderately
cool,
maritime
2% the coast near Japan 16 -10 to -16
Moderately
warm
18% Moscow region (continental)
and near the Baltic Sea
(transitional)
16 to 20 0 to -16
Moderately
warm, semi-
dry
10% at the shore of the Sea of Azov,
in the Volga region and in the
southern fringes of Siberia
20 -10
Moderately
warm, dry
5% northeastern foot of Caucasus
up to the Volga mouth
20 to 25 0 to -10
Russia has experienced several economic changes since the collapse of the
Soviet Union, the main one being a switch from the isolated, centrally planned
economy to the globally built-in market economy. Today, the Russian economy
TABLE
CLIMATIC ZONES IN RUSSIAN
FEDERATION
4
Ru
ssia
n M
arke
t o
f A
gro
Pro
du
cts
| 20
12
occupies the sixth place in the world with its GDP at the level of $1. 857 trillion
(see the table).
Russia has become one of the countries to suffer from the world economic crisis
of 2008-2009 most severely. The Government has spent $600 million in order to
stop the devaluation of the national currency. The crisis reached its height in the
middle of 2009, after which the Russian economy has started to grow and
gradually recover its pre-crisis positions.
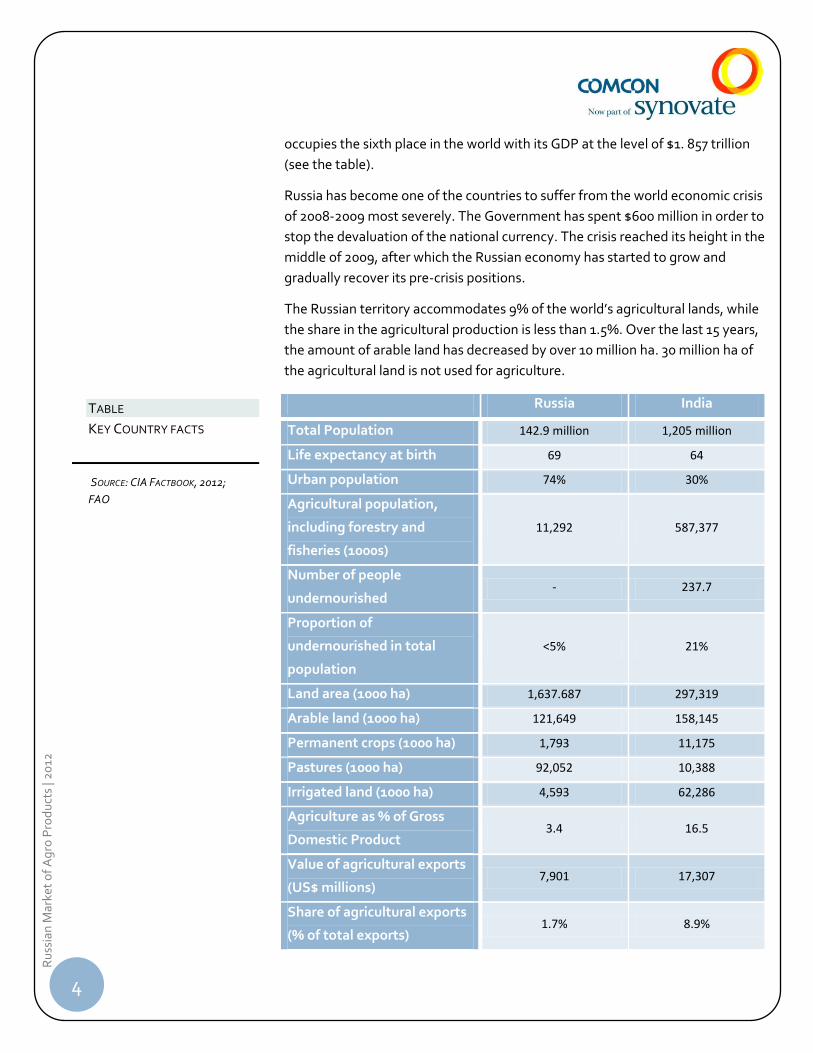
The Russian territory accommodates 9% of the world’s agricultural lands, while
the share in the agricultural production is less than 1.5%. Over the last 15 years,
the amount of arable land has decreased by over 10 million ha. 30 million ha of
the agricultural land is not used for agriculture.
Russia India
Total Population 142.9 million 1,205 million
Life expectancy at birth 69 64
Urban population 74% 30%
Agricultural population,
including forestry and
fisheries (1000s)
11,292 587,377
Number of people
undernourished - 237.7
Proportion of
undernourished in total
population
<5% 21%
Land area (1000 ha) 1,637.687 297,319
Arable land (1000 ha) 121,649 158,145
Permanent crops (1000 ha) 1,793 11,175
Pastures (1000 ha) 92,052 10,388
Irrigated land (1000 ha) 4,593 62,286
Agriculture as % of Gross
Domestic Product 3.4 16.5
Value of agricultural exports
(US$ millions) 7,901 17,307
Share of agricultural exports
(% of total exports) 1.7% 8.9%
TABLE
KEY COUNTRY FACTS
SOURCE: CIA FACTBOOK, 2012;
FAO
5
Ru
ssia
n M
arke
t o
f A
gro
Pro
du
cts
| 20
12
Value of agricultural imports
(US$ millions) 31,389 9,141
Share of agricultural imports
(% of total imports) 10.8 2.8
CROP RAISING AND FOOD PROCESSING
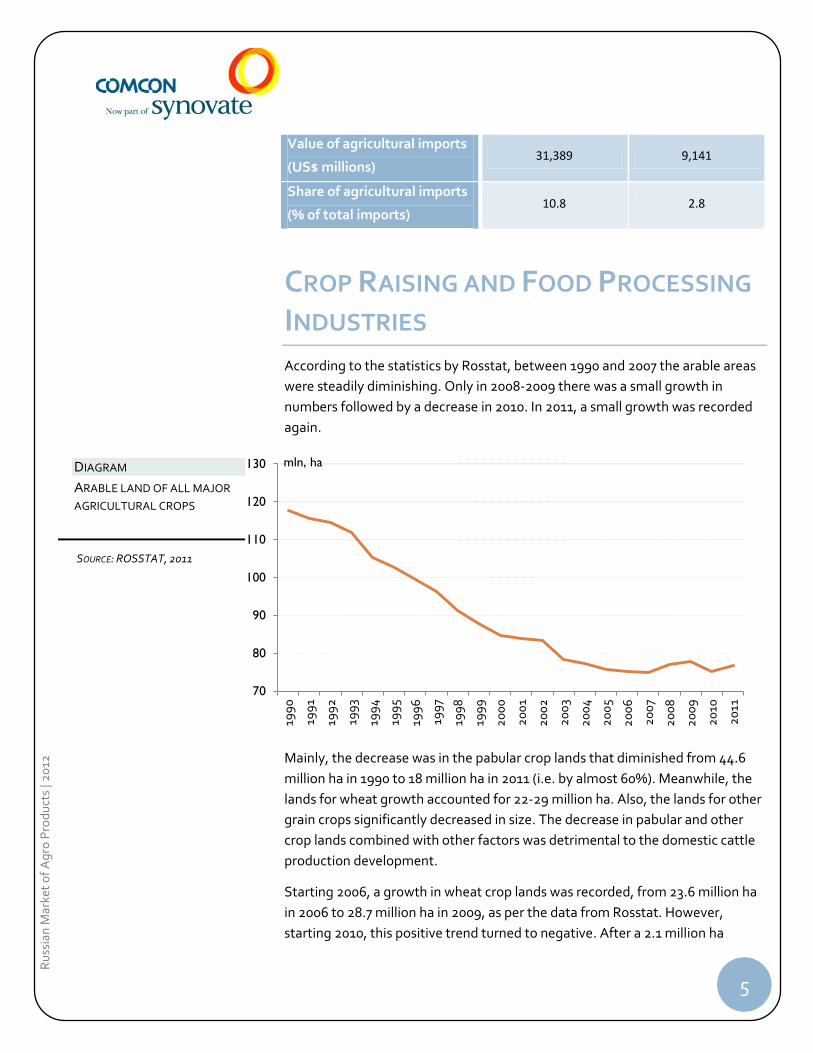
INDUSTRIES According to the statistics by Rosstat, between 1990 and 2007 the arable areas
were steadily diminishing. Only in 2008-2009 there was a small growth in
numbers followed by a decrease in 2010. In 2011, a small growth was recorded
again.
Mainly, the decrease was in the pabular crop lands that diminished from 44.6
million ha in 1990 to 18 million ha in 2011 (i.e. by almost 60%). Meanwhile, the
lands for wheat growth accounted for 22-29 million ha. Also, the lands for other
grain crops significantly decreased in size. The decrease in pabular and other
crop lands combined with other factors was detrimental to the domestic cattle
production development.
Starting 2006, a growth in wheat crop lands was recorded, from 23.6 million ha
in 2006 to 28.7 million ha in 2009, as per the data from Rosstat. However,
starting 2010, this positive trend turned to negative. After a 2.1 million ha
70
80
90
100
110
120
130
199
0
199
1
199
2
199
3
199
4
199
5
199
6
199
7
199
8
199
9
20
00
20
01
20
02
20
03
20
04
20
05
20
06
20
07
20
08
20
09
20
10
20
11
mln, ha DIAGRAM
ARABLE LAND OF ALL MAJOR
AGRICULTURAL CROPS
SOURCE: ROSSTAT, 2011
6
Ru
ssia
n M
arke
t o
f A
gro
Pro
du
cts
| 20
12
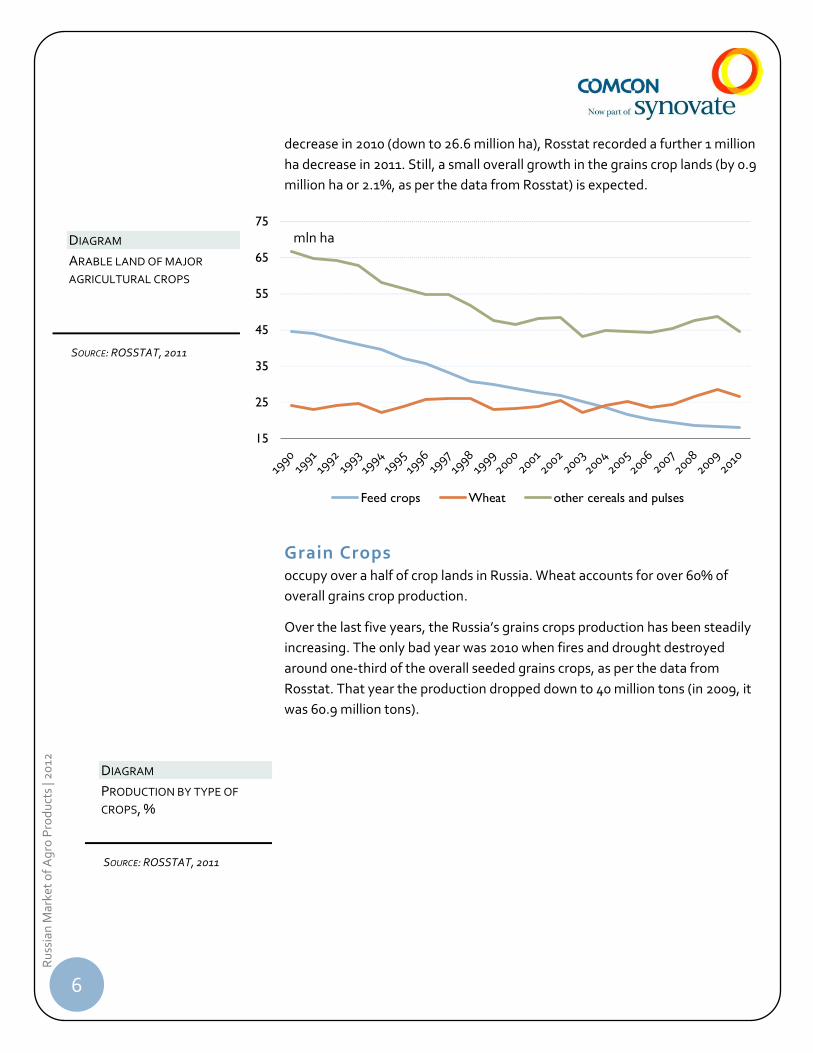
decrease in 2010 (down to 26.6 million ha), Rosstat recorded a further 1 million
ha decrease in 2011. Still, a small overall growth in the grains crop lands (by 0.9
million ha or 2.1%, as per the data from Rosstat) is expected.
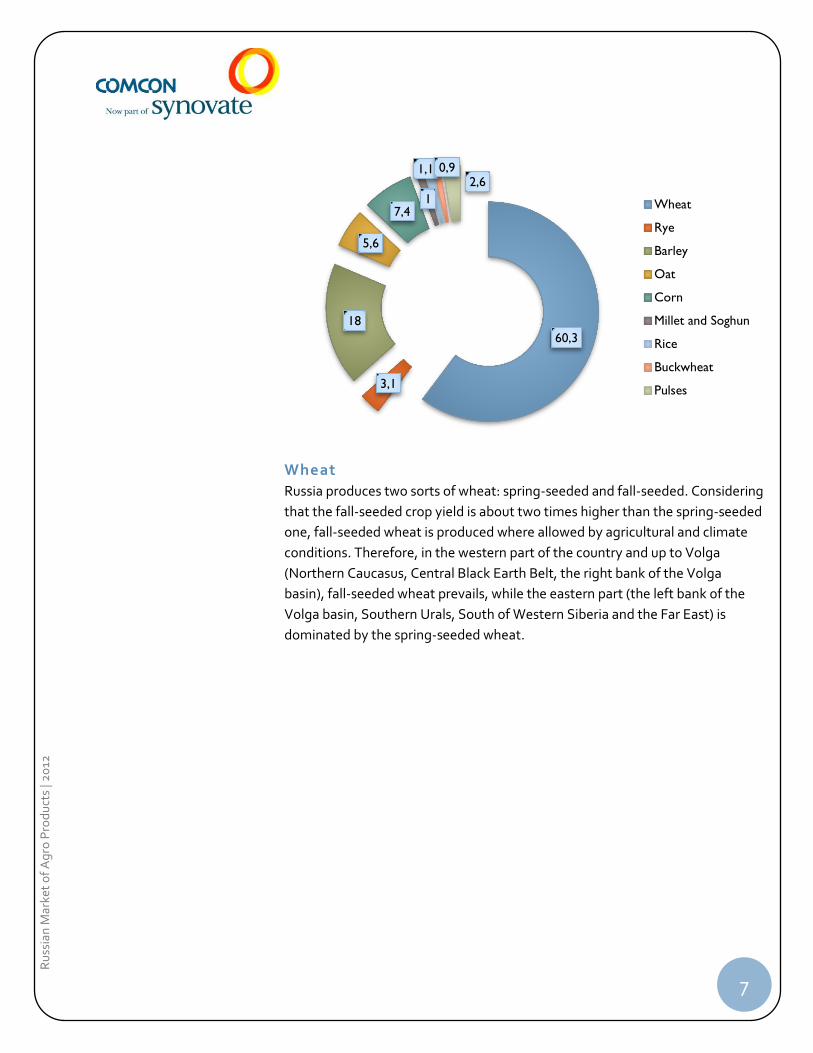
Grain Crops occupy over a half of crop lands in Russia. Wheat accounts for over 60% of
overall grains crop production.
Over the last five years, the Russia’s grains crops production has been steadily
increasing. The only bad year was 2010 when fires and drought destroyed
around one-third of the overall seeded grains crops, as per the data from
Rosstat. That year the production dropped down to 40 million tons (in 2009, it
was 60.9 million tons).
15
25
35
45
55
65
75
Feed crops Wheat other cereals and pulses
mln ha DIAGRAM
ARABLE LAND OF MAJOR
AGRICULTURAL CROPS
SOURCE: ROSSTAT, 2011
DIAGRAM
PRODUCTION BY TYPE OF
CROPS, %
SOURCE: ROSSTAT, 2011
7
Ru
ssia
n M
arke
t o
f A
gro
Pro
du
cts
| 20
12
Wheat
Russia produces two sorts of wheat: spring-seeded and fall-seeded. Considering
that the fall-seeded crop yield is about two times higher than the spring-seeded
one, fall-seeded wheat is produced where allowed by agricultural and climate
conditions. Therefore, in the western part of the country and up to Volga
(Northern Caucasus, Central Black Earth Belt, the right bank of the Volga
basin), fall-seeded wheat prevails, while the eastern part (the left bank of the
Volga basin, Southern Urals, South of Western Siberia and the Far East) is
dominated by the spring-seeded wheat.
60,3
3,1
18
5,6
7,4 1
1,1 0,9 2,6
Wheat
Rye
Barley
Oat
Corn
Millet and Soghun
Rice
Buckwheat
Pulses
8
Ru
ssia
n M
arke
t o
f A
gro
Pro
du
cts
| 20
12
Soft wheat accounts for over 95% of all the wheat seeded. The annual demand
for hard wheat for domestic consumption in Russia is about 1.2 million tons;
however, hard wheat production is significantly smaller, and soft wheat is
ubiquitously used for all food products. That is why significant amounts of
macaroni products are imported to Russia from Europe. Small amounts of hard
wheat are imported to Russia from Kazakhstan.
Rye
A core food crop for Russia, which, together with Poland and Germany, forms
the leading triad in the world’s rye production.
The main rye production area is Russian Non-Black Earth belt. The principal
areas of spring-seeded rye production are located in the Volga basin
(Ulyanovsk, Samara Regions and Tatarstan), in the Central District (Oryol,
Smolensk and Tver Regions), Volga-Vyatka District (Kirov and Nizhny
Novgorod Regions) and Ural Region (Perm Region and Udmurtia).
The 2011 rye crops exceeded the 2010 crops by a large margin (2,968.7
thousand tons vs. 1,635.6 thousand tons). Also, the crop lands increased almost
200 thousand ha.
The domestic annual rye demand is estimated as 1.5 million tons.
Barley
From barley corns, pot barley and pearl barley are produced, as well as barley
flour, which is added to wheat flour when baking specific sorts of bread. From
0
50
100
150
200
250
300
350
400
450
500
India Russia
kg
____________________________
Source: AGRO-INDUSTRIAL
COMPLEX «INFORM»
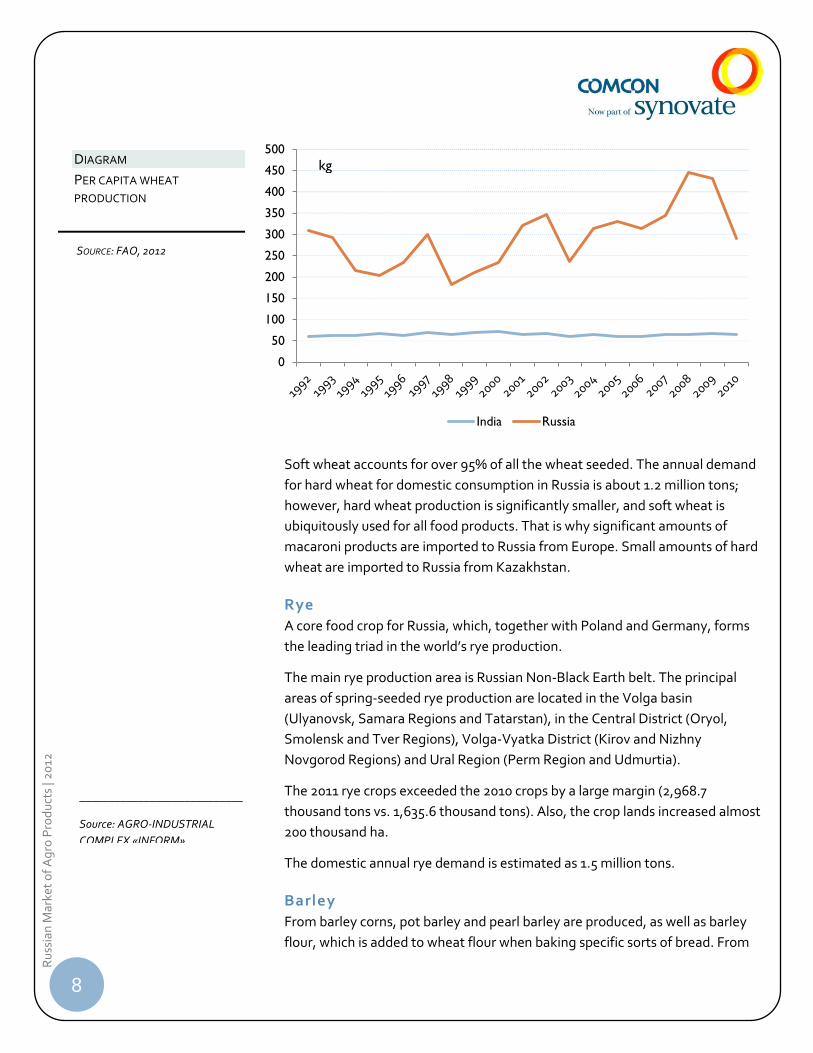
DIAGRAM
PER CAPITA WHEAT
PRODUCTION
SOURCE: FAO, 2012
9
Ru
ssia
n M
arke
t o
f A
gro
Pro
du
cts
| 20
12
barley, the amylum and molasses industry produces amylum. The products
extracted from the barley corn as malt extracts are used in textile,
confectionary and pharmaceutical industries. However, the biggest amounts of
barley are decorticated and processed to be used as a valuable concentrated
feed compound for pig and poultry farming.
Most barley is grown in the Central Federal District (36.4%) and in the Volga
Federal District (24%). In Russia, mostly fall-seeded barley is produced, which
accounts for around 90% of the total seeded barley.
One-fifth of the domestically harvested barley is exported. The main share in
the export structure belongs to the fodder barley.
The principle destination country for the barley exported from Russia is Saudi
Arabia. The share of the country is 58.8%. In particular, the geographic location
of the country allows further resale of Russian barley farther abroad. The
second largest buyer of domestically produced barley is Iran (9.9%). The CIS
countries account for buying less than 1% of the Russian barley.
The main barley exporting company is LLC Rosinteragroservis with 15.8%. The
second place (12%) is held by International Grain Company created by the Swiss
company Glencore International AG in 2004. Barley imports are insignificant
compared to barley exports. Russia mostly imports barley from Kazakhstan
(90% of all the barley imported). The second place is held by Sweden (8%).
The main consumers of barley are the leading brewing companies that account
for over 35% of the amounts purchased. The first place in the purchases (19%) is
occupied by the Baltika brewing company. The barley purchase share by forage
feed plants is as high as 10%.
Although barley cultivation is widespread in Russia, the suppliers have
significant problems selling these crops. Also, this market has less support by
the state compared to a number of other crops.
Russia is one of the leading consumers of brewer’s malt. Only ten years ago, the
share of imported malt was reaching 70%; however, this raw stock import
boosted breweries’ expenses, so the breweries started investing into agriculture
and malt and barley production. Currently, 75% of the malt demand is covered
by the domestically produced raw stock; however, despite all effort, only up to
one-third of the domestic brewer’s malt meets the world quality standards.
The Russian brewing companies and malt producers try to abandon raw stock
imports but, given the unstable quality of domestically produced barley, it is
still deemed impossible.
10
Ru
ssia
n M
arke
t o
f A
gro
Pro
du
cts
| 20
12
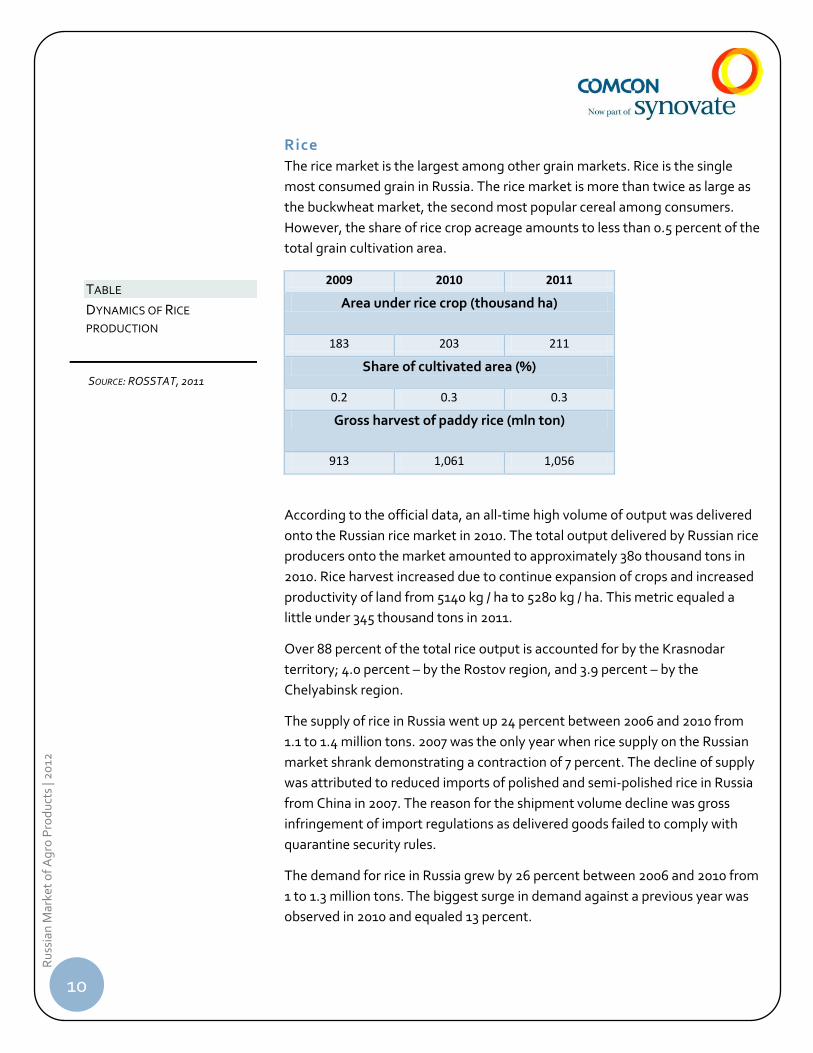
Rice
The rice market is the largest among other grain markets. Rice is the single
most consumed grain in Russia. The rice market is more than twice as large as
the buckwheat market, the second most popular cereal among consumers.
However, the share of rice crop acreage amounts to less than 0.5 percent of the
total grain cultivation area.
2009 2010 2011
Area under rice crop (thousand ha)
183 203 211
Share of cultivated area (%)
0.2 0.3 0.3
Gross harvest of paddy rice (mln ton)
913 1,061 1,056
According to the official data, an all-time high volume of output was delivered
onto the Russian rice market in 2010. The total output delivered by Russian rice
producers onto the market amounted to approximately 380 thousand tons in
2010. Rice harvest increased due to continue expansion of crops and increased
productivity of land from 5140 kg / ha to 5280 kg / ha. This metric equaled a
little under 345 thousand tons in 2011.
Over 88 percent of the total rice output is accounted for by the Krasnodar
territory; 4.0 percent – by the Rostov region, and 3.9 percent – by the
Chelyabinsk region.
The supply of rice in Russia went up 24 percent between 2006 and 2010 from
1.1 to 1.4 million tons. 2007 was the only year when rice supply on the Russian
market shrank demonstrating a contraction of 7 percent. The decline of supply
was attributed to reduced imports of polished and semi-polished rice in Russia
from China in 2007. The reason for the shipment volume decline was gross
infringement of import regulations as delivered goods failed to comply with
quarantine security rules.
The demand for rice in Russia grew by 26 percent between 2006 and 2010 from
1 to 1.3 million tons. The biggest surge in demand against a previous year was
observed in 2010 and equaled 13 percent.
TABLE
DYNAMICS OF RICE
PRODUCTION
SOURCE: ROSSTAT, 2011
11
Ru
ssia
n M
arke
t o
f A
gro
Pro
du
cts
| 20
12
The rice market in Russia is taken by a number of producers including the
Razgulyay Group, the Grana Association, the SoyuzPishcheprom Association,
and some others.
Beginning in 2010, the rice market has been recovering from the consequences
of the financial crisis. Currently, rice consumption is rising in Russia. Apart from
that, a rapid expansion of the instant-cereal market is an additional factor that
has a positive effect on the rice market. Experts forecast steady rice market
growth in 2012 and 2013.
Imports-exports
Between 2005 and 2010, the volume of rice imports tended to decline. The
imported rice share of the total supply volume in 2006 – 2010 was reduced
almost by half from 29 percent to 16 percent. State support of rice growing in
Russia contributed to a drop in the share of imported rice.
The rice market has the largest volume of imported rice compared to other
grain markets. Thailand, Vietnam, and China are the key importers of rice into
the Russian market.
The major receiving companies on the Russian rice market are the
ProdGamma-Grain company, the Agroalliance company, Angstrom Trading,
and Mistral Trading. The ProdGamma-Grain company receives over two thirds
of the total produce supplied to the Russian rice market.
There is an import of those types of rice that Russia does not produce. Now it is
long-grain rice and rare varieties (jasmine, basmati, Arborio). In 2010 they had
92% of imports. Whereas in 2005, these varieties accounted for 52% of
imported volumes, and almost as many (48%) were in the medium grain and
short grain rice, which can be produced in Russia.
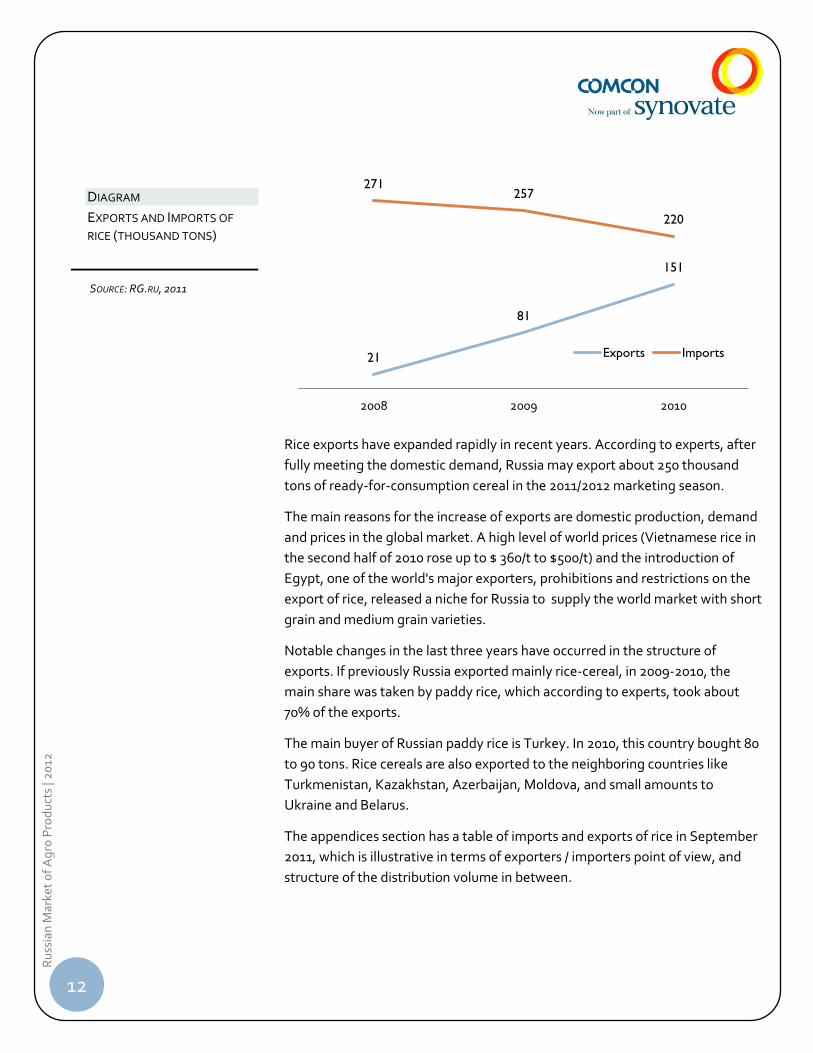
There was a maximum rice imports in 2002 and 2003, at the level of 470
thousand tons. Throughout the following years, it declined, and in 2010 it was
only 220 thousand tons, surpassing the export of 150 tons.
According to experts, Russia will have to import long grain rice for at least
another 4-5 years until there are analogues of the national selection.
12
Ru
ssia
n M
arke
t o
f A
gro
Pro
du
cts
| 20
12
Rice exports have expanded rapidly in recent years. According to experts, after
fully meeting the domestic demand, Russia may export about 250 thousand
tons of ready-for-consumption cereal in the 2011/2012 marketing season.
The main reasons for the increase of exports are domestic production, demand
and prices in the global market. A high level of world prices (Vietnamese rice in
the second half of 2010 rose up to $ 360/t to $500/t) and the introduction of
Egypt, one of the world's major exporters, prohibitions and restrictions on the
export of rice, released a niche for Russia to supply the world market with short
grain and medium grain varieties.
Notable changes in the last three years have occurred in the structure of
exports. If previously Russia exported mainly rice-cereal, in 2009-2010, the
main share was taken by paddy rice, which according to experts, took about
70% of the exports.
The main buyer of Russian paddy rice is Turkey. In 2010, this country bought 80
to 90 tons. Rice cereals are also exported to the neighboring countries like
Turkmenistan, Kazakhstan, Azerbaijan, Moldova, and small amounts to
Ukraine and Belarus.
The appendices section has a table of imports and exports of rice in September
2011, which is illustrative in terms of exporters / importers point of view, and
structure of the distribution volume in between.
21
81
151
271 257
220
2008 2009 2010
Exports Imports
DIAGRAM
EXPORTS AND IMPORTS OF
RICE (THOUSAND TONS)
SOURCE: RG.RU, 2011
13
Ru
ssia
n M
arke
t o
f A
gro
Pro
du
cts
| 20
12
Investments
In July 2012, Krasnodar region completed the first construction stage of the
largest plant in the country that will allow processing of up to 100 tons of raw
rice in one day. This may boost sowing and production of long-grain rice
varieties as demand for them currently accounts for most of rice import. The
project is unique in its focus on rare rice varieties and exclusive types of
production, which may prove an advantage for the investor. Indeed, there are
no facilities in the southern Russia that produce parboiled rice.
Several market participants point out that the rice-processing project poses
additional risks without own sources of raw rice.
“Processing capacities in the region are twice as high as the raw-produce volume.
The volume of raw rice left undistributed across production facilities is declining.
The market is nearing a point when up to 80 percent of rice will be accumulated by
large producers with own processing facilities.”
However, if the processer offers the agricultural producer exotic rice varieties
and ensures a buy-back, it becomes unnecessary for the producer to own
production facilities.
The rest of the grain crops that include rice and corn are not commonly raised
due to the harsh climate conditions. Corn is seeded in the Northern Caucasus,
the only region in Russia that resembles the renowned Corn Belt in the U.S. The
rest of the regions of the country produce corn for green fodder and ensilage.
Rice is seeded in the flux flow of the Kuban River, the Volga-Aqtobe bottom-
land and the near-Khanka lowland.
EXPERT OPINION
14
Ru
ssia
n M
arke
t o
f A
gro
Pro
du
cts
| 20
12
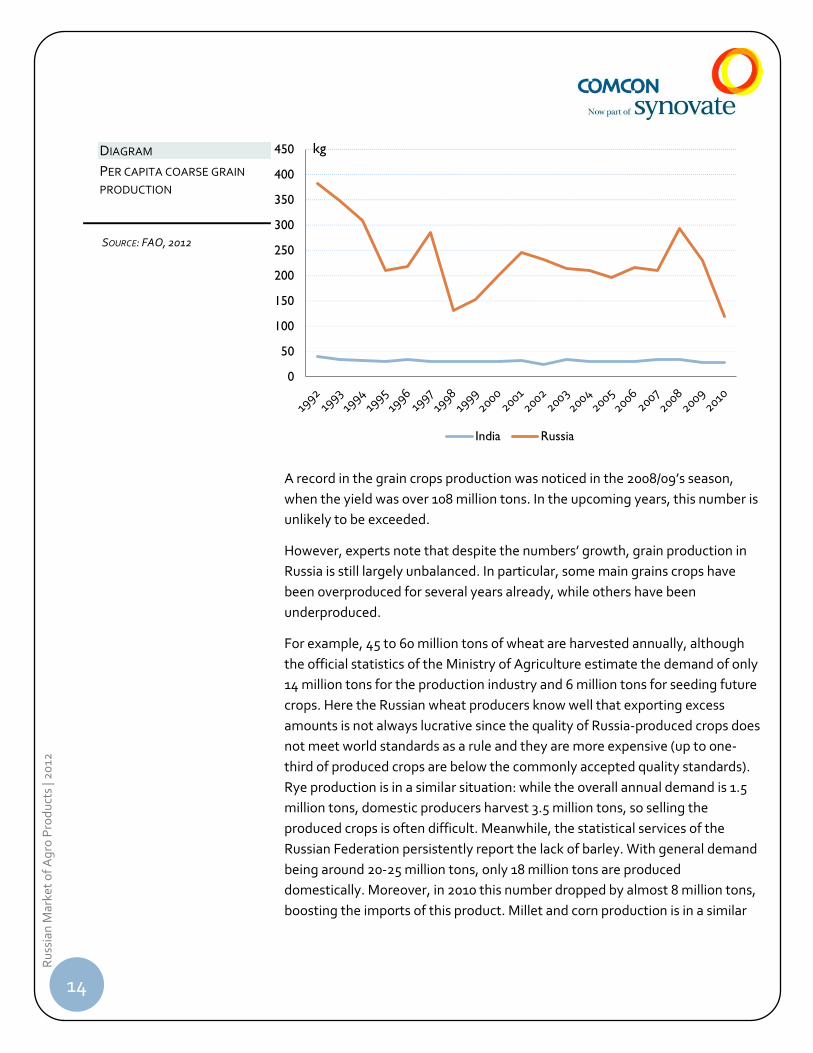
A record in the grain crops production was noticed in the 2008/09’s season,
when the yield was over 108 million tons. In the upcoming years, this number is
unlikely to be exceeded.
However, experts note that despite the numbers’ growth, grain production in
Russia is still largely unbalanced. In particular, some main grains crops have
been overproduced for several years already, while others have been
underproduced.
For example, 45 to 60 million tons of wheat are harvested annually, although
the official statistics of the Ministry of Agriculture estimate the demand of only
14 million tons for the production industry and 6 million tons for seeding future
crops. Here the Russian wheat producers know well that exporting excess
amounts is not always lucrative since the quality of Russia-produced crops does
not meet world standards as a rule and they are more expensive (up to one-
third of produced crops are below the commonly accepted quality standards).
Rye production is in a similar situation: while the overall annual demand is 1.5
million tons, domestic producers harvest 3.5 million tons, so selling the
produced crops is often difficult. Meanwhile, the statistical services of the
Russian Federation persistently report the lack of barley. With general demand
being around 20-25 million tons, only 18 million tons are produced
domestically. Moreover, in 2010 this number dropped by almost 8 million tons,
boosting the imports of this product. Millet and corn production is in a similar
0
50
100
150
200
250
300
350
400
450
India Russia
kg DIAGRAM
PER CAPITA COARSE GRAIN
PRODUCTION
SOURCE: FAO, 2012
15
Ru
ssia
n M
arke
t o
f A
gro
Pro
du
cts
| 20
12
situation: only 3.5 million tons of corn are produced annually. This amount is by
far not sufficient to cover the internal demand of domestic producers.
The internal consumption of grain crops in Russia increased from 75-76 million
tons (2009-2010) to 77-78 million tons (2010-2011). According to the expert
estimations, the consumption will annually grow by 2-3 million tons.
As per the data from the Russian Grain Union (RGU), between 2001 and 2010,
average internal annual grain consumption was 70.1 million tons. The main
share (over 50%) was used as feedstock. Consumption by the food production
industry and seeding consumption were around 30% and 16-17%, respectively.
In fact, the grain exporting capability first of all depends on the crop yield and
on the amount of grain in stock by the beginning of the crop year.
The estimations of future grain consumption are contradictory. One source
suggests a decrease in the grain consumed for grinding flour in the upcoming 7
years, due to decreasing population and dropping bread consumption. By 2011
(as compared to 2008) the bread consumption decreased by 1.5 million tons
and totaled 12.5 million tons. However, in the future an increase in the flour
production (up to 13.5-14 million tons) is possible, both for export and domestic
use. A decrease in the consumption can be mitigated if Russia does not tighten
its migration policy.
According to other data, internal grain consumption in Russia has increased
from 75-76 million tons (in the 2009-2010 crop year) to 77-78 (in the 2010-2011
crop year); it is also estimated to annually grow by 2-3 million tons on average
in the upcoming years.
Imports
The Russian imports of the main grain crops over the last several years tend to
decrease, except for 2010 (a year of crisis), when a draught forced Russia to
import about 2 million tons of grains; moreover, initial estimations suggested
this number to be over 3.5 million tons. The low numbers have been achieved
through a ban by the domestic Ministry of Agriculture that prevented the
exportation of crops. In the structure of the Russian grain imports, the largest
importers from the CIS countries are predominant. As per the official 2005-
2009 statistics by the Ministry of Agriculture, about 55% of Russia’s imported
grain crops are imported from Kazakhstan, while China accounts for another
15-16% and Ukraine, Belarus, Germany and Poland, for 7-7.5% each.
____________________________
SOURCE: INSTITUTE OF AGRARIAN
MARKET
____________________________
SOURCE: ANALITICAL DEPARTMENT
AGRORU.COM
16
Ru
ssia
n M
arke
t o
f A
gro
Pro
du
cts
| 20
12
Exports
In April 2010, an event took place that was a milestone for both Russian and the
entire world’s grain market. At the annual meeting of the International Grains
Council, Russia was officially transferred from the category of grain importers
to that of grain exporters. From being the largest net grains importer, the
nation turned into a steadily 3rd-4th largest wheat exporter and the 2nd-3rd
largest barley exporter.
As for the 2011/12 season, the Russian grain exports reached 23.5 million tons,
breaking the historical grain exportation record. By the middle of April, a
historical wheat exportation record of 18.5 million tons was set. Previous
exportation record was set in the 2009/10 season when 18.1 million tons were
exported (excl. the grain calculated from the flour exports). Record breaking
grain legumes exports of over 600 thousand tons have been noted. Corn
exportation as of mid April was also close to the historical records, reaching
over 1.2 million tons.
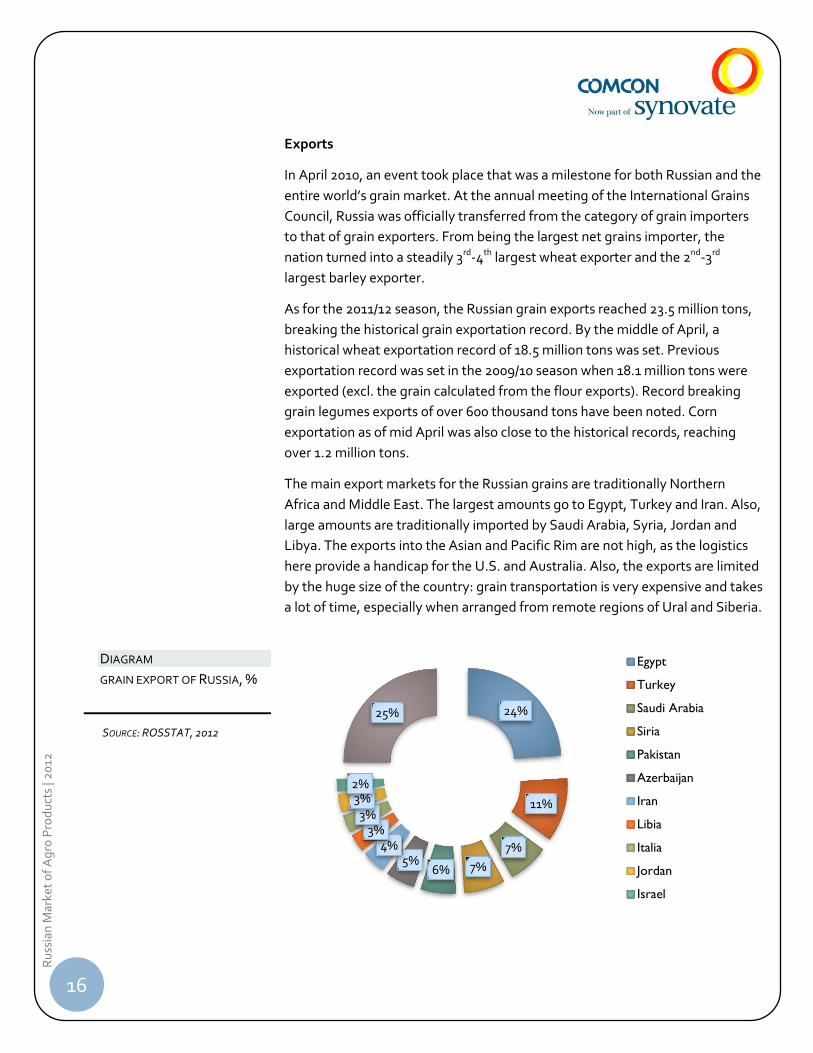
The main export markets for the Russian grains are traditionally Northern
Africa and Middle East. The largest amounts go to Egypt, Turkey and Iran. Also,
large amounts are traditionally imported by Saudi Arabia, Syria, Jordan and
Libya. The exports into the Asian and Pacific Rim are not high, as the logistics
here provide a handicap for the U.S. and Australia. Also, the exports are limited
by the huge size of the country: grain transportation is very expensive and takes
a lot of time, especially when arranged from remote regions of Ural and Siberia.
24%
11%
7%
7% 6% 5%
4% 3%
3% 3% 2%
25%
Egypt
Turkey
Saudi Arabia
Siria
Pakistan
Azerbaijan
Iran
Libia
Italia
Jordan
Israel
DIAGRAM
GRAIN EXPORT OF RUSSIA, %
SOURCE: ROSSTAT, 2012
17
Ru
ssia
n M
arke
t o
f A
gro
Pro
du
cts
| 20
12
State regulation
The Russian government pays close attention to the grain production industry,
providing conditions for sustained growth and for the realization of existing
potential. These were the measures that made Russia one of the largest grain
producers, and they will allow for even better results in the future. According to
the official position of the domestic Ministry of Agriculture, the push up of the
grain exports in the upcoming years has high perspectives and, hence, priority.
In the upcoming 10-15 years, Russia is planning to double the grain exports.
According to the ministry’s estimations, by 2016 the Russian grains exports will
have reached over 39 million tons, which accounts for 15 per cent of the world’s
market. The Russian government will continue the support of the Russian
grains exports in the long term; to this end, the expenses for building new linear
granaries are planned for as well as for improving seaport throughput in the
European part of the country and for building a new seaport grain terminal in
the Far East. The government also envisages the subsidies of loan rates and
railway transportation rates and it invites foreign investors to take part in
upgrading the seaport and granaries’ infrastructure.
Grain Crops Processing
Russia has a fairly well developed flour and grit grinding industry.
The flour market in Russia is shrinking. The last time this market grew stronger
was in 2006 (a 2.3% increase). Starting 2007, flour sales have been dropping
every year. In 2010, flour sales were 9.6 million tons, which is 2.1% lower than
the previous year. In the foreseeable future, the market diminishing rate will
slow down. According to the BusinesStat estimations, by 2014 the flour sales
will drop down to 9.3 million tons.
The main reasons for the flour market to diminish are the decrease in
population and the increase in the household income. These factors do not only
lower the bakery products consumption but also cause the retail flour purchase
(used for home-bake products) to drop.
In the recent years, the flour market has been changing: bread and bakery
producers cause the flour consumption to decrease, while the macaroni and
pastry producers increase their flour purchase. The demand by other food
industries such as the producers of pelmeni, pizza and pancakes is also growing.
In physical terms, wheat and rye-and-wheat flour account for 90% of the
market share, the rest of the market is occupied by the rye flour. This market
structure is virtually identical to the previous years’ structure, since the flour
____________________________
Source: RBC. Market Analysis
Department
18
Ru
ssia
n M
arke
t o
f A
gro
Pro
du
cts
| 20
12
market is traditional and long-settled.
The Russian flour market is independent from the imports. Domestic products
occupy almost the entire market volume. The monopoly of the domestic
producers in the domestic market virtually rules out the risks for the production
volume expansion and opens up a further business development prospect for
the entrepreneurs.
Generally, Russia is not a large flour exporter. Over the last 6 years, the
average annual exports have not exceeded 400-450 thousand tons. In 2010
flour exports dropped down to 150 thousand tons; however, in 2011 flour
exports set a new record, reaching 600 thousand tons due to the high
production and the ban on grain exports as well as high prices.
The main importers of the Russian flour are the near abroad countries, such as
Azerbaijan, Tajikistan and Mongolia. A part of the products (approx. 21% of the
overall exportation volume) is supplied to Tunisia.
The main types of grits in the Russian market are semolina, rice, buckwheat,
corn grits, as well as oat, wheat, barley grits and slotted peas.
The structure of the grits sales is gradually changing: in 2006 the main grits for
sale were semolina (30%) and buckwheat (28%), while rice (20%) was
significantly falling behind. In 2010, however, the first place was taken by rice
and semolina (31%), while buckwheat surrendered about one-third of its share.
At year-end 2010, the volume of the Russian grits market was practically 1
million tons. As compared to the previous year’s mark, the market volume has
grown by almost 2%. Meanwhile, the domestic production volume continued to
decrease (in 2010, by another 8%). The decrease is compensated for by
constantly increasing prices. Here, the pricing of buckwheat grits is exemplary:
they showed a quadruple (!) retail price growth, reaching the peak of 112 rubles
for a kilogram in May, 2011. Also, the prices for semolina were increasing (about
10% during 2010-2011) as well as the oatmeal prices (about 25%). It allowed the
producers to recompense for the decrease in the production volumes but it
caused increased attention to the industry by the state.
The 2010 retail grits sales in Russia surpassed the 2009’s sales by 15%. Overall,
from 2007 through 2010, the retail sales of grits in the Russian Federation
showed a significant growth. Over the 6 months of 2011, the retail grits sales
surpassed those over the same months of 2010 by more than a half.
____________________________
Source: GLOBAL REACH
CONSULTING
____________________________
Source: «The Russian and world
market of cereals», 2012 Intesco
Research Group
19
Ru
ssia
n M
arke
t o
f A
gro
Pro
du
cts
| 20
12
In 2010, the imported products’ share on the market was about 23% from the
overall available grits consumption potential in Russia. The principal volume of
the Russian market was taken by the domestically manufactured products. As
per the final results of the first half of 2011, the share of imported products in
the Russian market increased, which was the result of a significant increase in
the buckwheat imports to Russia.
Rice grits are imported into the Russian Federation by Vietnam, Thailand,
Pakistan, Uruguay and Brazil. Here, the leading importer is Vietnam, which
boasts 36% of the overall rice supply. Practically all other grits shipped to Russia
are brought from Ukraine. Ukraine’s share in the Russian import is 89%.
Hungary supplies about 8% of other grits.
In Russia, the segment of deep grain processing is completely undeveloped.
Products with high added value of the segment are mostly imported.
The discussions over the development of this industry have been held for a few
years already; however, the subsidies for building the plants are not provided,
and the investments are insignificant. One of the reasons behind the absence of
implemented projects for deep processing of grains (and other crops) in Russia
is that the investors have few possibilities to attract readily available funding
from the banks. The banks, including state-owned ones, are not interested in
lending money for such projects.
”We have all kinds of cereals in the market: rice, corn, wheat. Still, there is not a
single plant producing cereals in Russia; the nearest ones are located in the Baltic
States and Poland.”
However, Russia’s recent entrance into the WTO is pushing forward the
development of this segment. Currently, more than 10 deep grain processing
plant construction projects are being carried out, although all of them are very
far from completion.
Deep processing projects are very capital intensive: a plant with the annual
production of 200 thousand tons of grain costs about $330 thousand.
Therefore, the investors need support by the state: the optimal way here is co-
financing a part of the investment expenses from the state budget, for instance,
co-financing infrastructure construction and subsidizing long-term (8-10 year)
loans.
According to the data provided by the experts, a potential annual capacity of
the deep processed products market is 15-20 million tons of grain. The
EXPERT OPINION
20
Ru
ssia
n M
arke
t o
f A
gro
Pro
du
cts
| 20
12
bioethanol fuel market could consume 50-80 million tons of grain crops
annually.
The experts say that it makes sense to locate new production facilities in the
regions of Western Siberia. Those will produce such high added value products
as lysine, organic acids, bioplastics and gluten. These regions produce a lot of
grain. Here they can increase both the yield and the productivity of land, but
exportation is an issue while the domestic consumption is limited.
”Without new consumers, the agricultural producers will not intensify crop raising:
additional volumes only cause the grain prices to collapse. The producers must be
sure that they will always be able to sell the wheat at a good price, at least higher
than the prime cost (for Western Siberia, it is around $33 thousand per ton.”
In exportation -oriented southern regions, there is no necessity for deep
processing projects.
”First of all, the implementation of these projects will be hindered by the high cost
of raw stock. Secondly, in the Southern Federal District, it is reasonable to load the
grain into trucks and drive it 200-300 to the seaport and then sell them to the
exporter at a good price. Taking risks for building such a capital intensive
production plant does not make sense. Constructing such plants in the south is
unjustified in terms of economy.”
Corn can be the only exception here: the south produces up to 65-70% of overall
domestic corn crops. Such a focus brings logic into locating corn processing
plants in the Southern Federal District. Agrico, a Stavropol-based holding, has a
deep corn processing project with the cost of $83.3 mln.
Project examples:
Pava, an Altay-based grain processing company, is ready to invest up to $330
thousand into a deep grain processing project on the site of the Rebrikhin flour
mill. Pava wants to produce dry wheat gluten, syrups, ethyl alcohol s, feedstock
and liquefied carbon dioxide. The production capacity of the plant is 1.5
thousand tons of wheat per day, or 500 thousand tons per annum.
Bagansky Holding Group from the Novosibirsk Region announced a deep wheat
processing project. The plant to be built will be able to produce 6 thousand tons
of dry gluten, 24.8 tons of wheat amylum and 9.2 thousand tons of feedstock
for animal husbandry. The projected production capacity is scheduled to be
reached in 2014.
EXPERT OPINION
EXPERT OPINION
21
Ru
ssia
n M
arke
t o
f A
gro
Pro
du
cts
| 20
12
In the Penza Region, the PenzaAgroBio Company is planning to build a plant for
the production of syrups, amylum, gluten and feedstock ingredients. The
overall announced cost is $154 mln; the annual production capacity is 240
thousand tons of raw stock. Almost all the categories planned for production
are currently being imported from other countries.
Last year, a German chemical company Evonik created a joint venture with the
Russian Agroindustrial Trust. The companies plan to build an amino acid plant
in the Rostov Region for $200 mln that will annually process 300 thousand tons
of wheat into lysine. The commissioning of the plant is scheduled for the late
2013 or early 2014.
The Agrico Holding already has a project for building two plants for deep
processing of sugar beet and corn. A foreign company will take part in the
project (its name, form of partnership, project share and other details are not
disclosed by Agrico). The company possesses the deep processing technology
and the expertise in building such plants. The construction of the first plant can
start this year. It will daily process 250 tons of corn receiving 50 tons of native
and 25 tons of modified amylum, 70 tons of glucose and maltose products and
50 tons of fructose as well as feedstock. 250 tons per day is the first stage. The
project envisages a second stage, which will double the production capacity
after commissioning. Agrico plans to offset the plant cost in 6-7 years.
Brewing Industry
It is one of the most well-developed grain processing industries (barley, malt).
The brewing industry in Russia exists in rather unfriendly conditions. On the one
hand, the business activities of the breweries are tightly regulated by the state,
given the aggravating alcohol abuse problem. The government is introducing
limitations year after year and increasing the excise tax. On the other hand, the
brewing industry faces competition from vodka and strong alcohol producers
who lobby their interest in the government and who do not want to surrender
their share in the domestic alcohol market.
Russia is the fourth world’s annual producer of beer, losing the leadership only
to the U.S., China and Brazil. In Q1 2012 Russia produced 180.7 million tons of
lager beer, which accounts for 92% of the previous year’s production from
January till March. The production decline in the start of the year is the reaction
of the industry to the 20% increase in the beer excise tax effective starting
January 1, 2012. Similarly, the industry reacted to the threefold increase of the
excise tax at the beginning of 2010, which also led to a significant increase in
the retail beer prices.
22
Ru
ssia
n M
arke
t o
f A
gro
Pro
du
cts
| 20
12
As per the results of Q1 2012, beer showed the worst production numbers as
compared to the other excised beverages, especially to strong alcohol. Thus,
the production of vodka increased by 6.8%, and cognac production by 3.3%.
Meanwhile, wine producers cut their production by 3.3%.
Starting July 1, 2012, new industry standards come into force. Beer producers
will have malt percentage in the beverage raw stock checked. The minimum
allowed percentage will be 50% and it will increase to at least 80% in a year.
Until now the compound has not been regulated by the legislation. The brewers
estimate a 10-15% growth in the product prices. The beer production standard
should bring Russia closer to the world’s recognized beer producers, Germany
and Czechia. Germans still have the “On Beer Purity” law being enforced which
only allows putting malt, hop and water in the traditional German beer. In
Czechia malt must constitute no less than two-thirds of the beverage
ingredients. In Russia the majority of the low and middle cost beer is brewed
using rice or corn.
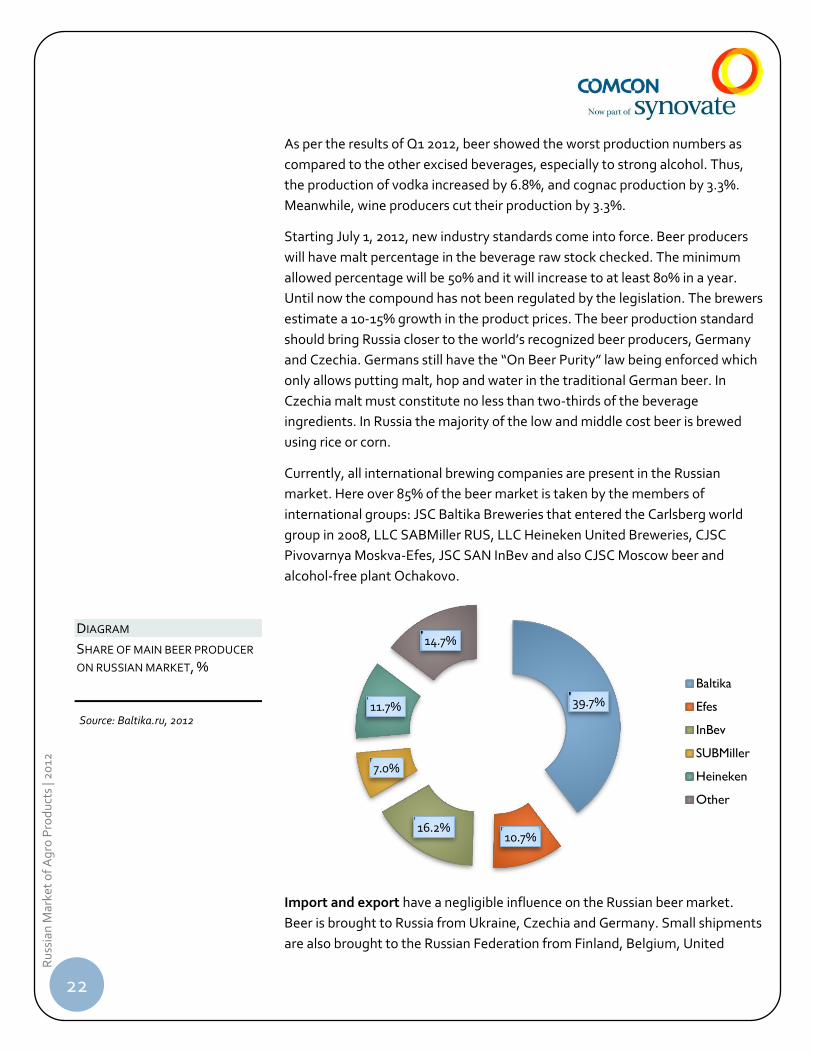
Currently, all international brewing companies are present in the Russian
market. Here over 85% of the beer market is taken by the members of
international groups: JSC Baltika Breweries that entered the Carlsberg world
group in 2008, LLC SABMiller RUS, LLC Heineken United Breweries, CJSC
Pivovarnya Moskva-Efes, JSC SAN InBev and also CJSC Moscow beer and
alcohol-free plant Ochakovo.
Import and export have a negligible influence on the Russian beer market.
Beer is brought to Russia from Ukraine, Czechia and Germany. Small shipments
are also brought to the Russian Federation from Finland, Belgium, United
39.7%
10.7% 16.2%
7.0%
11.7%
14.7%
Baltika
Efes
InBev
SUBMiller
Heineken
Other
DIAGRAM
SHARE OF MAIN BEER PRODUCER
ON RUSSIAN MARKET, %
Source: Baltika.ru, 2012
23
Ru
ssia
n M
arke
t o
f A
gro
Pro
du
cts
| 20
12
Kingdom and Ireland. The share of imported products in the beer market does
not exceed 3%. Less than 1% of the produced beer is exported abroad. The
main partners that import beer from Russia are the CIS countries: Kazakhstan,
Kyrgyzstan, Moldova, Ukraine and Abkhazia.
Over the last 10 years, the investments in the brewing industry have totaled
13.3 billion dollars. As claimed by the industry insiders, brewing companies
annually invest about 17 million dollars into their own agricultural projects in
Russia. Russian brewing companies own 16 malt production plants, and the
investments into the plants total 900 million dollars.
The beginning of year 2012 was marked by important corporate beer market
events, which speak of a positive evaluation of the Russian industry by the
foreign investors. Carlsberg, a Danish brewing company, announced its
intention to buy the remaining 15% of the Russian Baltika brand. The overall
deal amount for brining the share in the company to 100% is 6.5 billion Danish
crowns ($1.15 billion). The deal is associated with the successful results of the
corporate group in 2011.
In March 2012, according to the earlier agreements, PJSC Miller Brands,
Ukraine, changed ownership for Anadolu Efes, a member of the Anadolu
Group. According to the terms of the strategic alliance between SABMiller plc
and Anadolu Group created in the end of 2011, SABMiller transfers its assets in
Ukraine and Russia to Anadolu Efes. In its turn, Anadolu Efes transfers 24% of
its stock to SABMiller through increasing its equity share capital.
Oil-bearing Crops The principle oil-bearing crop, the sunflower, is raised in the forest steppe and
steppe belt of the country (Central Black-earth belt, Northern Caucasus).
In Russia the domestic market demand for sunflower seeds is almost
completely closed by the domestic production. The volume of the sunflower
market (and the oil-bearing crops market as a whole) has been dynamically
increasing over the last several years. This was instigated by the increase in the
consumption of the products derived from the sunflower, primarily by the food
industry; sunflower oil, mayonnaise sauces, soft margarines (dairy product
substitutes).
24
Ru
ssia
n M
arke
t o
f A
gro
Pro
du
cts
| 20
12
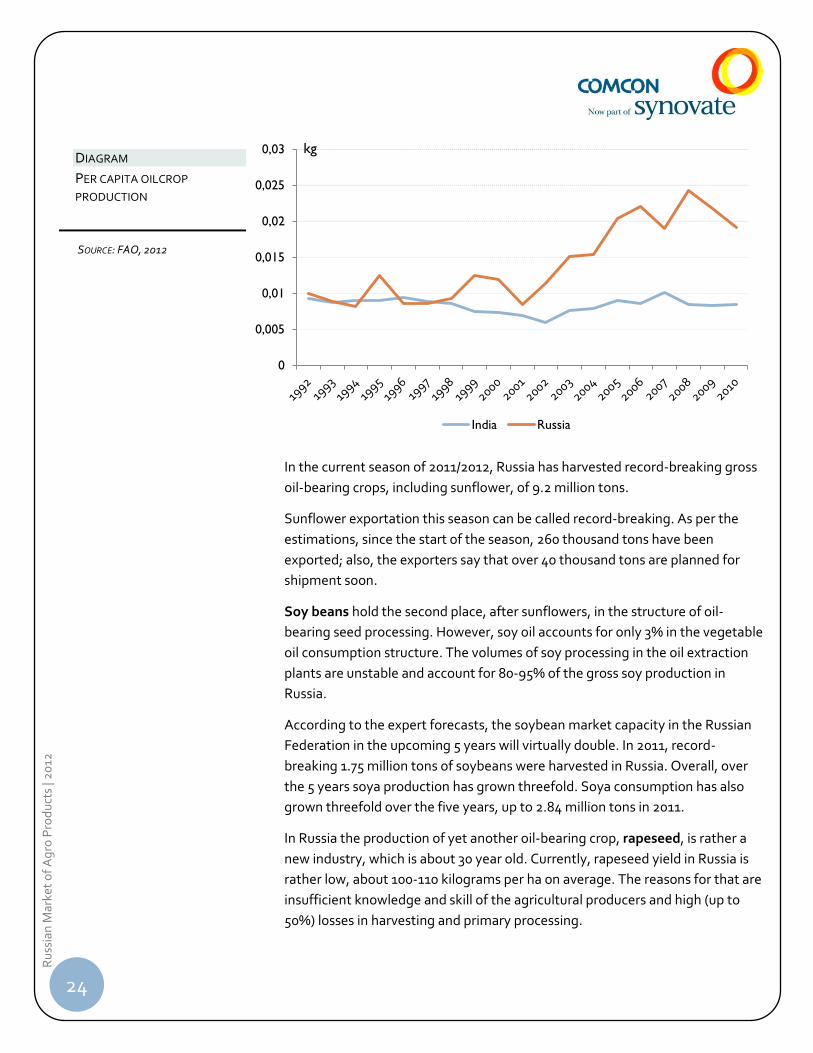
In the current season of 2011/2012, Russia has harvested record-breaking gross
oil-bearing crops, including sunflower, of 9.2 million tons.
Sunflower exportation this season can be called record-breaking. As per the
estimations, since the start of the season, 260 thousand tons have been
exported; also, the exporters say that over 40 thousand tons are planned for
shipment soon.
Soy beans hold the second place, after sunflowers, in the structure of oil-
bearing seed processing. However, soy oil accounts for only 3% in the vegetable
oil consumption structure. The volumes of soy processing in the oil extraction
plants are unstable and account for 80-95% of the gross soy production in
Russia.
According to the expert forecasts, the soybean market capacity in the Russian
Federation in the upcoming 5 years will virtually double. In 2011, record-
breaking 1.75 million tons of soybeans were harvested in Russia. Overall, over
the 5 years soya production has grown threefold. Soya consumption has also
grown threefold over the five years, up to 2.84 million tons in 2011.
In Russia the production of yet another oil-bearing crop, rapeseed, is rather a
new industry, which is about 30 year old. Currently, rapeseed yield in Russia is
rather low, about 100-110 kilograms per ha on average. The reasons for that are
insufficient knowledge and skill of the agricultural producers and high (up to
50%) losses in harvesting and primary processing.
0
0,005
0,01
0,015
0,02
0,025
0,03
India Russia
kg DIAGRAM
PER CAPITA OILCROP
PRODUCTION
SOURCE: FAO, 2012
25
Ru
ssia
n M
arke
t o
f A
gro
Pro
du
cts
| 20
12
In 2011 Russia harvested 6 million tons of corn and 1.1 tons of rapeseed,
showing an essential increase over 2010, a crisis year for agriculture, even
breaking the records for the rapeseed.
Oil-bearer cultures Processing
Oil-bearers, as well as all other crops, are the raw stock for the processing
plants. After processing, the main product (oil) and the supplemental product
(oil meal) are derived. Depending on the type and the quality of the oil, it is
consumed by the confectionary, cannery, feed compound, soap, paint-and-
coating, cosmetic and chemical industry plants. Here the predominant use of
sunflower is culinary oil production.
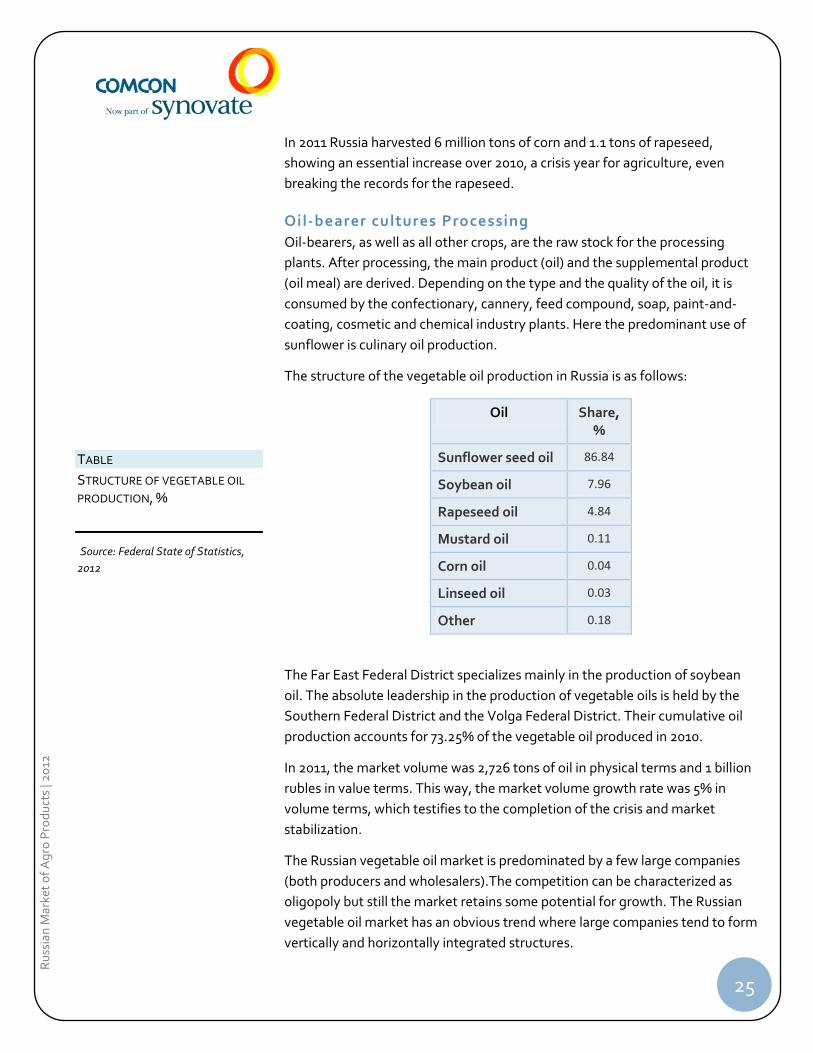
The structure of the vegetable oil production in Russia is as follows:
Oil Share, %
Sunflower seed oil 86.84
Soybean oil 7.96
Rapeseed oil 4.84
Mustard oil 0.11
Corn oil 0.04
Linseed oil 0.03
Other 0.18
The Far East Federal District specializes mainly in the production of soybean
oil. The absolute leadership in the production of vegetable oils is held by the
Southern Federal District and the Volga Federal District. Their cumulative oil
production accounts for 73.25% of the vegetable oil produced in 2010.
In 2011, the market volume was 2,726 tons of oil in physical terms and 1 billion
rubles in value terms. This way, the market volume growth rate was 5% in
volume terms, which testifies to the completion of the crisis and market
stabilization.
The Russian vegetable oil market is predominated by a few large companies
(both producers and wholesalers).The competition can be characterized as
oligopoly but still the market retains some potential for growth. The Russian
vegetable oil market has an obvious trend where large companies tend to form
vertically and horizontally integrated structures.
TABLE
STRUCTURE OF VEGETABLE OIL
PRODUCTION, %
Source: Federal State of Statistics,
2012
26
Ru
ssia
n M
arke
t o
f A
gro
Pro
du
cts
| 20
12
The five largest producers are represented exclusively by the Russia-renowned
brands: Aston Company with Zateya trademark, Bunge Ltd. with Ideal and
Zateya trademarks, WJ Group of companies with Milora trademark, Efko
company (Altero trademark) and also Yug Rusi (Zlata and Zolotaya Semechka
trademarks). The degree of the market consolidation is the highest in the
Russian oil production structure. Thus, in the largest segment (sunflower oil
production), the consolidation is minimal and is only 63%, while rapeseed oil is
in between, with 5 largest producers accounting for 72% of overall production.
For rapeseed oil, the set of 5 leaders is the same with the exception of Aston,
replaced by Ussuriysk MZhK with Maslava trademark.
The utilization of the oil processing plants’ production capacity is 60-65% on
average. Incomplete utilization is due to the seasonal character of oil-bearing
crops harvesting. The latter prevents all the industry plants from evenly
distributing the raw stock processing load within a year. Not all production-
capable facilities are effective, over a half of the facilities have outdated
equipment.
The main vegetable oils consumption sector is industry, which purchased 1,393
thousand tons of oils in 2010. 1,434 thousand tons of oils were sold via retail
outlets, and HoReCa account for 133 thousand tons. The industry consumes
large amounts of soybean, palm, coconut and rapeseed oil. In retail, mostly
olive and sunflower oil are sold. Sunflower oil accounts for about 70% of the
overall market turnover.
In Russia, there is a drastic growth in the production of deep-processed oils.
While in 2006 refined and hydrogenated oils only accounted for 41% of the
overall production, by 2010 the share of those was 60%. As the experts say, by
2015 the share of refined and hydrogenated oils in the overall vegetable oil
production volume will amount to 71%.
Imports and Exports
63% of vegetable oil produced by the Russian companies is sold domestically
and 37% is shipped abroad (it is mostly exported and it is mostly the sunflower
oil).
The imports of vegetable oil in 2011 were $1,188 million in value terms and
841.7 thousand tons in volume terms. Compared to the results of 2010 ($1,078
and 963.3 thousand tons), the imports grew by 10% in value terms, however,
declining in volume terms by 13%. Russia has mostly been importing palm and
coconut oil, the import volumes of those growing year after year.
____________________________
Source: «Analysis of the Russian
market of vegetable oils in Russia»,
2012, BusinesStat
____________________________
SOURCE: «ANALYSIS OF THE RUSSIAN
MARKET OF VEGETABLE OILS IN
RUSSIA», 2012, BUSINESSTAT
27
Ru
ssia
n M
arke
t o
f A
gro
Pro
du
cts
| 20
12
The main buyers of the Russian oils are Turkey (36 per cent) and Egypt (23 per
cent).
The 2011’s vegetable oils export volume was 1,349.1 million USD in value terms
and 1,127.2 thousand tons in physical terms. Compared to 2010 (803.9 million
and 892.1 thousand tons), the exports grew by 68% in value terms. Only a small
share of Russian-produced vegetable oil products is exported. However, in 2011
the supply of sunflower oil grew by 77% (in value terms) compared to the
previous year, also growing by 37% in physical terms.
----
When speaking about the grain and oil-bearer processing industry as a whole,
Russia is missing on the entire crops processing industries, and above all, the
production of fuel ethanol. Without this sort of processing, the agricultural
producers do not have a high demand outlet, and the cattle farming industry
lacks a cheap protein concentrate, hence being less competitive. This results in
the high volatility of the balance numbers. The weakness of the processing
industry renders the market volatility – the superfluous yield makes the prices
collapse and forces into performing purchasing interventions.
Vegetable Crops Over the last decade, vegetable market in Russia has shown a steady growth
despite serious problems in the industry.
In 2010, a draught had a strong impact on the industry cutting down the
resulting numbers by 20% by the end of the year.
On the contrary, in 2011 Russia harvested record-breaking vegetable crops,
which has caused the domestic prices on the main vegetable items to collapse,
leading to the market oversaturation. As per the experts’ estimation, potato
crop yield surpassed the 2010’s numbers by 25-27%, cabbage yield grew 10-
12%, and carrot and beetroot yield increased 5-7%.
____________________________
Source: AIC, “INFORM”
28
Ru
ssia
n M
arke
t o
f A
gro
Pro
du
cts
| 20
12
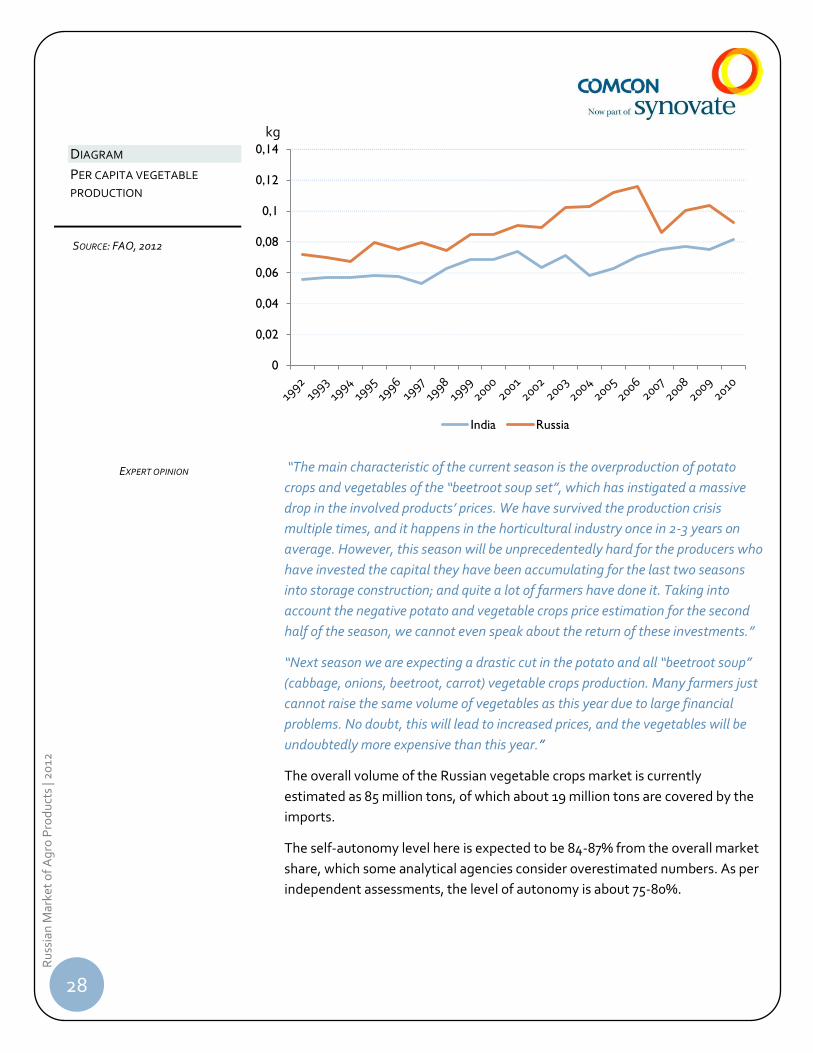
“The main characteristic of the current season is the overproduction of potato
crops and vegetables of the “beetroot soup set”, which has instigated a massive
drop in the involved products’ prices. We have survived the production crisis
multiple times, and it happens in the horticultural industry once in 2-3 years on
average. However, this season will be unprecedentedly hard for the producers who
have invested the capital they have been accumulating for the last two seasons
into storage construction; and quite a lot of farmers have done it. Taking into
account the negative potato and vegetable crops price estimation for the second
half of the season, we cannot even speak about the return of these investments.”
“Next season we are expecting a drastic cut in the potato and all “beetroot soup”
(cabbage, onions, beetroot, carrot) vegetable crops production. Many farmers just
cannot raise the same volume of vegetables as this year due to large financial
problems. No doubt, this will lead to increased prices, and the vegetables will be
undoubtedly more expensive than this year.”
The overall volume of the Russian vegetable crops market is currently
estimated as 85 million tons, of which about 19 million tons are covered by the
imports.
The self-autonomy level here is expected to be 84-87% from the overall market
share, which some analytical agencies consider overestimated numbers. As per
independent assessments, the level of autonomy is about 75-80%.
0
0,02
0,04
0,06
0,08
0,1
0,12
0,14
India Russia
kg
DIAGRAM
PER CAPITA VEGETABLE
PRODUCTION
SOURCE: FAO, 2012
EXPERT OPINION
29
Ru
ssia
n M
arke
t o
f A
gro
Pro
du
cts
| 20
12
A large share in the vegetable raising market is occupied by the numerous
private farms (71%); large companies only accounting for 17.1%, and
professional farmers contributing 11%.
Currently, by rough estimations the total volume of the Russian vegetable crops
market is $50 billion in value terms, the imports accounting for $1 billion, and
the exportation from Russia is approximately $37 mln, all figures calculated per
annum. The largest share in the imports is taken by tomatoes (40%) followed
by onions and garlic. The largest exporters of tomatoes into Russia are Turkey
and China, and the rest of the vegetables are mainly imported from the EU
countries, mostly Germany and the Netherlands.
“We buy tomatoes as well, since growing tomatoes domestically is currently very
expensive. Buying readymade tomato paste from China or Uzbekistan is way
cheaper.”
As per the experts’ opinion, the largest shares in the export market are taken by
potato crops (54%). Russia exports most of the potato production into
Azerbaijan and Kazakhstan. Overall, 90 to 95% of total exports go to the near-
abroad countries.
As of today, the principle amounts of vegetable crops are produced in the Volga
Federal District (2.7 million tons on average in the last three years, accounting
for 21% of the total production in Russia), the Central Federal District (2.6
million tons or 20,3%), the Southern Federal District (2.5 million tons or 20%),
the Siberian Federal District (1.6 million tons or 13%), North Caucasus Federal
District (1.6 million tons or 12%).
Processing (Vegetable Conservation)
From 2006 through 2010, the value volume of the vegetable conservation has
grown by 52%, from $2.7 to 4.1 billion. The value volume of canned vegetable
sales has been growing at a rate far exceeding the market growth in terms of
volume. This outrunning growth has been due to the fast increase in the canned
vegetables’ prices: from 2006 through 2010 the mean price of 1 kilogram of
canned vegetables has grown by 50%, from $2.96 to 4.5.
In 2010 the volume sales of canned vegetables reached 906 thousand tons.
Here, the capacity of the canned vegetables market in 2010 amounted to 2.3
million tons. This difference between the market volume and the capacity in
Russia is explained by the presence of homemade canned vegetables. In other
words, a part of the preserves is made from homegrown vegetables and such
EXPERT OPINION
____________________________
SOURCE: «ANALYSIS OF THE RUSSIAN
MARKET OF CANNED VEGETABLES»,
2011, BUSINESSTAT
30
Ru
ssia
n M
arke
t o
f A
gro
Pro
du
cts
| 20
12
preserves are not reported in the sales. About 1.4 million tons of canned
vegetables are produced in the Russian households annually.
The experts believe that this market stands out for its high competition. The
largest players are Bonduelle, Le Group CECAB, the owner of the Globus and
D'aucy trademarks, and EKO, a producer from Hungary. Among the domestic
producers, the leadership is held by Baltimor.
Currently, the Russian market of canned vegetables largely relies on imports. In
2010 the supply of canned vegetables included 373.6 thousand tons of domestic
production and 593.7 of imports. In the perspective, the share of imported
canned vegetables will decrease and will account for 51.5% of overall supply in
2015.
“Refreshment salads include 80% of domestically produced ingredients;
peas/corn: 50% are imports. If we take Siberia and the area east of the Urals, it is
on the Chinese (or sometimes Thai) imports. They do not have plants there at all.
Central Russia is 50/50. Kamchatka is 80% on imports.”
The producers have an acute lack of domestically produced raw stock. The
possibilities of raising raw stock crops domestically are hindered by the
authorities.
“Virtually no one is raising it, except for Bonduelle. They don’t have enough supply
and they are still buying, even from us. Very few have their own farmholds.”
“Some simply do not have a possibility to enter into a region and acquire farmland.
No one would sell. At best, this would be long-term rental, for 49 years. When you
come to a region without having connections with the authorities, it means you
are bound to fail. No one will support you. The only attention you will get is that of
the tax authorities and the fire safety inspections that will constantly fine you
(hidden corruption). You will need to be on friendly terms with the local
authorities, and not many are on those.”
Potato Crops
Potatoes are essential food and feedstock crops produced by the vegetable
and gourd raising industry. Potatoes are referred to as “the second best bread”
in Russia. These crops are ubiquitously seeded, the largest part, however, is
located in the Central Russia and also near the cities where vegetable raising is
being developed.
Russia is currently producing about 34 million tons of potatoes per annum,
being the second largest potato producer after China. This (among other
EXPERT OPINION
EXPERT OPINION
31
Ru
ssia
n M
arke
t o
f A
gro
Pro
du
cts
| 20
12
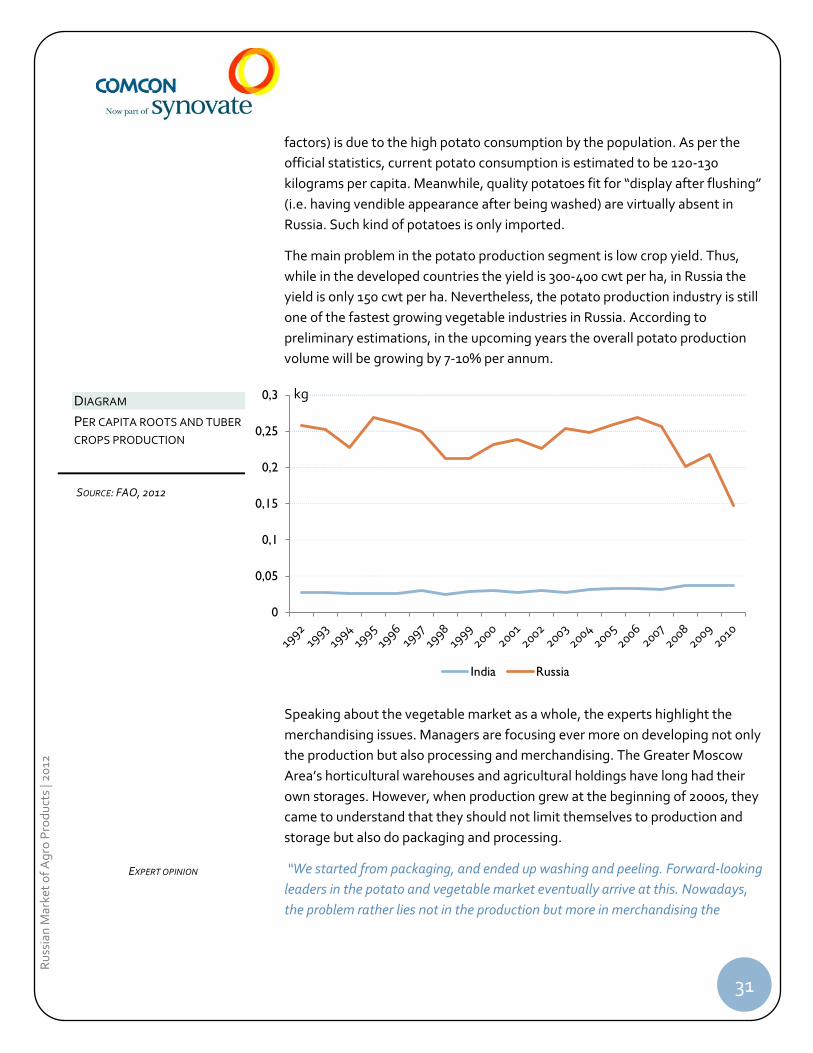
factors) is due to the high potato consumption by the population. As per the
official statistics, current potato consumption is estimated to be 120-130
kilograms per capita. Meanwhile, quality potatoes fit for “display after flushing”
(i.e. having vendible appearance after being washed) are virtually absent in
Russia. Such kind of potatoes is only imported.
The main problem in the potato production segment is low crop yield. Thus,
while in the developed countries the yield is 300-400 cwt per ha, in Russia the
yield is only 150 cwt per ha. Nevertheless, the potato production industry is still
one of the fastest growing vegetable industries in Russia. According to
preliminary estimations, in the upcoming years the overall potato production
volume will be growing by 7-10% per annum.
Speaking about the vegetable market as a whole, the experts highlight the
merchandising issues. Managers are focusing ever more on developing not only
the production but also processing and merchandising. The Greater Moscow
Area’s horticultural warehouses and agricultural holdings have long had their
own storages. However, when production grew at the beginning of 2000s, they
came to understand that they should not limit themselves to production and
storage but also do packaging and processing.
“We started from packaging, and ended up washing and peeling. Forward-looking
leaders in the potato and vegetable market eventually arrive at this. Nowadays,
the problem rather lies not in the production but more in merchandising the
0
0,05
0,1
0,15
0,2
0,25
0,3
India Russia
kg DIAGRAM
PER CAPITA ROOTS AND TUBER
CROPS PRODUCTION
SOURCE: FAO, 2012
EXPERT OPINION
32
Ru
ssia
n M
arke
t o
f A
gro
Pro
du
cts
| 20
12
product to the consumer.”
Still, the production of biofuel from the potatoes is deemed low-perspective by
the experts.
“Here, the issue lies in the breeds, the GMO, because raising culinary potatoes for
ethanol makes no sense. Also, it makes no sense to promote bioethanol as a
competitive fuel in a petroleum producing country, when there’s Brazil with the
U.S. as a potential marketing outlet and sugar cane that’s cheap, next to being
completely free to produce.”
However, the experts note a high potential of processing the product into
amylum, provided that modern technologies and quality standards apply.
“Processing into amylum is another pair of shoes. The potential for the processing
market is huge. For example, in the Greater Moscow Area, mayonnaise producers
buy imported amylum since there are no domestically produced offers of required
quality. We do not have our own technologies, so we need to acquire and develop
those from abroad.”
Ethanol and ethyl alcohol Industry
A part of the processed raw stock potatoes (and a part of grain raw stock, to a
lesser extent) is used in producing ethanol. This industry is tightly regulated
and supervised by the state.
From 2007 till 2011, the demand for ethanol in Russia dropped by almost 6%:
from 895 down to 843 million liters. The greatest decline (by almost 6%) in the
demand was recorded in 2009.
As the liquor and ethyl alcohol s industry is the largest consumer of ethanol and
ethyl alcohol in Russia, the marketing experts note the changes in the
customary ways of alcohol consumption to be among other reasons behind the
decline in the demand for ethanol. The demand for strong alcohol is
decreasing, while the consumption of low-alcohol beverages, beer and cocktails
displays a growth.
In 2011, the number of ethanol production plants has substantially decreased:
while by the beginning of the year, there were about 100 licensed plants, only
69 remained by the end of year after a license re-issuance. The experts reckon
that the state is thus regaining control over the industry and pushes away small
EXPERT OPINION
EXPERT OPINION
EXPERT OPINION
33
Ru
ssia
n M
arke
t o
f A
gro
Pro
du
cts
| 20
12
regional players. The authority representatives declare that it is only the first
stage in the population ‘de-alcoholization’ program.
“Market monopolization – for both vodka and ethanol production – is on the way.
The state is consciously taking steps to eliminate the producers.”
Region Owners
Production
in January-
September
2011
Change to
the similar
period of
2010 (%)
Mark
et
share
(%)
Zernoproduct Tula
Region
Centrol Ltd
(Beliz)
2.4 2.3 9.3
Spirtovoy
Kombinat
Kemerovo
Region
No data 2.2 8 8.8
Tulaspirt
(alcohol plant
Pavlovskiy)
Tula
Region
No data 2.2 13.7 8.7
Bashspirt Bashkiria Ministry of the
land property
of
Bashkortostan
1.7 -7.5 6.8
Tatspirtprom Tatarstan Ministry of the
land property
of
Bashkortostan
1.7 9.4 6.7
Total market 25.3 -8.3 100
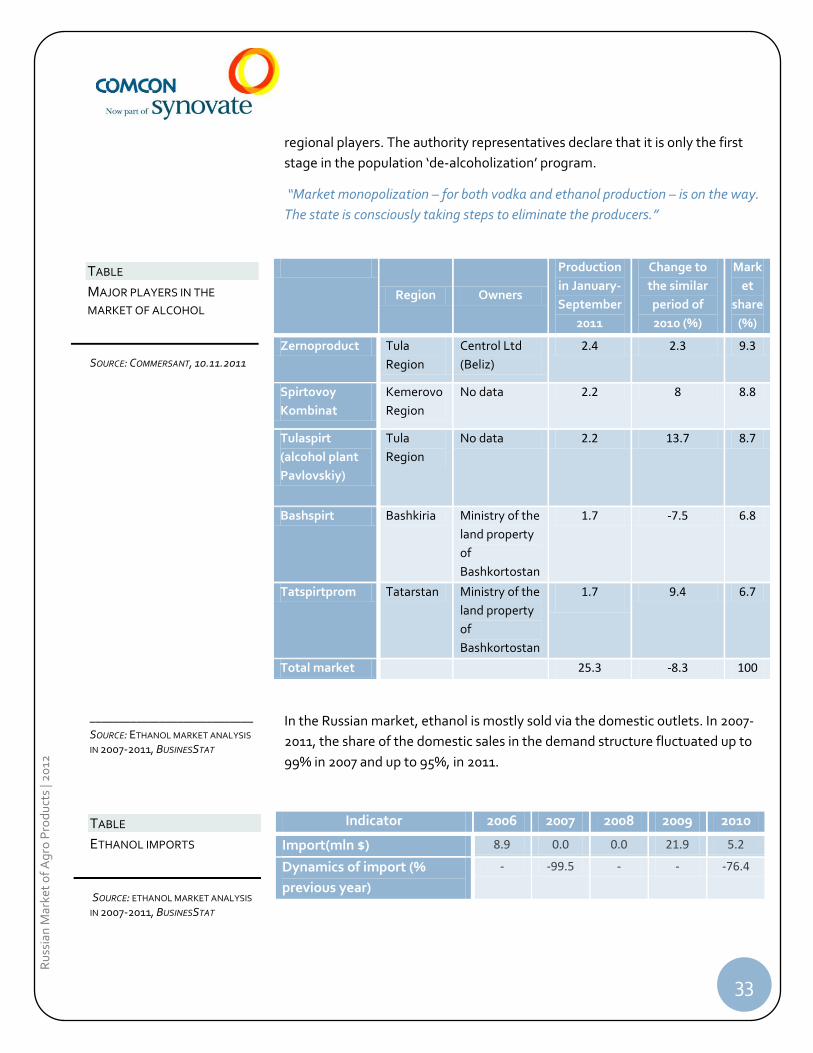
In the Russian market, ethanol is mostly sold via the domestic outlets. In 2007-
2011, the share of the domestic sales in the demand structure fluctuated up to
99% in 2007 and up to 95%, in 2011.
Indicator 2006 2007 2008 2009 2010
Import(mln $) 8.9 0.0 0.0 21.9 5.2
Dynamics of import (%
previous year)
- -99.5 - - -76.4
TABLE
MAJOR PLAYERS IN THE
MARKET OF ALCOHOL
SOURCE: COMMERSANT, 10.11.2011
TABLE
ETHANOL IMPORTS
SOURCE: ETHANOL MARKET ANALYSIS
IN 2007-2011, BUSINESSTAT
____________________________
SOURCE: ETHANOL MARKET ANALYSIS
IN 2007-2011, BUSINESSTAT

34
Ru
ssia
n M
arke
t o
f A
gro
Pro
du
cts
| 20
12
Sugar Industry
In the Russian Federation, sugar beet is one of the principal industrial crops
providing root crops rich in carbohydrates that are used to produce sugar. In
storage or in transportation, sugar beet quality is swiftly deteriorating, so sugar
mills are located close to the raw stock sources.
Overall, about 20 regions of the Russian Federation are seeding sugar beet, and
those are where the sugar mills are located. Clearly, we can highlight two belts
of the sugar industry in Russia: the northern one that pierces the Central Black-
earth Belt and Volga Region up to the Cis-Urals region (Bashkiria) and the
southern (near-Caucasus) one (Krasnodar Territory and, to a lesser extent,
Adygea, Karachay-Cherkessia and Stavropol Territory). A small area of
beetroot seeding and sugar production is located in the south of Western
Siberia (Altay Territory); in the Far East (Primorye) there is a sugar mill (and it
produces from imported cane raw-sugar). The largest producer of sugar beet in
Russia is Krasnodar Territory. Over 25% of sugar beet is grown there per
annum; 16 producing sugar mills have been built there.
2011 was peculiar through a record-breaking crop sugar beet yield: 48 million
tons vs. 19.9 million tons in the previous year. The sugar production is expected
to exceed 5.5 million tons. The volume of products made in Russia may total
140-150 thousand tons in November already. The buyers are the CIS countries,
in particular, Kazakhstan and Uzbekistan.
Processing
The sugar crops market is one of the troubled markets in Russia. Among the
conditions that hinder the industry development are the ‘black’ and ‘grey’
imports of raw stock and the imports of raw sugar from India, Pakistan, Ukraine
and Brazil.
As per the estimation by IKAR, in 2011 the Russian sugar industry capacity was
$6.5 billion (wholesale ‘warehouse’ prices), incl. imported white sugar ($0.4
billion).
As for the structure of the sugar product offering, the leading segment here is
the ‘sugar beet sand sugar’ whose share is 60%.
As per the Rosstat data, the sugar consumption during a season is widely
fluctuating, the maximum demand being noted from May through September.
This is explained by the sugar purchases for homemade preserves by the
population. In the end of the year, more sugar is consumed by the
confectionary industry.
____________________________
SOURCE: «PROFILE OF RUSSIAN SUGAR
INDUSTRY», INSTITUTE OF
AGRICALTURAL MARKET, 2011
35
Ru
ssia
n M
arke
t o
f A
gro
Pro
du
cts
| 20
12
Sugar consumption by the population amounts to 50% from the overall volume,
while the food processing industry consumes about 30%, HoReCa takes 8%,
organizations consume 1%, non-food consumption accounts for 1%, and 10% is
classified as miscellaneous consumption.
As a whole, the situation on the sugar market is far from being favorable: in
Russia, less than a third of the previously producing sugar mill are functioning;
the technology and equipment are morally and materially outdated, many
enterprises have gone bankrupt or changed ownership.
The long-awaited help from the state arrived as the “Development of Sugar Beet
and Sugar Production Subindustry for 2010-2012” program. The program has
been developed to support the industry by lowering the taxation of the
domestic sugar producers and tightening the control over the imported raw
stock. The industry was to be stimulated by the construction of new beet sugar
mills. This will allow for increasing the annual sugar production up to 5-6
million tons and enlarging the seeded lands by 30%. As per the industry
stimulation program, 60 billion rubles have been allotted for upgrading the
industry and subsidizing loan interest rates, as well as purchasing the
equipment, seeds, fertilizers and crop protection.
Currently, the production of sugar beet in Russia is controlled by the 5 largest
holdings. Through uniting the mills and exchanging expertise, they managed to
substantially lower the production prime cost and invest considerable amounts
into the production facilities’ upgrades. The acknowledged leaders in the
industry are 7 companies that within the recent few years have been controlling
no less than ¾ of the market (here, raw sugar operations are also taken into
account).
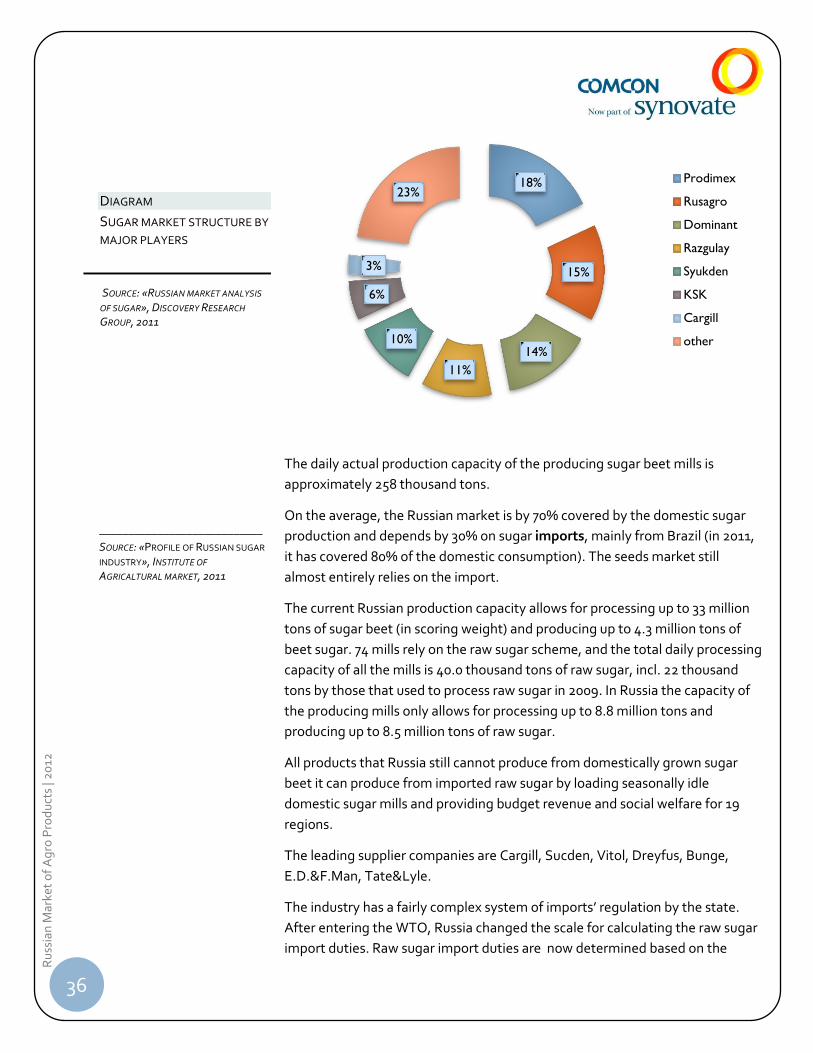
36
Ru
ssia
n M
arke
t o
f A
gro
Pro
du
cts
| 20
12
The daily actual production capacity of the producing sugar beet mills is
approximately 258 thousand tons.
On the average, the Russian market is by 70% covered by the domestic sugar
production and depends by 30% on sugar imports, mainly from Brazil (in 2011,
it has covered 80% of the domestic consumption). The seeds market still
almost entirely relies on the import.
The current Russian production capacity allows for processing up to 33 million
tons of sugar beet (in scoring weight) and producing up to 4.3 million tons of
beet sugar. 74 mills rely on the raw sugar scheme, and the total daily processing
capacity of all the mills is 40.0 thousand tons of raw sugar, incl. 22 thousand
tons by those that used to process raw sugar in 2009. In Russia the capacity of
the producing mills only allows for processing up to 8.8 million tons and
producing up to 8.5 million tons of raw sugar.
All products that Russia still cannot produce from domestically grown sugar
beet it can produce from imported raw sugar by loading seasonally idle
domestic sugar mills and providing budget revenue and social welfare for 19
regions.
The leading supplier companies are Cargill, Sucden, Vitol, Dreyfus, Bunge,
E.D.&F.Man, Tate&Lyle.
The industry has a fairly complex system of imports’ regulation by the state.
After entering the WTO, Russia changed the scale for calculating the raw sugar
import duties. Raw sugar import duties are now determined based on the
18%
15%
14%
11%
10%
6%
3%
23% Prodimex
Rusagro
Dominant
Razgulay
Syukden
KSK
Cargill
other
DIAGRAM
SUGAR MARKET STRUCTURE BY
MAJOR PLAYERS
SOURCE: «RUSSIAN MARKET ANALYSIS
OF SUGAR», DISCOVERY RESEARCH
GROUP, 2011
____________________________
SOURCE: «PROFILE OF RUSSIAN SUGAR
INDUSTRY», INSTITUTE OF
AGRICALTURAL MARKET, 2011
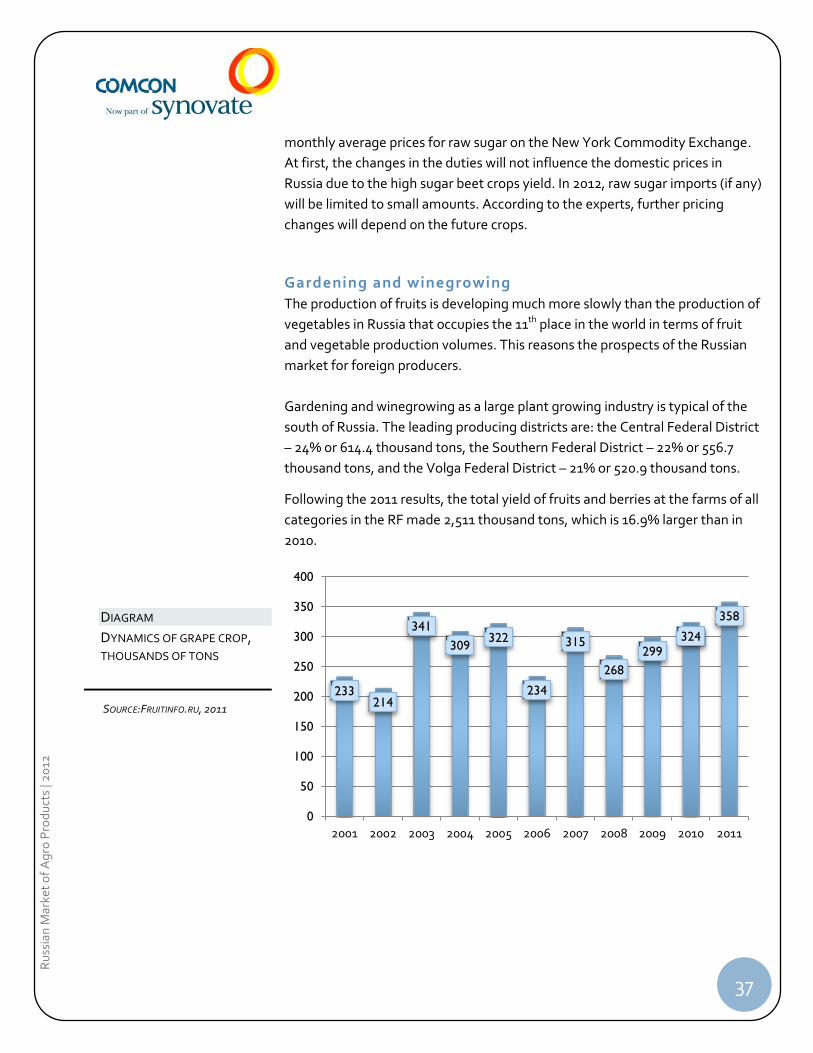
37
Ru
ssia
n M
arke
t o
f A
gro
Pro
du
cts
| 20
12
monthly average prices for raw sugar on the New York Commodity Exchange.
At first, the changes in the duties will not influence the domestic prices in
Russia due to the high sugar beet crops yield. In 2012, raw sugar imports (if any)
will be limited to small amounts. According to the experts, further pricing
changes will depend on the future crops.
Gardening and winegrowing
The production of fruits is developing much more slowly than the production of
vegetables in Russia that occupies the 11th place in the world in terms of fruit
and vegetable production volumes. This reasons the prospects of the Russian
market for foreign producers.
Gardening and winegrowing as a large plant growing industry is typical of the
south of Russia. The leading producing districts are: the Central Federal District
– 24% or 614.4 thousand tons, the Southern Federal District – 22% or 556.7
thousand tons, and the Volga Federal District – 21% or 520.9 thousand tons.
Following the 2011 results, the total yield of fruits and berries at the farms of all
categories in the RF made 2,511 thousand tons, which is 16.9% larger than in
2010.
233 214
341
309 322
234
315
268
299 324
358
0
50
100
150
200
250
300
350
400
2001 2002 2003 2004 2005 2006 2007 2008 2009 2010 2011
DIAGRAM
DYNAMICS OF GRAPE CROP,
THOUSANDS OF TONS
SOURCE:FRUITINFO.RU, 2011
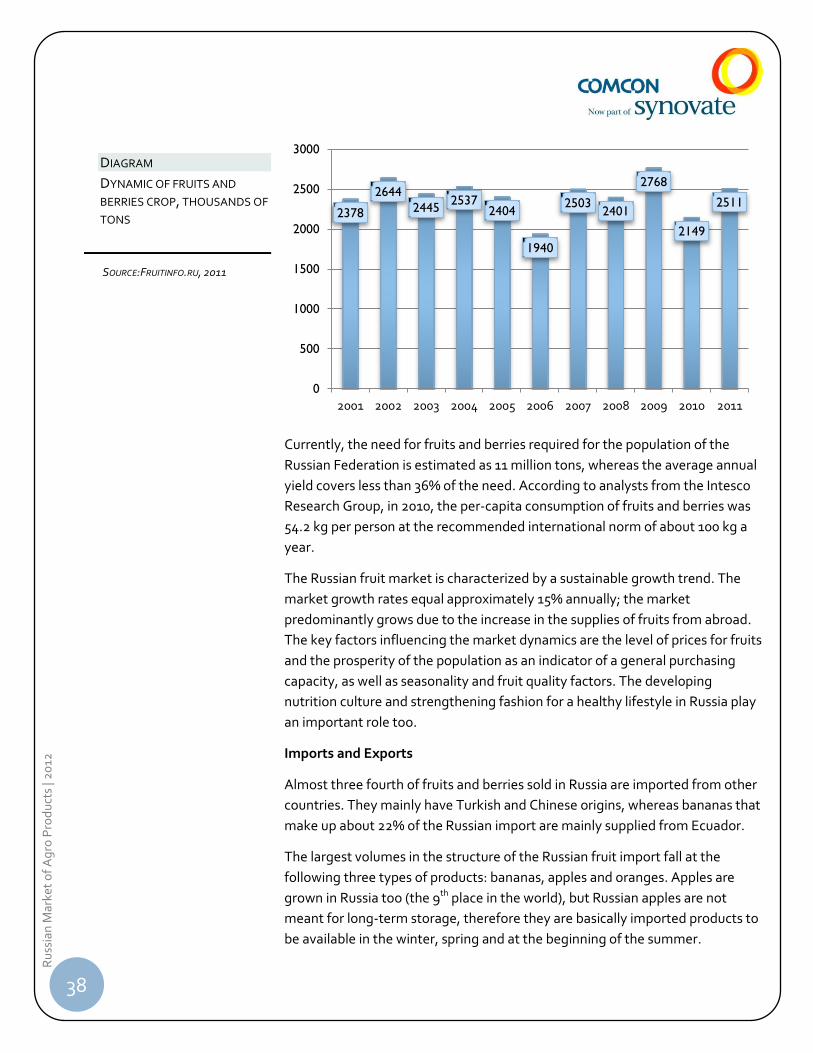
38
Ru
ssia
n M
arke
t o
f A
gro
Pro
du
cts
| 20
12
Currently, the need for fruits and berries required for the population of the
Russian Federation is estimated as 11 million tons, whereas the average annual
yield covers less than 36% of the need. According to analysts from the Intesco
Research Group, in 2010, the per-capita consumption of fruits and berries was
54.2 kg per person at the recommended international norm of about 100 kg a
year.
The Russian fruit market is characterized by a sustainable growth trend. The
market growth rates equal approximately 15% annually; the market
predominantly grows due to the increase in the supplies of fruits from abroad.
The key factors influencing the market dynamics are the level of prices for fruits
and the prosperity of the population as an indicator of a general purchasing
capacity, as well as seasonality and fruit quality factors. The developing
nutrition culture and strengthening fashion for a healthy lifestyle in Russia play
an important role too.
Imports and Exports
Almost three fourth of fruits and berries sold in Russia are imported from other
countries. They mainly have Turkish and Chinese origins, whereas bananas that
make up about 22% of the Russian import are mainly supplied from Ecuador.
The largest volumes in the structure of the Russian fruit import fall at the
following three types of products: bananas, apples and oranges. Apples are
grown in Russia too (the 9th place in the world), but Russian apples are not
meant for long-term storage, therefore they are basically imported products to
be available in the winter, spring and at the beginning of the summer.
2378
2644
2445 2537
2404
1940
2503 2401
2768
2149
2511
0
500
1000
1500
2000
2500
3000
2001 2002 2003 2004 2005 2006 2007 2008 2009 2010 2011
DIAGRAM
DYNAMIC OF FRUITS AND
BERRIES CROP, THOUSANDS OF
TONS
SOURCE:FRUITINFO.RU, 2011
39
Ru
ssia
n M
arke
t o
f A
gro
Pro
du
cts
| 20
12
According to analysts from the Intesco Research Group, in 2011 over 5.7 million
tons of fruits and berries in the territory of the RF, which is 3% larger than in
2010, were imported.
Russia has traditionally been one of the largest importers of apples (the world
share being 27%) and pears. After Russia joined the World Trade Organization
(WTO), import duties for these types of fruits are going to become at least 2
times smaller. This will hardly significantly influence the cost of apples, since
customs duties are not high for them now. The customs duties for pears now
are 10% of the customs cost. It has stayed the same after joining the WTO, but
it will drop down to 5% by year 2015.
There has been rather an unfavorable situation for the development of Russian
gardening in the past ten years in our country.
The drop in production volumes and the competitiveness of Russian-made
gardening and winemaking products has led to the decrease in the export of
fruits and berries from the country from 19.1 million dollars in 2010 to 18.2
million dollars last year, or by 4.7%. The largest relative weight in the product
structure of the export was typical of fresh (55.9%) and deep-frozen (38.1%)
gardening and winemaking products, and preserved (meant for short-term
storage) and dried products — 5.3 and 0.7%, respectively. The basic fresh export
products were nuts and wild berries (blackberry, cranberry) — 49.7 and 40.6%
of the total export of fresh fruits and berries.
One of the negative trends in the development of foreign trade is almost a
complete termination of apples export, although now they make up 40-45% in
the total gardening production volumes for the whole category of farms in the
country. The termination of the apples export has taken place due to the
bankruptcy of gardeners’ farms and loss of markets. Last year, the main
purchasers of products were as follows: nuts — Greece (25% of the total export
volumes), Moldova (18%); wild berries — Poland (62%) and Lithuania (27%);
apples — Turkey (37%); drupaceous fruits — Austria (77.5%); raspberry —
Poland (100%); currants — Germany (91%); deep-frozen berries — Poland
(26%) and Austria (26%); dried fruits — Poland (64%); grapes — Belarus (59%).
The central place in the market of fruits and berries belongs to the wholesale
and retail trade and market infrastructure.
Investments
In years to come, the state is going to reform the trade in fruits and berries by
deepening its specialization, developing competition and cooperation, as well
40
Ru
ssia
n M
arke
t o
f A
gro
Pro
du
cts
| 20
12
as strengthening the material and technical storage base, product processing
and product sales. At the end of 2011, an up-to-date vegetable and fruit storage
facility with the storage capacity of 5 thousand tons was commissioned in the
capital of Kabardino-Balkaria, Nalchik, at LLC Sady Elbrusa. However, most
often they build vegetable storage facilities and logistics centers for the
acceptance and primary processing of vegetables in Russia.
The Russian fruit market has a high growth potential, which is contributed to by
the actively developing healthy nutrition culture and the growing level of
prosperity among the Russian citizens.
Processing
Processing of fruits and berries in Russia is underdeveloped, although the
product processing market is attractive. Thus, 95% of deep-frozen fruits and
berries have foreign origins. Only 18% of the harvested crop of Russian fruits is
meant for processing. The largest volume is grown for the ‘fresh’ market.
Fruits and berries are mainly processed for the juice industry. It uses about 15%
of Russian raw materials. This is basically reasoned with climatic conditions,
due to which it is impossible to develop a sufficient production of, for example,
apple, plum and tomato concentrates.
The juice market is at the saturation level of 3 million liters and is characterized
by severe competition.
The key players here are PepsiCo, Coca-Cola, OJSC Wimm-Bill-Dann Foods,
OJSC Nidan Juices. However, in January 2011, PepsiCo purchased 66% of the
shares of the Russian subdivision of Wimm-Bill-Dann (Wimm-Bill-Dann Foods).
According to the FAS, the share of the united company in the juice market was
42-47%.
The share of imported products in the juice market is insignificant and equals
only 2%. Products are predominantly imported from the Netherlands, China,
Ukraine, Israel and Poland.
Raw materials are supplied at lower rates in the segment of deep-frozen fruits,
where the share of Russian raw materials is only 5%. Apart from the climatic
factor, a reason is that the culture of growing fruits and vegetables for deep-
freezing is underdeveloped, as well as the fact that
____________________________
SOURCE: SIG COMBIBLOC, «JUICE
MARKET RUSSIA 2012»
41
Ru
ssia
n M
arke
t o
f A
gro
Pro
du
cts
| 20
12
“...juice producers are profitable clients for farms, as they procure fruits in large
amounts, whereas the manufacturers of deep-frozen products can enjoy only
remainders.”
According to experts, a competitive benefit in the deep-freezing segment (both
fruits and vegetables) in the market will be enjoyed by the companies that are
able to organize full-cycle production processes, when products are not only
packaged, but are also grown in Russia.
This market is actively growing with 12% annually, on average. Experts say that
the sales of deep-frozen vegetables and fruits in Russia are going to grow by
7.2% annually, on average. In 2015, the sales volume will equal 427 thousand
tons.
Up to 70% of the deep-frozen vegetables and mushrooms market volume is
imported into Russia from Poland. These products are also supplied from China,
the Netherlands, Ukraine and other countries. The basic importers of deep-
frozen berries are Poland and China – they cover 61 and 18% of the supplies,
respectively.
The main suppliers of deep-frozen semi-finished goods made of plant resources
in Russia are as follows:
Polish companies: Hortex (Polski Ogrod Sp. z.o.o.), Hortino ZPOW SP.
Z.O.O, Frosta Sp. z.o.o., Oerlemans Food Siemiatycze Sp. z.o.o. and
ZPS Makow Sp. z.o.o.;
Dutch companies: Aviko B.V. and Freezitt B.V.;
French Bonduelle Group of companies;
Belgian Ardo NV and Mondi Foods NV;
German Frosta AG.
The segment of processing wild-growing cultures, such as berries and
mushrooms, is developing too. International companies are investing much
money in equipment and training in the Russian market, however, this is typical
mainly of the primary processing of berries, whereas they prefer to process
them at their own facilities outside Russia. It means that Russian manufacturers
are losing a significant portion of the added value due to that.
Medical herbs
The Russian market of medical herbs and mixes is characterized by a growth
trend; however, the market volume and its share in the total market of
pharmaceutical products look rather modest today and equal 11-12 million
EXPERT OPINION
____________________________
SOURCE: «RESEARCH OF MARKET
FROZEN VEGETABLES AND FRUIT, CJSC
INFORMATION AGENCY CREDINFORM,2011
42
Ru
ssia
n M
arke
t o
f A
gro
Pro
du
cts
| 20
12
dollars or 0.5-1.5%. Similar products cover up to 10% of the total volume of the
pharmaceutical market in the countries of the European Union.
The leading manufacturers of medical herbs and mixes are OJSC
Krasnogorskleksredstva, CJSC ST Medifarm, LLC People’s Medicine Medical
Company. The large manufacturers of medical herbs and mixes working
outside the central regions are CJSC Evalar and LLC Travy Bashkirii.
The largest Russian manufacturers of medical herbs and mixes (for example,
Krasnogorskleksredstva, People’s Medicine) make the largest portion of their
products from imported raw materials, whereas they receive them mainly from
Poland, Bulgaria, as well as Egypt and some other countries. However, the
share of the Russian medical herbs export is extremely small with due account
for the significant potential in this sphere.
Impediments in the development of the medical herbs and mixes production in
Russia are connected with the fact that, despite the high profitability of
cultivating even the simplest medical herbs (for example, chamomile or
valerian) that is two times more profitable than the profitability of growing
wheat, specialized farms that existed earlier practically do not function now.
Farms usually take no interest in cultivating medical herbs due to the significant
remoteness of commercial profits from crops in time. Crops start to bring
profits in at least two-three years for most medical herbs – it is inexpedient to
harvest them earlier. It is almost unreal in Russia to find loans under the terms
of receiving economic returns in two-three years today. A similar situation is
also typical of harvesting wild-growing herbs: despite their popularity not only
in Russia, but also abroad, it is often hard to accumulate enough means for
lending a harvesting campaign (it usually takes two-three months a year) in a
single step. The consequence of the existing situation is the low quality of raw
materials harvested by unprofessional harvesters.
The prospects for the development of the Russian medical herbs and mixes
market are largely connected with the state’s ability to create conditions for
enhancing the attractiveness of this business line both for Russian
manufacturers and for lending and investment structures.
Tobacco
Currently, Russia takes 3rd place after China and the United States in tobacco
production - more than 400 billion pieces of cigarettes per year. Practically all
tobacco products in circulation in Russia, produced domestically, and the
tobacco industry is currently one of the most stable industries in Russian
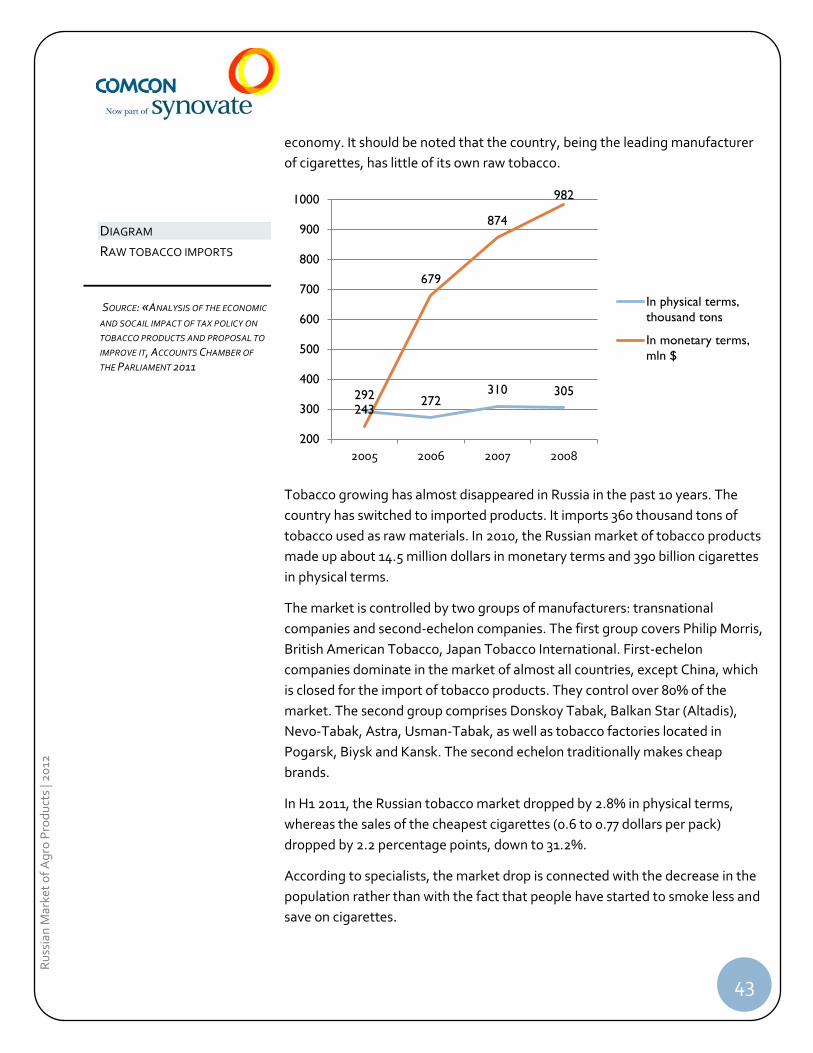
43
Ru
ssia
n M
arke
t o
f A
gro
Pro
du
cts
| 20
12
economy. It should be noted that the country, being the leading manufacturer
of cigarettes, has little of its own raw tobacco.
Tobacco growing has almost disappeared in Russia in the past 10 years. The
country has switched to imported products. It imports 360 thousand tons of
tobacco used as raw materials. In 2010, the Russian market of tobacco products
made up about 14.5 million dollars in monetary terms and 390 billion cigarettes
in physical terms.
The market is controlled by two groups of manufacturers: transnational
companies and second-echelon companies. The first group covers Philip Morris,
British American Tobacco, Japan Tobacco International. First-echelon
companies dominate in the market of almost all countries, except China, which
is closed for the import of tobacco products. They control over 80% of the
market. The second group comprises Donskoy Tabak, Balkan Star (Altadis),
Nevo-Tabak, Astra, Usman-Tabak, as well as tobacco factories located in
Pogarsk, Biysk and Kansk. The second echelon traditionally makes cheap
brands.
In H1 2011, the Russian tobacco market dropped by 2.8% in physical terms,
whereas the sales of the cheapest cigarettes (0.6 to 0.77 dollars per pack)
dropped by 2.2 percentage points, down to 31.2%.
According to specialists, the market drop is connected with the decrease in the
population rather than with the fact that people have started to smoke less and
save on cigarettes.
292 272 310 305
243
679
874
982
200
300
400
500
600
700
800
900
1000
2005 2006 2007 2008
In physical terms,
thousand tons
In monetary terms,
mln $
DIAGRAM
RAW TOBACCO IMPORTS
SOURCE: «ANALYSIS OF THE ECONOMIC
AND SOCAIL IMPACT OF TAX POLICY ON
TOBACCO PRODUCTS AND PROPOSAL TO
IMPROVE IT, ACCOUNTS CHAMBER OF
THE PARLIAMENT 2011

44
Ru
ssia
n M
arke
t o
f A
gro
Pro
du
cts
| 20
12
The sales of cigarettes from the premium segment (over 1.3 dollars per pack)
grew up to 16.2% of the market vs. 15.8% a year ago.
In recent years, there has been the serious tightening of the tobacco industry
regulation in Russia. In 2008, Russia joined the Framework Convention on
Tobacco Control. In 2010, Russia approved new technical regulations for
tobacco products that imply the increase in the size of a warning about the
harm done by smoking. A Concept of the state policy meant to counteract
tobacco consumption for years 2010-2015 covering all spheres of tobacco
regulation, such as smoking at public places, cigarette advertising and sales,
was also signed. Besides, an excise tax was increased and a law on the
regulation of the retail sales of alcohol products via kiosks and pavilions that
can trigger the elimination of many kiosks and pavilions selling beer and
cigarettes was passed in 2010.
Despite the measures taken, the import of cigarette products to Russia remains
relatively stable. Imported cigarettes provide a small share of the Russian
tobacco market, about 1% of the domestic production. World leaders seek to
move tobacco production in Russia, including the most modern types of
packages or the most promising segments (thin, aromatic, all-natural, etc.),
which reduces the need to import.
The largest tobacco importers into Russia are the USA, Germany, Great Britain,
Japan and Holland.
Annual export of cigarettes from Russia in the period from 2005 to 2009
increased by almost 2-fold. Thus, in 2005 exports was 9.5 billion cigarettes, in
3,43
6,78
3,47
5,68
5,06
2,96
0
1
2
3
4
5
6
7
8
2005 2006 2007 2008 2009 2010
DIAGRAM
IMPORTS OF CIGARETTES,
MLN. PIECES
SOURCE: «ANALYSIS OF THE ECONOMIC
AND SOCAIL IMPACT OF TAX POLICY ON
TOBACCO PRODUCTS AND PROPOSAL TO
IMPROVE IT, ACCOUNTS CHAMBER OF
THE PARLIAMENT 2011
45
Ru
ssia
n M
arke
t o
f A
gro
Pro
du
cts
| 20
12
2009 its volume was 18.5 billion (according to other sources 20 billion). Russian
cigarettes are exported both to CIS countries and foreign countries, but the
bulk goes the CIS. In 2010, total exports of tobacco products was $ 288.5
million, in the ratio 11% to 89% between the CIS countries and others,
respectively.The main volume of cigarettes is exported to Belarus and
Kazakhstan.
Flax
According to experts, Russia is the fourth largest flax fiber producer in the world
today. China is the largest producer of flax and cotton, surpassing other
manufacturers by a wide margin as it produces over 40 percent of the total
world output of flax. Insufficient efficiency of Russian enterprises together with
a low quality of output prevent Russia from ranking higher among the world’s
largest flax producers.
Labor costs to produce 100 kilograms of flax fiber are 4 to 5 times higher than in
leading foreign agricultural enterprises. Cropping capacity of this culture is not
very high in Russia either. In 2011, an average crop yield of flax fiber equaled 9
hundred kilograms per hectare. To compare, this metric in China amounts to 28
hundred kilograms per hectare, in the EU countries – 12 hundred kilograms per
hectare.
In order to take the industry to a higher level, the authorities are planning to
channel $10 million from the federal budget to support flax production.
Meanwhile, in order to bolster flax production, $6.5 million dollars will be
allocated from regional budgets this year; $8 million in 2013 and $5.2 million in
2014. The total amount of state aid within the framework of the national flax
fiber production program will equal $73 million. The Ministry of Agriculture
counts on this state aid to increase flax production 3.3 – 6.2-fold compared with
2010, boost linen produce 3.9 – 6.9-fold price-wise (increasing it to 64.3 – 114.4
billion rubles by 2020), and raise exports 2.5 – 3-fold.
This is the third time the Russian government has made an attempt at restoring
the domestic flax production complex. The program of development of flax
production complex in Russia in 1996 – 2000 received only 5.7 percent of the
envisioned funds - $6.9 million instead of $119 million. Nevertheless, it boosted
commercial viability and demand for Russian linen fabrics and products both on
the domestic and foreign market.
The program of development of flax production complex in Russia in 2008 –
2010 was the second attempt of the Agriculture Ministry to raise the domestic
flax production to a new level. The government assigned $14.2 million to
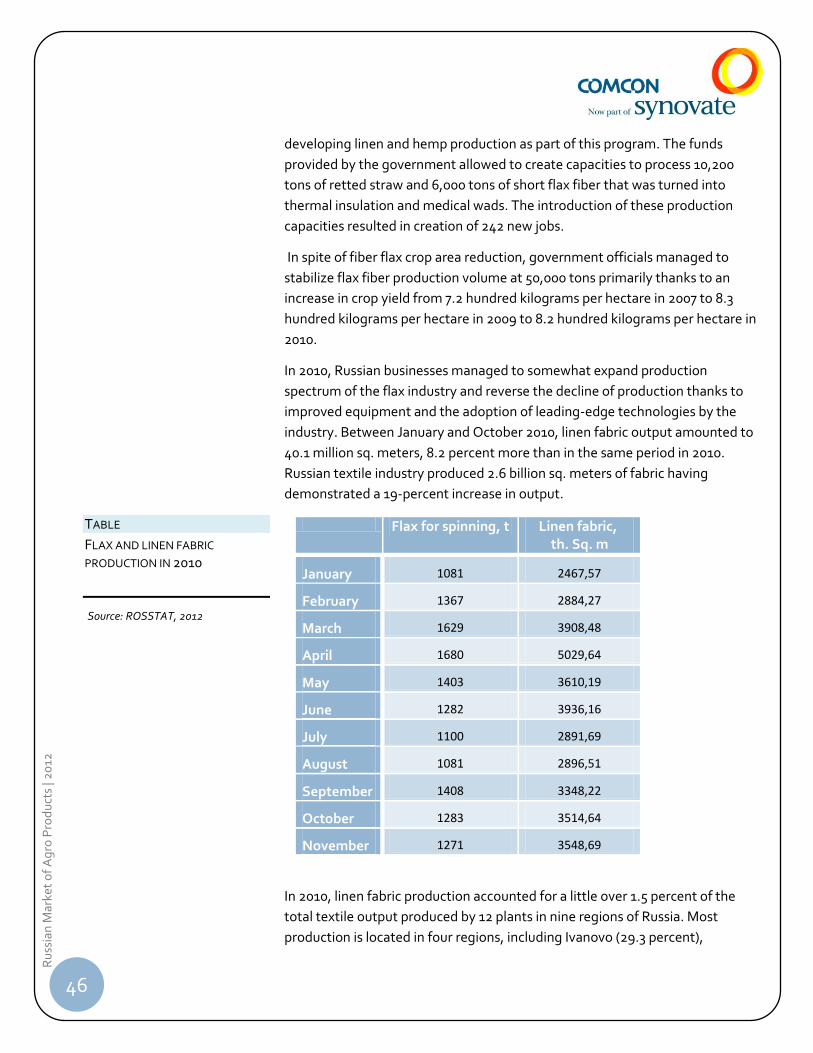
46
Ru
ssia
n M
arke
t o
f A
gro
Pro
du
cts
| 20
12
developing linen and hemp production as part of this program. The funds
provided by the government allowed to create capacities to process 10,200
tons of retted straw and 6,000 tons of short flax fiber that was turned into
thermal insulation and medical wads. The introduction of these production
capacities resulted in creation of 242 new jobs.
In spite of fiber flax crop area reduction, government officials managed to
stabilize flax fiber production volume at 50,000 tons primarily thanks to an
increase in crop yield from 7.2 hundred kilograms per hectare in 2007 to 8.3
hundred kilograms per hectare in 2009 to 8.2 hundred kilograms per hectare in
2010.
In 2010, Russian businesses managed to somewhat expand production
spectrum of the flax industry and reverse the decline of production thanks to
improved equipment and the adoption of leading-edge technologies by the
industry. Between January and October 2010, linen fabric output amounted to
40.1 million sq. meters, 8.2 percent more than in the same period in 2010.
Russian textile industry produced 2.6 billion sq. meters of fabric having
demonstrated a 19-percent increase in output.
Flax for spinning, t Linen fabric, th. Sq. m
January 1081 2467,57
February 1367 2884,27
March 1629 3908,48
April 1680 5029,64
May 1403 3610,19
June 1282 3936,16
July 1100 2891,69
August 1081 2896,51
September 1408 3348,22
October 1283 3514,64
November 1271 3548,69
In 2010, linen fabric production accounted for a little over 1.5 percent of the
total textile output produced by 12 plants in nine regions of Russia. Most
production is located in four regions, including Ivanovo (29.3 percent),
TABLE
FLAX AND LINEN FABRIC
PRODUCTION IN 2010
Source: ROSSTAT, 2012
47
Ru
ssia
n M
arke
t o
f A
gro
Pro
du
cts
| 20
12
Kostroma (24.8 percent), Vladimir (21 percent), and Vologda (15.4 percent).
Three enterprises produce more than a half of the total output. OOO
Privolzhskaya Otdelochnaya Fabrika is the leading domestic manufacturer of
linen goods with 20.6 percent of the total output. OOO BKLM-Active is the
second largest manufacturer producing 20.1 percent of all linen fabric in Russia.
OAO Vologodskiy Textile is the third largest linen fabric producer with 15.4
percent of the market share.
While carrying out the flax production complex development program,
government officials intend to focus on encouraging manufacturing of new
medical and sanitary-and-hygienic products that make use of unique natural
properties of flax like increased capillary capacity, moisture absorption,
antiseptic properties, and improved safety. Currently, there are practically no
manufacturers of non-woven materials containing flax and its derivatives in
Russia.
There is a certain potential in using flax while manufacturing insulating
materials for roofs and noise absorption. Linen usage is almost non-existent in
producing medical supplies and pharmaceutical drugs, as well as in military-
industrial production.
Industry representatives agree that modernization of flax plants and textile
factories is needed in order to carry out the formulated plans.
LIVESTOCK BREEDING Structurally, livestock production in Russia consists of poultry industry, swine
breeding, and cattle breeding.
In spite of steady growth of livestock production in Russia since 2002 (especially
in the poultry and pork segments), the general rate of production still falls short
of the output level in 1990. State aid to the meat industry is making a
significant contribution to the development of livestock production. The state
support measures include meat and cattle import quota allocation leading to a
reduction in imports.
Meat production Meat and dairy-and-meat cattle breeding industries mostly of the extensive
type are developed in arid steppes and semi-desert regions such as the Low
48
Ru
ssia
n M
arke
t o
f A
gro
Pro
du
cts
| 20
12
Volga region, North Caucasus, Southern Urals, and Siberian south. Natural
forage grassland in these regions allows for production of the cheapest beef at
minimum labor costs. The development of the meat cattle breeding industry of
the intensive type is characteristic of the regions with sophisticated farming
agriculture and suburban farms. Large cattle breeding complexes implement
cattle-feeding through field fodder production and by using by-products of
commercial crops as a result of industrial processes. Meat cattle breeding of
this type is predominant in the North Caucasus region and in Siberia.
The Volga federal district is the leader in livestock population with 31 percent of
the total cattle stock in Russia. The shares of the Southern federal district
(including North Caucasus) and the Siberian federal district in the total livestock
population stand at 22 percent and 21 percent respectively. The leading regions
in production of all meats are the Belgorod region, the Voronezh region, the
Moscow region, the Leningrad region, the Rostov region, the Saratov region,
the Chelyabinsk region, as well as the Stavropol region, the Republics of
Tatarstan and Bashkortostan, the Krasnodar territory and the Altay territory.
The share of beef in the total meat output in Russia amounts to 25.9 percent.
Poultry has the largest share standing at 38 percent of the total meat output.
Pork makes up 32.3 percent, nearly a third of the total output. Mutton and goat
meat together make up a mere 3 percent of the total meat output calculated in
dead weight.
Poultry takes up the largest share of the total meat and meat foods market in
Russia.
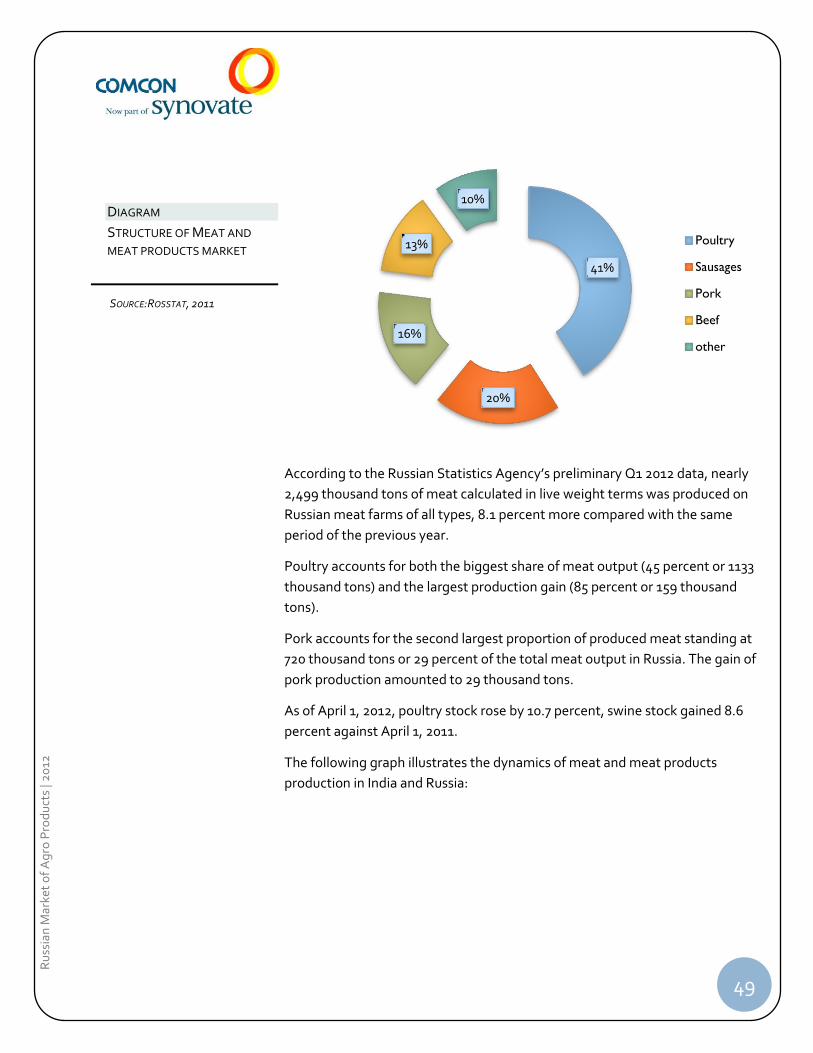
49
Ru
ssia
n M
arke
t o
f A
gro
Pro
du
cts
| 20
12
According to the Russian Statistics Agency’s preliminary Q1 2012 data, nearly
2,499 thousand tons of meat calculated in live weight terms was produced on
Russian meat farms of all types, 8.1 percent more compared with the same
period of the previous year.
Poultry accounts for both the biggest share of meat output (45 percent or 1133
thousand tons) and the largest production gain (85 percent or 159 thousand
tons).
Pork accounts for the second largest proportion of produced meat standing at
720 thousand tons or 29 percent of the total meat output in Russia. The gain of
pork production amounted to 29 thousand tons.
As of April 1, 2012, poultry stock rose by 10.7 percent, swine stock gained 8.6
percent against April 1, 2011.
The following graph illustrates the dynamics of meat and meat products
production in India and Russia:
41%
20%
16%
13%
10%
Poultry
Sausages
Pork
Beef
other
DIAGRAM
STRUCTURE OF MEAT AND
MEAT PRODUCTS MARKET
SOURCE:ROSSTAT, 2011
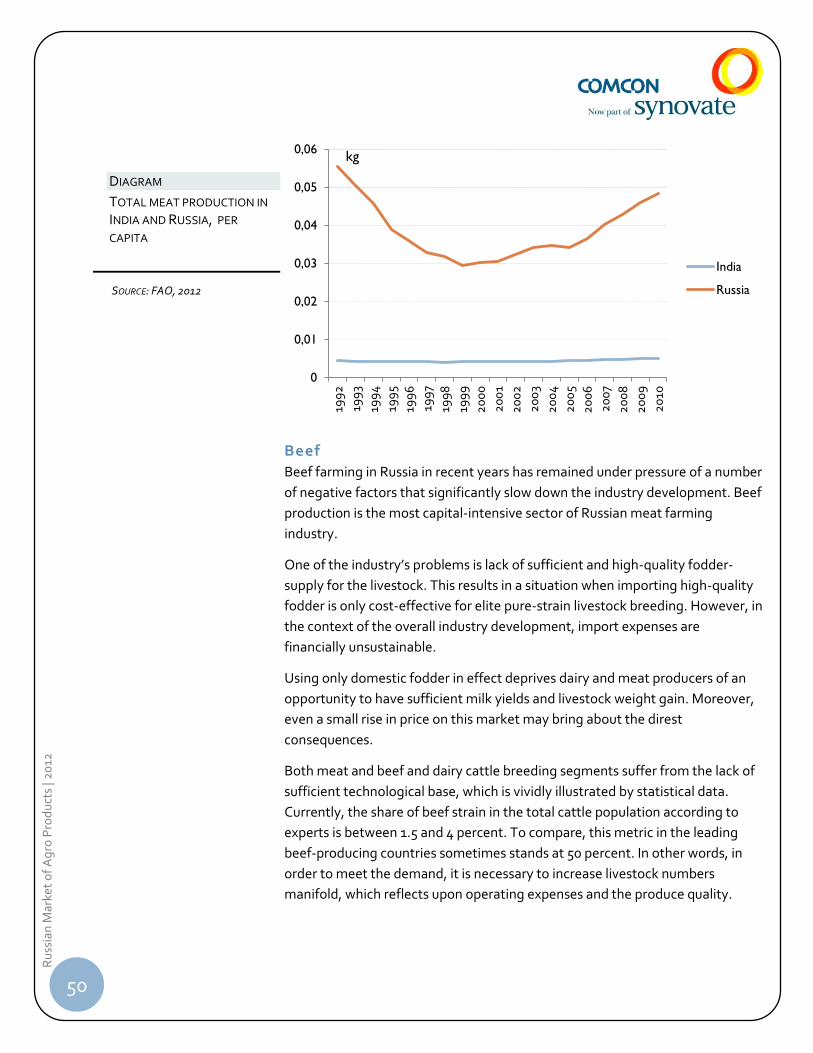
50
Ru
ssia
n M
arke
t o
f A
gro
Pro
du
cts
| 20
12
Beef
Beef farming in Russia in recent years has remained under pressure of a number
of negative factors that significantly slow down the industry development. Beef
production is the most capital-intensive sector of Russian meat farming
industry.
One of the industry’s problems is lack of sufficient and high-quality fodder-
supply for the livestock. This results in a situation when importing high-quality
fodder is only cost-effective for elite pure-strain livestock breeding. However, in
the context of the overall industry development, import expenses are
financially unsustainable.
Using only domestic fodder in effect deprives dairy and meat producers of an
opportunity to have sufficient milk yields and livestock weight gain. Moreover,
even a small rise in price on this market may bring about the direst
consequences.
Both meat and beef and dairy cattle breeding segments suffer from the lack of
sufficient technological base, which is vividly illustrated by statistical data.
Currently, the share of beef strain in the total cattle population according to
experts is between 1.5 and 4 percent. To compare, this metric in the leading
beef-producing countries sometimes stands at 50 percent. In other words, in
order to meet the demand, it is necessary to increase livestock numbers
manifold, which reflects upon operating expenses and the produce quality.
0
0,01
0,02
0,03
0,04
0,05
0,06
199
2
199
3
199
4
199
5
199
6
199
7
199
8
199
9
20
00
20
01
20
02
20
03
20
04
20
05
20
06
20
07
20
08
20
09
20
10
India
Russia
kg
DIAGRAM
TOTAL MEAT PRODUCTION IN
INDIA AND RUSSIA, PER
CAPITA
SOURCE: FAO, 2012
51
Ru
ssia
n M
arke
t o
f A
gro
Pro
du
cts
| 20
12
By late in 1992, the livestock numbers on cattle farms of all types stood at 52.2
million cattle units. By 2011 this figure had fallen by 61 percent to a mere 20.1
million dairy and beef cattle units combined.
Yet another industry problem is an unadjusted contractual system within the
producer-processer-retailer chain. Beef producers earn 25 percent of the retail
meat price at most, while in developed economies this metric stands at 45 – 50
percent.
That said, many experts believe that in the coming years beef farming in Russia
will finally begin to expand demonstrating fairly high growth rates. Several
factors will simultaneously contribute to the projected growth. As the demand
for beef in Russia is rising, the government cut import quotas in order to help
revive the cattle breeding industry. The program for the development of beef
farming in Russia in 2009 – 2012 is beginning to demonstrate tangible results.
However, it is unlikely that all set objectives of the program will be
accomplished. The program is aimed at increasing the numbers of beef strains
to 800 thousand units, including 200 thousand dams by 2012. The program is
also supposed to boost high-quality beef production from meat cattle in terms
of live weight to 282.4 thousand tons by 2012. To compare, in 2011,
approximately 57.6 thousand tons of beef was produced in Russia, meaning the
yearly increase will need to equal 500 percent.
Having seen extremely fast growth rates in the recent years, poultry breeding
and swine breeding sectors are beginning to face new problems, which is a
good sign for the cattle industry. Even though potential for growth in the
poultry and swine sectors is far from being exhausted, the competition has
become so stringent that the largest market players are highly likely to switch
to cattle breeding as a viable alternative.
Retail sales of beef in Russia between 2007 and 2011 fell by nearly 3 percent
from 786 thousand tons to 764 thousand tons. The decline in retail beef sales is
primarily attributed to the supply of substitute-products on the Russian market,
such as poultry, pork, and others sold at lower prices. Retail sales of beef in
Russia between 2012 and 2016 will continue to fall on average by 1 percent a
year. Retail sales of beef in 2016 are expected to stand at 715 thousand tons.
The leading beef-producing Russian regions are the Republic of Bashkortostan,
the Republic of Tatarstan, and the Altay Territory.
In 2011, Russia covered its demand for beef by 72.5 percent. This market
segment shrank between 2009 and 2011 by 8.5 percent (or 13 – 15 percent by
other estimations), a result of industry-wide challenges mentioned above.
____________________________
SOURCE: «BEEF MARKET ANALYSIS,
2011, BUSINESSTAT
____________________________
SOURCE: «RUSSIAN AND WORLD BEEF
MARKET ANALYSIS», 2011 INTESCO
RESEARCH GROUP
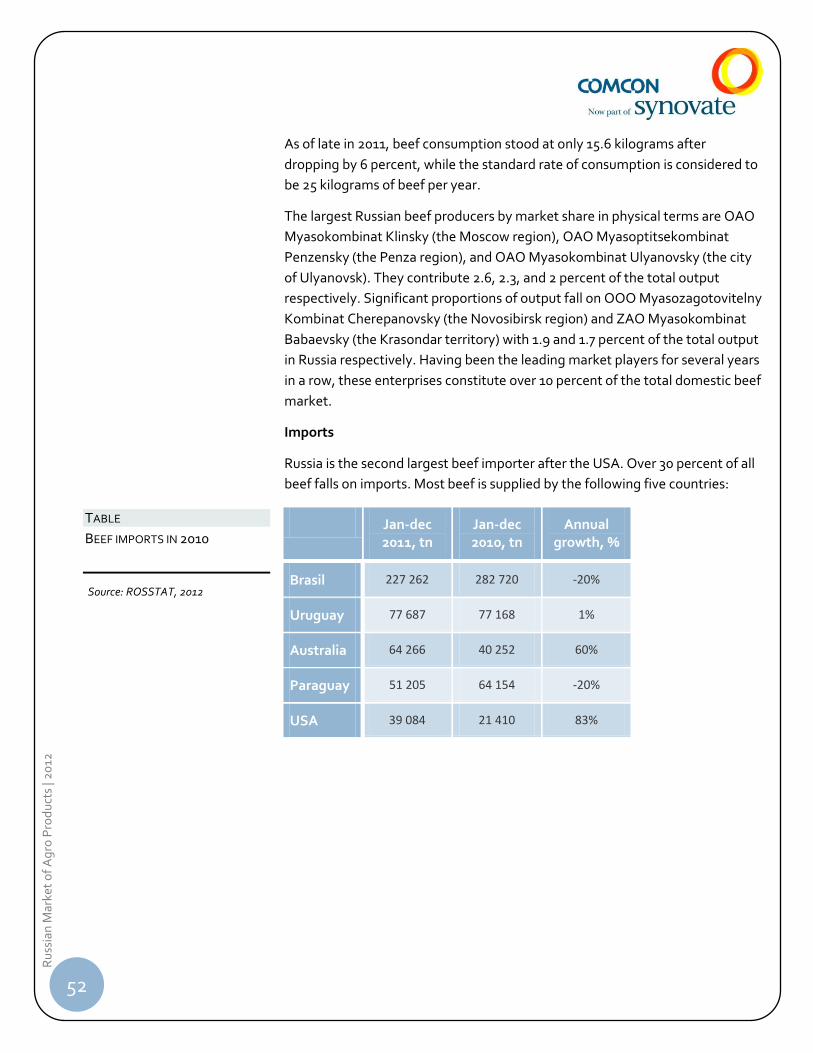
52
Ru
ssia
n M
arke
t o
f A
gro
Pro
du
cts
| 20
12
As of late in 2011, beef consumption stood at only 15.6 kilograms after
dropping by 6 percent, while the standard rate of consumption is considered to
be 25 kilograms of beef per year.
The largest Russian beef producers by market share in physical terms are OAO
Myasokombinat Klinsky (the Moscow region), OAO Myasoptitsekombinat
Penzensky (the Penza region), and OAO Myasokombinat Ulyanovsky (the city
of Ulyanovsk). They contribute 2.6, 2.3, and 2 percent of the total output
respectively. Significant proportions of output fall on OOO Myasozagotovitelny
Kombinat Cherepanovsky (the Novosibirsk region) and ZAO Myasokombinat
Babaevsky (the Krasondar territory) with 1.9 and 1.7 percent of the total output
in Russia respectively. Having been the leading market players for several years
in a row, these enterprises constitute over 10 percent of the total domestic beef
market.
Imports
Russia is the second largest beef importer after the USA. Over 30 percent of all
beef falls on imports. Most beef is supplied by the following five countries:
Jan-dec 2011, tn
Jan-dec 2010, tn
Annual growth, %
Brasil 227 262 282 720 -20%
Uruguay 77 687 77 168 1%
Australia 64 266 40 252 60%
Paraguay 51 205 64 154 -20%
USA 39 084 21 410 83%
TABLE
BEEF IMPORTS IN 2010
Source: ROSSTAT, 2012
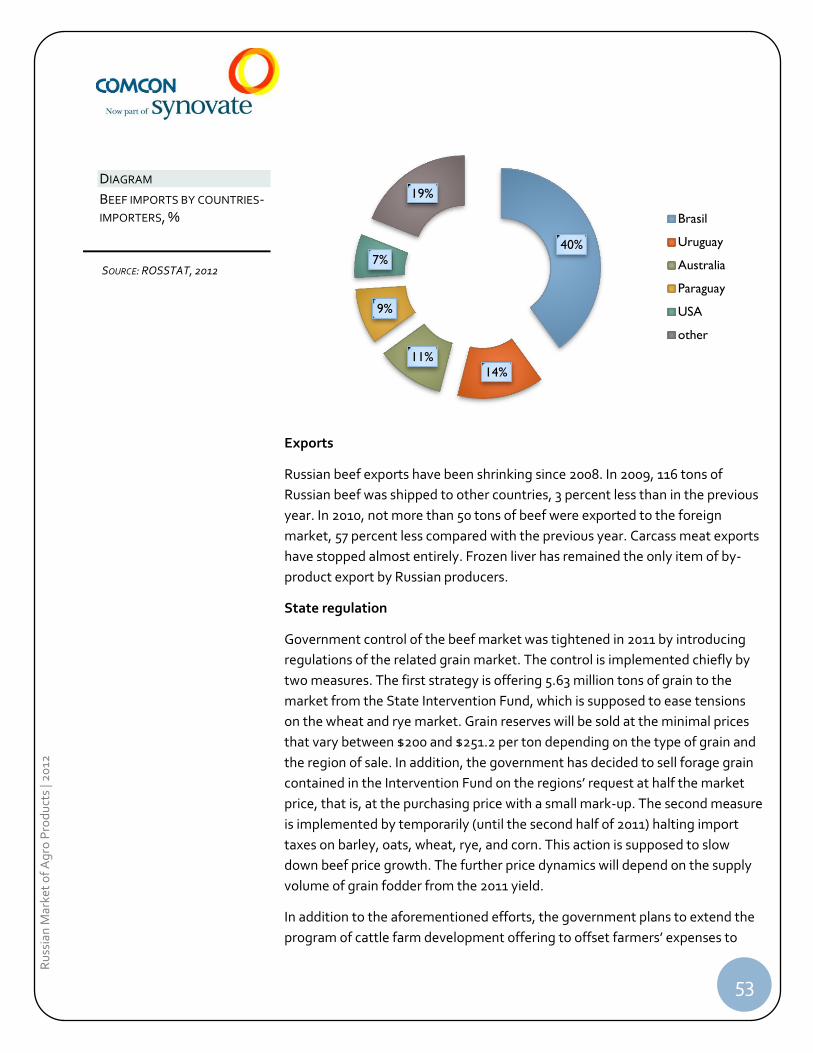
53
Ru
ssia
n M
arke
t o
f A
gro
Pro
du
cts
| 20
12
Exports
Russian beef exports have been shrinking since 2008. In 2009, 116 tons of
Russian beef was shipped to other countries, 3 percent less than in the previous
year. In 2010, not more than 50 tons of beef were exported to the foreign
market, 57 percent less compared with the previous year. Carcass meat exports
have stopped almost entirely. Frozen liver has remained the only item of by-
product export by Russian producers.
State regulation
Government control of the beef market was tightened in 2011 by introducing
regulations of the related grain market. The control is implemented chiefly by
two measures. The first strategy is offering 5.63 million tons of grain to the
market from the State Intervention Fund, which is supposed to ease tensions
on the wheat and rye market. Grain reserves will be sold at the minimal prices
that vary between $200 and $251.2 per ton depending on the type of grain and
the region of sale. In addition, the government has decided to sell forage grain
contained in the Intervention Fund on the regions’ request at half the market
price, that is, at the purchasing price with a small mark-up. The second measure
is implemented by temporarily (until the second half of 2011) halting import
taxes on barley, oats, wheat, rye, and corn. This action is supposed to slow
down beef price growth. The further price dynamics will depend on the supply
volume of grain fodder from the 2011 yield.
In addition to the aforementioned efforts, the government plans to extend the
program of cattle farm development offering to offset farmers’ expenses to
40%
14%
11%
9%
7%
19%
Brasil
Uruguay
Australia
Paraguay
USA
other
DIAGRAM
BEEF IMPORTS BY COUNTRIES-IMPORTERS, %
SOURCE: ROSSTAT, 2012
54
Ru
ssia
n M
arke
t o
f A
gro
Pro
du
cts
| 20
12
purchase young cattle stock and breeding herd. A remission of personal income
tax will be granted to private subsidiary farm owners after a corresponding
amendment to the tax code is passed. The amendments will grant such farmers
tax breaks to purchase cattle and fodder.
No doubt, the efforts to support cattle producers made by the government will
encourage output expansion and increase the supply of beef on the Russian
market. Overall, the beef market is looking forward to a supply surge of grain
from the 2011 yield and a rise in cattle population.
Pork
The Russian pork market is dynamically developing.
According to the National Union of Pig Producers, the pig population continued
growing in 2011, and pig production in the dead weight of farms belonging to
all forms of ownership grew by 6.4%, and since the beginning of the
implementation of the national industry development project – by 47.6%. It has
become 2.3 times larger at enterprises and has almost tripled in five years. This
was contributed to by the reconstruction and modernization of pig complexes,
commissioning new objects and the implementation of the target program
called Development of Pig Production in the Russian Federation in 2010–2012.
It is expected that pork volumes will grow by 200–250 thousand tons this year,
and in 2015 they will exceed 3 million tons in terms of dead weight. It is
expected that meat production volumes will become 8 times larger in the
industrial sector by 2020.
There were produced over 940 thousand tons of pork in Russia in 2011. This
value is significantly higher than the level of year 2010 when they made 838
thousand tons, i.e. 13% larger than a year ago. The largest portion of pork made
in Russia is fresh or cooled pork that covered about 85% of produced pork in
2011. The share of frozen pork and pork by-products was about 7% each in
2011.
The total per-capita supply of Russian and imported pork in 2011 was almost
24.6 kg in the equivalent of dead weight.
The leader in terms of Russian pork production is the Central Federal District
that makes over 40% of these products, whereas the Central, Volga and
Siberian Federal Districts cover about three fourth of these products made in
Russia. Pork is almost not produced in the North Caucasian Federal District
where it is not consumed due to its cultural and religious peculiarities, as well as
55
Ru
ssia
n M
arke
t o
f A
gro
Pro
du
cts
| 20
12
in the Far Eastern Federal District where climatic conditions are inadequate for
producing it.
The main Russian manufacturers forming the internal pork market of Russia are
as follows: Miratorg Agribusiness Holding, LLC Agro-Belgorye Group,
Cherkizovo Group, Prodo Group, OJSC Belgorod Bacon Group.
Imports-exports
The Russian meat-processing industry still strongly depends on imported raw
materials. Russia is the second largest country importing pork after Japan.
The share of imported pork in the Russian market in 2011 was over 40%. The
export of pork from Russia is very small and had little influence on its
consumption volumes inside the country.
Last year, pork import equaled 648 thousand tons, more than a half of it (over
340 thousand tons) falling at the countries of the EU. The largest pork suppliers
are Germany (98 thousand tons), Denmark (79.6 thousand tons), Spain (51.2
thousand tons), France (36 thousand tons). A drop down to 400 thousand tons
or by 17% is expected this year. The largest importer of pork for Russia among
the CIS countries is Belarus. Some part of Belarusian pork is supplied into the
Russian market in a cooled condition. By 2015, Russia is going to become self-
sufficient in terms of pork.
The self-sufficiency of Russia in terms of pork (with due account for the
production of this type of meat in all categories of farms in the country) made
66.7%. In 2010, it was at the level of 66.2%.
State regulation
Until recently, a significant problem for Russian pork producers has been severe
competition with the suppliers of live pigs for slaughtering, the import of which
has not been quoted and has been liable for rather low duties. However,
beginning 2010, the Government of the Russian Federation has increased
duties for importing live pigs (from 5% in 2009 to 40% in 2010), and now
Russian pork manufacturers are more optimistic about the future.
Market participants expect that these and other pig breeding state support
measures will stimulate the development of the industry in the future too.
According to some analysts, the segment will continue growing in 2011-2014 by
6-8% annually, on average.
____________________________
SOURCE: «PIG MEAT MARKET IN 2006-2010”, BUSINESSTAT 2011
____________________________
SOURCE: ANALITICAL DEPARTMENT
AGRORU.COM
56
Ru
ssia
n M
arke
t o
f A
gro
Pro
du
cts
| 20
12
Investments
According to official forecasts, the share of international companies in the
Russian pork market will be actively growing in years to come.
“The Russian market now offers a higher level of prices for pork from
manufacturers. The price for carcass pork in Russia is almost two times higher
than in such countries as Germany, Denmark, France, Spain, the Netherlands,
USA, Canada”
Thus, the Russian Baltic Pork Investment Group from Norway has started to
implement an aggressive expansion in the pork market in Russia. The company
is going to invest $237 million in the construction of four hog-raising farms till
year 2015 and, according to experts, an almost two times larger volume of
investments will be provided for the construction of seven more farms in 2015-
2018 that will comply with the veterinary norms of Russia and the food safety
regulations prescribed by the Federal Service for Veterinary and Phytosanitary
Surveillance.
Poultry
Poultry breeding is the most successful industry of the Russian animal breeding
industry. The poultry production segment has been demonstrating sustainable
growth over a long period of time at the growth rates (in numerical terms) of
11-18% (according to Rosstat) annually since 2004. The further growth in
internal production volumes is expected following the 2012 results, which,
according to experts, might lead to the increase in the whole poultry market.
According to Rosstat, the leader in poultry production in the Russian Federation
is the Central Federal District: following the 2010 results, the share of this
district in the total poultry production volume exceeded 36%.
The key trend is market re-orientation to domestic products.
The volume of the Russian poultry market in 2011 grew by 2.7% to make 3.5
million tons.
The average per-capita consumption of poultry reached 24.8 kg in 2011 in
Russia. This result is rather impressive: the growth made 2% vs. year 2010 and
11% vs. the pre-crisis year. This result is very significant, since the consumption
of poultry has almost reached the value of the biologically required norm of its
consumption.
____________________________
Source: Intesco Research Group, 2012
EXPERT OPINION
57
Ru
ssia
n M
arke
t o
f A
gro
Pro
du
cts
| 20
12
Imports-exports
A drop in the amount of imported products in the Russian market was faced in
years 2007-2011 and in five years it made 28%. In 2011, the share of imported
poultry in the Russian market dropped down to 11% as the result of the
significant decrease in import quotas. The key exporters of poultry into the
Russian market are the USA, Brazil, Germany, France, Germany.
In 2011, more than a half of the volume of poultry imported into the RF was
from the USA (over 60%). Brazil provided 17.4% of the total supply of imported
products in the Russian market. The share of France in the Russian import
structure did not reach 8%. After a significant drop (by 27%) in 2010 caused by
the temporary ban on product export, the share of the USA grew by 13% in
2011, however, it did not reach the share as of year 2009. The share of Brazil
decreased by 5% in 2011.
In Q1 2012, the supplies of Russian products in international markets grew too:
they almost doubled to make 4.1 thousand tons. The key sales markets for
Russian products are Hong Kong and Vietnam. Insignificant volumes were
exported to Abkhazia.
Investments
The dynamic increase in poultry production is going to continue in Russia in the
mid-term perspective. The investment attractiveness of the industry is still
high. Thus, in February 2012 it was reported on more than ten new investment
projects in the poultry industry of Russia that are being constructed and
commissioned now or are going to be implemented in the foreseeable future.
Investments in the largest of them will make 130 to 160 million dollars. The
total volume of poultry production within the framework of these projects is
about 120 thousand tons in terms of dead weight, including 67 thousand tons of
turkey, 20 thousand tons of duck. In total, there was reported on 23 investment
projects in the industry in January-February 2012. According to preliminary
estimates, the total growth in the industry after commissioning these
enterprises will make about 650 thousand tons of poultry. It is expected that
almost all these projects will reach their design capacity in the next two years.
Meat processing
Meat processing is the most dynamically developing segment in the food
processing industry. All the more, its development rates wonder even the world
society: according to the International Trade Association on Machine
____________________________
Source: Analytical Department
AGRORU.com
58
Ru
ssia
n M
arke
t o
f A
gro
Pro
du
cts
| 20
12
Equipment for Food Processing and Packaging, following the 2008-2009
results, Russia became one of the world largest purchasers of machine
equipment for meat processing after making deals worth of over 100 million
euro and did not decrease its rates in 2010 (for comparison: the USA – a
traditional leader – bought equipment to the sum of 76 million euro in this
time).
Currently, the meat processing product market of Russia is saturated enough
and is characterized by the large number of enterprises of various sizes and
specializations, as well as the wide range of products they make.
The market volume is estimated at the level of 2.4 million tons of products. The
manufacture of sausage products in Russia grew by 5% vs. 2010.
The main products of the meat processing industry are sausage products, since
a significant portion of meat (over 30%) has been traditionally used for making
sausage. Sausage supplies into the Russian market are controlled by Russian
manufacturers.
According to analysts, the total consumption of sausage per one Russian citizen
makes 15.5 kg annually. These products have stably been taking the fourth
place in the consumer basket being inferior only to dairy products, vegetables
and fruits and bread. Besides, Moscow region is one of the most developed and
saturated ones. Here, the level of annual per-capita consumption is significantly
higher: approximately 26-27 kg annually. Thus, the capital covers 15 to 25% of
the total Russian market of meat products.
The most popular types of goods in the sausage product market are cooked
sausage, frankfurters and wieners making over 55% of the total volume of this
market altogether, the share of semi-smoked sausage and hard-smoked
sausage is 23%, that of smoked products – about 9 %, and the segment of other
sausage products covers 13% of the market.
The share of imported sausage does not exceed 0.5% of the total supply
(mainly meat dainties). The export volume of products made in Russia is
somewhat more than 1%. Thus, almost all manufactured products are meant
for internal consumption.
The accession to the WTO brought some changes to the meat processing
industry; however, they are not very significant. The import of raw materials for
making sausage products will be controlled by the state in the first several years
anyway.

59
Ru
ssia
n M
arke
t o
f A
gro
Pro
du
cts
| 20
12
More and more often, preference is given for Russian raw materials or in-house
raw materials in the production of sausage products, manufacturers try to
perform the whole production cycle “from farms to stores” on their own by
investing in the construction of facilities manufacturing raw materials.
According to experts, the market is going to be consolidating down to the limit
in years to come, and strong regional brands will either become parts of the
largest federal players and/or will gradually be “replaced” with federal products.
Finally, in several years the largest 3-5 players will control 70-80% of the
market.
Despite the growing competition, according to experts, the Russian market of
sausage products is one of the quickest-turnover markets in the Russian food
industry. In this connection, more and more companies tend to consider it one
of the most promising sectors for investments.
Dairy market
Milk production volumes have not changed significantly in the RF in the past 10
years, which is reasoned with the stable consumption of these products, as well
as the saturated competitive environment.
The cow population in Russia restored by 1.2% up to 8.94 million cows in 2011.
The largest districts in terms of cow population are the Volga, Siberian and
Central Federal Districts. The largest number of cows (2.5 million) was owned
by the farmers from the Volga Federal District. The Siberian Federal District
bred 1.8 million cows, and their number in the Central Federal District made
over 1.2 million. As for regions, the leaders in terms of cow population are such
republics as Bashkortostan, Dagestan, Tatarstan and Altay Territory. The share
of the Republic of Bashkortostan made 5.6%, that of Dagestan – 4.7%. The
Republic of Tatarstan and the Altay Territory had 4.6% and 4.3% of the cow
population of Russia, respectively.
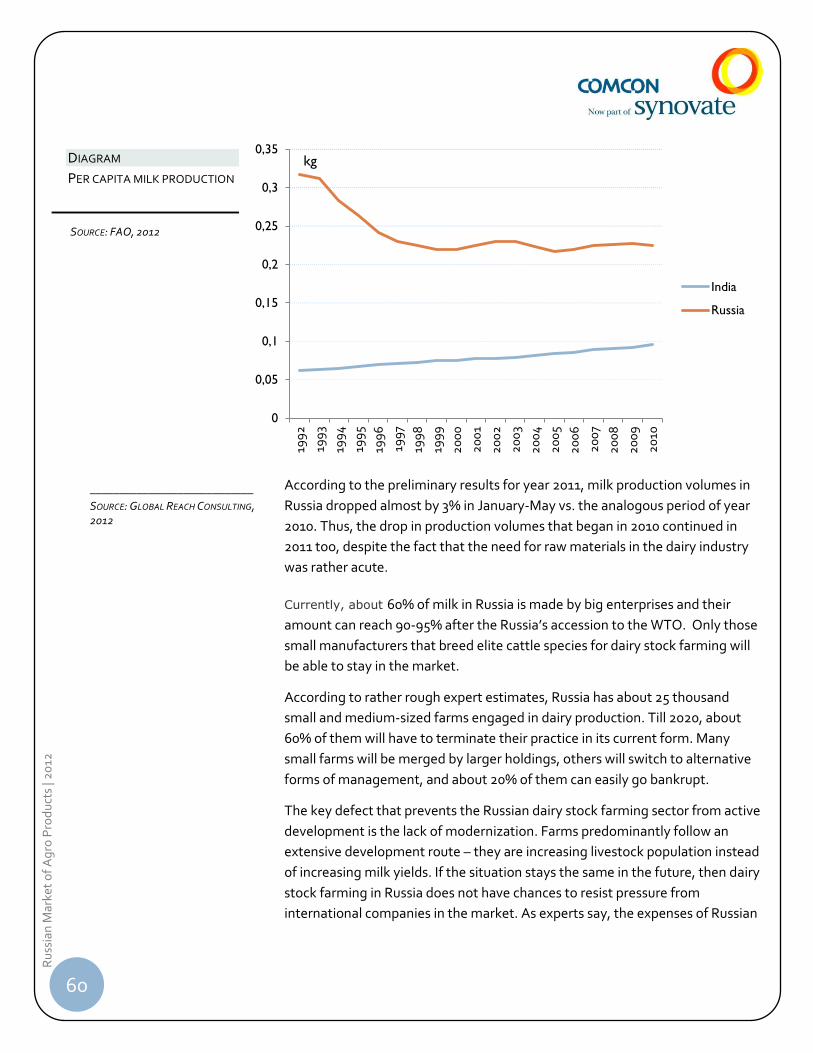
60
Ru
ssia
n M
arke
t o
f A
gro
Pro
du
cts
| 20
12
According to the preliminary results for year 2011, milk production volumes in
Russia dropped almost by 3% in January-May vs. the analogous period of year
2010. Thus, the drop in production volumes that began in 2010 continued in
2011 too, despite the fact that the need for raw materials in the dairy industry
was rather acute.
Currently, about 60% of milk in Russia is made by big enterprises and their
amount can reach 90-95% after the Russia’s accession to the WTO. Only those
small manufacturers that breed elite cattle species for dairy stock farming will
be able to stay in the market.
According to rather rough expert estimates, Russia has about 25 thousand
small and medium-sized farms engaged in dairy production. Till 2020, about
60% of them will have to terminate their practice in its current form. Many
small farms will be merged by larger holdings, others will switch to alternative
forms of management, and about 20% of them can easily go bankrupt.
The key defect that prevents the Russian dairy stock farming sector from active
development is the lack of modernization. Farms predominantly follow an
extensive development route – they are increasing livestock population instead
of increasing milk yields. If the situation stays the same in the future, then dairy
stock farming in Russia does not have chances to resist pressure from
international companies in the market. As experts say, the expenses of Russian
0
0,05
0,1
0,15
0,2
0,25
0,3
0,35
199
2
199
3
199
4
199
5
199
6
199
7
199
8
199
9
20
00
20
01
20
02
20
03
20
04
20
05
20
06
20
07
20
08
20
09
20
10
India
Russia
kg DIAGRAM
PER CAPITA MILK PRODUCTION
SOURCE: FAO, 2012
____________________________
SOURCE: GLOBAL REACH CONSULTING,
2012
61
Ru
ssia
n M
arke
t o
f A
gro
Pro
du
cts
| 20
12
cattle breeders are more than two times higher than the relative level of
western countries –
“A foreign farmer has the same milk yield from one cow as our farmer gets from
two of them, whereas the quality of milk does not differ significantly. This means
that Russian people need a two-time larger amount of food for two cows, they
have to be serviced, one should build a corral, which impacts the cost of
products”.
The Russian market has several peculiarities. First of all, prices for milk and milk
products in the market exceed average prices in European countries. An
exception is only some Scandinavian countries where the price for milk is
practically one of the highest in the world. The indicators of the demand for
milk has been growing in recent years – thus, market capacity is going to
increase in years to come both in absolute and relative terms, and this triggers
huge demand.
Thus, after the accession to the WTO, the RF market will enjoy the first and the
most priority place in the list of new sales markets for the European market
where competition is getting severer among many large manufacturers. Along
with that, the cost of producing milk in the west, despite the differences in
salaries and the cost of primary materials, is much lower than in Russia, which
will allow foreigners to provide the Russian market with similar-quality
products, but at relatively low prices.
Processing
The Russian dairy market has a significant growth potential till year 2015
making 4-6% annually, despite the existing high consumption level. In
monetary terms, the market is going to dynamically grow too, by 5-7%
annually. Following the 2011 results, the Russian dairy market made 28 billion
dollars in monetary terms and over 40 thousand tons in physical terms.
Jan-June 2011 Growth, %
Whole milk products in milk
equivalent
5,474.5 97
Milk 2,020.6 99.9
Cream 37 95
Yogurt 359.4 97.7
Kefir (buttermilk) 528 99.9
TABLE
MILK PRODUCTS PRODUCTION
(JAN-JUNE 2011), TH. T
SOURCE: ROSSTAT, 2012
____________________________
SOURCE: KPMG EXPERTS, 2012
EXPERT OPINION
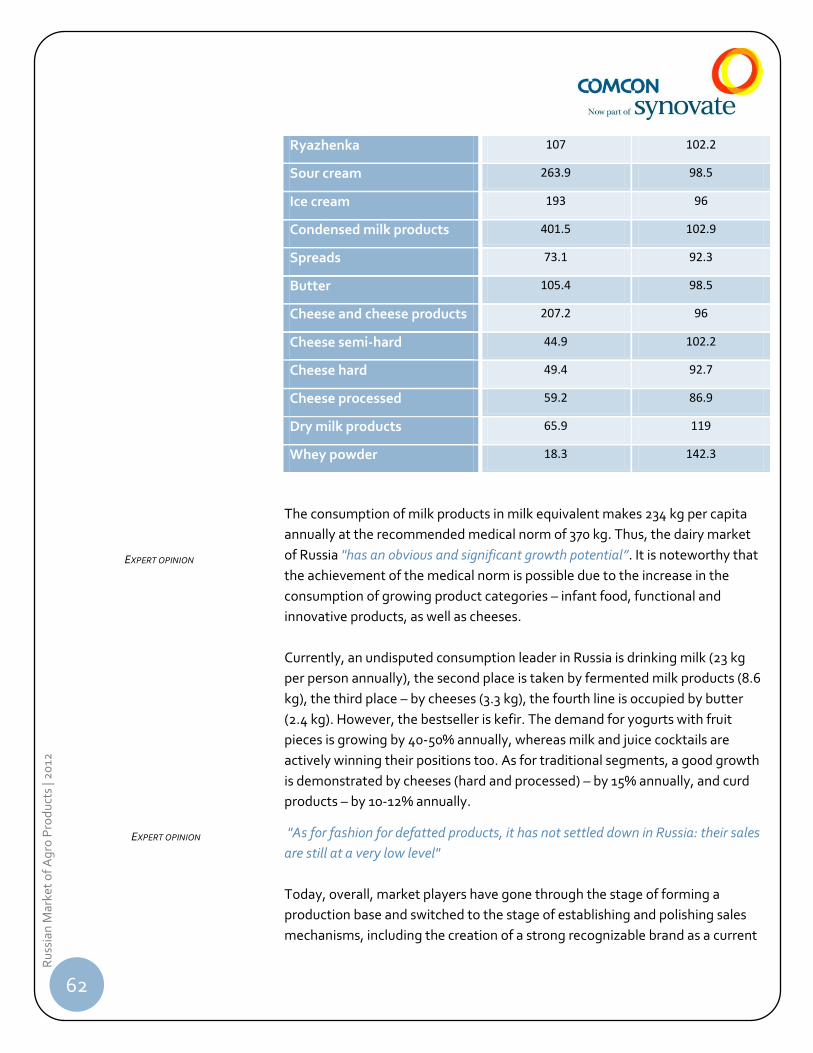
62
Ru
ssia
n M
arke
t o
f A
gro
Pro
du
cts
| 20
12
Ryazhenka 107 102.2
Sour cream 263.9 98.5
Ice cream 193 96
Condensed milk products 401.5 102.9
Spreads 73.1 92.3
Butter 105.4 98.5
Cheese and cheese products 207.2 96
Cheese semi-hard 44.9 102.2
Cheese hard 49.4 92.7
Cheese processed 59.2 86.9
Dry milk products 65.9 119
Whey powder 18.3 142.3
The consumption of milk products in milk equivalent makes 234 kg per capita
annually at the recommended medical norm of 370 kg. Thus, the dairy market
of Russia "has an obvious and significant growth potential”. It is noteworthy that
the achievement of the medical norm is possible due to the increase in the
consumption of growing product categories – infant food, functional and
innovative products, as well as cheeses.
Currently, an undisputed consumption leader in Russia is drinking milk (23 kg
per person annually), the second place is taken by fermented milk products (8.6
kg), the third place – by cheeses (3.3 kg), the fourth line is occupied by butter
(2.4 kg). However, the bestseller is kefir. The demand for yogurts with fruit
pieces is growing by 40-50% annually, whereas milk and juice cocktails are
actively winning their positions too. As for traditional segments, a good growth
is demonstrated by cheeses (hard and processed) – by 15% annually, and curd
products – by 10-12% annually.
"As for fashion for defatted products, it has not settled down in Russia: their sales
are still at a very low level"
Today, overall, market players have gone through the stage of forming a
production base and switched to the stage of establishing and polishing sales
mechanisms, including the creation of a strong recognizable brand as a current
EXPERT OPINION
EXPERT OPINION
63
Ru
ssia
n M
arke
t o
f A
gro
Pro
du
cts
| 20
12
key factor of forming the cost of a company. At the moment, there are about 2
thousand manufacturers of dairy products. However, 3% of large companies
cover more than 50% of the Russian dairy market: they are three world giants,
such as Wimm-Bill-Dann (has been owned by PepsiCo since 2011), Unimilk and
Danone.
“All manufacturers began to reduce costs and refuse to work with wholesalers
since 2006, when globalization in the market of processors began and when such
giants as Wimm-Bill-Dann, Danone and Unimilk appeared. Many companies have
started to work directly by developing collective farms. Danone is a pioneer. It has
implemented a joint investment program with the Ministry of Agriculture since
2003”
It is noted that one of the problems in the industry is the high level of falsified
products. The annual volume of dairy products containing vegetable fats is
estimated as 4 million tons. They derive fat from whole milk and use it for
making expensive sour cream and butter, but they add oil to such milk after
extracting natural fat from it. Thus, one liter of milk can give two liters of this
product, which increases profits.
82 of 138 product names tested by the industry union have turned out to be
fakes.
"30% of the market is covered by palm and coconut oil. Ice cream producers have
not been purchasing butter for a long time. Milk fat has not been found in
Adygeysky cheese made in St.Petersburg”
Imports
In 2010, the import share in the structure of the Russian dairy market drastically
grew to make about 20%. Following the 2010 results, the import of milk
products in natural terms made over 1 million tons, which is almost one third
larger than in 2009.
In 2010, the growth in import volumes was typical of all groups of milk
products. Cheeses and curd prevail in the Russian import structure in natural
terms, they cover almost 40% of the whole import of milk products. Their share
in the import structure was even larger several years ago. The share of butter
and milk spreads is over 10%, whereas the import of milk whey and products
made of natural milk components equaled approximately 7% following the
2010 results.
Expert opinion
Expert opinion
EXPERT OPINION
____________________________
SOURCE: RG.RU
25 MAY 2012
EXPERT OPINION
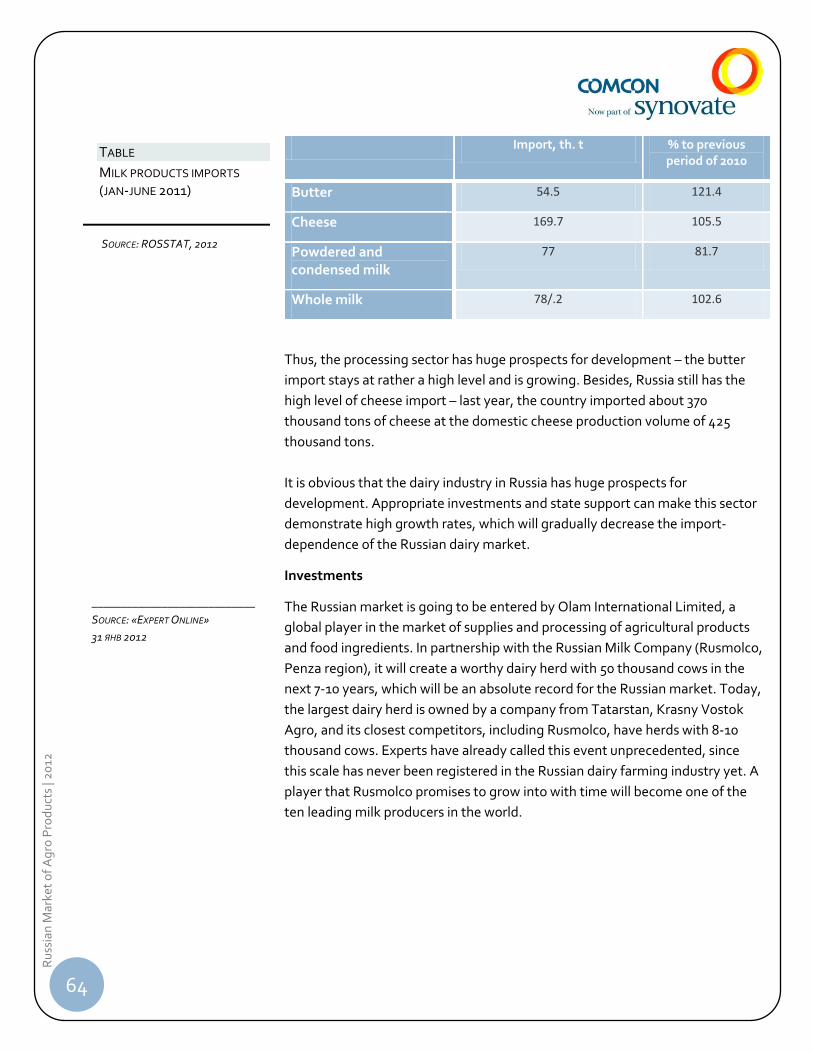
64
Ru
ssia
n M
arke
t o
f A
gro
Pro
du
cts
| 20
12
Import, th. t % to previous period of 2010
Butter 54.5 121.4
Cheese 169.7 105.5
Powdered and condensed milk
77 81.7
Whole milk 78/.2 102.6
Thus, the processing sector has huge prospects for development – the butter
import stays at rather a high level and is growing. Besides, Russia still has the
high level of cheese import – last year, the country imported about 370
thousand tons of cheese at the domestic cheese production volume of 425
thousand tons.
It is obvious that the dairy industry in Russia has huge prospects for
development. Appropriate investments and state support can make this sector
demonstrate high growth rates, which will gradually decrease the import-
dependence of the Russian dairy market.
Investments
The Russian market is going to be entered by Olam International Limited, a
global player in the market of supplies and processing of agricultural products
and food ingredients. In partnership with the Russian Milk Company (Rusmolco,
Penza region), it will create a worthy dairy herd with 50 thousand cows in the
next 7-10 years, which will be an absolute record for the Russian market. Today,
the largest dairy herd is owned by a company from Tatarstan, Krasny Vostok
Agro, and its closest competitors, including Rusmolco, have herds with 8-10
thousand cows. Experts have already called this event unprecedented, since
this scale has never been registered in the Russian dairy farming industry yet. A
player that Rusmolco promises to grow into with time will become one of the
ten leading milk producers in the world.
____________________________
SOURCE: «EXPERT ONLINE»
31 ЯНВ 2012
TABLE
MILK PRODUCTS IMPORTS
(JAN-JUNE 2011)
SOURCE: ROSSTAT, 2012
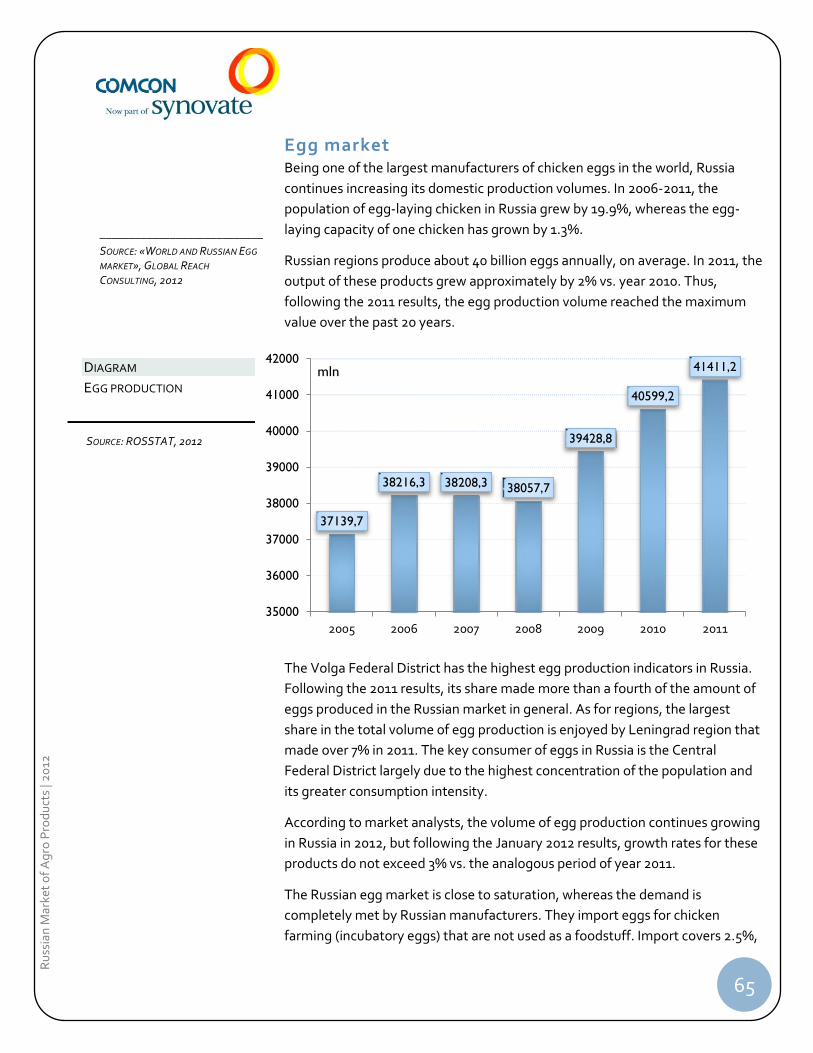
65
Ru
ssia
n M
arke
t o
f A
gro
Pro
du
cts
| 20
12
Egg market Being one of the largest manufacturers of chicken eggs in the world, Russia
continues increasing its domestic production volumes. In 2006-2011, the
population of egg-laying chicken in Russia grew by 19.9%, whereas the egg-
laying capacity of one chicken has grown by 1.3%.
Russian regions produce about 40 billion eggs annually, on average. In 2011, the
output of these products grew approximately by 2% vs. year 2010. Thus,
following the 2011 results, the egg production volume reached the maximum
value over the past 20 years.
The Volga Federal District has the highest egg production indicators in Russia.
Following the 2011 results, its share made more than a fourth of the amount of
eggs produced in the Russian market in general. As for regions, the largest
share in the total volume of egg production is enjoyed by Leningrad region that
made over 7% in 2011. The key consumer of eggs in Russia is the Central
Federal District largely due to the highest concentration of the population and
its greater consumption intensity.
According to market analysts, the volume of egg production continues growing
in Russia in 2012, but following the January 2012 results, growth rates for these
products do not exceed 3% vs. the analogous period of year 2011.
The Russian egg market is close to saturation, whereas the demand is
completely met by Russian manufacturers. They import eggs for chicken
farming (incubatory eggs) that are not used as a foodstuff. Import covers 2.5%,
37139,7
38216,3 38208,3 38057,7
39428,8
40599,2
41411,2
35000
36000
37000
38000
39000
40000
41000
42000
2005 2006 2007 2008 2009 2010 2011
mln
____________________________
SOURCE: «WORLD AND RUSSIAN EGG
MARKET», GLOBAL REACH
CONSULTING, 2012
DIAGRAM
EGG PRODUCTION
SOURCE: ROSSTAT, 2012
66
Ru
ssia
n M
arke
t o
f A
gro
Pro
du
cts
| 20
12
and reserves as of the beginning of this year form almost the same share of the
supply.
The main exporter of eggs into the Russian market is Belarus. Following the
2011 results, its share in the total egg import volume in Russia exceeded 70%. In
monetary costs, the share of Belarus in the volume of egg supplies in Russia
prevails too, but it is not that significant – following the 2011 results, it made
about 30%, which is much smaller than the indicator in physical terms. This
testifies to not high prices for supplies from this country.
In 2011, the Russian export of eggs in physical terms made 350 million eggs.
This year, it is expected that the level of export will make 400 million eggs. Key
importers of Russian eggs are Kazakhstan, Mongolia, Tajikistan and Kirgizia.
The recent trend testifies to the growth in egg production and the increase in
the share of eggs meant for deep processing.
Processing
According to Rosptitsesoyuz, there were processed 2.8 billion eggs in the
internal market in 2011. Thus, only about 6% of eggs produced in Russia are
meant for processing, whereas the countries of the European Union process 20-
25% of eggs, USA — 30-35%, Japan — 35-40%, despite the fact that the amount
of fresh eggs made there is 3 or even 4 times smaller than in Russia. This
happens only due to the production of egg powder. As for more hi-tech
products, they are either not made in Russia at all or are made in amounts that
are extremely insignificant for such a large country.
The reason why Russia is behind is the lack of a technical production base and
equipment for processing edible eggs. Only 10% of the egg-producing
companies have imported equipment with pasteurizing installations, which
allows them making the wide range of liquid and dried egg products and
guarantee their quality and safety.
Thus, in order to extend the range of egg products in the market and bring the
industry to a new level, poultry companies should pay special attention to the
development of the deep processing of eggs into liquid (egg mixture, egg
whites, yolks) and dry (yolks, whites) egg products. In 2009, the output of liquid
egg products in Russia grew by 109.7% to make about 27,200 tons, and the
output of dry egg products dropped from 12,040 to 10,500 tons.
A promising route for the development of the product range in the egg market
and egg products is making poultry farming products enriched with precious
67
Ru
ssia
n M
arke
t o
f A
gro
Pro
du
cts
| 20
12
nutrients. Eggs enriched with selenium, iodine, vitamins, polyunsaturated acids
now make only 16.5% in the range of eggs produced by Russian manufacturers.
The largest share of the market is covered by eggs produced in compliance with
state standards – 71%. However, the market structure is gradually changing.
For comparison: in 1990, eggs produced in compliance with state standards
covered 96% of the egg products manufactured in Russia, whereas eggs
enriched with nutrients were not made at all.
The modern markets of some countries have a significant number of egg
products belonging to two main groups: food and non-food.
The group of food products is subdivided into two subgroups. The first one is
products for industrial consumers (confectionary, oil and fat, bread, meat and
other industries) – egg mixtures, whites, liquid, frozen and dried yolks. The
second group covers products for in-home consumption and public catering
establishments that includes semi-finished goods (specially packaged and
processed liquid whole eggs with a long shelf life at room temperature, frozen
whole eggs in a special package, dry omelets, sublimated products with and
without fillings, hard-boiled eggs, etc.) and other ready-made products – both
cooled and frozen (egg rolls, frankfurters, omelets with cheese, grilled egg
cutlets, egg pizzas, sandwiches, stuffed eggs, etc.).
The group of non-food products includes lysozyme, ovomucoids, avidin,
immunoglobulin, acetylneuraminic acid, phospholipids, lipoproteins, etc.
Products from this group are meant for the pharmaceutical, cosmetics,
chemical and other industries.
The Russian market has only food products for industrial consumers. Other
market niches (food products for in-home consumption and public catering
establishments, as well as non-food products) are almost free now.
The world experience shows that egg products for in-home consumption and
public catering establishments cover about 25% of the market in physical
terms. Therefore the manufacturers of egg products should pay attention to
this currently free market segment and try to occupy it.
The leaders in the consumption of egg products in Russia are the confectionary
and oil and fat industries that consume about 90% of the market volume in
physical terms.
The consumption of egg processing products by non-food industries is
insignificant. However, it is should be noted that these products are
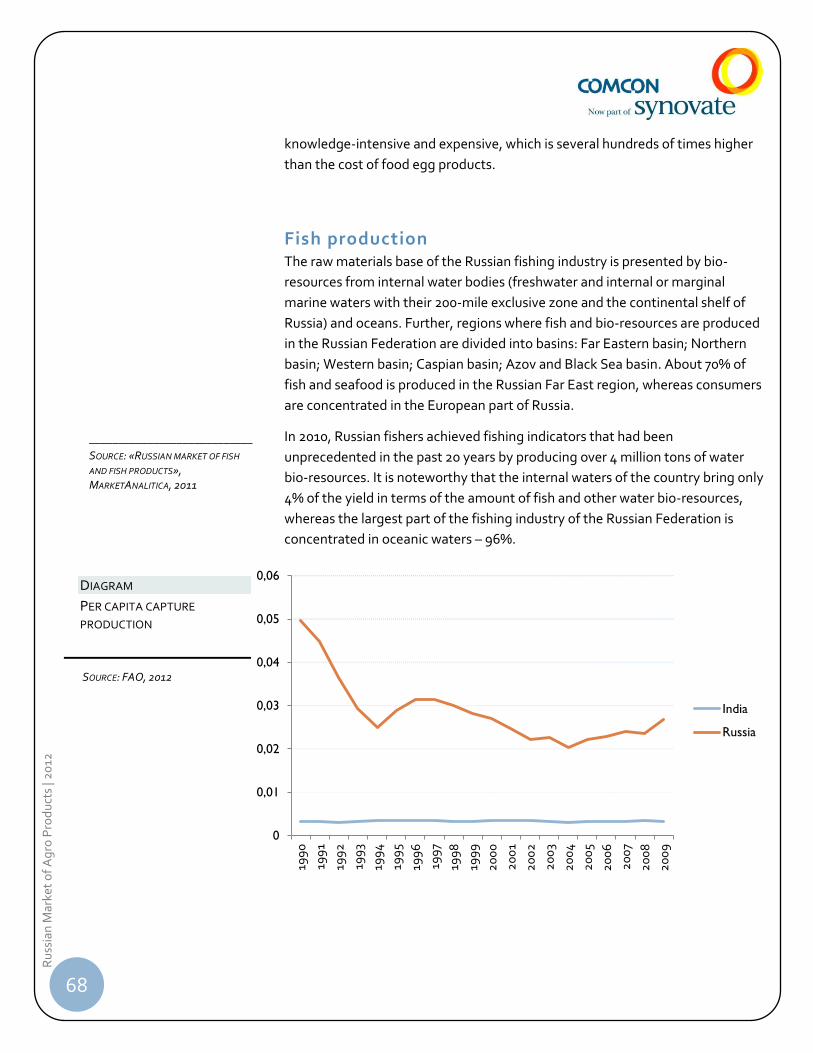
68
Ru
ssia
n M
arke
t o
f A
gro
Pro
du
cts
| 20
12
knowledge-intensive and expensive, which is several hundreds of times higher
than the cost of food egg products.
Fish production The raw materials base of the Russian fishing industry is presented by bio-
resources from internal water bodies (freshwater and internal or marginal
marine waters with their 200-mile exclusive zone and the continental shelf of
Russia) and oceans. Further, regions where fish and bio-resources are produced
in the Russian Federation are divided into basins: Far Eastern basin; Northern
basin; Western basin; Caspian basin; Azov and Black Sea basin. About 70% of
fish and seafood is produced in the Russian Far East region, whereas consumers
are concentrated in the European part of Russia.
In 2010, Russian fishers achieved fishing indicators that had been
unprecedented in the past 20 years by producing over 4 million tons of water
bio-resources. It is noteworthy that the internal waters of the country bring only
4% of the yield in terms of the amount of fish and other water bio-resources,
whereas the largest part of the fishing industry of the Russian Federation is
concentrated in oceanic waters – 96%.
0
0,01
0,02
0,03
0,04
0,05
0,06
199
0
199
1
199
2
199
3
199
4
199
5
199
6
199
7
199
8
199
9
20
00
20
01
20
02
20
03
20
04
20
05
20
06
20
07
20
08
20
09
India
Russia
DIAGRAM
PER CAPITA CAPTURE
PRODUCTION
SOURCE: FAO, 2012
____________________________
SOURCE: «RUSSIAN MARKET OF FISH
AND FISH PRODUCTS»,
MARKETANALITICA, 2011
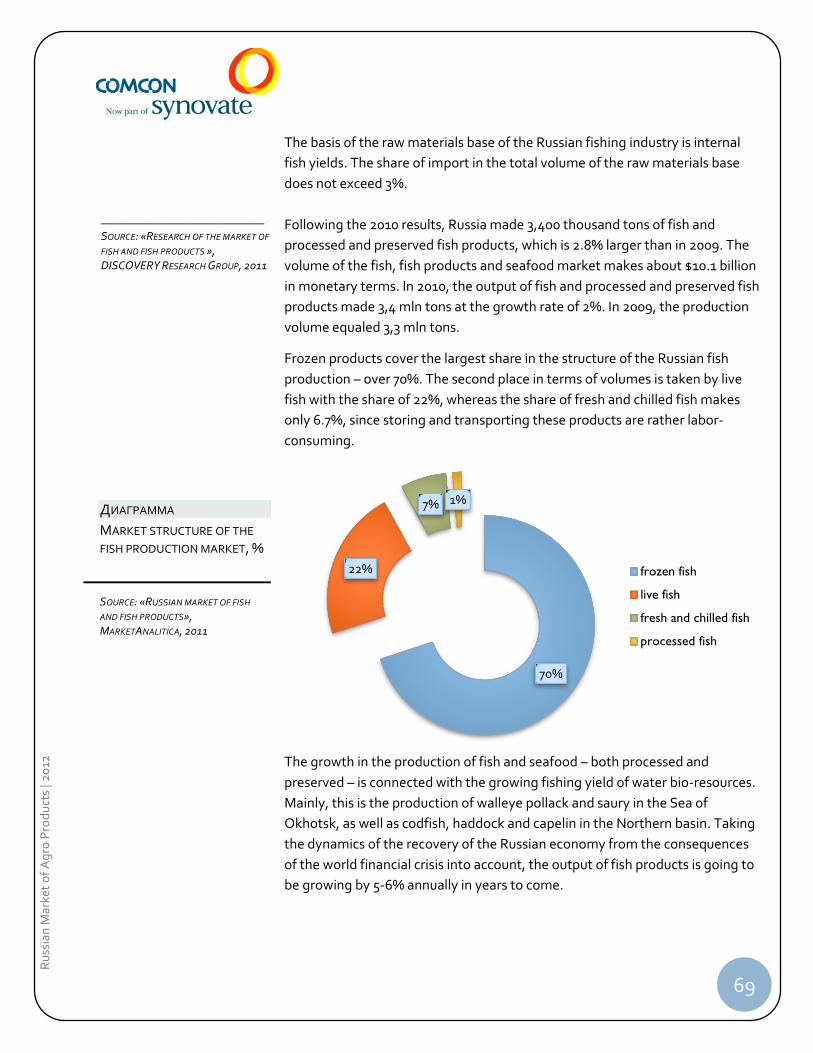
69
Ru
ssia
n M
arke
t o
f A
gro
Pro
du
cts
| 20
12
The basis of the raw materials base of the Russian fishing industry is internal
fish yields. The share of import in the total volume of the raw materials base
does not exceed 3%.
Following the 2010 results, Russia made 3,400 thousand tons of fish and
processed and preserved fish products, which is 2.8% larger than in 2009. The
volume of the fish, fish products and seafood market makes about $10.1 billion
in monetary terms. In 2010, the output of fish and processed and preserved fish
products made 3,4 mln tons at the growth rate of 2%. In 2009, the production
volume equaled 3,3 mln tons.
Frozen products cover the largest share in the structure of the Russian fish
production – over 70%. The second place in terms of volumes is taken by live
fish with the share of 22%, whereas the share of fresh and chilled fish makes
only 6.7%, since storing and transporting these products are rather labor-
consuming.
The growth in the production of fish and seafood – both processed and
preserved – is connected with the growing fishing yield of water bio-resources.
Mainly, this is the production of walleye pollack and saury in the Sea of
Okhotsk, as well as codfish, haddock and capelin in the Northern basin. Taking
the dynamics of the recovery of the Russian economy from the consequences
of the world financial crisis into account, the output of fish products is going to
be growing by 5-6% annually in years to come.
70%
22%
7% 1%
frozen fish
live fish
fresh and chilled fish
processed fish
____________________________
SOURCE: «RESEARCH OF THE MARKET OF
FISH AND FISH PRODUCTS »,
DISCOVERY RESEARCH GROUP, 2011
ДИАГРАММА
MARKET STRUCTURE OF THE
FISH PRODUCTION MARKET, %
SOURCE: «RUSSIAN MARKET OF FISH
AND FISH PRODUCTS»,
MARKETANALITICA, 2011
70
Ru
ssia
n M
arke
t o
f A
gro
Pro
du
cts
| 20
12
Now the market that is characterized by the per-capita consumption of 22 kg of
fish is estimated at the level of approximately 480 billion rubles. It is expected
that it will double in the next five years.
This happens largely due to the continuous growth in the urban population
preferring products with a high added value, i.e. semi-finished goods or ready-
made foods. Currently, the average price for primary processing products
makes 100 rubles per kilogram, that of products with a high added value — 200
rubles per kilogram. These products are consumed in approximately equal
proportions.
“Most of these processes are in progress now. Consumption is growing — five
years ago it was 13 kilograms per capita, whereas now this value is 22 kilograms.
It is possible to imagine that soon we might reach the value of 30 kilograms. Food
inflation exists too and there are forecasts concerning the further growth in prices
for food in the world”
According to the annual and quarterly reporting of market players, the key
players of the market are the Russian Sea Group, ROK Group, OJSC Meridian
Production and Commercial Company (Moscow), LLC Santa Bremor Joint
Venture (Belarus, Germany) and CJSC Baltiysky Bereg (St.Petersburg).
The largest players among the key market participants are as follows: Russian
Sea (with its market share of 12%); the second position belongs to Atlant
Pacific – 4%. They are followed by Dari Morya and the DEFA Group – 3% and
others.
Imports
The fish import dropped by 20% in physical terms, although, due to the
growing prices for imported fish, it grew by 30% in monetary terms. This
testifies to the significant growth in prices for imported products.
They mainly supply frozen walleye pollack to Russia – its share is 22% in
physical terms, as well as fresh and frozen herring whose share covers 19% of
the import. It should be noted that the whole volume of walleye pollack
available in the market is produced in Russia. However, due to the lack of
required production facilities, the largest portion of the yield is sent for
processing to other countries – mainly to China. Thus, Russia receives
“secondary-freezing” fish.
A country that supplies the largest volume of fish products to Russia, Norway,
covers 39% of the import market. Norway is the main supplier of trout and
salmon by providing 70% of the whole import of these types of fish. Norway is a
EXPERT OPINION
71
Ru
ssia
n M
arke
t o
f A
gro
Pro
du
cts
| 20
12
“flagship” not only in terms of fish production, but also in terms of its
processing volumes. Norwegian citizens have a certain consumption culture,
they realize that high-quality fish is not cheap and are ready to pay much for
high-quality fish.
The main supplier of prawns to Russia, Denmark, covers 80% of the total
amount of imported products. Russia is becoming a very attractive market for
supplying mussels and other types of shell-fish.
Exports
As for export supplies, Russia sent 1,412 thousand tons of fish and seafood to
other countries in 2010, which exceeds the indicators of year 2009 almost by
20%.
The structure of the Russian export with a breakdown into product groups is
analogous to import – over 90% falls at frozen fish. Significantly behind it are
fish fillets, crustaceans and shell-fish – their shares make 4, 2 and 1%,
respectively. The leading position in export supplies is enjoyed by walleye
pollack – following the 2010 results, it enjoys 67% of the total indicator.
Despite the growth in the gross added value in the fishing and fish-farming
industries, the Russian market is still mainly receiving expensive and processed
products, including those made of Russian resources. Besides, Russian
companies are exporting raw materials with a low added value.
Aquaculture
As for the development of the aquaculture, it is at rather a low level now in
Russia. Currently, Russian farms grow about 3% of the total amount of fish
produced in the country every year, i.e. approximately 130 thousand tons. For
comparison, China annually makes up to 40 million tons of aquaculture
products, and in the 1980s, this indicator used to make 599 thousand tons
annually in the USSR. On average, Russian fish makes 0.2% of the world
volume of aquaculture products.
____________________________
SOURCE: ANALYSIS DEPARTMENT
THEFISHSITE.COM
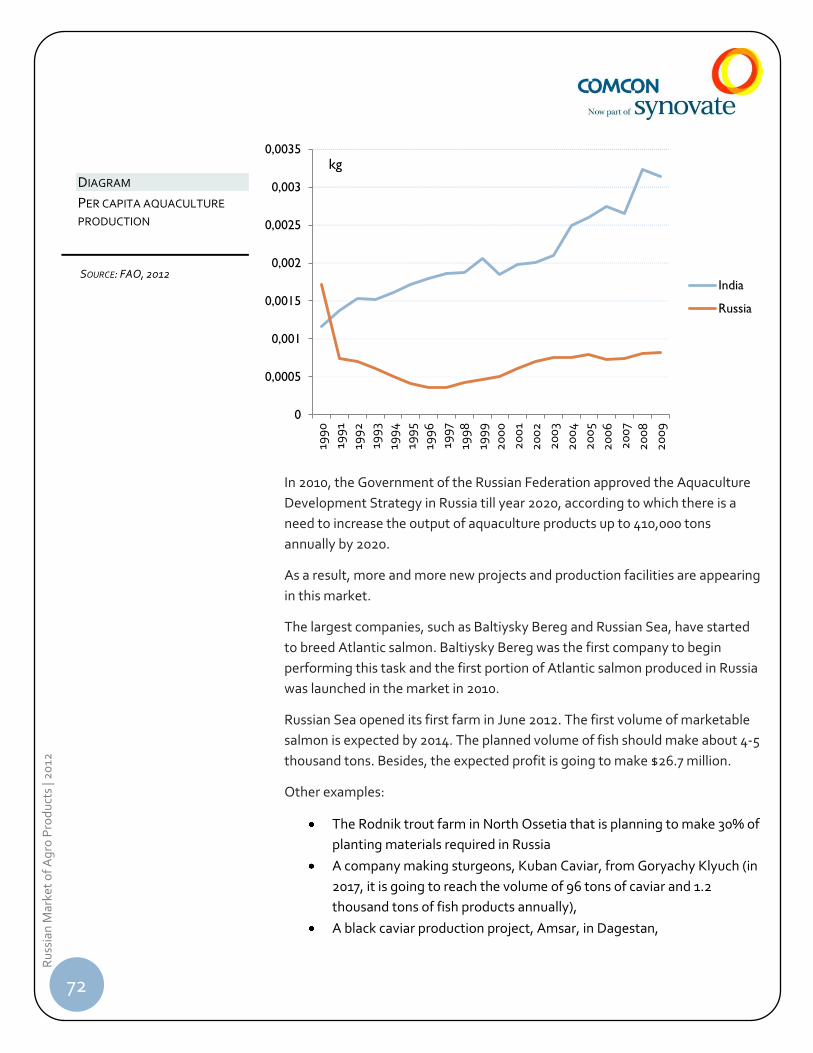
72
Ru
ssia
n M
arke
t o
f A
gro
Pro
du
cts
| 20
12
In 2010, the Government of the Russian Federation approved the Aquaculture
Development Strategy in Russia till year 2020, according to which there is a
need to increase the output of aquaculture products up to 410,000 tons
annually by 2020.
As a result, more and more new projects and production facilities are appearing
in this market.
The largest companies, such as Baltiysky Bereg and Russian Sea, have started
to breed Atlantic salmon. Baltiysky Bereg was the first company to begin
performing this task and the first portion of Atlantic salmon produced in Russia
was launched in the market in 2010.
Russian Sea opened its first farm in June 2012. The first volume of marketable
salmon is expected by 2014. The planned volume of fish should make about 4-5
thousand tons. Besides, the expected profit is going to make $26.7 million.
Other examples:
The Rodnik trout farm in North Ossetia that is planning to make 30% of
planting materials required in Russia
A company making sturgeons, Kuban Caviar, from Goryachy Klyuch (in
2017, it is going to reach the volume of 96 tons of caviar and 1.2
thousand tons of fish products annually),
A black caviar production project, Amsar, in Dagestan,
0
0,0005
0,001
0,0015
0,002
0,0025
0,003
0,0035
199
0
199
1
199
2
199
3
199
4
199
5
199
6
199
7
199
8
199
9
20
00
20
01
20
02
20
03
20
04
20
05
20
06
20
07
20
08
20
09
India
Russia
kg
DIAGRAM
PER CAPITA AQUACULTURE
PRODUCTION
SOURCE: FAO, 2012
73
Ru
ssia
n M
arke
t o
f A
gro
Pro
du
cts
| 20
12
A project on breeding sturgeons and producing black caviar in
Astrakhan region,
A project on breeding sturgeons has been launched in Kalmykia
However, many new projects come across industry problems, such as problems
with getting long-term loans, the high cost of energy resources and feedstuffs,
which will make their products not competitive after Russia accessed the WTO.
Processing (canned goods, preserves)
The industry is facing the shortage of up-to-date processing enterprises.
Therefore the largest part of fished out bio-resources are sent to other
countries for further processing.
According to BusinesStat, the volume of canned and preserved fish and
seafood in Russia made 356.1 thousand tons in 2011, which is 3.7% larger than a
year ago.
Fish products prevail in the total turnover of canned and preserved fish and
seafood. Seafood covered about 3% in 2011 in the total sales volume of canned
and preserved products. In 2011, Russia made 9.6 thousand tons of canned and
preserved seafood. Usual fish products also prevail in the import structure.
Products from Russian manufacturers cover about 74% of the total volume of
the Russian market. The import share in the Russian market of canned and
preserved fish and seafood is rather high and makes somewhat more than a
fourth of the products available in the market.
According to expert estimates, the consumption of canned and preserved fish
and seafood grew insignificantly in 2011, but it still does not fit the possibilities
of a marine empire, since every Russian dweller consumed only 2.29 kg.
Overall, experts note that the Russian market of fish and seafood preserves a
significant potential for development and is far from saturation. It is expected
that it will continue growing with the increase in the incomes of the population
during the post-crisis period.
74
Ru
ssia
n M
arke
t o
f A
gro
Pro
du
cts
| 20
12
STATE SUPPORT FOR AGRICULTURE The State Program on Developing Agriculture and Regulating the Markets of
Agricultural Products, Raw Materials and Food for the period of 2008-2012 was
launched in 2008.
This Program implies the determination of priority goals in the development of
the agroindustrial complex in the mid-term perspective (five years). These
routes mean the determination of specific objectives that are going to be
fulfilled with corresponding sub-programs.
A sub-program is a range of measures for the state regulation of the sector.
Each subprogram has its own goals and target indicators, state influence
mechanisms and the volumes of finance from the federal budget for all years of
the program’s time of validity. This State Program is expected to provide a
stable base for the development of the agricultural and food sector, make the
investment environment more attractive in it, provide guidelines for the
agribusiness.
A program and targeted approach is used for the implementation of the State
Program. It provides for the interconnection between the distribution of budget
resources and the achievement of target indicators, as well as the objectives of
the federal center and regions.
In compliance with the legislation, the State Program is the main document
establishing a policy in the agroindustrial complex for the period of five years.
The Ministry of Agriculture is responsible for its implementation and provides
annual reports to the society not on the development of the agricultural
complex in general, which is relevant to the current practice, but on the
implementation of the certain subprograms of the State Program, i.e. actually
it reports on the results of its activities.
The law implies the National Report by the Ministry of Agriculture and its
publication for a wide audience. Besides, one year prior to the completion of
the State Program implementation, there will be established an expert
commission with the participation of the representatives of the agricultural and
food sector, independent analysts and several public officials (their share will be
limited with one third of the number of commission members in order to make
the evaluation of the Government’s activities on implementing this State
Program really independent).
75
Ru
ssia
n M
arke
t o
f A
gro
Pro
du
cts
| 20
12
The state finances the agroindustrial complex with money from the federal
budget of the constituent entities of the Russian Federation and extra-
budgetary resources. The money of the deferral budget provided for the
support and development of the agroindustrial complex is specified in the
federal budget as a separate section and a separate line in other budget
sections.
Subsidies and compensations for agricultural producers provided from the
federal budget are established by the Government of the Russian Federation in
compliance with the federal legislation and other regulatory legal acts of the
Russian Federation. Subsidies and compensations for agricultural producers
provided from the budgets of the constituent entities of the Russian Federation
are determined with the order prescribed by the legislation and other
regulatory legal acts of the Russian Federation.
It uses the funds of the federal budget provided for the support and regulation
of the agroindustrial production sector for: short-term lending for seasonal
expenses and supporting required reserves in the agroindustrial production
sector, long-term lending for agroindustrial production, pledging agricultural
products, raw materials and food, prepaying for the procurements of
agricultural products, raw materials and food for state needs, leasing in the
sphere of agroindustrial production, providing lending cooperatives where over
50% of the authorized capital belongs to legal entities and individuals engaged
in agroindustrial production with long-term loans for forming their authorized
capital.
The total volume of finance for the Program in 2008-2012 from the federal
budget will make $18.4 billion, including: in 2008 – $2.5 billion, in 2009 – 3.3
billion, in 2010 – $4 billion, in 2011 – $4.2 billion, in 2012 – $4.3 billion.
The Prime Minister of the RF has reported at the meeting of the United Russia
party that there will be provided $5.6 billion for supporting agriculture in 2012.
It is planned to preserve almost all support routes – provision with mineral
fertilizers, providing subsidies for tariffs, leasing, receiving fuel and lubrication
materials at lower prices.
Besides, the program specifies an important role for financial state support
measures – subsidies and privileged loans to be provided to agricultural
producers.
Thus, the funding of this program in 2008 equaled 118.7 billion rubles (64.4 % of
the total expenses of the federal budget on agriculture), whereas a prevailing
76
Ru
ssia
n M
arke
t o
f A
gro
Pro
du
cts
| 20
12
share (64.9% or 41.9% of the total budget financing for the agrarian sector) falls
at subsidies for loan interest rates.
The objective consisting in making loans more affordable for agricultural
producers specified in the State Program was implemented rather successfully.
The volumes of short-term loans grew by 59% in 2008 vs. 2007 and their level
was 1.9 times higher than that planned by the State Program.
Short-term subsidized loans were available not only to agricultural enterprises,
but also to companies working in the processing industries of the agroindustrial
complex. The share of the latter covered 49% of the sum of short-term loans
and 44% of subsidies from the federal and regional budgets in 2008. The
recipients of investment loans were mainly agricultural enterprises (94% of all
loans). In 2008, subsidized investment loans were received by 13 thousand
agricultural enterprises.
In the period of the State Program implementation, there has been registered a
significant growth in the volume of loans attracted by the agroindustrial
complex (542.5 billion rubles in 2008 vs. 125.6 billion rubles in 2005), and their
positive influence on the stabilization of the production of the main types of
agricultural products.
The implementation of the Program will contribute to the achievement of the
strategic goals of the Ministry of Agriculture of the Russian Federation:
increasing the competitiveness of Russian agricultural products on the basis of
the financial stability and modernization of agriculture;
sustainable development of rural territories, increasing the employment and
improving the living standards of rural population.
It is planned that the Ministry of Agriculture will introduce a new state
agriculture development program till year 2020 to the Government in the
future. The key objectives of the program will still be food safety provision,
investment attractiveness support, as well as the complex development of the
social sphere of rural areas. The draft document will have new priority state
support routes – the development of the agricultural and food market, food and
processing industry modernization. Special attention in this program will be
paid to the development of melioration, renovation of the machine and tractor
fleet, development of infrastructure, logistics and processing. However, all
existing routes of the state support for crop growing will be preserved in it.
As a measure meant to support agriculture, on January 30, 2010, the President
approved the Food Safety Doctrine of the Russian Federation developed within
77
Ru
ssia
n M
arke
t o
f A
gro
Pro
du
cts
| 20
12
the framework of the complex implementation of the national security strategy
adopted in May 2009.
According to the Doctrine, by 2020, the share of Russian grains and potatoes
should make no less than 95%, that of milk and dairy products — 90%, meat
and salt — 85%, sugar, vegetable oil and fish products — 80 %.
INVESTMENT POTENTIAL Due to the growth in world prices for food and the protectionist policy of the
state, the agroindustrial complex looks the most attractive and quickly
developing today. Another important benefit for investors is the fact that this
sphere has suffered from the crisis least of all.
Players investing money in the agroindustrial complex would like to see more
predictable and insured risks in it and greater willingness of the state to
guarantee investment returns.
The infrastructure of the agroindustrial complex, even against the background
of the overall insufficient development of the road, energetic, utilities and
social infrastructure in Russia, looks not very presentable, not to mention such
specific factors as, for example, irrigation or melioration that are either
catastrophically obsolete or were destroyed during the Post-Soviet time.
Besides, it is worth mentioning weather and climatic risks in crop growing and
epizootic risks in livestock breeding together with almost the complete absence
of an insurance culture.
Despite the relatively active support of the state within the framework of the
national program and various regional programs, there are also political risks
that primarily consist in state (although it might be forced) interference in the
activities of agricultural markets.
Analysts and potential investors also name the inability of agricultural
producers to make a correct, reasoned investment project and prepare
corresponding documents for it. Bankers also say that this factor impedes the
attraction of borrowed money for investments in the agroindustrial complex.
The situation is even worse in the processing industry. Manufacturers name the
key problem with investments: expensive money, expensive capitals, expensive
loans.
78
Ru
ssia
n M
arke
t o
f A
gro
Pro
du
cts
| 20
12
“There are certain programs with a simplified VAT system in agriculture, but they
are lacked in processing industries. There are only usual taxes here. Interest rates
are not subsidized. There is an agroindustrial complex development program, but
it is not applied in processing industries”.
“You take a bank loan at usual interest rates – not at those that are provided to
agricultural producers or industrialists. They imply usual commercial terms and
conditions. The situation is getting worse, taking the severe competition into
account”.
The list of industry risks includes weather conditions, prices for fuel, the state of
machinery and labor force. There is the shortage or even the colossal deficit of
competent employees. When considering projects, one should pay greater
attention to solving this issue by providing significant sums of money for the
search, training, development and retention of personnel.
The leading regions in terms of investments in agriculture with indicators that
are several times higher than the average Russian ones in the total volume of
investments in the basic capital are as follows:
Stavropol Territory – 23%
Krasnodar Territory – 11.2%
Rostov region – 8.2%.
However, this share has never been larger than 5% (following the 2007 results)
in Russia on average, and in 2010 it even dropped down to 3.3%.
Investment attractiveness evaluation with a breakdown into industries
Following the 2011 results, internal production provided a demand for grains,
potatoes, sugar, poultry. In years to come, the share of Russian pork in the
internal market will reach the value specified in the Food Safety Doctrine. As for
milk and beef production, this will happen by 2020.
There might be invested $24,1 billion in the food and processing industry of
Russia in 2013-2020. This value is specified in the development strategy for
these industries designed by the Ministry of Agriculture of the Russian
Federation for the period of 2013-2020. The strategy will become part of the
State Agroindustrial Complex Development Program for this period. According
EXPERT OPINION
EXPERT OPINION
79
Ru
ssia
n M
arke
t o
f A
gro
Pro
du
cts
| 20
12
to the draft document, the largest volume of investments is to be provided for
the sugar industry: $3.6 billion.
It is planned to provide $3.3 billion for the development of the dairy industry,
$3.3 billion for the meat industry and $3.27 billion for the baking industry. The
confectionary sector will receive $2.7 billion, the canning and the fruit and
vegetable industries – $903 mln, and the starch industry – $856 mln.
Investing this money by 2020 will allow, in particular, bringing the output of
beet sugar up to the level of 5.4 million tons vs. 2.8 million tons in 2010. The
output of whole milk products might rise up to 13.5 million tons vs. 11.3 million
tons in 2010, that of confectionary products – up to 3 million 175 thousand tons
vs. 2 million 887 thousand tons, starch – up to 320 thousand tons vs. 146
thousand tons, canned vegetables – up to 1 billion 255 million cans vs. 975
million cans, respectively.
As for each sector separately:
Plant production and processing products are underinvested in certain
spheres; production performance is low. It is necessary to increase the appeal of
the industry by means of improving production technologies. The commercial
sector is not able to perform certain things on its own, e.g., to install irrigation
systems on fields. The industry requires larger-scale support from the state and
investors.
Grain crops: The segment of wheat and rye production is the best developed
one; corn and millet production is somewhat less developed. Barley remains a
crop the need for which is regularly not met with domestic supplies.
Long-grain rice is not produced in Russia, although processing facilities are
already working by purchasing raw materials from Thailand. The rice market is
considered one of the promising spheres from the viewpoint of investments,
taking an increasing demand for instant cereals into account.
It is noteworthy that the industry of advanced grain crops processing is
absolutely undeveloped in Russia; investors have already become worried
about this fact. Several large-scale projects on the construction of plants are
being developed currently. The problem of the insufficient development of this
sphere becomes especially acute after the accession of Russia to the WTO.
According to experts, Western Siberia is the most appealing region for
investments in this sphere.
80
Ru
ssia
n M
arke
t o
f A
gro
Pro
du
cts
| 20
12
Oil-bearing crops: Sunflower is the best developed crop; it achieved the record-
breaking export volume last year. Soy and rape can be named as promising
crops, the volumes of which in the structure of oil-bearing crops production are
far inferior to those in developed countries.
The market of investments in deeply processed (refined and hydrogenated) oil
production is actively developing. The market share of such oil types increased
by 19% from 2006 t0 2010. According to forecasts, it will grow up to 71% by
2015.
The ethanol fuel market is absolutely undeveloped in Russia.
Vegetable production is developed extremely non-uniformly. Investors have
already declared excessive production capacities for vegetable production in
greenhouses in the south, which can lead to problems with sales in the future;
but the demand remains unmet in the other Russian regions. The industry is
mainly controlled by agricultural holdings that have their own plantations and
developed processing lines.
Most investments in processing here are meant for the diversification of
production and provision with raw materials.
The most developed crops are potatoes, marrow squashes, eggplants. 40% of
tomatoes and tomato pastes that cover a large share in vegetable processing
are imported.
The market has many unoccupied niches. Vegetable additives allow making
new healthy foodstuffs. The reason why these niches are not occupied consists
in the fact that working in them is too risky for small entrepreneurs, whereas
large ones are now developing other segments.
The distinctive feature of the market is the greater differentiation of prices for
vegetables and fruits in different regions than for other products. Thus, the
market will welcome products, the transportation of which is connected with
lower costs.
Production facilities processing potatoes into starch are attractive for
investments, if they apply advanced technologies and quality standards. The
production of bio-fuel from potatoes is now not interesting for investors.
Probably, the situation will change because Russia accessed the WTO.
The ethyl alcohol s and alcohol industry is strictly regulated and controlled by
the state. Recently, there has been registered the drastic drop in the number of
distilleries in connection with the Government’s measures meant to restore the
81
Ru
ssia
n M
arke
t o
f A
gro
Pro
du
cts
| 20
12
state control. Therefore the investment potential is at a relatively low level
now.
The sugar industry is characterized by 30% of imported products that allow
providing supplies to plants in off-seasons. Plants meet market needs
completely, which cannot be said about the market of seeds. Russia completely
depends on imported products in this regard.
Gardening and processing products. This market is actively developing and
shows a 15-percent growth for each sector annually. The reason is the
popularization of a healthy lifestyle with the population and growing incomes.
Like in the vegetable market, one can find unoccupied niches here. An example
can be cider, a low alcohol beverage made of apples.
The berry market is characterized by a paradox situation, when raw materials
are brought abroad, processed their and then return to Russia in the form of
ready-made products. A reason is the under-development of the processing
constituent of the market and raw material orientation, which is the next step
in the development of the industry and investment attraction.
The market of medical herbs can be interesting for investors too, however, it is
limited with the existing lending terms and conditions.
The tobacco market completely consists of imported products. Recently, the
state has been seriously tightening conditions for doing this business in Russia
by introducing restrictive measures on tobacco smoking and increasing excise
taxes in a step-by-step way.
The livestock breeding sector is a less risky, highly profitable business largely
due to the state support in the form of investment and subsidized loans and
fantastic barriers to the import of meat and poultry. However, the industry has
certain risks anyway. In particular, talking about pig production, it implies huge
risks connected with African swine fever. It should also be taken into account
that investing in big companies is much safer than in small ones. The
profitability of large industrial players in the livestock breeding sector is stable
several dozens of percentage of net profit, which is impossible in plant
production.
Production cycles (and the turnover of funds) in poultry breeding is short –
about 1.5 months, in pig production — about 5-5.5 months. Those in milk
production and cattle breeding are much longer. As a result, the risk of

82
Ru
ssia
n M
arke
t o
f A
gro
Pro
du
cts
| 20
12
investing in a business with a long pay-back period is higher, which impedes the
development of these industries.
Beef: Russia is the largest importer. As for investments, it is most promising to
develop the Northwestern, Central and Urals Federal Districts.
Pork: this is an actively growing market. Large volumes of foreign investments
in the industry are expected in the foreseeable future, since Russian prices are
much higher than those in Europe
Poultry: the investment attractiveness of the industry is given high evaluations
to. They reported on 23 investment projects in the industry only in the first two
months of year 2012.
Meat processing: it is considered the most dynamically developing food
processing industry. The import and export volumes are insignificant, i.e. all
manufactured products are meant to meet internal needs. However, the
market is still not saturated.
Milk and milk products: the market grows by 6% annually and is evaluated as
appealing, despite the existing high consumption level. After Russia accessed
the WTO, this market is becoming one of the priorities for foreign
manufacturers.
Egg market: it can be divided into two sectors: eggs with an eggshell and
processed eggs. The former is practically saturated, whereas the latter has high
investment appeal indicators and a trend towards growth.
Fish production. This market is far from saturation in terms of fishing, the
development of the aquaculture and processing sectors. A current trend is the
fact that the largest players have started to actively invest money in the
development of aqua-farms, especially in salmon fishes breeding.
83
Ru
ssia
n M
arke
t o
f A
gro
Pro
du
cts
| 20
12
EXPERTS OPINION ON THE PROSPECTS
OF RUSSIAN-INDIAN RELATIONS IN
TRADE AND INVESTMENTS For many years, India remains one of the main Russian exporters of tea, coffee,
tobacco, spices, rice, nuts, gherkins, dried vegetables and fruits, sugar and
seafood. According to experts, these areas are still in hign demand and
promising in the Russian agribusiness. However, experts note that the rice
market will remain in present condition only the next 4-5 years, while Russian
manufacturers do not master the cultivation of long-grain rice.
There are investment opportunities in the industry of deep processing of grain,
as in Russia it is not developed. From the expert’s point of view, Western Siberia
is the most attractive area to invest from this perspective.
It is recommended to invest in highly processed vegetable oil production
(refined and hydrogenated), which is projected to rise up to 71% by the year
2015.
Russia has not mastered production of fuel ethanol, which can get active
development after Russia became a WTO member.
Niches for imports also exist in the seed market for the sugar industry and the
market of medicinal herbs.
Experts note the market of livestock products, especially beef, where Russia is
the largest importer and pork, which is expected in the near future to have a
large amount of foreign investments, as the Russian prices are much higher
than the European ones. Meat processing market might seem even more
interesting, because it is unsaturated and may receive particular interest from
the point of view of buffalo meat, which can be delivered from India.
After Russia entered the WTO, the experts point out that the market of milk
and dairy products will be one of the priorities for the foreign investors. In order
to gain a foothold on it, some efforts should be made now.
The egg segment is aso one of unsaturated markets, both in shell, and
processed. India can take a significant presence in this market, because it’s
known for its capabilities in the production of egg powder.
84
Ru
ssia
n M
arke
t o
f A
gro
Pro
du
cts
| 20
12
Fish production in Russia is also far from saturation (especially with recent
trends and "fashion" for fish products) and actively requires investment both in
terms of fish caught, and in fish processing.
However, all of these features need to be linked with the veterinary and
phytosanitary regulations and the standards of Russia, with which the Indian
exporters are regularly having problems.
85
Ru
ssia
n M
arke
t o
f A
gro
Pro
du
cts
| 20
12
APPENDIXES
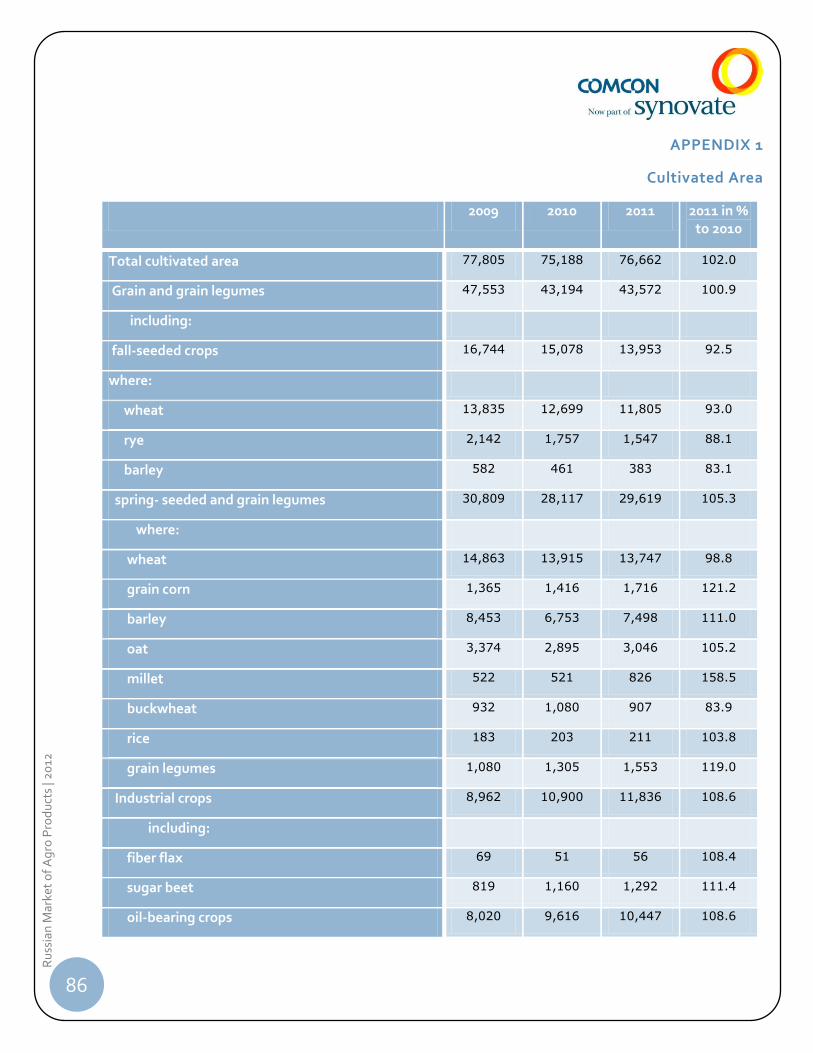
86
Ru
ssia
n M
arke
t o
f A
gro
Pro
du
cts
| 20
12
APPENDIX 1
Cultivated Area
2009 2010 2011 2011 in % to 2010
Total cultivated area 77,805 75,188 76,662 102.0
Grain and grain legumes 47,553 43,194 43,572 100.9
including:
fall-seeded crops 16,744 15,078 13,953 92.5
where:
wheat 13,835 12,699 11,805 93.0
rye 2,142 1,757 1,547 88.1
barley 582 461 383 83.1
spring- seeded and grain legumes 30,809 28,117 29,619 105.3
where:
wheat 14,863 13,915 13,747 98.8
grain corn 1,365 1,416 1,716 121.2
barley 8,453 6,753 7,498 111.0
oat 3,374 2,895 3,046 105.2
millet 522 521 826 158.5
buckwheat 932 1,080 907 83.9
rice 183 203 211 103.8
grain legumes 1,080 1,305 1,553 119.0
Industrial crops 8,962 10,900 11,836 108.6
including:
fiber flax 69 51 56 108.4
sugar beet 819 1,160 1,292 111.4
oil-bearing crops 8,020 9,616 10,447 108.6
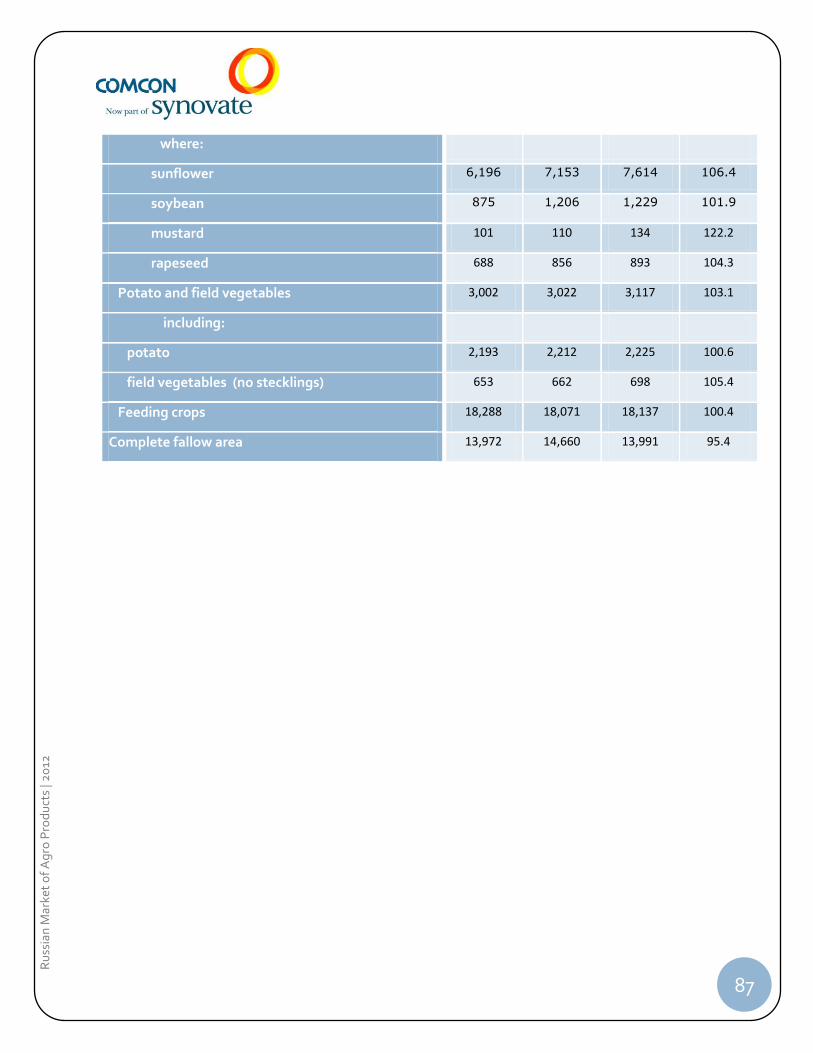
87
Ru
ssia
n M
arke
t o
f A
gro
Pro
du
cts
| 20
12
where:
sunflower 6,196 7,153 7,614 106.4
soybean 875 1,206 1,229 101.9
mustard 101 110 134 122.2
rapeseed 688 856 893 104.3
Potato and field vegetables 3,002 3,022 3,117 103.1
including:
potato 2,193 2,212 2,225 100.6
field vegetables (no stecklings) 653 662 698 105.4
Feeding crops 18,288 18,071 18,137 100.4
Complete fallow area 13,972 14,660 13,991 95.4
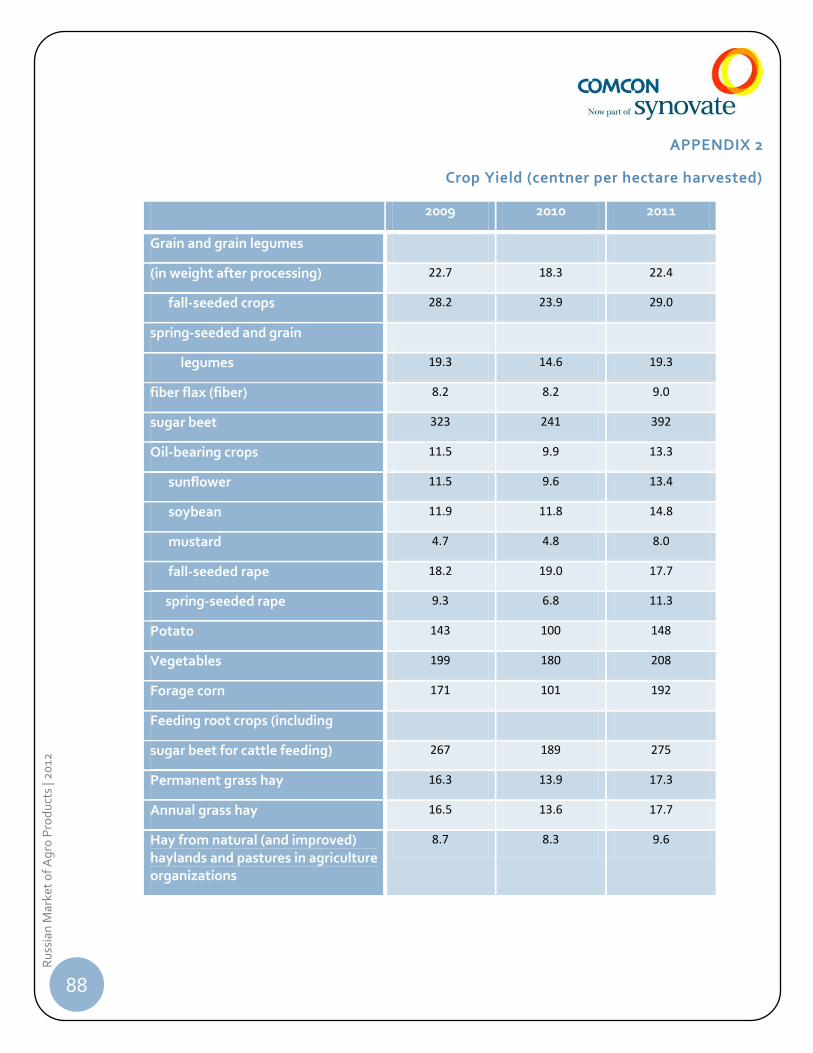
88
Ru
ssia
n M
arke
t o
f A
gro
Pro
du
cts
| 20
12
APPENDIX 2
Crop Yield (centner per hectare harvested)
2009 2010 2011
Grain and grain legumes
(in weight after processing) 22.7 18.3 22.4
fall-seeded crops 28.2 23.9 29.0
spring-seeded and grain
legumes 19.3 14.6 19.3
fiber flax (fiber) 8.2 8.2 9.0
sugar beet 323 241 392
Oil-bearing crops 11.5 9.9 13.3
sunflower 11.5 9.6 13.4
soybean 11.9 11.8 14.8
mustard 4.7 4.8 8.0
fall-seeded rape 18.2 19.0 17.7
spring-seeded rape 9.3 6.8 11.3
Potato 143 100 148
Vegetables 199 180 208
Forage corn 171 101 192
Feeding root crops (including
sugar beet for cattle feeding) 267 189 275
Permanent grass hay 16.3 13.9 17.3
Annual grass hay 16.5 13.6 17.7
Hay from natural (and improved) haylands and pastures in agriculture organizations
8.7 8.3 9.6
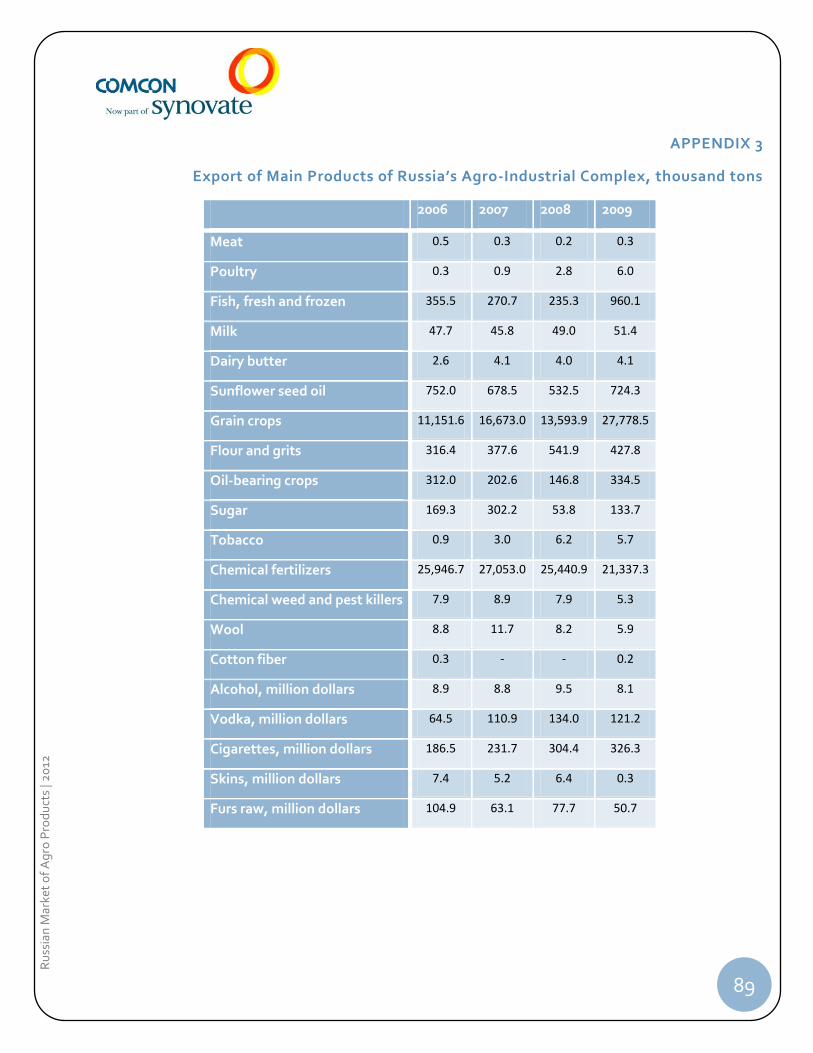
89
Ru
ssia
n M
arke
t o
f A
gro
Pro
du
cts
| 20
12
APPENDIX 3
Export of Main Products of Russia’s Agro-Industrial Complex, thousand tons
2006 2007 2008 2009
Meat 0.5 0.3 0.2 0.3
Poultry 0.3 0.9 2.8 6.0
Fish, fresh and frozen 355.5 270.7 235.3 960.1
Milk 47.7 45.8 49.0 51.4
Dairy butter 2.6 4.1 4.0 4.1
Sunflower seed oil 752.0 678.5 532.5 724.3
Grain crops 11,151.6 16,673.0 13,593.9 27,778.5
Flour and grits 316.4 377.6 541.9 427.8
Oil-bearing crops 312.0 202.6 146.8 334.5
Sugar 169.3 302.2 53.8 133.7
Tobacco 0.9 3.0 6.2 5.7
Chemical fertilizers 25,946.7 27,053.0 25,440.9 21,337.3
Chemical weed and pest killers 7.9 8.9 7.9 5.3
Wool 8.8 11.7 8.2 5.9
Cotton fiber 0.3 - - 0.2
Alcohol, million dollars 8.9 8.8 9.5 8.1
Vodka, million dollars 64.5 110.9 134.0 121.2
Cigarettes, million dollars 186.5 231.7 304.4 326.3
Skins, million dollars 7.4 5.2 6.4 0.3
Furs raw, million dollars 104.9 63.1 77.7 50.7
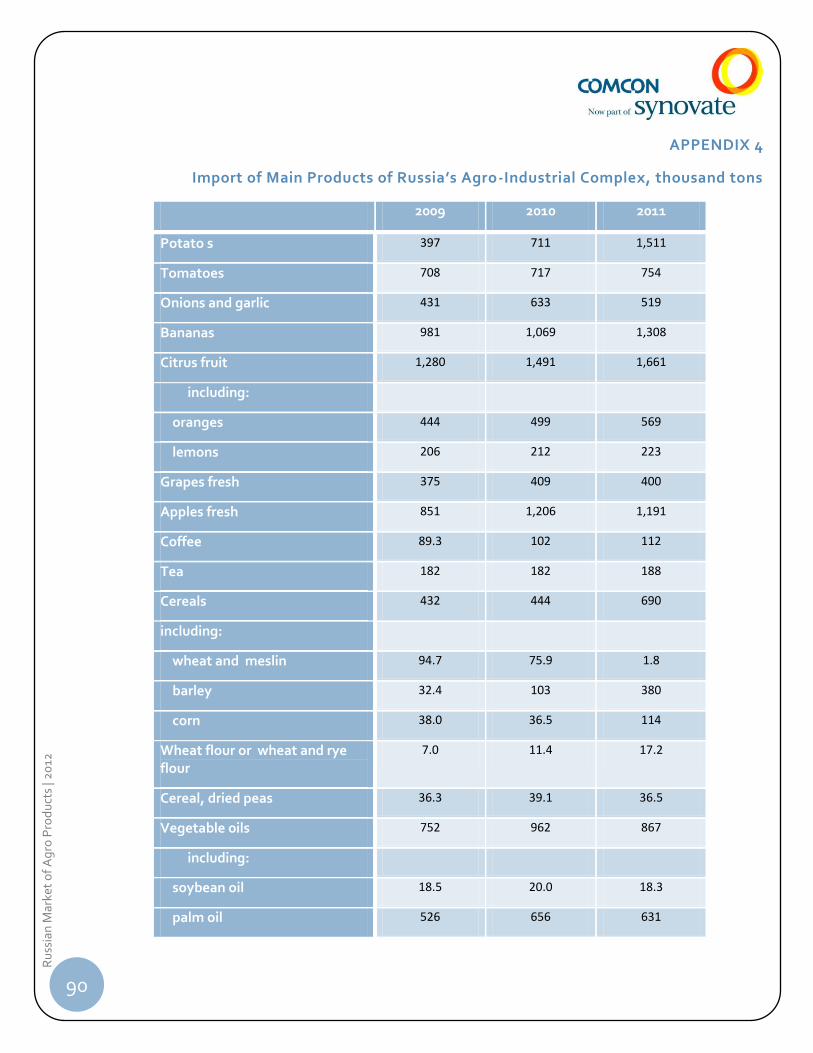
90
Ru
ssia
n M
arke
t o
f A
gro
Pro
du
cts
| 20
12
APPENDIX 4
Import of Main Products of Russia’s Agro-Industrial Complex, thousand tons
2009 2010 2011
Potato s 397 711 1,511
Tomatoes 708 717 754
Onions and garlic 431 633 519
Bananas 981 1,069 1,308
Citrus fruit 1,280 1,491 1,661
including:
oranges 444 499 569
lemons 206 212 223
Grapes fresh 375 409 400
Apples fresh 851 1,206 1,191
Coffee 89.3 102 112
Tea 182 182 188
Cereals 432 444 690
including:
wheat and meslin 94.7 75.9 1.8
barley 32.4 103 380
corn 38.0 36.5 114
Wheat flour or wheat and rye flour
7.0 11.4 17.2
Cereal, dried peas 36.3 39.1 36.5
Vegetable oils 752 962 867
including:
soybean oil 18.5 20.0 18.3
palm oil 526 656 631
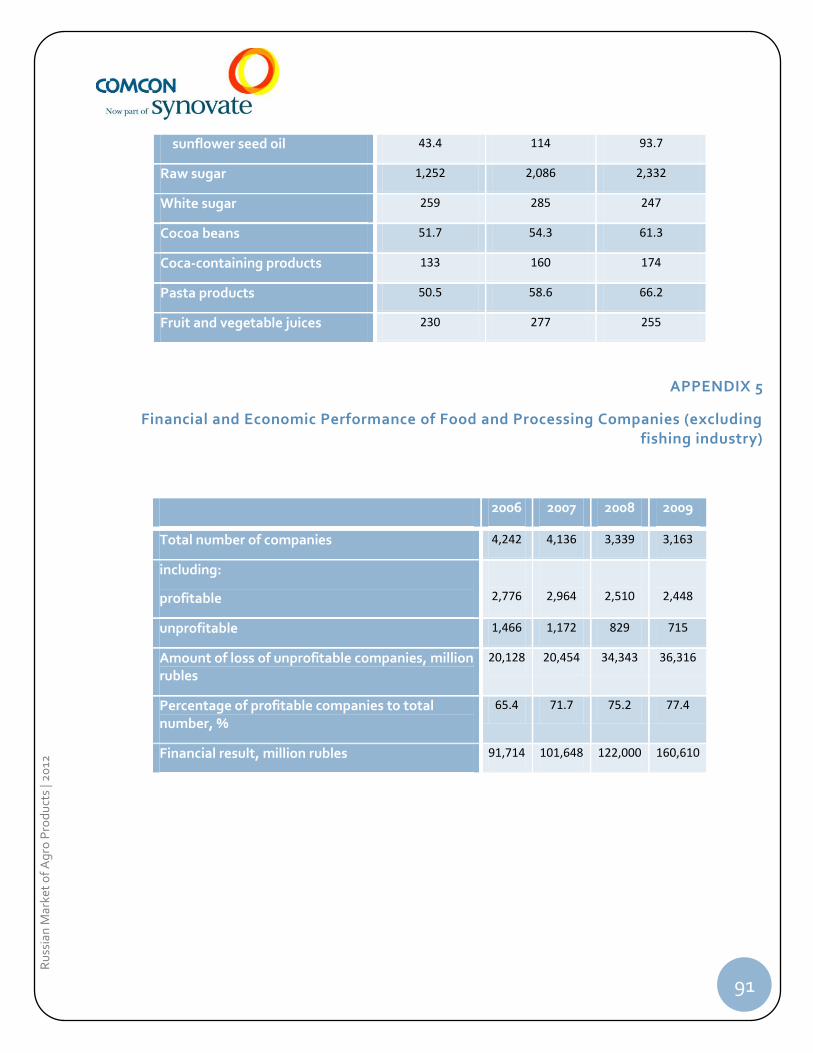
91
Ru
ssia
n M
arke
t o
f A
gro
Pro
du
cts
| 20
12
sunflower seed oil 43.4 114 93.7
Raw sugar 1,252 2,086 2,332
White sugar 259 285 247
Cocoa beans 51.7 54.3 61.3
Coca-containing products 133 160 174
Pasta products 50.5 58.6 66.2
Fruit and vegetable juices 230 277 255
APPENDIX 5
Financial and Economic Performance of Food and Processing Companies (excluding fishing industry)
2006 2007 2008 2009
Total number of companies 4,242 4,136 3,339 3,163
including:
profitable
2,776
2,964
2,510
2,448
unprofitable 1,466 1,172 829 715
Amount of loss of unprofitable companies, million rubles
20,128 20,454 34,343 36,316
Percentage of profitable companies to total number, %
65.4 71.7 75.2 77.4
Financial result, million rubles 91,714 101,648 122,000 160,610
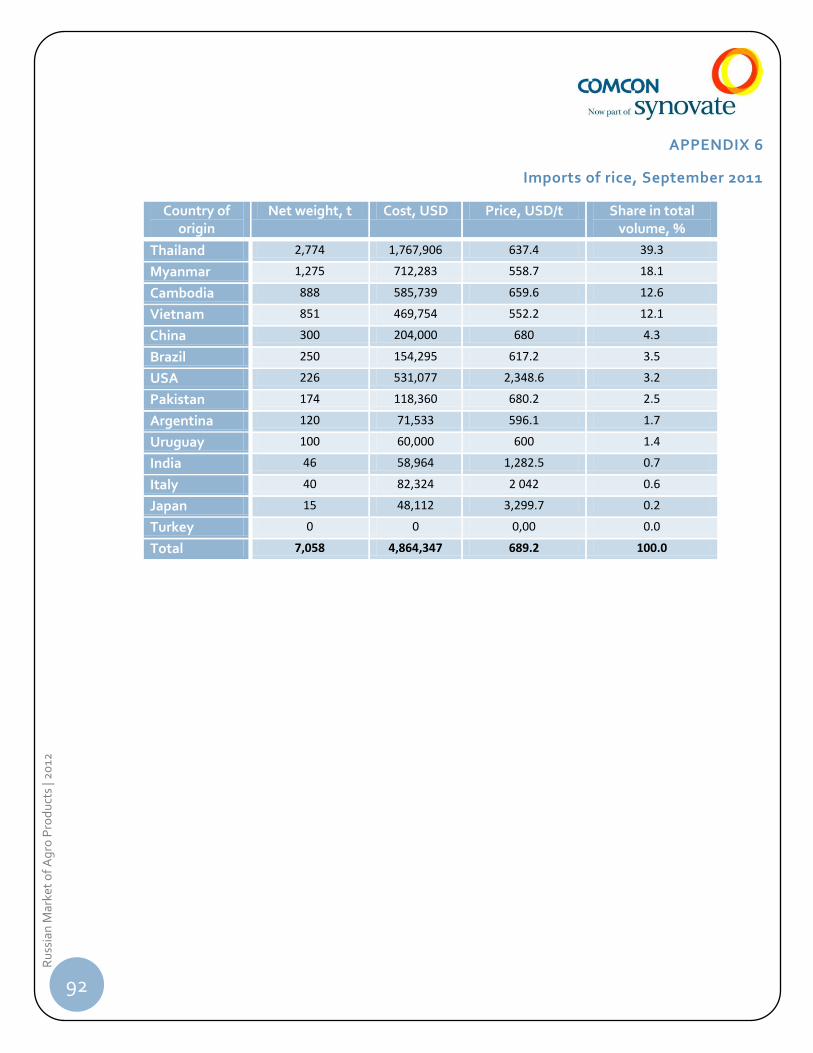
92
Ru
ssia
n M
arke
t o
f A
gro
Pro
du
cts
| 20
12
APPENDIX 6
Imports of rice, September 2011
Country of origin
Net weight, t Cost, USD Price, USD/t Share in total volume, %
Thailand 2,774 1,767,906 637.4 39.3
Myanmar 1,275 712,283 558.7 18.1
Cambodia 888 585,739 659.6 12.6
Vietnam 851 469,754 552.2 12.1
China 300 204,000 680 4.3
Brazil 250 154,295 617.2 3.5
USA 226 531,077 2,348.6 3.2
Pakistan 174 118,360 680.2 2.5
Argentina 120 71,533 596.1 1.7
Uruguay 100 60,000 600 1.4
India 46 58,964 1,282.5 0.7
Italy 40 82,324 2 042 0.6
Japan 15 48,112 3,299.7 0.2
Turkey 0 0 0,00 0.0
Total 7,058 4,864,347 689.2 100.0
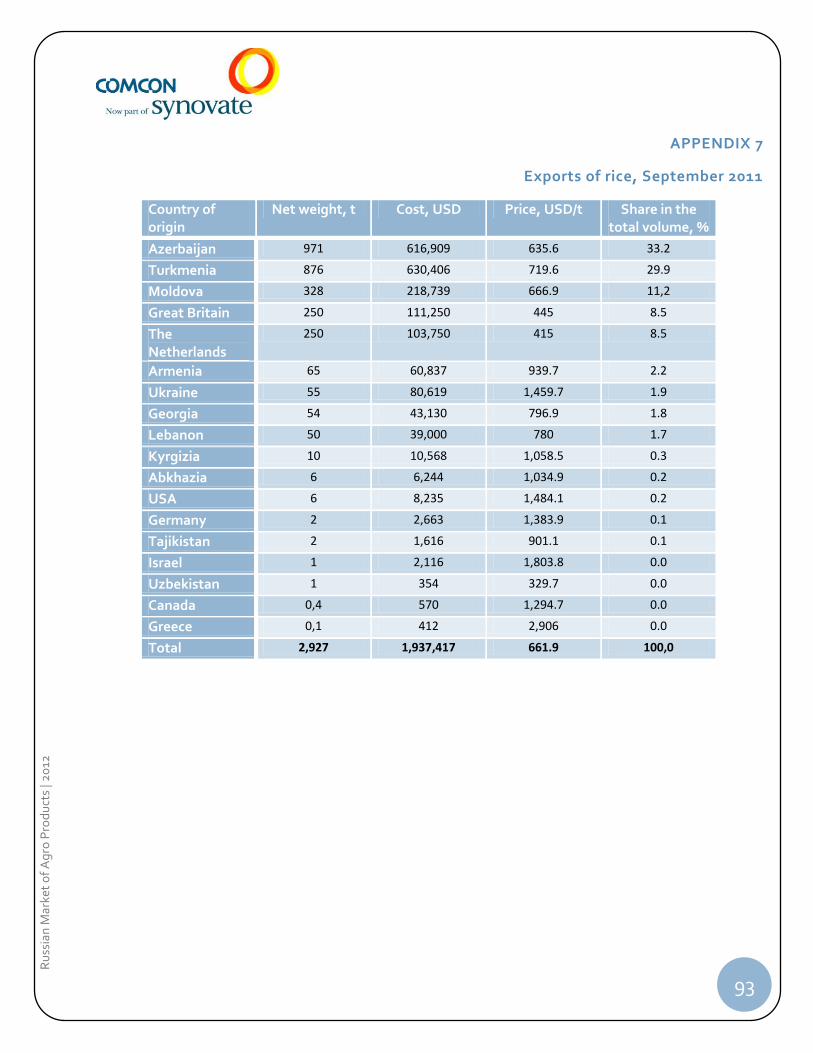
93
Ru
ssia
n M
arke
t o
f A
gro
Pro
du
cts
| 20
12
APPENDIX 7
Exports of rice, September 2011
Country of origin
Net weight, t Cost, USD Price, USD/t Share in the total volume, %
Azerbaijan 971 616,909 635.6 33.2
Turkmenia 876 630,406 719.6 29.9
Moldova 328 218,739 666.9 11,2
Great Britain 250 111,250 445 8.5
The Netherlands
250 103,750 415 8.5
Armenia 65 60,837 939.7 2.2
Ukraine 55 80,619 1,459.7 1.9
Georgia 54 43,130 796.9 1.8
Lebanon 50 39,000 780 1.7
Kyrgizia 10 10,568 1,058.5 0.3
Abkhazia 6 6,244 1,034.9 0.2
USA 6 8,235 1,484.1 0.2
Germany 2 2,663 1,383.9 0.1
Tajikistan 2 1,616 901.1 0.1
Israel 1 2,116 1,803.8 0.0
Uzbekistan 1 354 329.7 0.0
Canada 0,4 570 1,294.7 0.0
Greece 0,1 412 2,906 0.0
Total 2,927 1,937,417 661.9 100,0
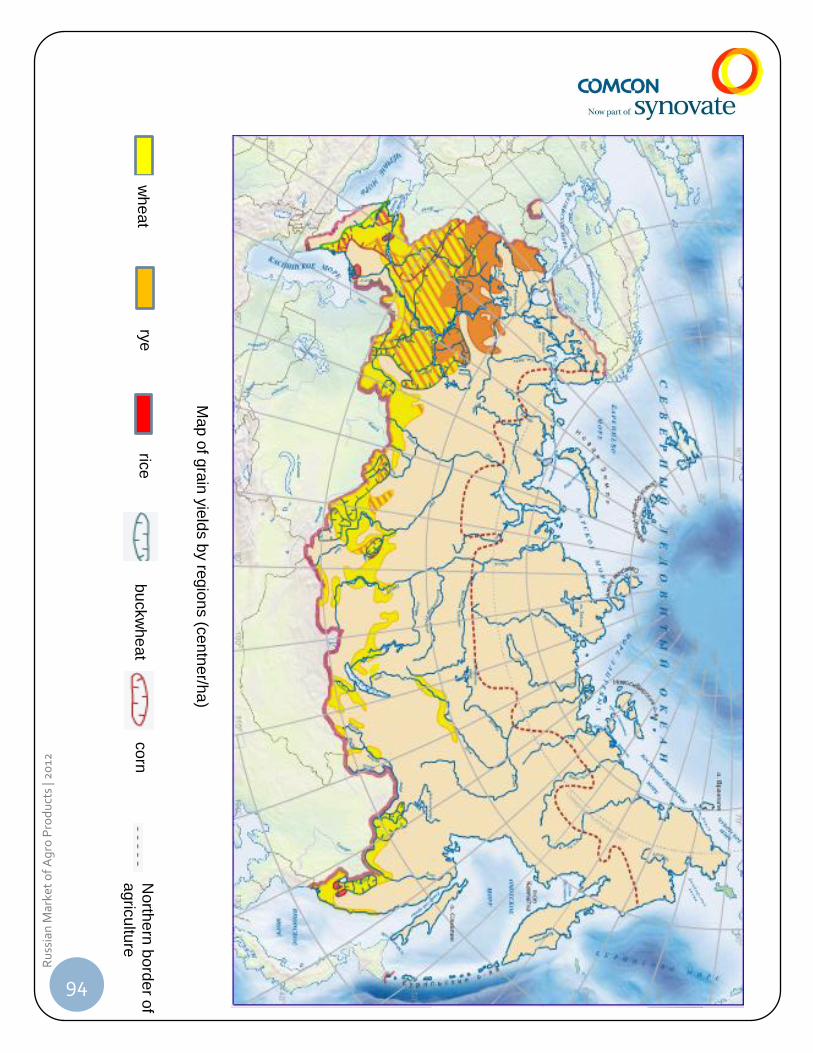
94
Ru
ssia
n M
arke
t o
f A
gro
Pro
du
cts
| 20
12
b
uckw
he
at
co
rn
North
ern
bo
rde
r of
agric
ultu
re
rice
rye
wh
ea
t
Ma
p o
f gra
in y
ield
s b
y re
gio
ns (c
en
tne
r/ha
)
95
Ru
ssia
n M
arke
t o
f A
gro
Pro
du
cts
| 20
12
APPENDIX 9
The Largest Agro-Industrial Companies
United Grain Company JSC
Foundation Date 2009
Company’s Activities
The company’s main activity lines are:
export of Russian grain to the world market
trading and purchasing activities in the domestic grain market
active development and employment of the grain market’s infrastructure
Company’s Sales Geography
United Grain Company exports bulks of Russia’s grain to Egypt, Saudi Arabia, Jordan and Israel
Products The company exports Russia's grain: wheat, barley, rye and other grain crops.
Organization Structure
State-owned company: 100% of its shares belong to the Russian Federation represented by the Federal Agency for State Property Management.
The company has stakes in 31 companies in 18 federal subjects.
Awards
Company profile The company acts as a state agent that conducts state trade and commodity interventions for regulating the market of agricultural products, raw materials and foodstuff. The company supervises the Federal Intervention Fund of Agricultural Products, Raw Materials and Foodstuff amounting to over 9.5 million tons of grain with total cost of over 1.5 billion US dollars.
Financial Performance (2010)
Revenue: 306 million US dollars, profit: 6 million US dollars
Contact Information 3, Bldg. 1, Orlikov Lane, 107139, Moscow, +7 (495) 647-39-83
Web-site http://www.oaoozk.com
96
Ru
ssia
n M
arke
t o
f A
gro
Pro
du
cts
| 20
12
Liviz JSC
Foundation Date 1897
Company’s Activities
The company produces strong alcoholic beverages
Company’s Sales Geography
The company delivers its products all over Russia
Products The company has four brands of alcohol products: Nasha Vodka, Diplomat, Saint Petersburg and Golden Moscow.
Organization Structure
Awards
Company profile The Liviz distillery is among the oldest ones in Russia. It was founded over 100 years ago. At present, Liviz is a modern company producing environmentally friendly product.
According to Business Analytics information, the company occupied 3.5% Russia’s vodka market as of March 2007.
Financial Performance (2008)
Revenue: 1.3 US dollars, loss: 5.7 US dollars.
Contact Information 56-58, Sinopskaya Embankment, St. Petersburg, Russia
Telephone number: (812) 271-29-66
Web-site www.liviz.ru
97
Ru
ssia
n M
arke
t o
f A
gro
Pro
du
cts
| 20
12
Baltika Breweries
Foundation Date 1990
Company’s Activities
The company’s main activity line is beer production.
Company’s Sales Geography
Baltika’s products are exported to 75 countries around the world, including the countries of Western Europe, North America and the Middle East region
Products The company owns about 30 beer brands including Baltika, Arsenalnoe, Nevskoe, Yarpivo, Tuborg, Carlsberg, Kronenbourg 1664 and a number of regional brands, as well as 8 non-beer brands
Organization Structure
The company includes:
breweries located in 10 Russia’s cities: St. Petersburg, Yaroslavl, Tula, Voronezh, Rostov-on-Don, Samara, Chelyabinsk, Krasnoyarsk, Khabarovsk and Novosibirsk, and 1 brewery in Azerbaijan
2 own malt-houses
In April 2008, Baltika became a part of the Carlsberg International Group; the core owner: BALTIC BEVERAGES HOLDING AB (89.01%).
Awards Prize in The Best Innovation Project nomination, 2012
Company profile The company is a leader of Russia’s beer market occupying 39.7%. It is one of the largest FMCG companies in Russia
Production capacity in Russia is 5.2 million hectoliters of beer per month
The company’s products are available in 98% of the points of sale around Russia
The Baltika brand is one of the three most expensive brands in Russia and it is the №1 beer in Europe in terms of sales
Contact Information 3, 6th Verkhniy Lane, St. Petersburg +7 (812) 325-93-25
Financial Performance (2010)
Capitalization: 7.4 billion US dollars
Revenue: 2.7 billion US dollars, net profit: 640 million US dollars
Web-site baltika.ru
98
Ru
ssia
n M
arke
t o
f A
gro
Pro
du
cts
| 20
12
St. Petersburg Mill Plant
Foundation Date 1949
Company’s Activities
The company manufactures grocery products
Company’s Sales Geography
The company has a distribution network in the Northwest Region of Russia. At present, it is entering the federal market. The company’s products are exported to Belarus, Georgia, Moldova and Ukraine.
Products The company manufactures the following products:
flour
cereals
porridges
sugar
flakes, etc. The company owns a number of brands: Aladushkin, Yasno Solnyshko, Predportovaya Flour and Gornitsa
Organization Structure
Since early 2003, Saint Petersburg Mill Plant is a part of the largest in North-Western Russia food holding ALADUSHKIN Group.
Awards The Best Product 2010 medal, etc.
Company profile At present, Saint Petersburg Mill Plant is a leader in Northwest Russia’s flour and cereal industry. The company takes up to 70% of the flour retail market and over 60% of the cereal market of the Northwest Region.
Financial Performance
Contact Information 5, 4th Predportovy Proezd, Saint Petersburg Telephone number: +7 (812) 413-66-81
Web-site www.mill.ru
E-mail [email protected]
99
Ru
ssia
n M
arke
t o
f A
gro
Pro
du
cts
| 20
12
Yug Rusi Group of Companies
Foundation Date 1992
Company’s Activities
The company produces and exports vegetable oil and grocery products.
The company exports grain and grain legumes
Company’s Sales Geography
The company has a developed national distribution network and direct contacts with all main national trade networks.
Sales geography includes such countries as Azerbaijan, Afghanistan, Belarus, Germany, Georgia, Kazakhstan, Kyrgyzstan, Lithuania, Latvia, Moldova, Mongolia, Tajikistan, Turkmenistan, Uzbekistan, Czech Republic, Estonia, etc.
Products Bottled and bulk vegetable oil
Grocery product range: mayonnaise, bakery, confectionery, flour, canned vegetables, soft drinks, snacks, etc.
Organization Structure
The total area of farmlands is about 200,000 hectares; area of croplands is over 150,000 hectares
27 grain elevators
9 oil extraction units
11 refining units
11 distribution centers
terminals in Rostov and Kherson seaports
2 bakery plants
Awards Product of the Year National Premium (2011 and 2008)
Grand Prix of the All-Russia Festival of Oil and Fat Product Quality, 2010
Award for participation in the Best Product 2008 International Contest
Golden Standart 2004 International Contest
Trademark No. 1 in Russia 2009 Premium
Company profile The company is a leader in the bottled vegetable oil market having stable and constantly increasing market share over 32.9 % (as of 2010/2011)
Financial Performance (2009)
Revenue: 1.07 billion US dollars
100
Ru
ssia
n M
arke
t o
f A
gro
Pro
du
cts
| 20
12
Contact Information 8, Tolstoy Square, Rostov-on-Don
Telephone number: (863) 264 19 14
Web-site grain.ru
E-mail [email protected]
Prodimex Group
Foundation Date 1992
Company’s Activities
The company is Russia’s largest producer of white sugar.
Company’s Sales Geography
The company has longstanding business links with the largest consumers, including well-known Russian food producers and international trade companies.
Products Sugar, beet pulp, citric acid and molasses.
According to the company’s data, it produces over 15% of Russia’s sugar.
Organization Structure
The company is owned by Prodimex Farming Group, Cyprus.
Prodimex Group is the largest agricultural holding in Russia.
The company incorporates 15 sugar plants.
The total area of farmlands is 570,000 hectares.
Awards
Company profile The company’s strategy is aimed at achieving maximum efficiency from its activity and supposes possession of the own large land bank, introduction of the most effective farming methods, investments in effective productive assets and development of stable long-term relations with consumers.
Financial Performance (2010)
Revenue: 1,100 million US dollars.
Contact Information Bld.3, Business Center Riga Land, 26th km Baltia Highway, Krasnogorsk District, Moscow Region
Telephone number.: +7 (495) 933-44-00
Web-site www.prodimex.ru
E-mail [email protected]
101
Ru
ssia
n M
arke
t o
f A
gro
Pro
du
cts
| 20
12
Baltimor Company
Foundation Date 1995
Company’s Activities
The company produces and exports canned vegetables
Company’s Sales Geography
The company has eight regional representative offices in Russia: St. Petersburg, Krasnodar, Samara, Yekaterinburg, Novosibirsk, Irkutsk, Khabarovsk and Vladivostok, which enable the company to cover a major part of the country
Products Vegetable pastes, salads and snacks, canned and glassed products, mushrooms/olives, pickled products and juices.
The company owns the following brands: Baltimor, Krasnodarye, 8 Ovoschei and Krasnaya Polyana
Organization Structure
The company features a vertically integrated holding structure
The company integrates three production plants: Baltimor-Krasnodar Ltd. (a canning plant) in Krasnodar, Baltimor-Amur Ltd. (a canning plant) in Khabarovsk and Krasnodarye Ltd. (an agriculture company) in Krasnodar Krai.
Awards Product of the Year National Premium (1999-2005)
Trademark No. 1 in Russia Premium (2002)
Brand of the Year/EFFIE (2004 and 2006), etc.
Company profile The company uses raw materials for production from its own farmlands located near the plant.
According to the Baltimor holding’s data, it occupies 50% of the canned vegetable market. Some other resources estimate their share at the level at about 40%.
Contact Information 2, Konstitutsii Square, 196247 St. Petersburg
Telephone number: +7(812) 449-59-60
Web-site www.baltimor-rus.ru
E-mail [email protected]
102
Ru
ssia
n M
arke
t o
f A
gro
Pro
du
cts
| 20
12
Nidan Juices JSC
Foundation Date 1998
Company’s Activities
The company produces juices
Company’s Sales Geography
The company has a large logistics network all over Russia
Products The company’s key products and juices of the following brands: Moya Semya, Da! and Caprice, as well as Caprice tea line.
Organization Structure
The owner of the company’s 100 % is Ireland-based European refreshments (subsidiary of the Coca-Cola Company)
The company owns 2 plants in Novosibirsk and Kotelniki, as well as storage facilities.
Awards Moya Semya brand was declared Trademark No. 1 in Russia in the Juice category (2011, 2009)
Company profile
Financial Performance (2006)
Revenue: 220 million US dollars, net profit: 11.5 million US dollars
Contact Information 2, 1st Pokrovsky Proezd, Kotelniki, Moscow Region
+7 (495) 782-17-65
Web-site www.nidan.ru
E-mail [email protected]
103
Ru
ssia
n M
arke
t o
f A
gro
Pro
du
cts
| 20
12
Evalar Pharmaceutical Company
Foundation Date 1991
Company’s Activities
The company manufactures pharmaceutical products based on medical plants
Company’s Sales Geography
Evalar is one of Russia’s largest pharmaceutical companies; the country’s absolute market leader in volumes of pharmaceutical product output. The company’s share amounts to almost ¼ of the dietary supplement pharmaceutical market.
Products The company’s portfolio includes about 150 medicines and dietary supplements in different product forms: pills, capsules, tinctures, drops, water-soluble drinks in sachets and teas in tea filter bags.
Organization Structure
Closed stock joint company
Awards Trademark No. 1 in Russia Premium in 2009
Quality Leader Premium
Health Idea National Premium Prize in the Best Producer of the Year nomination (2006, 2007, 2008 and 2010)
The Best Industrial Company in Altai Krai Premium
Demidov Prize for Achievements in Industrial Production and Business, 2005
Company profile The company conducts research in biochemistry, pharmaceuticals, parapharmaceuticals and functional nutrition. It develops fully innovative natural medicines and phytopreparations based on traditional folk medicine formulas.
Financial Performance
Contact Information 23/6, Sotsialisticheskaya Street, Biysk, 659332 Altai Krai
+7(495)783-10-00
Web-site http://www.evalar.ru/
E-mail [email protected]
104
Ru
ssia
n M
arke
t o
f A
gro
Pro
du
cts
| 20
12
Miratorg Agribusiness Holding
Foundation Date 1995
Company’s Activities
The country’s largest producer and importer of meat
Company’s Sales Geography
The company has a strong logistics and distribution network all over Russia
Products Miratorg Agribusiness Holding is Russia’s largest pork producer and the leader in Russia’s meat and semi-finished product market.
The company’s portfolio includes the following brands:
Vitamin (frozen vegetables, berries, mushrooms and mixes);
Miratorg (meat semi-finished products);
Gurmama (meat semi-finished products);
Miratorg (cooled meat semi-finished products).
Organization Structure
The company’s structure includes:
2 grain companies;
fodder plant;
grain elevator;
10 pig farms for 1.15 million pigs;
pig slaughtering and meat processing plant;
semi-finished product plant in Kaliningrad Region;
3 low-temperature automated warehouses (Moscow, Saint Petersburg and Kaliningrad);
transport company;
distribution companies;
main agricultural business is concentrated in Belgorod Region.
Awards
Company profile Miratorg Agribusiness Holding is the largest investor in Russia’s agro-industrial sector (35 billion rubles of effectively used investments). It takes active participation in the Agro-Industrial Sector Development National Project and the National Program for Agriculture Development and Regulation of Agricultural Products, Raw Materials and Foodstuff Markets for 2008–2012.
Financial Performance (2010)
Revenue: 1.1 billion US dollars, net profit: 78 million dollars.
Contact Information 17, Prechistenskaya Embankment, Moscow
105
Ru
ssia
n M
arke
t o
f A
gro
Pro
du
cts
| 20
12
Galactika Group of Companies
Foundation Date 2008
Company’s Activities
Galactika Group is one of the largest manufacturers of dairy products in Russia.
Company’s Sales Geography
The company has a developed logistics network
Products Galactika manufactures products under the brands like Bolshaya Kruzhka, MilkTime, Tom and Jerry, Luntik and Sudarynya
Organization Structure
Galatika Group incorporates the following enterprises:
• Galactika dairy plant
• Baby food plant
• Gatchinsky dairy plant
• 2 agricultural companies
• Galactika trading company
Awards
Company profile According to Russian and foreign experts, Galactika dairy plant is one of the most advanced dairy enterprises in Europe. It is a fully automated plant with advanced equipment, which manufactures the highest quality products.
Financial Performance (2010)
Revenue: over 100 million US dollars.
Contact Information 254, Ligovsky Pr., Saint Petersburg
Telephone number: +7 (812) 334 40 55
Web-site www.mnogomoloka.ru
E-mail [email protected]
+7(495)7750650
Web-site http://www.miratorg.ru
E-mail [email protected]
106
Ru
ssia
n M
arke
t o
f A
gro
Pro
du
cts
| 20
12
Russian Sea Group of Companies
Foundation Date 1997
Company’s Activities
The company works in three directions:
production of ready-to-eat fish products (Russian Sea company)
delivery of cooled and fresh-frozen fish and seafood products (Russian Fish Company)
fish farming (Russian Sea - Aquaculture)
Company’s Sales Geography
The company has 30 offices and branches all over Russia. The company’s logistics system enables it to distribute the products through direct sales and trade representatives all over the country.
Products ready-to-eat fish products
cooled and fresh-frozen fish and seafood products
Organization Structure
95% of Russian Sea Group of Companies belongs to Corsico Limited. The company owns a fish processing plant in Noginsk and a fish farming plant at the Segozero Lake, Karelia. In the nearest future the company is planning to build one more manufacturing complex and a warehouse in Noginsk.
Awards
Company profile Russian Sea is one of the leaders in the fish product market in Russia
It occupies about 12% of Russia’s fish product market
The company’s plants have advanced equipment, which enables manufacturing high-quality products meeting consumers’ demands
In April 2010, the company conducted IPO on Russia’s stock exchanges
Financial Performance (2009)
Revenue: 597 million US dollars, profit: 3.9 million US dollars
Contact Information 4 Belovezhskaya Street, 121353 Moscow
Telephone number: 8 (495) 258 99 28
Web-site www.russiansea.ru
E-mail [email protected]
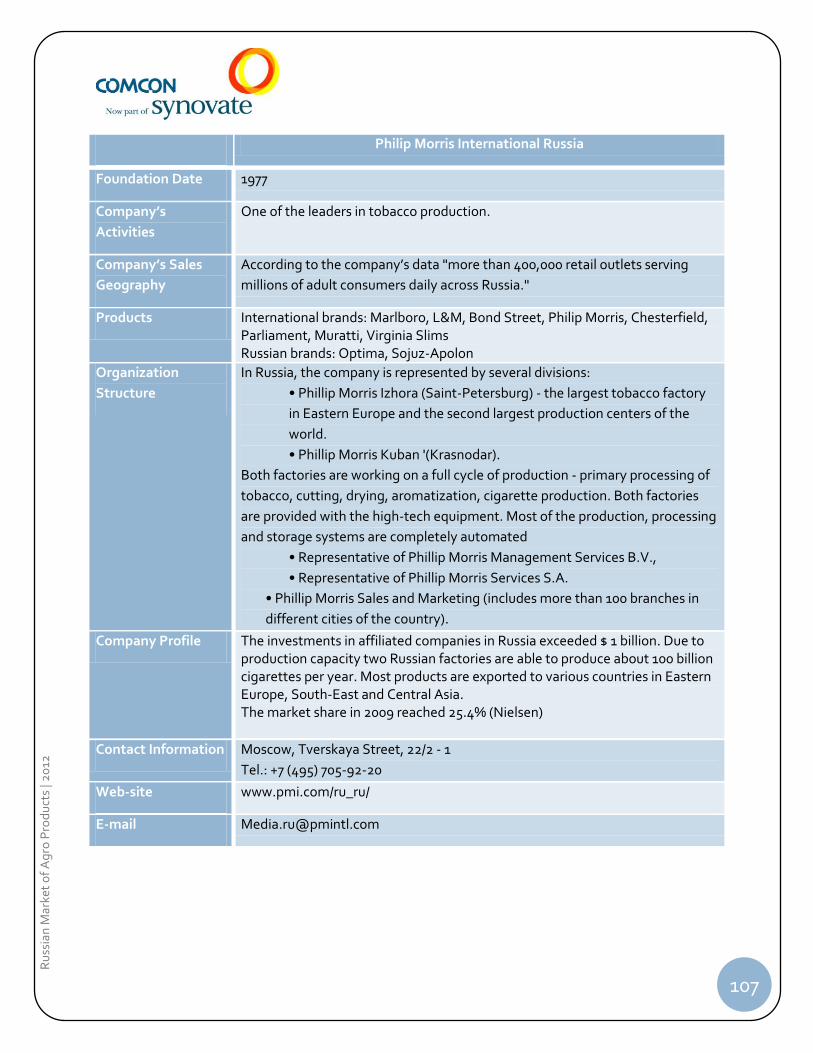
107
Ru
ssia
n M
arke
t o
f A
gro
Pro
du
cts
| 20
12
Philip Morris International Russia
Foundation Date 1977
Company’s
Activities
One of the leaders in tobacco production.
Company’s Sales
Geography
According to the company’s data "more than 400,000 retail outlets serving
millions of adult consumers daily across Russia."
Products International brands: Marlboro, L&M, Bond Street, Philip Morris, Chesterfield, Parliament, Muratti, Virginia Slims Russian brands: Optima, Sojuz-Apolon
Organization
Structure
In Russia, the company is represented by several divisions:
• Phillip Morris Izhora (Saint-Petersburg) - the largest tobacco factory
in Eastern Europe and the second largest production centers of the
world.
• Phillip Morris Kuban '(Krasnodar).
Both factories are working on a full cycle of production - primary processing of
tobacco, cutting, drying, aromatization, cigarette production. Both factories
are provided with the high-tech equipment. Most of the production, processing
and storage systems are completely automated
• Representative of Phillip Morris Management Services B.V.,
• Representative of Phillip Morris Services S.A.
• Phillip Morris Sales and Marketing (includes more than 100 branches in
different cities of the country).
Company Profile The investments in affiliated companies in Russia exceeded $ 1 billion. Due to production capacity two Russian factories are able to produce about 100 billion cigarettes per year. Most products are exported to various countries in Eastern Europe, South-East and Central Asia. The market share in 2009 reached 25.4% (Nielsen)
Contact Information Moscow, Tverskaya Street, 22/2 - 1
Tel.: +7 (495) 705-92-20
Web-site www.pmi.com/ru_ru/
E-mail [email protected]
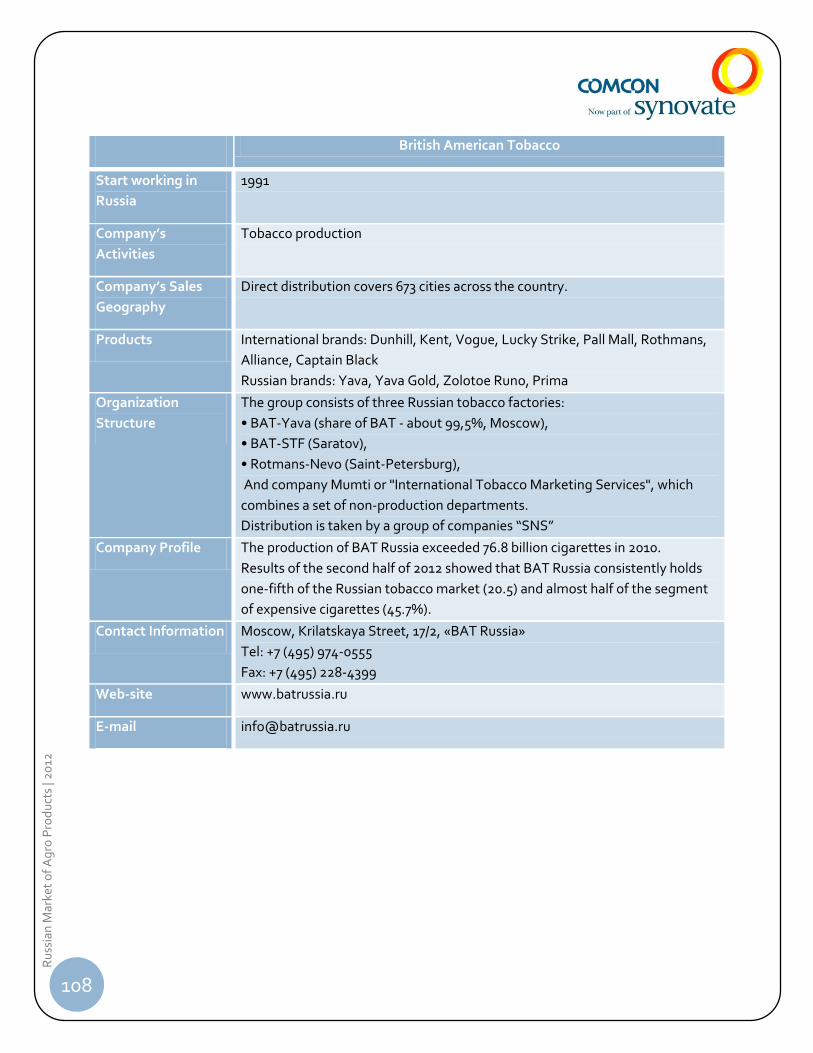
108
Ru
ssia
n M
arke
t o
f A
gro
Pro
du
cts
| 20
12
British American Tobacco
Start working in
Russia
1991
Company’s
Activities
Tobacco production
Company’s Sales
Geography
Direct distribution covers 673 cities across the country.
Products International brands: Dunhill, Kent, Vogue, Lucky Strike, Pall Mall, Rothmans,
Alliance, Captain Black
Russian brands: Yava, Yava Gold, Zolotoe Runo, Prima
Organization
Structure
The group consists of three Russian tobacco factories:
• BAT-Yava (share of BAT - about 99,5%, Moscow),
• BAT-STF (Saratov),
• Rotmans-Nevo (Saint-Petersburg),
And company Mumti or "International Tobacco Marketing Services", which
combines a set of non-production departments.
Distribution is taken by a group of companies “SNS”
Company Profile The production of BAT Russia exceeded 76.8 billion cigarettes in 2010.
Results of the second half of 2012 showed that BAT Russia consistently holds
one-fifth of the Russian tobacco market (20.5) and almost half of the segment
of expensive cigarettes (45.7%).
Contact Information Moscow, Krilatskaya Street, 17/2, «BAT Russia»
Tel: +7 (495) 974-0555
Fax: +7 (495) 228-4399
Web-site www.batrussia.ru
E-mail [email protected]
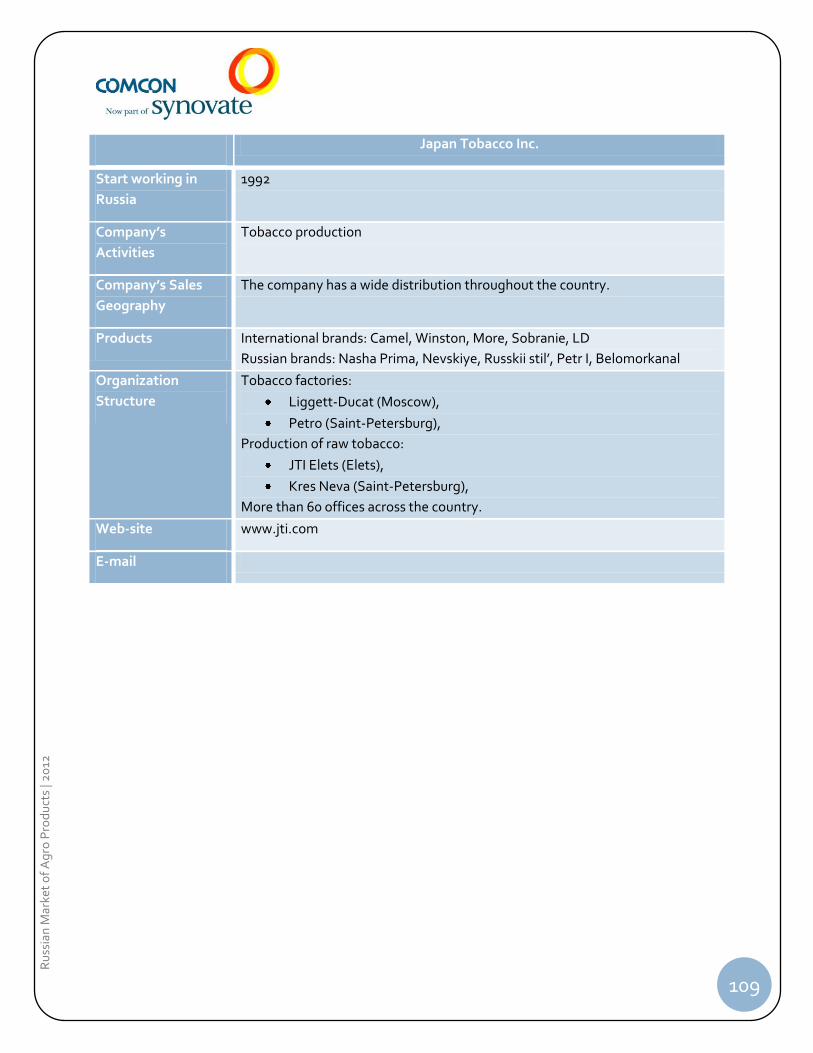
109
Ru
ssia
n M
arke
t o
f A
gro
Pro
du
cts
| 20
12
Japan Tobacco Inc.
Start working in
Russia
1992
Company’s
Activities
Tobacco production
Company’s Sales
Geography
The company has a wide distribution throughout the country.
Products International brands: Camel, Winston, More, Sobranie, LD
Russian brands: Nasha Prima, Nevskiye, Russkii stil’, Petr I, Belomorkanal
Organization
Structure
Tobacco factories:
Liggett-Ducat (Moscow),
Petro (Saint-Petersburg),
Production of raw tobacco:
JTI Elets (Elets),
Kres Neva (Saint-Petersburg),
More than 60 offices across the country.
Web-site www.jti.com
110
Ru
ssia
n M
arke
t o
f A
gro
Pro
du
cts
| 20
12
References
Experts
Nord-Ovosch Management Company
Baltimor Group of Companies
Galactika Group of Companies
KPMG Consulting Company
Russian Grain Union
Official Resources and Statistics
Basic Indicators of Agriculture in Russia in 2011 (annual statistics digest).
Federal State Statistics Service of the Russian Federation, 2012
FAO
ROSSTAT
Analytical Reviews
Russian and World Cereal Market. Current Situation and Outlook. Intesco Research Group
Basic Indicators of Agriculture in Russia in 2011 (annual statistics digest). Federal State Statistics Service of the
Russian Federation, 2012
Agriculture in Russia in 2009 (booklet). Ministry of Agriculture of the Russian Federation, 2010
Alabushev A.V. Grain Farming in Russia: State, Problems and Promising Lines. Theoretical, Scientific and
Practical Magazine, 2009, No. 1
Report No. 17 (272). Russian Grain Union, 2010
Report “On State and Implementation of Agricultural Lands". Ministry of Agriculture of the Russian Federation,
2011
Analytical Market Review: Grain Crops and Derived Products. Ministry of Agriculture of the Russian Federation,
2nd quarter, 2011.
Labor and Employment in Russia in 2011 (statistics digest). Federal State Statistics Service of the Russian
Federation, 2012
Review of Agro-Industrial Complex of Russia in 2010–2011. Ernst & Young, 2011
111
Ru
ssia
n M
arke
t o
f A
gro
Pro
du
cts
| 20
12
Survey of Possibilities for Russia-Finland Cooperation in Production and Processing of Grain and Oil-bearing
Crops. FinPro, 2011
Industry reviews from Intesco Research Group, Agro-industrial complex Inform, Institute of Agrarian Market,
Global Reach Consulting, RBC, BusinesStat, SIG Combibloc, CreditInform
Internet Resources
Agroru.com
Fruitinfo.ru
http://www.agroxxi.ru/monitoring-selskohozjaistvenyh-tovarov/analiz-rynka-kukuruznogo-i-rapsovogo-masla-
v-rosi.html
http://expert.ru/2011/12/6/slishkom-horoshij-god/
http://www.agroxxi.ru/monitoring-selskohozjaistvenyh-tovarov/obzor-rosiiskogo-rynka-svezhih-ovoshei.html
http://www.agroxxi.ru/stati/pererabotka-spaset-kartofelevodstvo.html
http://www.ikar.ru/press/1431.html
http://linestorg.ru/news/business/569/
http://www.riskovik.com/journal/stat/n5/rastitelnoe-maslo/
http://www.riskovik.com/riski/otraslevye/full/24/
http://ikar.ru/sugar/profile.html
http://www.kommersant.ru/doc/1820345
http://www.agroxxi.ru/zrast/kak-sdelat-otrasl-bezothodnoi-rynok-saharnoi-svekly-v-rosi.html
http://www.agroru.com/news/670790.htm
http://www.foodmarket.spb.ru/current.php?article=1604
http://www.marketcenter.ru/content/document_r_980DCB49-9CE2-403F-BD77-8CA70BCAE043.html
and many more