Embed Size (px)
Citation preview

Russia’s automotive market: 2014 results and outlook
www.pwc.ru/automotive
February 2015
Sergey Litvinenko Director PwC Russia Automotive Practice

PwC
Passenger cars sales in Russia

PwC
Global sales of new passenger cars The US and China slow down, while European markets continue to restore
New passenger cars sales in key markets, 2014
3
+6.8% +13%
China: +9.9% 19.7 mln units
Russia: -10.0% 2.3 mln units
India: -6.1% 2.5 mln units
UK: +9.3% 2.5 mln units
Spain: +18.4% 0.86 mln units
France: +0.3%
1.8 mln units
Italy: +4.2%
1.4 mln units
Germany: +2.9% 3.0 mln units
Brazil: -9.4% 2.5 mln units
Japan: +3% 4.7 mln units
USA: +1.3% 16.4 mln units*
• The European market continues to recover. It may take a few years, however, to reach pre-crisis levels. Spain, with its high growth rate, is driving the market upward, with growth facilitated by low base level.
• In 2014, China continued to improve its position in the race for global car sales leadership, moving still further ahead of the US. However, the growth rate slowed down in the Chinese market. But, China still has growth potential: car producers are bringing new models to the market, which have been customised for the Chinese consumer, and are easing their pricing policies (in part due to pressure from the Chinese government), and the country's economy is demonstrating further growth.
• The other BRIC countries posted declining car sales figures in 2014. Brazil and India, the decline in sales occurred mostly as a result of the depreciation of local currencies, price increases and high interest rates. Sales in Russia slumped further, which is driven by a number of reasons that are discussed below.
(*) including light commercial vehicles Sources: ACEA, data from national industry associations

PwC
What role will the major markets play in future? What has changed for Russia?
• The BRIC markets have the greatest potential for unit sales growth in the next 10 years.
• Going forward, the US and EU markets will not be able to demonstrate a similar growth rate as emerging economies; however, they will remain the key markets alongside China.
• China is already the largest automotive market in the world, which will continue to expand (in volume) and will be under focus of the car producers’ attention.
• The role of Japan, formerly one of the world’s largest markets, will further diminish. Japanese car producers will be increasingly focused on meeting consumer needs in other countries.
4
No. Country 2014 sales, million units
Outlook for moving up in the rating
by 2025
1 China 19.7
2 USA 16.4
3 Japan 4.7
4 Germany 3.0
5 Brazil 2.5
6 India 2.5
7 UK 2.5
8 Russia 2.3
Major passenger car markets in 2014 and their potential to improve their global rankings over the next 10 years
Sources: PwC analysis

PwC
Despite slowing growth, Russia is still one of the key markets for strategic alliances of car producers
Top-10 global strategic alliances by sales volume in 2014, million units
Share of Russia in global auto alliance sales
(*) Estimate for 2014 based on actual performance for 8 months of 2014 Source: AEB, companies data, PwC analysis
5
Production sites in Russia
2.84*
2.94
4.32
4.61
6.32
7.87
8.46
9.93
10.14
10.23
6.6%
4.3%
7.7%
5.9%
-0.1%
5.2%
2.4%
2.1%
4.2%
-2.5%
Suzuki
PSA
Honda
Fiat-Chrysler
Ford
KIA-Hyundai
Renault-Nissan
GM
Volkswagen
Toyota 1.9%
2.4%
1.9%
9.0%
4.5%
1.0%
0.4%
0.5%
1.4%
0.7%

PwC
New passenger car sales in Russia in 20141
6
Passenger car categories
Sales, thousand units Sales, USD billion
Jan-Dec 2014
Jan-Dec 2013
Change Jan-Dec
2014 Jan-Dec
2013 Change
Local brands 410 480 -15% 4.4 5.9 -25%
Locally assembled foreign car brands 1,280 1,310 -2% 30.6 34.6 -12%
Imported new cars 6502 810 -20% 23.2 28.5 -19%
TOTAL 2,340 2,600 -10% 58.2 69.0 -16%
• The year 2014 was quite challenging and rather uneven for the automotive industry. Russia’s car market in 2014 was influenced by a variety of factors, some of which will have a great impact on market growth in future.
• Based on 2014 results, passenger car sales in Russia declined by 10% in unit terms. In US dollar terms, the market shrank by 16%, while demonstrating a 2% increase in rouble terms.
• Geopolitical uncertainty, rouble depreciation, rising car prices and auto loan interest rate increase had a significant impact on the automotive market.
1Net of light commercial vehicles
2Preliminary estimate by PwC
Sources: АЕB, Avtostat, ASM-Holding, Russian Federal Customs Service, PwC

PwC
New passenger car market in Russia in 2014: Conclusions and trends
In 2014, the market progressed through three distinct phases:
─ Market slowdown in 1Q 2014 resulting from the wind-down of preferential car loan programmes;
─ A mid-year sales slump driven by market uncertainty due to the imposed sanctions and increasingly strained political relations with a number of countries;
─ Excessive demand for new cars in the 4Q 2014 as a result of rouble depreciation and the expected increase in prices.
7
-6%
-2% 0%
-8%
-12%
-17%
-23%
-26%
-20%
-10%
-1%
2%
-30%
-25%
-20%
-15%
-10%
-5%
0%
5%
0
50
100
150
200
250
300
January February March April May June July August September October November December
New passenger car sales, thousand units New passenger car sales growth rate (versus the same month in the prior year), %
Heightened tensions around Crimea
Source: АЕB, PwC estimates
Launch of a new scrappage programme + rouble depreciation
Stage 1 Stage 2 Stage 3
In November-December, customers from Kazakhstan and Belarus purchased about 90,000 cars in Russia, more than half of which were new

PwC
2,600 2,340
-328 68
2013 2014
The market was supported by sales of Japanese and premium brands, while sales in the low-end price segment have dropped off
8
Sales of new passenger cars (excluding LCV)*, in 2013-2014, thousand units
Source: АЕB, PwC analysis
*LCV = light commercial vehicles
Brand's share in the total decline of
sales volume in 2014
Lada 22% -71,900 units
Chevrolet 16% -51,500 units
Ford 11% -35,900 units
VW 9% -28,200 units
Daewoo 7% -23,100 nits
Opel 5% -16,400 units
Renault 5% -15,700 units
Peugeot 3% -9,800 units
SsangYong 3% -9,000 units
Other 20% -66,500 units
Brand's share in the total increase of
sales volume in 2014
Nissan 24% 16,100 units
Datsun 17% 11,400 units
Mazda 12% 7,500 units
Toyota 11% 7,300 units
UAZ 7% 4,900 units
Mercedes 7% 4,400 units
Lexus 5% 3,400 units
Jeep 4% 3,000 units
Mitsubishi 2% 1,400 units
Other 11% 8,200 units

PwC
Lada
KIA Renault
Hyundai
Toyota Nissan
VW Chevrolet
Skoda Mitsubishi
Daewoo
Mazda Mercedes-Benz Ford
BMW Audi
UAZ
Opel
SsangYong 0
50
100
150
200
250
300
350
400
-40% -30% -20% -10% 0% 10% 20% 30%
Sa
les
vo
lum
e i
n 2
014
, th
ou
sa
nd
s o
f u
nit
s
Sales increase in 2014, %
Lifan
Volume and share of the passenger car market (excluding LCV) broken down by brands in 2014
9
8.8
Source: АЕB, PwC analysis
Volume, sales increase and share of the passenger car market by brands in 2014
Brand Market share in 2014, %
Lada 16.2%
KIA 8.4%
Renault 8.1%
Hyundai 7.7%
Toyota 6.9%
Nissan 6.8%
VW 5.5%
Chevrolet 5.3%
Skoda 3.6%
Mitsubishi 3.4%
Opel 2.8%
Ford 2.4%
Mazda 2.2%
Mercedes-Benz 2.1%
Daewoo 1.6%
BMW 1.5%
Audi 1.5%
UAZ 1.5%
SsangYong 1.1%
Lifan 1.0%
Other 10.4%

PwC
The market is strongly influenced by fluctuations in the Russian rouble exchange rate against other currencies
10
• One of the main drivers influencing the car market in 2014 and shaping the situation in 2015, was the significant weakening of the Russian rouble (RUB). The RUB’s depreciation against the US dollar (USD) and the euro (EUR) in 2014 was 99% and 67%, respectively. Meanwhile, the South Korean won (KRW) and Japanese yen (JPY) firmed versus the RUB by 93% and 77%, respectively. As a result, car prices in RUB rocketed for 2-3 months.
30
35
40
45
50
55
60
65
7 0
7 5
80
85
01.01.2015 01.10.2014 01.07.2014 01.04.2014 01.01.2014
+67%
+99%
USD EUR
Source: Central Bank of the Russian Federation
RUB/USD and RUB/EUR exchange rate fluctuations in 2014
RUB/JPY and RUB/KRW exchange rate fluctuations in 2014
30
35
40
45
50
55
60
65
01.01.2015 01.10.2014 01.07.2014 01.04.2014 01.01.2014
+93% +77%
JPY (for 100 units)
KRW (for 1000 units)

PwC
The ongoing macroeconomic uncertainty will continue to determine the difficult situation in the automotive industry in 2015
11
Indicator 2012 2013 2014E 2015F Forecast source
GDP 3.4% 1.3% 0.6% -3.5% Consensus*
Inflation 6.6% 6.5% 11.4% 11.6% Consensus*
USD/RUB exchange rate
(average annual rate) 31.1 31.9 38.6 63.4 Consensus*
EUR/RUB exchange rate
(average annual rate) 39.9 42.4 60.0 72.4 Consensus*
Average Brent oil price
(USD per barrel) 98.4 99.7 96.0 65.0 Consensus*
Real disposable income 4.6% 4.0% -0.3% -2.8% Ministry of Economic Development
of the Russian Federation
Net capital inflow / outflow
(USD billion) -54 -61 -152 -118 Central Bank of the Russian Federation
Consumer confidence index, Q4 -8% -11% -18% N/A
Key economic indicators (year-on-year change)
• In 2014, there was a generally negative macroeconomic background: economic slowdown, rising inflation, a strong rouble depreciation against other currencies, falling oil prices, capital outflows, the decline in real disposable income and consumer confidence.
(*) Moody's, Fitch Ratings, Morgan Stanley, JP Morgan, IMF, Citibank, EBRD, World Bank, and others
Source: Central Bank of the Russian Federation, Ministry of Economic Development of the Russian Federation, Ministry of Finance of the Russian Federation, Bloomberg, PwC analysis

PwC
Comparing the car market: 2009 vs 2015
12
*Consensus forecasts
Source: AEB, Rosstat, Bloomberg, PwC estimates
8 0 000
1 00 000
1 2 0 000
1 4 0 000
1 6 0 000
1 8 0 000
2 00 000
2 2 0 000
2 4 0 000
2 6 0 000
-58%
Oct Jul Apr Jan Oct Jul Apr Jan
New passenger car sales, units
8 0 000
1 00 000
1 2 0 000
1 4 0 000
1 6 0 000
1 8 0 000
2 00 000
2 2 0 000
2 4 0 000
2 6 0 000
Oct Jul Apr Jan Oct Jul Apr Jan
?
2008A 2009A 2014A 2015F*
+5.2% -7.8% GDP trend, % +0.6% -3.5%
29.4 30.2 Year-end RUB/USD exchange rate 56.2 N/A
24.8 31.7 Average RUB/USD exchange rate for the year 38.0 63.4
45.6 75.3 Year-end oil price (USD per barrel) 58.2 N/A
98.4 62.8 Average oil price (USD per barrel) for the year 99.4
65.0

PwC
Outlook and forecasts

PwC
Key factors driving the Russian auto market
Factors Impact on the market in 2014
Impact on the market in 2015
Long-term impact on the market
Household income
Car prices
Cost of car operating
Availability of loans
Consumer sentiment
Stimulation of demand
Model line-up and brand strategy
Infrastructure development
Overall economic conditions
Dealership network penetration
Used car market development
Car fleet upgrade
Demographics
14

PwC
Average car price growth for the selected brands from September 2014 to mid-January 2015
15
20%
22%
22%
23%
24%
26%
45%
52%
56% Opel
Renault
Chevrolet
Infiniti
Ford
Lexus
Nissan
Toyota
Mitsubishi
16%
16%
17%
19%
20%
Skoda
Mercedes-Benz
KIA
8%
7%
14%
15%
Land Rover
VW
BMW
Audi
Lada
Hyundai
For this analysis, we have taken several best-selling car models of each brand and averaged the growth data for each brand. Car prices are based on actual dealer car prices taken into account special offers.
US car brands
Japanese car brands
European car brands
Korean and Russian car brands
• Given the rouble depreciation, car producers have had to adjust their RUB prices for cars sold in Russia. The majority of car brands have taken a step-by-step approach to price adjustments, trying to find a balance between the need to minimise losses and maintain demand. Key aspects to be considered when establishing a new price are fluctuations in the RUB exchange rate against the manufacturer's base currency, the level of production localisation in Russia and the brand strategy.

PwC
Granta liftback Vesta XRay 4x4 Urban Largus Cross Kalina Sport Kalina Cross
Sales trends will be significantly influenced by new models in the line-ups as well as the level of localisation
16
• Those brands that can offer the buyer the brand-new models with moderate price increases will be in a better position in 2015.
• At the same time price rises may be curbed due to the high level of manufacturing localisation and/or the brand strategy in the local market.
• Russian car producers have an opportunity in the coming years to improve the situation in the market and increase their market share. On the one hand, the declining demand and sales decrease will have a negative effect as well. But, on the other hand, the rouble depreciation and the government support create opportunities for business development, moreover, through expansion of export.
Source: PwC analysis * current-generation model facelift
2014 2015
GLA-Class C-Class S-Class Coupe GLE/GLE Coupe
Teana Qashqai Terrano Juke* X-Trail
X3* X6 X4 2 Series Active Tourer
6 Series*
Nissan
Mercedes-Benz
BMW
Lada
Pathfinder Sentra
2 Series
Mazda Mazda6* CX-5* CX-3* Mazda3* MX-5*
Examples of some brands with a relatively new model line-up and/or important new models in 2015

PwC
Overview of government support measures for Russian auto market (1 of 2)
• Under current conditions, government support for the market has become vital. The extension of the government’s successful car fleet renewal programme into 2015 will support the market; but the allocated funds will be enough for a few months only.
• Given that the 2015 programme (compared to the 2014 programme) is more focussed on stimulating demand for commercial vehicles, its impact on passenger car sales will be less pronounced. Approximately 130,000 cars could be purchased based on funding of RUB 10 billion. The programme will primarily support the low-end car segment.
17
Type of vehicle Number of cars sold, units
Share
Passenger cars 155,002 82.4%
LCV* 22,544 12.0%
Trucks 8,299 4.4%
Buses 2,333 1.2%
Total 188,178 100%
AvtoVAZ 30%
KIA Motors Rus 12%
UAZ 10%
Volkswagen Group Rus
9%
MC GAZ Group 6%
Renault Russia 5%
Nissan Manufacturing
Rus 5%
Ford Sollers Holding
4%
Hyundai Motor Manufacturing
Rus 4%
Kamaz 3% Other
12%
Source: Ministry of Industry and Trade of the Russian Federation
Outcome of the government car fleet renewal programme, September–December 2014

PwC
Overview of government support measures for Russian auto market (2 of 2)
• The recent rouble depreciation has paved the way for further localisation of car production in Russia, which is a strategic priority for the development of Russia’s auto industry. However, whether investors would opt to put their money into Russia-based production will to a great extent depend on several factors:
─ the domestic market capacity;
─ export capabilities (given Russia's relations with neighbouring countries);
─ understanding among investors and market players of the prospective strategy for the Russian economy and industry development.
• The decline in sales expected in 2015 may prompt some brands to leave the Russian market. At greatest risk are those car producers whose sales in Russia are relatively low compared to their global sales. Moreover, some car dealers are likely to go bankrupt. In order to ease the decline in sales in 2015, it would be advisable to consider some potential options for stimulating demand through extra incentives, such as:
─ increasing funding and extending the car fleet renewal programme;
─ ensuring reduction of effective interest rates on car loans (subsidising car loan interests and/or targeted support for banks to expand auto lending);
─ reducing the cost of car ownership, which includes changing the way the transport tax is calculated to encourage purchases of cars with low emissions (possible only for new cars and for a certain period);
─ government procurement of domestically produced cars;
─ permitting the use of “maternity capital” grants for car purchases;
─ creating favourable conditions for exporting Russian-made cars, etc.
18
PwC
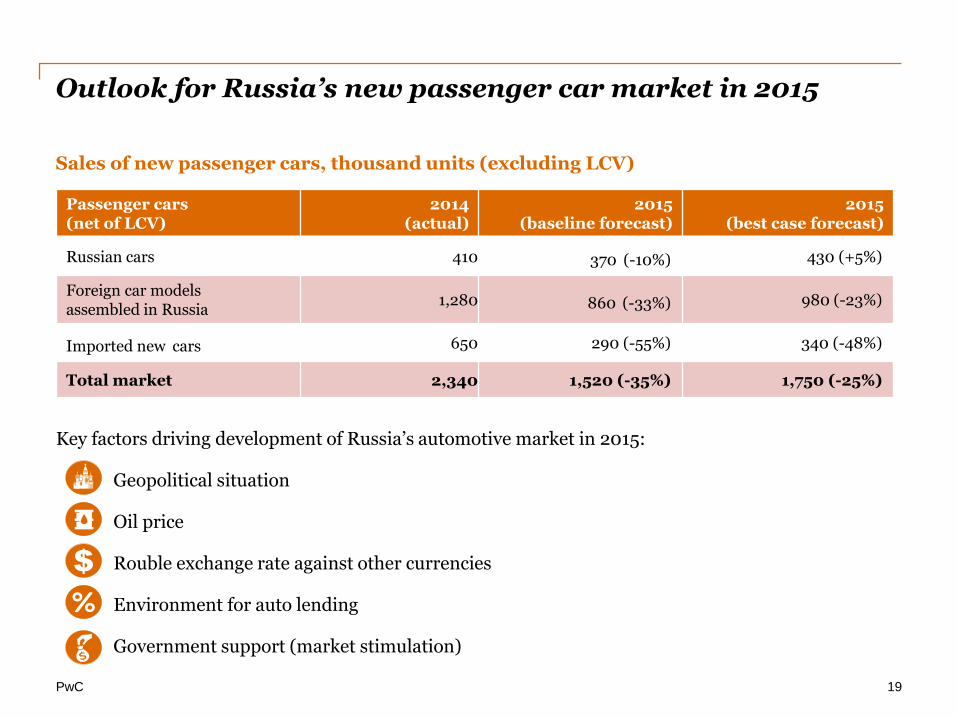
Outlook for Russia’s new passenger car market in 2015
19
Passenger cars (net of LCV)
2014 (actual)
2015 (baseline forecast)
2015 (best case forecast)
Russian cars 410 370 (-10%) 430 (+5%)
Foreign car models assembled in Russia
1,280 860 (-33%) 980 (-23%)
Imported new cars 650 290 (-55%) 340 (-48%)
Total market 2,340 1,520 (-35%) 1,750 (-25%)
Sales of new passenger cars, thousand units (excluding LCV)
Key factors driving development of Russia’s automotive market in 2015:
- Geopolitical situation
- Oil price
- Rouble exchange rate against other currencies
- Environment for auto lending
- Government support (market stimulation)

PwC
It may take 5 years to rebound to 2012 levels
• We have considered two market development scenarios: 1) best case and 2) baseline case. • The level of motorisation (number of cars per 1,000 people) is projected to increase up to 350-400 cars by 2025
according to the forecast.
20
Source: PwC analysis
2025
3.4 3.1
2024
3.4 3.1
2023
3.4 3.0
2022
3.3 3.0
2021
3.2 2.9
1.8
1.8 1.6
1.9
2015 2009
2.3
1.4
2008 2017
2.7
2007
2.4
2.4
2006
2.6
1.8
2005 2018
1.4
1.8
2.6
2016
1.5
2.8
2014
2.3
2019
2.3
2013
2.8
2.6
2012
3.0
2.8
2011 2020
2.5
2010
Sales recovery to 2012 level
Sales in 2012
Passenger car sales forecast in 2015-2025, million units
Baseline scenario
Best case scenario

PwC
The cost of car ownership in Russia To read the full PwC annual survey, please visit: www.pwc.ru/automotive

PwC 22
Main conclusions on the cost of ownership as of January 2015 (1 of 2)
The annual cost of ownership*, RUB thousand
• The car prices increase in the end of 2014 will likely continue into 2015. Certain car producers have already raised prices by tens of percent. At the same time, banks have been adopting more strict terms for issuing car loans, while insurance companies have raised OSAGO (compulsory third party car insurance) and KASKO (hull coverage auto insurance) rates. Other car servicing expense items have increased alongside the rouble depreciation. Consequently, car owners and potential buyers have now begun to pay more attention not only to a car's brands, model and features, but also to the cost of owning and maintaining it.
• PwC experts have analysed the cost of ownership in Russia as of January 2015. The cost of ownership means both operating expenses and car’s value depreciation (car purchase price less resale revenue).
Source: PwC analysis
634
460
334
680
439
335
223
Full-size SUV (over
RUB 3 million)
Full-size SUV (up to
RUB 3 million)
1,167
Mid-size crossover
Compact crossover E-Class (Business) D-Class (Mid-size) C-Class (Golf) B-Class (Compact)
* The cost of ownership of a particular car can vary significantly, depending of the specific conditions for buying and operating the vehicle

PwC 23
Main conclusions on the cost of ownership as of January 2015 (2 of 2)
Structure of car ownership costs, %
29%26% 30%
27% 26% 23% 24%20%
24%
19% 13%
7%
16%14% 16%
9%
17%
17% 18%
21%
21%
19%19%
19%
19%
31% 31%38%
28%35% 33%
45%
2%2%3% 4%5% 4% 2%2%2%2%1%
1%1% 4%2%3%3%3%
3%3%
3%4%
E-Class
(Business)
680
3%
C-Class (Golf)
335
B-Class
(Compact)
223
Full-size SUV
(over
RUB 3 million)
1,167 634
Compact
crossover
334
D-Class (Mid-size)
439
Mid-size
crossover
460
3%
Full-size SUV
(up to
RUB 3 million)
Fuel
Loan (% only)
Depreciation Other maintenance expenses
Insurance (KASKO and OSAGO)
Maintenance (scheduled)
Taxes and charges
Source: PwC analysis

PwC
• 7-24% of the total cost of ownership, depending on the car segment;
• Fuel expenses in the total cost of car ownership differ in the reviewed segments: the share of fuel expenses is lower for more expensive cars despite higher fuel consumption (due to more powerful engines).
• 17-21% of the total cost of ownership;
• Late 2014 – early 2015, the rouble depreciation and prime rate increase led to an increase in car loan interest rates up to 19-23%;
• Sales in the low- and medium-price segments are most sensitive to the interest rate growth, while premium segment cars sales are less dependent on loan interest rate changes.
Survey findings on the key components in the cost of ownership (1 of 2)
24
• 19-45% of the total cost of ownership;
• Loss in value depends primarily on the original cost of a car, as well as on the used car market environment (including the demand for and supply of a particular model);
• Normally, higher-end cars lose value faster than less expensive and prestigious cars;
• Other factors driving loss in value include: the reliability of a model, the availability of new updated model cars in the market, and price trends for similar new cars.
Costs of ownership
Loan
Fuel
Insurance Taxes and duties
Other expenses
Depreciation
Main- tenance

PwC
• 2-4% of the total cost of ownership;
• Normally, the more expensive a car, the smaller share of maintenance expenses in the cost of ownership.
• 20-30% of the total cost of ownership (mainly driven by the cost of KASKO);
• In monetary terms, the amount of insurance expenses (KASKO) grows along with the cost of a car. Yet, as a percentage of the cost of a car, KASKO expenses are normally lower for more expensive vehicles;
• Other factors, driving the cost of KASKO, include: cost of spare parts and repairs, car exclusivity, etc.
Survey findings on the key components in the cost of ownership (2 of 2)
25
• 1-4% of the total cost of ownership;
• Transport tax depends on engine capacity and region;
• A multiplier used for the transport tax on cars that cost more than RUB 3 million significantly increases the cost of ownership.
• 2-5% of the total cost of ownership;
• Other expenses (winter tyres, car wash twice per month) are nearly at the same level in monetary terms, so their share in the total cost of ownership is driven by the car price.
Costs of ownership
Loan
Fuel
Insurance Taxes and duties
Other expenses
Depreciation
Main- tenance

PwC
Key assumptions underlying the survey
26
• The survey covered new cars that are officially supplied to Russia.
• For the purposes of our analysis, 8 car classes have been identified in accordance with car size and price*.
• Each class includes 5 popular car brands.
• The findings of the analysis for each car class show the average result for the cars in the corresponding class.
• All major indicators (car price, loan terms and conditions, etc.) are as of the second half of January 2015 and are based on PwC analysis, data provided by car dealers and information from open sources.
• The following key assumptions underlie our survey:
─ A car is bought with a standard equipment package, a gasoline engine and an automatic transmission;
─ A car is bought and used in a major Russian city;
─ A car is used by one owner for 3 years;
─ A car is bought, using a loan, with a down payment of 50%.
Average characteristics of reviewed cars by class
(*) Composition and criteria of each class have been identified on the basis of PwC analysis
Source: PwC analysis
B Class (Compact)
C Class (Golf)
D Class (Mid-size)
E Class (Business)
Compact crossover
Mid-size crossover
Full-size SUV (up to RUB 3
mln)
Full-size SUV (over to RUB
3 mln)
Car price, RUB thousand 551.6 928.4 1,280.0 2,276.5 1,135.2 1,541.8 2,258.6 3,308.9
Engine, h.p. 98 115 149 194 149 177 205 300
Kilometres travelled, km/year
24,342 24,600 25,420 20,700 21,140 23,380 25,700 24,440
Fuel consumption (gasoline AI-95, AI-92 or similar), l/100 km
6.8 7.4 6.4 7.0 7.5 8.1 11.6 11.3
Loss in value over three years, % of original cost
23% 33% 30% 38% 24% 31% 27% 47%
Loan interest rate 22.6% 21.2% 22.2% 21.7% 21.9% 20.7% 18.8% 23.0%

PwC
© 2015 PwC. All rights reserved.
Thank you!
This presentation has been prepared for general guidance on matters of interest only, and does not constitute professional advice. You should not act upon the information
contained in this presentation without obtaining specific professional advice. No representation or warranty (express or implied) is given as to the accuracy or completeness of
the information contained in this presentation. To the extent permitted by law, PwC, its members, employees and agents accept no liability, and disclaim all responsibility, for
the consequences of you or anyone else acting, or refraining to act, in reliance on the information contained in this presentation or for any decision based on it.
Sergey Litvinenko
Director, PwC Automotive Practice