Embed Size (px)
Citation preview
REPUBLIC OF RWANDA
Ministry of Youth and ICT
Rwanda ICT Sector Profile – 2012
“Measuring ICT sec tor per formance and Tracking ICT for Deve lopment (ICT4D) towards Rwanda Soc io-Economic Transformation”
– December 2012 –
2
Foreword It is my pleasure to present to you the Rwanda ICT Sector Profile for the year 2012. This sector profile is a compilation of indicators that have been selected to measure the Rwanda’s ICT sector performance and track ICT for Development (ICT4D) towards Rwanda Socio-Economic Transformation and provide valuable information for the formulation of National policies. This report takes into consideration internationally recognized reports used to measure Information-society and e-Government developments, respectively the “Measuring the Information Society” measured by the International Telecommunication Union (ITU) and the “UN e-Government Survey” measured by the United Nations (UN). These two reports presents valuable information and ranks countries performance globally, with regards to the ICT sector performance, cost and affordability of ICT services as well as uptake of e-government applications and services. This profile particularly features the ICT for Socio-Economic Development in Rwanda, particularly for the five priority sectors namely, the Governance Sector, the Health Sector, the Education Sector, the Agriculture sector and the Business & Finance Sector, with a special focus on tracking the use of the deployed systems and applications. The year 2012 has shown a particular and continued uptake in the utilization of ICT, especially in terms of mobile-cellular subscriptions, International Internet bandwidth, and mobile-broadband subscriptions, bringing more citizens connected to Internet. Key ICT achievements have also been highlighted, in order to inform readers of major developments that happened in 2012. The measurement of the impact of ICT for Socio-Economic Development, that is tracked for the very first year, show that there are still important efforts to be made to increase the usage of systems already in place in the various priority sectors. We trust that the ICT Sector Profile 2012 will be of great value for its readers.
Jean Phi lbert Nsengimana Minister o f Youth and ICT
3
Acknowledgments The Rwanda ICT Sector Profile– 2012, was prepared by the Ministry of Youth and ICT, in collaboration with the ICT Department of Rwanda Development Board (RDB), the Rwanda Utilities and Regulatory Agency (RURA), the National Institute of Statistics of Rwanda (NISR). Special thanks to the Ministry of Local Government (MINALOC), the Ministry of Health (MOH), the Ministry of Education (MINEDUC), The Ministry of Economic Planning and Finance (MINECOFIN), the Ministry of Agriculture (MINAGRI), the Ministry of Justice (MINIJUST), the National Bank of Rwanda (BNR), the Rwanda Revenue Authority (RRA), the Rwanda Education Board (REB), the National Identification Authority (NIDA) and the Registrar General Office of the Rwanda Development Board (RDB). Without their cooperation and support, the compilation of this Sector Profile would not have been possible. The report includes data from ITU, the Department of Economic and Social Affairs of the United Nations Population Division, which is greatly acknowledged. The work was carried out under the overall coordination of Mr. Didier Nkurikiyimfura, the Director General in charge of ICT at the Ministry of Youth and ICT.
4
Table of Contents
Foreword ................................................................................................. 2
Acknowledgments ................................................................................. 3
1. ICT Sector Overview ......................................................................... 5 1.1 VISION ...................................................................................................................................... 5 1.2 ICT SECTOR STRATEGIC OBJECTIVES ................................................................... 5 1.3 INSTITUTIONAL FRAMEWORK .................................................................................. 5 1.4 ICT FOR DEVELOPMENT (ICT4D) ROADMAP .................................................... 5 1.5 KEY PRIORITY SECTORS .................................................................................................. 6 1.6 GUIDING PRINCIPLES ...................................................................................................... 6
2. The ICT Sector in 2012 ....................................................................... 8 2.1 KEY ACHIEVEMENTS ..................................................................................................... 8 2.2 KEY CHALLENGES ........................................................................................................ 11
3. ICT at a Glance .................................................................................. 13 3.1 SECTOR STRUCTURE, EFFICIENCY AND CAPACITY ................................. 13 3.2 SECTOR PERFORMANCE ............................................................................................. 13 3.3 ICT FOR DEVELOPMENT (ICT4D) STATISTICTS ............................................. 14 3.3.1. ICT In Finance ......................................................................................................................... 14 3.3.2. ICT in Education ...................................................................................................................... 15 3.3.3. ICT in Health ........................................................................................................................... 17 3.3.4. ICT in Governance .................................................................................................................... 19 3.3.5. ICT in Agriculture .................................................................................................................... 20 3.3.6. ICT Investments ........................................................................................................................ 20
5
1. ICT Sector Overview
1.1 VISION
To accelerate socio-economic development, improving productivity of the private sector and developing the growth of ICT.
1.2 ICT SECTOR STRATEGIC OBJECTIVES
The following strategic objectives are constantly followed, in the pursuit of attaining Vision 2020 goals: § To develop a vibrant ICT industry and position Rwanda as the Regional ICT Hub § To facilitate the creation of a highly competitive service sector, fueling economic
growth § To promote social and cultural interaction and integration in the society through
the use of ICT § Enable efficient and effective service delivery through ICT
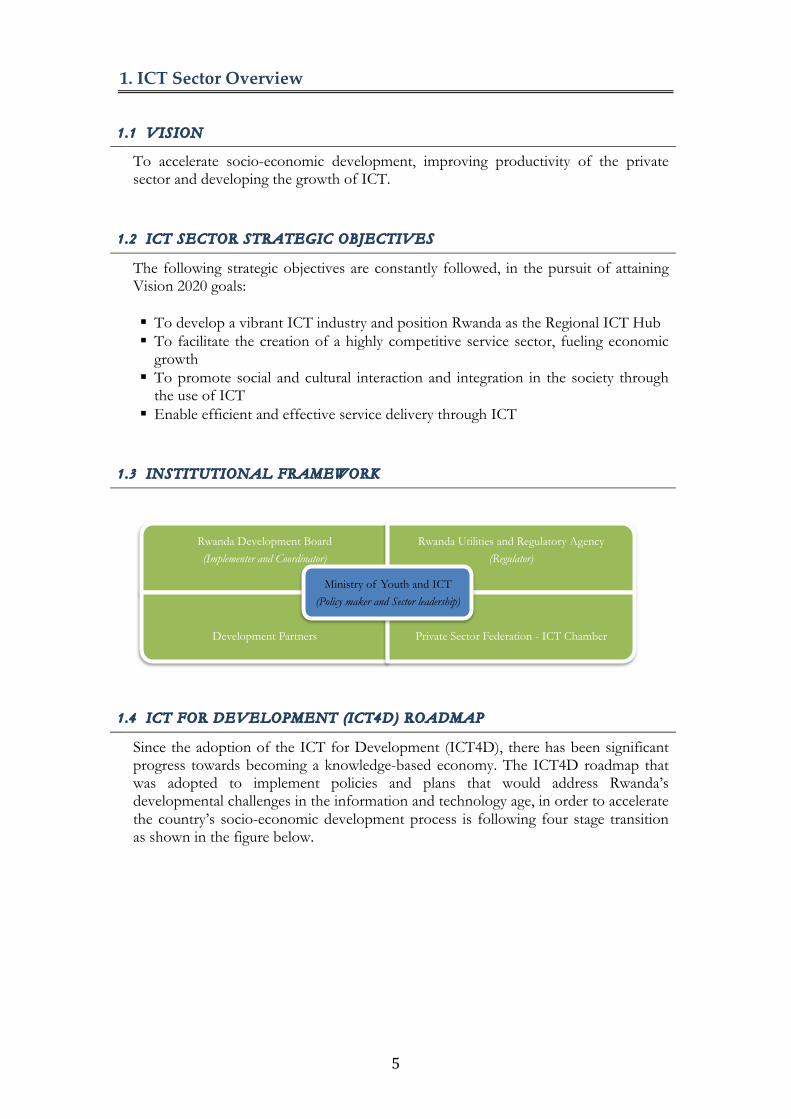
1.3 INSTITUTIONAL FRAMEWORK
1.4 ICT FOR DEVELOPMENT (ICT4D) ROADMAP
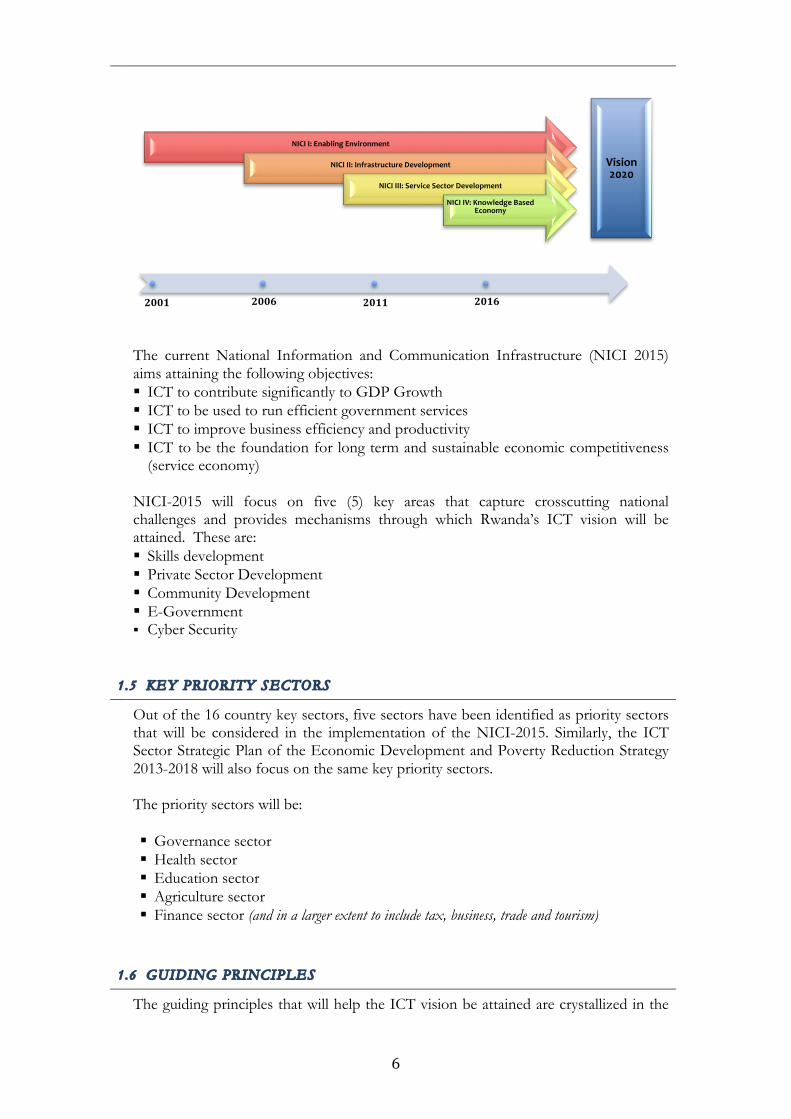
Since the adoption of the ICT for Development (ICT4D), there has been significant progress towards becoming a knowledge-based economy. The ICT4D roadmap that was adopted to implement policies and plans that would address Rwanda’s developmental challenges in the information and technology age, in order to accelerate the country’s socio-economic development process is following four stage transition as shown in the figure below.
Rwanda Development Board (Implementer and Coordinator)
Rwanda Utilities and Regulatory Agency (Regulator)
Development Partners Private Sector Federation - ICT Chamber
Ministry of Youth and ICT (Policy maker and Sector leadership)
6
The current National Information and Communication Infrastructure (NICI 2015) aims attaining the following objectives: § ICT to contribute significantly to GDP Growth § ICT to be used to run efficient government services § ICT to improve business efficiency and productivity § ICT to be the foundation for long term and sustainable economic competitiveness
(service economy) NICI-2015 will focus on five (5) key areas that capture crosscutting national challenges and provides mechanisms through which Rwanda’s ICT vision will be attained. These are: § Skills development § Private Sector Development § Community Development § E-Government § Cyber Security
1.5 KEY PRIORITY SECTORS
Out of the 16 country key sectors, five sectors have been identified as priority sectors that will be considered in the implementation of the NICI-2015. Similarly, the ICT Sector Strategic Plan of the Economic Development and Poverty Reduction Strategy 2013-2018 will also focus on the same key priority sectors. The priority sectors will be: § Governance sector § Health sector § Education sector § Agriculture sector § Finance sector (and in a larger extent to include tax, business, trade and tourism)
1.6 GUIDING PRINCIPLES
The guiding principles that will help the ICT vision be attained are crystallized in the
NICI I: Enabling Environment
NICI II: Infrastructure Development
NICI III: Service Sector Development
NICI IV: Knowledge Based Economy
Vision 2020
2001 2006 2011 2016
7
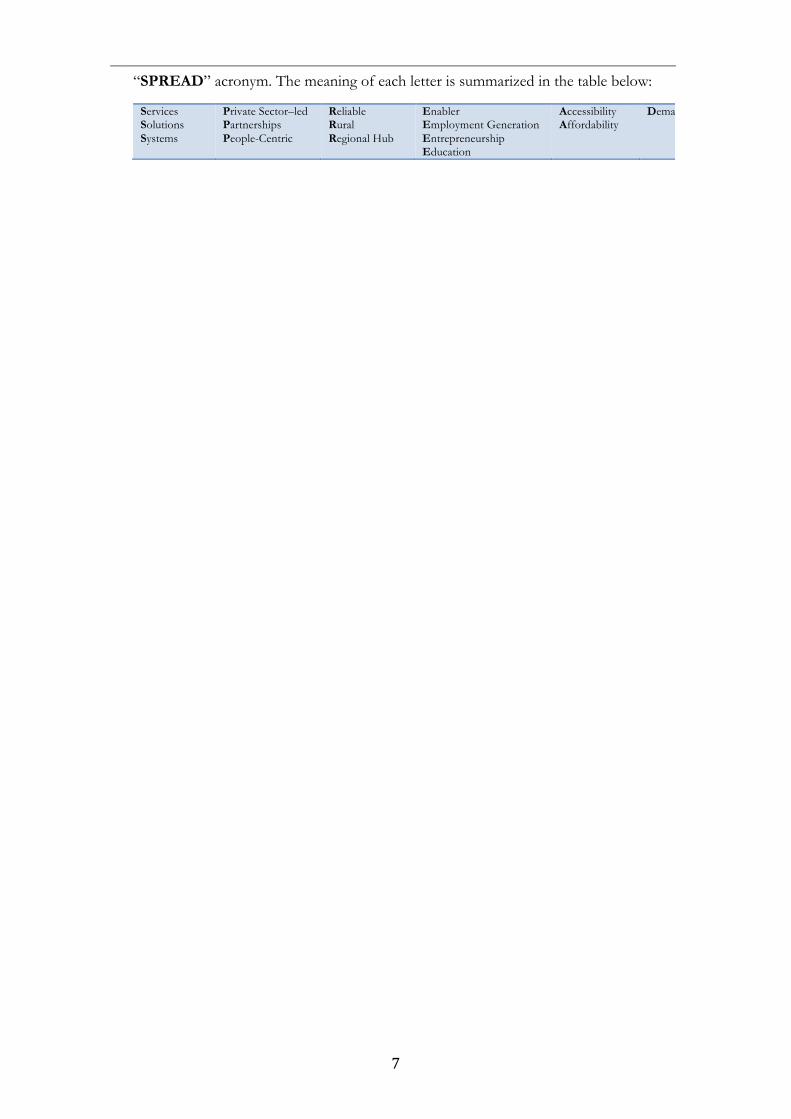
“SPREAD” acronym. The meaning of each letter is summarized in the table below: Services Solutions Systems
Private Sector–led Partnerships People-Centric
Reliable Rural Regional Hub
Enabler Employment Generation Entrepreneurship Education
Accessibility Affordability
Demand-driven
8
2. The ICT Sector in 2012
2.1 KEY ACHIEVEMENTS
The year 2012 has been characterized by the following achievements: Telecommunicat ions Sector 1. Airtel, the third licensed mobile telecommunications company, launched its
mobile services in March 2012. This new development will allow increased competition and drive affordability of data and voice prices for the consumers of Telecommunications services.
2. The number of active mobile-cellular phone subscribers has increased to 53.1%,
up from 41.5 % in 2011. This major growth of mobile subscribers is mainly due to the increased competition between the incumbent Telecom Operators, who offer access to data and voice services. As of December 2012, Rwanda had 5,690,751 mobile subscribers, with respectively 3,432,755 mobile subscribers of MTN Rwanda Ltd, 1,866,924 subscribers of Tigo Rwanda Ltd and 391,072 subscribers of Airtel Rwanda Ltd. This represent respectively, 60.32% of subscribers for MTN, 32.80% of subscribers for TIGO and 6.87% of subscribers for Airtel.
3. The purchase of Bulk Internet bandwidth from Uganda and Tanzania through the World Bank/RCIP project, which allowed additional 2.4 Gbps to be provisioned, increasing the available Internet bandwidth to 3.5 Gbps for Rwanda. As a result, the Internet wholesale bandwidth costs were slashed by about 75% (from prices ranging between 500 – 700 USD to 125 USD for day hours and 60 USD for night hours). Rwanda was also subsequently ranked as the country with fastest Internet connectivity speed in Africa number (Ookla's NetIndex).
4. The National Data Center was made operational; with a new cloud computing platform was installed to centrally host Public and Private sector applications and services. This latest development position Rwanda among the very few countries with highly available, resilient and robust data center infrastructure in the continent, and will position the country to offer a very stable online services.
5. Rwanda was ranked the most dynamic African country in the ITU ICT Development Index (IDI), in the ITU “Measuring the Information Society 2012”. Rwanda achieved one of the highest improvements in the IDI ranking (climbing seven places), by improving both the access and the use sub-indices of ITU ranking.
6. Broadband Systems Corporation (BSC), a company that was incorporated to
commercialize the National Fiber Optic Backbone, the Kigali metropolitan Network and the National Data Center was launched in May 2012. BSC is already offering data services to Government institutions and selling excess capacity to Telecom Operators are a cheaper market costs.
7. RURA commissioned the International Gateway Traffic Verification System (IGTVS), a
system that allows the monitoring of the performance of the telecoms sector
9
including traffic measurement, accurate billing, quality of service assessment, market surveillance, interconnection dispute resolution, and fraud management.
Finance Sec tor 8. Several new Government to Business (G2B) and Government to Citizens (G2C)
Services were launched, including:
a) The Online Tax payment system, allowing citizens to file personal taxes online.
b) The ePayment system, which allows citizens to pay their taxes online through their banks, hence reducing queues and time.
c) The Single Electronic Window System, a facility that allows parties involved
in trade and transport to lodge standardized information and documents with a single entry point to fulfill all import, export, and transit-related regulatory requirements, hence reducing the cost of doing business due to online clearance and allowing simplified procedures.
Educat ion Sector
9. The Carnegie Mellon University (CMU) facility at Telecom House was rehabilitated and its campus was launched in August 2012. The first intake of students for the 2012-2013 academic year of the Masters programme has a total of 24 students.
10. kLab (knowledge Lab) was established as the first ever “ICT Innovation Center” in the country and made operation in July 2012, a project that was jointly implemented with the Rwanda ICT chamber. kLab, a technology space, brings like-minded innovators together and give them the resources they need to explore their ideas, learn from each other, and develop innovative ICT solutions. kLab is a technology space enabling ambitious entrepreneurs come together and develop their trailblazing ideas into successful businesses. Separately, the Korean International Cooperation Agency (KOICA) has approved the construction of a large ICT Innovation Center as a new project. The construction of this Innovation Center is planned to start in September 2013, in the Kigali Technopole.
11. The distribution of OLPCs reached 115,816 units, covering 227 schools. Digital
content were also deployed in these schools, allowing primary school students to access courses in a digital format and improving quality of education.
Health Sector 12. The percentage of health facilities with functional infrastructure (computer,
Internet, including modems) reached 84%. This allows the health facilities to access health information systems and medical records systems and provide better and timely reporting.
10
Governance Sec tor
13. Sixty (60) new Service Access Points were deployed (2 per sectors) and are fully
owned and managed by the relevant districts. With consideration to the existing Business Development Centers, these access points are now totaling to 91 Access Points, providing Business Plans, ICT trainings and access to online information and services.
14. The Document Tracking was deployed in 25 institutions (with almost all ministries) and currently being deployed for 40 additional institutions (that includes all provinces & districts). This automated tool will allow sensible reduction of paper usage in Government.
15. The Automated Passenger Clearance System, a system that support the automation of
the migration services rendered to border communities and airports. Using Biometric data, the system removes the need for human input and passport stamps, reduces the migration clearance processing time, eliminates risks of fraud and detects use of illegal and forged documents.
16. A total of 7 institutions are now connected to the National identification
Authority Database using online secure authentication, namely Traffic Police, RRA, MTN, TIGO, AIRTEL, B.N.R /Credit Reference Bureau, Immigration. Through this secure access, these institutions are able to provide better and quicker services to their constituencies.
Agricul ture Sec tor 17. The eSoko system usage has increased, empowering more farmers with timely
crops market price information, reaching for more than 54,000 transactions, translating to more informed market pricing decisions and ultimately more successful farming.
18. The Fertilizer Voucher Management System has issued more than 800,000 fertilization vouchers, allowing 2,4 million farmers to benefit from the fertilizers distribution countrywide.
ICT investments
19. The Foreign Direct Investments (FDI) in ICT has reached more than 44 million
USD, all under implementation, with more than new 4,046 direct jobs created by the ICT investments.
11
2.2 KEY CHALLENGES
The ICT Sector also encountered various challenges during the year 2012. They are highlighted below, and will be addressed through specific interventions during the year 2013.
1. The ICT sector is facing a challenge of limited skillsets required for its sustainable growth. To date, in the framework of the National Information and Communication Infrastructure (NICI) 2010 – 2015, some specific skills development projects have been designed to increase the number of specialized IT-related industry, IT project management and other set of skills required for the sector growth. However, these initiatives are still in early stages and have not yielded limited tangible results. Skills development remains at the heart of a sustainable knowledge-based economy. This challenge will continue to be addressed by the Ministry of Youth and ICT and all its partners during the next years.
2. Though the country has already invested in a robust and resilient communication infrastructure with the construction of the National Backbone, Kigali Metropolitan Network amongst others, the absence of a Last Mile Network is preventing a steady growth of the Internet penetration countrywide. While mobile broadband subscriptions is on the rise with the increasing coverage of the 3G network currently being deployed by licensed Telecom operations, significant investments are still required to deploy a much wider National Last mile broadband network. Securing an acceptable broadband experience for national citizens and foreigners living in Rwanda will remain the focus during the year 2013. This network will be implemented through strong partnerships with the private sector, which will remain on the forefront of this intervention.
3. ICT Penetration, ICT awareness and Literacy rate at community level remains at
very low level. Generally, statistics show that citizens living in rural areas have a limited ownership of ICT devices, be it for Computers, Smartphones and TVs. This partially affects broadband uptake in the country. In addition, citizens (especially rural citizens) have a very limited awareness of how ICT can improve their productivity and socio-economic welfare. To tackle this challenge, the Ministry of Youth and ICT (MYICT), together with the Ministry of Local Government (MINALOC) and the Ministry of Education (MINEDUC), and in partnership with the Private Sector Federation (with on the forefront Telecom Operators, Internet Service Providers, Banks and ICT SMEs) have designed a five-year ICT Literacy and Awareness Campaign which will target rural communities. The major activities of this campaign will be rolled out during the year 2013. The Ministry of Youth and ICT, in partnership with Telecom Operators and ICT devices supplies have also designed a programme that will amongst other objectives, increase the ICT devices ownership in the country. The programme, also know as “Viziyo” will be launched and implemented during the year 2013.
4. While there has been a surge of new range of Business to Citizens (B2C) services made mainly available by the Telecom Operators, Banks and other ICT-enabled
12
services, it has been noted that the rate of deployment of Government to Citizens (G2C) e-government services is generally done at a low pace and where available, systems and services not sufficiently used by the intended users. This translates into inefficient manual processes, delays in service delivery, long queues and bureaucracy, which in turn impose considerable burden to our economy. This challenge requires the development of a comprehensive e-Government Policy and Strategy, which will be developed during the year 2013 but also an increased awareness of the existing online services. The Ministry of Youth and ICT will work hands in hands with several partners to deliver the e-Government and improve the country ranking in the UN e-Government survey report. In addition, the Ministry of Youth and ICT has initiated a new project, known as “Rwanda Online”, which will serve as the main vehicle to deliver e-government services, using Public Private Partnerships.
13
3. ICT at a Glance
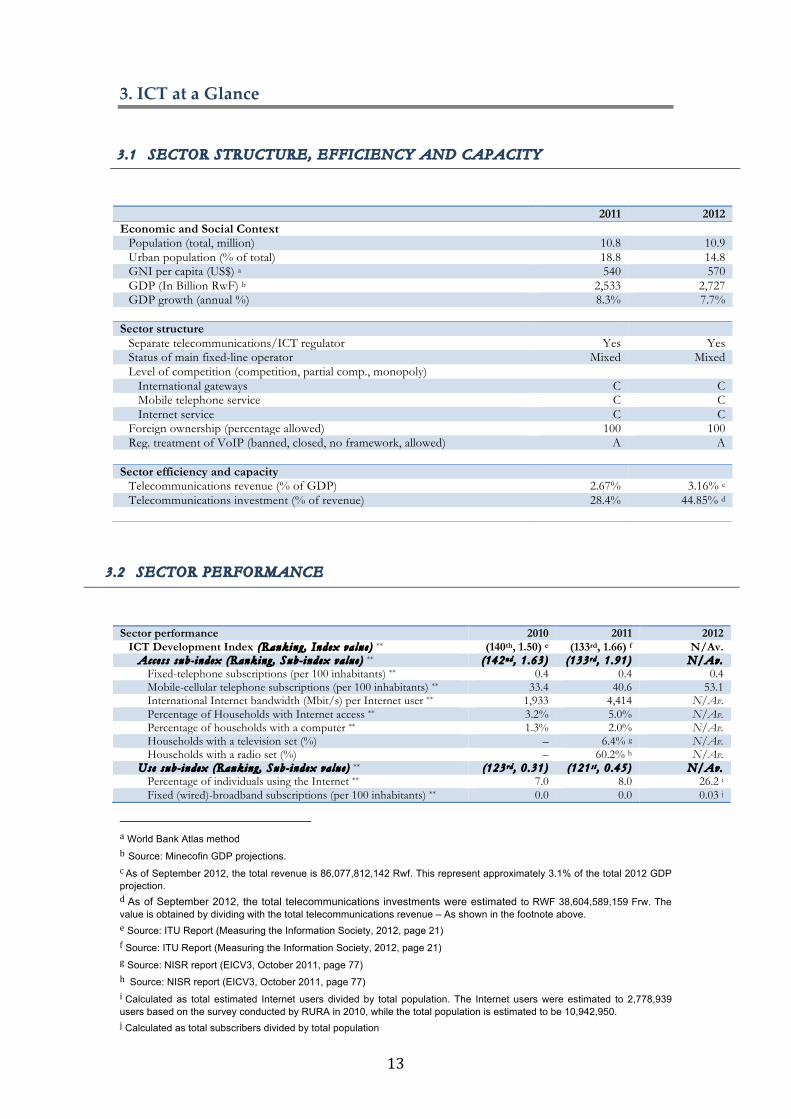
3.1 SECTOR STRUCTURE, EFFICIENCY AND CAPACITY
2011 2012 Economic and Social Context
Population (total, million) 10.8 10.9 Urban population (% of total) 18.8 14.8 GNI per capita (US$) a 540 570 GDP (In Billion RwF) b 2,533 2,727 GDP growth (annual %) 8.3% 7.7%
Sector structure
Separate telecommunications/ICT regulator Yes Yes Status of main fixed-line operator Mixed Mixed Level of competition (competition, partial comp., monopoly)
International gateways C C Mobile telephone service C C Internet service C C
Foreign ownership (percentage allowed) 100 100 Reg. treatment of VoIP (banned, closed, no framework, allowed) A A
Sector efficiency and capacity
Telecommunications revenue (% of GDP) 2.67% 3.16% c Telecommunications investment (% of revenue) 28.4% 44.85% d
3 .2 SECTOR PERFORMANCE
Sector performance 2010 2011 2012
ICT Development Index (Ranking , Index va lue) ** (140th, 1.50) e (133rd, 1.66) f N/Av. Access sub- index (Ranking , Sub- index va lue) ** (142nd, 1 .63) (133rd, 1 .91) N/Av.
Fixed-telephone subscriptions (per 100 inhabitants) ** 0.4 0.4 0.4 Mobile-cellular telephone subscriptions (per 100 inhabitants) ** 33.4 40.6 53.1 International Internet bandwidth (Mbit/s) per Internet user ** 1,933 4,414 N/Av. Percentage of Households with Internet access ** 3.2% 5.0% N/Av. Percentage of households with a computer ** 1.3% 2.0% N/Av. Households with a television set (%) – 6.4% g N/Av. Households with a radio set (%) – 60.2% h N/Av.
Use sub- index (Ranking , Sub- index va lue) ** (123rd, 0 .31) (121st, 0 .45) N/Av. Percentage of individuals using the Internet ** 7.0 8.0 26.2 i Fixed (wired)-broadband subscriptions (per 100 inhabitants) ** 0.0 0.0 0.03 j
a World Bank Atlas method b Source: Minecofin GDP projections. c As of September 2012, the total revenue is 86,077,812,142 Rwf. This represent approximately 3.1% of the total 2012 GDP projection. d As of September 2012, the total telecommunications investments were estimated to RWF 38,604,589,159 Frw. The value is obtained by dividing with the total telecommunications revenue – As shown in the footnote above. e Source: ITU Report (Measuring the Information Society, 2012, page 21) f Source: ITU Report (Measuring the Information Society, 2012, page 21) g Source: NISR report (EICV3, October 2011, page 77) h Source: NISR report (EICV3, October 2011, page 77) i Calculated as total estimated Internet users divided by total population. The Internet users were estimated to 2,778,939 users based on the survey conducted by RURA in 2010, while the total population is estimated to be 10,942,950. j Calculated as total subscribers divided by total population
14
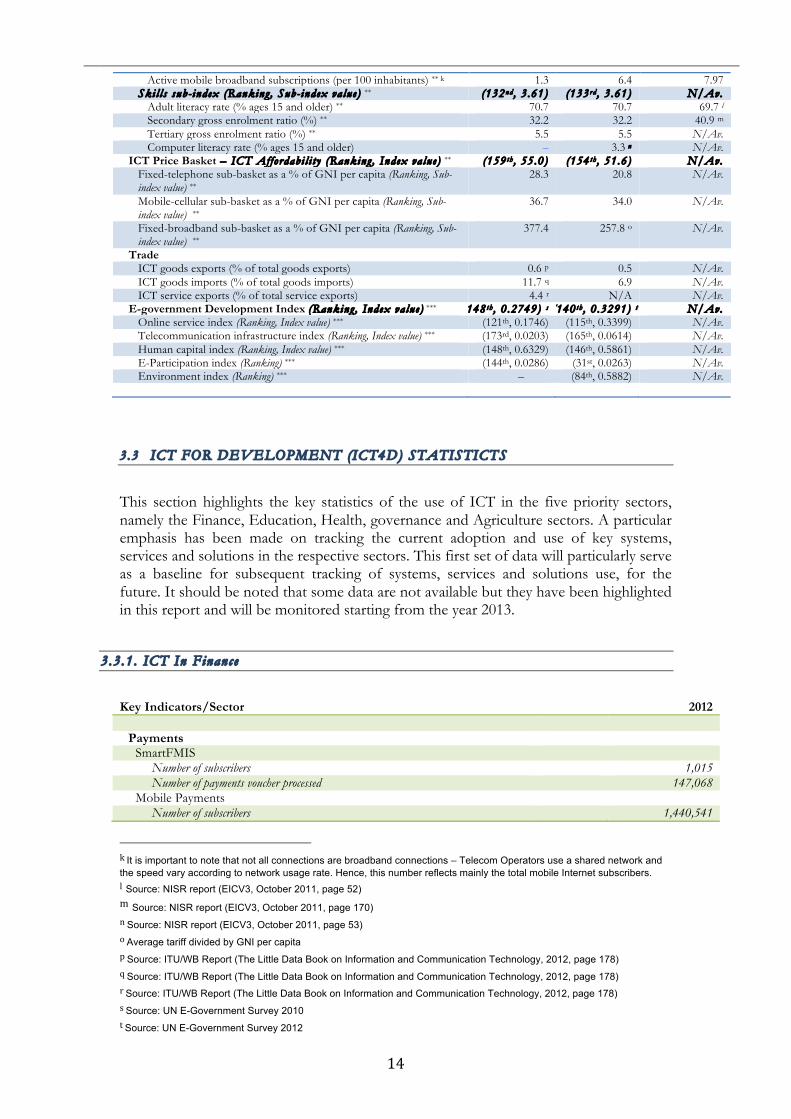
Active mobile broadband subscriptions (per 100 inhabitants) ** k 1.3 6.4 7.97 Skil l s sub- index (Ranking , Sub- index va lue) ** (132nd, 3 .61) (133rd, 3 .61) N/Av.
Adult literacy rate (% ages 15 and older) ** 70.7 70.7 69.7 l Secondary gross enrolment ratio (%) ** 32.2 32.2 40.9 m Tertiary gross enrolment ratio (%) ** 5.5 5.5 N/Av. Computer literacy rate (% ages 15 and older) – 3.3 n N/Av.
ICT Price Basket – ICT Affordabi l i t y (Ranking , Index va lue) ** (159th, 55.0) (154th, 51.6) N/Av. Fixed-telephone sub-basket as a % of GNI per capita (Ranking, Sub-index value) **
28.3 20.8 N/Av.
Mobile-cellular sub-basket as a % of GNI per capita (Ranking, Sub-index value) **
36.7 34.0 N/Av.
Fixed-broadband sub-basket as a % of GNI per capita (Ranking, Sub-index value) **
377.4 257.8 o N/Av.
Trade ICT goods exports (% of total goods exports) 0.6 p 0.5 N/Av. ICT goods imports (% of total goods imports) 11.7 q 6.9 N/Av. ICT service exports (% of total service exports) 4.4 r N/A N/Av.
E-government Development Index (Ranking , Index va lue) *** (148th, 0 .2749) s (140th, 0 .3291) t N/Av. Online service index (Ranking, Index value) *** (121th, 0.1746) (115th, 0.3399) N/Av. Telecommunication infrastructure index (Ranking, Index value) *** (173rd, 0.0203) (165th, 0.0614) N/Av. Human capital index (Ranking, Index value) *** (148th, 0.6329) (146th, 0.5861) N/Av. E-Participation index (Ranking) *** (144th, 0.0286) (31st, 0.0263) N/Av. Environment index (Ranking) *** – (84th, 0.5882) N/Av.
3.3 ICT FOR DEVELOPMENT (ICT4D) STATISTICTS
This section highlights the key statistics of the use of ICT in the five priority sectors, namely the Finance, Education, Health, governance and Agriculture sectors. A particular emphasis has been made on tracking the current adoption and use of key systems, services and solutions in the respective sectors. This first set of data will particularly serve as a baseline for subsequent tracking of systems, services and solutions use, for the future. It should be noted that some data are not available but they have been highlighted in this report and will be monitored starting from the year 2013.
3.3.1 . ICT In Finance Key Indicators/Sector 2012
Payments
SmartFMIS Number of subscribers 1,015 Number of payments voucher processed 147,068
Mobile Payments Number of subscribers 1,440,541
k It is important to note that not all connections are broadband connections – Telecom Operators use a shared network and the speed vary according to network usage rate. Hence, this number reflects mainly the total mobile Internet subscribers. l Source: NISR report (EICV3, October 2011, page 52) m Source: NISR report (EICV3, October 2011, page 170) n Source: NISR report (EICV3, October 2011, page 53) o Average tariff divided by GNI per capita p Source: ITU/WB Report (The Little Data Book on Information and Communication Technology, 2012, page 178) q Source: ITU/WB Report (The Little Data Book on Information and Communication Technology, 2012, page 178) r Source: ITU/WB Report (The Little Data Book on Information and Communication Technology, 2012, page 178) s Source: UN E-Government Survey 2010 t Source: UN E-Government Survey 2012
15
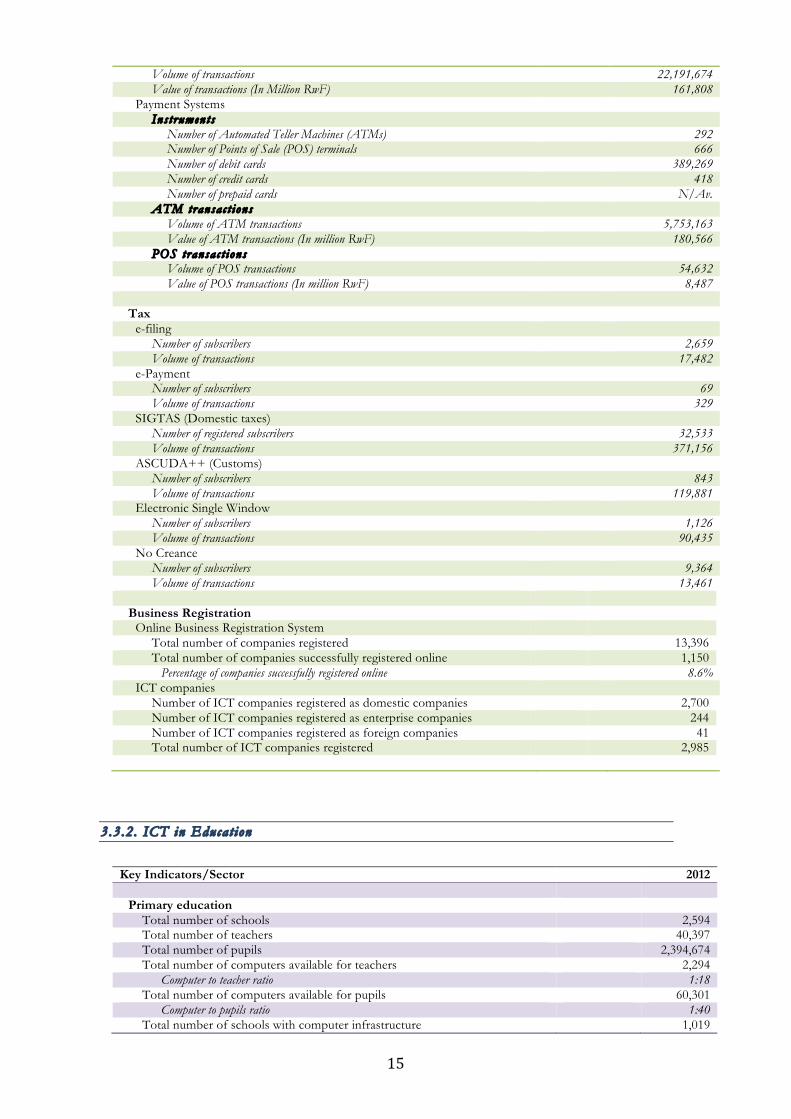
Volume of transactions 22,191,674 Value of transactions (In Million RwF) 161,808
Payment Systems Ins t ruments
Number of Automated Teller Machines (ATMs) 292 Number of Points of Sale (POS) terminals 666 Number of debit cards 389,269 Number of credit cards 418 Number of prepaid cards N/Av.
ATM transac t ions Volume of ATM transactions 5,753,163 Value of ATM transactions (In million RwF) 180,566
POS transac t ions Volume of POS transactions 54,632 Value of POS transactions (In million RwF) 8,487
Tax
e-filing Number of subscribers 2,659 Volume of transactions 17,482
e-Payment Number of subscribers 69 Volume of transactions 329
SIGTAS (Domestic taxes) Number of registered subscribers 32,533 Volume of transactions 371,156
ASCUDA++ (Customs) Number of subscribers 843 Volume of transactions 119,881
Electronic Single Window Number of subscribers 1,126 Volume of transactions 90,435
No Creance Number of subscribers 9,364 Volume of transactions 13,461
Business Registration
Online Business Registration System Total number of companies registered 13,396 Total number of companies successfully registered online 1,150
Percentage of companies successfully registered online 8.6% ICT companies
Number of ICT companies registered as domestic companies 2,700 Number of ICT companies registered as enterprise companies 244 Number of ICT companies registered as foreign companies 41 Total number of ICT companies registered 2,985
3.3.2 . ICT in Educat ion Key Indicators/Sector 2012
Primary education
Total number of schools 2,594 Total number of teachers 40,397 Total number of pupils 2,394,674 Total number of computers available for teachers 2,294
Computer to teacher ratio 1:18 Total number of computers available for pupils 60,301
Computer to pupils ratio 1:40 Total number of schools with computer infrastructure 1,019
16
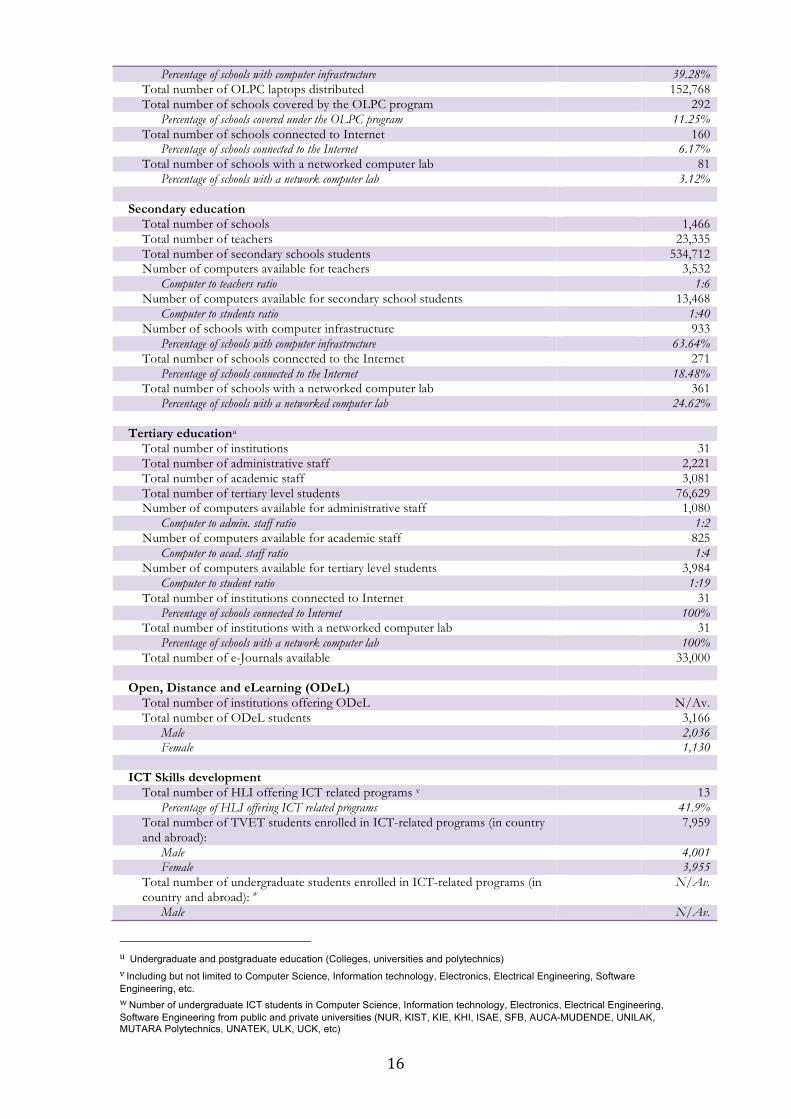
Percentage of schools with computer infrastructure 39.28% Total number of OLPC laptops distributed 152,768 Total number of schools covered by the OLPC program 292
Percentage of schools covered under the OLPC program 11.25% Total number of schools connected to Internet 160
Percentage of schools connected to the Internet 6.17% Total number of schools with a networked computer lab 81
Percentage of schools with a network computer lab 3.12% Secondary education
Total number of schools 1,466 Total number of teachers 23,335 Total number of secondary schools students 534,712 Number of computers available for teachers 3,532
Computer to teachers ratio 1:6 Number of computers available for secondary school students 13,468
Computer to students ratio 1:40 Number of schools with computer infrastructure 933
Percentage of schools with computer infrastructure 63.64% Total number of schools connected to the Internet 271
Percentage of schools connected to the Internet 18.48% Total number of schools with a networked computer lab 361
Percentage of schools with a networked computer lab 24.62% Tertiary educationu
Total number of institutions 31 Total number of administrative staff 2,221 Total number of academic staff 3,081 Total number of tertiary level students 76,629 Number of computers available for administrative staff 1,080
Computer to admin. staff ratio 1:2 Number of computers available for academic staff 825
Computer to acad. staff ratio 1:4 Number of computers available for tertiary level students 3,984
Computer to student ratio 1:19 Total number of institutions connected to Internet 31
Percentage of schools connected to Internet 100% Total number of institutions with a networked computer lab 31
Percentage of schools with a network computer lab 100% Total number of e-Journals available 33,000
Open, Distance and eLearning (ODeL)
Total number of institutions offering ODeL N/Av. Total number of ODeL students 3,166
Male 2,036 Female 1,130
ICT Skills development
Total number of HLI offering ICT related programs v 13 Percentage of HLI offering ICT related programs 41.9%
Total number of TVET students enrolled in ICT-related programs (in country and abroad):
7,959
Male 4,001 Female 3,955
Total number of undergraduate students enrolled in ICT-related programs (in country and abroad): w
N/Av.
Male N/Av.
u Undergraduate and postgraduate education (Colleges, universities and polytechnics) v Including but not limited to Computer Science, Information technology, Electronics, Electrical Engineering, Software Engineering, etc. w Number of undergraduate ICT students in Computer Science, Information technology, Electronics, Electrical Engineering, Software Engineering from public and private universities (NUR, KIST, KIE, KHI, ISAE, SFB, AUCA-MUDENDE, UNILAK, MUTARA Polytechnics, UNATEK, ULK, UCK, etc)
17
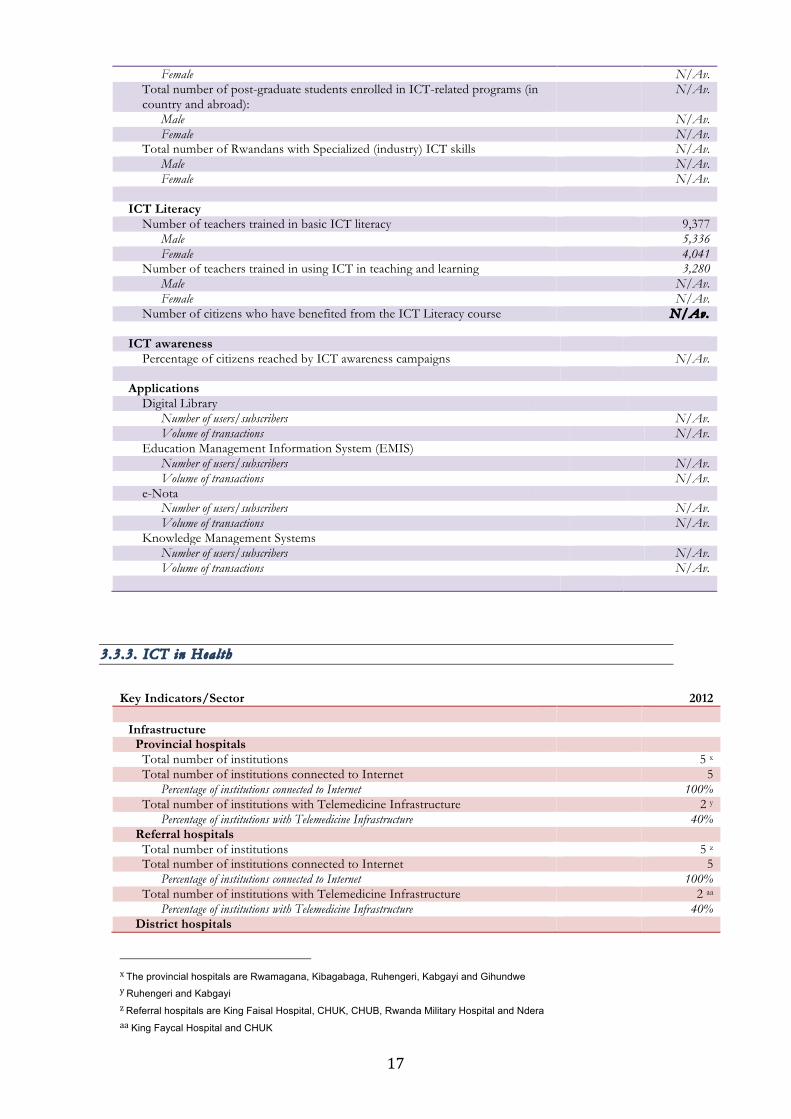
Female N/Av. Total number of post-graduate students enrolled in ICT-related programs (in country and abroad):
N/Av.
Male N/Av. Female N/Av.
Total number of Rwandans with Specialized (industry) ICT skills N/Av. Male N/Av. Female N/Av.
ICT Literacy
Number of teachers trained in basic ICT literacy 9,377 Male 5,336 Female 4,041
Number of teachers trained in using ICT in teaching and learning 3,280 Male N/Av. Female N/Av.
Number of citizens who have benefited from the ICT Literacy course N/Av. ICT awareness
Percentage of citizens reached by ICT awareness campaigns N/Av. Applications
Digital Library Number of users/subscribers N/Av. Volume of transactions N/Av.
Education Management Information System (EMIS) Number of users/subscribers N/Av. Volume of transactions N/Av.
e-Nota Number of users/subscribers N/Av. Volume of transactions N/Av.
Knowledge Management Systems Number of users/subscribers N/Av. Volume of transactions N/Av.
3.3.3 . ICT in Heal th Key Indicators/Sector 2012
Infrastructure
Provincial hospitals Total number of institutions 5 x Total number of institutions connected to Internet 5
Percentage of institutions connected to Internet 100% Total number of institutions with Telemedicine Infrastructure 2 y
Percentage of institutions with Telemedicine Infrastructure 40% Referral hospitals
Total number of institutions 5 z Total number of institutions connected to Internet 5
Percentage of institutions connected to Internet 100% Total number of institutions with Telemedicine Infrastructure 2 aa
Percentage of institutions with Telemedicine Infrastructure 40% District hospitals
x The provincial hospitals are Rwamagana, Kibagabaga, Ruhengeri, Kabgayi and Gihundwe y Ruhengeri and Kabgayi z Referral hospitals are King Faisal Hospital, CHUK, CHUB, Rwanda Military Hospital and Ndera aa King Faycal Hospital and CHUK
18
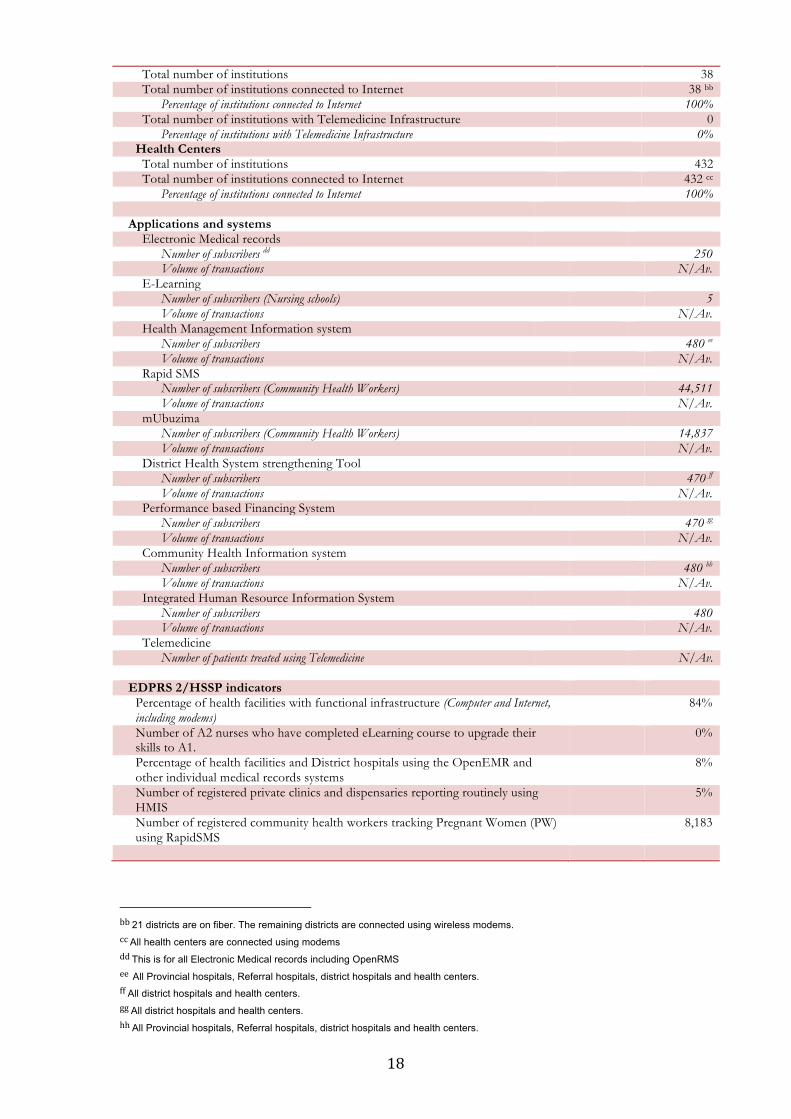
Total number of institutions 38 Total number of institutions connected to Internet 38 bb
Percentage of institutions connected to Internet 100% Total number of institutions with Telemedicine Infrastructure 0
Percentage of institutions with Telemedicine Infrastructure 0% Health Centers
Total number of institutions 432 Total number of institutions connected to Internet 432 cc
Percentage of institutions connected to Internet 100%
Applications and systems Electronic Medical records
Number of subscribers dd 250 Volume of transactions N/Av.
E-Learning Number of subscribers (Nursing schools) 5 Volume of transactions N/Av.
Health Management Information system Number of subscribers 480 ee Volume of transactions N/Av.
Rapid SMS Number of subscribers (Community Health Workers) 44,511 Volume of transactions N/Av.
mUbuzima Number of subscribers (Community Health Workers) 14,837 Volume of transactions N/Av.
District Health System strengthening Tool Number of subscribers 470 ff Volume of transactions N/Av.
Performance based Financing System Number of subscribers 470 gg Volume of transactions N/Av.
Community Health Information system Number of subscribers 480 hh Volume of transactions N/Av.
Integrated Human Resource Information System Number of subscribers 480 Volume of transactions N/Av.
Telemedicine Number of patients treated using Telemedicine N/Av.
EDPRS 2/HSSP indicators
Percentage of health facilities with functional infrastructure (Computer and Internet, including modems)
84%
Number of A2 nurses who have completed eLearning course to upgrade their skills to A1.
0%
Percentage of health facilities and District hospitals using the OpenEMR and other individual medical records systems
8%
Number of registered private clinics and dispensaries reporting routinely using HMIS
5%
Number of registered community health workers tracking Pregnant Women (PW) using RapidSMS
8,183
bb 21 districts are on fiber. The remaining districts are connected using wireless modems. cc All health centers are connected using modems dd This is for all Electronic Medical records including OpenRMS ee All Provincial hospitals, Referral hospitals, district hospitals and health centers. ff All district hospitals and health centers. gg All district hospitals and health centers. hh All Provincial hospitals, Referral hospitals, district hospitals and health centers.
19
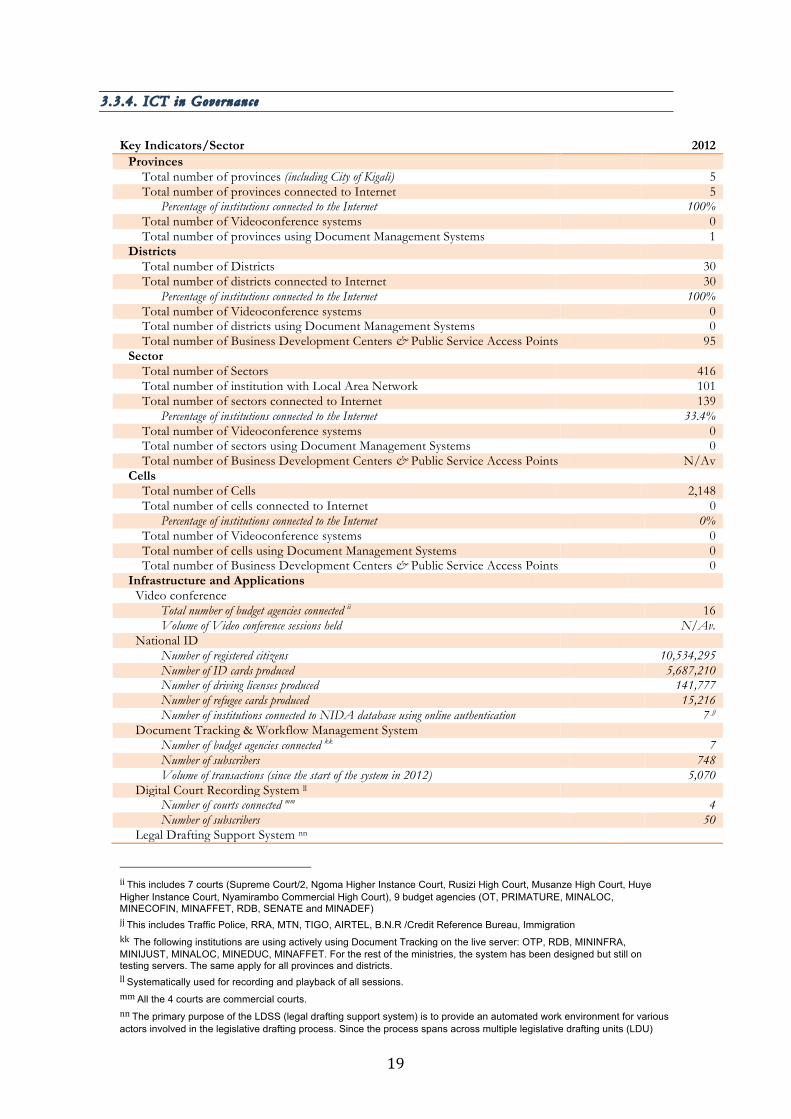
3.3.4 . ICT in Governance Key Indicators/Sector 2012
Provinces Total number of provinces (including City of Kigali) 5 Total number of provinces connected to Internet 5
Percentage of institutions connected to the Internet 100% Total number of Videoconference systems 0 Total number of provinces using Document Management Systems 1
Districts Total number of Districts 30 Total number of districts connected to Internet 30
Percentage of institutions connected to the Internet 100% Total number of Videoconference systems 0 Total number of districts using Document Management Systems 0 Total number of Business Development Centers & Public Service Access Points 95
Sector Total number of Sectors 416 Total number of institution with Local Area Network 101 Total number of sectors connected to Internet 139
Percentage of institutions connected to the Internet 33.4% Total number of Videoconference systems 0 Total number of sectors using Document Management Systems 0 Total number of Business Development Centers & Public Service Access Points N/Av
Cells Total number of Cells 2,148 Total number of cells connected to Internet 0
Percentage of institutions connected to the Internet 0% Total number of Videoconference systems 0 Total number of cells using Document Management Systems 0 Total number of Business Development Centers & Public Service Access Points 0
Infrastructure and Applications Video conference
Total number of budget agencies connected ii 16 Volume of Video conference sessions held N/Av.
National ID Number of registered citizens 10,534,295 Number of ID cards produced 5,687,210 Number of driving licenses produced 141,777 Number of refugee cards produced 15,216 Number of institutions connected to NIDA database using online authentication 7 jj
Document Tracking & Workflow Management System Number of budget agencies connected kk 7 Number of subscribers 748 Volume of transactions (since the start of the system in 2012) 5,070
Digital Court Recording System ll Number of courts connected mm 4 Number of subscribers 50
Legal Drafting Support System nn
ii This includes 7 courts (Supreme Court/2, Ngoma Higher Instance Court, Rusizi High Court, Musanze High Court, Huye Higher Instance Court, Nyamirambo Commercial High Court), 9 budget agencies (OT, PRIMATURE, MINALOC, MINECOFIN, MINAFFET, RDB, SENATE and MINADEF) jj This includes Traffic Police, RRA, MTN, TIGO, AIRTEL, B.N.R /Credit Reference Bureau, Immigration kk The following institutions are using actively using Document Tracking on the live server: OTP, RDB, MININFRA, MINIJUST, MINALOC, MINEDUC, MINAFFET. For the rest of the ministries, the system has been designed but still on testing servers. The same apply for all provinces and districts. ll Systematically used for recording and playback of all sessions. mm All the 4 courts are commercial courts. nn The primary purpose of the LDSS (legal drafting support system) is to provide an automated work environment for various actors involved in the legislative drafting process. Since the process spans across multiple legislative drafting units (LDU)
20
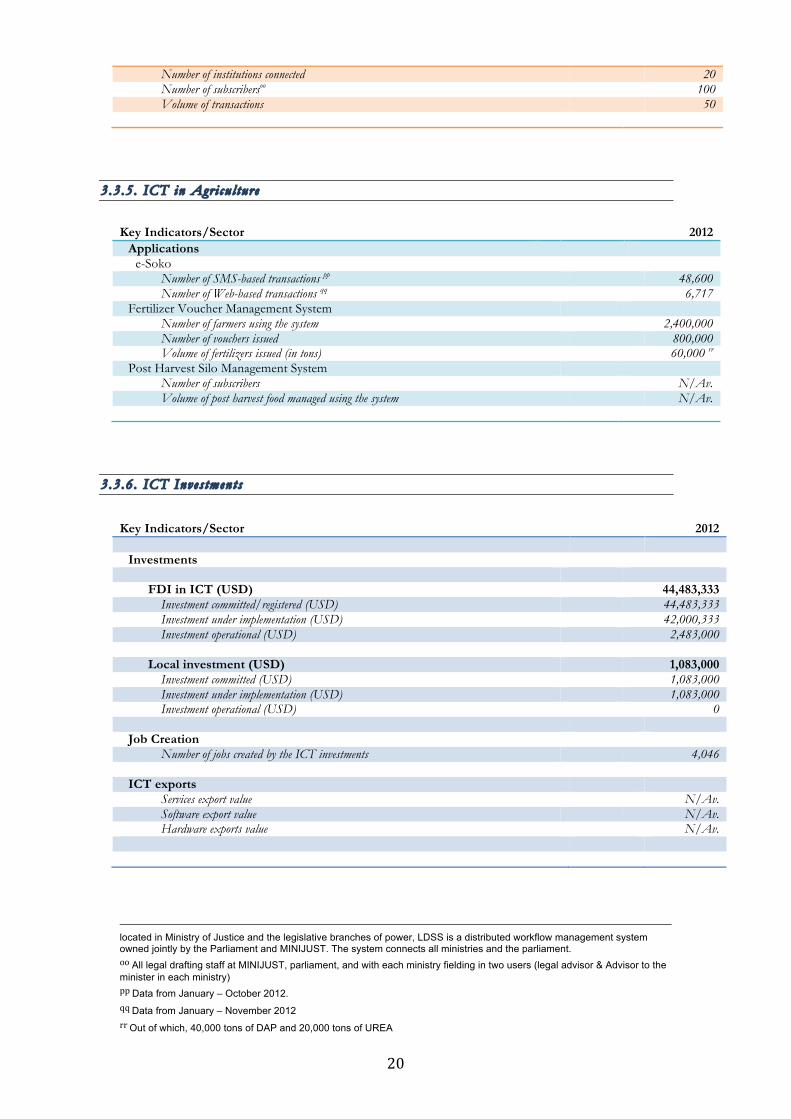
Number of institutions connected 20 Number of subscribersoo 100 Volume of transactions 50
3.3.5 . ICT in Agr i cu l ture Key Indicators/Sector 2012
Applications e-Soko
Number of SMS-based transactions pp 48,600 Number of Web-based transactions qq 6,717
Fertilizer Voucher Management System Number of farmers using the system 2,400,000 Number of vouchers issued 800,000 Volume of fertilizers issued (in tons) 60,000 rr
Post Harvest Silo Management System Number of subscribers N/Av. Volume of post harvest food managed using the system N/Av.
3.3.6 . ICT Inves tments Key Indicators/Sector 2012
Investments
FDI in ICT (USD) 44,483,333
Investment committed/registered (USD) 44,483,333 Investment under implementation (USD) 42,000,333 Investment operational (USD) 2,483,000
Local investment (USD) 1,083,000
Investment committed (USD) 1,083,000 Investment under implementation (USD) 1,083,000 Investment operational (USD) 0
Job Creation
Number of jobs created by the ICT investments 4,046 ICT exports
Services export value N/Av. Software export value N/Av. Hardware exports value N/Av.
located in Ministry of Justice and the legislative branches of power, LDSS is a distributed workflow management system owned jointly by the Parliament and MINIJUST. The system connects all ministries and the parliament. oo All legal drafting staff at MINIJUST, parliament, and with each ministry fielding in two users (legal advisor & Advisor to the minister in each ministry) pp Data from January – October 2012. qq Data from January – November 2012 rr Out of which, 40,000 tons of DAP and 20,000 tons of UREA
21
CONTACT US:
Ministry of Youth and ICT P. O.Box 3738 Kigali, Rwanda Website http://www.myict.gov.rw
myictrwanda myict.rwanda