Embed Size (px)
Citation preview
REPUBLIC OF RWANDA
RWANDA WATER AND FORESTRY AUTHORITY P.O.BOX: 7443 KIGALI Department of Water Resources Management
Mapping prone areas to Soil
Erosion in 20 districts of
Northern, Southern and
Western Provinces
August 2019
1. Background
Erosion risk map of Rwanda has been
developed in June 2018 using the
Catchment Restoration Opportunity Mapping
(CROM) Spatial Decision Support tool.
CROM model was developed based the
Universal Soil Loss Equation (USLE model)
originally introduced by Wischimeier and
Smith in 1978. The USLE model counts five
input parameters derivable from Rainfall
(R), Soils (K), Topography/ Relief (LS),
Land cover and crop management (C), and
conservation practices (P), each having a
multiplier effect as follow:
A=R×K×LS×C×P
Where A is the average annual loss (T/Ha);
R is the rainfall-runoff erosivity factor; K is the
soil erodibility factor; LS is the slop length (L)
and steepness (S) factor; C is the cover and
management factor; P is the land
management and conservation practices
factor. Combining these factors in the GIS
model builder, the CROM helped to identify
six erosion risk classes: (1) No erosion risk,
(2) Low erosion risk, (3) Moderate erosion
risk, (4) high erosion risk, (5) very high
erosion risk and (6) the extremely high
erosion risk. CROM report is available at
RWFA/IWRM department and ESRI
Rwanda office and priority restoration
measures are describe in the report.
However this risk map did not show the
areas already covered by erosion control
measures in place and the areas not
protected yet. The map does not neither
indicate the erosion features as proof of
risk, nor recommended practices to
mitigate those risks. This makes it hard to
1
know the progress made to fight against
erosion and their results. Moreover, the
plan for the future interventions becomes
difficult because the erosion risk map
shows the potential while districts need to
know where exactly the problem still and
what is appropriate measures taking into
account current land use. Therefore, the
team which was recruited to do the forest
mapping was also tasked to use the same
World View images and map erosion the
control practices currently in place using
visual image interpretation techniques. The
team was also tasked to recommend
appropriate control measures where are
required. This study covers the 20 districts
in Rwanda from West, North and South
Province.
2. Brief on methodology used to map
erosion control and recommended
practices
Defining the areas with no risk to high risk soil
erosion, observation on land use/cover type
is very important. For example, areas
covered by forests, pasture, perennial crops
(tea, coffee and banana), and agricultural
land with erosion control measures such as
terraces, agroforestry in alley cropping and
hedgerows are mapped as areas with
minimum or no risk though CROM model has
previously identified such areas as high risk
areas. High risk zones occupied by
settlements (built-up areas) are considered in
the interpretation and delineated to ensure
storm water management interventions are
planned in the future.
In the erosion control mapping, three high
erosion risk categories identified by CROM
model were prioritized: (1) high risk, (2)
very high risk and (3) extremely high risk.
Using World View images areas of four key
erosion factors has been mapped: 1) land
cover/use, 2) occurrence of erosion
feature, 3) erosion control measures in
place, and 4) Recommended erosion
measures.
The first step was to clean-up the CROM
raster data using Geo-processing tools of
ArcGIS/ArcMap. This step consists of
reducing individual pixels of different erosion
risk categories and remaining with large
areas with the similar risks. This
generalization process ensures that original
risk categories modelled by CROM are kept
as much as possible. It is just to allow the
merge of the neighboring cells (at least three
neighbor pixels) in order to produce a map
easy to be interpreted. The processed raster
data was then converted to vector data, a
format which is easy to use in spatial multi-
criteria analysis and produce statistics. The
geodatabase was finally created which
contains (1) three risk categories identified by
CROM-DSS model, (2) Possible erosions
features observable on the WV images, (3)
existing land use/land cover classes, (4)
observed erosion control practices, and (5)
recommended erosion control practices for
risk categories which are currently without
erosion control measures or where the
existing measures are judged inadequate
and require the revision.
3. Summary findings
The following tables show erosion risk
categories, areas, erosion features
currently in place, land uses factors and
erosion control measures that are
observable; and recommended
interventions ensure better land protection
against erosion in the 20 districts of
Northern, Southern and Western
Provinces.
Table 1 shows the top three districts most
susceptible to erosion with over 50% of
their land currently at high risk of water
erosion; the first being Muhanga with 63%
of its land prone to water erosion,
Ngororero district with 61% and Rutsiro
with 53% of its total land identified as high
erosion risk zones. Other districts such as
Gakenke, Burera, Karongi, Rulindo and
Nyamagabe districts need also
considerable attention as the risk accounts
more than 40% of the district land to high
erosion risk zones. An in-depth analysis
and characterisation of each high risk
mapping unit, with the related erosion
control recommendations will be
demonstrated in the full report.
2
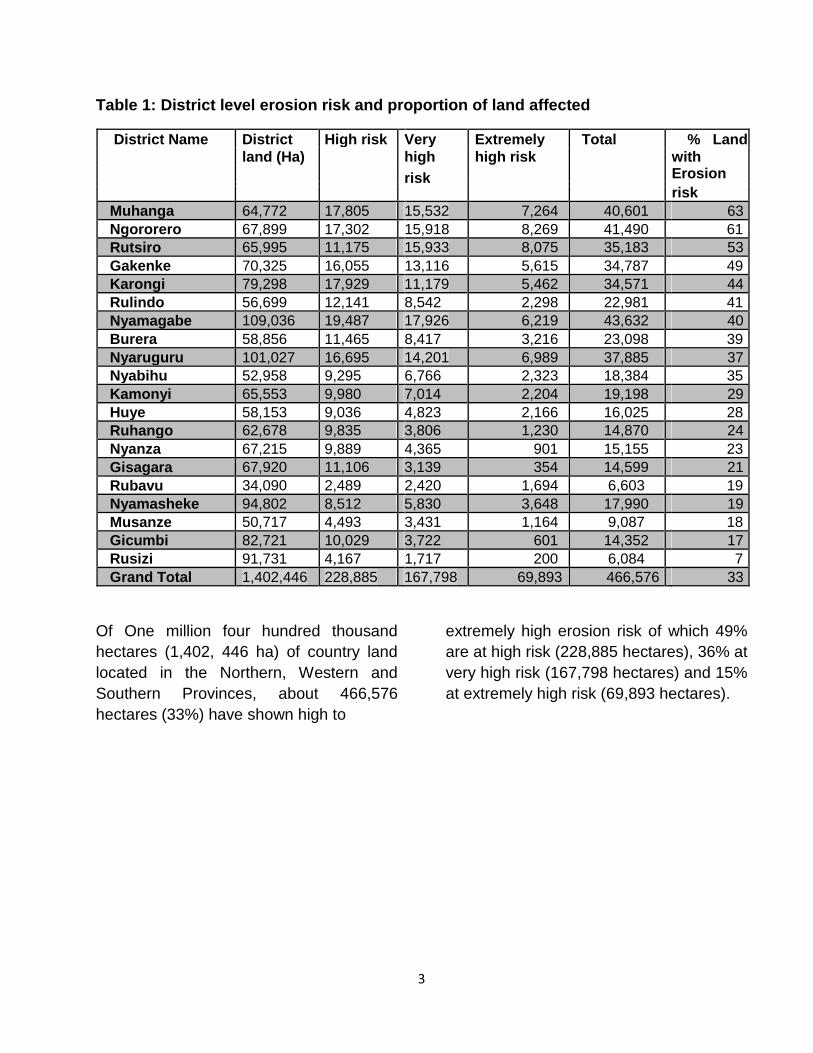
Table 1: District level erosion risk and proportion of land affected
District Name District High risk Very Extremely Total % Land
land (Ha) high high risk with
risk Erosion
risk
Muhanga 64,772 17,805 15,532 7,264 40,601 63
Ngororero 67,899 17,302 15,918 8,269 41,490 61
Rutsiro 65,995 11,175 15,933 8,075 35,183 53
Gakenke 70,325 16,055 13,116 5,615 34,787 49
Karongi 79,298 17,929 11,179 5,462 34,571 44
Rulindo 56,699 12,141 8,542 2,298 22,981 41
Nyamagabe 109,036 19,487 17,926 6,219 43,632 40
Burera 58,856 11,465 8,417 3,216 23,098 39
Nyaruguru 101,027 16,695 14,201 6,989 37,885 37
Nyabihu 52,958 9,295 6,766 2,323 18,384 35
Kamonyi 65,553 9,980 7,014 2,204 19,198 29
Huye 58,153 9,036 4,823 2,166 16,025 28
Ruhango 62,678 9,835 3,806 1,230 14,870 24
Nyanza 67,215 9,889 4,365 901 15,155 23
Gisagara 67,920 11,106 3,139 354 14,599 21
Rubavu 34,090 2,489 2,420 1,694 6,603 19
Nyamasheke 94,802 8,512 5,830 3,648 17,990 19
Musanze 50,717 4,493 3,431 1,164 9,087 18
Gicumbi 82,721 10,029 3,722 601 14,352 17
Rusizi 91,731 4,167 1,717 200 6,084 7
Grand Total 1,402,446 228,885 167,798 69,893 466,576 33
Of One million four hundred thousand
hectares (1,402, 446 ha) of country land
located in the Northern, Western and
Southern Provinces, about 466,576
hectares (33%) have shown high to
extremely high erosion risk of which 49%
are at high risk (228,885 hectares), 36% at
very high risk (167,798 hectares) and 15%
at extremely high risk (69,893 hectares).
3
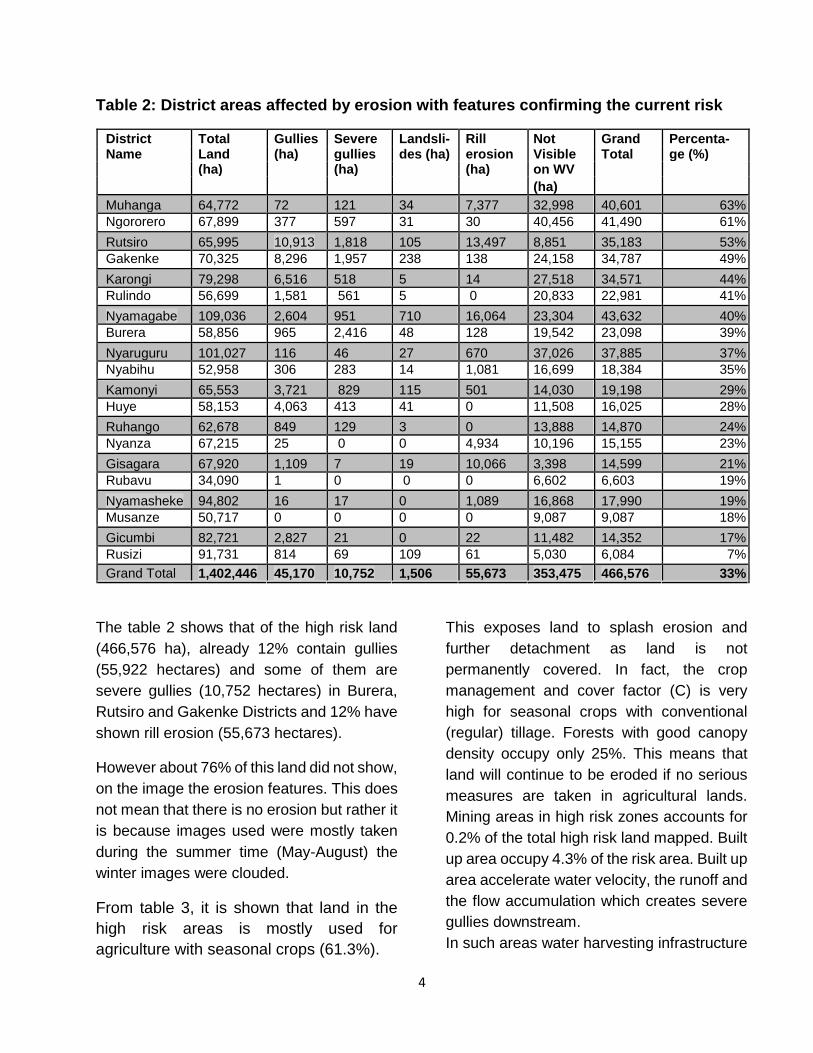
Table 2: District areas affected by erosion with features confirming the current risk
District Total Gullies Severe Landsli- Rill Not Grand Percenta- Name Land (ha) gullies des (ha) erosion Visible Total ge (%)
(ha) (ha) (ha) on WV
(ha)
Muhanga 64,772 72 121 34 7,377 32,998 40,601 63%
Ngororero 67,899 377 597 31 30 40,456 41,490 61%
Rutsiro 65,995 10,913 1,818 105 13,497 8,851 35,183 53%
Gakenke 70,325 8,296 1,957 238 138 24,158 34,787 49%
Karongi 79,298 6,516 518 5 14 27,518 34,571 44%
Rulindo 56,699 1,581 561 5 0 20,833 22,981 41%
Nyamagabe 109,036 2,604 951 710 16,064 23,304 43,632 40%
Burera 58,856 965 2,416 48 128 19,542 23,098 39%
Nyaruguru 101,027 116 46 27 670 37,026 37,885 37%
Nyabihu 52,958 306 283 14 1,081 16,699 18,384 35%
Kamonyi 65,553 3,721 829 115 501 14,030 19,198 29%
Huye 58,153 4,063 413 41 0 11,508 16,025 28%
Ruhango 62,678 849 129 3 0 13,888 14,870 24%
Nyanza 67,215 25 0 0 4,934 10,196 15,155 23%
Gisagara 67,920 1,109 7 19 10,066 3,398 14,599 21%
Rubavu 34,090 1 0 0 0 6,602 6,603 19%
Nyamasheke 94,802 16 17 0 1,089 16,868 17,990 19%
Musanze 50,717 0 0 0 0 9,087 9,087 18%
Gicumbi 82,721 2,827 21 0 22 11,482 14,352 17%
Rusizi 91,731 814 69 109 61 5,030 6,084 7%
Grand Total 1,402,446 45,170 10,752 1,506 55,673 353,475 466,576 33%
The table 2 shows that of the high risk land
(466,576 ha), already 12% contain gullies
(55,922 hectares) and some of them are
severe gullies (10,752 hectares) in Burera,
Rutsiro and Gakenke Districts and 12% have
shown rill erosion (55,673 hectares).
However about 76% of this land did not show,
on the image the erosion features. This does
not mean that there is no erosion but rather it
is because images used were mostly taken
during the summer time (May-August) the
winter images were clouded.
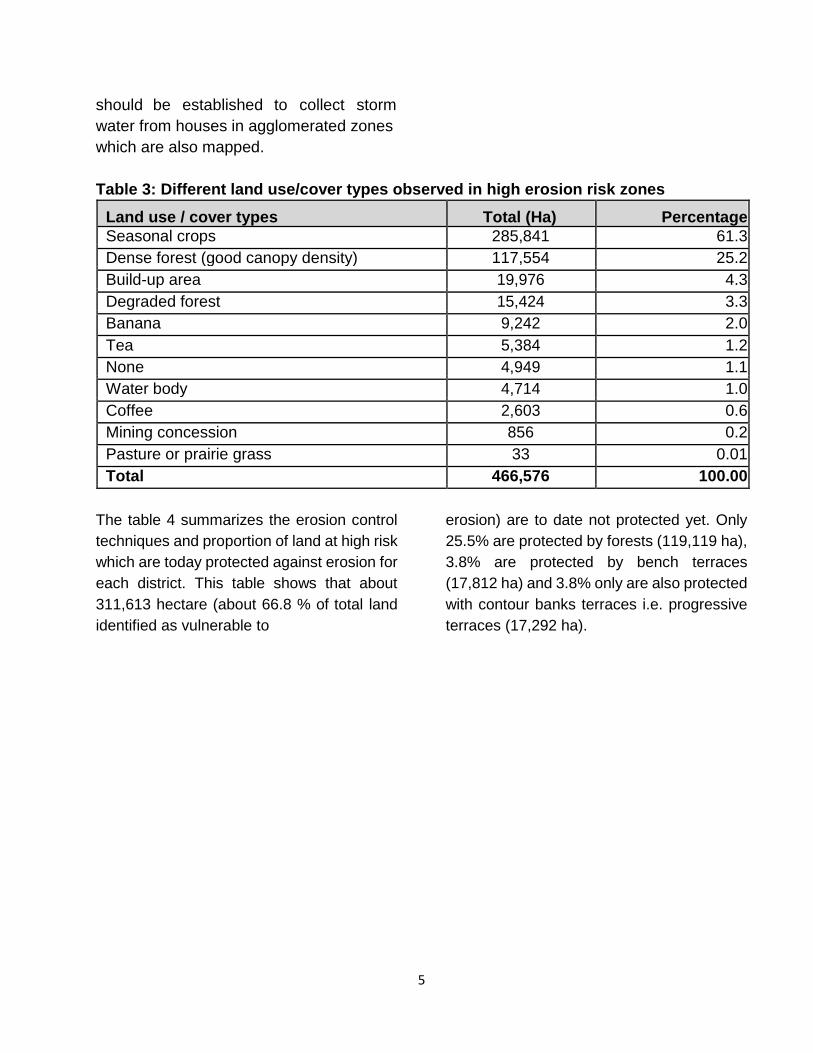
From table 3, it is shown that land in the
high risk areas is mostly used for
agriculture with seasonal crops (61.3%).
4
This exposes land to splash erosion and
further detachment as land is not
permanently covered. In fact, the crop
management and cover factor (C) is very
high for seasonal crops with conventional
(regular) tillage. Forests with good canopy
density occupy only 25%. This means that
land will continue to be eroded if no serious
measures are taken in agricultural lands.
Mining areas in high risk zones accounts for
0.2% of the total high risk land mapped. Built
up area occupy 4.3% of the risk area. Built up
area accelerate water velocity, the runoff and
the flow accumulation which creates severe
gullies downstream.
In such areas water harvesting infrastructure
should be established to collect storm
water from houses in agglomerated zones
which are also mapped.
Table 3: Different land use/cover types observed in high erosion risk zones
Land use / cover types Total (Ha) Percentage
Seasonal crops 285,841 61.3
Dense forest (good canopy density) 117,554 25.2
Build-up area 19,976 4.3
Degraded forest 15,424 3.3
Banana 9,242 2.0
Tea 5,384 1.2
None 4,949 1.1
Water body 4,714 1.0
Coffee 2,603 0.6
Mining concession 856 0.2
Pasture or prairie grass 33 0.01
Total 466,576 100.00
The table 4 summarizes the erosion control
techniques and proportion of land at high risk
which are today protected against erosion for
each district. This table shows that about
311,613 hectare (about 66.8 % of total land
identified as vulnerable to
erosion) are to date not protected yet. Only
25.5% are protected by forests (119,119 ha),
3.8% are protected by bench terraces
(17,812 ha) and 3.8% only are also protected
with contour banks terraces i.e. progressive
terraces (17,292 ha).
5
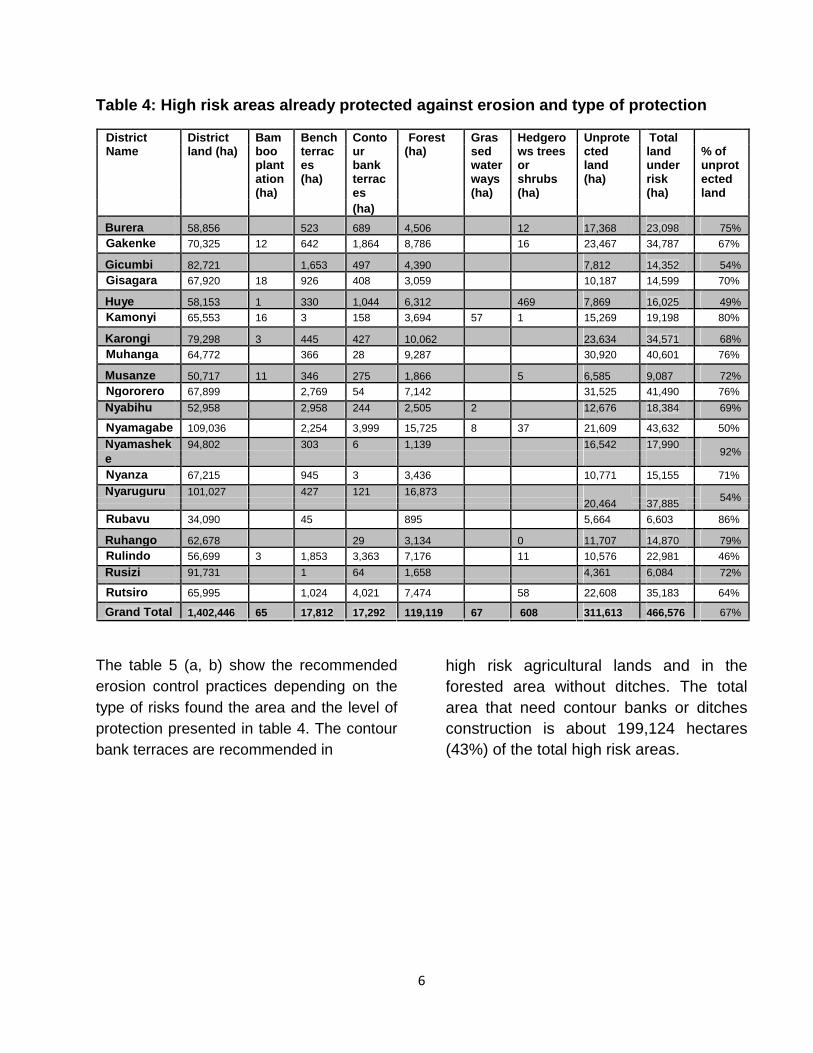
Table 4: High risk areas already protected against erosion and type of protection
District District Bam Bench Conto Forest Gras Hedgero Unprote Total
Name land (ha) boo terrac ur (ha) sed ws trees cted land % of
plant es bank water or land under unprot
ation (ha) terrac ways shrubs (ha) risk ected
(ha) es (ha) (ha) (ha) land
(ha)
Burera 58,856 523 689 4,506 12 17,368 23,098 75%
Gakenke 70,325 12 642 1,864 8,786 16 23,467 34,787 67%
Gicumbi 82,721 1,653 497 4,390 7,812 14,352 54%
Gisagara 67,920 18 926 408 3,059 10,187 14,599 70%
Huye 58,153 1 330 1,044 6,312 469 7,869 16,025 49%
Kamonyi 65,553 16 3 158 3,694 57 1 15,269 19,198 80%
Karongi 79,298 3 445 427 10,062 23,634 34,571 68%
Muhanga 64,772 366 28 9,287 30,920 40,601 76%
Musanze 50,717 11 346 275 1,866 5 6,585 9,087 72%
Ngororero 67,899 2,769 54 7,142 31,525 41,490 76%
Nyabihu 52,958 2,958 244 2,505 2 12,676 18,384 69%
Nyamagabe 109,036 2,254 3,999 15,725 8 37 21,609 43,632 50%
Nyamashek 94,802 303 6 1,139 16,542 17,990 92%
e
Nyanza 67,215 945 3 3,436 10,771 15,155 71%
Nyaruguru 101,027 427 121 16,873
20,464
37,885
54%
Rubavu 34,090 45 895 5,664 6,603 86%
Ruhango 62,678 29 3,134 0 11,707 14,870 79%
Rulindo 56,699 3 1,853 3,363 7,176 11 10,576 22,981 46%
Rusizi 91,731 1 64 1,658 4,361 6,084 72%
Rutsiro 65,995 1,024 4,021 7,474 58 22,608 35,183 64%
Grand Total 1,402,446 65 17,812 17,292 119,119 67 608 311,613 466,576 67%
The table 5 (a, b) show the recommended
erosion control practices depending on the
type of risks found the area and the level of
protection presented in table 4. The contour
bank terraces are recommended in
high risk agricultural lands and in the
forested area without ditches. The total
area that need contour banks or ditches
construction is about 199,124 hectares
(43%) of the total high risk areas.
6
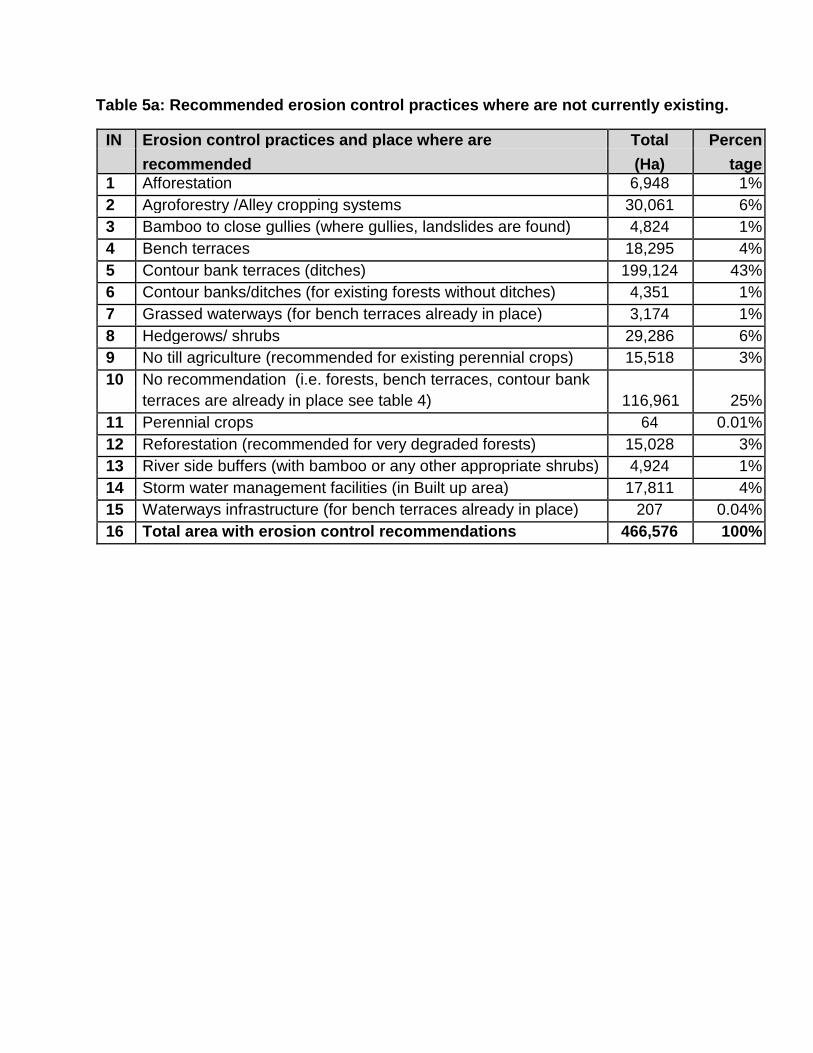
Table 5a: Recommended erosion control practices where are not currently existing.
IN Erosion control practices and place where are Total Percen
recommended (Ha) tage
1 Afforestation 6,948 1%
2 Agroforestry /Alley cropping systems 30,061 6%
3 Bamboo to close gullies (where gullies, landslides are found) 4,824 1%
4 Bench terraces 18,295 4%
5 Contour bank terraces (ditches) 199,124 43%
6 Contour banks/ditches (for existing forests without ditches) 4,351 1%
7 Grassed waterways (for bench terraces already in place) 3,174 1%
8 Hedgerows/ shrubs 29,286 6%
9 No till agriculture (recommended for existing perennial crops) 15,518 3%
10 No recommendation (i.e. forests, bench terraces, contour bank
terraces are already in place see table 4) 116,961 25%
11 Perennial crops 64 0.01%
12 Reforestation (recommended for very degraded forests) 15,028 3%
13 River side buffers (with bamboo or any other appropriate shrubs) 4,924 1%
14 Storm water management facilities (in Built up area) 17,811 4%
15 Waterways infrastructure (for bench terraces already in place) 207 0.04%
16 Total area with erosion control recommendations 466,576 100%
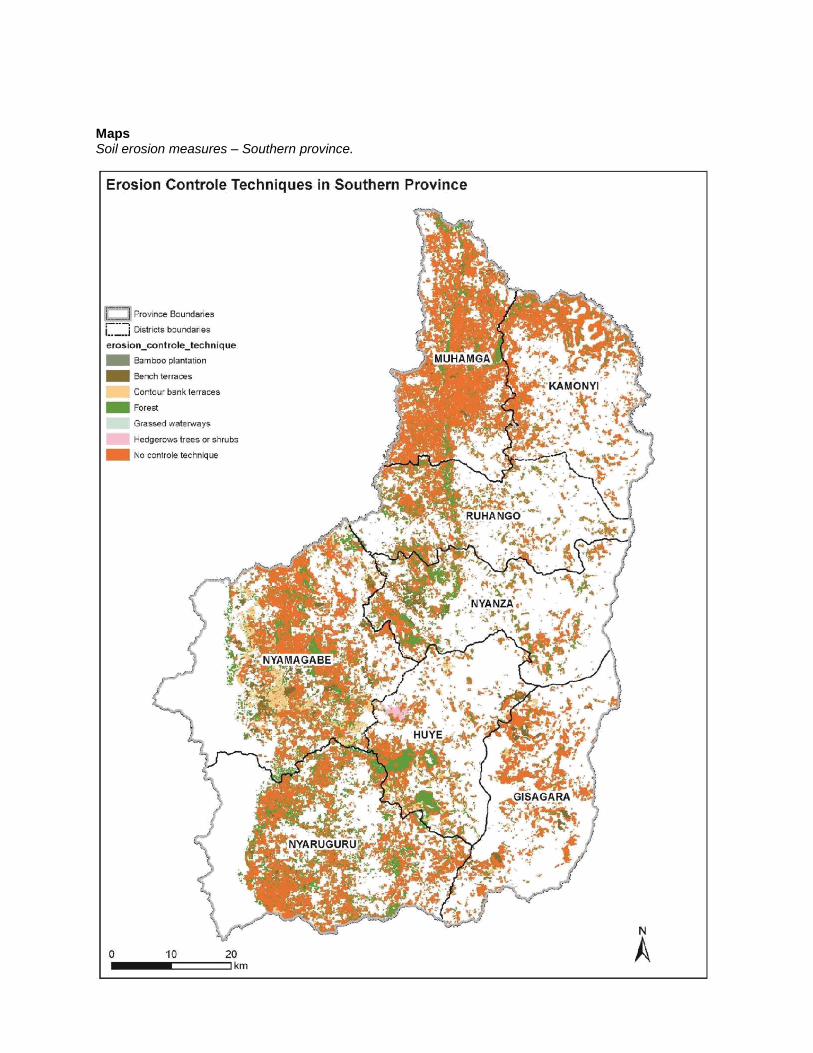
Maps
Soil erosion measures – Southern province.
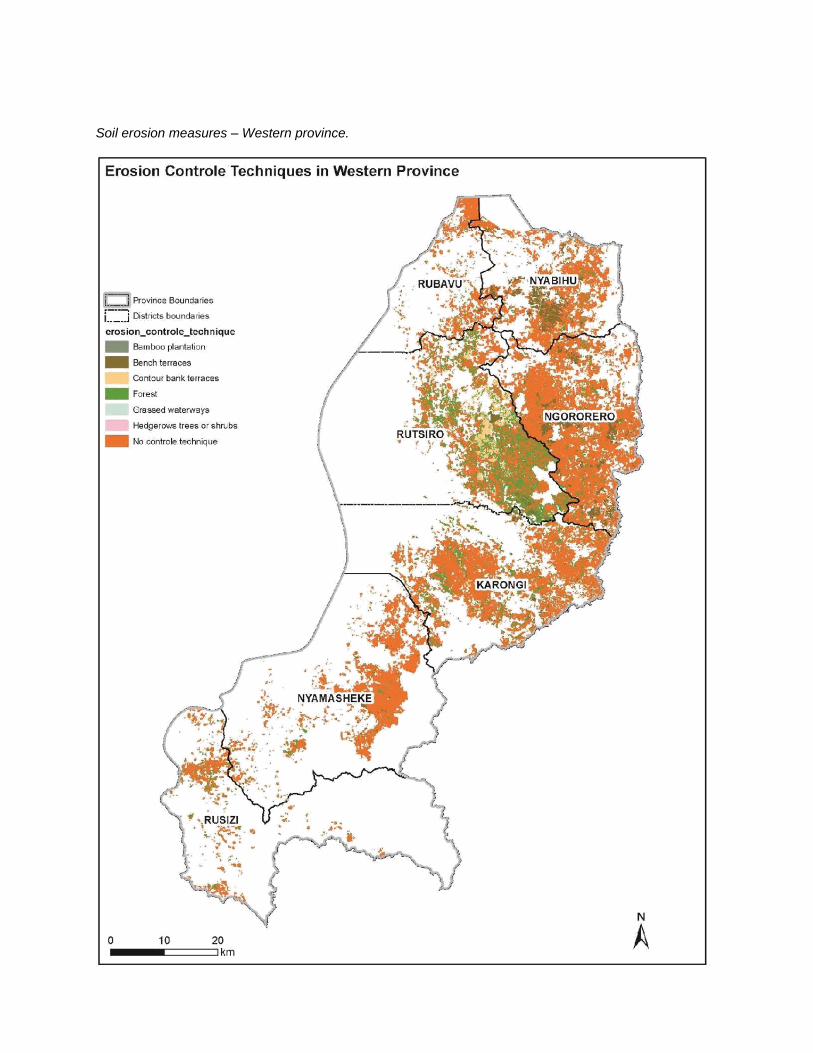
Soil erosion measures – Western province.
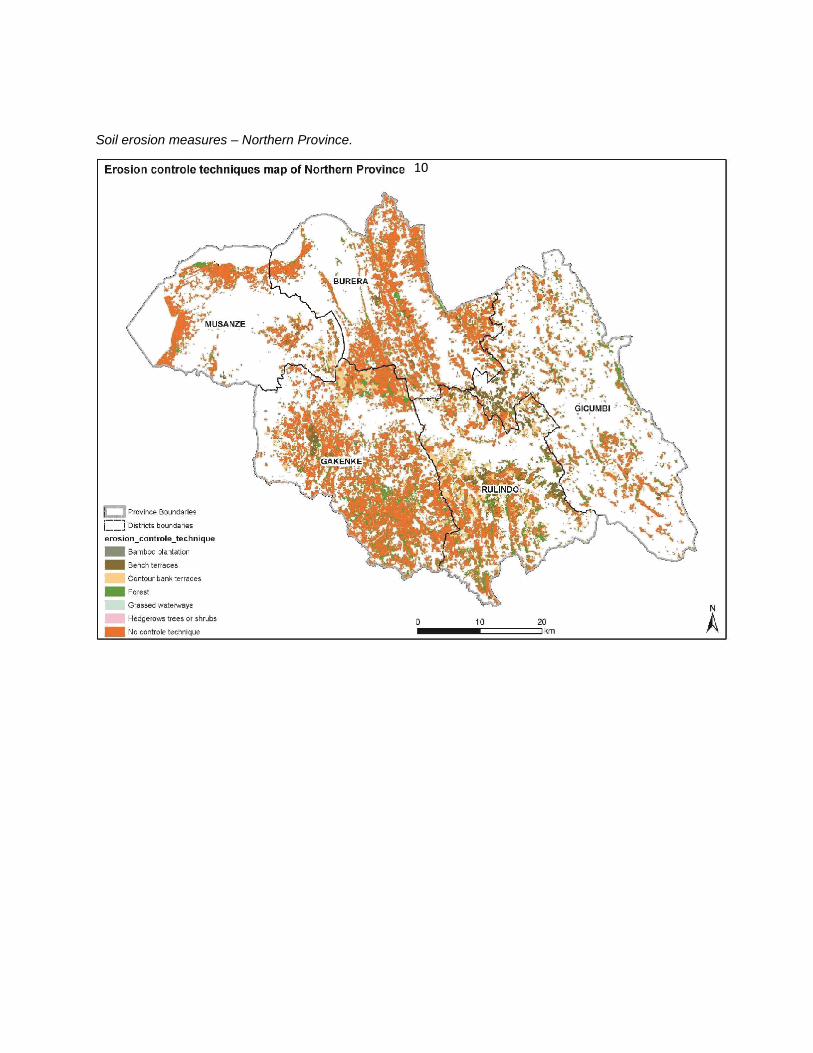
Soil erosion measures – Northern Province.
10

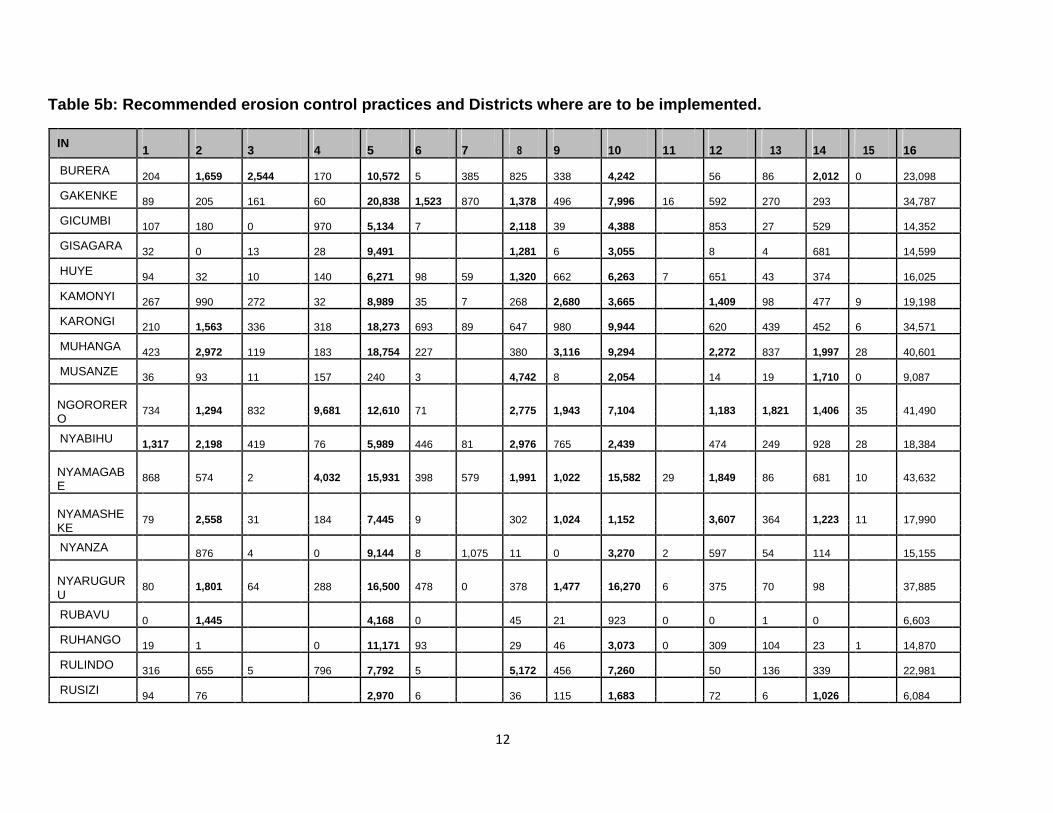
Table 5b: Recommended erosion control practices and Districts where are to be implemented.
IN 1
2
3
4
5
6
7
8
9
10
11
12
13
14
15
16
BURERA 204
1,659
2,544
170
10,572
5
385
825
338
4,242
56
86
2,012
0
23,098
GAKENKE 89
205
161
60
20,838
1,523
870
1,378
496
7,996
16
592
270
293
34,787
GICUMBI 107
180
0
970
5,134
7
2,118
39
4,388
853
27
529
14,352
GISAGARA 32
0
13
28
9,491
1,281
6
3,055
8
4
681
14,599
HUYE 94
32
10
140
6,271
98
59
1,320
662
6,263
7
651
43
374
16,025
KAMONYI 267
990
272
32
8,989
35
7
268
2,680
3,665
1,409
98
477
9
19,198
KARONGI 210
1,563
336
318
18,273
693
89
647
980
9,944
620
439
452
6
34,571
MUHANGA 423
2,972
119
183
18,754
227
380
3,116
9,294
2,272
837
1,997
28
40,601
MUSANZE 36
93
11
157
240
3
4,742
8
2,054
14
19
1,710
0
9,087
NGORORER 734
1,294
832
9,681
12,610
71
2,775
1,943
7,104
1,183
1,821
1,406
35
41,490
O
NYABIHU 1,317
2,198
419
76
5,989
446
81
2,976
765
2,439
474
249
928
28
18,384
NYAMAGAB 868
574
2
4,032
15,931
398
579
1,991
1,022
15,582
29
1,849
86
681
10
43,632
E
NYAMASHE 79
2,558
31
184
7,445
9
302
1,024
1,152
3,607
364
1,223
11
17,990
KE
NYANZA 876
4
0
9,144
8
1,075
11
0
3,270
2
597
54
114
15,155
NYARUGUR 80
1,801
64
288
16,500
478
0
378
1,477
16,270
6
375
70
98
37,885
U
RUBAVU 0
1,445
4,168
0
45
21
923
0
0
1
0
6,603
RUHANGO 19
1
0
11,171
93
29
46
3,073
0
309
104
23
1
14,870
RULINDO 316
655
5
796
7,792
5
5,172
456
7,260
50
136
339
22,981
RUSIZI 94
76
2,970
6
36
115
1,683
72
6
1,026
6,084
12
IN 1
2
3
4
5
6
7
8
9
10
11
12
13
14
15
16
RUTSIRO 1,978
10,890
2
1,181
6,841
244
30
2,613
322
7,303
4
37
210
3,448
80
35,183
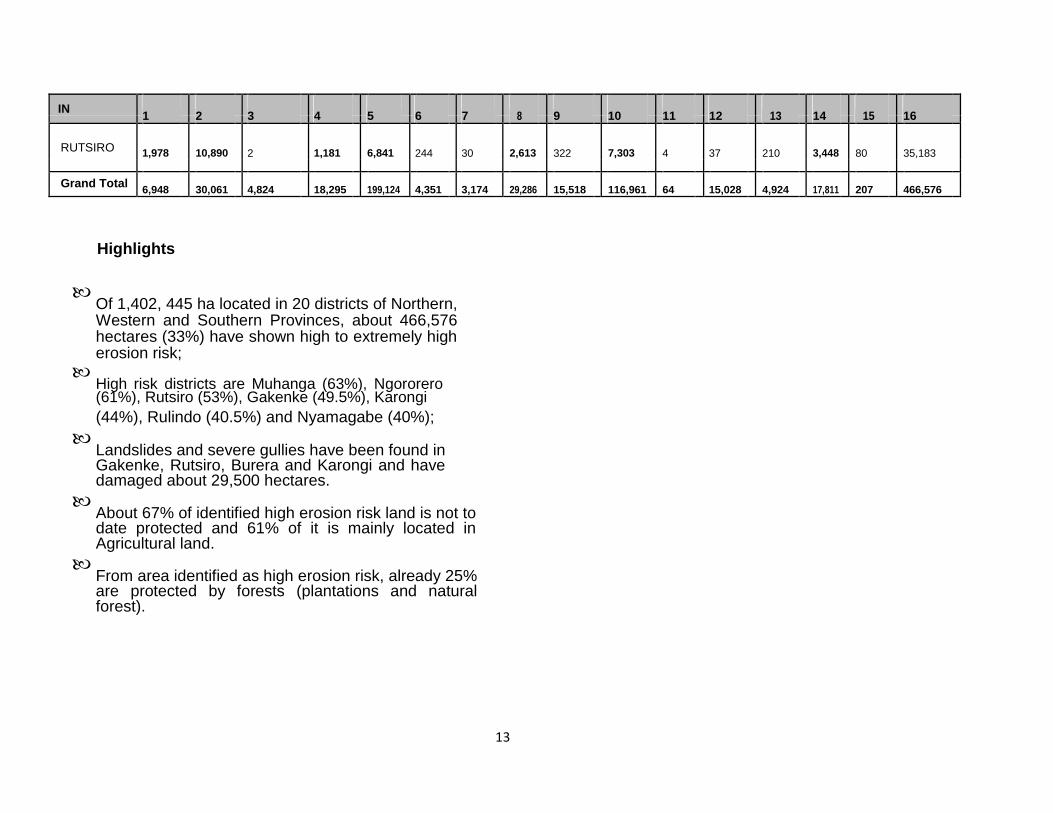
Grand Total 6,948
30,061
4,824
18,295
199,124
4,351
3,174
29,286
15,518
116,961
64
15,028
4,924
17,811
207
466,576
Highlights
Of 1,402, 445 ha located in 20 districts of Northern, Western and Southern Provinces, about 466,576 hectares (33%) have shown high to extremely high erosion risk;
High risk districts are Muhanga (63%), Ngororero (61%), Rutsiro (53%), Gakenke (49.5%), Karongi
(44%), Rulindo (40.5%) and Nyamagabe (40%);
Landslides and severe gullies have been found in Gakenke, Rutsiro, Burera and Karongi and have damaged about 29,500 hectares.
About 67% of identified high erosion risk land is not to date protected and 61% of it is mainly located in Agricultural land.
From area identified as high erosion risk, already 25% are protected by forests (plantations and natural forest).
13