Embed Size (px)
Citation preview

1
Ryans and Holland Creeks
WATER MONITORING REPORT 1996 - 2010

2
FRONT COVER : PHOSPHORUS SAMPLES LINED UP IN THE GOULBURN BROKEN WATERWATCH
LABORATORY BEING PREPARED FOR ANALYSIS

3
TABLE OF CONTENTS
INTRODUCTION ................................................................................................................................................................................ 4
REGIONAL RIVER HEALTH STRATEGY ............................................................................................................................... 7
MONITORING PLAN ....................................................................................................................................................................... 8
MAP OF MONITORING SITES ................................................................................................................................................. 10
TURBIDITY......................................................................................................................................................................................... 11
ELECTRICAL CONDUCTIVITY (SALINITY) ..................................................................................................................... 15
PH ............................................................................................................................................................................................................ 20
DISSOLVED OXYGEN ................................................................................................................................................................... 23
PHOSPHORUS .................................................................................................................................................................................. 25
STATE ENVIRONMENT PROTECTION POLICY (SEPP) COMPLIANCE ............................................................ 27
MACRO-INVERTEBRATES IN RYANS CREEK ................................................................................................................. 30
SUMMARY FOR RYANS AND HOLLAND CREEKS ......................................................................................................... 32
REFERENCES ..................................................................................................................................................................................... 33
GLOSSARY .......................................................................................................................................................................................... 33
APPENDIX A ...................................................................................................................................................................................... 34
RYANS AND HOLLAND CREEK REPORT FOR SAMPLES FROM 01 JAN 2010 TO 31 DEC 2010 ........ 34

4
Introduction
Waterwatch is a community water quality monitoring program that assists the community in
monitoring their local waterway. The program aims to:
increase community awareness and understanding of water quality issues;
increase community involvement in water management decisions;
generate useful data for community, and agency, use which complements Agency monitoring;
and,
assist in assessing the value of river restoration programs.
Monitoring networks across the Goulburn Broken Catchment have been formed to study water quality
in their local areas. The networks are able to test a local stream for a range of parameters using
equipment supplied by the Waterwatch Program. The parameters selected for testing in each area
depend upon the water quality issues identified by the monitoring network. Monitors also record the
date, time and rainfall to assist in the interpretation of the data.
Monitoring only began regularly on the Ryans and Holland Creeks in 2007, instigated by a Community
Stream Sampling Program funded by the Bureau of Rural Science. Monitoring has continued, although
at not so many sites. During 2010, a total of twenty one sites were regularly monitored for the
following parameters:
1. Electrical Conductivity (Salinity);
2. Turbidity;
3. pH;
4. Temperature; and
5. Total Phosphorus (at selected sites);
6. Dissolved oxygen (at selected sites).
This report contains the following information:
1. Monitoring Plan
2. Information about water quality parameters
3. A tabular summary of data collected at sites monitored by the Creightons Creek Network
4. Graphical representation of parameters along the length of the waterway
5. Graphical representation of parameters over the period of the monitoring program
6. Comparisons of local water quality data with State Environment Protection Policy (SEPP)
guidelines
7. Macro-invertebrate sampling conducted in 2010
8. Raw data for 2010.
The report provides a summary of testing results since 1997 and should be used to stimulate
discussion on the state of water quality in Ryans and Holland Creeks and potential actions to improve
water quality. There is the potential to use water quality data collected in the program to discover
trends in water quality over time and to measure the effects of improvement works carried out in the
sub-catchment.

5
Figure 1. Goulburn Broken Catchment
GBCMA (2005)

6
Figure 2. Broken River Basin
Red numbers show river reaches
GBCMA (2005)

7
Regional River Health Strategy
Rivers are divided into sections, known as “reaches”, and each section or reach is given a number. Most sites monitored by Goulburn Broken Waterwatch are in
reaches that are addressed in the Goulburn Broken Catchment Management Authority‟s (GBCMA) Regional River Health Strategy (RRHS). The reaches that are
targeted in the RRHS are identified through the five yearly Index of Stream Condition (ISC) Assessment (GBCMA, 2005). Holland and Ryans Creeks have reaches
which fall under Program A in the RRHS. This Program addresses key issues in forty three reaches in the Goulburn Broken catchment which have been identified as
High Priority Reaches. A High Priority Reach is one of high community value for environmental, social and economic values (GBCMA, 2005). Ryans Creek Reach 17
also falls under Program B in the RRHS, to protect Ecologically Healthy Rivers.
River Reach Description High Values to be
protected
Threats
Holland Creek
13
and
14
START – Holland Creek at confluence with Ryans
Creek, 550 m upstream of Emu Bridge Road
crossing
END - Holland Creek 700 m downstream of
crossing at Samaria Road
Macquarie Perch. Stock access;
Water quality - turbidity, Dissolved oxygen and
nutrients;
Water Quality trend – pH;
Barrier to fish migration;
Channel modification;
Flow deviation;
Introduced flora;
Degraded riparian vegetation.
Ryans Creek 17 START – Ryans Creek at the old Tolmie Road
crossing (Tatong)
END – Ryans Creek at Southern end of Loombah
Weir (off Upper Ryans Creek Road)
Ecologically Healthy
River
No threats currently risk the status of Reach 17 of
Ryans Creek, but it will be monitored and actions
necessary undertaken to prevent impacts from
any low risk threats.
Table 1 GBCMA (2005)
Reach 15 of Holland Creek is also targeted under Program C in the RRHS, to create more ecologically healthy rivers. This reach has poor riparian width, and
revegetation initiatives are proposed to improve this. See Goulburn Broken Catchment Management Authority‟s Regional River Health Strategy (2005) for more
detailed information.

8
Monitoring Plan
Name of Project Activity Area: Ryans and Holland Creeks
Monitoring Coordinator: Danielle Beischer
Why are you monitoring? Waterwatch has an on-going objective to encourage the community to become involved in monitoring
local waterways to learn more about water quality issues. The data that is collected through this
monitoring program can be used to target on-ground works to improve water quality.
Following the bushfires in the Ryans Creek catchment in December 2006, water quality monitoring
took on a new imperative. Data has been collected since February 2007 and forwarded to the Goulburn
Broken Catchment Management Authority for use in monitoring the initial impact of the fires on the
sub-catchment, and the length of time required for Ryans Creek to recover from the fires.
Who will use the data? The data is primarily collected for the benefit of the community. The data is also available to other
organisations and individuals that have an interest in catchment water quality. These include Federal
and State Government agencies, Local Government, Catchment Management Authorities (CMAs),
Natural Resource Management (NRM) bodies and managers, community groups and local farmers and
landholders.
How will the data be used? Waterwatch data is used by the community to understand issues regarding water quality in waterways.
The data is then available to develop local action plans to improve water quality and to measure the
effectiveness of these plans.
Data collected by Goulburn Broken Waterwatch at chosen sites in 2009 was forwarded to the
Department of Sustainability and Environment, for use in the 2009 Index of Stream Condition
Assessment. This assessment is carried out every five years, and Waterwatch Victoria was
approached to be included in the project, assisting with data collection for this assessment. Five sites
in this report; Ryans Creek at confluence with Sams Creek at Gunns Road (RYA020), Watchbox Creek
at O‟Dea's (WBX010), Holland Creek at Tolmie (HOL001), Holland Creek at Dodds Bridge (HOL003),
and Sams Creek at Gunns Road (SAM010); were included in the 2009 ISC Assessment.
Goulburn Broken Waterwatch integrates our monitoring programs into the Goulburn Broken Catchment
Management Authority‟s Regional River Health Strategy. The Goulburn Broken Catchment
Management Authority can utilise the data to assess actions to improve river health against targets
and objectives.
Who will be involved and where will you monitor?
CHRIS HAKKENNES RYA010 - MAP 8124 E 427268 N 5944387 Ryans Creek on Rogash Road.
WBX010 - MAP 8124 E 425615 N 5943976 Watchbox Creek at O‟Dea's.
DON AND MARGARET MCFADDEN RYA017 – MAP 8124 E 421420 N 5947156 Ryans Creek at "Kilfeera" driveway bridge.
TERRY RING RYA003 - MAP 8124 E 429790 N 5936372 Ryans Creek at “Tinnaroo”

9
WATERWATCH COORDINATOR
BLI010 – MAP 8024 E 409772 N 5952317 Blind Creek on Samaria Road. BLI015 – MAP 8124 E 413865 N 5941589 Blind Creek at Knights Road.
BRO055 – MAP 8024 E 407362 N 5955285 Broken River after Benalla at Pump station, Faithful St. HOL001 – MAP 8124 E 473707 N 5913939 Holland Creek at Tolmie.
HOL002 – MAP 8124 E 422842 N 5923978 Holland Creek at Fords Bridge.
HOL003 – MAP 8124 E 422899 N 5927549 Holland Creek at Dodds bridge. HOL004 – MAP 8124 E 422797 N 5929650 Holland Creek upstream Tatong at “Riverview”
HOL010 – MAP 8124 E 419615 N 5934129 Holland Creek at Tatong bridge.
HOL012 – MAP 8124 E 417465 N 5942647 Holland Creek Benalla-Tatong Rd (Samaria Rd)
RYA001 – MAP 8124 E 428496 N 5919688 Ryans Creek at Madhouse Road.
RYA002 – MAP 8124 E 430956 N 5935700 Loombah Weir - Ryans Creek.
RYA019 – MAP 8124 E 417829 N 5947246 Ryans Creek at "Warilya" at Gunn's Road. RYA050 – MAP 8124 E 430800 N 5934500 Ryans Ck 1 km u/s Loombah Weir, macroinvert. site.
RYA101 – MAP 8124 E 431400 N 5917800 Ryans Creek at Dick's Landing Rd, US of RYA001.
SAM010 – MAP 8124 E 417777 N 5947147 Sam Creek at Gunns Road. WPC005 - MAP 8024 E 399771 N 5950533 Woolpress Ck at Baddaginnie
INACTIVE HOL015 – MAP 8024 E415753 N5947634 Holland Creek at Emu Bridge.
HOL020 – MAP8024 E409851 N5952766 Holland Creek at Sherwills Bridge Benalla.
RYA020 – MAP 8124 E 417781 N 5947211 Ryans Ck at confluence with Sam Ck at Gunns Rd. SAM005 – MAP 8124 E 422340 N 5943523 Sam Creek at Molyullah-Tatong Rd.
See Map on page 10 also.
Which parameters will be monitored?
Turbidity,
Electrical Conductivity,
Temperature,
pH (at selected sites), Dissolved Oxygen (at selected sites)
Total Phosphorus (at selected sites)
Apart from temperature and dissolved oxygen, these parameters are monitored to develop the Water
Quality sub-index of the Index of Stream Condition in Victoria.
Data quality controls?
See Data Confidence Plan
What methods will you use?
When and how often will you monitor? See Community Monitoring Manual for the methods and procedures used in the Waterwatch Program.
A statistical analysis of water quality data requires monthly monitoring as a minimum.
How will the data be managed and reported? All water quality data is sent to the local Waterwatch Coordinator for quality assurance checking prior
to being sent to the Data Management Coordinator for entry into the Regional Waterwatch Database.
Periodically, raw data reports and written reports are prepared by the Data Management Coordinator
and distributed to the volunteer monitoring network, and agencies or groups who have requested the
data.
Raw data is also loaded monthly onto the Goulburn Broken Waterwatch website
(www.gbwaterwatch.org.au).

10
Map of Monitoring Sites
Figure 3: This map is taken from the Goulburn Broken Waterwatch Website, (www.gbwaterwatch.org.au) and
shows the water quality monitoring sites along Ryans and Holland Creeks.
11
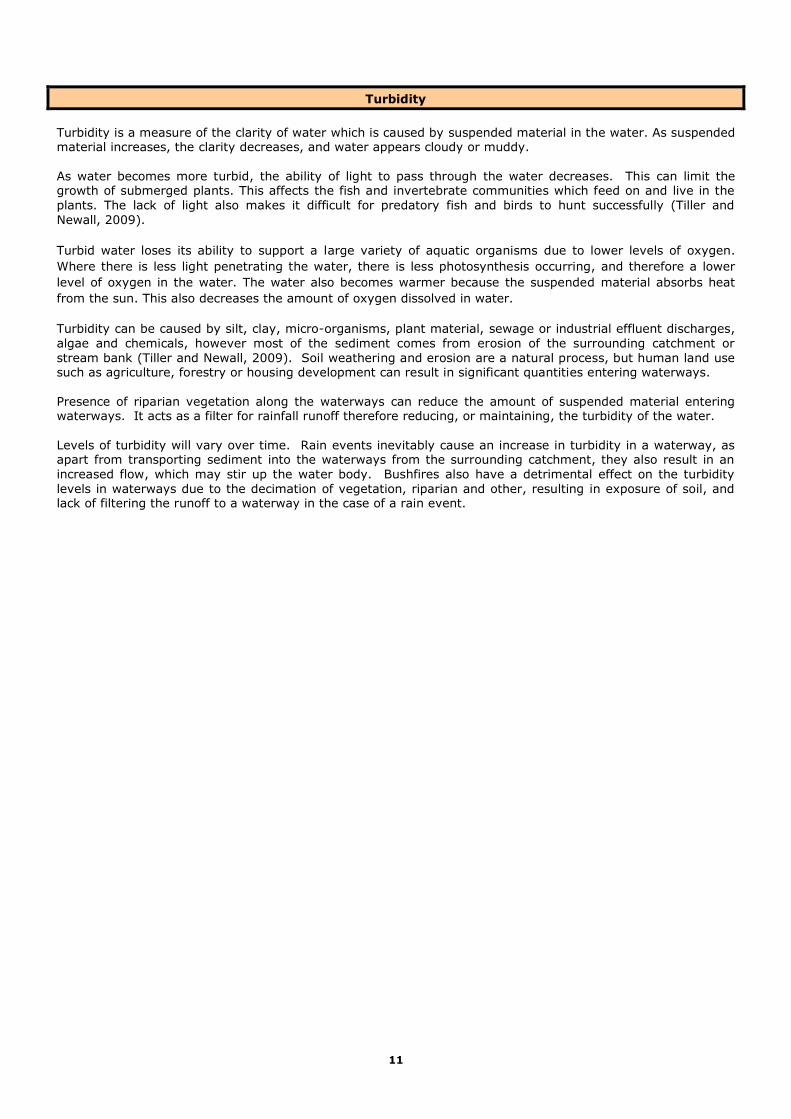
Turbidity
Turbidity is a measure of the clarity of water which is caused by suspended material in the water. As suspended material increases, the clarity decreases, and water appears cloudy or muddy.
As water becomes more turbid, the ability of light to pass through the water decreases. This can limit the growth of submerged plants. This affects the fish and invertebrate communities which feed on and live in the
plants. The lack of light also makes it difficult for predatory fish and birds to hunt successfully (Tiller and
Newall, 2009).
Turbid water loses its ability to support a large variety of aquatic organisms due to lower levels of oxygen.
Where there is less light penetrating the water, there is less photosynthesis occurring, and therefore a lower
level of oxygen in the water. The water also becomes warmer because the suspended material absorbs heat
from the sun. This also decreases the amount of oxygen dissolved in water.
Turbidity can be caused by silt, clay, micro-organisms, plant material, sewage or industrial effluent discharges,
algae and chemicals, however most of the sediment comes from erosion of the surrounding catchment or
stream bank (Tiller and Newall, 2009). Soil weathering and erosion are a natural process, but human land use such as agriculture, forestry or housing development can result in significant quantities entering waterways.
Presence of riparian vegetation along the waterways can reduce the amount of suspended material entering waterways. It acts as a filter for rainfall runoff therefore reducing, or maintaining, the turbidity of the water.
Levels of turbidity will vary over time. Rain events inevitably cause an increase in turbidity in a waterway, as apart from transporting sediment into the waterways from the surrounding catchment, they also result in an
increased flow, which may stir up the water body. Bushfires also have a detrimental effect on the turbidity
levels in waterways due to the decimation of vegetation, riparian and other, resulting in exposure of soil, and lack of filtering the runoff to a waterway in the case of a rain event.

12
Turbidity in the Ryans and Holland Creeks Holland Creek at Benalla has been monitored by Waterwatch since 1997. Most other sites in this report began being monitored in early 2007 as part of the
Community Stream Sampling Project for the Bureau of Rural Science. The table and graph below summarise the data collected.
Site Code
Site Description
TURBIDITY MEDIANS (NTU)
1996 1997 1998 1999 2000 2001 2002 2003 2004 2005 2006 2007 2008 2009 2010
HOL001 Holland Creek at Tolmie - - - - - - - - - - - - 9 11 -
HOL002 Holland Creek at Fords
Bridge - - - - - - - - - - - 4 4 - -
HOL003 Holland Creek at Dodds
Bridge - - - - - - - - - - - - 5 7 -
HOL004 Holland Creek U/S
Tatong at “Riverview” - - - - - - - - - - - - 4 - -
HOL010 Holland Creek at Tatong
Bridge - - - - - - - - - - - 8 4 - -
HOL012
Holland Creek at
Benalla- Tatong Road (Samaria Road)
- - - - - - - - - - - 10 22 - -
RYA001 Ryans Creek at
Madhouse Road - - - - - - - - - - - - 4 - -
RYA003 Ryans Creek at
"Tinnaroo" - - - - - 5 - - - - - 4 3 4 5
RYA010 Ryans Creek and
Rogash Road - - - - - 3 - - - - - 7 12 13 15
WBX010 Watchbox Creek at
O'Dea’s - - - - - - - - - - - 7 7 8 11
RYA017
Ryans Creek at
Kilfeera driveway bridge
- - - - - - - - - - - 13 23 20 22
RYA019
Ryans Creek at
Warilya at Gunns
Road
- - - - - - - - - - - 8 13 - -
SAM005 Sam Creek at Molyullah-
Tatong Road - - - - - - - - - - - 52 15 - 27
SAM010 Sam Creek at Gunns
Road - - - - - - - - - - - 23 52 62 -
Ratings for Valleys:
<10 NTU Excellent <12.5 NTU Good <15 NTU Fair <22.5 NTU Poor >22.5 NTU Degraded
Table 2

13
Site
Code Site Description
TURBIDITY MEDIANS (NTU)
1996 1997 1998 1999 2000 2001 2002 2003 2004 2005 2006 2007 2008 2009 2010
RYA020 Ryans Creek at
confluence with Sam
Creek
- - - - - 6 - - - - - 18 27 17 35
HOL015 Holland Creek at Emu
Bridge - - - - - - - - - 20 - 10 24 11 -
HOL020 Holland Creek at
Sherwills Bridge Benalla - 19 20 - 28 - - - - - - 14 13 16 -
BRO055 Broken River at
Faithfull Street 19 19 23 40 41 33 - 35 18 24 - 22 18 25 44
Annual Rainfall Total (mm)
BoM Killanoola Station (82109) 837 447 614 716 770 596 457 - 623 855 - 604 495 555 1074
Ratings for Valleys: <10 NTU Excellent <12.5 NTU Good <15 NTU Fair <22.5 NTU Poor >22.5 NTU Degraded
Table 2 continued
Turbidity medians have risen slightly at all sites tested in 2010. It must be noted rainfall is double that for 2009, and rainfall has a direct
effect on turbidity.
Turbidity results are still rated as “Excellent” at Ryans Creek at “Tinaroo” (RYA003).
Sam Creek continues to have elevated turbidity at Mollyullah-Tatong Rd (SAM005). There were insufficient results to calculate a
representative median for the site at Gunn‟s Rd (SAM010) in 2010.
There was little monitoring in Holland Creek in 2010.

14
Figure 4
Figure 4 shows the median turbidity at each site with sufficient results to calculate a median for 2010 only. The
pink line shows the typical trend of turbidity increasing as water moves downstream.
Figure 5
Figure 5 shows the long term median turbidity at each site which includes all samples collected since 1996.
0
5
10
15
20
25
30
35
40 N
TU
Site Code
Turbidity Medians of Ryans and Holland Creeks - 2010
Degraded
Excellent
0
10
20
30
40
50
60
NT
U
Site Code
Turbidity Medians of the Ryans and Holland Creeks 1996 - 2010
Degraded
Excellent

15
Electrical Conductivity (Salinity)
Electrical conductivity (EC) measures the flow of electricity in a solution (Tiller and Newall, 2009). As the
amount of dissolved salts in the water increase, the conductivity increases. This relationship is used as a measure of salinity, and is recorded as micro Siemens per centimetre (µS/cm) (Tiller and Newall, 2009).
Salts are necessary for aquatic organisms to survive, but excessive amounts may be toxic to some. Different organisms have different tolerance levels to salt, but most freshwater aquatic organisms will not tolerate high
levels. In general, EC levels less than 1500 µS/cm are considered to have little short term effect (Tiller and
Newall, 2009). As salinity rises, the number of species decline.
Geology, urban and agricultural runoff, industrial and sewage runoff, proximity to the coast, and groundwater
all affect salinity levels. Naturally salinity levels are higher in dry periods, as evaporation concentrates the salt
levels. During these dry times, groundwater maybe the major contributor of water to waterways. Groundwater can have very high salt concentrations, and rising groundwater tables are known to have elevated
salinity levels in many rivers in Victoria (Tiller and Newall, 2009). Once there is runoff again from rainfall, the
salt concentrations will decrease.
Dryland salinity is caused when deep rooted trees are replaced with seasonal crops or grasses that do not
pump the water into the atmosphere as efficiently. If trees are cleared higher up in a catchment, this can lead to dramatic rises in groundwater tables. Revegetation of recharge areas and buffer strips along local streams
can help to reduce salinity.
The following summary can assist in interpretation of salt levels in surface waterways.
0-800 µS/cm
Water from your tap at home would be within this range.
This is good drinking water for people and suitable for all animals. When water of 300 µS/cm is used in irrigation through overhead sprinklers, plants that are sensitive to
salt may develop leaf scorch.
800-2500 µS/cm
People can drink water within this range but it would start to taste very salty.
This water is still suitable for all animals. Peas, apricots and grapes can't be grown with water over 1,500 µS/cm.
If this water is used for irrigation farming, special care must be taken with drainage and choosing plants
that are tolerant to salt. For example, lucerne can be irrigated with water of 2,000 µS/cm and white clover with water of 1,000 µS/cm, provided they are grown on sandy soil with good drainage.
2,500-10,000 µS/cm
Water in this range is not suitable for people and should only be drunk in an emergency. When water over 4,000 µS/cm is given to laying hens it causes their eggs to crack.
Water over 6,000 µS/cm is unsuitable for pigs and poultry.
Highly saline water may also contain a high level of magnesium which can be harmful to stock. This water is generally not used for irrigation farming except on some crops that have a very high
tolerance to salt.
Pears, apples and tomatoes could not be grown with water in this range.
Over 10,000 µS/cm
Water over 10,000 µS/cm has an extremely high salinity. This water is unsuitable for people and for most animals.
Only beef cattle and adult sheep can survive on water in this range.
Irrigation farming is not possible with such highly saline water.
In dryland areas only salt tolerant pastures will survive. At 50,000 µS/cm water has salinity similar to the sea.

16
Electrical Conductivity (Salinity) in Ryans and Holland Creeks
Holland Creek at Benalla has been monitored by Waterwatch since 1997. Testing began for most of the other sites in early 2007 as part of the Community Stream
Sampling Project for the Bureau of Rural Science. The table below shows median results for each calendar year.
Site
Code Site Description
Electrical Conductivity MEDIANS (µS/cm)
1996 1997 1998 1999 2000 2001 2002 2003 2004 2005 2006 2007 2008 2009 2010
HOL001 Holland Creek at Tolmie - - - - - - - - - - - - 45 32 -
HOL002 Holland Creek at Fords
Bridge - - - - - - - - - - - - 85 - -
HOL003 Holland Creek at Dodds
Bridge - - - - - - - - - - - - 77 84 -
HOL004 Holland Creek U/S
Tatong at “Riverview” - - - - - - - - - - - 86 117 - -
HOL010 Holland Creek at Tatong Bridge
- - - - - - - - - - - 99 103 - -
HOL012 Holland Creek at Benalla- Tatong Road
(Samaria Road)
- - - - - - - - - - - 98 125 - -
RYA001 Ryans Creek at
Madhouse Road - - - - - - - - - - - - 32 - -
RYA003 Ryans Creek at
"Tinnaroo" - - - - - 40 - - - - - 67 60 50 40
RYA010 Ryans Creek and
Rogash Road - - - - - 90 - - - - - 103 100 117 55
WBX010 Watchbox Creek at
O'Dea’s - - - - - - - - - - - 150 100 104 100
RYA017 Ryans Creek at Kilfeera driveway
bridge
- - - - - - - - - - - 135 110 138 80
RYA019
Ryans Creek at
Warilya at Gunns
Road
- - - - - - - - - - - 136 143 - -
Ratings for Valleys:
<80 EC Excellent <240 EC Good <400 EC Fair <600 EC Poor >600 EC Degraded
Table 3

17
Site
Code Site Description
Electrical Conductivity MEDIANS (µS/cm)
1996 1997 1998 1999 2000 2001 2002 2003 2004 2005 2006 2007 2008 2009 2010
SAM005 Sam Creek at Molyullah-Tatong Road
- - - - - - - - - - - 200 169 - 110
SAM010 Sam Creek at Gunns Road
- - - - - - - - - - - 600 410 504 -
RYA020 Ryans Creek at confluence with Sam
Creek
- - - - - 220 - - - - - 196 147 150 174
HOL015 Holland Creek at Emu
Bridge - - - - - - - - - 102 - 150 150 100 -
HOL020 Holland Creek at
Sherwills Bridge Benalla - 160 120 - 190 - - - - - - 145 151 140 -
BRO055
Broken River at
Faithfull Street Benalla
110 130 135 110 120 140 - 164 124 136 - 160 164 160 131
Annual Rainfall Total (mm)
BoM Killanoola Station (82109) 837 447 614 716 770 596 457 - 623 855 - 604 495 555 1074
Ratings for Valleys: <80 EC Excellent <240 EC Good <400 EC Fair <600 EC Poor >600 EC Degraded
Table 3 continued
Electrical conductivity levels have remained stable and improved slightly at most sites in 2010.

18
Figure 6
Figure 6 shows the median electrical conductivity at each site with enough data to calculate a representative median for 2010 only.
0
100
200
300
400
500
600
µS
/cm
Site code
Electrical Conductivity Medians of Ryans and Holland Creeks 2010
Excellent
Good
Fair
Degraded

19
Figure 7
Figure 7 shows the long term median electrical conductivity. These medians are calculated using each data point collected for each site since 1996.
0
100
200
300
400
500
600
700
µS
/cm
Site code
Electrical Conductivity Medians in Ryans and Holland Creeks 1996 - 2010
Excellent
Good
Degraded

20
pH
The pH of a stream is a measure of how acid or alkaline (basic) the water is on a scale from 0 to 14. It is a
measure of the hydrogen ion (H+) concentration. Water contains both H+ and OH- ions. Pure distilled water
contains equal numbers of H and OH ions and is considered neutral (pH 7).
pH measurements between 7 and 0 indicate the solution is acidic and the solution contains more H ions than
OH ions. Measurements from 7 to 14 indicate alkalinity and the water contains more OH ions than H ions.
From pH 7 to pH 0, water becomes more acidic and from pH 7 to 14, water becomes increasingly alkaline. pH
is a logarithmic scale so that for every one unit change (e.g. from 5 to 4), there is a ten-fold increase in
acidity.
The pH of fresh waters usually lies in the range 6.5 to 8.0 (Tiller and Newall, 2009) although wide variations
can occur because of catchment geology. Granitic rock, or soil high in organic acids tend to lower the pH of
groundwater, and basaltic rock, or soils high in salts have the reverse effect, typically increasing the pH (Tiller
and Newall, 2009). The pH can also be affected when plants consume carbon dioxide (CO2) during
photosynthesis. The reduction in CO2 reduces the acidity of the water, therefore increasing the pH. The
reverse is true at night when respiration is occurring and CO2 levels increase (Tiller and Newall, 2009). A
range of other factors can affect pH, including industrial runoff and sewage discharges.
pH Changes in Water
Changes in pH outside the normal range of a water body will cause loss of the more sensitive species.
Extremely high and low pH values will lead to the death of all aquatic life.
The most common cause of unnatural changes in pH occurs in catchments which have acid sulphate soils that
have been exposed to the atmosphere by mining or urban development. During high rainfall events, these
acids can be washed into streams causing sharp rises in pH values for short periods of time. Nutrient pollution
can cause excessive growth of algae and other plants and lift the pH values to quite high levels at certain
times of the day. These sometimes large variations in pH can reduce the number of species of aquatic
organisms normally present in the water body.

21
pH in Ryans and Holland Creeks
Some sites in Ryans and Holland Creeks have been monitored by Waterwatch for pH since 1998. The table below summarises the data collected.
Site
Code Site Description
pH MEDIANS
1996 1997 1998 1999 2000 2001 2002 2003 2004 2005 2006 2007 2008 2009 2010
HOL001 Holland Creek at Tolmie - - - - - - - - - - - - 7.6 7.1 -
HOL002 Holland Creek at Fords Bridge
- - - - - - - - - - - - 7.7 - -
HOL003 Holland Creek at Dodds Bridge
- - - - - - - - - - - - 7.7 7.3 -
HOL004 Holland Creek U/S Tatong at “Riverview”
- - - - - - - - - - - 7.3 7.6 - -
HOL010 Holland Creek at Tatong
Bridge - - - - - - - - - - - 7.7 7.3 - -
HOL012
Holland Creek at
Benalla- Tatong Road
(Samaria Road)
- - - - - - - - - - - 7.6 7.3 - -
RYA001 Ryans Creek at
Madhouse Road - - - - - - - - - - - - 7.5 - -
RYA003 Ryans Creek at "Tinnaroo"
- - - - - - - - - - - 7.8 7.3 - -
RYA010 Ryans Creek and Rogash Road
- - - - - - - - - - - 7.8 7.6 - -
WBX010 Watchbox Creek at O'Dea’s
- - - - - - - - - - - 7.8 - - -
RYA017
Ryans Creek at
Kilfeera driveway
bridge
- - - - - - - - - - - 7.8 7.7 - -
RYA019
Ryans Creek at
Warilya at Gunns Road
- - - - - - - - - - - 7.6 7.5 - -
Ratings for Mountains, Valleys and Plains: 6.0 - 7.5 Excellent 5.5 - 6 or <8.0 Good 8.0 - 8.5 Fair 5.0 - 5.5 or 8.5 - 9.0 Poor < 5.0 or > 9.0 Degraded
Table 4

22
Site
Code Site Description
pH MEDIANS
1996 1997 1998 1999 2000 2001 2002 2003 2004 2005 2006 2007 2008 2009 2010
SAM005 Sam Creek at Molyullah-Tatong Road
- - - - - - - - - - - 7.2 - - -
SAM010 Sam Creek at Gunns
Road - - - - - - - - - - - 7.1 7.0 7.0 -
RYA020
Ryans Creek at
confluence with Sam
Creek
- - - - - - - - - - - 7.3 7.4 7.1 6.8
HOL015 Holland Creek at Emu
Bridge - - - - - - - - - 7.6 - - 7.5 - -
HOL020 Holland Creek at Sherwills Bridge Benalla
- - 7.1 - 7.1 - - - - - - 7.6 7.4 6.9 -
BRO055 Broken River at Faithfull Street
Benalla
7.6 - 7.0
Annual Rainfall Total (mm)
BoM Killanoola Station (82109) 837 447 614 716 770 596 457 - 623 855 - 604 495 555 1074
Ratings for Mountains, Valleys and Plains: 6.0 - 7.5 Excellent 5.5 - 6 or <8.0 Good 8.0 - 8.5 Fair 5.0 - 5.5 or 8.5 - 9.0 Poor < 5.0 or > 9.0 Degraded
Table 4 continued
pH levels have remained stable over the years of monitoring.

23
Dissolved Oxygen
Dissolved oxygen (DO) is the small amount of oxygen gas dissolved in the water. It is essential for the
respiration of fish, aquatic animals, micro-organisms and plants, and without it they will die. Oxygen in water
comes primarily from diffusion across the water-air interface, and is increased by turbulent mixing of water
with air. In still or low flowing water, this transfer is slow however, in a fast flowing, turbulent waterway, the
oxygen transfer is considerably higher (Tiller and Newall, 2009). Oxygen in water can also be produced when
plants photosynthesise (Tiller and Newall, 2009). In healthy rivers, this contribution by plants is relatively
small, but in water bodies that are nutrient enriched, the plant productivity can be high, resulting in higher
levels of oxygen being produced (Tiller and Newall, 2009).
Bacteria and other micro-organisms utilise oxygen during the decay or breaking down of organic matter.
Increased amounts of organic matter results in increased amounts of oxygen required to complete the break
down process. This is known as oxygen demand, and if demand exceeds the supply, or uptake of oxygen,
then oxygen levels may fall significantly (Tiller and Newall, 2009).
Under most natural conditions, a waterway will be at least 80% saturation, although concentrations vary
depending on the time of day (Tiller and Newall, 2009). Plant respiration at night consumes oxygen, and plant photosynthesis during the day will produce oxygen. In nutrient rich (eutrophic) conditions, high numbers of
plants are respiring at night causing troughs in oxygen levels, and photosynthesis of these high numbers during
the day can cause very high dissolved oxygen concentrations, known as super saturation (Tiller and Newall, 2009). Levels above 110% indicate eutrophic conditions, and levels of 130% or more are almost certainly a
result of blooms of algae, or other aquatic plants (Tiller and Newall, 2009).
The breakdown of organic matter in a waterway is a natural occurrence as organic matter accumulates after
runoff. In a healthy water body the period of low oxygen levels is relatively short, as the water body quickly
processes the organic matter. Fish and other aquatic organisms are likely to be tolerant of low oxygen levels
for short periods. Most native fish in lowland rivers can tolerate levels as low as 50% saturation (approximately 5mg/L) for extended periods, and lower than this for short term periods (Tiller and Newall,
2009). Very low levels can cause formation of hydrogen sulphide, which is highly toxic to most native fish
species (Tiller and Newall, 2009).
So, to maintain a healthy and diverse aquatic ecosystem, the dissolved oxygen levels should ideally be
maintained at high levels. If the oxygen level falls, there will be reductions or losses in the more sensitive
aquatic species. At low oxygen levels, only a very few hardy species may be present. Therefore dissolved
oxygen levels are a useful indicator of general water quality. The State Environment Protection Policy –
Waters of Victoria environmental quality objectives for dissolved oxygen for rivers and streams in the
Goulburn Broken region suggests a 25th percentile of greater than or equal to 85 % saturation, and a
maximum of 110 % saturation.
Due to the photosynthesis and respiration cycle, regular monitoring should be carried out at a similar time of
day, and the time recorded. Oxygen levels are also affected by temperature, reducing as the water
temperature increases.
A dissolved oxygen test in mg/L tells us precisely how much oxygen is dissolved in water, but it does not
indicate how much dissolved oxygen the water is capable of holding at the temperature of the test. The
percentage saturation is a better measure of the availability of oxygen to aquatic organisms.
Major sources of oxygen demanding substances include sewage effluent, stormwater runoff, septic tank
discharges, leaf litter, and aquatic plant material.

24
Dissolved Oxygen in Ryans and Holland Creeks
Some sites in Ryans and Holland Creeks have been monitored by Waterwatch for dissolved oxygen since 2007.
The below summarises the data collected.
Site
Code Site Description
Dissolved Oxygen MEDIANS (% Saturation/concentration mg/L)
2007 2008 2009 2010
HOL001 Holland Creek at Tolmie - 88/9.2 84/9.2 -
HOL002 Holland Creek at Fords Bridge - 89/8.9 - -
HOL003 Holland Creek at Dodds Bridge - 95/9.7 96/9.5 -
HOL004 Holland Creek U/S Tatong at “Riverview” 96/8.6 86/9.2 - -
HOL010 Holland Creek at Tatong Bridge 90/7.8 70/6.9 - -
HOL012 Holland Creek at Benalla- Tatong Road
(Samaria Road) 84/9.2 55/5.5 - -
RYA001 Ryans Creek at Madhouse Road - 89/9.7 - -
RYA003 Ryans Creek at "Tinnaroo" 96/8.4 92/9.3 - -
RYA010 Ryans Creek and Rogash Road 96/8.5 94/8.8 87/8.6 -
WBX010 Watchbox Creek at O'Dea’s 95/10.1 - 94/9.7 -
RYA017 Ryans Creek at Kilfeera driveway bridge 95/9.7 98/8.4 - -
RYA019 Ryans Creek at Warilya at Gunns Road 94/9.6 88/8.8 - -
SAM010 Sam Creek at Gunns Road 49/4.9 71/7.0 66/6.7 -
RYA020 Ryans Creek at confluence with Sam
Creek 90/8.3 89/9.1 87/9.9 67/6.1
HOL020 Holland Creek at Sherwills Bridge Benalla 60/6.2 42/4.2 - -
Annual Rainfall Total (mm) BoM Killanoola Station (82109)
604 495 555 1074
Low
Table 5
There are no Waterwatch ratings for medians for Dissolved Oxygen (DO) as used for the other
parameters in this report.
There are the State Environment Protection Policy – Waters of Victoria (SEPP) environmental quality
objectives for dissolved oxygen for rivers and streams in the Goulburn Broken region.
SEPP suggests a 25th percentile of greater than or equal to 85 % saturation, and a maximum of 110
% saturation.
Scientific studies suggest that 4.5 mg/L of dissolved oxygen (DO) is the minimum amount that will
support a large and diverse fish population. The DO level in good fishing waters generally averages
about 9 mg/L, and when DO levels drop below about 3 mg/L, even the hardy fish will not survive.
Based on these figures, most sites monitored for Dissolved Oxygen saturation over the last four years
have reasonable median results.
Further dissolved oxygen percentiles can be seen in comparison with the SEPP Guidelines in Table 8 of this
report.

25
Phosphorus
Phosphorus is a nutrient that occurs naturally at low concentrations in water and it is essential for all forms of
life. It comes from processes like the weathering of rocks (inorganic phosphorus) and from the decomposition of
organic matter such as plant litter (organic phosphorus).
Other sources of phosphorus entering river systems include:
Organic material from animals such as waste and decaying tissue
Wastewater treatment plants
Stormwater runoff
Runoff or discharge from intensive agricultural or dairy industry
Forest runoff
Phosphorus is one of the nutrients required by aquatic plants and animals, however it is often the one in
shortest supply, therefore limiting plant growth. If phosphorus levels are high enough they can contribute to
algal blooms and excessive growth of aquatic plants. This can result in smothering of aquatic habitat, and also
cause severely high oxygen peaks and low oxygen troughs due to excess photosynthesis during the day, and
respiration at night. These extreme highs and lows can be enough to severely stress or kill stream fauna (Tiller
and Newall, 2009).
There can be seasonal variation in phosphorus levels. High flows generally result in higher phosphorus
concentrations, as runoff carries sediment containing phosphorus into waterways. As for turbidity, bushfire and
resultant devastation of riparian, and other, vegetation can result in extremely high levels of phosphorus. This
is due to the massive sediment and ash inputs to the waterways after storm events.
Nutrients in waterways (particularly phosphorus) became an important parameter to monitor when deciding the
quality of water in a waterway when the Water Quality Strategy was produced for the Goulburn Broken
Catchment. Phosphorus is also a parameter included in the chemical sub-index as part of the Victorian Index of
Stream Condition (ISC) rating system for measuring the condition of a waterway.
Total phosphorus is used rather than soluble (reactive) phosphorus, as it includes all forms of phosphorus
present in a waterway rather than the soluble component. It will generally increase from headwaters to the
lower part of a waterway.

26
Phosphorus in the Ryans and Holland Creeks
Holland Creek at Benalla has been monitored for Total Phosphorus by Waterwatch and Volunteer monitors since 1997, and Holland Creek at Emu Bridge has been
monitored since 2004. Due to restraints on time and resources, Goulburn Broken Waterwatch now only monitors the most downstream site of a waterway for Total
Phosphorus. The table and graph below summarise the data collected.
Site
Code Site Description
Total Phosphorus MEDIANS (µg/L)
1996 1997 1998 1999 2000 2001 2002 2003 2004 2005 2006 2007 2008 2009 2010
HOL001 Holland Creek at
Tolmie - - - - - - - - - - - - - 30 -
HOL003 Holland Creek at
Dodd’s Bridge - - - - - - - - - - - - - 20 -
WBX010 Watchbox Creek at
O'Dea’s - - - - - - - - - - - - - 20 -
SAM010 Sam Creek at Gunn’s
Road - - - - - - - - - - - - - 400 -
RYA020
Ryans Creek at
confluence with Sam Creek
- - - - - 40 - - - - - 70 30 40 -
HOL015 Holland Creek at Emu
Bridge - - - - - - - - - 50 - 20 20 80 -
HOL020
Holland Creek at
Sherwills Bridge
Benalla
- - 50 - 80 - - - - - - 50 35 80 -
BRO055
Broken River at
Faithfull Street Benalla
60 50 70 100 100 90 90 80 - 70 - 40 40 60 80
Annual Rainfall Total (mm) BoM Killanoola Station
(82109)
837 447 614 716 770 596 457 - 623 855 - 604 495 555 1074
Ratings for the Mountains, Valleys and Plains– <10 µg/L Excellent, <25 µg/L Good, <50 µg/L Fair, <100 µg/L Poor, >100 µg/L Degraded
Table 6
There were insufficient samples collected in the Ryans and Holland Creeks and their tributaries during 2010 to calculate representative medians.

27
State Environment Protection Policy (SEPP) Compliance
The State Environment Protection Policy (SEPP) Waters of Victoria (WoV) water quality objectives identify the
„ideal‟ result range for environmental data at a particular location in a waterway. If a site fails a SEPP objective
for one parameter, it indicates a possible problem for the whole system, not just for the one parameter and not
just for the one site). It is recommended that an ecological risk assessment (ERA) be undertaken to determine
if there is a risk to the values (or “beneficial uses”) associated with that stream.
Basically, any set of results that fails the objective is a red flag to look more closely at what‟s going on. This
differs from aiming for a particular turbidity or total phosphorus result, as an ERA may determine that it is
acceptable to exceed the SEPP objectives for some parameters depending on the use/value of the waterway.
Figure 8: Goulburn Broken Catchment Management Authority - SEPP (WoV) segments
(EPA,2003).

28
State Environmental Protection Policy (Waters of Victoria) Environmental Quality Objectives for Rivers and Streams – water quality
The State Environment Protection Policy (Waters of Victoria) segment and objectives applicable within the Goulburn Broken CMA region for the tests of relevance to
the Ryans and Holland Creeks are shown in Table 7. This table has been reproduced from the State Environment Protection Policy Waters of Victoria (Victorian
Environment Protection Authority 2003).
SEGMENT
INDICATOR
Total
phosphorus
(ug/L)
Total nitrogen
(ug/L)
Dissolved oxygen % saturation
Turbidity
(NTU)
Electrical conductivity
(uS/CM)
pH
(pH units)
75th
percentile
75th
percentile
25th
percentile maximum
75th
percentile
75th
percentile
25th
percentile
75th
percentile
Cleared Hills and Coastal Plains
mid-reaches of Ovens, Goulburn and
Broken catchments ≤25 ≤600 ≥85 110 ≤10 ≤500 ≥6.4 ≤7.7
Delatite River at Tonga Bridge ≤25 ≤500 ≥85 110 ≤10 ≤500 ≥6.4 ≤7.7
Goulburn River at Eildon ≤25 ≤600 ≥85 110 ≤10 ≤500 ≥6.4 ≤7.7
Table 7
Note: SEPP objectives are long term theoretical goals for water quality. It is not expected that waterways will comply at this stage

29
2010 results in Ryans and Holland Creeks and their tributaries (Table 8) to be compared to SEPP objectives– water quality (Table 7)
FAIL
Table 8
When comparing with SEPP objectives, three quarters of the readings taken should fall below the 75th percentile.
Both sites monitored for total phosphorus in 2010 exceed the SEPP objective of 25 µg/L.
With the exception of Ryans Creek at “Tinaroo” (RYA003), all sites continue to exceed the SEPP objective of less than or equal to 10 NTU for
turbidity.
Electrical conductivity and pH results are all within the SEPP guidelines. This is excellent considering that SEPP objectives are long term
theoretical goals for water quality.
It is not expected that waterways will comply with all objectives at this stage.
SEGMENT
INDICATOR
Total
phosphorus
(ug/L)
Dissolved oxygen
% saturation
Turbidity
(NTU)
Electrical
conductivity
(uS/CM)
pH
(pH units)
75th percentile
25th percentile
maximum 75th percentile
75th percentile
25th percentile
75th percentile
RYA003 Ryans Creek at "Tinnaroo" 5 50
RYA010 Ryans Creek and Rogash Road 18 69
WBX010 Watchbox Creek at O'Dea‟s 12 108
RYA017 Ryans Creek at Kilfeera driveway
bridge 26 136
SAM005 Sam's Creek at Molyullah-Tatong Rd 54 133
RYA020 Ryans Creek at confluence with Sam
Creek 80* 55 138 40 220 6.7 6.9
BRO055 Broken River at Faithfull Street
Benalla 110 78 91 45 161 6.9 7.1

30
Macro-invertebrates in Ryans Creek
Why do a Macro-invertebrate Survey?
Macro-invertebrates are animals without backbones that live at least a part of their life in water.
One reason for studying macro-invertebrates (or waterbugs) is that they can be useful
indicators of the ecological health of freshwater habitats. Some aquatic invertebrates are
more tolerant to pollution than others. If a stream is polluted, tolerant bugs will usually be found in larger numbers than
the intolerant or sensitive ones. However, if a habitat is close to pristine, or in its
natural state, tolerant types of bugs will be found alongside the more sensitive bugs
which will be in equal or greater numbers than the tolerant.
Sites and habitats within the Ryans Creek were assessed against the SEPP WoV biological
objectives (State Environmental Protection Policy – Waters of Victoria), biological objectives
for Cleared Hills and Coastal Plains (B4).
Site:
1. Upper Ryans Creek above Loombah Reservoir – Waterwatch code RYA050.
Separate assessments are made for riffle and edge habitats. In order to make a complete and
accurate assessment of a site, the biological samples must be collected in both autumn and
spring, and the invertebrate data from both seasons combined in the calculation of the
indices.
The indicators used to assess the health of the waterway are;
Number of Families. The number of invertebrate families found at a site can give a reasonable representation of
the ecological health of a stream as healthy streams generally have more families. The
Number of Families index is calculated by simply summing the total „families‟ of invertebrates
present at a site.
The SIGNAL biotic index.
SIGNAL (Stream Invertebrate Grade Number- Average Level) is an index of water quality
based on the tolerance of aquatic biota to pollution (Chessman 1995). It is calculated by
summing together the sensitivity grades of each of the families found at a site that have been assigned a sensitivity grade, and then by dividing by the number of graded families present.
The output is a single number, between zero and ten, reflecting the degree of water pollution.
The EPT biotic index The EPT index is the total number of families in the generally pollution sensitive insect orders
of Ephemeroptera (mayflies), Plecoptera (stoneflies) and Trichoptera (caddisflies). It is
calculated by summing together the number of families in these three orders present at a
site. Any loss of families in these groups usually indicates disturbance.
Key Invertebrate Families
This index focuses mainly on the loss of key taxa that are indicative of good habitat and water
quality. To calculate the Key Families index, simply compare the list of families present at a
site with the appropriate list of key families as specified in the State Environmental Protection Policy (Waters of Victoria). The key families score is the total number of these
key families present at a site.

31
1. Results The objectives for biological indicators of environmental quality are given for each of the
biological regions and habitats covered by this report. To meet objectives, sites assessed
must return values equal to or greater than the values given in Table 9.
All three objectives should be met in region B4 and failure to meet any one of the objectives
should trigger further investigation.
Table 9 Objectives for biological indicators of environmental quality as listed in the SEPP WoV (Victorian Environmental Protection Authority 2003)
Indicators
Region & Habitat
No of Families SIGNAL
index score
Key families
combined habitat
B4 riffle 23 5.5 22
B4 edge 26 5.5 22
Table 10 Biotic indices results for one site in the Goulburn Broken Waterwatch Program in
2008, 2009 and 2010, assessed against SEPP WoV objectives for biological indicators of
environmental quality. Site code/
year
Site location Biological
Region
Habitat Number
of families
score
SIGNAL
index
score
Key families
Combined
Habitat
score
Site
Pass
Fail
2008
Upper Ryan’s Creek
above Loombah
Reservoir
B4 Riffle 22 6.0 29 Fail
2009
Upper Ryan’s Creek
above Loombah
Reservoir
B4 Riffle 24 6.3 30 Pass
2010
Upper Ryan’s Creek
above Loombah
Reservoir
B4 Riffle 29 6.5 28 Pass
2008
Upper Ryan’s Creek
above Loombah
Reservoir
B4 Edge 25 6.1 29 Fail
2009
Upper Ryan’s Creek
above Loombah
Reservoir
B4 Edge 32
6.0 30 Pass
2010
Upper Ryan’s Creek
above Loombah
Reservoir
B4 Edge 31 6.0 28 Pass
Fail
N/O - No objective set for that indicator in that SEPP (WoV) region
2. Discussion Upper Ryans Creek has improved from marginally failing the SEPP biological objectives for both
the riffle and edge samples in 2008 to continuing to comfortably pass all three parameters for
both types of samples in 2010.
The biological objectives for the riffle sample have in 2010, as in 2009, maintained levels well above the minimum standards required for all three parameters (Number of Families, SIGNAL
SCORE and Key Families Index), for the desired objectives for a healthy waterway.
The edge habitat easily passed all three SEPP biological objectives in 2010 (Number of Families, SIGNAL score and Key Families).
A comprehensive macro-invertebrate report is available by contacting Goulburn Broken Waterwatch on phone 5832 0460, or by email to [email protected] .

32
Summary for Ryans and Holland Creeks
Results for the Ryans and Holland Creek in 2010 show that;
The majority of sites monitored for turbidity continue to fail to meet SEPP objectives.
All sites meet SEPP objectives for Electrical conductivity, which is excellent
considering these are long term theoretical goals.
pH results for are excellent, and all sites tested meet guidelines.
Dissolved oxygen levels are low at those sites tested when compared with the SEPP
objectives.
Macro-invertebrates passed at the Ryans Creek site when assessed against SEPP WoV
objectives for biological indicators of environmental quality. Holland Creek is not sampled for
macro-invertebrates.
Many sites that were previously monitored were unable to be tested in 2010. It is recommended that at
least the most downstream site of a waterway be monitored regularly in order to collect baseline data of
waterways contributing to their receiving waterways.
These results have so far been distributed to
Goulburn Broken Catchment Management Authority
Waterwatch State Office
DSE

33
References
EPA (2003) Goulburn Broken Catchment Management Authority SEPP (WoV) Segments and
environmental quality objectives. Environment Protection Authority, Macleod.
GBCMA (2005). Regional River Health Strategy 2005-2015. Goulburn Broken Catchment Management
Authority, Shepparton.
GBCMA (2005). Regional River Health Strategy 2005-2015. Status of the Riverine System – Regional
Overview. Goulburn Broken Catchment Management Authority, Shepparton.
Tiller, D. and Newall, P. (2009). Interpreting River Health Data – Waterwatch Victoria. Mulqueen Printers
Pty Ltd.
Glossary
DO Dissolved Oxygen – a measure of the concentration of oxygen in the water
EC Electrical Conductivity – measures the flow of electricity in a solution in µS/cm EPA Environment Protection Authority
EPT Ephemeroptera, Plecoptera and Trichoptera
GBCMA Goulburn Broken Catchment Management Authority ISC Index of Stream Condition
Median Numbers in a series are sorted into ascending order, and the middle number is
the median Mean Average calculated by adding all data points and dividing by the number of data
points
pH Acidity or alkalinity of the water – 0 being acidic, 14 being alkaline
Photosynthesis Process where plants produce oxygen during daylight hours Respiration Process where plants consume oxygen during non daylight hours
RRHS Regional River Health Strategy
SEPP State Environment Protection Policy SIGNAL Stream Invertebrate Grade Level
Turbidity A measure of the clarity of water, measured in NTU

34
Appendix A
Ryans and Holland Creek Report For Samples from 01 Jan 2010 to 31 Dec 2010
SiteNo: BLI010 Blind Creek on Samaria Road Parameters: Temp TPhos pH Turb Rainfall Flow EC % O2 Sat Date: Time: Sample Type: ° C mg/L P pH Units NTU mm ML/day µS/cm % 10-Mar-10 10:40 AM 24.4 dry 02-Nov-10 8:40 AM Grab 14.5 6.7 14 27 med 210 44
SiteNo: BLI015 Blind Creek at Knights Rd Parameters: Temp TPhos pH Turb Rainfall Flow EC % O2 Sat Date: Time: Sample Type: ° C mg/L P pH Units NTU mm ML/day µS/cm % 02-Nov-10 9:20 AM Grab 14.3 6.9 21 27 med 297 77
SiteNo: BRO055 Broken River after Benalla at Pump station in Faithful St. Parameters: Temp TPhos pH Turb Rainfall Flow EC % O2 Sat Date: Time: Sample Type: ° C mg/L P pH Units NTU mm ML/day µS/cm % 13-Jan-10 11:15 AM Grab 24.1 0.05 6.8 14 med 161 53 18-Feb-10 4:00 PM Grab 25.5 7.3 22 2 NNF 201 78 17-Mar-10 4:50 PM Grab 22 0.11 7.1 36 0 NNF 131 74 23-Apr-10 2:20 PM Grab 18.3 0.06 6.9 45 0 high 172 89 20-May-10 4:30 PM Grab 10.3 7.0 26 steady 148 91 17-Jun-10 4:25 PM Grab 9.7 7.3 50 normal 113 89 23-Sep-10 3:15 PM Grab 14.8 0.06 7.1 44 fast 109 89 03-Nov-10 3:25 PM Grab 18.1 0.14 6.4 65 27 high 97 85 16-Dec-10 5:00 PM Grab 22 0.1 7.0 45 0 hifast 101 91
SiteNo: HOL001 Holland Creek at Tolmie Parameters: Temp TPhos pH Turb Rainfall Flow EC % O2 Sat Date: Time: Sample Type: ° C mg/L P pH Units NTU mm ML/day µS/cm % 13-Jan-10 9:10 AM Grab 19.1 6.7 10 0 steady 42 68 18-Feb-10 1:20 PM Grab 19.9 7.3 22 2 NNF 41 85 10-Mar-10 4:15 PM Grab 15.4 7.1 38 22 normal 32 80 02-Nov-10 11:15 AM Grab 11.1 7.0 16 55 hifast 36 84
SiteNo: HOL002 Holland Creek at Fords Bridge Parameters: Temp TPhos pH Turb Rainfall Flow EC % O2 Sat Date: Time: Sample Type: ° C mg/L P pH Units NTU mm ML/day µS/cm % 10-Mar-10 3:30 PM Grab 16.8 7.4 19 24.4 high 48 85 02-Nov-10 10:20 AM Grab 11.4 7.4 25 27 hifast 44 92
Report Date: 25 Aug 2011Field60: 1 of 6 Pages.

35
Waterwatch Victoria Application (WVA) - Site Report
SiteNo: HOL003 Holland Creek at Dodds Bridge Parameters: Temp TPhos pH Turb Rainfall Flow EC % O2 Sat Date: Time: Sample Type: ° C mg/L P pH Units NTU mm ML/day µS/cm % 13-Jan-10 8:25 AM Grab 22.1 6.5 3.9 0 mediu 94 71 18-Feb-10 12:40 PM Grab 22.6 7.4 10 2 NNF 87 84 10-Mar-10 3:15 PM Grab 17.5 7.3 21 24.4 high 61 84 02-Nov-10 10:05 AM Grab 11.9 7.3 25 27 hifast 48 92
SiteNo: HOL010 Holland Creek at Tatong Bridge Parameters: Temp TPhos pH Turb Rainfall Flow EC % O2 Sat Date: Time: Sample Type: ° C mg/L P pH Units NTU mm ML/day µS/cm % 10-Mar-10 3:00 PM Grab 18.4 7.3 22 24.4 normal 66 83 02-Nov-10 9:45 AM Grab 12.0 7.3 26 27 hifast 53 93
SiteNo: HOL012 Holland Creek Benalla-Tatong Rd (Samaria Rd) Parameters: Temp TPhos pH Turb Rainfall Flow EC % O2 Sat Date: Time: Sample Type: ° C mg/L P pH Units NTU mm ML/day µS/cm % 02-Nov-10 9:30 AM Grab 13.1 7.2 60 27 hifast 58 88 SiteNo: HOL015 Holland Creek at Emu Bridge Road Parameters: Temp TPhos pH Turb Rainfall Flow EC % O2 Sat Date: Time: Sample Type: ° C mg/L P pH Units NTU mm ML/day µS/cm % 10-Mar-10 10:50 AM Grab 17.5 6.7 57 24.4 high 99 61 13-Apr-10 3:05 PM Grab 15.8 7.1 32 1.3 normal 122 124 02-Nov-10 8:50 AM Grab 14.2 7.2 65 27 hifast 65 85
SiteNo: HOL020 Holland Creek at Sherwills Bridge Benalla Parameters: Temp TPhos pH Turb Rainfall Flow EC % O2 Sat Date: Time: Sample Type: ° C mg/L P pH Units NTU mm ML/day µS/cm % 10-Mar-10 10:30 AM Grab 18.9 0.16 6.2 54 24.4 high 178 43 13-Apr-10 4:30 PM Grab 16.8 0.04 7.3 29 1.3 normal 111 122 02-Nov-10 8:30 AM Grab 14.7 0.1 6.4 83 27 hifast 77 79
Report Date: 25 Aug 2011Field60: 2 of 6 Pages.

36
Waterwatch Victoria Application (WVA) - Site Report
SiteNo: RYA001 Ryans Creek at Madhouse Road Parameters: Temp TPhos pH Turb Rainfall Flow EC % O2 Sat Date: Time: Sample Type: ° C mg/L P pH Units NTU mm ML/day µS/cm % 10-Mar-10 3:45 PM Grab 14.6 7.6 7 24.4 normal 31 84 02-Nov-10 10:45 AM Grab 10.4 7.2 6 55 hifast 29 84
SiteNo: RYA003 Ryans Creek at 'Tinnaroo' Parameters: Temp TPhos pH Turb Rainfall Flow EC % O2 Sat Date: Time: Sample Type: ° C mg/L P pH Units NTU mm ML/day µS/cm % 25-Jan-10 9:30 AM Grab 21 4 6 50 10-Mar-10 1:30 PM Grab 20.5 7.0 6 24.4 normal 52 78 24-Mar-10 8:00 AM Grab 15.4 3 0 3.5 50 13-Apr-10 1:40 PM Grab 18.9 7.4 2 1.3 normal 66 134 26-Apr-10 2:00 PM Grab 15.8 3 41 HF 50 25-May-10 10:30 AM Grab 12.8 3 36 rising 40 23-Jul-10 5:00 PM Grab 10.8 5 16 40 27-Aug-10 12:00 PM Grab 7.3 32 16 40 25-Sep-10 11:00 AM Grab 13.8 5 0 8 40 28-Oct-10 2:30 PM Grab 19.4 5 8 40 02-Nov-10 12:00 PM Grab 15.5 7.5 15 high 36 91 21-Nov-10 10:00 AM Grab 19.1 <5 0 10 40 23-Dec-10 11:00 AM Grab 19 5 8 40
SiteNo: RYA010 Ryans Creek and Rogash Road Parameters: Temp TPhos pH Turb Rainfall Flow EC % O2 Sat Date: Time: Sample Type: ° C mg/L P pH Units NTU mm ML/day µS/cm % 26-Jan-10 5:10 PM 0 NF1 23-Feb-10 2:15 PM Grab 21.8 130 10.4 10-Mar-10 2:25 PM Grab 20.1 7.1 12 24.4 normal 144 82 24-Mar-10 10:20 AM Grab 17.4 12 0 falling 160 13-Apr-10 2:15 PM Grab 16.7 7.9 5 1.3 normal 94 140 28-May-10 9:45 AM Grab 12.1 2.4 36 steady 60 26-Jun-10 8:30 AM Grab 8.7 18 16 steady 60 24-Jul-10 9:30 AM Grab 7.3 15 0 steady 60 25-Aug-10 9:30 AM Grab 8.6 30 7.7 rising 50 26-Sep-10 8:45 AM Grab 11.6 15 0 steady 50 25-Oct-10 10:25 AM Grab 15.7 17 3.3 steady 50 02-Nov-10 1:15 PM Grab 18 7.5 19 27 fast 44 91 22-Nov-10 12:00 PM Grab 22.2 15 0 steady 50 22-Dec-10 11:30 AM Grab 17.0 17 0 rising 50
Report Date: 25 Aug 2011Field60: 3 of 6 Pages.

37
Waterwatch Victoria Application (WVA) - Site Report
SiteNo: RYA017 Ryans Creek at 'Kilfeera' driveway bridge Parameters: Temp TPhos pH Turb Rainfall Flow EC % O2 Sat Date: Time: Sample Type: ° C mg/L P pH Units NTU mm ML/day µS/cm % 24-Feb-10 8:00 AM Grab 16.5 25 2 light 160 10-Mar-10 11:50 AM Grab 17.9 7.0 35 24.4 high 136 72 27-Mar-10 10:00 AM Grab 19.7 50 0 low 190 13-Apr-10 2:20 PM Grab 16.6 6.9 22 1.3 normal 153 159 22-Apr-10 4:00 PM Grab 19.8 18 0 120 21-Jun-10 8:00 AM Grab 9.4 17 6 steady 60 26-Jul-10 2:00 PM Grab 9.3 19 0 steady 80 22-Aug-10 10:00 AM Grab 8.6 26 2.5 high 80 27-Sep-10 10:00 AM Grab 13.2 13 0 high 70 23-Oct-10 9:00 AM Grab 17.6 14 2 normal 80 02-Nov-10 1:50 PM Grab 15.1 7.4 26 27 hifast 55 89 23-Nov-10 10:00 AM Grab 22.9 19 0 normal 60 20-Dec-10 11:40 AM Grab 13.8 36 23 rising 80
SiteNo: RYA019 Ryan's Creek at 'Warilya' at Gunn's Road Parameters: Temp TPhos pH Turb Rainfall Flow EC % O2 Sat Date: Time: Sample Type: ° C mg/L P pH Units NTU mm ML/day µS/cm % 10-Mar-10 11:00 AM Grab 17.6 6.7 43 24.4 high 130 70 13-Apr-10 3:45 PM Grab 15.9 7.2 17 1.3 normal 164 150 02-Nov-10 2:00 PM Grab 15.5 7.1 39 27 hifast 59 93
SiteNo: RYA020 Ryans Creek at confluence with Sam's Creek at Gunn's Rd. Parameters: Temp TPhos pH Turb Rainfall Flow EC % O2 Sat Date: Time: Sample Type: ° C mg/L P pH Units NTU mm ML/day µS/cm % 13-Jan-10 7:50 AM Grab 20.6 0.02 5.6 16 0 stagna 156 9.3 18-Feb-10 11:50 AM Grab 21.5 6.7 25 2 NNF 275 55 10-Mar-10 11:15 AM Grab 16.7 0.12 6.8 48 24.4 high 174 67 13-Apr-10 2:50 PM Grab 15.5 <0.02 7.2 17 1.3 normal 168 138 20-Apr-10 10:00 AM Grab 19 35 0 stagna 420 12-Aug-10 3:30 PM Grab 15 60 40 flood 80 16-Sep-10 10:45 AM Grab 11.7 30 steady 190 02-Oct-10 12:00 PM Grab 14.5 20 steady 250 02-Nov-10 2:10 PM Grab 15.8 0.06 6.9 38 27 hifast 61 90 08-Nov-10 12:30 PM Grab 21 40 steady 180 14-Dec-10 5:00 PM Grab 22 40 steady 160 Report Date: 25 Aug 2011Field60: 4 of 6 Pages.

38
Waterwatch Victoria Application (WVA) - Site Report
SiteNo: RYA050 Ryans Creek 1 km upstream Loombah Weir - macroinvertebrate site Parameters: Temp TPhos pH Turb Rainfall Flow EC % O2 Sat Date: Time: Sample Type: ° C mg/L P pH Units NTU mm ML/day µS/cm % 13-Apr-10 11:00 AM Grab 13.2 7.2 3 0 normfa 73 128 29-Nov-10 11:30 AM Grab 22.5 6.2 8 fast 34 88
SiteNo: RYA101 Ryans Creek at Dick's Landing Rd, US of RYA001 Parameters: Temp TPhos pH Turb Rainfall Flow EC % O2 Sat Date: Time: Sample Type: ° C mg/L P pH Units NTU mm ML/day µS/cm % 10-Mar-10 4:00 PM Grab 13.4 7.3 8 24.4 normal 28 75 02-Nov-10 11:00 AM Grab 9.4 6.9 5.5 55 hifast 26 83
SiteNo: SAM005 Sam's Creek at Molyullah-Tatong Rd Parameters: Temp TPhos pH Turb Rainfall Flow EC % O2 Sat Date: Time: Sample Type: ° C mg/L P pH Units NTU mm ML/day µS/cm % 10-Mar-10 2:45 PM Grab 20 6.5 73 24.4 low 135 70 20-Apr-10 10:00 AM 0 dry 12-Aug-10 3:00 PM Grab 9.8 90 40 flood 150 16-Sep-10 11:00 AM Grab 12 20 steady 110 02-Oct-10 12:00 PM Grab 16 20 steady 130 02-Nov-10 12:00 PM Grab 16.5 7.1 27 27 lofast 88 95 08-Nov-10 5:00 PM Grab 22.5 20 steady 100 14-Dec-10 2:00 PM Grab 22 35 steady 100
SiteNo: SAM010 Sam's Creek at Gunn's Road Parameters: Temp TPhos pH Turb Rainfall Flow EC % O2 Sat Date: Time: Sample Type: ° C mg/L P pH Units NTU mm ML/day µS/cm % 13-Jan-10 8:00 AM 0 dry 18-Feb-10 12:00 PM Grab 23.8 6.7 45 2 NNF3 446 28 10-Mar-10 11:25 AM Grab 17.2 6.7 54 24.4 normal 308 41 13-Apr-10 2:35 PM Grab 17.8 6.9 23 0 slow 427 84 03-Nov-10 2:15 PM Grab 17.4 0.11 6.8 56 high 133 82
Report Date: 25 Aug 2011Field60: 5 of 6 Pages.

39
Waterwatch Victoria Application (WVA) - Site Report
SiteNo: WBX010 Watchbox Crk at O'Deas Parameters: Temp TPhos pH Turb Rainfall Flow EC % O2 Sat Date: Time: Sample Type: ° C mg/L P pH Units NTU mm ML/day µS/cm % 13-Jan-10 7:55 AM 0 dry 26-Jan-10 5:20 PM 0 NF1 18-Feb-10 12:25 PM 2 dry 23-Feb-10 2:30 PM dry 10-Mar-10 2:35 PM Grab 19.1 7.2 8 24.4 normal 89 78 24-Mar-10 10:35 AM Grab 17.3 8 0 stagna 120 13-Apr-10 2:15 PM 1.3 nosam 28-May-10 10:00 AM Grab 36 stagna nosam 26-Jun-10 8:45 AM Grab 9.2 <10 16 stagna 110 24-Jul-10 9:15 AM Grab 8.2 10 0 stagna 110 25-Aug-10 9:45 AM Grab 8.2 25 7.7 steady 80 26-Sep-10 9:00 AM Grab 12.4 10 0 falling 80 25-Oct-10 10:40 AM Grab 16.6 11 3.3 falling 100 02-Nov-10 1:30 PM Grab 16 0.03 7.5 15 27 hifast 67 94 22-Nov-10 12:15 PM Grab 22.8 11 0 falling 100 22-Dec-10 11:45 AM Grab 16.9 12 0 steady 100 Report Date: 25 Aug 2011Field60: 6 of 6 Pages.