Embed Size (px)
Citation preview

1
Lesson 4: Assessing Values at Risk of Wildfire within the Wildland Fire Decision Support System (WFDSS)
S-495Unit 8: Long-term Geospatial Fire Analysis using FSPro
Welcome to Unit 8 Lesson 4: Assessing Values at Risk of Wildfire within the Wildland Fire Decision Support System (WFDSS). This lesson will take approximately 1 hour to complete and has no associated exercise. The intended goal of this lesson is to familiarize you with Rapid Assessment of Values-at-Risk (RAVAR) products and how they relate to the probability output from the FSPro model.
1

2
Lesson 4 ObjectivesLesson 4 Objectives
Demonstrate familiarity with the applications of RAVAR Demonstrate familiarity with the applications of RAVAR and how it is integrated with the WFDSSand how it is integrated with the WFDSSExamine and identify the various components of Tier I Examine and identify the various components of Tier I and II RAVAR productsand II RAVAR productsUnderstand limitations of risk and value assessment in Understand limitations of risk and value assessment in RAVAR productsRAVAR productsDemonstrate the application of strategic risk assessment Demonstrate the application of strategic risk assessment products to inform wildland fire decision makingproducts to inform wildland fire decision makingClaim beneficial fire effects using the WFDSSClaim beneficial fire effects using the WFDSS
Upon successful completion of this lesson, students will be able to:
Let’s go over the lesson objectives. Upon successful completion of this lesson, students will be able to:
1) Demonstrate familiarity with the applications of RAVAR and how it is integrated with the WFDSS;
2) Examine and identify the various components of Tier I and II RAVAR products;3) Understand the limitations of risk and value assessment in RAVAR products;4) Demonstrate the application of strategic risk assessment products to inform
wildland fire decision making; and 5) Claim beneficial fire effects using the WFDSS.
2

3
Lesson OutlineLesson Outline
RAVAR introductionRAVAR introductionHistory of RAVARHistory of RAVARWhat is risk?What is risk?Use of RAVAR in previous fire seasonsUse of RAVAR in previous fire seasonsResponse levelsResponse levelsWhich product is right for me?Which product is right for me?ExpectationExpectationRAVAR data and cooperating agenciesRAVAR data and cooperating agenciesBenefits of fire & claiming beneficial fire effectsBenefits of fire & claiming beneficial fire effectsSummarySummary
Let’s take a look at the lesson outline:
First we will introduce RAVAR and its history, discuss the concept of risk, and review the use of RAVAR in previous fire seasons. We will discuss the various response levels and review the appropriate value assessment products to meet the response level need. We will discuss how expectation factors into decision-making and how it is used to quantify risk. The lesson will introduce the various components of data used in RAVAR and the interagency cooperation goals of the WFDSS. Lastly, we will identify benefits of fire and discuss how to claim beneficial fire effects in the WFDSS. We will close with a summary of the lesson.
3

4
RAVAR IntroductionRAVAR Introduction
Rapid Assessment of ValuesRapid Assessment of Values--atat--Risk (RAVAR) is Risk (RAVAR) is the primary fire economics tool within the the primary fire economics tool within the Wildland Fire Decision Support System Wildland Fire Decision Support System (WFDSS).(WFDSS).RAVAR identifies the primary resource values at RAVAR identifies the primary resource values at risk of ongoing large fire eventsrisk of ongoing large fire eventsTypically integrated with the FSPro (Fire Spread Typically integrated with the FSPro (Fire Spread Probability) model to identify potential values Probability) model to identify potential values affectedaffected
Let’s get started.Rapid Assessment of Values-at-Risk (RAVAR) is the primary fire economics tool within the Wildland Fire Decision Support System (WFDSS). RAVAR was developed by the Rocky Mountain Research Station’s Missoula Forestry Sciences Lab. RAVAR identifies the primary resource values at risk of ongoing large fire events and is typically integrated with FSPro model output to identify the likelihood of different resources being affected in the potential fire path of an ongoing event. It can also be linked to any expected fire spread polygon.
RAVAR can help agency administrators, incident managers, and fire planners develop wildland fire suppression strategies by rapidly identifying and quantifying the significant resource values most likely to be at risk of an ongoing fire event. In the area command setting, RAVAR has been shown to be useful in prioritizing fires for assignment of scarce suppression resources. Additionally, RAVAR can help support the development of Long Term Implementation Plans (LTIP), and will be a critical component of the WFDSS as the system transitions to replace the Wildland Fire Situation Analysis in 2009.
4

5
RAVAR IntroductionRAVAR Introduction
Improved strategic risk assessment toolImproved strategic risk assessment toolProvides spatially explicit values at risk data Provides spatially explicit values at risk data linked to fire threat projections linked to fire threat projections
FSPro or other fire behavior modelsFSPro or other fire behavior modelsUser defined polygonsUser defined polygons
Value is identified in RAVAR Value is identified in RAVAR –– need more need more research to get value changeresearch to get value change
RAVAR is a strategic risk assessment tool and is not intended to be used for tactical decision making. The strength in this type of value assessment is that it is spatially explicit and links values data to fire threat projections, generally in the form of FSPro models. In addition to FSPro and other fire behavior models (such as FARSITE and FlamMap), user-defined hazard zones can be used. It is important to note, however, that these user-defined polygon assessments do not imply probability of fire spread and are used only as a limited hazard assessment. We will discuss these other assessment products in more detail later in the lesson.
RAVAR identifies values at risk of wildfire, but more research is needed to understand value change – that is, high risk does not always imply value lost.
5

6
How RAVAR currently works…How RAVAR currently works…
In WFDSS:In WFDSS:Incident createdIncident createdFSPro model output generatedFSPro model output generatedRAVAR orderedRAVAR orderedFSPro model output downloaded from siteFSPro model output downloaded from siteRAVAR analysis performed onsite in MissoulaRAVAR analysis performed onsite in MissoulaFinished map and report uploaded to WFDSSFinished map and report uploaded to WFDSS
Let’s look at how RAVAR currently works. In WFDSS, an incident is created and FSPro model output is generated. A requesting analyst will order a RAVAR report and specify which FSPRo run should be used to perform the values assessment. The FSPro model output is downloaded from the WFDSS site and the RAVAR analysis is performed onsite in Missoula (to be automated within WFDSS in 2009). When the analysis is complete, the finished map and report are uploaded to the system and the FSPro model used is tagged along with the RAVAR analysis.
6

77
History of RAVARHistory of RAVAR
Numerous FSPro Analysts trained and working Numerous FSPro Analysts trained and working with web application with web application Over 100 RAVAR reports delivered in each of Over 100 RAVAR reports delivered in each of 2007 and 2008 fire seasons2007 and 2008 fire seasonsActive involvement with Area Command in Active involvement with Area Command in California, Montana, and Central IdahoCalifornia, Montana, and Central Idaho
Early demonstrations of value assessment performed by the RAVAR team showed the importance of values at risk in assessing suppression expenditures and developing strategic suppression strategies. In 2005, the RAVAR prototype was initially tested with increased testing and prototype applications delivered during the 2006 and 2007 seasons. New products and modifications were delivered in the 2008 season, and numerous FSPro analysts have been trained and are currently working with the web application. During the active fire seasons of 2007 and 2008, over 100 RAVAR reports were delivered each year through the web-based WFDSS to fire events in real time.

88
What is Risk?What is Risk?
Threat Threat –– historical management has had a reactionary historical management has had a reactionary response to fire threatresponse to fire threatRisk = probability of an event occurring (threat) × impact Risk = probability of an event occurring (threat) × impact of event occurring (values)of event occurring (values)Commonly confused terms:Commonly confused terms:
Threat = Source of possible damage or loss (fire is the object Threat = Source of possible damage or loss (fire is the object of of threat)threat)Hazard = Potential for damage or loss (the fire has potential fHazard = Potential for damage or loss (the fire has potential for or causing damage or loss)causing damage or loss)Risk = Probability that loss will occur (the likelihood of fireRisk = Probability that loss will occur (the likelihood of firecausing value change in terms of benefit and loss)causing value change in terms of benefit and loss)
In this lesson, the word “risk” will come up often. So let’s take a moment to look at the definitions of risk and develop a more complete understanding of risk in the context of wildfire decision making. In addition to risk, the terms “hazard” and “threat” must also be defined. The following summary may clarify these commonly confused terms:THREAT equals the source of possible damage or loss (fire is the object of threat)HAZARD equals the potential for damage or loss (the fire has potential for causing damage or loss)RISK equals the probability that loss will occur (or the likelihood of fire causing value change in terms of benefit and loss)
Historically, fire management has been threat-based rather than risk-based. The consideration of risk in decision making, however, allows for a probabilistic quantification of threat intersected with value change. In other words, risk is not just the “oh no,” but it is focused on the “so what?”.
99
What is Risk?What is Risk?
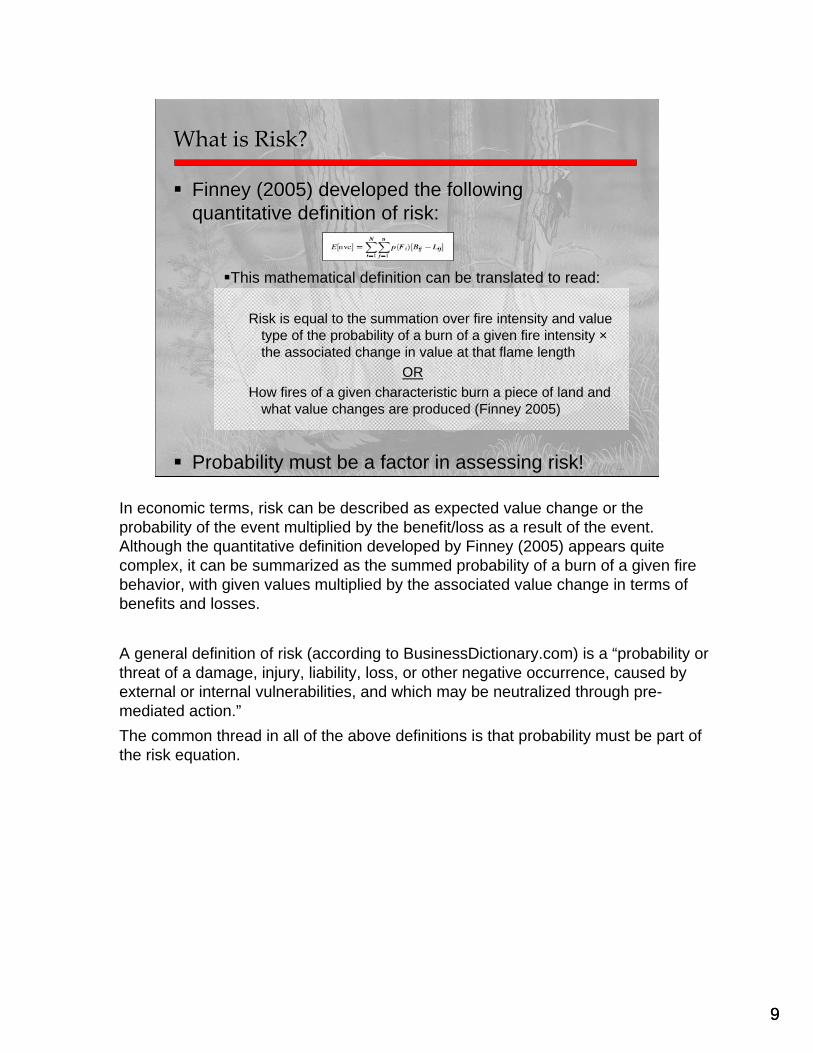
Finney (2005) developed the following Finney (2005) developed the following quantitative definition of risk:quantitative definition of risk:
This mathematical definition can be translated to read: This mathematical definition can be translated to read:
Risk is equal to the summation over fire intensity and value type of the probability of a burn of a given fire intensity × the associated change in value at that flame length
ORHow fires of a given characteristic burn a piece of land and
what value changes are produced (Finney 2005)
Probability must be a factor in assessing risk!!
In economic terms, risk can be described as expected value change or the probability of the event multiplied by the benefit/loss as a result of the event. Although the quantitative definition developed by Finney (2005) appears quite complex, it can be summarized as the summed probability of a burn of a given fire behavior, with given values multiplied by the associated value change in terms of benefits and losses.
A general definition of risk (according to BusinessDictionary.com) is a “probability or threat of a damage, injury, liability, loss, or other negative occurrence, caused by external or internal vulnerabilities, and which may be neutralized through pre-mediated action.”The common thread in all of the above definitions is that probability must be part of the risk equation.

10
Response Levels in WFDSSResponse Levels in WFDSS
Response Level Description Value Analysis Approach Analysis Tool
1 Initial Attack
Count structures proximate to ignition point; compare structure counts between multiple ignitions – possibly add buffer capabilities
WFDSS Value Inventory Tool
2 Escaped fire- Extended
Inventory structures and critical infrastructure at buffered distances from ignition point or perimeter RIVaT
3.x Extended management plan
Add natural resource analysis and more detailed local inventories – all in context of probable fire spread RAVAR
3.x Strategic/ Long Term Implementation Plan
Support the development of Management Action Points (MAPs), and appropriate responses on large complex events or multiple ignitions that are resistant to near term control.
RAVAR
Certain value assessment products may be better suited to certain fire types or ongoing fire events. For example, for initial attack responses, a full RAVAR analysis would not be necessary or warranted. In this case, one might find the WFDSS Value Inventory Tool most useful. With the Value Inventory Tool, decision makers can perform a limited assessment of values within distance of an ignition point.
Other situations warrant a limited value assessment of values that MIGHT be in harm’s way. For these situations, the Rapid Inventory of Values Threatened (RIVaT) may be the most appropriate assessment product. RIVaT is not a complete risk assessment as there is no associated spread probability.
10

11
Response Levels in WFDSSResponse Levels in WFDSS
Response Level Description Value Analysis Approach Analysis Tool
1 Initial Attack
Count structures proximate to ignition point; compare structure counts between multiple ignitions – possibly add buffer capabilities
WFDSS Value Inventory Tool
2 Escaped fire- Extended
Inventory structures and critical infrastructure at buffered distances from ignition point or perimeter RIVaT
3.x Extended management plan
Add natural resource analysis and more detailed local inventories – all in context of probable fire spread RAVAR
3.x Strategic/ Long Term Implementation Plan
Support the development of Management Action Points (MAPs), and appropriate responses on large complex events or multiple ignitions that are resistant to near term control.
RAVAR
The RAVAR analysis incorporates FSPro or other fire behavior model outputs and adds a level of confidence to decision making by linking spread probability to the underlying values potentially at risk. This is close to a true risk analysis with quantification of structures and other major infrastructure at risk. Additionally, natural resource value assessment can be requested with RAVAR. However, RAVAR only identifies values that are likely to be affected by a given fire; a full risk assessment would also quantify likely value change due to the given fire event.
The basic response levels and their corresponding suggested products are as follows: RL 1: Initial attack limited risk assessment needed; RL 2: RIVAT – general summary of values proximate to perimeter; and RL 3: RAVAR – full risk assessment intersection of probability of event and value.
11

12
Which value assessment product is right for Which value assessment product is right for my situation?my situation?
It is necessary to review each value assessment product in detail in order to be able to make informed decisions. Let’s take a more in depth look at the products, their benefits, and their limitations…
12
13
RAVAR Detail and Tier StructureRAVAR Detail and Tier Structure
The RAVAR model produces two primary outputsThe RAVAR model produces two primary outputsTier I identifies private structures, public infrastructure, pubTier I identifies private structures, public infrastructure, public lic reserve areas, and hazardous waste sites. reserve areas, and hazardous waste sites. Tier II products focus on regionally identified natural resourceTier II products focus on regionally identified natural resourceand wildland management priorities.and wildland management priorities.
RAVAR (unlike RAVAR (unlike RIVaTRIVaT) includes a spread probability ) includes a spread probability model. model. Allows us to answer, “What is the probability that fire will Allows us to answer, “What is the probability that fire will reach this area, and which values could be affected if it reach this area, and which values could be affected if it does?”does?”
The RAVAR model produces two primary outputs. The Tier 1 map and report identifies private structures based on two sources: county level geospatial cadastral data; and structure points derived from USGS aerial photo interpretation. Public infrastructure includes water supply systems and reservoirs, major power lines, pipelines, communication towers, and recreation facilities. Tier 1 also identifies designated wilderness and roadless areas, wild and scenic river corridors, and national recreation areas.
Tier II reports are used to identify highly valued natural resources and management priorities that may be affected by an ongoing fire event. The RAVAR staff has coordinated the acquisition and staging of the appropriate layers with regional Forest Service fire and natural resource staff members. Examples of Tier II layers include sensitive wildlife habitat, recreation zones, restoration priority areas, and management response zones formerly defined as Appropriate Management Response.
RAVAR (unlike RIVaT) includes a spread probability model that allows us to answer the question, “What is the probability that fire will reach this area, and which values could be affected if it does?”
13

14
Defining Expectation in RAVARDefining Expectation in RAVAR
Expectation can be defined as the “degree of Expectation can be defined as the “degree of probability of the occurrence of something”probability of the occurrence of something”The potential for loss can be calculated in The potential for loss can be calculated in RAVAR in terms of probability of occurrence, or RAVAR in terms of probability of occurrence, or “expectation”“expectation”Expectation (expected structures threatened)= Expectation (expected structures threatened)= probability that resources are impacted × probability that resources are impacted × number of structures in the zonenumber of structures in the zone
The last slide introduced the concept of estimating values potentially affected by fire using the probability that fire will reach the area. We can take this concept one step further by looking at expected change to a resource from the fire event in terms of a single probability weighted value. This is known as expectation.
Expectation, according to the American College Dictionary, can be defined as the “degree of probability of the occurrence of something” (ACD 1970). The potential for loss can be calculated in RAVAR in terms of probability of occurrence, or “expectation,” by multiplying the sum of values in each zone by the midpoint of the spread probability zone. The next slide demonstrates the mathematical process for performing this calculation.
14

15
How is expectation calculated?
Expected Structures Threatened (assuming no suppression) = (Expectation = No. of structures × prob. of fire spread within zone)
An expected value is calculated from the sum of the number of structures per zone multiplied by the spread probability of the zone.
For example, there are 108 structures in the > 80% spread zone, and the midpoint of that zone is 0.9. So, 108 structures multiplied by the probability of those structures being threatened (0.9) is 97.2. The same calculation for the next zone would be as follows: 117 structures multiplied by 0.7 is equal to 81.9. Continue this calculation for each zone and the sum of the expected values is the EXPECTED STRUCTURES THREATENED number (shown in red on the slide).
Estimates of the EXPECTED VALUES AT RISK should be calculated by multiplying the resource value (or count) by the likelihood that the resource would be impacted. Values other than residential structures are identified within RAVAR and could also be summarized to suggest a multi-attribute risk measure. For example, miles of power transmission lines or acres of Wild and Scenic Recreation Corridor could be used to estimate a multi-objective measure of risk.
16
What does the RAVAR product look like?What does the RAVAR product look like?
Let’s take a look at some actual RAVAR maps and report excerpts. We’ll discuss how this information can inform decision making.
16

17
Tier I RAVAR Map ExampleTier I RAVAR Map Example
This Tier I RAVAR map was produced for the Zaca Fire in Southern California in August of 2007. The Zaca was an extremely expensive fire with numerous structures, power transmission lines, and oil and gas pipelines located within the FSPro spread probability zones.
17
18
Values at RiskValues at Risk
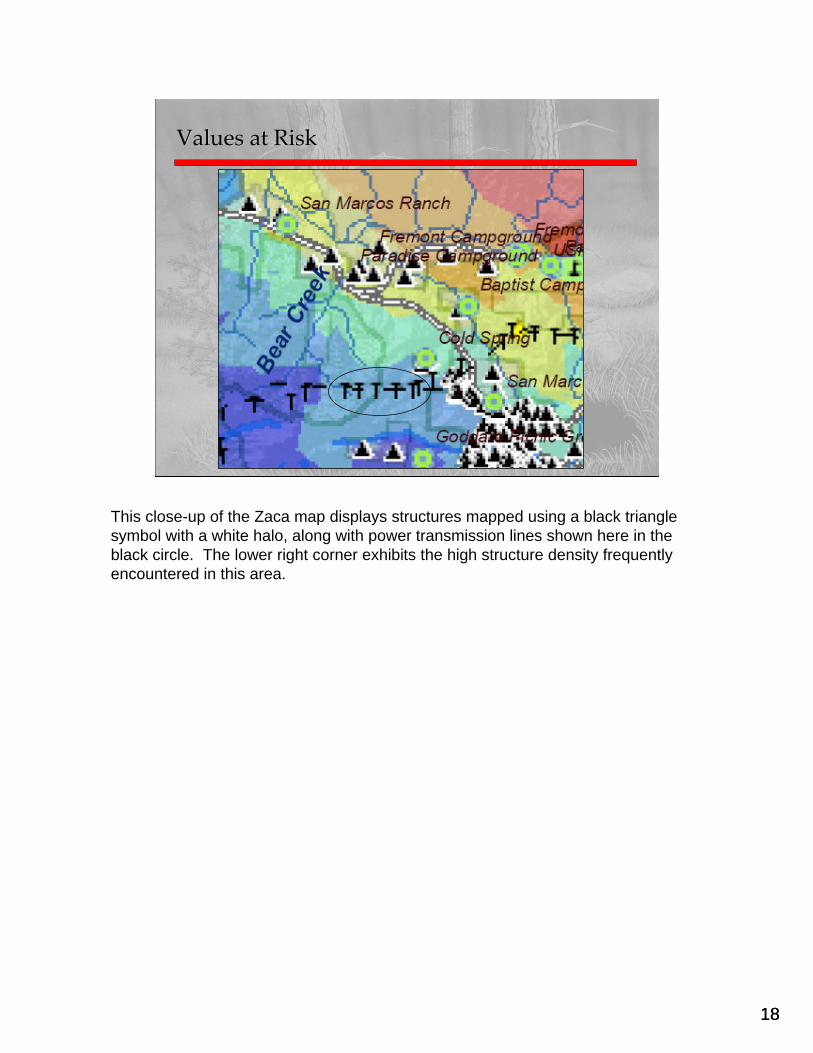
This close-up of the Zaca map displays structures mapped using a black triangle symbol with a white halo, along with power transmission lines shown here in the black circle. The lower right corner exhibits the high structure density frequently encountered in this area.
18

19
ZacaZaca Structures ThreatenedStructures Threatened
Expected Structures Threatened (assuming no suppression) = 549(Expectation = No. of structures × prob. of fire spread within zone)
Fire Spread Probability Zone
Cumulative Acres
Count by Zone
Cumulative Count Value by Zone Cumulative
Value
> 80% 221,479 5 5 $737,500 $737,500
60 - 80 % 280,771 5 10 $737,500 $1,475,000
40 - 60 % 328,527 23 33 $3,392,500 $4,867,500
20 - 40 % 388,346 374 407 $55,165,000 $60,032,500
5 - 20 % 492,482 2,624 3,031 $387,040,000 $447,072,500
1 - 5 % 679,091 2,974 6,005 $438,665,000 $885,737,500
(8/3/07 (8/3/07 -- 14 day 14 day FSProFSPro projection)projection)
The table on this slide shows how resource counts and values are reported in RAVAR reports. The cumulative structures count displays the total number of structures located within the FSPro probability zones. The expected structures threatened number creates a slightly different picture of values threatened by multiplying the values (or counts) potentially at risk by the likelihood that those values will be impacted. The EXPECTED STRUCTURES THREATENED result shown in red on the slide, is calculated using the same methodology described early in the lesson. When comparing risk between different fires, expected values are more informative than cumulative values.
19

2020
Structures DataStructures Data
County Tax RecordsCounty Tax RecordsWorked with Cadastre SubWorked with Cadastre Sub--committeecommittee3/4 of Western US counties 3/4 of Western US counties provided dataprovided data
Structure points from USGS Structure points from USGS aerial photo within hours of a aerial photo within hours of a requestrequest
Structure data is one of the key components of a RAVAR Tier I analysis. Private structures within the Tier I layer are based on two sources: 1) county-level geospatial cadastral data and 2) structure points derived from aerial photo interpretation produced by the USGS Rocky Mountain Geographic Science Center. Acquisition of the cadastral data has been coordinated by the National Cadastral Sub-Committee and resulted in the pre-staging of structures layers for use in RAVAR for approximately three-fourths of all western US counties in 2008. The cadastral committee has reached out to local county offices including assessors, planners, and natural resource and GIS personnel to acquire the counties’ spatial (GIS) parcel records. From the cadastre record, a building clusters map is developed representing the general location of structures identified within the parcel records.

21
Strategic vs. Tactical UseStrategic vs. Tactical Use
Strategic management of wildfire events Strategic management of wildfire events involves determining where suppression efforts involves determining where suppression efforts will be most effective and the proper distribution will be most effective and the proper distribution of suppression resourcesof suppression resourcesTactical management includes evacuation Tactical management includes evacuation planning and structure protectionplanning and structure protectionThe RAVAR and The RAVAR and RIVaTRIVaT products are intended products are intended for strategic use onlyfor strategic use onlySpatial inaccuracies in data make the data Spatial inaccuracies in data make the data inappropriate for tactical use inappropriate for tactical use
The RAVAR and RIVaT products are intended for strategic use. Due to known and assumed spatial inaccuracies in the data, it is not appropriate to use structure data for tactical use such as the development of evacuation plans and structure protection, although these products may assist in local coordination efforts. The building cluster point is based on county parcel data and tax records. Four of the most important identified concerns include: 1) the actual structure location being likely to diverge from the RAVAR identified parcel center, particularly as parcel size increases; 2) multiple structures potentially being located on a given parcel (RAVAR only associates a single point with any parcel); 3) very new development or existing structures not currently existing on the tax record may not be represented; and 4) non-residential structures may be incorrectly classified as building points.
The limitations of the data and discussion of the methods used to generate building cluster points are covered in greater detail in the RAVAR limitations section later in the lesson.
21

2222
FGDC Cadastral Subcommittee:FGDC Cadastral Subcommittee:
Figure 1 – March 2007 Parcel Availability Figure 2 – November 2008 Parcel Availability
Wildland Fire ProjectWildland Fire Project
The maps above display the progress of the cadastral project. Currently, the RAVAR team has approximately 3/4 of western counties processed and ready to evaluate in a RAVAR analysis. Unavailable counties do not limit RAVAR as the USGS provides real-time aerial photo interpretation of structure points in areas without cadastre.

23
Map of USGS assists to dateMap of USGS assists to date
The map on the slide depicts the areas of USGS assistance in structure identification. The USGS provides real-time image interpretation to rapidly extract structure points to be analyzed in RAVAR. The process is often completed in 3-4 hours from initial request to structure point delivery.
23

24
USGS Assistance with Large ComplexUSGS Assistance with Large Complex
The Central Idaho Complexes in August, 2007, occurred in counties where building clusters were not available. The USGS extracted structure points for a large geographic area. USGS structure points are mapped using a black symbol with a yellow halo.
24

2525
Example of early RAVAR productExample of early RAVAR product
The map on this slide of the August 2005 Tarkio Fire in northwest Montana is an early demonstration of FSPro and RAVAR. The FSPro probability zones demonstrated that under the current fire conditions, risk to highly valued areas was very low (only 1 out of 1000 simulations posed risk to areas of value). This knowledge provided confidence to decision makers that monitoring this fire was the appropriate action.

2626
Example of early RAVAR productExample of early RAVAR product
And here’s another early RAVAR demonstration. This map demonstrates that point protection may be sufficient to protect values at risk because the FSPro model output shows a low probability of the fire reaching areas of higher structure density.

2727
Jocko Lakes RAVAR MapJocko Lakes RAVAR Map
The August 2007 Jocko Lakes Fire in Western Montana was high risk on the eastern flank of fire, with high structure density located in the higher probability zones. Using the definition of risk, this side of the fire has a high likelihood of fire reaching values, with the potential for significant value impact if it does. The RAVAR map shows little to no risk (low probability of fire spread and very low values) on the western flank, however. This is a case where it is appropriate to question whether full suppression to fully contain is warranted or whether suppression dollars would be better spent focusing on the eastern high-risk flank only.

28
RAVAR Limitations (Tier I)RAVAR Limitations (Tier I)
Strategic Tool – needs field validationIf Tier I derived from cadastral data:
No information on special use structures on fed landVery new developments may be missingStructures not on tax record missingIdentifies only a single building cluster in centroid of parcel
If derived from USGSMay err by identifying low value out buildings
It is important for users of RAVAR to understand the products’ limitations. RAVAR is designed for strategic use only, and local knowledge validation of spatial location of values data is highly recommended.
RAVAR reports and maps are limited by the accuracy of the data used to generate them. Although the best available data are used, known gaps in the data exist. USFS special use and recreation structures are not available as a spatial data layer; therefore, if structure data are derived from cadastral information, special use structures will not be represented in the map or report. Secondly, very new developments may be missing, along with structures not included in the tax records. Third, the current methodology for identifying building clusters allows only one point (structure) per parcel. The placement of the cluster point is the parcel centroid, as most county cadastral information does not contain exact structure location. This structure location generalization is yet another known limitation of the RAVAR product when using cadastral information.
The use of USGS-derived structure information eliminates the location errors described above, and the USGS structure identification method likely identifies special use structures on federal lands. The limitations with USGS-derived information are that the structure data are only as current as the aerial photographs used, and structures identified may included low value outbuildings, resulting in overvaluation of structures at risk. Additionally, structures under dense canopy may not be identifiable using these methods.
28

29
What about Tier II regionally specific and What about Tier II regionally specific and natural resource values?natural resource values?
Let’s next discuss how RAVAR can assist in identifying regionally specific and natural resource values potentially at risk of wildfire.
29
30
Natural Resource ValuesNatural Resource Values
OIG 2006 - Concluded that 1995 and 2001 policy assigning natural resources and properties equal protection priorities was not being implemented.How do you compare the value to be protected versus cost of protection for natural resource values?
The USDA Office of Inspector General’s (OIG) 2006 Audit Report presented a review of the Forest Service’s large fire suppression costs. The results concluded that high suppression costs were largely due to the USFS’s effort to protect private property in the wildland urban interface (WUI). Consequently, natural resources were receiving lower protection priority than the protection of private property. The current Federal policy of 1995 and 2001 no longer prioritizes private structure protection over natural resource values, yet according to the report, this policy was not being implemented (OIG 2006).
One of the challenges in prioritizing non-market natural resource values to which a dollar has not been assigned is in determining “How do you compare the value to be protected versus cost of protection for natural resource values?”
Let’s examine a fire with high natural resource values and low structure and infrastructural values.
30

3131
Fire SpreadProbability Zone
Acres by Zone
Cumulative Acres
CumulativeStructure
CountCumulative
Value
> 80% 10,639 10,639 0 $0
60 - 80 % 2,503 13,142 0 $0
40 - 60 % 3,241 16,383 0 $0
20 - 40 % 5,804 22,187 0 $0
5 - 20 % 16,588 38,775 0 $0
1 - 5 % 113,094 151,869 264 $38,940,000
Colby Fire, Northern Cal.Colby Fire, Northern Cal.
Expected Structures Threatened (assuming no suppression) = 7.9(Expectation = No. of structures x prob. of fire spread within zone)
The table shown in the slide is from a RAVAR analysis completed for the 2007 Colby Fire in northern California. As the table shows, the fire posed little risk to structures except in the lowest spread probability zone, despite the fire size. At a time of scarce suppression resources, (during national Preparedness Level V), should this fire receive resources?
3232
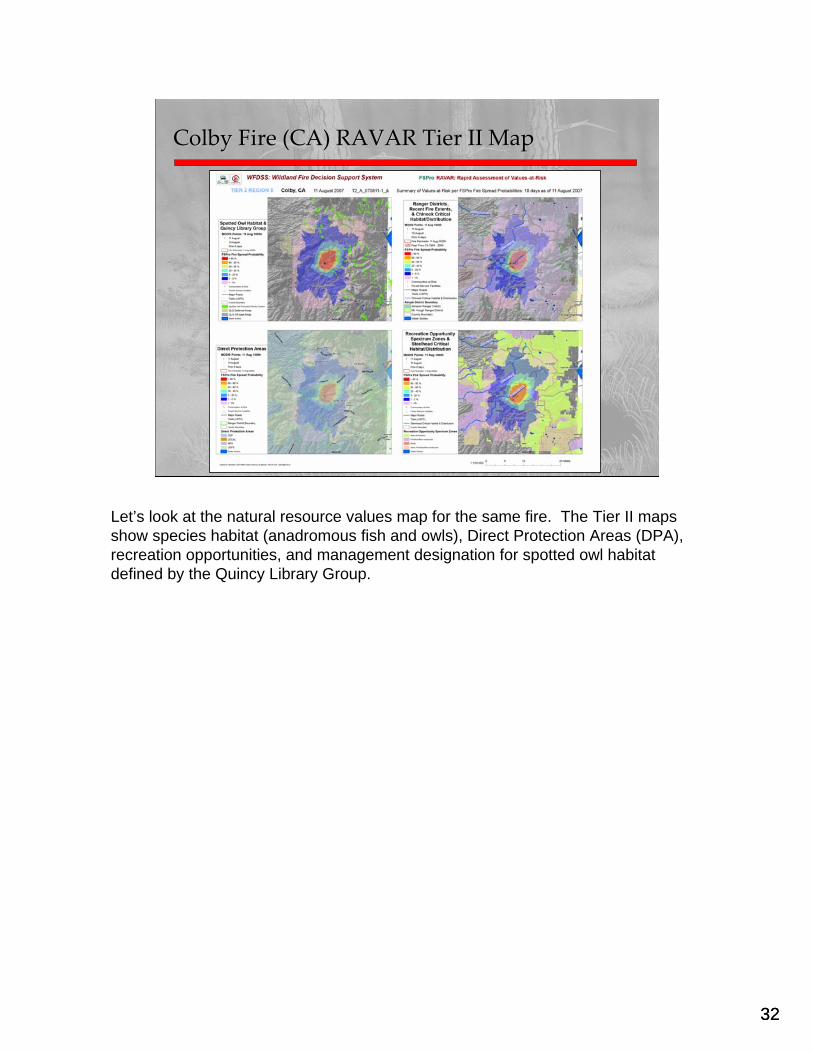
Colby Fire (CA) RAVAR Tier II MapColby Fire (CA) RAVAR Tier II Map
Let’s look at the natural resource values map for the same fire. The Tier II maps show species habitat (anadromous fish and owls), Direct Protection Areas (DPA), recreation opportunities, and management designation for spotted owl habitat defined by the Quincy Library Group.

3333
CHINOOK CRITICAL HABITATCHINOOK CRITICAL HABITAT
SPAWNINGSPAWNING
Fire Spread Fire Spread Probability ZoneProbability Zone
Miles by Miles by ZoneZone
Cumulative Cumulative MilesMiles
> 80%> 80% 5.25.2 5.25.2
60 60 -- 80 %80 % 0.60.6 5.85.8
40 40 -- 60 %60 % 0.20.2 6.06.0
20 20 -- 40 %40 % 0.50.5 6.56.5
5 5 -- 20 %20 % 2.32.3 8.78.7
1 1 -- 5 %5 % 24.124.1 32.932.9
SPOTTED OWL PROTECTED ACTIVITY SPOTTED OWL PROTECTED ACTIVITY CENTERSCENTERS
Fire Spread Fire Spread Probability ZoneProbability Zone
Acres Acres by Zoneby Zone
Cumulative Cumulative AcresAcres
> 80%> 80% 11 11
60 60 -- 80 %80 % 4545 4646
40 40 -- 60 %60 % 138138 184184
20 20 -- 40 %40 % 324324 507507
5 5 -- 20 %20 % 278278 785785
1 1 -- 5 %5 % 3,3663,366 4,1514,151
STEELHEAD CRITICAL HABITATSTEELHEAD CRITICAL HABITAT
SPAWNINGSPAWNING
Fire Spread Fire Spread Probability ZoneProbability Zone
Miles by Miles by ZoneZone
Cumulative Cumulative MilesMiles
> 80%> 80% 5.35.3 5.35.3
60 60 -- 80 %80 % 0.60.6 5.85.8
40 40 -- 60 %60 % 0.20.2 6.06.0
20 20 -- 40 %40 % 0.50.5 6.56.5
5 5 -- 20 %20 % 2.32.3 8.88.8
1 1 -- 5 %5 % 24.124.1 32.932.9
Quantification of Natural Resource ValuesQuantification of Natural Resource Values
The tables in the slide show acres of spotted owl protected activity centers at risk along with miles of steelhead and Chinook critical spawning habitat. Should this still be considered a low risk fire?
34
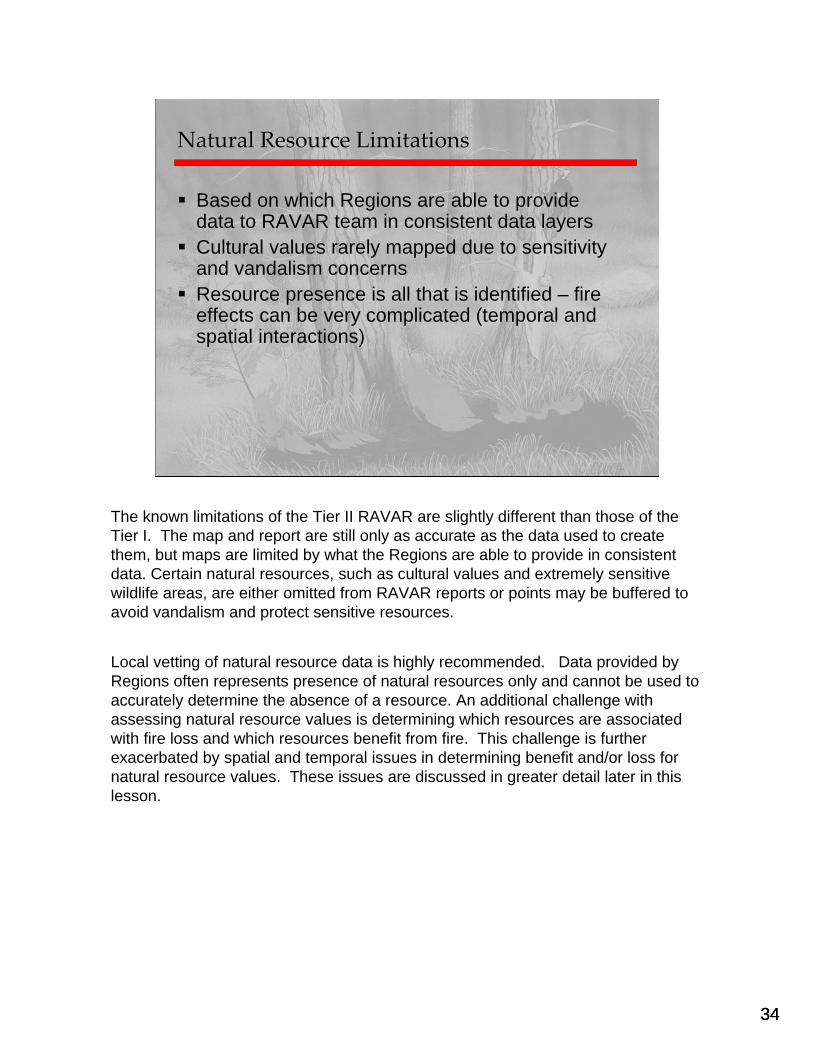
Natural Resource LimitationsNatural Resource Limitations
Based on which Regions are able to provide data to RAVAR team in consistent data layersCultural values rarely mapped due to sensitivity and vandalism concernsResource presence is all that is identified – fire effects can be very complicated (temporal and spatial interactions)
The known limitations of the Tier II RAVAR are slightly different than those of the Tier I. The map and report are still only as accurate as the data used to create them, but maps are limited by what the Regions are able to provide in consistent data. Certain natural resources, such as cultural values and extremely sensitive wildlife areas, are either omitted from RAVAR reports or points may be buffered to avoid vandalism and protect sensitive resources.
Local vetting of natural resource data is highly recommended. Data provided by Regions often represents presence of natural resources only and cannot be used to accurately determine the absence of a resource. An additional challenge with assessing natural resource values is determining which resources are associated with fire loss and which resources benefit from fire. This challenge is further exacerbated by spatial and temporal issues in determining benefit and/or loss for natural resource values. These issues are discussed in greater detail later in this lesson.
34

3535
New Product Introduced New Product Introduced
Unprecedented 2008 lightning event in northern California gave way to new RIVaT productSiege events created need for delivery of values potentially at risk before FSPro and Fire Behavior Analysts availableAllowed decision makers to have preliminary value assessment in-hand before more complete risk assessment was available
The 2008 fire season brought with it an exceptional lighting event in northern California. The overwhelming number of new fires made it difficult to respond quickly to each incident with a formal risk assessment, and the need for more rapid incident response was identified. RIVaT was introduced as a multi-ring buffer that could be used to analyze values in the vicinity of an ignition point or fire perimeter –and delivered to the field quickly – before an FSPro model could be ordered and approved.
RIVaT is currently available within WFDSS and is requested using the same ordering process as that for RAVAR with “RIVaT” specified in the comments.

36
RIVaTRIVaT DetailDetail
RIVaT analyses can be performed on a buffered ignition point, a buffered perimeter, a planning perimeter, or using contingency lines, etc.Quick turn-around from time of request to product delivery – limited assessmentThe Santa Anna RIVaT uses a FARSITE-simulated fire perimeter with user-specified wind direction and wind speed – product specific to Santa Anna wind events in S. California
The RIVaT analysis is a limited hazard assessment and can be performed on a buffered ignition point, a buffered perimeter, a planning perimeter, can be performed using contingency lines, etc. The turn around time from time of request to product delivery is approximately 1 hour, which is 1/3 of the time needed to complete a RAVAR assessment.
The Santa Anna RIVaT is a special product that was released on an experimental basis in the fall of 2008. This RIVaT uses a FARSITE-simulated fire perimeter with user-specified wind direction and wind speed – this product is specific to Santa Anna wind events in southern California.
When is it appropriate to use a RIVaT analysis? It is appropriate for 1) coarse inventory of key assets before FSPro is available, 2) to assess the need for full RAVAR request, and 3) use where expected duration of fire, (for example, fast spreading range fire) requires rapid hazard evaluation and FSPro is not yet available.
36
37
What does a What does a RIVaTRIVaT map look like?map look like?
Let’s take a look at some RIVaT examples.
37
38
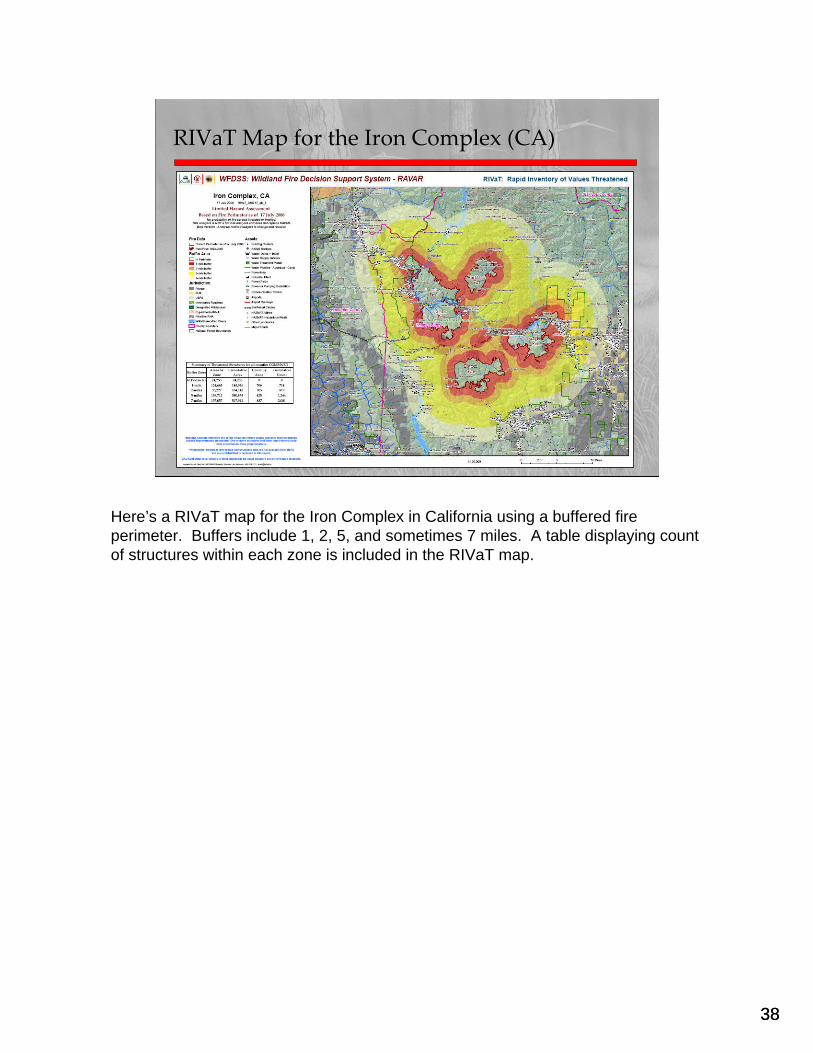
RIVaTRIVaT Map for the Iron Complex (CA)Map for the Iron Complex (CA)
Here’s a RIVaT map for the Iron Complex in California using a buffered fire perimeter. Buffers include 1, 2, 5, and sometimes 7 miles. A table displaying count of structures within each zone is included in the RIVaT map.
38

39
Santa Anna Santa Anna RIVaTRIVaT MapMap
As mentioned, the Santa Anna RIVaT was released as an experimental prototype in the fall of 2008. The product was used for three wind-driven fire incidents – one of which was the Sayre Fire – shown here on this slide, to estimate the general spread direction and extent based on wind vectors and speeds.
39

40
RIVaTRIVaT LimitationsLimitations
No spread probability is implied. This merely represents what might be in ‘harms way’.User-defined polygons and buffered perimeters do not imply direction or extent (exception is Santa Anna RIVaT)Limited assessment: quantification of structures only; limited qualification of other major infrastructure
RIVaT analyses provide a limited assessment of the values potentially threatened but without a spread probability; they are merely a quick look at which values are present in the fire vicinity. RIVaT is not a full RAVAR and should not replace RAVAR as a value assessment product. User-defined polygons and buffered perimeters do not imply spread direction or extent and should therefore be used with caution. The Santa Anna RIVaT is the exception because the ellipsoid shape was developed using the FARSITE modeling software. RIVaT is a limited assessment compared to RAVAR, with only structures quantified in the report and limited qualification of other major infrastructure.
40

41
RAVAR vs. RAVAR vs. RIVaTRIVaT
The town of Briceburg. Note the difference in scale and direction of spread change from the RIVaT to the RAVAR map.
Let’s look at a side-by-side comparison of the two products from the 2008 Telegraph fire in California. The RIVaT map (on the left) was completed on July 28th and the RAVAR (on the right) was completed on July 29th. Note the difference in perimeter size, the change in map scale based on the increase in perimeter size, and the direction of spread shown in the RAVAR map, which cannot be modeled in the RIVaT.
Some values located within the 5-mile buffer in the RIVaT map are located proximate to the perimeter or within the greater than 80 % probability zone in the RAVAR. Although RIVaT analyses are very useful for a rapid identification of values possibly at risk, they cannot provide any level of confidence that values may be impacted by fire spread. RAVAR presents values and the likelihood of fire reaching those values.
41

42
Benefits of FireBenefits of Fire
Wildfire impacts to natural resource values are complicated
Intensity – low flame lengths may provide improved conditionsSpatial – depends on resource distribution and fire locationTemporal – short-term degradation vs. long-term enhancement
Fuel treatment effectReduced likelihood of future loss
Much of this lesson has focused on reporting the potentially negative consequences of wildfire to resources. However, the benefits of fire are well recognized as a management tool. Determining how wildfire impacts natural resource values can be complicated. Fire intensity is one of the variables in determining the benefits of fire. A low flame length may greatly improve certain wildlife habitats, while a more severe burn may be associated with a negative species response. Although, in certain areas intense fire may be the norm, and due to current landscape conditions high intensity fire may be beneficial. There are spatial considerations in looking at fire benefits where it may be beneficial to have smaller dispersed fires but large fires would be detrimental. Additionally, there are temporal considerations for natural resource values where initial post fire response may be negative for some species, but long term recovery may result in habitat enhancement.
Fire can also serve as a fuel treatment in effect, which will reduce the likelihood of future value loss.
42

43
Claiming Benefits Under Risk Informed ResponseClaiming Benefits Under Risk Informed Response
Possible prototype to support 2009 policy modificationsUpload shape files for those units identified for fire benefits in LMP/FMP Store the resource objectives Acceptable fire intensity? Model fire behavior (FSPro) and projected first-order effects (Fire Severity module- Beta). Validate observed fire severity with BARC/ BAER.
Let’s take a look at how we could claim the benefits of fire under a risk informed response.
Plans for the 2009 fire season involve a possible WFDSS prototype to support wildland fire management policy modifications implemented in 2008, changing fire from one type of management (either for resource benefit or suppression) to management for one or more objectives based on the Land/Resource Management Plan direction (WFLC 2008). Prototype ideas suggested for supporting this policy change include uploading shape files for beneficial fire units identified in the Land Management or Fire Management Plans, and the ability to store the resource objectives within the system.
Additional proposed system functionality to support claiming benefits include an acceptable fire intensity level and use of the FSPro to model fire behavior and project first-order fire effects (Fire Severity module- Beta). The observed fire severity can then be validated with Burned Area Reflectance Classification (BARC) and Burned Area Emergency Response (BAER) tools.
43
44
Ongoing Work and EnhancementsOngoing Work and Enhancements
Incorporate interagency partner needs (DOI)Incorporate interagency partner needs (DOI)Expand data to include southeastern U.S.Expand data to include southeastern U.S.Inclusion of reference fire budgets in WFDSSInclusion of reference fire budgets in WFDSS
RAVAR and the associated value assessment products are constantly under review and revision. The 2008 fire season prompted many changes and improvements to the process. During the summer of 2008, the RAVAR group in Missoula hosted two Department of Interior (DOI) detailers to learn the RAVAR process and facilitate data and knowledge exchange. Successful outcomes of these details include increased cooperation with both National Park Service (NPS) and Bureau of Land Management, increased data sharing for use in RAVAR, and the opportunity to meet with NPS fire directors to improve cooperation and use of RAVAR in the 2009 season. The RAVAR group will continue expansion of values data, specifically cadastral data to provide support to the southeastern U.S. and other areas requiring values assessment to support wildfire strategic response.
The 2009 season looks to be as exciting and challenging as the 2008 season proved to be. Additional system improvements are being developed every day. Currently underway in preparation for the 2009 season is the development and inclusion of reference fire budgets to assist in properly managing suppression resources for fire events.
44

45
The RAVAR prototype is presented in this lessonAutomated within WFDSS for 2009 (hand-off from research)Future process and products may differ from what has been presented here
Enhancements 2009Enhancements 2009
The RAVAR process and products presented in this lesson are what is currently in place, but future products may look different over the course of the next year. WFDSS is planned to be fully automated for the 2009 season, with values data accessible within the system. IBM is currently working on development of the automated system, and a team is in place to transfer data to the system. Although the RAVAR group will be involved with this transition, the switch will likely be a “hand off” from a research prototype to a system standard, which is still in the process being defined.
45

46
Lesson SummaryLesson SummaryLesson Summary
Introduced RAVARReviewed the history of RAVARDiscussed the concept of riskReviewed response levels & associated productsExplored products and their appropriate useLooked at how expectation influences decisionsExplored RAVAR data & cooperating agenciesDiscussed benefits of fire & claiming beneficial fire effects
In this lesson we:1) Introduced RAVAR;2) Reviewed the history of RAVAR;3) Discussed the concept of risk;4) Reviewed response levels & associated products;5) Explored products and their appropriate use;6) Looked at how expectation influences decisions;7) Explored RAVAR data & cooperating agencies; and8) Discussed the benefits of fire & claiming beneficial fire effects.
46