Embed Size (px)
Citation preview

~~S"f V~? ' ,
tJO' 3'
NOAA Technical Memorandum ]~S NHC 31
(Revision!
of NOAA Technical Memorandum 18)
THE DEADLIEST, COSTLIEST, ,~MOST INTENSE UNITED STATES HURRICANES
OF THIS CENTURY (AND OTHER FREQUENTLY REQUESTED HURRICANE FACTS)
Paul J. Hebert, WSFO, Miami, FloridaRobert A. Case, NHC, Miami, Florida
National Hurricane CenterMiami. Florida
Updated March 1990
National Weather ServiceElbert W. FridayAssistant A~lnistrator
National Oceanic and Atmospheric A~inistrationJohn A. KnaussUnder Secretary anel A~inistrator
IItITED STATESDEPARTMENT OF C()t4ERCERobert A. Mosbacher. Secretary

PIREF ACE
This version of the Deadlie:st, Costliest, and Most Intense Unitedstates Hurr icanes of This Centur:y is an update through the 1989hurricane season.
Hurricane Hugo, the first ci3tegory 4 or 5 hurricane to strike theUnited states since 1969, has l~j to revisions of many of the tables.In addition three new tables have been added. These are Tables 12athrough 12c, which rank deaths ~1d unadjusted and adjusted damages byannual totals. Adjusted dollar di~ge estimates in the tables have beenmade based on 1989 dollars. Much of the text remains unchanged. Page 11has the most significant changes.
Deaths am dollar darrage es1tim3.tes for Hugo and the rem3.inder ofthe 1989 tropical cyclones to af:Eect the United states should beconsidered prelindnary. They are expected to be close to the finalfigures in the 1989 Atlantic hurJricane season articles issued by theNational Hurricane Center.
Finally, the end of the decc~e of the eighties allows soneinteresting con{)arisons in trend!; from recent seasons and previousdecades.

THE DEADLIEST I COSTLIEST I AND MOST INTENSEUNITED STATES HURRICM-lES OF THIS <::ENTURY
(AND OTHER FRmUENTLY ROOUESTED HURRICM-lE FAcrS)
by
Paul J. Hebert, Weather Service Forecast Office& Robert A. Case, National Hurricane Center
National weather Service" Miami, Florida
ABSTRACI'
Lists of United states hurricanes Which have caused 25 or moredeaths and more than one hundred rndllion dollars in damages(unadjusted) dur ing this century have been cornpi led from all
data sources available at the National Hurricane Center (NHC).In addition, all major~ hurricanes Which have made landfallin the United states during this century are listed. Someadditional statistics on United States hurricanes of thiscentury and tropical cyclones in general are also presented.
1. IN'I'RODUCl'ION
Numerous requests are received at the National Hurr icane Centerfor statistical information on deaths, damages, and severity ofhurricanes which have affected the United states. In the past, this hasrequired searching through various reference materials, depending on thenature of the individual request. Different sources gave differentestimates of these statistics so that decisions had to be constantlymade as to which information should be given out by NHC as "official"from the National Hurricane Information Center (another function ofNHC). Requests to other weather Service Offices posed the same dilemma.These lists are being published in the hope of presenting a singlesource of the best currently available estimates of deaths, damages,and intensity of major U.S. hurricanes which have made landfall in thiscentury. In some instances, data in these lists present revisedest imates for ind i vidual hurr icanes based on more complete inforrnat ionreceived after earlier published values, including the previous versionsof this technit1al memorandum.
There are 'other frequently asked questions about hurr icanes. Whatis the average .number of hurricanes per year? What year(s) had the mostand least hurricanes? What hurricane had the longest life? When didthe earliest and latest hurricane occur? What was the most intenseAtlantic hurricane? What was the largest nunber of hurricanes inexistence on the same day? When. was the last time a major hurricane orany hurricane hit a given cOImUn.ity directly2? Ans~rs to these andseveral other questions are provided in Section 3.
~A major hurricane is a category 3, 4, or 5 on the Saffir/SimpsonHurr icane Scale (see references,), and is conparable to a Great Hurr icanein other publications. Table 1 gives the criteria used.
2A direct hit neans experiencingr the core of strong winds and high tides(approximately 50 «dIes along t:he coastline) of a hurricane.

Table 1. Saffir/Simpson Hurricane Scale Ranges.
Scale ~~'jNumber Central Pressure OR Winds OR Surge Damage
(Cateqory) (Millibars) (Inches) (MDh) (Feet)
1 2980 ?:28.94 74-95 4-5 Mininal
2 965-979 28.50-28.91 96-110 6-8 Moderate
3 945-964 27.91-28.47 111-130 9-12 Extens i ve
4 920-944 27.17-27.88 131-155 13-18 Extre~
5 <920 <27.17 >155 >18 Catastrophic
-2-

2. rnITmIA
The statistics in most of the tables and figures in this publicationdepend directly on the criteria used in preparing another study,Hurr icane Experience Levels of Coastal County Populations-Texas to Maine(Hebert, Taylor, and Case, 1984). The prim3rY purpose of that study wasto demonstrate, county by county, the low hurr icane exper ience level of a
large majority of the population. Statistics show that the largest lossof life and, for the most part, property occur in locations experiencingthe core of a category 3 or higher hurricane. Unless a given populationhas experienced this core, or direct hit, with its very strong winds andhigh tides, it ~uld defeat the prim3rY purpose of the study on hurricaneexperience levels to so categorize it.
The central pressure ranges of hurricanes on the Saffir/Simpsonscale will usually agree quite well with the wind ranges in thatcategory. In the absence of other information, this is normally the bestestimate of a hurricane's winds. However, some hurricanes which havedeveloped from winter-type or subtropical low pressure systemsoccasionally have a minimum central pressure lower than the correspondingobserved winds ~uld suggest. In thi§: instance, ~ ~ criteria ~ ~.
On the other hand, the surge is strongly dependent on the slope ofthe continental shelf (shoaling factor). This can change the height ofthe surge Qy a factor Qf ~ for a given central pressure and/or maximumwind.
Heavy rainfall associated with a hurricane is nQt one of thecriteria for categorizing it.
The subjective determdnation of which category number to assign to ahurricane, as well as its direct or indirect3 effect, is made on a countyQy county basis with the intent of the study on hurricane experience levelsforemost in mdnd. However, state and United States lists will includedirect hits even though a county mdght only have a footnote reference tosuch a hit.
As with the assignment of scale numbers, a certain amount ofsubjectivity was inescapable at times in determdning which countiesreceived direct or indirect hits during the various hurricane situations.However, certain arbitrary guidelines for these classifications as usedin Hurricane Experience Levels, etc., are indicated below:
Direct H.it. -~en the innermJst core region or "eye" mJved over acounty, it was counted as a direct hit. Using "R" as the radius ofmaximum winds in a hurricane (the distance in ndles from the storm'scenter to the circle of maximum winds around the center), all or parts ofcounties falling within approxinately 2R to the right and R to the leftof a storm's landfall point were considered to have received a direct hit.(This assUIreS an observer at sea looking to~d the shore). On theaverage, this direct hit zone extended about 50 ndles along the coastline(R=15 miles). Of course, some hurricanes were smaller than this and some,particularly at higher latitudes, were mlch larger. Cases were judgedindividually, and many borderlinle situations had to be resolved.
3Indirect means experiencing at least wind gusts of hurricane forceand/or tides of 4 to 5 feet or more above normal from a nearby hurricane.
-3-

Indirect ill -These were based prinarily on a hurricane'sstrength and size, and on the configuration of the individual countycoastline. Here again, much subjectivity was necessary in many casesWhich were complicated by storm paths and geography. Generally,those areas on either side of the direct hit zone Which receivedhurricane force winds and/or tides of 4 to 5 feet or more abovenormal were considered to have had an indirect hit.
It is realized that the effect of an indirect hit by a largecategory 4 hurricane maght be greater than that of a small category 1affecting the same county. However, trying to account for thesedifferences would hopelessly complicate the use of this system.
The study by Simpson and Lawrence (1971) gives climatologicalprobabilities of the total number of storms and hurricanes to affect theU.S. coastline by fifty-male wide coastal segments, as well as onlyhurr icanes, and major (or great) hurr icanes. Whi 1e this 50 ma 1esapproximates that of the "core" used for direct hits, there are sonedifferences. In the Simpson and Lawrence study, a storm/hurricane/greathurr icane was counted in the segment where it crossed the coast plus thenext segment .tQ ~ right. As indicated earlier, the "core"used in Hebert, Taylor, and Case (1984) can be smaller or larger than 50males, and could also affect one of the segments in Simpson andLawrence to the ~ of a coastline crossing which that study wouldnot count.
The foregoing two studies and their associated criteria areclimatoloaical with their primary purpose being for use in assessingrisk based on ~ experience. On the other hand, the National weatherService's Hurricane Probability Program has as its purpose the assessnentof risk based on a present hurr icane threat to the United Statescoastline. It does this by arbitrarily defining a "strike" as the centerof a hurricane moving through a zone within approximately 50 nauticalmales to the right or 75 nautical males to the left of the site ofinterest (Sheets, 1984). The asymmetry is to allow for the strongestwinds in a hurricane frequently being further to the right of the centerthan the left-a consideration reflected also in the earlier studiesdiscussed. This 125 nautical male diameter circle approximates the regionof hurricane force winds for a "typical" hurricane. It will usually belarger than the "core", and is fixed, like the s~nts in Simpson andLawrence. HURRICANE SmIKE PROBABILITIES HAVE NO RELATION TO HURRICANEINTENSITY. Users of these probabilities ~ take this into account whenassessing risk, based on the forecast tine before landfall and strength.The reader is urged to refer to The National weather Service HurricaneProbability Program (Sheets, 1984) for a more thorough explanation offorecast probabilities.
Statistics on total storm/hurricane activity in the North AtlanticOcean (which includes the Gulf of Mexico and the Caribbean Sea) can befound in Neumann, Jarvinen, Pike, and Elms (1987). A detailed breakdownof hurricanes by category which have affected coastal counties of theGulf of Mexico and North Atlantic Ocean both directly and indirectly canbe found in Hebert, Taylor, and Case (1984), which has been updated wherenecessary for this technical memorandum. The best source of how ahurricane affected individual localities or states can be found in theannual articles on the hurricane season in the Monthly weather Review(1990) and Storm ~ tabulation (1990) for the individual states,
respectively.
-4-

3.
DISalSSION
Part I
(1) What have been the deadliest hurricanes of this century in theUnited states?
Table 2 lists the 31 deadliest hurricanes to strike theU,.S. in this century. Three hurricanes prior to 1900 as~ll as a tropical storm Which affected southern Californiain 1939 are listed as an addendum because of their largedeath tolls.
(2) What have been the costliest hurricanes of this century in theUnited states?
Table 3 lists the 31 costliest hurricanes to strike theU:.S. in this century. Figures are unadjusted for inflation.
Table 3a re-orders some of these plus several otherhurricanes after adjusting to 1989 dollars4.
(3) What have been the most intense hurricanes to strike the Unitedstates during this century?
Table 4 lists the 60 major hurricanes Which have struck theU.S. during this century. Hurricanes are ordered by thelowest estimated central pressure and/or highest categoryto affect the United states at time of landfall
A look at the lists of deadliest and costliest hurricanes of thiscentury reveals several striking facts: (1) The twelve deadliesthurricanes were all the equivalent of a category 4 or higher, if theexcessive forward speed is considered as raising the category of ahurricane by one. (2) All but four of the thirty-one deadliest hurricaneswere major hurricanes. Two were the inland flood-producing hurricanesAgnes and Diane. These large death totals were primarily a result of the15 to 20 feet or more rise of the ocean (storm surge) associated withthese major hurricanes. (3) A large portion of the damage in three of theeleven costliest hurricanes (Table 3) resulted from inland floodingcaused by torrential rainfall in mountainous areas. (4) Nearlythree-fifths of the deadliest hurricanes were the equivalent of acategory four o~ higher, but only two-fifths of the costliest hurricanes(Table 3) met this criterion. (5) Only one of the deadliest hurricaneshas occurred during the past twenty years in contrast to about half ofthe costliest hurricanes.
4Adjusted to 1989 dollars on basis of U.S. Department of Commercecomposite construction cost indexes.
-5-
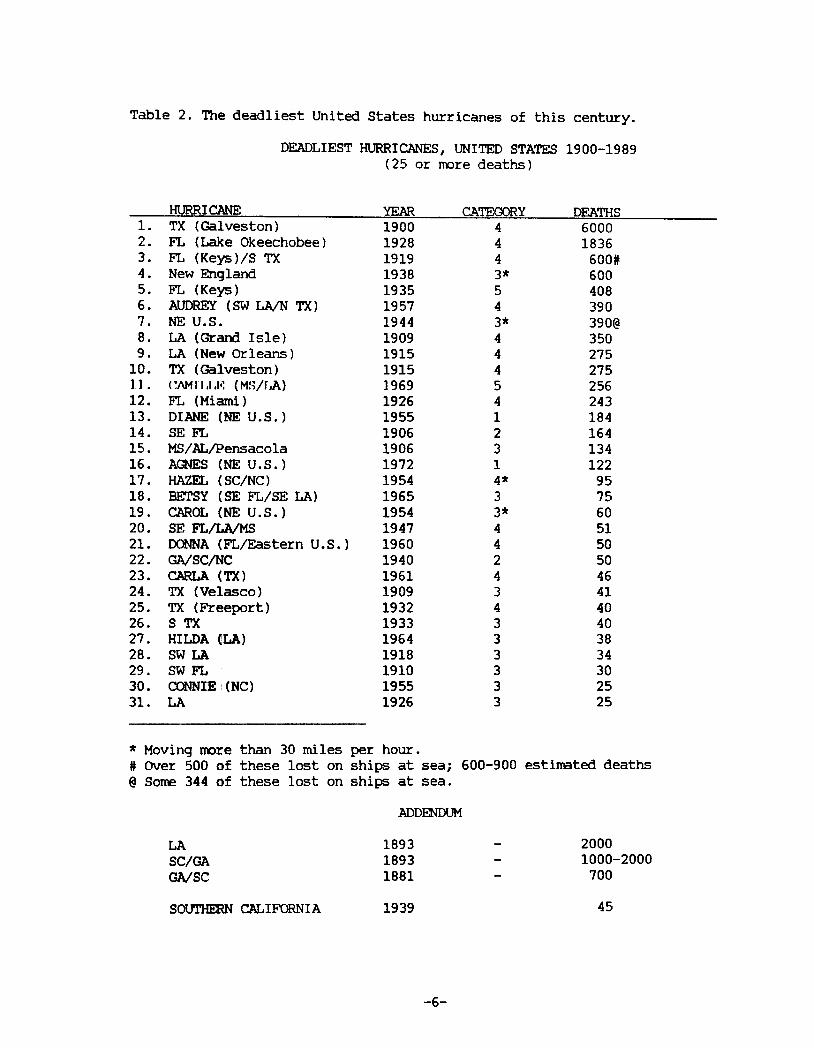
Table 2. The deadliest United states hurricanes of this century.
DEADLIEST HURRICANES, UNITED STATES 1900-1989(25 or R¥)re deaths)
HURRI CANE YEAR CATEGORY DEATHS
1. TX (Galveston) 1900 4 60002. FL (Lake Okeechobee) 1928 4 18363. FL (Keys)/S TX 1919 4 600#4. New England 1938 3* 6005. FL (Keys) 1935 5 4086. AUDREY (SW LAIN TX) 1957 4 3907. NE u.S. 1944 3* 390@8. LA (Grand Isle) 1909 4 3509. LA (New Orleans) 1915 4 27510.
TX (Galveston) 1915 4 2751.]. (~rl.l."~ (MH/r.A) 1969 5 25612.
FL (Miand) 1926 4 24313. DIANE (NE U.S.) 1955 1 18414. SE FL 1906 2 16415. MS/AL/Pensaco1a 1906 3 13416. AGNES (NE U.S.) 1972 1 12217. HAZEL (SC/NC) 1954 4* 95
18. BETSY (SE FL/SE LA) 1965 3 7519. CAROL (NE U.S.) 1954 3* 60
20. SE FL/LA/MS 1947 4 5121. DONNA (FL/Eastern U.S.) 1960 4 5022. GA/SC/NC 1940 2 5023. CARLA (TX) 1961 4 4624.
TX (Velasco) 1909 3 4125. TX (Freeport) 1932 4 4026.
S TX 1933 3 4027. HILDA ~LA) 1964 3 38
28. SW LA 1918 3 3429. SW FL 1910 3 3030.
CONNIE (NC) 1955 3 2531. LA 1926 3 25
* Moving more than 30 ndles per hour.# Over 500 of these lost on ships at sea; 600-900 estimated deaths@ Some 344 of these lost on ships at sea.
ADDENDUM
189318931881
20001000-2000
700
LASC/GAGA/SC
-
451939s 0t1rHERN CAr. I FORN I A
-6-

Table 3. The costliest United states hurricanes of this century.., (Unadjusted)
COSTLIEST HURRICANES, UNITED STATES 1900-1989(More than $100,000,000 damage)
HURR I CANE YEAR CATEGORY DAMAGE ( U .S. )
1. HUGO (SC) 1989 4 $7,000,000,0002. FREDERIC (AL/MS) 1979 3 2,300,000,0003. AGNES (NE U.S.) 1972 1 2,100,000.0004. ALICIA (N TX) 1983 3 2,000,000,000~5. JUAN (LA) 1985 1 1,500,000,0006. CAMILLE (MS/AL) 1969 5 1,420,700,0007. BETSY (SE FL/SE LA) 1965 3 1,420,500,0008. ELENA (MS/AL/NW FL) 1985 3 1,250,000,0009. GLORIA (Eastern U.S.) 1985 3* 900,000,000
10. DIANE (NE U.S.) 1955 1 831,700,00011 ALLISON (N TX) 1989 T.S.@ 500,000,00012 ELOISE (NW FL) 1975 3 490,000,00013. CAROL (NE U.S.) 1954 3* 461,000,00014. CELIA (S TX) 1970 3 453,000,00015. CARLA (TX) 1961 4 408,000,00016 CLAUDETTE (N TX) 1979 T.S.@ 400,000,00017. DONNA (FL/Eastern U.S.) 1960 4 387,000,00018. DAV!D (FL/Eastern U.S.) 1979 2 320,000,00019. New England 1938 3* 306,000,00020. KATE (FL Keys/NW FL) 1985 2 300,000,00021. ALLEN (S TX) 1980 3 300,000,00022. HAZEL (SC/NC) 1954 4* 281,000,00023. DORA (NE FL) 1964 2 250,000,00024. BEULAH (9 TX) 1967 3 200,000,00025. AUDREY (LAIN TX) 1957 4 150,000,00026. CARMEN (LA) 1974 3 150,000,00027. CLEO (SE FL) 1964 2 128,500,00028. HILDA (Central LA) 1964 3 125,000,00029. FL (Miand) 1926 4 112,000,00030. SE FL/LA/MS 1947 4 110,000,00031. NE U.S. 1944 3* 100,000,000+
* Moving more than 30 miles per hour.@ Only of Tropical Storm intensity, but included because of high damage
amount.
~Alicia was mdstakenly listed as $200,000 in the previous version of thisTechnical MeIOOrandum.
-7-

Table 3a. The costliest United states hurricanes of this century.(Adjusted to 1989 dollars) **
COSTLIEST HURRICANES, UNITED STATES 1900-1989(More than $400,000,000 damage)
Hlffi R I CANE YEAR CA TEOOR Y DAMAGE ( U .S. )
1. HU(O (SC) 1989 4 $7,000,000,0002. BETSY (FL/LA) 1965 3 6,321,225,0003. AGNES (NE U.S.) 1972 1 6,279,000,0004. CAMILLE (MS/AL) 1969 5 5,128,727,0005. DIANE (NE U.S.) 1955 1 4,108,598,0006. New England 1938 3* 3,515,940,0007. FREDERIC (AL/MS) 1979 3 3,427,000,0008. ALICIA (N TX) 1983 3 2,340,000,000~9. CAROL (NE U.S.) 1954 3* 2,318,830,00010.
CARLA (TX) 1961 4 1,884,960,00011. DONNA (FL/Eastern U.S.) 1960 4 1,784,070,00012. JUAN (LA) 1985 1 1,635,000,00013. CELIA (S TX) 1970 3 1,526,610,00014. HAZEL (SC/NC) 1954 4* 1,413,430,00015. ELENA(MS/AL/NW FL) 1985 3 1,362,500,00016. FL (Miamd) 1926 4 1,286,880,00017. DORA (NE FL) 1964 2 1,132,500,00018. ELOISE (NW FL) 1975 3 1,058,400,00019. GLORIA (Eastern U.S.) 1985 3* 981,000,00020. NE U.S. 1944 3* 905,000,00021. BEULAH (S TX) 1967 3 826,000,000
22. SE FL/LA/MS 1947 4 688,600,00023. AUDREY (LA/N TX) 1957 4 681,000,00024. CLAUDETTE (N TX) 1979 T.S.@ 596,000,00025. CLEO (SE FL) 1964 2 582,105,00026. SW FL/NE FL 1944 3 570,150,00027.
HILDA (LA) 1964 3 566,250,00028. SE FL 1945 3 527,400,00029. ALLISON (N TX) 1989 T.S.@ 500,000,00030. DAV1D (FL/Eastern U.S.) 1979 2 476,800,00031. lONE (NC) 1955 3 434,720,00032. ALLEN (S TX) 1980 3 402,000,000
1,152,400,0002691,440,0003
44
N TX ( Galveston)N TX (Galveston)
19151900
~Not in this list in previous version-see footnote in table 3.2Considered too high in 1915 reference.3Using J.915 cost adjusbrent base -none available prior to 1915.
*@
Moving more than 30 nd leg per hour.Only of Tropical storm intensity, but included because of high damage.
** Adjusted to 1989 dollars on basis of U. S. Department of Commercecomposite construction cost indexes. Revision of previous indexes hascaused a switch in rank of AGIES/BE"rSY and ELmWHAZEL.
-8-

Table 4, The most intense United states hurr icanes of this century (attine of landfall),
MOST INTENSE HURRICANES, UNITED STATES 1900-1989(At tine of landfall)
HUFRICANE YEAR CATEOORY MILLIBARS INCHES1. FL (Keys) 1935 5 892 26.352. CAMILLE (LA/MB) 1969 5 909 26.843. FL (Keys)/S TX 1919 4 927 27.374. FL (Lake Okeechobee) 1928 4 929 27.435. DONNA (FL/Eastern U.S.) 1960 4 930 27.46
,6. TX (Galveston) 1900 4 931 27.497. LA (Grand Isle) 1909 4 931 27.498. LA (New Orleans) 1915 4 931 27.499. CARLA (TX) 1961 4 931 27.49
10. HUGO (SC) 1989 4 934 27.5811. FL (Miamd) 1926 4 935 27.6112. HAZEL (SC/NC) 1954 4* 938 27.70
13. SE FL/LA/MS 1947 4 940 27.7614. N TX 1932 4 941 27.7915.
GLORIA (Eastern U.S.) 1985 3*& 942 27.8216. AUDREY (LA!N TX) 1957 4# 945 27.9117.
TX (Galveston) 1915 4# 945 27.9118. CELIA (S TX) 1970 3 945 27.9119. ALLEN (S TX) 1980 3@ 945 27.91
20. New England 1938 3* 946 27.9421. FREDERIC (AL/MS) 1979 3 946 27.9422. NE U.S. 1944 3* 947 27.9723. SC/NC 1906 3 947 27.9724.
BETSY (SE FL/SE LA) 1965 3 948 27.9925. SE FL/NW FL 1929 3 948 27.9926. SE FL 1933 3 948 27.9927. S TX 1916 3 948 27.9928. MS/AL 1916 3 948 27.9929. DIANA (NC) 1984 3+ 949 28.0230. S TX 1933 3 949 28.0231. BEULAH (S TX) 1967 3 950 28.0532. HILDA (Central LA) 1964 3 950 28.0533. GRACIE (SC) 1959 3 950 28.0534. TX (Central) 1942 3 950 28.0535. SE FL 1945 3 951 28.08
Continued on next page
*&#@
Moving more than 30 md1es per hour.Winds and tides did not justify 4.Classified 4 because of extreme tides.Reached Cat. 5 intensity three times along its path through the Caribbeanand Gulf of Mexico. The lowest pressure reported was 899 rob (26.55 in.)at 1742 UTC 8/7/80 off the northeastern tip of the Yucatan Peninsula.Cape Fear, NC area only; was a 2 at final landfall.+
-9-

Table 4 continued.
HUHR!CANE YEAR CATEOORY MILLIBARS INCHES36. FL (Tampa Bay) 1921 3 952 28.1137. CARMEN (Central LA) 1974 3 952 28.1138. EDNA (New England) 1954 3* 954 28.1739. SE FL 1949 3 954 28.1740. ELOISE (NW FL) 1975 3 955 28.2041. KING (SE FL) 1950 3 955 28.2042. Central LA 1926 3 955 28.2043. SW LA 1918 3 955 28.2044. SW FL 1910 3 955 28.2045. NC 1933 3 957 28.2646.
FL (Keys) 1909 3 957 28.2647. EASY (NW FL) 1950 3 958 28.29
48. N TX 1941 3 958 28.2949. NW FL 1917 3 958 28.2950. N TX 1909 3 958 28.2951.
MS/AL 1906 3 958 28.2952. ELENA (MS/AL/NW FL) 1985 3 959 28.3253.
CAROL (NE U.S.) 1954 3* 960 28.3554. IONE (NC) 1955 3 960 28.3555.
ALICIA (N TX) 1983 3 962 28.4156. CONNIE (NC/VA) 1955 3 962 28.4157. SW FL/NE FL 1944 3 962 28.4158. Central LA 1934 3 962 28.4159. SW FL/NE FL 1948 3 963 28.4460. NW FL 1936 3 964 28.47
* Moving roore than 30 mi leg per hour.
DI~ HITS BY IruRRICANESU .S. GJLF & ATLANTI C COASTS
1900-1989
Category 5: 24: 143: 442: 341: 57
TCYrAL 151
Major hurricanes (categories 3, 4, 5 ) 60
This means that during the period 1900-1989, an average of 2 majorhurricanes every 3 years made landfall somewhere along the u.s.Gulf or Atlantic coast. (All categories combined average about 5hurricanes every 3 years for the same period.)
-10-

One of the greatest concerns of the National weather Service's (NWS)hurricane preparedness officials is that the statistics in tables 1-4will mislead DeoDle into thinkina that no mJre large loss of life willoccur in a hurricane because of our advanced technoloav. Dr. RobertSheets, spokesman for the NWS hurricane warning service and Director ofNHC, as well as former Director, Dr. Neil Frank, have repeatedlyemphasized the great danger of a catastrophic loss of life in a futurehurricane if proper preparedness plans for vulnerable areas are notformulated.
The study by Hebert, Taylor, and Case (1984), updated with 1985population estimates, showed that as of 1985 almost 75% of U.S. coastalresidents from Texas to Maine have never experienced a direct hit by amajor hurricane. Many of those 43 million residents had mJved to coastalsections during the past twenty-five years. Even the landfall of Hugo hasnot lessened an ever increasing concern brought by the continued increasein coastal populations.
A look at Table 5 which lists hurricanes by decades in this centuryshows that during the twenty year period 1960-1979 both the number andintensity of landfalling U.S. hurricanes decreased sharply! Based on1900-1959 statistics from the same study, the expected number ofhurricanes and major hurricanes during the period 1960-1979 was 36 and 15,respecti vely. In fact, only 27 or 75% of the expected number of hurr icanesstruck the U.S. with only 10 major hurricanes or 67% of that expectednumber. Did the decade of the eighties show a change in this trend?
Hurricane Hugo became the first category 4 or 5 hurricane to strikethe U.S. since Candlle in 1969-a period of 20 years. On the average acategory 4 or greater hurricane strikes the U.S. once every 6 years.
Fewer hurr icanes do not necessar i ly mean a lesser threat of disaster,however. The 1919 hurricane which was both the third deadliest and thirdmost intense of this century to strike the U.S, occurred in a year whichhad a total of only three storms/hurr icanes. The most intense U. S.hurricane of record in 1935 and the seventh costliest in 1965 (Betsy)occurred in years which had a total of only six storms/hurricanes.
The conclusions are obvious. A large death toll in a U.S. hurricaneis still possible. The decreased death totals in recent years may be asITUch a result of lack of m3,jor hurricanes striking the mJst vulnerbleareas as they are of any fail-proof forecasting, warning, and observingsystems. Continued coastal growth and inflation will almost certainlyresult in every future m3,jor landfalling hurricane (and even weakerhurricanes and tropical storms) replacing one of the current costliesthurricanes. If warnings are heeded and preparedness plans developed, thedeath toll can be reduced, but large property losses are inevitable.
PMT II
In addition, to information about U.S. hurricanes, this section willalso include statistics on total tropical storm and hurricane activity.
(1) What is the average number of hurr icanes per year?Table 6 gives the average number of tropical cyclones Whichreached storm strength and hurricane strength for varioustime periods. A total of ten tropical cyclones reachingstorm strength with six of these becoming hurricanesappears to be the best averages to use based on the past40 to 50 year time period. The averages of eight tropicalcyclones and five hurricanes for the longer 104-year periodis a reflection of less detection and fewer actual stormsprior to 1930.
-11-

Table 5. Number of hurricanes of various categories to strike the Unitedstates each decade. Updated from Hebert, Taylor, and Case (1989).
CA~Y ALL MAJORDECADE 1 2 3 4 5 1.2.3.4.5 3.4.51900-1909 5 5 4 2 16 61910-1919 8 3 5 3 19 81920-1929 6 4 3 2 15 51930-1939 4 5 6 1 1 17 81940-1949 7 8 7 1 23 81950-1959 8 1 7 2 18 91960-1969 4 5 3 2 1 15 61970-197~~ 6 2 4 12 41980-198~~ 9 1 5 1 16 61900-198~~ 57 34 44 14 2 151 60
Note: Only the highest category to affect the U.S. has been used.
Table 6. Average number of tropical cyclones which reached storm strengthand hurricane strength for various time periods. Updated from Neumann, etal (1987).
NUMBER A VrnAGES ( PER YEAR)PERIOD OF )"EJ..RS 'IROPI~ CYcr..ONESJ. HURRICANES1886-1989 104 8.4 4.91940-1989 50 9.7 5.61950-1989 40 9.7 5.81960-1989 30 9.4 5.41970-1989 20 9.4 5.11975-1989 15 9.3 5.31980-1989 10 9.3 5.2
3.Include:~ subtropical storITS after 1967
-12-

(2) ~1at year(s) have had the most and least hurricanes?Table 7 shows the years of maximum and minimum tropicalcyclone and hurricane activity for the entire Atlantic Ocean.
The only years when a hurricane failed to strike the U.S.coast were 1902, 1905, 1907, 1914, 1922, 1927, 1930, 1931,1937,1951,1958,1962, 1973, 1978, 1981, and 1982. Notethat only twice has the U. S. gone as long as two yearswithout a hurricane. The most hurricanes to strike the U.S.in one year were six in 1916 and 1985. There were five in1933, and four in 1906,1909, and 1964. Three hurricaneshave struck the U.S. in one year a total of fifteen times.Ten of these fifteen times occurred during the period1944-19591
In this century three or more hurricanes have struck theU.S. an average of once every four vears! See Table 13. Achronological list of all hurricanes to strike the u.S.during this century through 1982 including month, categoryby states affected, and mdnimum sea level pressure atlandfall can be found in Hebert, Taylor, and Case (1984).This list will be updated in the next version of thatpublication (probably in 1991), but the information isavailable at the National Hurricane Center.
(3) When did the earliest and latest hurricane occur?The hurricane season is defined as June 1 through November30. An early hurricane can be defined as occurring in thethree months prior to the start of the season, and a latehurricane can be defined as occurring in the three monthsafter the season. With these criteria the earliest observedhurricane in the Atlantic was on March 7, 1908, while thelatest observed hurricane was on December 31, 1954.The earliest hurricane to strike the u.s. in this centurywas Alma which struck northwest Florida on June 9, 1966.The latest hurricane to strike the u.s. was late onNovember 30, 1925 near Tampa, Florida.
(4) What were the longest-lived and shortest-lived hurricanes?Ginger in 1971 holds the record for both the most number ofdays as a hurr icane (20) and tropical cyclone (31). Therehave been many tropical cyclones Which attained hurr icaneintensity for periods of 12 hours or less.
(5) What were the strongest and weakest Atlantic hurricanes? Tostrike the United states?
In terms of central pressure (and probably winds), thestrongest observed hurricane in the Atlantic basin wasGilbert in 1988 with a pressure of 888 rod11ibars whilelocated in the northwest Caribbean. The 1935 Labor Dayhurr icane in the Flor ida Keys with a pressure of 892rodllibars was the strongest hurricane to strike the U.s.Numerous hurr icanes have reached only the rodnimum windspeed of 74 rod les per hour and struck the U. S .
-13-

(6) How many hurricanes have there been in each month?Table 8 adapted from Neumann, et al (1987) shows the totaland average number of tropical cyclones and those whichbecane hurr icanes by months for 1the per iod 1886-1989. Inaddi tion, the monthly total and civerage number ofhurricanes to strike the u.s. in this century (updatedfrom Hebert, et ai, (1989) are g:iven.
Table 7. Years of maximum and mdnimum tropical (~yclone and hurr icaneacti vi ty in the North Atlantic Ocean, Car ibbean Sea, and Gulf of Mexicoduring the period 1871-1989 (from Neumann, et aI, 1987).
MAX I MUM AC-r I VI TY
'IR OP I CAL CY cr..OOES ~ HURR I CANES 2
NUMBER YEAR ( S ) NUMBm YEAR ( S )
21 1933 12 196918 1969 11 1916, 195017 1887 10 1887,1893,193316 1936 9 1955, 1980
MINIMUM ACrIVITY
TROP I CAL CYcr.ONES 1. HUI~ I C~ 2
NUMBER YEAR ( S ) NUMBm- YEAR ( S )1 1890, 1914 0 1907, 19142 1925,1930 1 1890, 1905, 1919, 1925
2 1895,1897,1904, 1917,1922,1930,1931,1982
1.Inc1udes subtropical storms after 1967. See Neumann, et al (1987).2After 1885.
Table 8. Total and average number of tropical cyclones and hurr icanes in theNorth Atlantic Ocean, Caribbean Sea, and Gulf of Mexico by month of origin forthe period 1886-1989 (from Neumann, et aI, 1987), and for hurricanes strikingthe u.S. coast in this century (updated from Hebert, Taylor, and Case, 1989).
om. CP I CAr.. CY cr.OOES 1. HURR I CANES U .S. HURR I CANE S 2
MONTH rorAL AVG. rorAL AVG. rorAL AVG.JAN-APRIL 3 * 1 * 0 0.0MAY 14 0.1 3 * 0 0.0JUNE 56 0.5 23 0.2 11 0.1JULY 65 0.6 34 0.3 16 0.2AUGUST 210 2.0 148 1.4 36 0.3~ 298 2.9 187 1.8 61 0.6OCTOBER 181 1.7 91 0.9 23 0.2NOvg-mrn. 42 0.4 21 0.2 4 *DEXEiBER 6 0.1 3 * 0 0.0YEAR 875 8.4 511 4.9 151 1.5
~Includes subtropical storms after 1967. See Neumann, et al (1981) for details.21900-1989.
* Less than 0.05.
-14-

( 7) What was the largest number of hurr icanes in existence in theAtlantic Ocean at the same time?
According to information on the master data tape ofNeumann, et al (1987), there have never been fourhurr icanes in existence in the North Atlantic at the sametime in this century. On August 22, 1893 four hurricanesco-existed, one of them being the hurricane Which killed anestimated 2,000 people in Georgia-South Carolina severaldays later.
On September 11, 1961 three hurricanes and possibly afourth existed. The only other years in this century withthree hurricanes on the map at the same time were 1950 and1967.
(8) How many direct hits by hurricanes of various categories haveaffected each state?
Table 9, updated from Hebert, Taylor, and Case (1989),shows the number of hurricanes (direct hits) affecting theU.S.and individual states. The table shows that on theaverage close to two hurricanes oer year strike the U.S.,While two major hurricanes cross the U.S. coast someWhereevery three years.
Other noteworthy facts, updated from Hebert, Taylor, andCase (1989), are: 1.) Thirty-six percent of all u.s.hurricanes hit Florida; 2.) Seventy-five percent ofcategory 4 or higher hurricanes have hit either Florida orTexas; 3.) Approximately one out of every two hurricanes isa major one along the middle Gulf coast, southern Florida,and New York and southern New England.
(9) When are the major hurricanes likely to strike given areas?Table 10 shows the incidence of major hurricanes by monthsfor the u.s. and individual states. For the United statesas a Whole, September has had more major hurricanes thanall other months combined. Only in Texas and Louisiana areAugust major hurr icanes almost an equal threat. Most majorOctober hurricanes occur in southern Florida.
However, three of the most devastating hurricanes did nQtoccur in September--AUDREY (1957) in June, CAMILLE (1969)in August, and HAZEL (1954) in October.
(10)
How long has it been since a major hurricane directly hit agiven community? Any hurricane? Indirectly?
Table 11 summarizes the occurrence of the last majorhurricane or of any hurricane to directly hit the morepopulated coastal communities from Brownsvil1e, Texas toEastport, Maine. In addition, if a hurricane indirectlyaffected a community after the last direct hit, it islisted in the last column of the table.
-15-

Table 9. Number of hurr icanes (direct hits) affecting the U. S. and irnji vidualstates 1900-1989 according to Saffir/Simpson scale. UPdated from He~rt,Taylor, and Case, (1989).
AREA ALL MAJOR
H1JRRICANES1 2 3 4 5 (:?:3)U.S.
(Texas to 57 34 44 14 2 151 60Maine)
CATm)RYNUMBm
12723814
17916416
102001*32021*5
9324511
15773
1044311*0002*1*1*1*0
9315755
1660570281*0005*3*3*2*00
641130050023021*0000000000
0000110100100000000000000
3617
613248
1054228
17245
1422
41*01*874*52*5
15726
1165
22608
100491*0005*3*3*2*00
Texas(North)(Central)(South)
LouisianaMississippiAlabanaFlorida
(North~st)(Northeast)(Southwest)(Southeast)
GeorgiaSouth CarolinaNorth CarolinaVirginiaMarylandDela\6reNew JerseyNew YorkConnect icutRhode IslandMassachusettsNew HanpshireMaine
Indicates all hurricanes in this category were moving greater than 30 mph.*
Note: state totals will not equal U.s. totals and Texas and Floridasectional totals will not necessarily equal state totals.
-16-

Table 10. Incidence of najor hurricanes (direct hits) by IOOnths to affectthe United states and individual states (1900-1989) according to theSaffirlSimpson Scale (updated from Hebert, Taylor, and Case, 1989).
MONTH
AREA JUNE JUL Y -AUG .SEPT .~ .~U.S. (Texas to 2 3 13 35 7 60
Maine)
11
11
731331
6213544
155
15726
1165
22608
100491000533200
2 11111
1 5
57
321
371
111
111
4222
Texas(North)(Central)(South)
LouisianaMississippiAlabanaFlorida
(North~t)(Northeast)(South~st)(Southeast)
GeorgiaSouth CarolinaNorth CarolinaVirginiaMarylandDelawareNew JerseyNew YorkConnecticutRhode IslandMassachusettsNew HaITt)ShireMaine
Note: state totals will not equal U. s. totals and Texas and Flor idasectional totals will not necessarily equal state totals.
-17-

Table 11.. Last occurrence of a direct or indirect hit by any hurricane and/orby a major hurricane at the more populated coastal communities from Texas toMaine (updated from Hebert, Taylor, and Case, 1989). Category is inparenthe~ses .
DIREX:-r INDI~STATE CITY LMT MAJoo' LM;T ANY ~ ANYTexas Brownsville 1980(3) Allen 1980(3) Allen
Corpus Christi 1970(3) Celia 1971(1) Fern 1980(3) AllenPort Aransas 1970(3) Celia 1971(1) Fern 1980(3) AllenMatagorda 1961(4) Carla 1971(1) Fern 1983(3) AliciaFreeport 1983(3) Alicia 1983(3) AliciaGalveston 1983(3) Alicia 1989(1) JerryHouston 1941(3) 1989(1) JerryBeaumont <1900 1986(1) BonnieCameron 1957(4) Audrey 1985(1) Danny 1985(1) JuanMorgan City 1974(3) Carmen 1985(1) JuanHouma 1974(3) Carmen 1985(1) JuanNew Orleans 1965(3) Betsy 1965(3) BetsyBay st. Louis 1985(3) Elena 1985(3) ElenaBiloxi 1985(3) Elena 1985(3) ElenaPascagou1a 1985(3) Elena 1985(3) ElenaMobile 1985(3) Elena 1985(3) ElenaPensacola 1926(3) 1926(3) 1979(3)Panama City 1975(3) Eloise 1985(2) KateApa1achicola 1985(3) Elena 1985(2) KateHomosassa 1950(3) Easy 1968(2) Gladysst. Petersburg 1921(3) 1946(1) 1968(2)Tampa 1921(3) 1946(1) 1968(2)Sarasota 1944(3) 1946(1) 1966(2)Fort Myers 1960(3) Donna 1960(3) Donna 1966(2)Naples 1960(4) Donna 1964(2) Isbell 1965(3)Key west 1948(3) 1987(1) FloydMiand 1950(3) King 1964(2) Cleo 1965(3)Fort Lauderdale 1950(3) King 1964(2) Cleo 1965(3)west Palm Beach 1949(3) 1979(2) DavidStuart 1949(3) 1979(2) DavidFort Pierce 1933(3) 1979(2) DavidVero Beach <1900 1979(2) DavidCocoa <1900 1979(2) DavidDaytona Beach <1900 1960(2) Donna 1979(2)st. Augustine <1900 1964(2) DoraJacksonville <1900 1964(2) DoraFernandina Beach <1900 1928(2) 1964(2) DoraBrunswick <1900 1928(1)Savannah <1900 1979(2) DavidHilton Head 1959(3) Gracie 1979(2) David 1985(1) BobCharleston 1989(4) Hugo 1989(4) HugoMyrtle Beach 1954(4*) Hazel 1954(4*) Hazel 1989(4) HugoWilmdngton +1960(3*) Donna 1984(2) DianaMorehead City 1960 (3*) Donna 1960 (3*) DonnaCape Hatteras 1985(3*) Gloria 1986(1) Charley
Louisiana
1969(5)
CamilleMississippi
AlabamaFlorida Fred-eric
GladysGladysAlnaAlnaBetsy
BetsyBetsy
David
Georgia
SouthCarolina
NorthCaIolina
1985(3*)
Gloria
+ Cape Fear only -Direct 3.
-18-

Table 11. continued.
D I REC'I' I NO I RECrSTATE CITY LAST MAJOR LMT M..fY LAST M..fYVirginia Virginia Beach 1944(3*) 1986(1) Charley
Norfolk <1900 1955(1) Connie 1985(3*) GloriaMaryland Ocean City <1900 <1900 1985(3*) Gloria
Baltimore <1900 <1900 1954(2*) HazelDelaware Rehoboth Beach <1900 <1900 1985(3*) Gloria
Wilndngton <1900 <1900 <1900New Jersey Cape May <1900 1903(1) 1985(3*) Gloria
Atlantic City <1900 1903(1) 1985(3*) GloriaNew York New York City <1900 1903(1) 1976(1) Belle
westhampton 1985(3*) Gloria 1985(3*) GloriaConnecticut New London 1938(3*) 1972(1) Agnes 1985(2*) Gloria
New Haven 1938(3*) 1985(2*) GloriaBridgeport 1954(3*) Carol 1985(2*) Gloria
Rhode Island Providence 1954(3*) Carol 1985(2*) GloriaMassachusetts Cape Cod 1954(3*) Edna 1954(3*) Edna 1985(2*) Gloria
Boston <1900 1960(1*) Donna 1985(2*) GloriaNew Hampshire Portsmouth <1900 1985(2*) GloriaMaine Portland <1900 1985(1*) Gloria
Eastport <1900 1969(1) Gerda 1985(1*) Gloria
* Moving roore than 30 miles per hour. <1900 neans before 1900
Perhaps the most illustrative example of the uncertainty ofwhen a hurricane mdght strike a given locality is Pensacola,Florida. Although Dunn (1967) listed Pensacola as the citywith the second highest frequency of hurricane force windsin the United states (1 in 10), it has been more than 60years since any hurricane directly struck Pensacola!
In order to obtain the same type of information listed inTable 11 for the remaining coastal communities, the readeris referred to Hebert, Taylor, and Case (1984).
(11) What is the total U. S. damage (unadjusted and adjusted) and deathtoll for each year of this century?
Table 12 summarizes this information. Tables 12a-c rank theyears. In most years the death and damage totals are usuallythe result of a single, major hurricane. Gentry (1966) givesdamages adjusted to 1957-59 costs as a base for the period1915-1965. For the most part, death and damage totals forthe period 1915-1965 were taken from Gentry's paper, and forthe remaining years from the Monthly weather Review. Adjusteddamages were calculated to 1989 dollars by the same factorsas used in Table 3a.
(12) Are there hurricane cycles?Figures 1 through 9 show the landfalling portion of themajor hurr icanes which have struck any portion of theUni ted states dur ing this century.
-19-

Table 12. Estimated annual deaths and damages (unadjusted and adjusted~)in the United states for each year of this century.
YEAR DAMAGE ($ MILLIONS) YEAR DEATHS DAMAGE ($ MILLIONS)
UNADJUSTED ADJUSTED UNADJUSTED ADJUSTED1900 6000+ 30 (689)2 1945 7 80 7031901 10 1 * 1946 0 5 371902 0 Minor Minor 1947 53 136 8511903 15 1 * 1948 3 18 1031904 5 2 * 1949 4 59 3371905 0 Minor Minor 1950 19 36 2021906 298 3+ * 1951 0 2 101907 0 0 0 1952 3 3 151908 0 0 0 1953 2 6 301909 406 8 * 1954 193 756 38031910 30 1 * 1955 218 985 48661911 17 1+ * 1956 19 27 1261912 1 Minor Minor 1957 400 152 6901913 5 3 * 1958 2 11 501914 0 0 0 1959 24 23 1061915 550 63 14483 1960 65 396 18261916 107 33 657 1961 46 331 15291917 5 Minor Minor 1962 3 2 91918 34 5 65 1963 10 12 541919 287 22 253 1964 49 515 23331920 2 3 27 1965 75 1445 64301921 6 3 34 1966 54 15 641922 0 0 0 1967 18 200 8261923 0 Minor Minor 1968 9 10 391924 2 Minor Minor 1969 256 1421 51301925 6 Minor Minor 1970 11 454 15301926 269 107 1229 1971 8 213 6711927 0 0 0 1972 121 2100 62791928 1836 25 287 1973 5 3 81929 3 1 11 1974 1 150 3531930 0 Minor Minor 1975 21 490 10581931 0 0 0 1976 9 100 2081932 0 0 0 1977 0 10 191933 63 47 638 1978 36 20 341934 17 5 62 1979 22 3045 45371935 414 12 149 1980 2 300 4021936 9 2 25 1981 0 25 311937 0 Minor Minor 1982 0 Minor Minor1938 600 300 3447 1983 22 2000 23401939 3 Minor Minor 1984 4 66 751940 51 5 60 1985 30 4000 43601941 10 8 89 1986 9 17 181942 8 27 260 1987 0 8 81943 16 17 154 1988 6 9 91944 64 165 1493 1989 56 7670 7670
DEATHS
~Adjusted to 1989 dollars on basis of U.S. Department of Commercecomposite construction cost indexes.
2Using 1915 cost adjustment base -none available prior to 1915.3Considered too high in 1915 reference.
* Not available
-20-

Table l2a. &C5tirrated deaths j.n the United states for each year of thiscentury ranked according to amnual total.
RANK YEAR TO']'AL RANK YEAR TOTAL
1 1900 6000+ 37 1911 172 1928 1836 37 1934 173 1938 EiOO 39 1943 164 1915 ~i50 40 1903 155 1935 ~114 41 1970 116 1909 ~106 42 1901 107 1957 ~IOO 42 1941 108 1906 ~~98 42 1963 109 1919 ~~87 45 1936 9
10 1926 ~~69 45 1968 911 1969 ~~56 45 1976 912 1955 ~~18 45 1986 913 1954 ].93 49 1942 814 1972 ].21 49 1971 815 1916 ].07 51 1945 716 1965 75 52 1921 617 1960 65 52 1925 618 1944 64 52 1988 619 1933 63 55 1904 520 1989 56 55 1913 521 1966 54 55 1917 522 1947 53 55' 1973 523 1940 51 59 1949 424 1964 49 59 1984 425 1961 46 61 1929 326 1978 36 61 1939 327 1918 34 61 1948 328 1910 30 61 1952 328 1985 30 61 1962 330 1959 24 66 1920 231 1979 22 66 1924 231 1983 22 66 1953 233 1975 21 66 1958 234 1950 19 66 1980 234 1956 19 71 1912 136 1967 18 71 1974 1
Note 1: There ~re 18 years jln "*tich no deaths occurred.. .1902,1905,1907,1908,1914,1922,1923,1927,1930,1931,1932,1937,1946,1951,1977,1981,1982,1987.
Note 2: Death totals in this table do not agree with those in table 2because the latter included deaths on ships at sea.
-21-

Table l2b. Estimated damages (unadjusted) in the United states for eachyear of this century ranked according to annual total.
RANK YEAR DAMAGE RANK YEAR DAMAGE($ millions) ($ millions)
1 1989 7670 37 1959 232 1985 4000 38 1919 223 1979 3045 39 1978 204 1972 2100 40 1948 185 1983 2000 41 1943 176 1965 1445 41 1986 177 1969 1421 43 1966 158 1955 985 44 1935 129 1954 756 44 1963 12
10 1964 515 46 1958 1111 1975 490 47 1968 1012 1970 454 47 1977 1013 1960 396 49 1988 914 1961 331 50 1909 815 1938 300 50 1941 815 1980 300 50 1987 817 1971 213 53 1953 618 1967 200 54 1918 519 1944 165 54 1934 520 1957 152 54 1940 521 1974 150 54 1946 522 1947 136 58 1906 3+23 1926 107 59 1913 324 1976 100 59 1920 325 1945 80 59 1921 326 1984 66 59 1952 327 1915 63 59 1973 328 1949 59 64 1904 229 1933 47 64 1936 230 1950 36 64 1951 231 1916 33 64 1962 232 1900 30 68 1911 1+33 1942 27 69 1901 133 1956 27 69 1903 135 1928 25 69 1910 135 1981 25 69 1929 1
Note 1: Eleven years had mdnor damage...1902,1905,1912,1917,1923,1924,1925,1930,1937,1939,1982.
Seven years had no damage...1907,1908,1914,1922,1927,1931,1932.Note 2:
-22-

Table 12c. Estimated damages (adjusted to 1989 dollars)~ in the Unitedstates for each year of this century ranked according to annual total.
RANK YEAR DAMAGE RANK YEAR DAMAGE($ millions) ($ millions)
1 1989 7670 33 1976 2082 1965 6430 34 1950 2023 1972 6279 35 1943 1544 1969 5130 36 1935 1495 1955 4866 37 1956 1266 1979 4537 38 1959 1067 1985 4360 39 1948 1038 1954 3803 40 1941 899 1938 3447 41 1984 75
10 1983 2340 42 1918 6511 1964 2333 43 1966 6412 1960 1826 44 1934 6213 1970 1530 45 1940 6014 1961 1529 46 1963 5415 1915 15112 47 1958 5016 1944 1493 48 1968 3917 1926 1229 49 1946 3718 1975 1058 50 1921 3419 1947 851 50 1978 3420 1967 826 52 1981 3121 1900 7193 53 1953 3022 1945 703 54 1920 2723 1957 690 55 1936 2524 1971 671 56 1977 1925 1916 657 57 1986 1826 1933 638 58 1952 1527 1980 402 59 1929 1128 1974 353 60 1951 1029 1949 337 61 1962 930 1928 287 61 1988 931 1942 260 63 1973 832 1919 253 63 1987 8
Note 1: Eleven years with mdnor damage...1902,1905,1912,1917,1923,1924,1925,1930,1937,1939,1982.
Note 2: Seven years with no damage...1907,1908,1914,1922,1927,1931,1932.
Note 3: Eight years prior to 1915 not adjusted...1901,1903,1904,1906,1909,1910,1911,1913.
~Adjusted to 1989 dollars on basis of u.s. Department of Commercecomposite construction cost indexes.
2Considered too high in 1915 reference.3Using 1915 cost adjustment base -none available prior to 1915.
-23-

: .".' ., .I, : "!. -.., -
l --,-.
(trMAJOR U.S. HURRICANES(?CATEGORY 3)
1901 -1910
4&
'0
3~
~ ,,, .
"', .
'. +: 1909, ,
)6
3&1909~
~'---\f"'v
""'19CS \ 19061909\ ,
,.. ~
2~
4
Figure 1. Major landfa11ing United states hurricanes (greater than orequal to a category 3) during the period 1901-1910.
f"T...MAJOR U.S. HURRICANES
(2: CATEGORY 3)
1911 -1920,. -,- , ,
48T ,-
;.-.:." ~~/
J,
'0 "0 .,(.'".. .-"'., . ,.-' --'
;---
"
35
--[r:- 0
1917,
38
1910-:=
\191~91~16.
to, '., -I,
~q
2~ ') t1916
") --.Figure 2. Major landfalling United states hurricanes (greater than orequal to a category 3) during the period 1911-1920.
-24-

MAJOR U.S. HURRICANES(~CATEGORY 3)
1921 -1930
48 ..: ;-~,--
," ~Ibl
~;)11
,.-_.:_-,---
"..
-;l3~
38
\
25
., 4r~~
Figure 3. Major landfalling United states hurricanes (greater than orequal to a category 3) during the period 1921-1930.
.' , I, .'., I, I
1938 .,'-5"--J ;' --,-, \ I
-, ,..-;;~- .. --~, I
~~ :~~ -
Ir~
I ~.
1/~~)t..,,)'-'
MAJOR U.S. HURRICANES(:2:, CATEGORY 3}
1931 -1940",
48 ..,I'-
"0 .,
, "..'-".,'
,.". .
--.:--;---
..r
-25-

j'~ J
1944~~""7 .,:
Ir
MAJOR U.S. HURRICANES(?CATEGORY 3)
1941 -1950
r
;;-- -, .I "'\
.' '-
441
-" '(.
..,..-
3 '..1
"II
I...( ..
I : ~J ' .I
41 '.1947'
b~:;:;~~~~
.._°__°..'
,"-~ --
~~,-;---if'I..-;-~ , , --I
194~'\ 194
, 'rrI~
3'1
1948
'"
1-"'"I
: ~ ~ 1942~
19441944
., ~
Figu]~e 5. Major landfalling United states hurricanes (greater than orequa:l to a category 3) during the period 1941-1950.
r" i
MAJOR U.S. HURRICANES(~ CATEGORY .3 )
1951 -1960
I
.l--,.~ , I ,
Il~-~~48' '-I-:~--
.,'O', .,.'-
II.I
'I,, I'. ). ;, -..~- -~
0 ;'~ -,
(,.--'. --
--'~--7--lONE
'II
3~ c-,0
.0'I"0 I.
I
~~--+-~'~~.
':--~ ~,.
3&1
..--q
20.., ~I~.)-DONNA t
1960-
Figu:re 6. Major landfalling United states hurricanes (greater than orequal to a category 3) during the period 1951-1960.
-26-
I.'I..) "'
0
II
..I.I
I
: r J.-~"'-"'"
~ ,-.~
19421948
KING

,~vMAJOR U.S. HURRICANES(~CATEGORY 3)
1961 -1970'-1 ', ,
" i
" i-I
IIII
48
..\ ).*--"', .",,---j
35 ., , I"', : I .' I .'. .,.I I, '." ,i CAMILLE'
.;BETSY-HILDA
HILDA1964
~CELIA-I970CARLA-196t .
/-.°__°...
38
-"BETSY.1965 +:-'J \ I
t25
BEULAH -1967
" -
Figure 7. Major landfalling Unit~~ States hurricanes (greater than orequal to a category 3) during the period 1961-1970.
, I I, ,'.'I I, , ,'. .L" -Co:'.
J__c,
vMAJOR U.S. HURRICANES
(~CATEGORY 3)
1971 -1980
"'.1- ::\1 \. ."'-
,...
"I.4D
-~., '("
\.,~.,,.
-_.~~:.i--
., ,.."-;, -",A ./ ---
3S
'- -'- _O.'
38
~q
2~ .-" , I'-.Jt
., -r"-.~
Figure 8. Major landfalling United states hurricanes (greater than orequal to a category 3) during the period 1971-1980.
-27-

v
"""
MAJOR U.S. HURRICANES(2 CATEGORY '3)
1981 -1990
!~:
,, ..
,\ .'.
,.,I
-I -
48-: -,-,-"' .,.,,-., '
(.,.
.' .". ~.
__4 ..'./
.
.I.; "', .;I .
~-~-
35 ,,,.I ',
."I
.II
~~~~:~ ~'"C
ELENA1985
:"", I
' i...\ I, ELEN~
;. ..~,, C~""~
'~ 1
ALICIA
\38
a
~'ALICIA1983
,,.0".~
( ,
-qas
") 4
Figure 9. Major landfa11ing United states hurricanes (greater than orequal to a category 3) during the period 1981-1989.
THIS S~IOO ImmrIOOM.LY LEFT BLANK
-28-

The reader mdght note the tendency of the majorhurr icanes to cluster in certain areas dur ing certaindecades. Another interesting point is the generaltendency for this clustering to occur in the latter halfof individual decades in one area and in the first halfof individual decades in another area. During the veryactive period of the thirties this clustering is notapparent.
A compar ison of twenty-year per iods beginning in 1900indicates that the major hurricanes tended to be in thewestern Gulf Coast states at the beginning of the century,shifting to the eastern Gulf Coast states and Floridaduring the next twenty years, then to Florida and theAtlantic Coast states during the forties and fifties, andback to the western Gulf Coast states in the sixties and
seventies. Does figure 9 indicate a shift to the easternGulf Coast states, Florida, and the Atlantic Coast statesin the eighties and nineties?
THIS S~IOO INTmTIONALLY LEI'""!' BLANK
-29-

(13) Are there hurr icane cycles evident in certain years regardlessof category or geographical area?
Table 13 gives a tabulation of hurricanes of allcategories to affect the U.S. by individual yearswithin each decade.
Table 13. Major and all category landfalling hurricanes in the Unitedstates by individual years.
MAJOR
00 01 02 03 04 05 06 07 08 09 TarAL1900-09 1 2 3 61910-19 1 2 2 1 1 1 81920-29 1 2 1 1 51930-39 1 3 1 1 1 1 81940-49 1 1 2 1 1 1 1 81950-59 2 3 2 1 1 91960-69 1 1 1 1 1 1 61970-79 1 1 1 1 41980-89 1 1 1 2 1 6TOTAL 7 3 2 4 9 10 7 4 4 10 601990-99
ALL00 01 02 03 04 05 06 07 08 09 'rorAL
1900-09 1 2 2 1 4 1 4 151910-19 2 2 2 2 3 6 1 1 1 201920-29 2 2 1 2 1 3 2 2 151930-39 2 5 2 2 3 2 1 171940-49 2 2 2 1 3 3 1 3 3 3 231950-59 3 1 3 3 3 1 1 3 181960-69 2 1 1 4 1 2 1 1 2 151970-79 1 3 1 1 1 1 1 3 121980-89 1 1 1 6 2 1 1 3 16TOTAL 14 12 8 16 17 20 23 8 11 22 1511990-99
Figures 1 through 9 certainly support the existence of acyclical nature of major hurricanes affecting given regionsTable 13 is also suggestive of preferred periods. However,it is left to the reader to decide what weight should begiven to these statistics.
-30-

4. SUMMARY
In virtually every coastal city of any size from Texas to Maine,both present Director, Dr. Robert Sheets, and former Director, Dr. NeilFrank, have stated that the United States is building toward a hurricanedisaster.
The population growth versus low hurricane experience levelsindicated in Hebert, Taylor, and Case (1984), together with updatedstatistics presented in the discussion section of this paper, form thebas is for their statements. Stated simply, the areas of the United StatesWhere 9 out of 10 persons have lost their lives by drowning from thestorm surge dur ing hurr icanes (alonq the immediate Gulf of Mexico andAtlantic shorelines) are the very areas Where the most dramaticincreases in population have occurred in recent years. This situation, incombination with continued building on low coastal elevations, will leadto serious problems for many areas in future hurricanes. Since it islikely that people will always live along the immediate shoreline, apleasant way of life, the solution to the problem lies in education andpreparedness.
The message to coastal residents is this: Become famdliar with Whathurricanes can do, and When a hurricane threatens your area, increaseyour chances of survival by moving away from the water until thehurr icane has passed! Unless this message is clearly understood bycoastal residents through a thorough and continuing preparedness effort,a future di:saster is inevitable.
Acknowledge:ments: The work of J.G. Taylor, co-author of previous versionsof this paper, contributed much. Joan David drafted the figures.
~CES
Dunn, G.E., and Staff, 1967: Florida Hurricanes, ESSA Technical MemorandYmWB'IM-SR-38, 28 pp.
Gentry, R.C., 1966: Nature and Scope of Hurricane Damage, American Societyfor Q::eanography, Hurricane Synposium, Publication NlU11ber One. 344 pp.
Hebert, P.J., J.G. Taylor, and R.A. Case, 1984: Hurricane Experience Levelsof Coa:stal County Populations -Texas to Maine, NOM,TechnicalMemora~ NWS-NHC-24, 127 pp.
Hebert, P.J., J.G. Taylor, and R.A. Case, 1989: The Deadliest, Costliestand Most Intense United States Hurr icanes of This Century (and OtherFrequently Requested Hurr icane Facts), NOM, Techn ical Mernor andumNWS-NHC-31, 27 pp.
Neumann, C.J., B.R. Jarvinen, A.C. Pike, and J.D. Elms, 1987: TropicalCyclones of the North Atlantic Q::ean, 1871-1986, NOM, HistoricalC1im3to1ogy Series 6-2,186 pp.
Saffir, H.S., 1977: Design and Construction Requirements for HurricaneResistant Construction, American Society of Civil Engineers, New York,PreQrint Number 2830,20 pp.
Sheets, R.C., 1984: The National weather Service Hurricane ProbabilityProgram, NOM, Technical Reoort NWS-37, 70 pp.
Simpson, R.H., and M.B. Lawrence, 1971: Atlantic Hurricane Frequencies Alongthe U.S. Coastline, NOM, Technical Memorandum NWS-SR-58, 14 pp.
Simpson, R.H., 1971: A Proposed Scale for Ranking Hurricanes by Intensity,Minutes of the Eighth NOM, NWS, Hurricane Conference, Miami, Fla.
U.S. weather Bureau: Month1v weather Review, 1872-1970 (National weatherService 1971-1973, and American Meteorological Society 1974-1990).
U.S. weather Bureau: Clim3to10<Jical Data and Storm Data, various vo1UJres,various periods, National and State Summaries (National weather Service
1971-1990).
-31-