Embed Size (px)
Citation preview
SAMPLING AND BIOSTATISTICS
Sequential Sampling for Panicle Caterpillars (Lepidoptera: Noctuidae)in Sorghum
N. C. ELLIOTT,1,2 M. J. BREWER,3 K. L. GILES,4 G. F. BACKOULOU,4 B. P. MCCORNACK,5
B. B. PENDLETON,6 AND T. A. ROYER4
J. Econ. Entomol. 107(2): 846Ð853 (2014); DOI: http://dx.doi.org/10.1603/EC13413
ABSTRACT Panicle caterpillars comprise an economically important insect pest complex of sor-ghum throughout the Great Plains of the United States, particularly in Kansas, Oklahoma, and Texas.The sorghum panicle caterpillar complex consists of larvae of two polyphagous lepidopteran species:the corn earworm, Helicoverpa zea (Boddie), and fall armyworm, Spodoptera frugiperda (J.E. Smith)(Lepidoptera: Noctuidae). Sampling for panicle caterpillars in sorghum Þelds is usually accomplishedby the beat bucket sampling technique with a Þxed sample size of 30 beat bucket samples of onesorghum panicle each per 16.2 ha of Þeld. We used WaldÕs sequential probability ratio test for a negativebinomial distribution to develop a sequential sampling plan for panicle caterpillars. In total, 115 sorghumÞelds were sampled in Kansas, Oklahoma, and Texas from June to August 2010. Panicle caterpillars had anaggregated distribution of counts conÞrmed by PearsonÕs chi-square statistic for lack of Þt to the negativebinomial distribution for each sampled Þeld. A sequential sampling plan was developed using a highthreshold (an economic threshold) of 0.5 caterpillars per sorghum panicle, a low threshold (a safe level)of 0.20 caterpillars per panicle, and Þxed error rates (� � 0.10 and � � 0.05). At caterpillar densities �0.45and �0.12 per panicle, the average number of panicles inspected to make a decision was less than thecurrent recommendation of 30. In a 2013 validation test of 25 Þelds, the expectednumber of samples takenfromaverage samplenumber curvewas in close agreementwith thenumberof samples requiredusing thesequential plan (r2 � 0.93), and all Þeldswere correctly classiÞedwhen comparedwith a Þxed sample sizeresult. The plan improved upon current sampling recommendations for panicle caterpillars in sorghumbecause at known acceptable Þxed error rates fewer samples were required when caterpillars are scarceor abundant,whereasmore sampleswere required tomakedecisionswith the same acceptable error rateswhen densities were near the economic thresholds.
KEY WORDS integrated pest management (IPM), sequential sampling, corn earworm, fall armyworm,Helicoverpa zea
The United States produces the most sorghum of anynation, and most of that is produced in Kansas, Ne-braska, Oklahoma, and Texas (U.S. Department ofAgriculture [USDA] 2010). Panicle caterpillars com-prise an economically important insect pest complexof sorghum throughout the Great Plains of the UnitedStates, particularly in Kansas, Oklahoma, and Texas.The sorghum panicle caterpillar complex consists oftwo polyphagous lepidopteran species: the corn ear-
worm, Helicoverpa zea (Boddie), and the fall army-worm, Spodoptera frugiperda (J.E. Smith) (Lepidop-tera: Noctuidae). In a recent survey, growers rankedthe panicle worm complex as the second most impor-tant insect pest behind greenbugs (Pendleton et al.2000). Moths of these species lay eggs on the leavesandpanicles of sorghumduring the summer, and feed-ing by the larvae can cause severe economic damageto the sorghum crop. Burkhardt (1957) observed thatone to two H. zea larvae per sorghum panicle resultedin 10Ð25% grain loss. Nearly all of the damage ob-served in the Þeld is caused by third- to sixth-instar H.zea feeding on sorghum seeds in the soft dough stage(Kinzer and Henderson 1968). Kinzer and Henderson(1968) also found that Þrst and second H. zea instarspreferred ßowering sorghum. More recently, Soper etal. (2013) demonstrated that H. zea and S. frugiperda(corn strain) larvae feeding on sorghum seeds grow atequivalent rates and the soft dough stage of sorghumwas most vulnerable to yield loss by these species.
The beat bucket technique is considered the mostefÞcient way to sample for panicle caterpillars and
Mention of trade names or commercial products in this article issolely for the purpose of providing speciÞc information and does notimply recommendation or endorsement by the U.S. Department ofAgriculture.
1 USDA-ARS Plant Science Research Laboratory, 1301 N. WesternRd., Stillwater, OK 74075.
2 Corresponding author, e-mail: [email protected] Texas AgriLife Research and Extension Center Corpus Christi,
10345 Hwy. 44, Corpus Christi, TX 78406.4 Department of Entomology and Plant Pathology, Oklahoma State
University, 127 Noble Research Center, Stillwater, Oklahoma 74078.5 Brian McCornack, Department of Entomology, Kansas State Uni-
versity, 204 Waters Annex, Manhattan, KS 66506.6 Department of Agricultural Sciences, P. O. Box 60998, West Texas
A&M University, Canyon, TX 79016.
some other panicle-feeding insects in sorghum (Tee-tes and Wiseman 1979, Merchant and Teetes 1992). Amajor limitation of sampling by beat buckets is that itis basedon aÞxed sample size,whichwas set at 30 beatbucket samples per 16.2 ha of Þeld by Cronholm et al.(2007). Sampling with a Þxed sample size is ofteninefÞcient because too much time is spent samplingÞelds with low or high population densities (Binns1994). A second limitation of a Þxed sample size is thatdecisions on whether the economic threshold hasbeen exceeded have variable and unknown errorrates. Thus, a grower makes a decision on whether thepopulation may economically damage the crop with agenerally unknown level of conÞdence as to whetherthe correct decision is being made. Sequential sam-pling can overcome the limitations for Þxed sample sizetechniques and can sometimes result in 50% or greaterreduction in the time required to sample a Þeld (Binns1994), which may make routine sampling more feasiblefor growers. Our objective was to develop a sequentialsampling plan for use in integrated pest management(IPM) decision-making for panicle caterpillars in sor-ghum. The sampling data from 115 production Þeldslocated in Kansas, Oklahoma, and Texas were used todevelop a sequential sampling procedure for sorghumpanicle caterpillars. The procedure was validated withindependent data from another 25 Þelds.
Materials and Methods
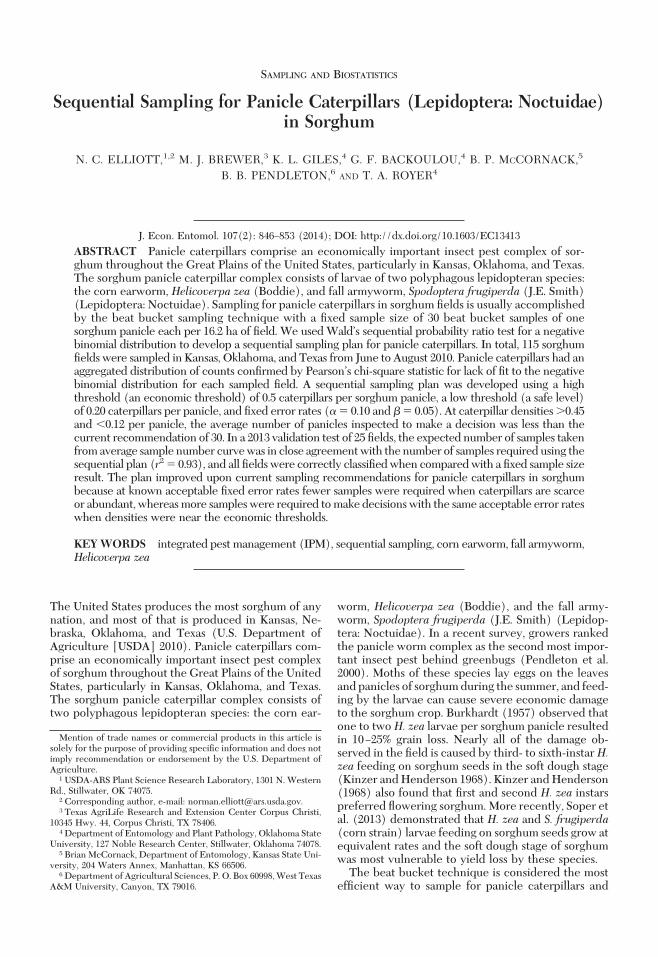
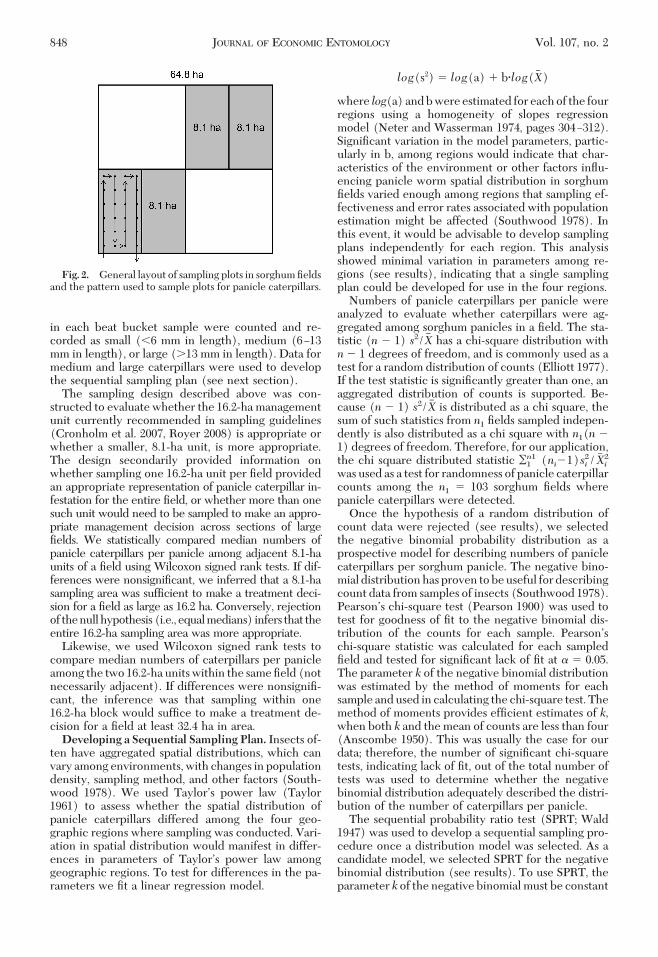
Sampling Panicle Caterpillars. Sorghum Þelds infour geographical areas in Kansas, Oklahoma, andTexas where sorghum is intensively grown were sam-pled during JuneÐAugust 2010 (Fig. 1). Within eacharea, �15 sorghum Þelds were selected for sampling.EachÞeldwas sampled one timeusing thebeat bucketsampling technique (Teetes and Wiseman 1979). Anindividual samplewas takenbyvigorously shakingonesorghumpanicle inside awhite 5-gallon bucket and bycounting the number of dislodged panicle caterpillarsin the bucket. Twenty-four beat bucket samples weretaken from each of two adjacent 8.1-ha sections ineach Þeld, for a total of 48 beat bucket samples perÞeld according to the uniform sampling pattern illus-trated in Fig. 2. The sampling pattern sometimes hadtobemodiÞed to adjust todifferences in the shapeandsize of Þelds, but we always strived for uniform cov-erage of each 8.1-ha block. Sorghumpanicleswere notsampled within a �10-m border from the edge of theÞeld. The two 8.1-ha sections were contiguous to forma 16.2-ha block. In selected Þelds, this procedure wasrepeated in two 16.2-ha blocks within the Þeld, so 96beat bucket samples were taken over a total area of32.4 ha. Sampling was done during the ßoweringthrough the hard dough stages. All panicle caterpillars
Fig. 1. Locationsof four sorghum-growingareaswherepanicle caterpillarswere sampled in sorghumÞelds. (OnlineÞgurein color.)
April 2014 ELLIOTT ET AL.: SEQUENTIAL SAMPLING IN SORGHUM 847
in each beat bucket sample were counted and re-corded as small (�6 mm in length), medium (6Ð13mm in length), or large (�13 mm in length). Data formedium and large caterpillars were used to developthe sequential sampling plan (see next section).
The sampling design described above was con-structed to evaluate whether the 16.2-ha managementunit currently recommended in sampling guidelines(Cronholm et al. 2007, Royer 2008) is appropriate orwhether a smaller, 8.1-ha unit, is more appropriate.The design secondarily provided information onwhether sampling one 16.2-ha unit per Þeld providedan appropriate representation of panicle caterpillar in-festation for the entire Þeld, or whether more than onesuch unit would need to be sampled to make an appro-priate management decision across sections of largeÞelds. We statistically compared median numbers ofpanicle caterpillars per panicle among adjacent 8.1-haunits of a Þeld using Wilcoxon signed rank tests. If dif-ferences were nonsigniÞcant, we inferred that a 8.1-hasampling area was sufÞcient to make a treatment deci-sion for a Þeld as large as 16.2 ha. Conversely, rejectionof thenullhypothesis(i.e., equalmedians) infers that theentire 16.2-ha sampling area was more appropriate.
Likewise, we used Wilcoxon signed rank tests tocompare median numbers of caterpillars per panicleamong the two 16.2-ha unitswithin the sameÞeld (notnecessarily adjacent). If differences were nonsigniÞ-cant, the inference was that sampling within one16.2-ha block would sufÞce to make a treatment de-cision for a Þeld at least 32.4 ha in area.
Developing a Sequential Sampling Plan. Insects of-ten have aggregated spatial distributions, which canvary among environments,with changes in populationdensity, sampling method, and other factors (South-wood 1978). We used TaylorÕs power law (Taylor1961) to assess whether the spatial distribution ofpanicle caterpillars differed among the four geo-graphic regions where sampling was conducted. Vari-ation in spatial distribution would manifest in differ-ences in parameters of TaylorÕs power law amonggeographic regions. To test for differences in the pa-rameters we Þt a linear regression model.
log(s2) � log(a) � b�log(X� )
where log(a) andbwereestimated for eachof the fourregions using a homogeneity of slopes regressionmodel (Neter and Wasserman 1974, pages 304Ð312).SigniÞcant variation in the model parameters, partic-ularly in b, among regions would indicate that char-acteristics of the environment or other factors inßu-encing panicle worm spatial distribution in sorghumÞelds varied enough among regions that sampling ef-fectiveness and error rates associated with populationestimation might be affected (Southwood 1978). Inthis event, it would be advisable to develop samplingplans independently for each region. This analysisshowed minimal variation in parameters among re-gions (see results), indicating that a single samplingplan could be developed for use in the four regions.
Numbers of panicle caterpillars per panicle wereanalyzed to evaluate whether caterpillars were ag-gregated among sorghum panicles in a Þeld. The sta-tistic (n � 1) s2/X� has a chi-square distribution withn � 1 degrees of freedom, and is commonly used as atest for a random distribution of counts (Elliott 1977).If the test statistic is signiÞcantly greater than one, anaggregated distribution of counts is supported. Be-cause (n � 1) s2/X� is distributed as a chi square, thesum of such statistics from n1 Þelds sampled indepen-dently is also distributed as a chi square with n1(n �1) degrees of freedom. Therefore, for our application,the chi square distributed statistic ¥1
n1 (ni�1)si2/X� i
2
was used as a test for randomness of panicle caterpillarcounts among the n1 � 103 sorghum Þelds wherepanicle caterpillars were detected.
Once the hypothesis of a random distribution ofcount data were rejected (see results), we selectedthe negative binomial probability distribution as aprospective model for describing numbers of paniclecaterpillars per sorghum panicle. The negative bino-mial distributionhasproven tobeuseful fordescribingcount data from samples of insects (Southwood 1978).PearsonÕs chi-square test (Pearson 1900) was used totest for goodness of Þt to the negative binomial dis-tribution of the counts for each sample. PearsonÕschi-square statistic was calculated for each sampledÞeld and tested for signiÞcant lack of Þt at � � 0.05.The parameter k of the negative binomial distributionwas estimated by the method of moments for eachsample andused in calculating the chi-square test. Themethod of moments provides efÞcient estimates of k,when both k and the mean of counts are less than four(Anscombe 1950). This was usually the case for ourdata; therefore, the number of signiÞcant chi-squaretests, indicating lack of Þt, out of the total number oftests was used to determine whether the negativebinomial distribution adequately described the distri-bution of the number of caterpillars per panicle.
The sequential probability ratio test (SPRT; Wald1947) was used to develop a sequential sampling pro-cedure once a distribution model was selected. As acandidate model, we selected SPRT for the negativebinomial distribution (see results). To use SPRT, theparameter k of the negative binomialmust be constant
Fig. 2. General layout of sampling plots in sorghumÞeldsand the pattern used to sample plots for panicle caterpillars.
848 JOURNAL OF ECONOMIC ENTOMOLOGY Vol. 107, no. 2
over the range of panicle caterpillar population den-sities that exceed theeconomic threshold.Anestimateof a common k, designated as kc, was calculated usingthe method proposed by Bliss and Owens (1958). Thismethod involves calculating the sample size, mean,and variance for each sample and calculating a linearregression through the origin to obtain an initial es-timate of kc. The inverse of the slope of the regressionline is an estimate of kc. In the regression, yi (estimatedas Si
2 � X) was regressed against xi (estimated asXi
2 � [Si2/ni]). The estimate of kc from the un-
weighted regression was used to calculate weights fora subsequent weighted regression. The weights foreach samplewere inverselyproportional to the samplevariance (Bliss and Owens 1958) with parameters kc
and �. Theestimateof kc from theweighted regressionwas compared with the previous estimate. When kc
changed minimally among successive iterations, theprocess was discontinued.
We tested for the suitability of a common k for allsampled Þelds (Bliss and Owens 1958). The test re-quired calculating the sample size,mean, and variancefor each sample and calculating linear regressions of yi
on xi (see above)Þrst through theorigin and thenwitha y-intercept. F-tests were constructed based on ap-propriate sums of squares from the two regressions totest the null hypothesis of a common k versus thealternative hypothesis that k differed for at least onesample (seeYoung andYoung 1998, pages 114Ð117 forcomplete details).
The SPRT for the negative binomial distributiontests the following hypotheses:
Ho: � � �o
H1: � � �1
where�1 (��o) is thenumberofcaterpillarsperpanicleabovewhichinsecticidal treatment isadvised(economicthreshold), and �o is the corresponding number wherethe infestation isconsideredbelowtheeconomic thresh-old (safe level). We constructed a sequential samplingplan based on SPRT for an economic threshold of 0.5caterpillars per panicle. We chose a safe level (i.e., no-treat decision) of 0.20 caterpillar per panicle which wasset at less than half the economic threshold, and chose� � 0.10 and � � 0.05. We set � � � (i.e., � � 0.10 and� � 0.05) because decreasing an error rate increases thenumber of panicles required to make a decision, and anerroneousdecision to treat aÞeld thatwas slightlybelowthe safe threshold (�) was considered less serious thanfailing to treat a Þeld that was above the economicthreshold (�).
Sequential sampling stop lines, operating charac-teristic (OC) curves, and average sample number(ASN) curves were developed using standard meth-odology and formulae (see Young and Young 1998,pages 157Ð170). For our application, theASN speciÞesthe average number of samples required to make adecision as a function of the mean number of cater-pillars per sorghum panicle, whereas the OC gives theprobability of accepting the null hypothesis (Ho) alsoas a function of the mean.
Validating the Candidate SPRT. To validate the se-quential sampling plan, 25 sorghum Þelds were sampledfrom the Texas Coastal Plains (n � 5) and central Okla-homa(n�20)duringJuly2013. Intotal,48paniclesweresampled sequentiallywithin an8.1-ha sectionof theÞeldby theprocedure describedpreviously. Themeanof the48 samples was used to estimate the true populationmean. Thenumber ofmediumplus large caterpillars perpanicle was recorded for each panicle sampled from aÞeld until a treat or no-treat decision was made. Thensampling was continued until the 48 panicles were in-spected. The decision derived from the sequential sam-pling plan was compared with the mean number of cat-erpillars calculated from counts for the 48 panicles. Thedecision from sequential sampling was considered cor-rect if themeanfromthe48paniclesagreedwiththestopsamplingdecision(�0.50 fora treatdecisionor�0.20 fora no-treat decision) and was considered incorrect oth-erwise. In the casewhere the samplemeanwasbetween0.20 and 0.50 caterpillars per panicle, a treat decision ora no-treat decision was technically incorrect. However,an inherent feature of sequential sampling is that a de-cisionwilleventuallybemadeevenwhenthepopulationmean falls between the upper and lower stop lines, andthe infestationwillbeclassiÞedaseitherabovetheupperlimit or below the lower limit. Therefore, for validationwe considered the decision to be correct if a no-treatdecision was achieved when the mean was �0.35, and ifa treat decisionwas achievedwhen themeanwas �0.35,where 0.35 is the midpoint between 0.20 and 0.50.
All statistical tests, except those for chi-square good-ness of Þt to the negative binomial distribution, wereaccomplishedusingprocedures inSAS9.1(SASInstitute2004, Cary, NC). A program was written in Pro For-tran11.1(AbsoftCorp.,Troy,MI) tocalculatechi-squaregoodnessofÞt tests to thenegativebinomialdistribution.
Results and Discussion
Panicle Worm Sampling. Thirty-seven Þelds weresampled incentralKansas, 40 innorthcentralOklahoma,23 in the Texas High Plains, and 15 in the Texas coastalregion, for a total of 115 Þelds. Sampling data from 12Þeldswerenotusedbecausenopaniclecaterpillarswerefound or because in a few cases collection errors madethe data for a Þeld unusable. Thus, panicle caterpillarcountdatafromatotalof103Þeldswereusedinanalyses.The number of caterpillars per sorghum panicle for the103 Þelds ranged from 0.02 to 3.17, with a mean of 0.42(SE � 0.049) caterpillars per panicle.
Five out of 103 Wilcoxon tests comparing the num-ber of caterpillars per panicle among adjacent 8.1-hablockswithin Þeldswere signiÞcant. The difference indensity between 8.1 ha ranged from 0 to 1.54 cater-pillars per panicle with a mean across all Þelds of 0.05caterpillars perpanicle (SE�0.03).For 16.2-hablocksthe difference in density ranged from 0 to 0.41 cater-pillars per panicle with a mean across all Þelds of 0.03caterpillars per panicle (SE � 0.07). For 8.1-ha blocks,the number of signiÞcant Wilcoxon tests was close tothe number that would be expected by chance with� � 0.05. This result supported the conclusion that a
April 2014 ELLIOTT ET AL.: SEQUENTIAL SAMPLING IN SORGHUM 849
decision made from a sample from a single 8.1-ha unitwould be sufÞcient for making a pest managementdecision for a 16.2-ha management unit. We also cal-culated Wilcoxon tests to compare the number ofcaterpillars per panicle among the two 16.2-ha blockswithin the same Þeld. There was one signiÞcant Wil-coxon test for theeightÞelds inwhichwe sampled two16.2-ha blocks. Although the number of comparisonsis probably too few to be deÞnitive, evidence suggeststhat sampling a single 16.2-ha block provides sufÞcientinformation for making a management decision for alarger Þeld. There was little evidence to suggest thatovipositionbymoths in sorghumÞeldswasaggregatedatscales of 8.1Ð16.2 ha, resulting in approximately equaldensity of panicle worms among blocks of those sizeswithinÞelds.Thepractical signiÞcanceof the tworesultswas that sampling only a portion of a Þeld, as normallyoccurs in the process of sequential sampling, would jus-tifydecisionsapplied toa largerareawithin theÞeld, andperhaps to the entire Þeld. Because 16.2-ha blocks wereusually not contiguous within a Þeld, the limited datasuggest that results from sampling fromone 8.1-ha blockwould frequently provide reliable decisions for a Þeld atleast 32.4-ha in area.
Developing a Sequential Sampling Plan. The ho-mogeneityof slopes regressionmodel forTaylorÕs powerlawwassigniÞcant(F�311.5;df�7,96;P�0.0001).Theregression model explained most of the variation in therelationship between log(s2) and log(X�) at R2 � 0.96.Therewas very little evidence for difference in log(a)orb among the four regions (Table 1). The only signiÞcantdifference was for the intercept (log(a)) for the TexasCoastal Plains region. In all other cases, parameterswerenot signiÞcantlydifferentamong thegeographic regions.Thus, there was little evidence for difference in spatialdistribution of panicle caterpillars in sorghum Þeldsamong regions, thus indicating that sampling effective-ness and error rates associated with population estima-tion would be similar among regions using a single se-quential sampling plan constructed from data from allregions.
The average of the variance of counts of caterpillarsper panicle for the 103 Þelds (mean of s2 � 1.57, SE �0.51)was greater than the averageof themeanof counts(mean of X� � 0.42, SE � 0.05), suggesting existence ofan aggregated distribution of counts. The presence of anaggregated distribution was conÞrmed by the approxi-mate chi-square test based on the index of dispersion(Elliott 1977) for the 103 samples (�2 � 11058.0; df �4841; P � 0.001).
PearsonÕs chi-square statistic for lack of Þt to thenegative binomial distribution was calculated for eachsampled Þeld. Of tests for 103 Þelds, seven showed asigniÞcant lack of Þt to the negative binomial distri-bution. Seven signiÞcant tests of 103 was close to thenumber expected by chance when testing at a signif-icance level of � � 0.05. Thus, the result supported theconclusion that the negative binomial distributionwasan acceptable probability model for counts of cater-pillars per sorghum panicle.
An unweighted regression through the origin of yi
against xi for samples from the 103 sorghum Þelds wassigniÞcant and had a slope of 2.74 (kc � 0.365; Table2). A weighted regression using an estimate of k �0.365 in calculating Bliss and OwensÕ (1958) weightsyielded k � 0.471, but a much smaller r2 than theunweighted regression. Iterating on the weighted re-gressionchanged kconly slightly fromthevalue for theÞrst weighted regression, with correspondingly smallvalues for r2. The greater r2 associated with the un-weighted regression combined with the relativelysmall change in kc from iterative weighted regressionsled us to conclude that kc � 0.365 was the best esti-mate. Using the Bliss and OwensÕ (1958) test proce-dure for the acceptability of a common k, the F-testassociated with the slope was signiÞcant (F � 55.75;df � 1, 99; P � 0.001), whereas the F-test for existenceof a nonzero intercept was not signiÞcant (F � 0.12;df � 1,99;P � 0.500).Hubbard andAllen (1991) foundthat selecting an estimate of kc smaller than the truevalue resulted in more conservative error rates thanthose speciÞed in the SPRT (� and �), and the effecton ASN and OC caused by misspeciÞcation of k wassmall. Shah et al. (2009) observed larger effects onASN and OC from misspeciÞcation of k, but the mag-nitude of the misspeciÞcation of k in their study was
Table 1. Estimates of Taylor’s power law parameters and t-statistics testing the hypothesis that the parameter equals zero derived froma homogeneity of slopes regression model for panicle caterpillars per panicle in sorghum fields from four geographic regions in Kansas,Oklahoma, and Texas
Geographic regionParameter (SE)
log(a) t P b t P
Texas Coastal Plains 0.64 (0.17) 1.99 0.0495 1.16 (0.08) 0.82 0.4138Texas High Plains 0.44 (0.17) 0.90 0.3712 1.10 (0.08) 0.20 0.8401North central Oklahoma 0.47 (0.11) 1.69 0.0946 1.06 (0.06) �0.43 0.6665Overall (Inc. central Kansas) 0.29 (0.07) 3.98 0.0001 1.09 (0.05) 22.67 0.0001
Table 2. Statistics for regression models to estimate the pa-rameter k of the negative binomial distribution for samples from103 sorghum fields consisting of counts of caterpillars on 48 pan-icles
Model Slope (SE) k r2 F P
Unweighted 2.74 (0.36) 0.365 0.36 56.81 �0.00011st weighted 2.12 (0.68) 0.471 0.09 9.85 0.00222nd weighted 2.11 (0.68) 0.474 0.09 9.70 0.00243rd weighted 2.11 (0.68) 0.475 0.09 9.70 0.0024
All regressions were forced through the origin. Degrees of freedomwere 1 for model (numerator) and 101 for error (denominator) in allregressions.
850 JOURNAL OF ECONOMIC ENTOMOLOGY Vol. 107, no. 2
much greater than was likely for our data. Therefore,the hypothesis of a common k was not rejected (Blissand Owens 1958) and developing SPRT for a negativebinomial distribution with kc � 0.365 was justiÞed.
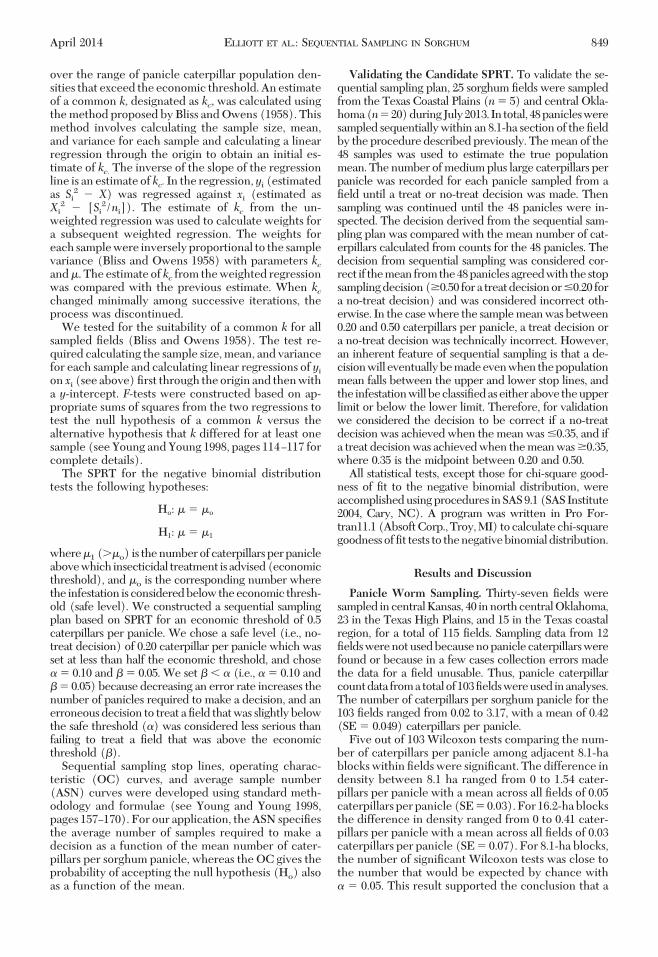
The economic injury level for panicle caterpillarsdepends on yield, crop value, and size of the cater-pillars infesting a sorghum Þeld (Knutson and Cron-holm 2007). We constructed a sequential samplingplan based on SPRT for an economic threshold of 0.5caterpillars per panicle, which is typical of economicthresholds for panicle caterpillars (KnutsonandCron-holm 2007). We chose a safe level of 0.20 caterpillarsper panicle, which was set at less than half the eco-nomic threshold.Thedata setof 0.02Ð3.17mediumandlarge worms per panicle observed in the Þeld encom-passed these thresholds. Stop sampling lines for pan-icle caterpillar sequential sampling in sorghum for aneconomic injury level of 0.5 caterpillars per sorghumpanicle are illustrated in Fig. 2. The lower stop linedoes not permit a “do not treat”Õ decision until a min-imum of 18 panicles are inspected, even if no panicleworms are detected. Based on the upper stop line, atreat decision can be made after inspecting a singlepanicle, but a decision based on such a small samplewould probably not be advisable. At �0.45 caterpillarsper panicle, the average number of panicles inspectedto make a decision was less than the current recom-mendation of 30 (Fig. 3). At densities �0.12 caterpillarsperpanicle, average sample sizeswerealso�30panicles.For densities between 0.13 and 0.41 caterpillar per pan-icle, �30 paniclesmust be inspected on average tomakea management decision. It is worth noting that the Þxedsamplesizeof30panicleswasset intheliteraturewithoutspeciÞcallyknownstatisticalcharacteristics, ascanbesetwhen comparing sequential plans to single (Þxed) sam-pling plans, and the sample savings may be greater if theÞxedplansweredesignedwith speciÞc statistical criteriacomparable with the sequential plans (Guenther 1977,Brewer and Trumble 1991). This indicates that the cur-rently recommended Þxed sample size of 30 panicles
frequently does not have error rates equivalent to thosespeciÞed in the sequential sampling plan when popula-tions are near the economic threshold of 0.5 caterpillarsper panicle. The plan improves on currently recom-mended samplingprocedures for panicle caterpillars be-cause fewer samples are required at low and high den-sities, and error rates are improved at intermediatedensities,wherea largernumberof samples are requiredto make decisions with acceptable error rates. If so de-sired, theparameters�,�,�o, and�1 canbemanipulatedto achieve a sequential sampling plan with more accept-able sampling properties, albeit at the expense of errorrates and the magnitude of variation in the estimatedpopulation density that can be detected.
Validating the Candidate SPRT. For the 25 sorghumÞelds sampled for validation, the mean number of cat-erpillars per panicle in 20 Þelds was below the safe levelof�0.20perpanicle,whereasfortwoÞeldsthemeanwas�0.20 but �0.35. For the 22 Þelds with infestations ofcaterpillars that should result in ano-treatdecision, all 22werecorrectlyclassiÞed.ForthreeÞelds, themeannum-ber of caterpillars per panicle was �0.50, which werecorrectly classiÞed as needing treatment. No Þelds wereincorrectly classiÞed.
The expected number of samples to make a decisionwas generally similar to theobservednumberof samples(Fig. 4). A linear regression equation Þtted to the datahad a slope of 0.95, which was not signiÞcantly differentfrom 1.0 (F � 0.88; df � 1, 23; P � 0.36). Furthermore,the intercept was 1.34, which did not differ signiÞcantlyfrom zero (t � 1.00; df � 1; P � 0.33; Fig. 5). Lack ofdifference from a slope of one and intercept of zero,combinedwitha largecoefÞcientofdetermination(r2�0.93) indicated strong agreement between the expectednumber of samples taken from the ASN curve and thenumber of samples required in practice.
The mean number of panicles inspected to make adecision was 23.9 (SE � 2.40), which was fewer thanthecurrent recommendationof 30 samples.Thus, timesavings would be expected when using the sequential
Fig. 3. Sequential sampling stop lines for sampling panicle caterpillars in sorghum for an economic injury level of 0.5caterpillar per sorghum panicle.
April 2014 ELLIOTT ET AL.: SEQUENTIAL SAMPLING IN SORGHUM 851
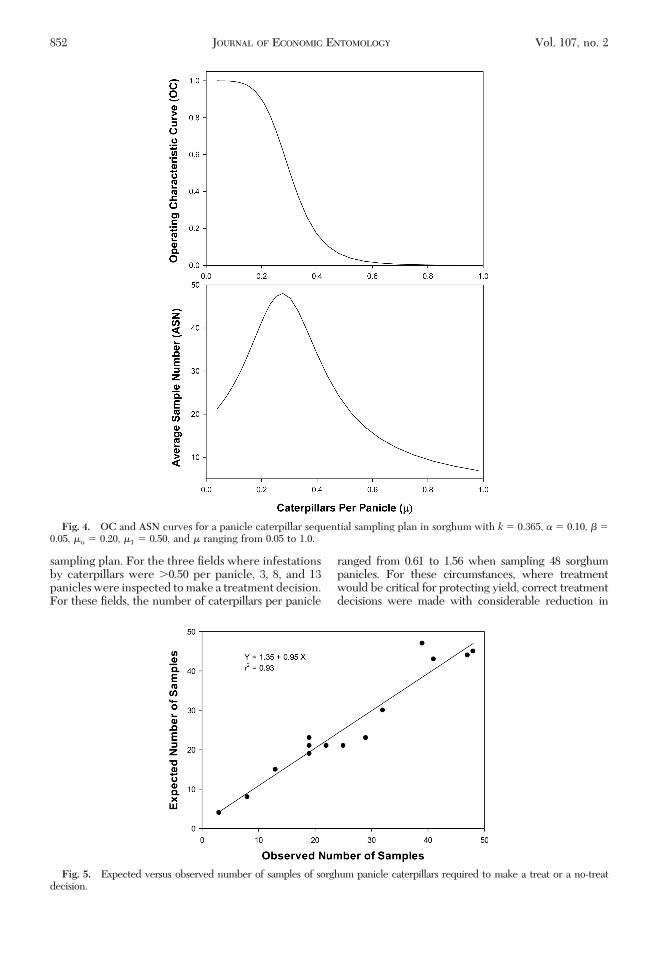
sampling plan. For the three Þelds where infestationsby caterpillars were �0.50 per panicle, 3, 8, and 13panicles were inspected to make a treatment decision.For these Þelds, the number of caterpillars per panicle
ranged from 0.61 to 1.56 when sampling 48 sorghumpanicles. For these circumstances, where treatmentwould be critical for protecting yield, correct treatmentdecisions were made with considerable reduction in
Fig. 4. OC and ASN curves for a panicle caterpillar sequential sampling plan in sorghum with k � 0.365, � � 0.10, � �0.05, �o � 0.20, �1 � 0.50, and � ranging from 0.05 to 1.0.
Fig. 5. Expected versus observed number of samples of sorghum panicle caterpillars required to make a treat or a no-treatdecision.
852 JOURNAL OF ECONOMIC ENTOMOLOGY Vol. 107, no. 2
sampling effort. Our validation, although not extensive,wasaccomplishedwithindependentdatafromÞeldsthatdifferedfromthoseusedindevelopingtheplanandweresampled in a different year, which adds further conÞ-dence in the relevance of SPRT to a range of Þeld con-ditions (Vernier et al. 2008). An Internet site has beendeveloped and deployed to aid users in obtaining infor-mationneeded to implement the samplingmethodology(Backoulou et al. 2013). The site provides a tool forcalculating the economic threshold for panicle worms,sequential sampling forms for a range of economicthresholds, and instructionsonhowto samplea sorghumÞelds for panicle caterpillars. We developed and vali-dated a sequential sampling plan for panicle caterpillarIPM decision-making in sorghum that reduces samplingtime compared with the current Þxed sample sizemethod of 30 sorghum panicles. Sampling within an8.1-ha subsection of a Þeld provided density estimatesvalid for larger areas of at least 16.2 ha, indicating thatsequential sampling based on a portion of a Þeld providedecisions that can be applied to a management unit aslargeas 16.2ha.ThecandidateSPRTprovidedadecisiontool dependent on fewer required samples at low andhighdensitiesofpaniclecaterpillarsatknownacceptableÞxed error rates, whereas a larger number of sampleswere required to make decisions with the same accept-ableerror rateswhendensitieswerenear the thresholds.
Acknowledgments
We thank Tim Johnson, Darwin Anderson, James Glover,Luke Pruter, Kent Hampton, Alysha Soper, Melody Larsen,and Jody Gilchrest for assistance with data collection. Thisresearch was funded by grant R0008-10 from the UnitedSorghum Checkoff Program. Contribution no. 14-095-J fromthe Kansas Agricultural Experiment Station.
References Cited
Anscombe, F. J. 1950. Sampling theory of the negative bi-nomial and logarithmic series distributions. Biometrika37: 358Ð382.
Backoulou, G. F., N. C. Elliott, T. A. Royer, B. P. McCornack,M. J. Brewer, B. B. Pendleton, and K. L. Giles. 2013.Headworm sequential sampling and decision support sys-tem. (http://entoplp.okstate.edu/shwweb/index.htm).
Binns, M. R. 1994. Sequential sampling for classifying peststatus. In L. Pedigo and D. G. Buntin (eds.), Samplingmethods for arthropod pests in agriculture. CRC, BocaRaton, FL.
Bliss, C. I., and A.R.G. Owens. 1958. Negative binomial dis-tributions with a common k. Biometrika 45: 37Ð58.
Brewer, M. J., and J. T. Trumble. 1991. Classifying resis-tance severity in Þeld populations: sampling inspectionplans for an insecticide resistance monitoring program. J.Econ. Entomol. 84: 379Ð389.
Burkhardt, C. C. 1957. Corn earworm control in grain sor-ghum. J. Econ. Entomol. 50: 539Ð541.
Cronholm, G., A. Knutson, R. Parker, and B. Pendleton.2007. Managing insect and mite pests of Texas sorghum.Texas Agricultural Extension Service Bulletin B-1220.
Elliott, J. M. 1977. Some methods for the statistical analysisof samples of benthic invertebrates. Sci. Publ. Freshw.Biol. Assoc. 25.
Guenther, W. C. 1977. Sampling inspection in statisticalquality control. Oxford University Press, New York, NY.
Hubbard, D. J., and O. B. Allen. 1991. Robustness of theSPRT for a negative binomial to misspeciÞcation of thedispersion parameter. Biometrics 47: 419Ð427.
Kinzer,H.G., andC.F.Henderson. 1968. Damageby larvaeofthe corn earworm to grain sorghum. J. Econ. Entomol. 61:263Ð267.
Knutson, A. E., and G. Cronholm. 2007. Economic injurylevels for sorghum midge, Stenodiplosis sorghicola andcorn earworm, Helicoverpa zea, feeding on panicles ofsorghum, Sorghum bicolor. Southwest. Entomol. 32: 75Ð85.
Merchant, M. E., and G. L. Teetes. 1992. Evaluation of se-lected samplingmethods forpanicle-infesting insectpestsof sorghum. J. Econ. Entomol. 85: 2418Ð2424.
Neter, J., and W. Wasserman. 1974. Applied Linear Statis-tical Models. Richard D. Irwin, Inc., Homewood, IL.
Pearson, K. 1900. On the criterion that a given system ofdeviations from the probable in the case of a correlatedsystem of variables is such that it can be reasonablysupposed tohavearisen fromrandomsampling.Phil.Mag.Ser. 50: 157Ð175.
Pendleton,B.B.,G.L.Teetes, andR.D.Parker. 2000. Quan-tifying Texas sorghum growerÕs use of IPM for insectpests. Southwest. Entomol. 25: 39Ð53.
Royer, T. A. 2008. Watch for panicle-feeding caterpillars insorghum. Plant Disease and Insect Advisory 7(29), p. 6.Entomology andPlant PathologyDepartment,OklahomaState University, Stillwater, OK. (http://entoplp.okstate.edu/Pddl/)
SAS Institute. 2004. SAS/STAT userÕs guide, version 9.1.SAS Institute, Cary, NC.
Shah, P. K., D. R. Jeske, and R. F. Luck. 2009. Sequentialhypothesis testing techniques for pest count models withnuisance parameters. J. Econ. Entomol. 102: 1970Ð1976.
Soper, A.M., R. J. Whitworth, and B. P. McCornack. 2013.Sorghum seed maturity affects the weight and feeding du-ration of immature corn earworm, Helicoverpa zea, and fallarmyworm, Spodoptera frugiperda, in the laboratory. J. In-sect Sci. 13: 67. (http://www.insectscience.org/13.67)
Southwood, T.R.E. 1978. Ecological methods with particu-lar reference to the study of insect populations. Chapman& Hall, London, United Kingdom.
Taylor, L. R. 1961. Aggregation, variance and the mean.Nature 189: 732Ð735.
Teetes, G. L., and B. R. Wiseman. 1979. Economic thresh-olds of Heliothis species in sorghum, pp. 57Ð61. In Eco-nomic thresholds and sampling of Heliothis species oncotton, corn, soybeans, and other host plants. So. Coop.Ser. Bull. 231, College Station, TX.
U.S.Dep.Agric. 2010. U.S.Dep.Agric.NationalAgriculturalStatistics Service. (www.usda.gov/nass)
Vernier, P. R., F.K.A. Schmiegelow, S. Hannon, and S. G.Cumming. 2008. Generalizability of songbird habitatmodels in boreal mixedwood forests of Alberta. Ecol.Modell. 211: 191Ð201.
Wald, A. 1947. Sequential analysis. Wiley, New York, NY.Young, L. J., and J. H. Young. 1998. Statistical Ecology. Klu-
wer Academic Publishers, Norwell, MA.
Received 20 September 2013; accepted 18 January 2014.
April 2014 ELLIOTT ET AL.: SEQUENTIAL SAMPLING IN SORGHUM 853

![Semiautomated Feature Extraction from RGB Images for Sorghum Panicle Architecture ... · Semiautomated Feature Extraction from RGB Images for Sorghum Panicle Architecture GWAS1[OPEN]](https://img.pdfslide.net/doc/110x75/5e5e983032be3a67ab7750f7/semiautomated-feature-extraction-from-rgb-images-for-sorghum-panicle-architecture.jpg)