Embed Size (px)
Citation preview
Energy Consumption of University
Laboratories:
Detailed Results from S-Lab Audits
Lisa Hopkinson, Peter James, Nigel Lenegan,
Tom McGrath and Malcolm Tait
©S-Lab, July 2011
Developed by the
S-Lab (Safe, Successful and Sustainable Laboratories) initiative of
HEEPI (Higher Education for Environmental Performance Improvement)
See www.goodcampus.org
Lab-CURE: Chemicals, Utilities, Resources and
Environment in Laboratories
Energy Consumption of University Laboratories: Detailed Results from S-Lab Audits
HEEPI July 2011 Page 2 of 58 www.goodcampus.org
Contents
About HEEPI and S-Lab ......................................................................................................................... 3
About the Authors................................................................................................................................ 3
Acknowledgements .............................................................................................................................. 3
Disclaimer ............................................................................................................................................. 3
Summary .............................................................................................................................................. 4
1. Introduction .................................................................................................................................. 5
2. The Importance of Laboratory Energy .......................................................................................... 7
3. Audit Details .................................................................................................................................. 7
4. Summary Results – Life Science .................................................................................................. 10
5. Summary Results - Chemistry ..................................................................................................... 13
6. Equipment Energy ....................................................................................................................... 15
7. Conclusions ................................................................................................................................. 16
Appendix A - Energy Consumption in the University of Cambridge’s Chemistry Building ................ 17
A1. Overview .................................................................................................................................. 17
Appendix B - Energy Consumption in the University of Edinburgh’s Cancer Research Centre ......... 25
B1. Overview .................................................................................................................................. 25
Appendix C - Energy Consumption in the University of Liverpool’s Biosciences Building ................ 33
C1. Overview .................................................................................................................................. 33
C2. Plug Load .................................................................................................................................. 39
Appendix D - Energy Consumption in the University of Manchester’s Chemistry Extension ........... 41
D1. Overview .................................................................................................................................. 41
D2. Plug Load .................................................................................................................................. 46
Appendix E - Energy Consumption in the University of York’s Department of Biology .................... 48
E1. Overview .................................................................................................................................. 48
E2. Plug Load .................................................................................................................................. 54
Appendix F - Sources of Information ................................................................................................. 56

Energy Consumption of University Laboratories: Detailed Results from S-Lab Audits
HEEPI July 2011 Page 3 of 58 www.goodcampus.org
About HEEPI and S-Lab
The Higher Education Environmental Performance Improvement (HEEPI) project supports
sustainable development, and especially environmental improvement, in universities and colleges
through: identification and dissemination of best practice; creation and maintenance of networks;
development of benchmarking; and in other ways. It is based at the University of Bradford.
S-Lab (Safe, Successful and Sustainable Laboratories) is one of its initiatives and aims to create
more sustainable laboratories, without jeopardising – and in many cases enhancing – safety and
performance.
It is mainly financed by the four UK higher education funding bodies (Higher Education Funding
Council for England (HEFCE), Higher Education Funding Council for Wales (HEFCW), Scottish
Funding Council (SFC) and Department for Employment and Learning Northern Ireland (DELNI)
through the Leadership, Governance and Management fund, with additional support from the
Carbon Trust and others. See www.goodcampus.org for more information.
About the Authors
Lisa Hopkinson is the HEEPI Researcher at the University of Bradford.
Peter James is Professor of Environmental Management at the University of Bradford, and co-
director of HEEPI.
Nigel Lenegan is Director of Energy and Carbon Reduction Solutions, who carried out the audits at
Liverpool, Manchester and York.
Tom McGrath is a mature Engineering Undergraduate at the University of Edinburgh who carried
out the audit there, under the supervision of David Somervell, Sustainability Manager.
Malcolm Tait is a Partner at K J Tait Engineers, which carried out the audit at Cambridge.
Acknowledgements
The authors are most grateful to the following university staff who contributed advice and
information on the lab energy audits (in alphabetical order):
University of Cambridge: Paul Hasley.
University of Edinburgh: David Burns and David Somervell.
University of Liverpool: Peter Birch, Norman Denton, Laura Nuttall, and senior lab technicians.
University of Manchester: Elaine Armstrong, Dave Brown, Chris Cunningham, and lab technicians.
University of York: Jo Hossell and Heike Singleton.
Disclaimer
Every effort has been made to ensure that the information in this document is accurate. However,
it should not be used as a substitute for professional advice on detailed matters of laboratory
design and management.

Energy Consumption of University Laboratories: Detailed Results from S-Lab Audits
HEEPI July 2011 Page 4 of 58 www.goodcampus.org
Summary
Laboratories consume large quantities of energy – often 3 to 4 times more than offices on a
square metre basis. However, their complexity makes it difficult to develop a detailed
understanding of how energy is used, and therefore to identify and prioritise improvement
opportunities. To fill this knowledge gap, S-Lab has conducted, or collaborated with, detailed
audits of energy use at three life science laboratories at the Universities of Edinburgh, Liverpool
and York, and two chemistry laboratories at the Universities of Cambridge and Manchester.
However, because the work has involved a number of assumptions, and because there is a high
degree of variability in different labs even within the same discipline, and even within the same lab
at different times, care is advised in interpreting the results, either to compare the audited
laboratories or in applying them to others. The headline results from the exercise are:
Ventilation-related energy (all the energy used to move, cool and heat air) comprises around
60% of total energy in chemistry labs and 45% in life science labs.
Equipment/small power comprises around 25% in life science labs and 15% in chemistry labs.
Space heating accounts for around 20% in both types of lab.
Lighting comprised around 10% for life science labs and 5% for chemistry.
Fume cupboard energy costs are £900-1500 per annum.
The annual cost of moving a cubic metre of air through the labs each second ranged from
£1,861-4,634, and that of a single air change per hour from £6,311-34,129.
The investigations also highlighted the importance of IT in many laboratories – in all cases as a
significant element of equipment/small power category, and in some through self-contained
server rooms (which are 17% of total consumption at Cambridge).
Detailed analysis at Liverpool and Manchester identified the most energy consuming equipment
types (as a result of either numbers of equipment, power and hours of usage) which were:
For chemistry, heaters / stirrers, mass spectrometers, rotary evaporators, gas chromatographs,
nuclear magnetic resonance spectroscopes, ovens, fridges, pumps and water baths.
For life science, freezers (-20 and -80) environmental growth chambers, water baths,
incubators, ovens, ice makers, hybridisers, incubators and thermal cyclers.
The analysis did not include many large pieces of equipment with 3-phase power supply. While
each lab will be different, a general rule of thumb is anything that is heating or cooling, is on 24/7,
or has a 3-phase power supply, is likely to be a significant energy consumer.
The exercise demonstrated that developing a more detailed understanding of energy consumption
can provide many benefits, including highlighting many opportunities for minimising energy
consumption and saving money; improving safety; and building better relationships between
Estates and laboratory staff. As subsequent reports will describe, the exercise suggests that there
is the potential to reduce UK university energy bills by tens of millions of pounds through schemes
that have a five year payback or less. A parallel guide to the audit process is also available.

Energy Consumption of University Laboratories: Detailed Results from S-Lab Audits
HEEPI July 2011 Page 5 of 58 www.goodcampus.org
1. Introduction
The S-Lab programme aims to create more sustainable laboratories, and to raise sustainability
awareness amongst lab-using staff and students, without jeopardising – and in many cases
enhancing – safety and performance. One aspect of its activities is the development of tools and
guidance materials to assist laboratory energy efficiency initiatives. To assist this, and to provide
reference data, the project conducted, or collaborated with existing, investigations of energy use
at three life science and two chemistry facilities in UK universities in 2008-10. They were (in
alphabetical order):
The Department of Chemistry at the University of Cambridge;
The Cancer Research Centre at the University of Edinburgh;
The Biosciences Building (academic section only) at the University of Liverpool ;
The Department of Chemistry (new extension only) at the University of Manchester; and
The Department of Biology (Blocks K, L, and M only) at the University of York.
Appendices A-E provide detailed information on each of the laboratories, whose main features are
summarised in Table 1.
Appendix F provides details of the main data sources that were used in the exercise. Developing
the data took much more time than was envisaged at its start, and demonstrated that a
considerable commitment is needed in order to build a reasonably accurate picture. However, the
audits also demonstrated that this commitment is worthwhile, as they identified many
opportunities for cost-effective measures to minimise energy consumption. The findings from this
aspect of the exercise will be incorporated into a subsequent report.
A parallel report also incorporates the learning from the exercise into advice on the process of
conducting audits and laboratory improvement.1
1 Hopkinson, L., James, P., Lenegan, N., Somervell, D. and Tait, M., Laboratory Energy Audits: S-Lab Process Guide (2011). See www.goodcampus.org.

Energy Consumption of University Laboratories: Detailed Results from S-Lab Audits
HEEPI July 2011 Page 6 of 58 www.goodcampus.org
Table 1: Summary of Laboratory Features
Date
Built
Floor
Area
(sq.m)
Total
Energy
(kWh/y)
Total
Electricity
(kWh/y)
Total Gas
(kWh/y)
Energy Use
per Unit Area
(kWh/sq.m/y)
Energy Cost
per Unit Area
(£/sq.m/y)
Ventilation-
related as %
of Total
Energy
Equipment
as % of
Total
Energy
Cambridge - Chemistry
Building
1950’s
(major
refurb
1990s)
27,603 19,537,91
4 10,251,111 9,286,803 707 40 51% 17%
Cambridge - Chemistry
Building Excluding
Server Room Energy
As
above
17,698,50
6 8,411,703 As above 641 33 57% 19%
Edinburgh Cancer
Research Centre 2002 3,000 2,937,408 1,268,111 1,669,297 979 67 38% 21%
Edinburgh - Cancer
Research Centre
Excluding Autoclave
Energy
As
above 2,421,480 As above 1,153,369 807 60 47% 26%
Liverpool – Biosciences
Building (Academic
Section)
2003 7,750 5,237,743 3,092,930 2,144,814 676 40 43% 23%
Manchester - Chemistry
Building (Extension) 2006 3,816 2,488,242 883,407 1,604,835 652 28 61% 12%
York - Department of
Biology (Blocks K, L & M) 2002 12,740 8,660,308 5,024,386 3,635,922 679 36 45% 22%
Energy Consumption of University Laboratories: Detailed Results from S-Lab Audits
HEEPI July 2011 Page 7 of 58 www.goodcampus.org
2. The Importance of Laboratory Energy
Laboratories consume large quantities of energy (and other resources); often more than three or
four times the rate for offices on a square metre basis. The energy costs for a typical 5,000 sq.m
bioscience laboratory are around £193,000 a year, compared to around £50,000 for a typical office
of the same size.2 There are a number of laboratories in the sector which have energy bills
approaching over £1 million per year. Results from previous rounds of HEEPI benchmarking
showed that not only were laboratories some of the most energy intensive buildings on a campus,
but also that the energy intensity (kWh/sq.m/year) was increasing rather than decreasing over
time.3
This energy intensity means that the energy and carbon-related emissions from laboratory-related
activities can be between 50-80% of total non-residential emissions at science- and technology-
intensive universities. It is therefore impossible for them to meet the carbon targets being set in
the UK without doing more to minimise laboratory energy consumption, and other carbon
impacts. However, this is difficult, with one barrier being limited information on how the energy in
laboratories is used, making it difficult to identify opportunities for improvement. Data available
from US laboratories suggests that ventilation is a key issue, particularly for chemistry
laboratories,4 and it has always been suspected that this is the case in the UK also. However, until
this exercise it was hard to know for sure.
The S-Lab energy audits were therefore carried out to address the gaps in current knowledge and
provide a detailed breakdown of energy use in UK university laboratories by different categories,
and to identify the main improvement opportunities. They have taken 8-10 person months of
work in total, and therefore represent some of the most robust studies on the topic which have
been conducted, in the UK or elsewhere.
3. Audit Details
The work began in 2008 and was mainly conducted in 2009/2010. Two of the investigations, at
Liverpool and Manchester, were carried out directly for S-Lab by Nigel Lenegan, of Energy &
Carbon Reduction Solutions, using basic metered data supplied by the universities. Nigel also led
the York investigation, in collaboration with the then Department of Biology Energy Manager, Jo
Hossell (now in the Estates Department), using detailed information developed by her.
The Edinburgh investigation was carried out by Tom McGrath, a mature engineering student at the
university, supervised by the Sustainability Manager, David Somervell. The Cambridge
investigation was carried out by Malcolm Tait of K J Tait Engineers directly for the university, and
the results have been used with permission, and with slight adjustment to conform to the S-Lab
categories.
2 Using the typical HEEPI lab benchmarks and Carbon Trust office benchmarks shown in Table 3 and assuming 10p/kWh for electricity and 3p/kWh for gas. 3 Hopkinson L. and James P., Sustainable Laboratories for Universities and Colleges – Reducing Energy and Environmental Impacts (2007). Available at www.goodcampus.org. See Tables 3 & 5 in this report for the benchmark figures for life science and chemistry laboratories respectively. 4 See www.labs21century.gov/toolkit/benchmarking.htm.

Energy Consumption of University Laboratories: Detailed Results from S-Lab Audits
HEEPI July 2011 Page 8 of 58 www.goodcampus.org
Table 2 summarises the general categories that were used, and how they were derived. Achieving
this categorisation was not straightforward. Some aspects had to be allocated between different
activities, e.g. gas heating between HVAC-related and general space heating. In some cases
activities were so large that metered data was available on them – for example, server room
consumption at Cambridge – but this was not possible in many cases.
Electricity consumption associated with personal computing (desktop and laptop computers,
printers etc.) is grouped in the ‘Equipment and Small Power’ category, as these are generally
metered together with lab equipment. For the same reason electricity from split DX air
conditioning units was also grouped under ‘Equipment and Small Power’ rather than the ‘Cooling’
category; the latter refers to central chillers and related pumps only. Electricity consumption
associated with central services (e.g. compressed air and nitrogen) which was separately metered
at some labs, was also included under the ‘Equipment and Small Power’ category.
Because of the important contribution of ventilation in laboratories, a ‘Ventilation-related’
category was estimated, which comprised all the energy used to move, cool and heat air. This
required a proportion of natural gas heating energy to be allocated to ventilation (as opposed to
direct space heating), i.e. a lab-space where heated air is exhausted through the ventilation
system will require more heating energy than a space without mechanical ventilation. This was
done by assuming that space heating was equivalent to the figure for a naturally ventilated office
(151 kWh/sq.m/year) given in a Carbon Trust report5, and that the remaining heating load - which
was generally around 60-65% of the total - was related to the laboratory mechanical ventilation
system.
Electricity consumed by heating pumps and chillers was also included in the ‘Ventilation-related’
category.
Appendix F provides further details of how the S-Lab estimates were derived at the individual
laboratories.
5 Carbon Trust, Energy Use in Government Laboratories (ECG083), London, 2002, page 5-2. Downloadable from: http://www.carbontrust.co.uk/publications/pages/publicationdetail.aspx?id=ECG083.

Energy Consumption of University Laboratories: Detailed Results from S-Lab Audits
HEEPI July 2011 Page 9 of 58 www.goodcampus.org
Table 2: Categorisation of Energy Consumption in Laboratories
Energy Categories Electricity-related Activities Gas-related Activities
Ventilation-related General supply
General extract
Fume cupboard extract
Special area ventilation
Electrical heating re ventilation (pumps)
Electrical cooling re ventilation (chillers,
pumps)
Boilers (Total energy
minus space heating
energy – see below)
Space Heating
(conventional space and
water heating)
Electrical heaters – not present in any of
the labs audited
Boilers (based on Carbon
Trust benchmark figure
per sq.m)
Equipment and Small
Power
Scientific equipment, IT equipment other
than servers, split DX air conditioning
units etc.
Central services – gases, compressed air
etc.
Lighting All lighting
Server Rooms All power supplied to server rooms
including servers, UPS, cooling where
significant load (Cambridge)

Energy Consumption of University Laboratories: Detailed Results from S-Lab Audits
HEEPI July 2011 Page 10 of 58 www.goodcampus.org
4. Summary Results – Life Science
The three life science laboratories are very different in terms of size, layout and the science
conducted within them. The Edinburgh Cancer Research Centre is a specialised research facility;
the York laboratories audited are research-only whereas Liverpool is a mixed teaching and
research facility. All three labs operate 24/7 although Edinburgh is unusual in that its main
ventilation system only operates during the daytime (there are designated fume cupboards and
areas for activities requiring 24/7 services). Edinburgh has a large onsite autoclave served by a
steam-boiler for sterilising biological waste and glassware, York has a steam autoclave serving a
small part of the facility, while Liverpool did not have an autoclave within the area audited. To aid
direct comparison the analysis for Edinburgh includes data both with and without the autoclave
energy included.
The breakdown of total energy consumption at Liverpool, Edinburgh and York are shown in Figures
1-4 below. It is evident that ventilation-related energy (which includes cooling and heating related
to ventilation) is – if the unusually high autoclave consumption at Edinburgh is discounted - within
a range of 43-47%. Equipment/small power accounts for between 22-26% of total energy while
space heating is between 19-23% of total energy.
Figures 5-8 below show the analogous results for energy costs. If the Edinburgh autoclave
consumption is excluded, ventilation-related costs are 38-44% of total energy costs, while there is
a much wider variation in small power/equipment, between 30-42%. Possible explanations for this
range are different types of science being carried out in the three labs, and the way that the data
was collected. The figures at Liverpool and York were based on sub-metered data pro-rated by
floor area, whereas at Edinburgh it was a bottom-up estimate (see Appendix F for more details on
sources of information).
Figure 1: Liverpool Total Energy Consumption Figure 2: York Total Energy Consumption

Energy Consumption of University Laboratories: Detailed Results from S-Lab Audits
HEEPI July 2011 Page 11 of 58 www.goodcampus.org
Figures 3 & 4: Edinburgh Total Energy Consumption With and Without Steam Autoclave
Figure 5: Liverpool Total Energy Costs Figure 6: York Total Energy Costs
Figures 7 & 8: Edinburgh Total Energy Costs With and Without the Steam Autoclave
Table 3 below shows that all three labs had higher energy, and especially electricity, consumption
than the HEEPI 2007 typical benchmark. Some possible explanations may be that all three are
intensively used compared to the norm, and/or that the HEEPI benchmarks are under-estimates,
perhaps because equipment intensity is increasing with time. The Edinburgh result seems
surprisingly high but there are a number of possible explanations:
The types of research carried out could be more energy intensive at Edinburgh (though the
electricity benchmark is similar to York, also purely research);
Edinburgh is a much more northerly location accounting for higher gas consumption;
Edinburgh has inefficiencies in certain areas (e.g. autoclave); and

Energy Consumption of University Laboratories: Detailed Results from S-Lab Audits
HEEPI July 2011 Page 12 of 58 www.goodcampus.org
Liverpool and York could be slightly underestimated as the overall energy data was not based
on direct metering (though the data has been thoroughly checked and the divergence is
unlikely to be high).
Table 4 shows very rough estimates of the annual cost per hourly air change and cubic metre of air
movement and conditioning in the life science facilities. These figures have an even stronger
‘health warning’ than others in the report because they involve very crude assumptions about
building volumes, and exclude any special ventilation. They are nonetheless of interest because
they show the cost savings that can be achieved by relatively small changes in the amount of air
moved, or hourly air change rates.
Table 3: Energy Comparisons for the Three Life Science Laboratories (kWh/sq.m/year)
Typical
Office
Benchmark6
HEEPI Lab
Benchmark7 Edinburgh
Edinburgh
Excluding
Autoclave
Liverpool York
Total Electricity 54 300 392 392 399 394
Total Gas 151 289 556 384 168 285
Total Energy 205 589 979 807 676 679
Ventilation-
related 6
Not
estimated 361 361 310 301
Equipment and
Small Power 22
Not
estimated 200 200 162 117
Table 4: Annual Cost per Hourly Air Change and Cubic Metre of Air Movement and Conditioning
Cambridge Edinburgh Liverpool Manchester York
Total HVAC Energy
Cost (£) 500,507 66,007 141,501 69,050 200,291
Design Air Supply
(m3/s) 108 20 42 37 66
Estimated Hourly Air
Change
NA due to
building
complexity
7.5 6.1 10.9 5.9
Annual Cost of Air
Movement (£/m3/s) 4,634 3,294 3,369 1,861 3,013
Annual Cost per
Hourly Air Change (£)
NA due to
building
complexity
8,783 23,209 6,311 34,129
6 Benchmarks for a typical naturally ventilated cellular office, from Carbon Trust, Energy use in offices (ECG019) (2003) available at: www.carbontrust.co.uk 7 See footnote 2. The figures are 2007 benchmarks for a typical medical/bioscience lab without secure
facility.

Energy Consumption of University Laboratories: Detailed Results from S-Lab Audits
HEEPI July 2011 Page 13 of 58 www.goodcampus.org
5. Summary Results - Chemistry
The two chemistry laboratories are also very different in scale and activities, and there are some
difficulties in comparing them. At Cambridge the whole chemistry building was assessed. At
Manchester only the extension of the main chemistry building was assessed which included two
teaching and a number of research labs. Cambridge also has a very high server component, which
Manchester does not (as the servers are located elsewhere). To aid direct comparison the analysis
includes the Cambridge data with the server room energy excluded. The breakdowns in terms of
total energy are shown overleaf.
Figures 9-11 show that the breakdowns are very similar for the ventilation-related (51-61%) and
space heating (18-22%) categories – though the latter may be a result of using the same
benchmark figure for space heating. Cambridge consumes a higher proportion of energy on
Equipment and Small Power (17-19%, than Manchester (10-12%). Note that the Cambridge
equipment energy estimate is subject to higher uncertainty because it is a residual figure.
Figures 12-14 show that there is a similar breakdown for energy costs (if the Cambridge server
rooms are excluded), with ventilation-related costs being 57-61% and equipment and small power
21-31% .
Table 4 above provides figures on the cost of hourly air changes and air movement within the two
laboratories.
Figure 9: Manchester Chemistry Total Energy Breakdown
Figures 10 and 11: Cambridge Chemistry Total Energy Breakdown With and Without Server
Consumption

Energy Consumption of University Laboratories: Detailed Results from S-Lab Audits
HEEPI July 2011 Page 14 of 58 www.goodcampus.org
Figure 12: Manchester Chemistry Total Energy Costs (Central Services energy included in
Equipment & Small Power category)
Figures 13 and 14: Cambridge Chemistry Total Energy Costs With and Without Server
Consumption
Table 5 shows that total energy and electricity consumption at both Manchester and Cambridge
(excluding servers) is below the HEEPI 2007 benchmark figures for a typical chemistry laboratory.
Gas consumption at Manchester is higher and at Cambridge lower than the benchmark figure.
These findings may reflect the fact that, unusually, the Manchester laboratory is not cooled in
summer, and the fact that both – and especially Cambridge – have devoted considerable effort to
reducing energy use.
Table 5: Energy Comparisons for the Two Chemistry Laboratories (kWh/sq.m/year)
Typical Office
Benchmark 8
HEEPI Lab
Benchmark 9 Cambridge
Cambridge
excluding
servers
Manchester
Total Electricity 54 367 371 295 232
Total Gas 151 353 336 336 421
Total Energy 205 720 708 631 652
Ventilation-
related 6
Not
estimated 361 361 419
Equipment and
Small Power 22
Not
estimated 117 117 58
8 Carbon Trust, see footnote 4. 9 See footnote 2. The figures are 2007 benchmarks for a typical chemistry laboratory.

Energy Consumption of University Laboratories: Detailed Results from S-Lab Audits
HEEPI July 2011 Page 15 of 58 www.goodcampus.org
The data generated by the audits was used to estimate the annual energy consumption and
energy costs of fume cupboards in the two laboratories. The figures produced are £1,277 for
Cambridge and £891 for Manchester. Both of these are approximate, and there are also significant
differences between the laboratories, especially the absence of cooling at Manchester and closure
of some of its plant during the period of the survey.
Hence, no conclusions about the relative efficiency of each can be drawn from the figures. Their
main significance is to validate the often made statements that fume cupboards are expensive to
operate, and to provide a ballpark figure of £900-1,500 for their actual energy costs in practice.
(An upper figure of £1,500 is reasonable given that Cambridge has some efficiency features that
are not present in many labs, and that some older fume cupboards are known to be even more
expensive).This range is lower than figures that are sometimes quoted, which probably reflects
improvements in energy efficiency in the decade since previous detailed work was done.
6. Equipment Energy
Detailed, bottom up analyses of equipment energy were undertaken at the Liverpool Biosciences
facility, the Manchester Chemistry extension and, less thoroughly, the Edinburgh Cancer Research
Building (see Tables C4, D5 and B4 in the respective Appendices). The estimates were based on
numbers of equipment, rated power (where available) and estimated usage of equipment.
Reduction factors were applied to the rated power to account for the fact that average power in
use is usually much lower than the rated peak power.
The analyses were not comprehensive as they generally excluded bespoke or 3-phase equipment,
where it was difficult to estimate power consumption. While there are many inherent difficulties
in estimates of this nature, they do provide some ballpark figures on equipment energy use. Table
6 summarises the top 10 equipment types (in descending order) in the two laboratories.10
Table 6: Significant Energy Consuming Equipment in Chemistry and Life Science Laboratories (in
descending order with most significant at the top of the list)
Chemistry Life Science
Heaters/Stirrers Freezer (-20)
Mass Spectrometry Environmental Chamber
Gas Chromatography Water bath
Rotary Evaporators Incubator
NMR Freezer (-80)
Ovens (Chemical) Oven
Fridges Ice maker
Diaphragm Pumps Hybridiser
Vacuum Pumps Incubator-shaker
Water Baths (Large) Thermal Cycler (PCR)
10 For more discussion of equipment energy and other environmental impacts see Hopkinson L. and James P., 2011, Saving Money Through Sustainable Procurement of Laboratory Equipment. Available at www.goodcampus.org.

Energy Consumption of University Laboratories: Detailed Results from S-Lab Audits
HEEPI July 2011 Page 16 of 58 www.goodcampus.org
7. Conclusions
Our investigations have highlighted the high energy consumption and costs of laboratories, and
the fact that ventilation (and associated cooling and heating) is the most important component of
this. Table 7 summarises a ‘rule of thumb’ split of laboratory energy consumption, and shows that
ventilation accounts for around 60% in chemistry and 45% in life science. It also provides the
energy split for an office – where the main elements are space heating, hot water and lighting -
and thereby demonstrates how much they differ from laboratories.
The investigations have also highlighted the importance of IT in many laboratories. Where they
exist, server rooms can be a significant and growing component of consumption – accounting for
17% of total consumption at Cambridge.
Undertaking this exercise has demonstrated that, despite the difficulties, it is worthwhile for many
reasons, including:
Highlighting, and providing information to support a business case for, many opportunities for
minimise energy consumption and saving money, by tackling ventilation systems. Some of
these have already been adopted in one or two of the laboratories but all would admit that
there is scope for more.
Assisting research and teaching, for example, by identifying poorly performing equipment and
systems.
Gaining a better knowledge of equipment numbers and usage which can enable improved
procurement, and more sharing of equipment between laboratories.
Enhancing safety through a more thorough understanding of both laboratory activities and the
detailed workings of ventilation systems, as well as their interaction.
Improving cross-functional working relationships, especially between Estates and laboratory
staff.
As a subsequent report will describe, the exercise suggests that there is the potential to reduce UK
university energy bills by tens of millions of pounds through schemes that have a five year payback
or less.
Table 7: Broad Estimates of Energy in Typical Laboratories by Category
Category Approximate Percentage of Total Energy
Life Science
Laboratory
Chemistry Laboratory Typical Office11
Ventilation-related 45% 60% 3%
Space/water heating 20% 20% 74%
Equipment and small
power
25% 15% 12%
Lighting 10% 5% 11%
11 Carbon Trust benchmark for typical naturally ventilated cellular office, see footnote 4.
Energy Consumption of University Laboratories: Detailed Results from S-Lab Audits
HEEPI July 2011 Page 17 of 58 www.goodcampus.org
Appendix A - Energy Consumption in the University of Cambridge’s
Chemistry Building
S-Lab would like to acknowledge the use of data and other information supplied by Malcolm Tait
of K J Tait Engineers who completed an energy audit of the University of Cambridge’s Department
of Chemistry building in 2009/2010. S-Lab has re-categorised some of the data to allow
comparison with the other lab audits, but the main data collection has been conducted by K J Tait
Engineers.
The Chemistry Building is a 3-storey building of 27,600 sq.m which is used for both teaching and
research. It was constructed in the 1950s and had undergone continual refurbishments since then,
including a major re-fit of the roof plant in the mid 1990s. There is only a mains gas and a mains
power meter serving the building, therefore the electricity consumption by category has been
estimated in various ways.
The building has 328 constant volume fume cupboards. Heating is provided by four natural gas
fired boilers, while there are also four electrically powered steam boilers. Six chiller units provide
cooling to the whole building with additional cooling for scientific equipment provided by over 200
split DX units. The building has a large IT component with 10 energy-intensive server rooms
housing High Performance Computing.
A1. Overview
Table A1 provides data on the metered electricity and gas for the building for the academic year
2007/08. It shows that the Chemistry Building:
Consumed over 19 million kWh of energy comprising 10 million kWh of electricity and 9 million
kWh of gas.
Had an annual energy cost of over £1 million in total, comprising around £890,000 in electricity
(at 8.7p/kWh) and £211,000 in gas (at 2.3p/kWh).
Table A2 and Figures A1 and A2 give a breakdown of total electricity consumption, with and
without server energy. This allows comparison with other chemistry buildings without server
rooms. Figure A1 shows that ventilation and lab equipment/small power comprise an estimated
32% each with the server rooms a further 20% of electricity consumption. Figure A2, which
excludes server energy, shows ventilation and lab equipment/small power comprise the majority
(80%) of electricity consumption in the building.
Table A3 and Figure A3 give a breakdown of total energy in the building. Figure A3 shows that
heating (gas consumption plus electrical heating) comprises nearly half of total energy
consumption.

Energy Consumption of University Laboratories: Detailed Results from S-Lab Audits
HEEPI July 2011 Page 18 of 58 www.goodcampus.org
Figures A4 and A5 show the breakdown of total energy (including and excluding server rooms
respectively) after a portion of the gas heating energy is reassigned to the ventilation category.
When server rooms are included (Figure A4) approximately half (51%) of the energy consumption
of the building is ventilation-related, associated with moving and conditioning (heating, cooling)
air. A further 18% is space heating and an estimated 17% is equipment and small power. When
server rooms are excluded (Figure A5), approximately 57% of energy consumption is ventilation-
related, 21% is space heating and 19% is equipment and small power.
Lastly, Figures A6 and A7 show the breakdown of total energy costs. When server room energy is
included, ventilation-related emissions are 45%, equipment/small power 26% and server rooms
17% of total energy costs. When server room energy is excluded, ventilation-related emissions are
54% and equipment/small power 31% of total energy costs.

Energy Consumption of University Laboratories: Detailed Results from S-Lab Audits
HEEPI July 2011 Page 19 of 58 www.goodcampus.org
Table A1: Details of Energy Consumption and Costs of the Chemistry Building, University of Cambridge
Gross Internal
Area (sq.m)
Electricity
(kWh/y)
Electricity
Cost (£/y)
Gas/heat
(kWh/y)
Gas/heat
Cost (£/y)
Total Energy
(kWh/y)
Total Energy Cost
(£/y)
Chemistry Building 27,603 10,251,111
(metered)
887,746 9,286,803
(metered)
210,810 19,537,914 1,098,556
Annual Energy Consumption
per Unit Area (kWh/sq.m/y)
371 336 707
HEEPI Typical Benchmark
for Chemistry (kWh/sq.m/y)
367 353 720
Annual Energy Cost per Unit
Area (£/sq.m/y)
32 8 40

Energy Consumption of University Laboratories: Detailed Results from S-Lab Audits
HEEPI July 2011 Page 20 of 58 www.goodcampus.org
Table A2: Estimated Electricity Consumption and Cost in the Chemistry Building, University of Cambridge
Category Sub-category Consumption
(kWh/y)
Cost
(£/y)
Basis of Estimate
Ventilation
General Supply 1,577,341 136,598 Estimate based on running hours and nameplate motor rating.
General Extract 98,280 8,511 As above.
Fume Extract 1,597,727 138,363 As above.
Sub-total 3,273,348 283,472 Sum of ventilation sub-categories.
Heating Pumps 373,318 32,329 Estimate based on running hours and nameplate motor rating.
Cooling (chillers & pumps) 642,213 55,616 Chillers only. Does not include split DX units.
HVAC Total 4,288,879 371,417 Ventilation plus heating plus cooling above.
Lighting 604,800 52,376 Assumed lighting benchmark of 64 kWh/sq.m.
Equipment and Small Power
3,248,024 281,279
Residual of metered electricity minus other categories. Small power
includes split DX units and general IT equipment (PCs, monitors,
imaging equipment and equipment IT).
IT (Server Rooms)
2,109,408 182,675 Server energy and server cooling only. General IT included in small
power.
Total Electricity Consumption
from Metered Data
10,251,111 887,746
See Table A1.

Energy Consumption of University Laboratories: Detailed Results from S-Lab Audits
HEEPI July 2011 Page 21 of 58 www.goodcampus.org
Table A3: Estimated Energy Consumption and Costs in the Chemistry Building, University of Cambridge
Category Consumption
(kWh/y)
Cost (£/y) Basis of Estimate
Electricity – Total 10,251,111 £887,746 See Table A1, metered data.
Electricity – HVAC 4,288,879 £371,417 See Table A2. Note this does not include split DX units.
Electricity – Other 5,962,232 £516,329 See Table A2 – residual from HVAC.
Gas Consumption Total 9,286,803 £210,810 See Table A1.
Heating (Gas) – Space 3,600,000 £81,720 Based on metered data for heating and hot water. In other S-Lab audits this data was
not available therefore assumed space heating as a naturally ventilated office = 151
kWh/sq.m /year (from ECG83 - see reference in Section 3). This gives a figure of
4,168,053 kWh which is 16% higher than the metered data.
Heating (Gas) - Ventilation 5,686,803 £129,090 Total gas consumption minus space heating component.
HVAC Energy 9,975,682 £500,507 Electricity – HVAC plus Ventilation Heating element of Gas.
Table A4: Estimated Fume Cupboard Energy and Costs in the Chemistry Building, University of Cambridge
Element Consumption
(kWh/y) Cost (£/y) Basis of Estimate
Fume Extract Fans 1,597,727 £138,363 Figure from Table A2.
Supply AHU's – Fans 1,498,474 £129,768 95% of total fan energy – based on an informed engineering estimate that only 5% of
supply air is removed via general extract fans.
General Extract Fans 98,280 £8,511 Figure from Table A2.
Heating Pumps 227,724 £19,721 61% of the total heating pump power 373,318 kWh given in Table A2, i.e. it was assumed
that 39% of the load was related to space heating, as per Table A3 and Section 3.
Fresh Air - Heat Only (no
cooling or
(de)humidification)
5,402,463 £122,635 95% of the natural gas heating associated with ventilation (5,686,803 kWh - see Table A3).
Total Fume Cupboards 8,824,668 £418,998 Sum of all the above.
Per Fume Cupboard 26,904 £1,277 For 328 fume cupboards at 0.5 m/s face velocity.

Energy Consumption of University Laboratories: Detailed Results from S-Lab Audits
HEEPI July 2011 Page 22 of 58 www.goodcampus.org
Figure A1: Breakdown of Estimated Electricity Usage, Chemistry Building, University of
Cambridge
Figure A2: Breakdown of Estimated Electricity Usage Excluding Server Rooms, Chemistry
Building, University of Cambridge
Figure A3: Breakdown of Estimated Total Energy Usage, Chemistry Building, University of
Cambridge

Energy Consumption of University Laboratories: Detailed Results from S-Lab Audits
HEEPI July 2011 Page 23 of 58 www.goodcampus.org
Figure A4: Breakdown of Estimated Total Energy Usage (Server Rooms Included), Chemistry
Building, University of Cambridge (With Heating/Cooling Component of Ventilation Included in
Ventilation-Related)
Figure A5: Breakdown of Estimated Total Energy Usage (ServerRooms Excluded), Chemistry
Building, University of Cambridge (With Heating/Cooling Component of Ventilation Included in
Ventilation-Related)

Energy Consumption of University Laboratories: Detailed Results from S-Lab Audits
HEEPI July 2011 Page 24 of 58 www.goodcampus.org
Figure A6: Breakdown of the Estimated Costs Associated with Total Energy Usage (Server Rooms
Included), Chemistry Building, University of Cambridge (With Heating Component of Ventilation
Included in Ventilation-Related Category
Figure A7: Breakdown of the Estimated Costs Associated with Total Energy Usage (Server Rooms
Excluded), Chemistry Building, University of Cambridge (With Heating Component of Ventilation
Included in Ventilation-Related Category

Energy Consumption of University Laboratories: Detailed Results from S-Lab Audits
HEEPI July 2011 Page 25 of 58 www.goodcampus.org
Appendix B - Energy Consumption in the University of Edinburgh’s
Cancer Research Centre
The University of Edinburgh Cancer Research Centre is a five-storey standalone building of
3,000m² completed in 2002 at a capital cost of £7 million. It is primarily a biomedical research
laboratory that houses approximately 130 full-time staff and is one of a number of Cancer
Research UK funded laboratories across the UK.
The Centre operates a night-time setback reducing the running costs associated with continuous
HVAC operation. This setback was conceived from the very outset to contain energy costs and has
been achieved through education of staff in good practice in energy management. A typical HVAC
operating day is from 5 a.m. to 10 p.m. with further reduced hours at weekend (and as a result of
this study “occupancy” hours will be reviewed to further cut down HVAC costs). The building
maintains access to staff on a 24/7 basis with the option of using the microbiological safety
cabinets.
Monitoring is provided by separate meters for gas and electricity, electricity readings are taken
every half hour, but there is no other sub metering. Heating is provided by three natural gas fired
boilers (425kW) and a separate gas fired steam generator provides steam for the two onsite
autoclaves. Two indoor, air cooled, chiller units (each with 328.5kW chilling capacity) provide
cooling to the whole building. There are also a number of split DX units in specialist equipment
rooms, including a dedicated -80 freezer room on the ground floor.
B1. Overview
Table B1 provides data for the size and estimated energy consumption of the building (based on
pro rata figures for consistency). It shows that in the academic year 2009/10 it:
Consumed nearly 3 million kWh of energy, comprising around 1.3 million kWh of electricity
and around 1.7 million kWh of fossil fuel energy.
Had annual energy costs of around £200,000, comprised of around £152,000 for electricity (at
12 p/kWh) and £48,000 for gas (at 2.8 p/kWh).
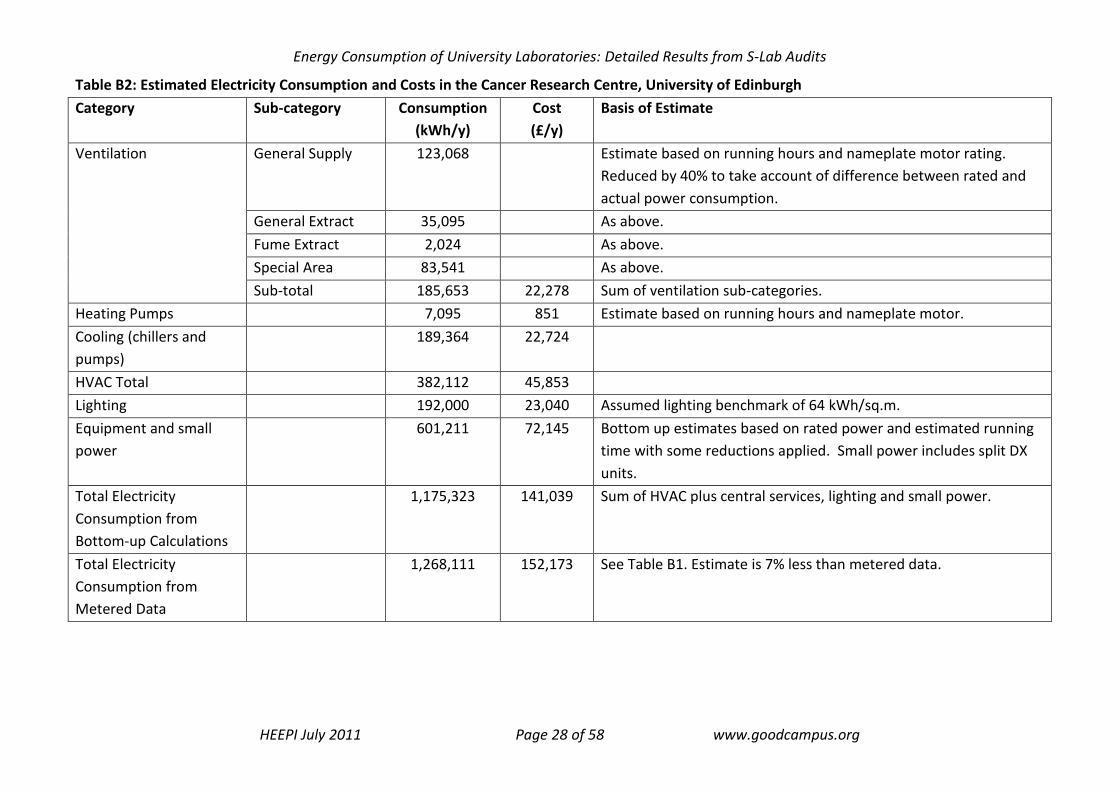
Table B2 and Figure B1 give a further breakdown of estimated electricity consumption. This shows
that equipment and small power accounts for 51%, ventilation 16% and lighting 16% of total
electricity.
Table B3, and Figures B2 and B3, provide a breakdown of total energy. Figure B2 shows that
autoclave steam accounts for 18% and heating (gas and electric) 41% of total energy. Figure B3
shows the breakdown when the estimated autoclave component is excluded. This indicates that
approximately 50% of the energy consumption of the building is associated with heating and 26%
with small power.
Energy Consumption of University Laboratories: Detailed Results from S-Lab Audits
HEEPI July 2011 Page 26 of 58 www.goodcampus.org
Figure B4 shows the estimated total energy when the gas heating component of ventilation is
grouped with ventilation-related electricity (ventilation, electrical heating and cooling), and
autoclave energy is excluded. This shows that ventilation-related energy is responsible for 38% of
the total energy.
Figures B5 and B6 show energy costs, with autoclave energy excluded in the latter. Figure B6
shows that 42% of total costs are associated with equipment and small power, and 38% with
ventilation.
Table B4 shows the estimated electricity consumption of scientific equipment (note that only the
main energy-intensive items of equipment were included in the estimate). This is based on
bottom-up estimates of energy using rated power (adjusted in many cases), estimated usage and
numbers of equipment. This shows that general equipment is 48%, refrigeration equipment 34%
(of which -80 freezers were the main component) and IT 18% of total equipment energy.

Energy Consumption of University Laboratories: Detailed Results from S-Lab Audits
HEEPI July 2011 Page 27 of 58 www.goodcampus.org
Table B1: Details of Energy Consumption and Costs of the Cancer Research Centre, University of Edinburgh
Gross Internal
Area (sq.m)
Electricity
(kWh/y)
Electricity Cost
(£/y)
Gas/heat
(kWh/y)
Gas/heat Cost
(£/y)
Total Energy
(kWh/y)
Total Energy
Cost (£/y)
Cancer Research
Centre
3,000 1,268,111
(metered)
152,173 949,279 (a)
1,669,297 (b)
(both metered)
26,580 (a)
48,036 (b)
2,421,480 (a)
2,937,408 (b)
178,753 (a)
200,209 (b)
Annual Energy
Consumption
per Unit Area
(kWh/sq.m/y)
422 316 (a)
556(b)
738 (a)
979(b)
HEEPI Energy
Benchmark for
Life Sciences
(Excluding
Secure Facility)
(kWh/sq.m/y)
Good: 242
Typical: 300
Good: 196
Typical: 289
Good: 438
Typical: 589
Annual Energy
Cost per Unit
Area
(kWh/sq.m/y)
51 9(a)
16(b)
60(a)
67(b)
(a) excluding autoclave energy consumption
(b) including autoclave energy consumption
Energy Consumption of University Laboratories: Detailed Results from S-Lab Audits
HEEPI July 2011 Page 28 of 58 www.goodcampus.org
Table B2: Estimated Electricity Consumption and Costs in the Cancer Research Centre, University of Edinburgh
Category Sub-category Consumption
(kWh/y)
Cost
(£/y)
Basis of Estimate
Ventilation
General Supply 123,068 Estimate based on running hours and nameplate motor rating.
Reduced by 40% to take account of difference between rated and
actual power consumption.
General Extract 35,095 As above.
Fume Extract 2,024 As above.
Special Area 83,541 As above.
Sub-total 185,653 22,278 Sum of ventilation sub-categories.
Heating Pumps 7,095 851 Estimate based on running hours and nameplate motor.
Cooling (chillers and
pumps)
189,364 22,724
HVAC Total 382,112 45,853
Lighting 192,000 23,040 Assumed lighting benchmark of 64 kWh/sq.m.
Equipment and small
power
601,211 72,145 Bottom up estimates based on rated power and estimated running
time with some reductions applied. Small power includes split DX
units.
Total Electricity
Consumption from
Bottom-up Calculations
1,175,323 141,039 Sum of HVAC plus central services, lighting and small power.
Total Electricity
Consumption from
Metered Data
1,268,111 152,173 See Table B1. Estimate is 7% less than metered data.

Energy Consumption of University Laboratories: Detailed Results from S-Lab Audits
HEEPI July 2011 Page 29 of 58 www.goodcampus.org
Table B3: Estimated Energy Consumption and Costs in the Cancer Research Building, University of Edinburgh
Category Consumption
(kWh/y)
Cost (£/y) Basis of Estimate
Electricity – Total 1,175,323 141,039 See Table B2 based on bottom up estimates.
Electricity – HVAC 382,112 45,853 See Table B2 –kWh of ventilation + ventilation-related electrical heating and cooling.
Electricity – Other 793,211 95,186 See Table B2 – residual from HVAC.
Gas Consumption Total 1,669,297 48,036 See Table B1.
Gas for Steam Boiler
Serving Autoclave
515,928 14,846 Estimate from monthly gas consumption for summer months, assume 42,994
kWh/month.
Gas consumption for
heating
1,153,369 33,189 Gas consumption total minus autoclave gas.
Heating (Gas) – Space 453,000 13,036 No data available, therefore, assume space heating as a naturally ventilated office =
151 kWh/sq.m/year (Carbon Trust, see footnote 4).
Heating (Gas)- Ventilation 700,369 20,154 Total heating minus space component.
HVAC Energy 1,082,481 66,007 Electricity - HVAC plus Heating -Ventilation element.

Energy Consumption of University Laboratories: Detailed Results from S-Lab Audits
HEEPI July 2011 Page 30 of 58 www.goodcampus.org
Table B4: Estimated Annual Electricity Consumption of Scientific Equipment based on Bottom-up Estimates, University of Edinburgh
Total
Use in
kWh/y
and (%)
Equipment List Average
Power
(W)
Typical
Usage
(hrs/y)
Qty Estimated Unit
Energy Use
(kWh/y)
Estimated
Total Energy
Use (kWh/y)
Estimated
Total Costs
(£/y)
% of
Equipment
List Total
Departmental
Equipment
235,044
(48%)
Incubator 313 32 2,738 87,631 10,516 37
Other Deptl Equip 184 51 1,609 82,084 9,850 35
Water bath 289 8 2,528 20,224 2,427 9
Centrifuge 128 18 1,118 20,127 2,415 9
Oven 302 4 2,649 10,596 1,272 5
Fume Cupboards 50 16 436 6973 837 3
Shaker 96 8 841 6,726 807 3
Hot Plates 26 3 228 683 82 0
Refrigeration 172,123
(34%)
-80 Freezer 1,200 8,760 12 10,512 126,144 15,137 73
Under Bench Fridge 50 8,760 35 440 15,417 1,850 9
Under Bench Freezer 50 8,760 30 438 13,140 1,577 8
Tall Fridge 65 8,760 13 571 7,419 890 4
Tall Freezer 28 8,760 19 245 4,660 559 3
Ice Machines 200 8,760 2 1,752 3,504 420 2
Tall Fridge/Freezer 80 8,760 2 701 1,401 168 1
Underbench F/F 50 8,760 1 438 438 53 0
IT 87,225
(18%)
Select PC 36 119 315 37,485 4,498 43
Servers 300 8,760 12 2,628 31,536 3,784 36
High Perf PC 53 23 460 10,580 1,270 12
Printer 51 14 444 6,218 746 7
Other IT Equip 23 7 201 1,406 169 2
Total 494,392

Energy Consumption of University Laboratories: Detailed Results from S-Lab Audits
HEEPI July 2011 Page 31 of 58 www.goodcampus.org
Figure B1: Breakdown of Estimated Electricity Usage, Cancer Research Centre, University of
Edinburgh
Figure B2: Breakdown of Estimated Total Energy Usage, Cancer Research Centre, University of
Edinburgh
Figure B3: Breakdown of the Estimated Total Energy Usage, Cancer Research Centre, University
of Edinburgh (With Heating/Cooling Component of Ventilation Included in Ventilation-Related)

Energy Consumption of University Laboratories: Detailed Results from S-Lab Audits
HEEPI July 2011 Page 32 of 58 www.goodcampus.org
Figure B4: Breakdown of the Estimated Total Energy Usage, Excluding Autoclave Energy, Cancer
Research Centre, University of Edinburgh (With Heating/Cooling Component of Ventilation
Included in Ventilation-Related)
Figure B5: Breakdown of the Estimated Costs Associated with Total Energy Usage, Cancer
Research Centre, University of Edinburgh (With Heating/Cooling Component of Ventilation
Included in Ventilation-Related)
Figure B6: Breakdown of the Estimated Costs Associated with Total Energy Usage, Excluding
Autoclave Use, Cancer Research Centre, University of Edinburgh (With Heating/Cooling
Component of Ventilation Included in Ventilation-Related)

Energy Consumption of University Laboratories: Detailed Results from S-Lab Audits
HEEPI July 2011 Page 33 of 58 www.goodcampus.org
Appendix C - Energy Consumption in the University of Liverpool’s
Biosciences Building
The School of Biological Sciences has three buildings which are metered and billed in aggregate.12
We refer to this building complex as the School complex. Our work focussed on one of these, the
Biosciences Building, a 4 storey building of 9,510 sq.m. We did not address Mersey Bio, a facility
for start up biotechnology businesses which occupies 1,760 sq.m at one end of the building. We
therefore refer to the area investigated as the ‘academic section of the Biosciences Building’. This
is used for both teaching and research. The offices run along one side of the building separated by
a corridor from the lab space. The latter comprises 2 main labs on each floor surrounded by
secondary lab areas.
There are only 23 fume cupboards but a number of specially-ventilated areas such as Constant
Temperature (CT) rooms, plant growth rooms, cell imaging and microscope rooms. Heating is
provided by gas. Two main 370kW chiller units in the roof plant room provide cooling to the whole
building, with a third chiller serving specialist rooms. There are a number of split DX units in
specialist equipment rooms, including a dedicated -80 freezer room on the ground floor.
C1. Overview
Table C1 provides data for the size and estimated energy consumption of the three School
buildings (based on pro rata figures for consistency). It shows that in 2009-10 they:
Consumed nearly 12 million kWh of energy, comprising around 7 million kWh of electricity and
around 5 million kWh of fossil fuel energy.
Had annual energy costs of £691,791, comprised of £556,679 for electricity (at 8 p/kWh) and
£135,111 for gas (at 2.8 p/kWh).
Table C1 also shows that the academic section of the Biosciences Building (which occupies around
about 80% of the space):
Consumes an estimated 5 million kWh of energy, comprising around 3 million kWh of
electricity and 2 million kWh of fossil fuel/heat energy.
Has estimated annual energy costs of £307,489 comprised of £247,434 for electricity and
£60,055 for gas.
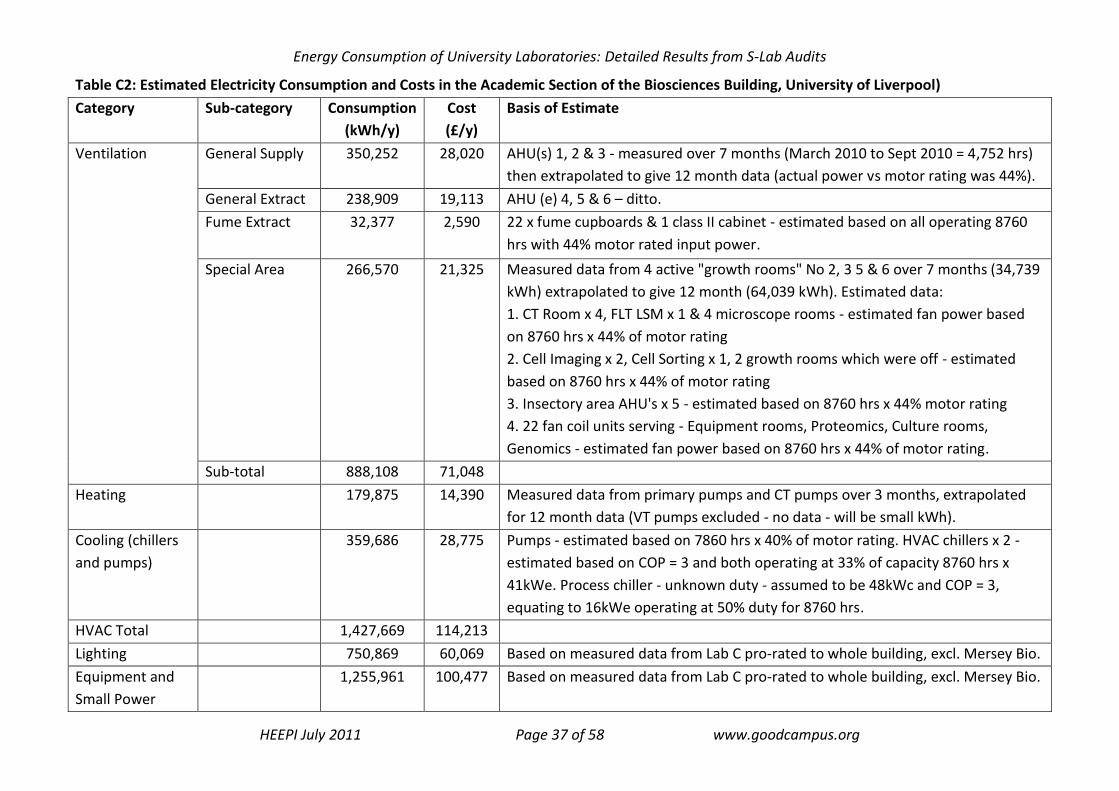
Table C2 and Figure C1 give a further breakdown of estimated electricity consumption in the
academic section of the Biosciences Building. This shows that equipment and small power (mainly
lab equipment and IT) accounted for 37%, ventilation 26% and lighting 22% of total electricity.
Table C3 and Figures C2 and C3 provide a breakdown of total energy consumption in the academic
section of the Biosciences Building. Figure C3 shows the breakdown when the estimated heating
12 The total electricity bill for the School of Biological Sciences of around £557,000 includes consumption from Mersey Bio within Biosciences Building, as well as energy from the Life Sciences and NMR buildings.

Energy Consumption of University Laboratories: Detailed Results from S-Lab Audits
HEEPI July 2011 Page 34 of 58 www.goodcampus.org
component of ventilation is included in the ventilation category. This indicates that approximately
43% of the energy consumption of the academic section of the Biosciences Building is associated
with moving and conditioning (heating, cooling, humidifying etc.) air.
Figure C4 shows the breakdown for energy costs, when equipment and small power is a much
larger component (because of its disproportionate use of electricity, which is more expensive than
gas).
Figure C1: Breakdown of Estimated Electricity Usage in the Academic Section of the Biosciences
Building, University of Liverpool
Figure C2: Breakdown of Estimated Total Energy Usage in the Academic Section of the
BioSciences Building, University of Liverpool

Energy Consumption of University Laboratories: Detailed Results from S-Lab Audits
HEEPI July 2011 Page 35 of 58 www.goodcampus.org
Figure C3: Breakdown of the Estimated Total Energy Usage in the Academic Section of the
Biosciences Building, University of Liverpool (with Heating/Cooling Component of Ventilation
Included in Ventilation-Related)
Figure C4. Breakdown of the Estimated Total Energy Costs in the Academic Section of the
Biosciences Building, University of Liverpool (with Heating/Cooling Component of Ventilation
Included in Ventilation-Related)

Energy Consumption of University Laboratories: Detailed Results from S-Lab Audits
HEEPI July 2011 Page 36 of 58 www.goodcampus.org
Table C1: Details of Energy Consumption and Costs of the School of Biological Sciences, University of Liverpool, Pro-rated by Floor Area
Gross Floor
Area (sq.m)
Electricity
(kWh/y)
Electricity Cost
(£/y)
Gas/heat
(kWh/y)
Gas/heat Cost
(£/y)
Total Energy
(kWh/y)
Total Energy
Cost (£/y)
Life Sciences 7,550 3,013,112 (a) 241,049 2,089,464 58,505 5,102,576 299,554
Academic Section
of the Biosciences
Building
7,750 3,092,930 (a) or
3,434,498 (b)
247,434 (a) or
274,760 (b) 2,144,814 60,055 5,237,743 (a) 307,489
Mersey Bio 1,760 702,394 (a) 56,192 487,080 13,638 1,189,475 69,830
NMR 376 150,057 (a) 12,005 104,058 2,913 254,115 14,918
Total School of
Biological
Sciences
17,436 6,958,493 556,679 4,825,416 135,112 11,783,909 691,791
Annual Energy
Consumption per
Unit Area
(kWh/sq.m/y)
399 276 676
HEEPI Good and
Typical
Benchmark for
Life Sciences
(Excluding Secure
Facility)
Good: 242
Typical: 300
Good: 196
Typical: 289
Annual Energy
Cost per Unit Area
(£/sq.m/y)
32 (c) 8 40
(a) Metered figure for whole building pro-rated by floor area
(b)Estimate derived from bottom-up calculations (see Table C2)
(c) Based on pro-rated floor area.
Energy Consumption of University Laboratories: Detailed Results from S-Lab Audits
HEEPI July 2011 Page 37 of 58 www.goodcampus.org
Table C2: Estimated Electricity Consumption and Costs in the Academic Section of the Biosciences Building, University of Liverpool)
Category Sub-category Consumption
(kWh/y)
Cost
(£/y)
Basis of Estimate
Ventilation
General Supply 350,252 28,020 AHU(s) 1, 2 & 3 - measured over 7 months (March 2010 to Sept 2010 = 4,752 hrs)
then extrapolated to give 12 month data (actual power vs motor rating was 44%).
General Extract 238,909 19,113 AHU (e) 4, 5 & 6 – ditto.
Fume Extract 32,377 2,590 22 x fume cupboards & 1 class II cabinet - estimated based on all operating 8760
hrs with 44% motor rated input power.
Special Area 266,570 21,325 Measured data from 4 active "growth rooms" No 2, 3 5 & 6 over 7 months (34,739
kWh) extrapolated to give 12 month (64,039 kWh). Estimated data:
1. CT Room x 4, FLT LSM x 1 & 4 microscope rooms - estimated fan power based
on 8760 hrs x 44% of motor rating
2. Cell Imaging x 2, Cell Sorting x 1, 2 growth rooms which were off - estimated
based on 8760 hrs x 44% of motor rating
3. Insectory area AHU's x 5 - estimated based on 8760 hrs x 44% motor rating
4. 22 fan coil units serving - Equipment rooms, Proteomics, Culture rooms,
Genomics - estimated fan power based on 8760 hrs x 44% of motor rating.
Sub-total 888,108 71,048
Heating 179,875 14,390 Measured data from primary pumps and CT pumps over 3 months, extrapolated
for 12 month data (VT pumps excluded - no data - will be small kWh).
Cooling (chillers
and pumps)
359,686 28,775 Pumps - estimated based on 7860 hrs x 40% of motor rating. HVAC chillers x 2 -
estimated based on COP = 3 and both operating at 33% of capacity 8760 hrs x
41kWe. Process chiller - unknown duty - assumed to be 48kWc and COP = 3,
equating to 16kWe operating at 50% duty for 8760 hrs.
HVAC Total 1,427,669 114,213
Lighting 750,869 60,069 Based on measured data from Lab C pro-rated to whole building, excl. Mersey Bio.
Equipment and
Small Power
1,255,961 100,477 Based on measured data from Lab C pro-rated to whole building, excl. Mersey Bio.

Energy Consumption of University Laboratories: Detailed Results from S-Lab Audits
HEEPI July 2011 Page 38 of 58 www.goodcampus.org
Total Electricity
Use Estimated
from Bottom Up
calculations
3,434,498 274,759 Sum of above.
Total Electricity
Use Based on
Floor Area, Pro
Rated
3,092,930 247,434 See Table C1.
Table C3: Estimated Energy Consumption and Costs in the Academic Section of the BioSciences Building, University of Liverpool
Category Consumption
(kWh/y)
Cost (£/y) Basis of Estimate
Electricity – Total 3,434,498 274,760 See Table A2. Estimate based on bottom-up calculations.
Electricity – HVAC 1,427,669 114,213 See Table A2 –kWh of ventilation + ventilation-related electrical heating and cooling.
Electricity – Other 2,006,829 160,546 See Table A2 – residual of Total Electricity minus HVAC Electricity.
Gas Consumption Total
2,144,814 60,055
Gas figure for School of Biological Sciences pro-rated by building floor area for
Biosciences Building excluding Mersey Bio Based on metered total figure, pro-rated by
area – extension = 23% of total building. See Table A1.
Heating (Gas) – Space 1,170,250 32,767
No data available, therefore, assume space heating as a naturally ventilated office =
151 kWh/sq.m/year (Carbon Trust, see footnote 4).
Heating (Gas)- Ventilation 974,564 27,288 Total heating minus space component (equivalent to 45% of heating).
HVAC Energy 2,402,233 141,501 Electricity - HVAC (based on bottom up estimates) plus Heating -Ventilation element.

Energy Consumption of University Laboratories: Detailed Results from S-Lab Audits
HEEPI July 2011 Page 39 of 58 www.goodcampus.org
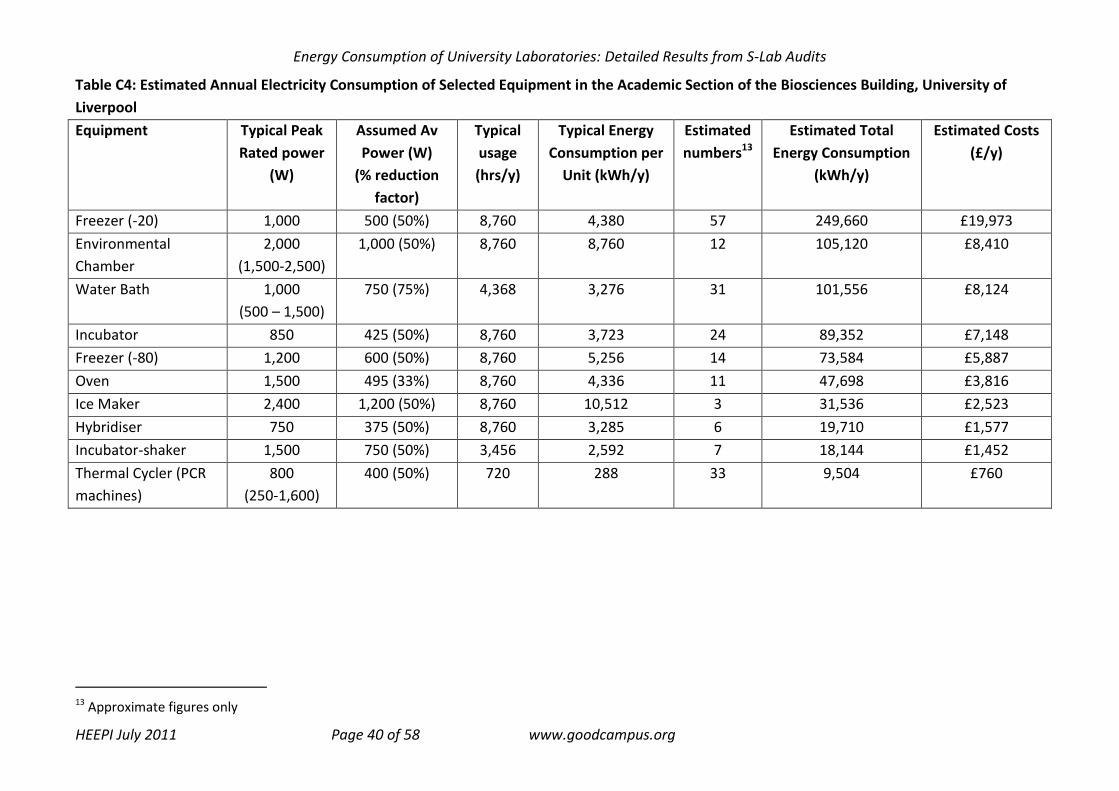
C2. Plug Load
An inventory of over 1,000 items of lab equipment (including PCs and monitors) in the academic
section of the Biosciences Building was conducted, and the rated (peak) power consumption data
and estimated usage hours were noted where available. Note that power data for some
equipment was inaccessible or unavailable – particularly for large 3-phase or bespoke equipment.
The rated power is likely to overestimate energy consumption and therefore reduction factors
were applied to get average energy consumption figures. When organised by total energy
consumption, the equipment responsible for the highest energy load were identified, as shown in
Table C4. Note that this does not include specialised equipment such as laser microscopes, robotic
equipment, mass spectrometers etc.
The figures for total plug load created by this exercise were approximately 16% lower than the
estimate obtained by extrapolating metered figures from Laboratory C (given in Table C2). It is not
clear how representative Lab C is of the lab equipment in the building as a whole, and which of
these methods is more accurate. Nonetheless, Table C4 provides a number of interesting insights,
especially:
Much of equipment energy consumption is associated with heating or cooling, and/or 24/7
operation.
Equipment which is relatively low powered (e.g. thermal cyclers), but plentiful and frequently
used, can be significant.
Energy Consumption of University Laboratories: Detailed Results from S-Lab Audits
HEEPI July 2011 Page 40 of 58 www.goodcampus.org
Table C4: Estimated Annual Electricity Consumption of Selected Equipment in the Academic Section of the Biosciences Building, University of
Liverpool
Equipment Typical Peak
Rated power
(W)
Assumed Av
Power (W)
(% reduction
factor)
Typical
usage
(hrs/y)
Typical Energy
Consumption per
Unit (kWh/y)
Estimated
numbers13
Estimated Total
Energy Consumption
(kWh/y)
Estimated Costs
(£/y)
Freezer (-20) 1,000 500 (50%) 8,760 4,380 57 249,660 £19,973
Environmental
Chamber
2,000
(1,500-2,500)
1,000 (50%) 8,760 8,760 12 105,120 £8,410
Water Bath 1,000
(500 – 1,500)
750 (75%) 4,368 3,276 31 101,556 £8,124
Incubator 850 425 (50%) 8,760 3,723 24 89,352 £7,148
Freezer (-80) 1,200 600 (50%) 8,760 5,256 14 73,584 £5,887
Oven 1,500 495 (33%) 8,760 4,336 11 47,698 £3,816
Ice Maker 2,400 1,200 (50%) 8,760 10,512 3 31,536 £2,523
Hybridiser 750 375 (50%) 8,760 3,285 6 19,710 £1,577
Incubator-shaker 1,500 750 (50%) 3,456 2,592 7 18,144 £1,452
Thermal Cycler (PCR
machines)
800
(250-1,600)
400 (50%) 720 288 33 9,504 £760
13 Approximate figures only

Energy Consumption of University Laboratories: Detailed Results from S-Lab Audits
HEEPI July 2011 Page 41 of 58 www.goodcampus.org
Appendix D - Energy Consumption in the University of Manchester’s
Chemistry Extension
D1. Overview
The Manchester Chemistry Building has two elements – the main building, built in the 1960s, and
a newer extension, built in 2005. As the overall building is both large and complex, the S-Lab audit
examined only the extension in detail, which is approximately 25% of the total building floor area.
The extension has 3 floors which contain teaching and research labs, a number of specialist lab
areas (e.g. mass spectrometry room), computer suites and network hubs.
Heating is by natural gas. Cooling is provided by 2 chillers and a number of split DX units in
individual rooms. The extension has 102 fume cupboards designed as Variable Air Volume (VAV)
with a face velocity of 0.5 m/s, though in practice they operate with a 0.6 m/s face velocity. Due
to diversity constraints, a maximum of 69 fume cupboards can operate at any one time when their
sashes are fully open.
As Table D1 shows, the Chemistry Extension in academic year 2009-10:
Consumed an estimated 2.5 million kWh of energy, comprising around 0.9 million kWh of
electricity and 1.6 million kWh fossil fuel energy (mainly gas for heating).
Had annual energy costs of around £107,000 comprised of around £70,000 for electricity (at
7.95 p/kWh) and £37,000 for gas (at 2.3 p/kWh).
Table D2 and Figure D1 show that the main component of electricity demand is estimated to be
ventilation (52%) followed by equipment and small power (largely lab equipment and IT) (22%).
Table D3 and Figures D2 and D3 show that, combined, fossil fuel and electrical heating account for
an estimated 63% total energy (see Fig D2). However a majority of heating energy is used to heat
the air which passes through the ventilation system – when this is taken into account ventilation
related consumption accounts for 61%, and space heating 22%, of overall energy demand (see
Figure D3).
Table D4 shows that fume cupboards are responsible for the majority of ventilation-related
consumption. They consume an estimated 20,159 kWh/year, or £891/year per fume cupboard.
This low figure is partly explained by lack of cooling in the laboratory.

Energy Consumption of University Laboratories: Detailed Results from S-Lab Audits
HEEPI July 2011 Page 42 of 58 www.goodcampus.org
Table D1: Details of Energy Consumption and Costs of the Chemistry Building, University of Manchester, Pro-rated by Floor Area
Gross Floor
Area (sq.m)
Electricity
(kWh/y)
Electricity Cost
(£/y)
Gas (kWh/y)
Gas Cost (£/y) Total Energy
(kWh/y)
Total Energy
Cost (£/y)
Main Building 12,807 4,545,593 (a) 361,847 5,386,037 (b) 123,879 (b) 9,931,630 485,726
Extension 3,816
883,407 (c)
1,010,037 (d) 70,231 1,604,835 (b) 36,911 (b) 2,488,242 107,142
Total Building 16,623 5,429,000 432,170 6,990,872 160,790 12,419,872 592,960
Annual Consumption per
Unit Area (Extension)
(kWh/sq.m/year)
232 421 (as per
total building) 652
Annual Consumption per
Unit Area (Total Building)
(kWh/sq.m/year)
327 421 747
HEEPI Energy Benchmark
for Chemistry
(kWh/sq.m/year)
Typical: 367 Typical: 353
Annual Cost per Unit
Area (Extension)
(£/sq.m/year)
18 10 28
Annual Cost per Unit
Area (Total Building)
(£/sq.m/year)
26 10 36
(a) Residual of total building minus extension figures
(b) Metered data pro-rated by floor area
(c) Based on metered data
(d) Estimate derived from bottom-up calculations (see Table D2)

Energy Consumption of University Laboratories: Detailed Results from S-Lab Audits
HEEPI July 2011 Page 43 of 58 www.goodcampus.org
Table D2: Estimated Electricity Consumption and Costs in the Chemistry Extension, University of Manchester
Category Sub-category Consumption
(kWh/y)
Cost
(£/y)
Basis of Estimate
Ventilation General Supply 155,214 12,339 Measured data for 7 months, extrapolated to give 12 months.
General Extract 38,426 3,055 Measured data for 7 months, extrapolated to give 12 months.
Fume Extract 335,000 26,633 Measured data for 7 months, extrapolated to give 12 months.
Sub Total 528,640 42,027 Measured data for Supply AHUs, General Extract AHUs & Fume Extract Fans - 7
months data for all excluding AHU 05 (2 months) then extrapolated for 12
months.
Heating 35,864 2,851 Measured data for primary, CT & VT pumps over 7 months, extrapolated to give
12 months.
Cooling 6,463 514 Measured data for AHU 01 chiller, 4 months, extrapolated for 12 months & local
AC units measured data for 5 months, extrapolated to give 12 months.
HVAC Sub-total 570,967 45,392 Sum of Ventilation, heating and cooling above.
Central Services Compressed
Air
10,357 823 Common system serving main chemistry and extension – taking 23% of total
measured data, for 7 months, extrapolated to give 12 months then pro-rated on
total area 16,623sq.m and 3816sq.m for extension.
Included in ‘Equipment and Small Power’ category in charts.
Vacuum 17,978 1,429
Nitrogen 56,662 4,505
Sub-total 84,997 6,757
Lighting 134,301 10,677 12 months measured data excluding MG, M1 & M2.
Equipment and Small
Power
219,773 17,472 12 months measured data – PG1 & 2, P1/2 & 2/2, P2/1 & P2/2, MG, M1 & M2.
Total Estimated
Electricity
Consumption
1,010,037 80,298 Sum of bottom up calculations above: HVAC plus central services plus lighting
plus small power.
Total Actual
Electricity
Consumption
883,407 70,322 Derived directly from meters (see Table 1).

Energy Consumption of University Laboratories: Detailed Results from S-Lab Audits
HEEPI July 2011 Page 44 of 58 www.goodcampus.org
Table D3: Estimated Energy Consumption and Costs in the Chemistry Extension, University of Manchester
Category Consumption
(kWh/y)
Cost
(£/y) Basis of Estimate
Electricity – Total 1,010,037 80,298 See Table D2. Estimate based on bottom-up calculations.
Electricity – Ventilation 528,640 42,027 See Table D2.
Electricity – HVAC 570,967 45,392 See Table D2 : Ventilation plus Heating plus Cooling
Electricity – Other 439,071 34,906 See Table D2: Central Services plus Lighting plus Small power.
Gas Consumption (Total) 1,604,835 36,911 Table D1. Based on metered total figure, pro-rated by area of Extension 23% of total.
Heating (Gas) – Space 576,216 13,253 Assumed space heating as a naturally ventilated office = 151 kWhrs/ sq.m/year (ECG83
– Energy Use in Government Labs 2002) x 3816sq.m.
Heating (Gas) - Ventilation 1,028,619 23,658 Total natural gas heating minus space component.
HVAC Energy 1,599,586 69,050 Electricity-HVAC plus Heating-HVAC Element.
Table D4: Estimated Fume Cupboard Energy and Costs in Chemistry Extension, University of Manchester
Element Consumption
(kWh/y)
Cost
(£/y) Basis of Estimate
Fume Extract Fans 335,000 26,633 Figure from Table D2
Supply AHU's – Fans 130,495 10,374 84% of the figure for general supply AHUs (= 155,214 kWh) in Table D2, reflecting the
difference between the fume extract design flow of 31.2 m3/s and the total design flow
rate of 37.11 m3/s (i.e. 6.09 m3/s is providing general ventilation rather than feeding the
extract). Actual figures may differ in practice.
General Extract Fans 38,426 3,055 Figure from Table D2.
Heating Pumps 22,953 1,824 64% of the total heating pump power 35,864 kWh given in Table D2, i.e. it was assumed
that 36% of the load was related to space heating, as per Table D3.
Fresh Air - Heat only (no cooling
or (de)humidification
864,805 19,890 84% of the natural gas heating associated with ventilation (1,028,619 kWh – see Table
D3) i.e. pro-rated based on fume extract flow compared to total design flow rate.
Total Fume Cupboards 1,391,679 61,476
Per Fume Cupboard 20,159 891 For 69 fume cupboards at 0.6 m/s face velocity

Energy Consumption of University Laboratories: Detailed Results from S-Lab Audits
HEEPI July 2011 Page 45 of 58 www.goodcampus.org
Figure D1: Breakdown of Estimated Electricity Usage in Manchester Chemistry Extension
Figure D2: Breakdown of Estimated Total Energy Usage in Manchester Chemistry Extension
Figure D3: Breakdown of Estimated Total Energy Usage in Manchester Chemistry Extension
(With Heating/Cooling Component of Ventilation Included in Ventilation-Related)

Energy Consumption of University Laboratories: Detailed Results from S-Lab Audits
HEEPI July 2011 Page 46 of 58 www.goodcampus.org
Figure D4: Breakdown of the Estimated Costs Associated with Total Energy Usage, Manchester
Chemistry Extension (With Heating/Cooling Component of Ventilation Included in Ventilation-
Related)
D2. Plug Load
As Table D5 shows, an inventory of lab equipment in the Extension was conducted, and the rated
(peak) power consumption data noted where available. Note that power data for some equipment
was inaccessible or unavailable – particularly for large 3-phase or bespoke equipment. As much
equipment is seldom operated at full power, a figure was generated for average power
consumption. Usage patterns were also estimated.
When organised by total energy consumption, the equipment responsible for the highest energy
load were identified, as shown in Table D5. The figures for total plug load created by this exercise
were approximately 45% greater than the measurement of laboratory small power energy
consumption derived from meters (as shown in Table D2) so the exercise is clearly indicative
rather than exact. Nonetheless, Table D5 provides a number of interesting insights, especially:
Consumption associated with equipment which is low powered but plentiful can be as
significant in total as more obvious items of larger equipment.
Much of equipment energy consumption is associated with heating or cooling, and/or 24/7
operation.

Energy Consumption of University Laboratories: Detailed Results from S-Lab Audits
HEEPI July 2011 Page 47 of 58 www.goodcampus.org
Table D5: Estimated Annual Electricity Consumption of Selected Equipment in the Chemistry Extension, University of Manchester
Equipment Typical Peak
Rated Power
(kW)
Assumed Average
Power (kW)
(with % reduction
factor)
Typical
Usage
(hrs/y)
Typical Energy
Consumption per
Unit (kWh/y)
Estimated
Numbers14
Estimated
Total Energy
Consumption
(kWh/y)
Estimated
Costs (£/y)
Heaters/Stirrers 0.5 0.375 (75%) 648 243 200 48,600 £5,832
Mass Spectrometry 3 1 (33%) 8,760 8760 5 43,800 £5,256
Gas Chromatography 1.6 0.8 (50%) 8,760 7008 4 28,032 £3,364
Rotary Evaporators 1.76 0.59 (33%) 1,000 590 27 15,930 £1,912
NMR 3.52 1.76 (50%) 8,760 15,418 1 15,418 £1,850
Ovens (Chemical) 6 2 (33%) 432 864 12 10,368 £1,244
Fridges 0.1 0.1 8,760 876 5 4,380 £526
Diaphragm Pumps 0.37 0.12 (33%) 1,000 120 26 3,120 £374
Vacuum Pumps 0.25 0.1875(75%) 216 40.5 60 2,268 £272
Water Baths (Large) 1.5 1.125 (75%) 72 81 28 2,025 £292
14 Approximate figures only

Energy Consumption of University Laboratories: Detailed Results from S-Lab Audits
HEEPI July 2011 Page 48 of 58 www.goodcampus.org
Appendix E - Energy Consumption in the University of York’s
Department of Biology
E1. Overview
The Department of Biology has eleven blocks which are metered in various ways and billed in
aggregate. This audit focussed on 3 blocks within the Department: K, L and M, which are
responsible for the majority of the energy consumption. Table E1 is a summary table of the
derived energy consumption for K, L and M blocks. Table E2 summarises the sub-metered data
available for the Department as an illustration of a not atypical sub-metering strategy in
laboratories , and how difficult it can sometimes be to disaggregate data between different uses.
In the cases of Blocks K, L and M, this involved pro-rating the data based on floor area. Therefore
the data presented in Tables E3, E4 and E5 represent best estimates in the time available.
Table E3 provides data for the size and estimated energy consumption of blocks K, L and M.15 It
shows that in calendar year 2009 they:
Consumed nearly 9 million kWh of energy, based on calendar year 2009 data, comprising
around 5 million kWh of electricity and around 4 million kWh of gas
Had annual energy costs of around £530,000, comprised of £370,000 for electricity (at 7.43
p/kWh) and £97,000 for gas (at 2.5 p/kWh).
Table E3 and Figure E1 give a further breakdown of electricity consumption in the three blocks.
This shows equipment and small power (largely lab equipment and IT) account for 31%, cooling
22%, lighting 18% and ventilation 17% of total electricity use.
Table E4, and Figures E2 and E3, give an estimated breakdown of total energy in the three blocks.
Figure E3 shows the breakdown when the heating/cooling component of ventilation is included in
the ventilation category. This indicates that approximately 45% of the energy consumption of the
3 blocks is associated with moving and conditioning (heating, cooling, humidifying etc) air.
Table E4 shows the estimated HVAC energy of around 3.8 million kWh costs around
£200,000/year.
Figure E4 shows that ventilation-related energy costs are 44% of the total and equipment and
small power 24%.
15 The figures include the energy consumption of the air handling unit which serves another block, F2, as this was sub-metered together with the lighting and plug load for Block L and it was difficult to separate its consumption out. It is unlikely to be more than 3-4% of the estimated total.

Energy Consumption of University Laboratories: Detailed Results from S-Lab Audits
HEEPI July 2011 Page 49 of 58 www.goodcampus.org
Table E1: Details of Energy Consumption and Costs of Department of Biology, University of York
Block served Gross
Internal
Area
(GIA)
(sq.m)
Electricity
(kWh/y)
Electricity
Cost (£/y)
Gas
(kWh/y)
Gas Cost
(£/y)
Total
Energy,
(kWh/y)
Total
Energy
Cost (£/y)
Total Consumption of Blocks K,
L, M, P and F2 from Primary
Meters
K, L, M & F2 +P
(Greenhouse) 14,448 5,886,146
£437,341 3,892,492 97,312 9,778,638 £534,653
F2 & P Chiller Energy F2 & P 208,976 (a)
F2 & P Plug Load and Lighting F2 & P 652,784 (b)
Consumption of Blocks K, L and
M after Exclusion of Block F2
and P Data
K, L and M 12,740 5,024,386 (c) £373,312 3,635,922
(d)
90,898
(d) 8,660,308 464,210
Annual Consumption per Unit
Area (Blocks
K,L,M)(kWh/sq.m/y)
394 285 679
HEEPI Energy Benchmark for
Life Sciences (Excluding Secure
Facility)
Good: 242
Typical: 300
Good: 196
Typical: 289
Good: 438
Typical:
589
Annual Cost per Unit Area
(Blocks K,L,M) (£/sq.m/y) 29 7 36
(a) Electricity for chillers 1,2, 3 (see Table E2) pro-rated by supply air to F2 & P compared to K,L,M,F2 & P
(b) See Table E2, sub-meters for P and F2
(c) Value for K, L, M, F2 & P (line 1) minus F2 & P chiller (line 2) minus F2 & P plug and lighting (line 3)
(d) Value for K, L, M, F2 & P gas (line 1) pro-rated by floor area for K,L,M

Energy Consumption of University Laboratories: Detailed Results from S-Lab Audits
HEEPI July 2011 Page 50 of 58 www.goodcampus.org
Table E2: Sub-Metered Data for the Department of Biology, University of York
Meters Block served Gross
Internal
Area
(GIA)
(sq.m)
Electricity
(kWh/y)
Electricity
Cost (£/y)
Gas
(kWh/y)
Gas Cost
(£/y)
Total
Energy
(kWh/y)
Total
Energy
Cost (£/y)
Primary meters K, L, M & F2 +P
(Greenhouse) 14,448 5,886,146 437,341 3,892,492 97,312 9,778,638 534,653
Block K - Plug & Lighting K 5,802
1,079,681
80,220
Block M – Plug, lighting & HVAC M 3,469 1,127,030
Block K – Mechanical Panel (K
plant room AHUs & bioscience
wide pumps & controls)
K 7,509 1,043,602 77,540
Block L -–Plug + Lighting +
HVAC (incl. F2 AHU but excl.
BSF plug load & lighting)
L & F2 4367 1,197,979 93,127.47
Chiller 1 K, L, M, F2 &
Greenhouses 14,448 402,646 29,917
Chiller 2 As above 376,051 27,941
Chiller 3 AS above 6,373 474
Block F2 – Plug Load and
Lighting (new meter)
F2 plug load
and lighting 898 55,419 4,118
P: Greenhouse Greenhouse 809 597,365 44,384

Energy Consumption of University Laboratories: Detailed Results from S-Lab Audits
HEEPI July 2011 Page 51 of 58 www.goodcampus.org
Table E3: Estimated Electricity Consumption and Costs in Blocks K, L, & M of the Department of Biology, University of York
Category Sub-category Consumption
(kWh/y)
Cost
(£/y)
Basis of Estimate
Ventilation
General Supply 389,808 £28,963 Estimate based on running hours and nameplate motor rating. Reduced
by 60% to take account of difference between rated and actual power
consumption.
General Extract 248,875 £18,491 As above.
Fume Extract 105,295 £7,823 As above.
Plant room &
lift motor room
S/E
77,312 £5,744 As above.
Sub-total 821,291 £61,022 Sum of ventilation sub-categories.
Heating 204,940 £15,227 Pro-rata common service pumps using floor area.
Cooling (chillers & pumps) 1,093,367 £81,237 Pro-rata chillers based on AHU airflow rate.
HVAC Total 2,119,598 £157,486
Central Services 77,438 £5,754 Cooling water pumps: motor nameplate data assumed 100% run time.
Lighting & Small Power (sum
of two categories below)
2,369,640 £176,064 Based on 186 kWh/ sq.m/year as block K metered light & small power,
applied to K,L and M.
Lighting 876,767 £65,144 Assumed lighting/small power ratio as for Liverpool, i.e., lighting 37%.
Equipment and Small Power 1,492,873 £110,920 Assumed lighting/small power ratio as for Liverpool, i.e., small power
63%.
IT (server rooms) 292,886 £21,761 Estimate based on triffid monitoring for circuit which includes server
rooms.
Total Electricity Consumption
from Bottom-up Calculations
4,859,563 £361,066 Sum of HVAC plus central services, lighting, small power and server
energy.
Total Electricity Consumption
from Metered Data
5,024,386 £373,312 See Table E1.

Energy Consumption of University Laboratories: Detailed Results from S-Lab Audits
HEEPI July 2011 Page 52 of 58 www.goodcampus.org
Table E4: Estimated Energy Consumption and Costs in Blocks K, L and M of the Department of Biology, University of York
Category Consumption
(kWh/y)
Cost
(£/y)
Basis of Estimate
Electricity – Total 4,859,563 £361,066 See Table E3 based on bottom up estimates.
Electricity – HVAC 2,119,598 £157,486 See Table E3 –kWh of ventilation + ventilation-related electrical heating and cooling.
Electricity – Other 2,739,965£ £103,580 See Table E3 – residual from HVAC.
Gas Consumption – Total 3,635,922 £90,898 See Table E2 – gas figure for K, L, M & F2 pro-rated by floor area.
Heating (Gas) – Space 1,923,740 £48,094 No data available, therefore, assume space heating as a naturally ventilated office =
151 kWh/sq.m/year (Carbon Trust, see footnote 4).
Heating (Gas)- Ventilation 1,712,182 £42,805 Total heating minus space component (equivalent to 47% of heating).
HVAC Energy 3,831,780 £200,291 Electricity - HVAC plus Gas Heating - Ventilation element.

Energy Consumption of University Laboratories: Detailed Results from S-Lab Audits
HEEPI July 2011 Page 53 of 58 www.goodcampus.org
Figure E1: Breakdown of Estimated Electricity Usage, Blocks K, L & M, Dept Biology, University of
York
Figure E2: Breakdown of Estimated Total Energy Usage, Blocks K, L & M, Dept Biology,
University of York
Figure E3: Breakdown of Estimated Total Energy Usage, Blocks K, L & M, Dept Biology, University
of York (With Heating/Cooling Component of Ventilation Included in Ventilation-Related)

Energy Consumption of University Laboratories: Detailed Results from S-Lab Audits
HEEPI July 2011 Page 54 of 58 www.goodcampus.org
Figure E4: Breakdown of the Estimated Costs Associated with Total Energy Usage, Blocks K, L, M,
University of York (with Heating/Cooling Component of Ventilation included in Ventilation-
related)
E2. Plug Load
A detailed survey of rated power/usage of lab equipment was not carried out for this audit as the
Biology Department’s then Energy Manager, Jo Hossell, had already monitored a number of
individual equipment items and had actual consumption data, which is more accurate.
Table E5 provides info on those items that she monitored, plus estimated energy use data on
certain items of equipment based on energy assessments from another bioscience laboratory. This
shows that -80 freezers, growth cabinets and incubators are the main items of equipment
responsible for equipment energy consumption.

Energy Consumption of University Laboratories: Detailed Results from S-Lab Audits
HEEPI July 2011 Page 55 of 58 www.goodcampus.org
Table E5: Estimated Annual Electricity Consumption of Selected Equipment in Blocks K, L, M of Dept Biology, University of York
Equipment Measured
Actual
Consumption
(kWh/y)
Measured
Average
Consumption
(kWh/y)
Typical
Usage
(hrs/y)
Estimated Energy
Consumption per
Unit (kWh/y)
Estimated
Numbers
(approximate
figures only)
Estimated
Total Energy
Consumption
(kWh/y)
Estimated
Costs (£/y)
-80 Freezer 5,724 8,760 3,990 (a) 47 269,046 £19,990
Growth Cabinet (small) 9,548 8,760 9,548 (b) >22 210,065 £15,608
Incubator (shaken & not) 2,592 (f) 66 171,072 £12,711
Drying Cabinet 1,825 5,630 (c) 24 135,120 £10,039
Water Bath (boiling) 7,018 2,555 13 91,234 £6,779
Oven 4,336 (f) 11 47,696 £3,544
Water Bath (60°C) 1,327 2,555 24 31,848 £2,366
Ice Maker 10,512 (f) 3 31,536 £2,343
Biological Safety Cabinet 3,373 (d) 7 23,611 £1,754
-20°C Freezers 313 8,760 313 50 15,677 £1,165
Vending Machines 5,840 (e) 7 15,645 £1,162
PCR 288 (f) 4 1,152 £86
(a) Average measured energy consumption based on 7 freezers. This will vary by freezer capacity. There are 47 -80Cs costing an estimated
£0.97/litre to run with an average capacity of 524 litres, so estimated total consumption is 269,046kWh/year with an estimated average of
5,724kWh. This is based on metering of 27 of them and knowing all makes and capacities – so for ones that have not been metered, figures from
one of the same make and size that have been metered have been used.
(b) Only 25 are in use at the moment the rest are turned off –where possible these are switched to take advantage of a reduced night time tariff so
they run lights from about 2:00am.
(c) Measured energy consumption of a small drying cabinet.
(d) Measured energy consumption of 2 safety cabinets.
(e) Measured energy of 7 vending machines.
(f) These are not measured figures – estimated consumption based on rated power and estimated usage.

Energy Consumption of University Laboratories: Detailed Results from S-Lab Audits
HEEPI July 2011 Page 56 of 58 www.goodcampus.org
Appendix F - Sources of Information
The main sources of information were:
Metered data. For some of the labs a metered figure was available for the total electricity and gas
consumption, or for a particular sub-category (e.g. lighting).
Metered data, pro-rated by floor area. In many cases a metered figure was available for a
particular category for part of the lab (e.g. lighting on one floor or one lab area) which was then
extrapolated to the whole lab based on floor area. In some cases, because the lab audit focussed
on part of a single building, or the building itself was not separately metered, the total energy
consumption also had to be pro-rated by floor area.
Metered data, pro-rated by air supply. In one case, York chiller energy, the metered data was pro-
rated by air supply, which was felt to be more accurate than by floor area.
Inverter readings. For some of the labs inverters controlling the fans and pumps were manually
monitored by the Estates Department and power output data shared with S-Lab.
Bottom-up estimates based on the product of plant/equipment rated power (W) and usage
(hrs/y). This method was used in the absence of metered data but often tends to overestimate
energy e.g. it was found that initial bottom-up estimates of electrical ventilation energy (fans)
were 60% higher than metered data in two of the labs audited. For this reason ventilation energy
consumption estimates for two of the labs (Edinburgh and York) where there was no sub-metering
were reduced by 60%. Similarly bottom-up estimates of lab equipment will also be higher (in some
cases 50% higher) than the actual consumption. Again a reduction factor was applied to bottom-
up estimates of lab equipment at Edinburgh, where there were no metered data estimates. Chiller
energy at some of the labs was also estimated using rated power and percentage of year runtime.
Use of typical benchmark figures. Benchmark figures for lighting and IT were used in several
cases in the absence of any metered data. A Carbon Trust benchmark figure for space heating was
also used to differentiate the gas consumption used for space heating from that used for
ventilation heating.
Residual data. In some cases, e.g. lab equipment at Cambridge, the energy consumption was
simply a residual of the difference between total energy consumption and bottom up estimates.
Table F1 shows the different ways in which the total and breakdown of energy consumption was
estimated at the different labs.
S-Lab considers the data provided on the five laboratories in the Appendices to be the best
available in the absence of full sub-metering. However, because of the many assumptions made
the error margins in the estimates are unknown and potentially considerable. There is also a high
degree of variability in different labs even within the same discipline, and even the same lab at
different times (due to the ever changing nature of science and research). Therefore care is
advised in applying these results too directly to other laboratories.
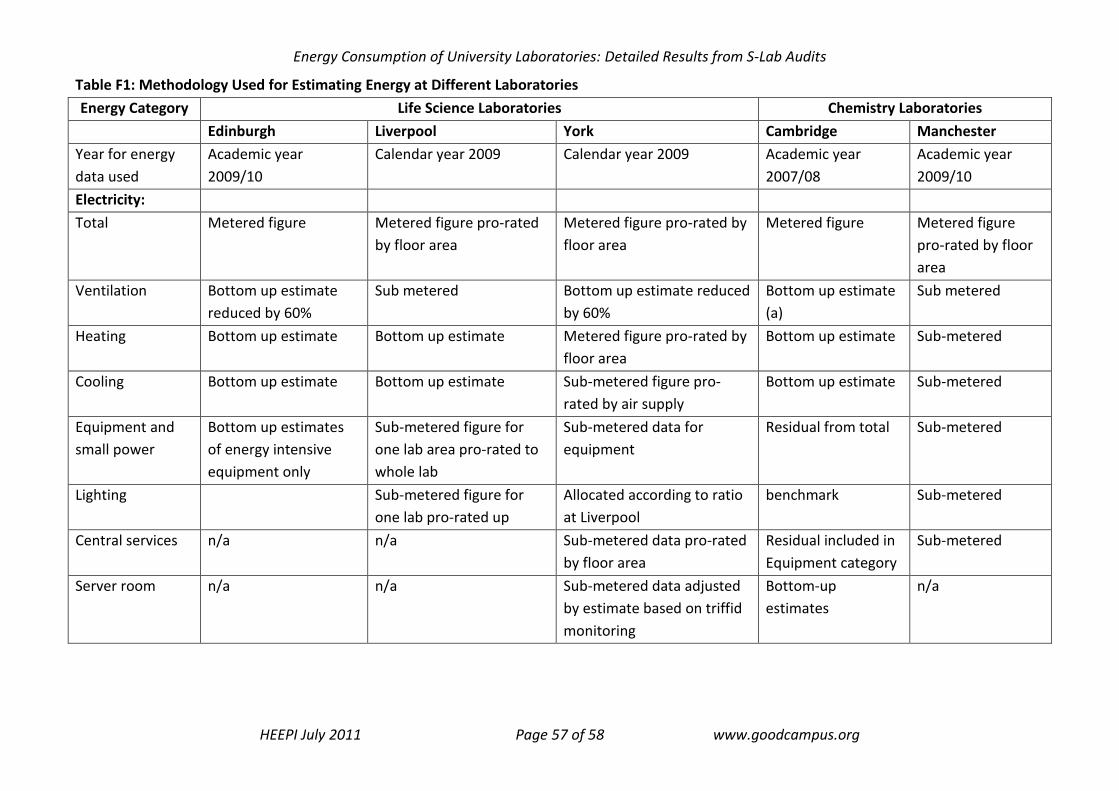
Energy Consumption of University Laboratories: Detailed Results from S-Lab Audits
HEEPI July 2011 Page 57 of 58 www.goodcampus.org
Table F1: Methodology Used for Estimating Energy at Different Laboratories
Energy Category Life Science Laboratories Chemistry Laboratories
Edinburgh Liverpool York Cambridge Manchester
Year for energy
data used
Academic year
2009/10
Calendar year 2009 Calendar year 2009 Academic year
2007/08
Academic year
2009/10
Electricity:
Total Metered figure Metered figure pro-rated
by floor area
Metered figure pro-rated by
floor area
Metered figure Metered figure
pro-rated by floor
area
Ventilation Bottom up estimate
reduced by 60%
Sub metered Bottom up estimate reduced
by 60%
Bottom up estimate
(a)
Sub metered
Heating Bottom up estimate Bottom up estimate Metered figure pro-rated by
floor area
Bottom up estimate Sub-metered
Cooling Bottom up estimate Bottom up estimate Sub-metered figure pro-
rated by air supply
Bottom up estimate Sub-metered
Equipment and
small power
Bottom up estimates
of energy intensive
equipment only
Sub-metered figure for
one lab area pro-rated to
whole lab
Sub-metered data for
equipment
Residual from total Sub-metered
Lighting Sub-metered figure for
one lab pro-rated up
Allocated according to ratio
at Liverpool
benchmark Sub-metered
Central services n/a n/a Sub-metered data pro-rated
by floor area
Residual included in
Equipment category
Sub-metered
Server room n/a n/a Sub-metered data adjusted
by estimate based on triffid
monitoring
Bottom-up
estimates
n/a

Energy Consumption of University Laboratories: Detailed Results from S-Lab Audits
HEEPI July 2011 Page 58 of 58 www.goodcampus.org
Gas:
Total Metered figure Metered figure pro-rated
by floor area
Metered figure pro-rated by
floor area
Metered figure Metered figure
pro-rated by floor
area
Space heating Benchmark figure used Benchmark figure used Benchmark figure used Sub-metered data Benchmark figure
used
Ventilation-
related
Residual figure Residual figure Residual figure Residual figure Residual figure
Steam (autoclave) Regression analysis to
find typical gas
consumption in
summer months x 12
n/a Included in Equipment and
Small Power category
n/a n/a
(a) This figure was not reduced as it was felt to be reasonably accurate as it included standby power.