Embed Size (px)
Citation preview

S LUMTM
GEOTECHNICAL & MATERIAL TESTING LABORATORY
CONSULTANTS LTD.
November 1, 2005 Environmental Engineering Company Suite 1, 2345-6 Street, N.W. Calgary, AB T7T 8Z8 Attention: John Smith EEC Project #: 12345678
SAMPLE REPORT
Geotechnical Laboratory Testing Report SOLUM Job #: 100010501024 Received: October 24, 2005 # of Samples Received: One-5 gal pail, 1 Shelby Tube Test Quantity ASTM Designation Water Content 1 D2216
Atterberg Limits 1 D4318 Full Gradation 1 D422 Standard Proctor 1 D698 Fall Cone Shear Test 1 N/A Vane Shear Test 1 D4648 Hydraulic Conductivity; Remolded at 95% of Maximum Dry Density 1 D5084 Saad A.M. Farag Laboratory Manager Solum Consultants Ltd.
Total Cover Pages: 1
#9, 3620 29 Street NE, Calgary, AB T1Y 5Z8 Ph: (403) 250-3035 Fax: (403) 250-3021 Email: [email protected]

#9, 3620 - 29 Street, NE Project Number:
Calgary, Alberta T1Y 5Z8 Client:
Ph: (403)250-3035 Project Name:
Fax: (403)250-3021 Location:
Email: [email protected] Tested By: Reviewed By:
www.solumconsultantsltd.com Date Reviewed: (dd-mm-yy)
Liqu
id L
imit(
%)
Pla
stic
Lim
it(%
)
Pla
stic
Ind
ex(
%)
Cla
ssifi
catio
n*
(US
CS
)
Cob
ble
Siz
e (%
)(7
5-3
00
mm
)
Gra
vel S
ize
(%)
(4.7
5-7
5m
m)
Sa
nd
Siz
e (
%)
(0.0
75
-4.5
mm
)
Silt
Siz
e (
%)
(0.0
05
-0.0
75
mm
)
Cla
y S
ize
(%)
(<0
.00
5m
m)
Max
imum
Dry
De
nsi
ty (
kg
/m3
)
Opt
imum
Wat
er
Co
nte
nt (
%)
Ove
r S
ize
De
nsi
ty
Co
rre
ctio
n (
kg/m
3 )
Ove
r S
ize
Opt
imum
W
ate
r C
on
ten
t C
orr
ect
ion
(%)
CCL-68680200-05 GR 40.7 83 45 38 MH 0.0 0.8 32.6 35.9 30.7 MH 1068 46.0 N/A N/A 3.6E-08
* Note: Soil classification is for material less than 0.425 mm (material used for Atterberg Limits), this includes the fine sand, silt and clay fraction of the sample. The USCS does not recognize the group symbol CI.
** Note: Soil classification is for the whole sample. Soil classification uses the Atterberg Limits results and the percent fines, percent sand and percent gravel as described in ASTM D2487.
Laboratory Analysis Summary
Atterberg Limits
Mo
istu
re C
on
ten
t(%
) Particle Size Analysis
Sa
mp
le ID
De
pth
(m
)
So
il C
las
sif
ica
tio
n**
Gro
up
Sy
mb
ols
Standard Proctor
Results
Co
ns
tan
t H
ea
d
Pe
rme
ab
ility
k20
(cm
/se
c)
12345678
Geotechnical Engineering Company
Site X Geotechnical Investigation
---
KC/SF
25-Oct-09
S LUMTM
GEOTECHNICAL & MATERIAL TESTING LABORATORY
CONSULTANTS LTD.
Tested by:
PREPARED SOLELY FOR THE USE OF OUR CLIENT AS SPECIFIED IN THE ACCOMPANYING REPORT. NO REPRESENTATION OF ANY KIND IS MADE TO OTHER PARITES WITH WHICH SOLUM TESTING LTD. HAS NOT ENTERED INTO A CONTRACT.
Date Tested:
Approved by:
Laboratory Compaction Characteristics of Soil - Standard Proctor (ASTM D698)
1,700
1,800
1,900
2,000
5 7 9 11 13 15 17 19
Water Content (%)
Dry
De
ns
ity
(k
g/m
3 )SAMPLE REPORT
Site X Remediation
Client: Environmental Engineering Company
Project No.: 12345678
Sample ID: TP01
Depth: 0.5 - 1.5 m
RA
26-Oct-05
OVERSIZE CORRECTIONASTM D4718
PREPARED SOLELY FOR THE USE OF OUR CLIENT AS SPECIFIED IN THE ACCOMPANYING REPORT. NO REPRESENTATION OF ANY KIND IS MADE TO OTHER PARTIES WITH WHICH SOLUM CONSULTANTS LTD. HAS NOT ENTERED INTO A CONTRACT.
100% SATURATION CURVE
MAXIMUM DRY DENSITY (γ dmax): 1,910 kg/m3
OPTIMUM WATER CONTENT (w o): 12.0%
95% = 1,815 kg/m³
Particles Retained on the No. 4 (4.75 mm) Sieve (Pc): 2.3 %
GM: 2.55 (Assumed)Corrected Max. Dry Density:
N/ACorrected Opt. Water Content:N/A
S LUMTM
GEOTECHNICAL & MATERIAL TESTING LABORATORY
CONSULTANTS LTD.

Plastic Limit (%)
Plasticity Index (%)
-40 Mesh Sieve (y/n)
Unified Soil Classification System
Atterberg Limits (ASTM D4318) - Method A
Number of Blows
Wet Sample Weight +Tare (g)
Liquid Limit (Oven Dried)
1 2 3
Liquid Limit (Air Dried) - Multipoint Method
32
20.70
3.81Weight of Water (g)
18.55
3.33
18.97Dry Sample Weight +Tare (g)
22.7822.21
Container ID
3.66
51.5
6.13Weight of Dry Soil (g)
10 22
---
Results
Liquid Limit (Air Dried) (%)
Liquid Limit (Oven Dried) (%) ---
11.36
5Container ID
Water Content (%)
4
30.43
51
Water Content (%)
Weight of Water (g)
Tare (g)
27.90
2.53
Dry Sample Weight +Tare (g)
14.05
Weight of Dry Soil (g)
Sample Information
24.55
Tare (g)
26.46
17.37
11.4511.24
Wet Sample Weight +Tare (g)
13.95
7.10 7.61
33
18
Plastic Limit
54.3 50.1
y
1.91
Average Water Content (%)
KC Reviewed By: SF
Date Tested: 29-Nov-11 (dd-mmm-yy)
CH
Project Number: 12345678
Client: Geotechnical Engineering Company
Project Name: Site X Geotechnical Investigation
Location: Calgary, AB
Sample ID TP01 Depth: 2.37-2.67 m
Tested By:
18.1
13.85 10.60
18.3% 18.0%
LL % Difference
Flow Curve
49
50
51
52
53
54
55
1 10 100
Number of Blows on Liquid Limit Device
Wa
ter
Co
nte
nt
(%)
25
S LUMTM
GEOTECHNICAL & MATERIAL TESTING LABORATORY
CONSULTANTS LTD.
0
10
20
30
40
50
60
70
0 10 20 30 40 50 60 70 80 90 100
Liquid Limit (%)
Pla
sti
cit
y I
nd
ex
(%
)
TP01
ML or OL
MH or OH
CL or OL
CH or OH
CL or ML
Tested by:
PREPARED SOLELY FOR THE USE OF OUR CLIENT AS SPECIFIED IN THE ACCOMPANYING REPORT. NO REPRESENTATION OF ANY KIND IS MADE TO OTHER PARITES WITH WHICH SOLUM TESTING LTD. HAS NOT ENTERED INTO A CONTRACT.
0.005 mm 0.075 mm 0.425 mm 2.0 mm 4.75 mm 19 mm 75 mm 300 mm
Coarse
Clay Silt Cobbles Boulders
Medium Fine Coarse
Gravel
Fine
Sand
Date Tested:
Approved by:
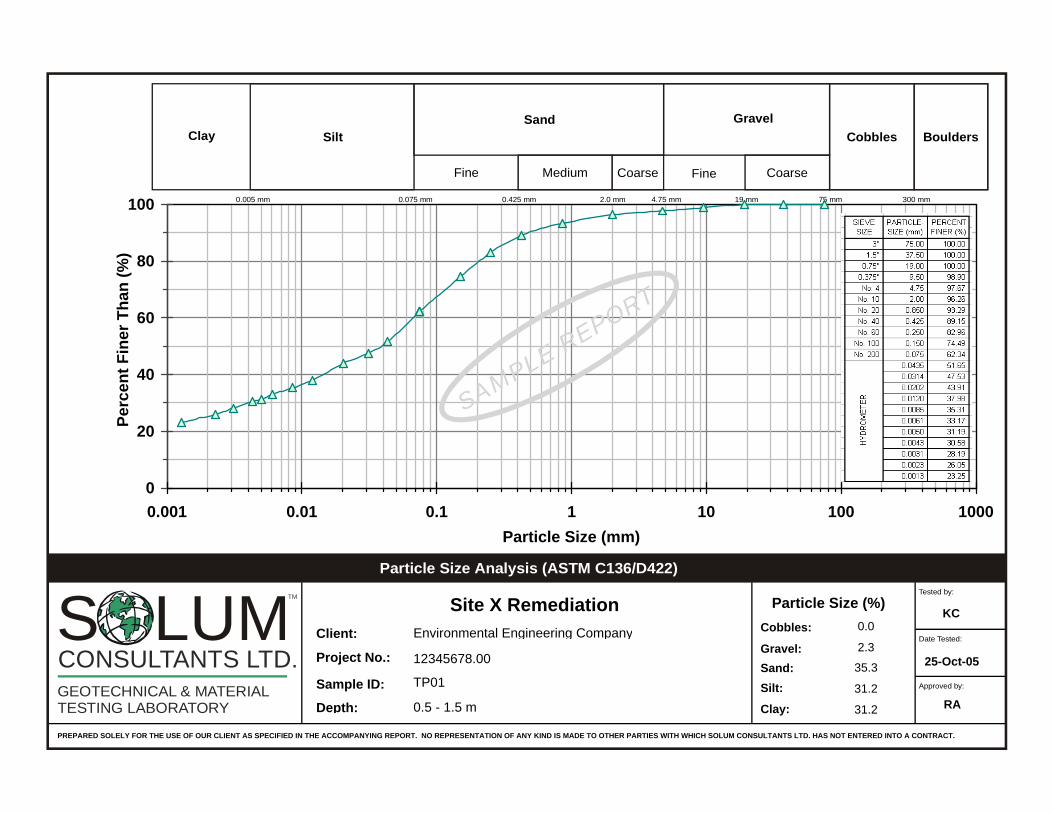
Particle Size Analysis (ASTM C136/D422)
0
20
40
60
80
100
0.001 0.01 0.1 1 10 100 1000
Particle Size (mm)
Per
cen
t F
iner
Th
an (
%)
Site X Remediation KC
25-Oct-05
Client: Environmental Engineering Company
12345678.00 Project No.:
Sample ID: TP01
Depth: 0.5 - 1.5 m
Cobbles:
Gravel:
Sand:
Silt:
Clay:
0.0
2.3
35.3
31.2
31.2
Particle Size (%)
PREPARED SOLELY FOR THE USE OF OUR CLIENT AS SPECIFIED IN THE ACCOMPANYING REPORT. NO REPRESENTATION OF ANY KIND IS MADE TO OTHER PARTIES WITH WHICH SOLUM CONSULTANTS LTD. HAS NOT ENTERED INTO A CONTRACT.
RA
SAMPLE REPORT
S LUMTM
GEOTECHNICAL & MATERIAL TESTING LABORATORY
CONSULTANTS LTD.

Client: Borehole No.: Tested by: KC / SF
Project No.: Sample No.:
Project Name: Site X Remediation Depth of Sample:
Location: Date of Testing: 17-Jan-08 ( dd -mm -yy)
DATE TIME ELAPSED TIME
TEMP. RtIN BURRETS OUT BURRETS
(MIN) (MIN) (SEC) (deg. C) READINGVOLUME
(cm3)
CHANGE
(cm3)
TOTAL
(cm3)READING
VOLUME
(cm3)
CHANGE
(cm3)
TOTAL
(cm3)
27-Jan-08 0:01 17 1.079 20 41.28 20 41.282:30 149.00 149 8940 17 1.079 19.7 40.66 0.62 0.62 21.2 43.76 2.48 2.485:00 299.00 150 9000 17 1.079 19.4 40.04 0.62 1.24 21.4 44.17 0.41 2.89
3.9E-08 cm/sec
Wet Mass: 257.37 gr Top Pore Pressure: 385 kPa Sample Height : 3.33 cm
Water Content: 27.3% Bottom Pore Pressure: 400 kPa Sample Diameter : 7.24 cm
Wet Density: 1880.7 kg/m3 Cell Pressure: 415 kPa Sample Area : 41.13 cm2
Dry Density: 1477.3 kg/m3 Hydraulic Gradient: Sample Volume : 136.85 cm3
Remarks:
INCREMENTAL TIME
TP01
Measurement of Hydraulic Conductivity of Saturated Porous Materials Using a Flexible Wall Permeameter
( ASTM D5084 )
Hydraulic Conductivity K20 (cm/sec)
4.0-4.5 m
12345678
Envoironmental Engineering Company
Calgary, AB
46.0
Reported
3.95E-083.94E-08
S LUMTM
GEOTECHNICAL & MATERIAL TESTING LABORATORY
CONSULTANTS LTD.

Tested by:
Date Tested:
Approved by:
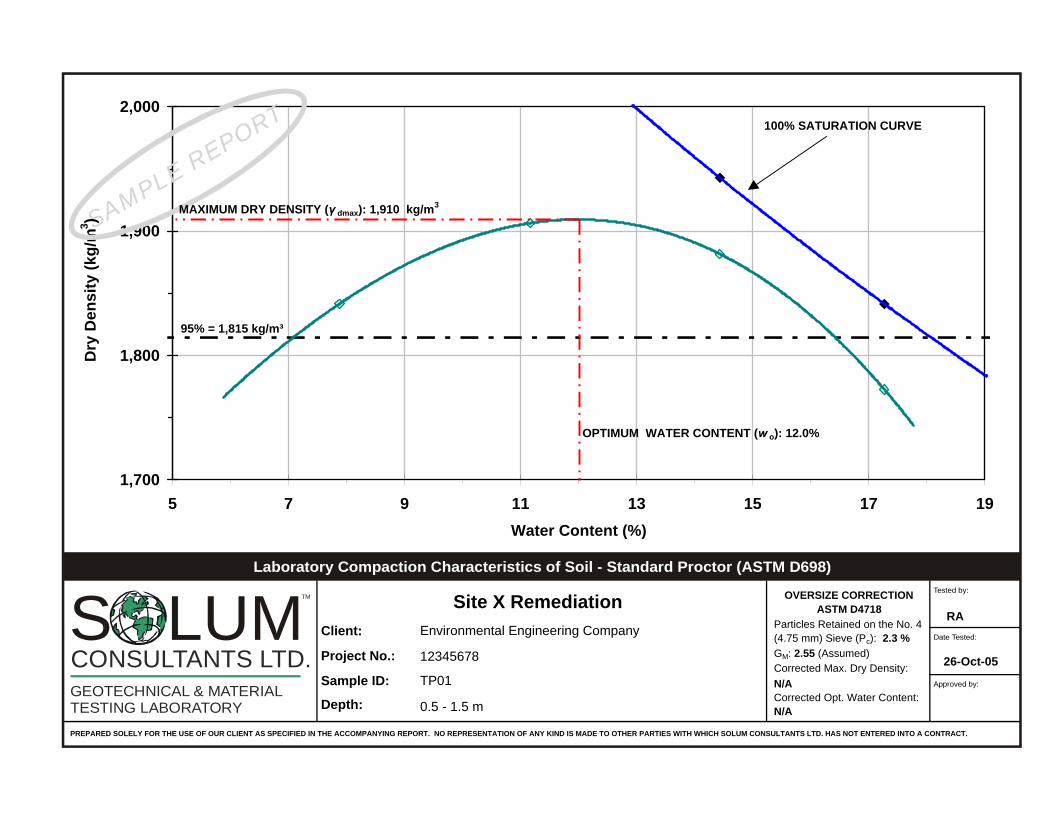
Laboratory Compaction Characteristics of Soil - Standard Proctor (ASTM D698)
y = -5.2989Ln(x) + 26.164
0
10
20
30
40
50
60
0.001 0.01 0.1 1 10 100
Shear Strength (t/m2)
Wa
ter
Co
nte
nt
(%)
Site X Remediation
Client: Environmental Engineering Company
Project No.: 12345678
Sample ID: TP01
Depth: 0.5 - 1.5 m
RA
26-Oct-05
PREPARED SOLELY FOR THE USE OF OUR CLIENT. NO REPRESENTATION OF ANY KIND IS MADE TO OTHER PARTIES WITH WHICH SOLUM CONSULTANTS LTD. HAS NOT ENTERED INTO A CONTRACT.
Shear Strength vs. Water Content (Fall Cone Test)
SAMPLE REPORT
S LUMTM
GEOTECHNICAL & MATERIAL TESTING LABORATORY
CONSULTANTS LTD.

Tested by:
Date Tested:
Approved by:
Laboratory Compaction Characteristics of Soil - Standard Proctor (ASTM D698)
0
10
20
30
40
50
60
70
80
90
100
0 10 20 30 40 50 60 70 80 90 100 110 120 130 140 150 160 170 180
Rotation (Degree)
Un
dra
ined
Sh
ear
Str
eng
th (
kPa
)
Undisturbed Undrained Shear Strength = 76.15kPaMaximum Torque = 0.3265 N/m
Site X Remediation
Client: Environmental Engineering Company
Project No.: 12345678
Sample ID: TP01
Depth: 0.5-1.5 m
RA
26-Oct-05
PREPARED SOLELY FOR THE USE OF OUR CLIENT. NO REPRESENTATION OF ANY KIND IS MADE TO OTHER PARTIES WITH WHICH SOLUM CONSULTANTS LTD. HAS NOT ENTERED INTO A CONTRACT.
Laboratory Miniature Vane Shear Test for Saturated Fine-Grained Clayey Soil - ASTM D4648
Rotation Rate: 60°/min
Remoulded Undrained Shear Strength = 32.13 kPaMaximum Torque = 0.1378 N/m
Water Content:15.5%
SAMPLE REPORT
S LUMTM
GEOTECHNICAL & MATERIAL TESTING LABORATORY
CONSULTANTS LTD.

Boring No. N/A Job No. N/A
Sample No. B1 Job Name N/A
Depth (ft) 5.0 m Tested By SF/KC
Date 11/5/2010 Calculated By KC
Sheet No. Checked By SF
SPECIMEN DIAMETER 7.34 (cm) MOISTURE CONTENT 21.0 (%)SPECIMEN HEIGHT 15.48 (cm) MASS OF WET SAMPLE 1273.1 (g)SPECIMEN AREA 42.27 (cm2) HEIGHT/DIAMETER RATIO 2.11SPECIMEN VOLUME 654.41 (cm3) WET BULK DENSITY 1945.4 (kg/m3)ASSUMED Gs 2.75 INITIAL SATURATION 81.3 (%)INITIAL VOID RATIO 0.71
Shear Strength 76.36 (kPa) Unconfined Compressive Strength 152.72 (kPa)Axial Failure Strain 9.47 (%)
VERT. LOAD 1 1-3 1-3)/2 DISPL. CELL
(cm) (kN) (%) (kPa) (kPa) 0.00 0.00 0.00 0.00 0.00 0.13 0.16 0.85 37.25 18.62 0.28 0.29 1.84 67.46 33.73 0.41 0.39 2.64 88.83 44.41 0.57 0.49 3.71 111.16 55.58 0.74 0.56 4.81 126.12 63.06 0.91 0.62 5.87 137.59 68.79 1.08 0.66 6.99 145.45 72.73 1.30 0.70 8.37 151.01 75.50 1.47 0.71 9.47 152.72 76.36 1.60 0.72 10.30 152.16 76.08 1.75 0.68 11.29 142.71 71.36 1.84 0.59 11.86 123.18 61.59
UNCONFINEDCOMPRESSION TEST (ASTM D2166)
S LUMTM
CONSULTANTS LTD.

Boring No. N/A Job No. N/A
Sample No. B1 Job Name N/A
Depth (ft) 5.0 m Tested By SF/KC
Date 11/5/2010 Calculated By KC
Sheet No. Checked By SF
0
100
200
0 2 4 6 8 10 12 14
Axial Strain (%)
Dev
iato
r St
ress
(kP
a)
S LUMTM
CONSULTANTS LTD.
UNCONFINEDCOMPRESSION TEST (ASTM D2166)
Stress-Strain Plot

X Remoulded
0.1270
Normal Stress (kPa)
200
400
600
---
N/A
Sample Information
Location:
Reviewed By:
(dd-mmm-yy)20-Nov-09Date of Testing:
Depth:Sample ID:
Residual Stress(kPa)
---
BH-01
Tested By: SF/KC
Horizontal Disp. (mm) Add WaterShearing Rate (mm/min)Peak Stress(kPa)
Direct Shear Test of Soils Under Consolidated Drained Conditions (ASM D3080)Project Number:
Client:
Project Name:
12345678
Geotechnical Engineering Company
Site X Geotechnical Investigation
SF
3
Specimen No.
5.6
0.1270
0.1270---
Yes
1
2
7.5
6.2
120.1
Sample Preparation Method:
222.5
309.1
---
S LUMTM
GEOTECHNICAL & MATERIAL TESTING LABORATORY
CONSULTANTS LTD.
Specimen3
Specimen2
Specimen1

SWELL/CONSOLIDATION TEST DATA
Client: Solum Consultants Ltd.Project: Barrhead Geotechnical InvestigationProject Number: 10012
Sample Data
Source:Sample No.: B1Elev. or Depth: 5' Sample Length(in./cm.): Location:Description:Liquid Limit: Plasticity Index: USCS: AASHTO: Figure No.: Testing Remarks:
Test Specimen Data
TOTAL SAMPLE BEFORE TEST AFTER TESTWet w+t = 57.83 g. Consolidometer # = 1 Wet w+t = 169.47 g.Dry w+t = 50.24 g. Dry w+t = 145.83 g.Tare Wt. = 14.05 g. Spec. Gravity = 2.8 Tare Wt. = 43.00 g.Height = 2.00 cm. Height = 2.00 cm.Diameter = 6.18 cm. Diameter = 6.18 cm.Weight = 124.43 g. Defl. Table = reference Set (mm/kPa)
Moisture = 21.0 % Ht. Solids = 1.2247 cm. Moisture = 23.0 %Wet Den. = 2074 kg/m3 Dry Wt. = 102.86 g.* Dry Wt. = 102.83 g. Dry Den. = 1715 kg/m3 Void Ratio = 0.633 Void Ratio = 0.618
Saturation = 92.8 %
* Initial dry weight used in calculations
End-of-Load Summary
Pressure(kPa)
FinalDial (cm.)
MachineDefl. (cm.)
Corrected(cm.)
VoidRatio
% Compression/Swell
start -0.01200 0.633 25.00 0.00660 0.00010 0.00670 0.648 0.9 Swell 50.00 -0.00480 0.00050 -0.00430 0.639 0.4 Swell
100.00 -0.03040 0.00080 -0.02960 0.619 0.9 Comprs. 200.00 -0.06840 0.00180 -0.06660 0.589 2.7 Comprs. 400.00 -0.11860 0.00270 -0.11590 0.548 5.2 Comprs. 800.00 -0.18020 0.00340 -0.17680 0.499 8.2 Comprs. 400.00 -0.17540 0.00300 -0.17240 0.502 8.0 Comprs. 100.00 -0.13320 0.00200 -0.13120 0.536 6.0 Comprs. 25.00 -0.03040 0.00010 -0.03030 0.618 0.9 Comprs.
Cc = 0.17 Pc = 132.17 kPa Cr = 0.07
Solum Consultants Ltd.

RatioMoistureSaturationInitial VoidCrCc
PcOverburdenSp. Gr.PILLDry Dens.Natural
Project:Remarks:Client:Project No.
AASHTOUSCSMATERIAL DESCRIPTION
CONSOLIDATION TEST REPORT
10 20 50 100 200 500.47
.49
.51
.53
.55
.57
.59
.61
.63
.65
.67V
oid
Rat
io
Applied Pressure - kPaCoefficients of Consolidation and Secondary Consolidation
No. Load(kPa)
Cv(cm.2/sec.)
C� No. Load(kPa)
Cv(cm.2/sec.)
C� No. Load(kPa)
Cv(cm.2/sec.)
C�
2 50.00 0.00503 100.00 0.00174 200.00 0.00015 400.00 0.00006 800.00 0.00007 400.00 0.00028 100.00 0.00009 25.00 0.0000
(kPa)(kPa)(kg/m3)
Barrhead Geotechnical InvestigationSolum Consultants Ltd.10012
0.6330.070.17132.172.8171521.0 %92.8 %
Figure
Source: Sample No.: B1 Elev./Depth: 5'

=
=D100
=
=D0
Load=
Load No.=
Project:Project No.:
Dial Reading vs. Time
Cv @ T90
0.0050 cm.2/sec.
T90
D90
Source: Sample No.: B1 Elev./Depth: 5'
2.86 min.
-0.00010
0.00026
0.00354
50.00 kPa
2
Barrhead Geotechnical Investigation10012
Square Root of Elapsed Time (min.)
Dia
l Rea
ding
(cm
.)
0 4 8 12 16 20 24 28 32 36 40-.005
-.004
-.003
-.002
-.001
.000
.001
.002
.003
.004
.005t90
FigureSolum Consultants Ltd.
Cv @ T90
0.0017 cm.2/sec.
=T90
=D100
=D90
=D0
Load=
Load No.=
Source: Sample No.: B1 Elev./Depth: 5'
8.47 min.
-0.01635
-0.01560
-0.00881
100.00 kPa
3
Square Root of Elapsed Time (min.)
Dia
l Rea
ding
(cm
.)
0 4 8 12 16 20 24 28 32 36 40-.033
-.030
-.027
-.024
-.021
-.018
-.015
-.012
-.009
-.006
-.003t90

SOLUM CONSULTANTS LTD.One-Dimensional Swell Test (ASTM D 4546)
JOB NAME N/A JOB NO. N/ABORING NO. SAMPLE NO. BH10-01 DEPTH 1.50-2.50 m TEST DATE 12/6/2009SAMPLE DESCRIPTION Silty clay w/ trace of gravels
Applied Dial Applied Dial Applied Dial
Pressure Reading Pressure Reading Pressure Reading(kPa) (in) (kPa) (in) (kPa) (in)
0 0.0000 300 -0.0293 0 0.000025 -0.0075 200 -0.0291 25 -0.001650 -0.0101 100 -0.0279 50 -0.0023100 -0.0145 50 -0.0265 100 -0.0038200 -0.0222 25 -0.0251 200 -0.0067300 -0.0293 0 -0.0208 300 -0.0105
300 -0.0215
Dial Reading Before Inundate -0.0105 in Swell Pressure 300 (kPa)
Dial Reading After Inundate -0.0215 in
Swell or Collapse Strain -1.1 (%)
Un-Loading Loading ( II )Loading ( I )
-0.050
-0.040
-0.030
-0.020
-0.010
0.000
0.010
0.020
0.030
0.040
0.050
0 100 200 300 400
Applied Pressure, (kPa)
Def
orm
atio
n, (
in)
Swell Pressure

Boring No. Job No.Sample No. Job Name Keystone XL Pipeline PS5Depth (m) Tested ByDate Calculated BySheet No. Checked By
STAGE1SPECIMEN DIAMETER 7.199 (cm) CELL PRESSURE (CP) 565.0 (kPa)SPECIMEN HEIGHT 13.376 (cm) BACK PRESSURE (BP) 165.0 (kPa)SPECIMEN AREA 40.678 (sq.cm) EFFECTIVE PRESSURE (EP) 400.0 (kPa)SPECIMEN VOLUME 544.092 (cu.cm)
Failure Criteria: Max. Deviator StressAxial Failure Strain 1.52 (%)
(�1-�3)f 144.74 (kPa) (�3)f 400.00 (kPa) (�1)f 544.74 (kPa)(�u)f 165.47 (kPa) (�3')f 234.53 (kPa) (�1')f 379.27 (kPa)
VERT. LOAD �u �1 �1-�3 �1' �3' p p' q �1' /�3'DISPL. CELL (cm) (KN) (kPa) (%) (kPa) (kPa) (kPa) (kPa) (kPa) (kPa)
0.00 0.00 0.00 0.00 0.00 400.00 400.00 400.00 400.00 0.00 10.02 0.13 15.86 0.11 30.80 414.94 384.14 415.40 399.54 15.40 1.080.03 0.22 35.85 0.23 54.55 418.70 364.15 427.28 391.42 27.28 1.150.05 0.29 55.16 0.34 71.93 416.77 344.84 435.96 380.80 35.96 1.210.06 0.35 72.39 0.46 85.67 413.27 327.61 442.83 370.44 42.83 1.260.07 0.39 86.87 0.55 96.35 409.48 313.13 448.18 361.30 48.18 1.310.09 0.42 102.04 0.66 103.63 401.59 297.96 451.81 349.77 51.81 1.350.11 0.47 117.21 0.80 113.58 396.37 282.79 456.79 339.58 56.79 1.400.13 0.50 128.24 0.95 121.42 393.18 271.76 460.71 332.47 60.71 1.450.15 0.54 144.10 1.12 130.29 386.19 255.90 465.15 321.05 65.15 1.510.18 0.57 155.82 1.33 139.19 383.37 244.18 469.59 313.77 69.59 1.570.20 0.60 165.47 1.52 144.74 379.26 234.53 472.37 306.89 72.37 1.62
08E4490
SF & KCSF SF
N/APS5-2009-064.57-5.23 m1/10/2010 CONSOLIDATED-UNDRAINED
TRIAXIAL COMPRESSION TESTASTM D4767
S LUMTM
CONSULTANTS LTD.

Boring No. N/A Job No. 08E4490Sample No. PS5-2009-06 Job Name Keystone XL Pipeline PS5Depth (m) 4.57-5.23 m Tested By SF & KCDate Calculated By SFSheet No. Checked By SF
1/10/2010
0
50
100
150
200
250
300
350
400
0 1 2 3 4 5 6
Axial Strain (%)
Dev
iato
r St
ress
(kPa
)
Effective Confining Pressure=400.0 kPaEffective Confining Pressure=600.0 kPaEffective Confining Pressure=800.0 kPa
CONSOLIDATED-UNDRAINEDTRIAXIAL COMPRESSION TEST
ASTM D4767
S LUMTM
CONSULTANTS LTD.

Boring No. N/A Job No. 08E4490Sample No. PS5-2009-06 Job Name Keystone XL Pipeline PS5Depth (m) 4.57-5.23 m Tested By SF & KCDate Calculated By SFSheet No. Checked By SF
1/10/2010 CONSOLIDATED-UNDRAINEDTRIAXIAL COMPRESSION TEST
ASTM D4767
0
100
200
300
400
500
600
0 200 400 600 800 1000 1200
Normal Stress (kPa)
Shea
r St
ress
(kPa
)
Total Stress
0
100
200
300
0 100 200 300 400 500 600 700 800 900
p' (kPa)
q (k
Pa)
Effective Confining Pressure=400.0 kPaEffective Confining Pressure=600.0 kPaEffective Confining Pressure=800.0 kPa
S LUMTM
CONSULTANTS LTD.

p-q&Mohr Chart 2
Page 1
0
100
200
300
400
500
600
0 200 400 600 800 1000 1200
Normal Stress (kPa)
Shea
r St
ress
(kPa
)
Total Stress
Effective Stress

Keystone XL Pipeline PS3 08E4490Keystone XL Pipeline PS3 08E4490Monitor ABMonitor, AB
CALIFORNIA BEARING RATIOCALIFORNIA BEARING RATIO ASTM D 1883-05 (One Water Content only)CALIFORNIA BEARING RATIO ASTM D 1883 05 (One Water Content only)
PS3 2009 09 B lkPS3-2009-09 BulkBrown Lean Clay (CL)Brown Lean Clay (CL)S h A 4 54 KSurcharge Amount: 4.54 Kg.Su c a ge ou t: .5 g.
95% O ti M i t C t t95% Optimum Moisture Contentp
10 Blows 25 Blows 56 Blows10 Blows 25 Blows 56 BlowsDry density before soak, kg/m^3 1,541 1,639 1,690Dry density before soak, kg/m 3 1,541 1,639 1,690D d it ft k k / ^3 1 554 1 649 1 698Dry density after soak, kg/m^3 1,554 1,649 1,698y y , g , , ,Moisture content before soak % 19 5 19 8 19 8Moisture content before soak, % 19.5 19.8 19.8Moisture content after soak avg % 27 4 25 3 23 7Moisture content after soak, avg., % 27.4 25.3 23.7Moisture content after soak, top 1", % 29.5 27.1 25.1Moisture content after soak, top 1 , % 29.5 27.1 25.1
ll f h k% Swell after 96 hour soak -0.83 -0.61 -0.48% Swell after 96 hour soak 0.83 0.61 0.48B i R ti 0 100" t ti 0 4 1 0 1 5Bearing Ratio, 0.100" penetration 0.4 1.0 1.5g , p
Dry Density vs CBRDry Density vs CBRDry Density vs CBR
5
Dry Density vs CBR
5
Dry Density vs CBR
5
Dry Density vs CBR
5
Dry Density vs CBR
5
Dry Density vs CBR
5
Dry Density vs CBR
5
Dry Density vs CBR
5
Dry Density vs CBR
5
Dry Density vs CBR
5
Dry Density vs CBR
5
Dry Density vs CBR
5
Dry Density vs CBR
5
Dry Density vs CBR
5
Dry Density vs CBR
5
Dry Density vs CBR
5
Dry Density vs CBR
5
BR
Dry Density vs CBR
5
BR
Dry Density vs CBR
5
CB
R
Dry Density vs CBR
5
cted
CB
R
Dry Density vs CBR
5
cted
CB
R
Dry Density vs CBR
5
rrec
ted
CB
R
Dry Density vs CBR
5
Cor
rect
ed C
BR
Dry Density vs CBR
5
Cor
rect
ed C
BR
Dry Density vs CBR
56 blows per layer
5
Cor
rect
ed C
BR
Dry Density vs CBR
56 blows per layer
5
Cor
rect
ed C
BR
Dry Density vs CBR
56 blows per layer
5
Cor
rect
ed C
BR
Dry Density vs CBR
56 blows per layer
5
Cor
rect
ed C
BR
Dry Density vs CBR
56 blows per layer
5
Cor
rect
ed C
BR
Dry Density vs CBR
56 blows per layer
5
Cor
rect
ed C
BR
Dry Density vs CBR
56 blows per layer
5
Cor
rect
ed C
BR
Dry Density vs CBR
56 blows per layer
5
Cor
rect
ed C
BR
Dry Density vs CBR
25 blows per layer
56 blows per layer
5
Cor
rect
ed C
BR
Dry Density vs CBR
25 blows per layer
56 blows per layer
5
Cor
rect
ed C
BR
Dry Density vs CBR
25 blows per layer
56 blows per layer
5
Cor
rect
ed C
BR
Dry Density vs CBR
10 blows per layer
25 blows per layer
56 blows per layer
5
Cor
rect
ed C
BR
Dry Density vs CBR
10 blows per layer
25 blows per layer
56 blows per layer
5
Cor
rect
ed C
BR
Dry Density vs CBR
10 blows per layer
25 blows per layer
56 blows per layer
5
Cor
rect
ed C
BR
Dry Density vs CBR
10 blows per layer
25 blows per layer
56 blows per layer
0
5
Cor
rect
ed C
BR
Dry Density vs CBR
10 blows per layer
25 blows per layer
56 blows per layer
0
5
1400 1600 1800
Cor
rect
ed C
BR
Dry Density vs CBR
10 blows per layer
25 blows per layer
56 blows per layer
0
5
1400 1600 1800
Cor
rect
ed C
BR
Dry Density vs CBR
10 blows per layer
25 blows per layer
56 blows per layer
0
5
1400 1600 1800
Cor
rect
ed C
BR
Dry Density as Molded, kg/m^3
Dry Density vs CBR
10 blows per layer
25 blows per layer
56 blows per layer
0
5
1400 1600 1800
Cor
rect
ed C
BR
Dry Density as Molded, kg/m^3
Dry Density vs CBR
10 blows per layer
25 blows per layer
56 blows per layer
0
5
1400 1600 1800
Cor
rect
ed C
BR
Dry Density as Molded, kg/m^3
Dry Density vs CBR
TP-1
Sample Report

Keystone XL Pipeline PS3Keystone XL Pipeline PS3Monitor ABMonitor, AB
S i @ i i CStress vs. Penetration @ 95% Optimum Moisture ContentStress vs. Penetration @ 95% Optimum Moisture Content
100100100100100100100100100100
10 Blows 25 Blows 56 Blows
100
10 Blows 25 Blows 56 Blows
100
10 Blows 25 Blows 56 Blows
100
10 Blows 25 Blows 56 Blows
100
10 Blows 25 Blows 56 Blows
100
10 Blows 25 Blows 56 Blows
100
10 Blows 25 Blows 56 Blows
100
10 Blows 25 Blows 56 Blows
100
10 Blows 25 Blows 56 Blows
100
10 Blows 25 Blows 56 Blows
100
10 Blows 25 Blows 56 Blows
100
10 Blows 25 Blows 56 Blows
100
10 Blows 25 Blows 56 Blows
100
10 Blows 25 Blows 56 Blows
100
10 Blows 25 Blows 56 Blows
100
10 Blows 25 Blows 56 Blows
100
)
10 Blows 25 Blows 56 Blows
100
psi )
10 Blows 25 Blows 56 Blows
100
psi )
10 Blows 25 Blows 56 Blows
50
100
ss (
psi )
10 Blows 25 Blows 56 Blows
50
100
Stre
ss (
psi )
10 Blows 25 Blows 56 Blows
50
100
Stre
ss (
psi )
10 Blows 25 Blows 56 Blows
50
100
Stre
ss (
psi )
10 Blows 25 Blows 56 Blows
50
100
Stre
ss (
psi )
10 Blows 25 Blows 56 Blows
50
100
Stre
ss (
psi )
10 Blows 25 Blows 56 Blows
50
100
Stre
ss (
psi )
10 Blows 25 Blows 56 Blows
50
100
Stre
ss (
psi )
10 Blows 25 Blows 56 Blows
50
100
Stre
ss (
psi )
10 Blows 25 Blows 56 Blows
50
100
Stre
ss (
psi )
10 Blows 25 Blows 56 Blows
50
100
Stre
ss (
psi )
10 Blows 25 Blows 56 Blows
50
100
Stre
ss (
psi )
10 Blows 25 Blows 56 Blows
50
100
Stre
ss (
psi )
10 Blows 25 Blows 56 Blows
50
100
Stre
ss (
psi )
10 Blows 25 Blows 56 Blows
50
100
Stre
ss (
psi )
10 Blows 25 Blows 56 Blows
50
100
Stre
ss (
psi )
10 Blows 25 Blows 56 Blows
50
100
Stre
ss (
psi )
10 Blows 25 Blows 56 Blows
50
100
Stre
ss (
psi )
10 Blows 25 Blows 56 Blows
50
100
Stre
ss (
psi )
10 Blows 25 Blows 56 Blows
50
100
Stre
ss (
psi )
10 Blows 25 Blows 56 Blows
50
100
Stre
ss (
psi )
10 Blows 25 Blows 56 Blows
50
100
Stre
ss (
psi )
10 Blows 25 Blows 56 Blows
50
100
Stre
ss (
psi )
10 Blows 25 Blows 56 Blows
50
100
Stre
ss (
psi )
10 Blows 25 Blows 56 Blows
50
100
Stre
ss (
psi )
10 Blows 25 Blows 56 Blows
50
100
Stre
ss (
psi )
10 Blows 25 Blows 56 Blows
0
50
100
Stre
ss (
psi )
10 Blows 25 Blows 56 Blows
0
50
100
Stre
ss (
psi )
10 Blows 25 Blows 56 Blows
0
50
100
0.0 0.1 0.2 0.3 0.4 0.5 0.6
Stre
ss (
psi )
P t ti ( i )
10 Blows 25 Blows 56 Blows
0
50
100
0.0 0.1 0.2 0.3 0.4 0.5 0.6
Stre
ss (
psi )
Penetration ( in )
10 Blows 25 Blows 56 Blows
0
50
100
0.0 0.1 0.2 0.3 0.4 0.5 0.6
Stre
ss (
psi )
Penetration ( in )
10 Blows 25 Blows 56 Blows
0
50
100
0.0 0.1 0.2 0.3 0.4 0.5 0.6
Stre
ss (
psi )
Penetration ( in )
10 Blows 25 Blows 56 Blows
0
50
100
0.0 0.1 0.2 0.3 0.4 0.5 0.6
Stre
ss (
psi )
Penetration ( in )
10 Blows 25 Blows 56 Blows
0
50
100
0.0 0.1 0.2 0.3 0.4 0.5 0.6
Stre
ss (
psi )
Penetration ( in )
10 Blows 25 Blows 56 Blows
0
50
100
0.0 0.1 0.2 0.3 0.4 0.5 0.6
Stre
ss (
psi )
Penetration ( in )
10 Blows 25 Blows 56 Blows
0
50
100
0.0 0.1 0.2 0.3 0.4 0.5 0.6
Stre
ss (
psi )
Penetration ( in )
10 Blows 25 Blows 56 Blows
0
50
100
0.0 0.1 0.2 0.3 0.4 0.5 0.6
Stre
ss (
psi )
Penetration ( in )
10 Blows 25 Blows 56 Blows
0
50
100
0.0 0.1 0.2 0.3 0.4 0.5 0.6
Stre
ss (
psi )
Penetration ( in )
10 Blows 25 Blows 56 Blows
0
50
100
0.0 0.1 0.2 0.3 0.4 0.5 0.6
Stre
ss (
psi )
Penetration ( in )
10 Blows 25 Blows 56 Blows
0
50
100
0.0 0.1 0.2 0.3 0.4 0.5 0.6
Stre
ss (
psi )
Penetration ( in )
10 Blows 25 Blows 56 Blows
0
50
100
0.0 0.1 0.2 0.3 0.4 0.5 0.6
Stre
ss (
psi )
Penetration ( in )
10 Blows 25 Blows 56 Blows
0
50
100
0.0 0.1 0.2 0.3 0.4 0.5 0.6
Stre
ss (
psi )
Penetration ( in )
10 Blows 25 Blows 56 Blows
0
50
100
0.0 0.1 0.2 0.3 0.4 0.5 0.6
Stre
ss (
psi )
Penetration ( in )
10 Blows 25 Blows 56 Blows
0
50
100
0.0 0.1 0.2 0.3 0.4 0.5 0.6
Stre
ss (
psi )
Penetration ( in )
10 Blows 25 Blows 56 Blows
0
50
100
0.0 0.1 0.2 0.3 0.4 0.5 0.6
Stre
ss (
psi )
Penetration ( in )
10 Blows 25 Blows 56 Blows
Sample Report

Client: Borehole No.: N/A Tested by:
Project No.: BH09-01
Project Name: Depth: 4.5-5.0 m
Location: Date : 15-Oct-09 ( dd -mm -yy)
TEMP.
(deg. C)
1 21.0 2250 270 1980 90 8.89E+01 O
2 21.0 7200 570 6630 250 2.41E+02 O
3 21.0 12560 1200 11360 290 2.72E+02 V
4 21.0 16450 2150 14300 370 3.39E+02 V
5 21.0 21000 3360 17640 500 4.47E+02 V
6 21.0 26000 4850 21150 680 5.91E+02 V
Average:
Test Method: √ Test Gas: √
Specimen Type:
Undisturbed
Wet Mass: 420.36 g Sample Height : cm
Water Content: 18.6% Sample Diameter : cm
Wet Density: 2178.0 kg/m3 Sample Area : cm2
Dry Density: 1836.5 kg/m3 Sample Volume : cm3
Remarks:
O-OutlierV-Valid
102.4Barometric Pressure (kPa):
Flexible Wall N2
1.1E-01
Pressure Drop( Pa )
Sample No.:
Rigid Wall Air
4.78
7.17
Experiment
No.
Inlet Pressure
( Pa )
Outlet Pressure
( Pa )
BubbleMeter
Reading( cc/min )
Measurement of Pneumatic Permeability of Partially Saturated Porous Material ( ASTM D6539 )
Pneumatic ConductivityKp (Darcy)
XYZ Environmental Ltd.
12345678
X Site Assessment
X Site
Qav(cc/min)
KC / SF
40.38
193.00
1.89E-01
1.53E-01
1.01E-01
9.98E-02
1.07E-01
1.18E-01
S LUMTM
GEOTECHNICAL & MATERIAL TESTING LABORATORY
CONSULTANTS LTD.
0
100
200
300
400
500
600
700
800
0 5000 10000 15000 20000 25000
∆ P (Pa)
QA
V (c
c/m
in)
+25% limit
-25% limit
Linear (Best Fit)
Proctor Information:
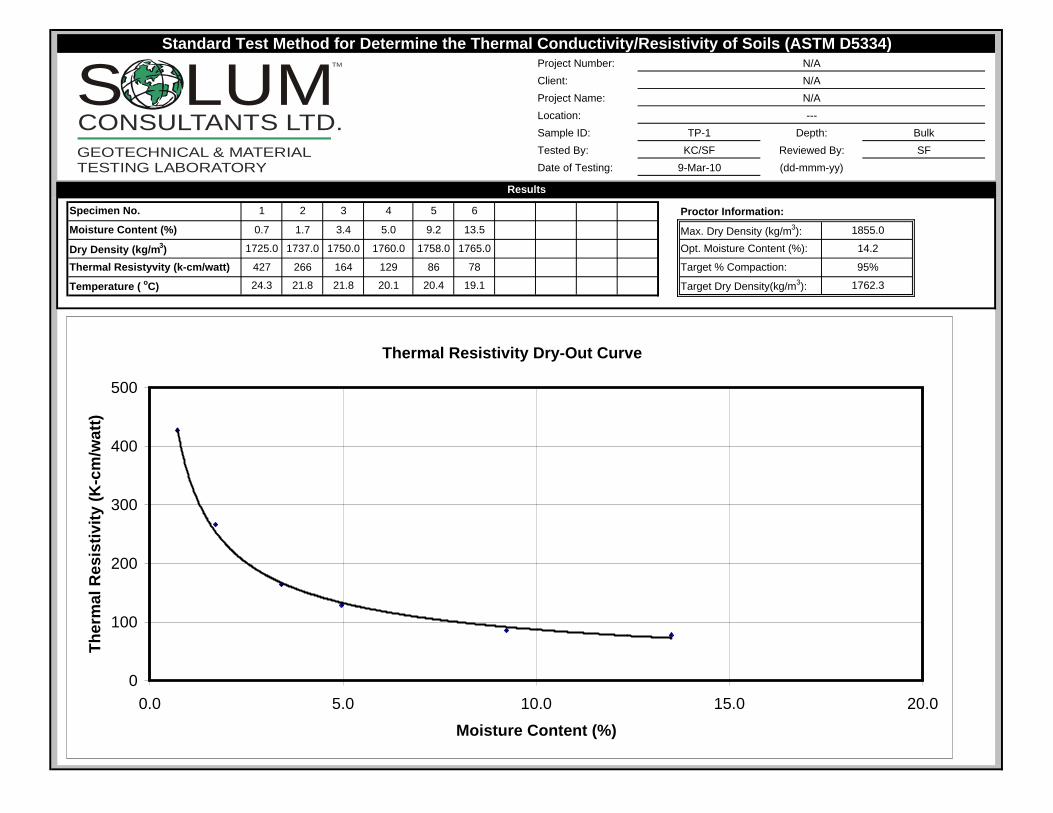
Standard Test Method for Determine the Thermal Conductivity/Resistivity of Soils (ASTM D5334)Project Number:
Client:
Project Name:
N/A
N/A
N/A
Tested By:
Date of Testing:
SFKC/SF
(dd-mmm-yy)9-Mar-10
Reviewed By:
Sample ID: TP-1 Depth:
---
Bulk
Location:
21.8
Results
4
5.0
1760.0
129
20.1
5
9.2
1758.0
3
3.4
1750.0
164
2
1.7
1737.0
266
21.8Temperature ( oC)
1
0.7
1725.0
427
24.3
Specimen No.
Moisture Content (%)
Dry Density (kg/m3)
Thermal Resistyvity (k-cm/watt)
20.4
6
13.5
1765.0
78
19.1
86
Max. Dry Density (kg/m3):
Opt. Moisture Content (%):
Target % Compaction:
Target Dry Density(kg/m3):
1855.0
14.2
95%
1762.3
S LUMTM
GEOTECHNICAL & MATERIAL TESTING LABORATORY
CONSULTANTS LTD.
Thermal Resistivity Dry-Out Curve
0
100
200
300
400
500
0.0 5.0 10.0 15.0 20.0
Moisture Content (%)
Th
erm
al
Re
sis
tiv
ity
(K
-cm
/wa
tt)