Embed Size (px)
Citation preview

111 S. CAPITOL P.O. BOX 30026 LANSING, MICHIGAN 48909 .www.michigan.gov (517) 335-3420
March 30, 2020
The Honorable Jim Stamas, Chair The Honorable Shane Hernandez, Chair Senate Appropriations Committee House Appropriations Committee Michigan State Senate Michigan House of Representatives State Capitol State Capitol Lansing, Michigan 48909 Lansing, Michigan 48909
Dear Legislators:
Attached is the monthly financial report for the month ending February 29, 2020. This report is submitted pursuant to MCL 18.1386. This report can also be found on the Internet at the following address:
www.michigan.gov/budget under “Spending and Revenue Reports”.
If you have questions concerning the information in this report, please contact this office.
Sincerely,
Chris Kolb State Budget Director
Attachment
cc: Mike Shirkey, Sen. Maj. Leader Jim Runestad, Chair, Senate Finance Com. Jim Ananich, Senate Min. Leader Lynn Afendoulis, Chair, House Tax Policy Com. Lee Chatfield, Speaker of the House JoAnne Huls, Executive Office Christine Greig, House Min. Leader Jay Rising, Executive Office Senate Appropriations Committee Jen Flood, Executive Office House Appropriations Committee Kyle Jen, Deputy State Budget Director Senate Fiscal Agency Heather Boyd, Office of Financial Mgmt. House Fiscal Agency Internal State Budget Office Distribution
LANSING
STATE OF MICHIGAN
GRETCHEN WHITMER STATE BUDGET OFFICE CHRIS KOLB
GOVERNOR DIRECTOR

FISCAL2020
Beginning Balance, October 1, 2019
11,012.1$
Revenue Adjustments: Shift Venture Michigan Fund II to Voucher Purchase 22.9$ Assumed Income Tax Earmark shift (HB 4125) (173.2)$ Local Government Program Payments (490.0)$
Subtotal Additional Revenue Adjustments (640.3)$
Total FY Resources Available For Expenditure GF/GP - Ongoing 10,371.8$
Expenditures, Current Law:Public Acts 52 through 67 of 2019 10,476.1$ Vetoes and Transfers (536.2) Supplementals PA 154 and PA 162 of 2019 159.4
Total Expenditures Projected - Ongoing 10,099.3$
Current Year Revenues minus Ongoing Costs 272.5$
One-Time Revenue:Beginning Balance 916.2$ 1
Lawsuit Settlement Proceeds (AG, DEQ) (7.6)$ Other One-Time Revenue 10.0$
Total FY Resources Available For Expenditure GF/GP - One-Time 918.6$
One-Time Expenditures:Public Acts 52 through 67 of 2019 193.9$ Vetoes and Transfers (18.6)$ Supplementals PA 154 and PA 162 of 2019 101.6$ FY20 Supplementals Proposed with FY21 Executive Budget 373.0$
Total Expenditures Projected - One-Time 649.9$
One-Time Revenue minus One-Time Spending 268.7$
Projected Ending Balance, September 30, 2020 541.2$ 1 Final ending balance, State of Michigan 2019 Comprehensive Annual Financial Report, published March 2020.
Current General Fund General Purpose Revenues, January 2020 Consensus Estimate
GENERAL FUND, GENERAL PURPOSEFiscal Year 2020
Projected Revenues and ExpendituresFebruary 29, 2020
($ in millions)
see one-time revenue
- 1 -

FISCAL2020
Beginning Balance, October 1, 2019 see one-time revenue
Current Year School Aid Fund Revenues, January 2020Consensus Estimate 13,925.4$
Revenue Adjustments: Assumed Income Tax Earmark shift (HB 4125) 173.2$ General Fund 45.0$ Community District Trust Fund 75.4$ Federal Revenue 1,749.6$
Subtotal Additional Revenue Adjustments 2,043.2$
Total FY Resources Available for Expenditure School Aid Fund 15,968.6$
School Aid Ongoing Costs: PA 58 of 2019 15,162.7$ Vetoes (55.9)$ PA 162 of 2019 54.9$
Community Colleges Ongoing Costs: PA 52 of 2019 414.7$
Universities Ongoing Costs: PA 62 of 2019 349.4$
Total School Aid Fund Ongoing Costs Projected 15,925.8$
Current Year Revenues minus Ongoing Costs 42.8$
Beginning Balance (One-Time Revenue): 194.7$ 1
General Fund Subsidy One-Time 17.7$ MPSERS Retirement Obligation Reform Reserve Fund 1.9$
One-Time Spending Items: PA 58 of 2019 - School Aid 72.7$ Vetoes (72.7)$ PA 162 of 2019 - School Aid 15.7$
One-Time Revenue minus One-Time Spending 198.6$
Projected Ending Balance, September 30, 2020 241.4$
SCHOOL AID FUNDFiscal Year 2020
Projected Revenues and ExpendituresFebruary 29, 2020
($ in millions)
1 Final ending balance, State of Michigan 2019 Comprehensive Annual Financial Report, published March 2020.
- 2 -

Expenditures & Encumbrances
Year to DateFY 2019
Fiscal YearEnd
SEP 30, 2019Department
InitialAppropriations (1)
ExecutiveOrders &
SupplementalAppropriations (1)
Encumbrance,Work Project &Capital Outlay
Carry Forwards
TotalAuthorization
Expenditures &Encumbrances
Year to DateFY 2020
61.5 118.5 Agriculture and Rural Development 107.9 3.5 26.5 137.9 59.9
35.9 91.5 Attorney General 104.5 1.6 19.7 125.8 38.9
229.6 458.6 Capital Outlay (2) 333.8 8.1 585.2 927.1 221.1
5.7 15.3 Civil Rights 16.4 0.0 1.4 17.8 5.6
572.5 1,157.2 Colleges and Universities 1,298.0 44.0 14.3 1,356.3 661.1
947.7 2,022.8 Corrections 2,001.3 33.5 212.7 2,247.5 961.4
140.2 455.7 Education 487.2 0.4 51.6 539.1 137.9
151.3 456.1 Environment, Great Lakes, and Energy 572.9 18.0 512.6 1,103.4 161.8
3.4 6.7 Executive Office 7.1 0.0 1.2 8.4 5.7
10,293.7 25,590.3 Health and Human Services 26,164.7 271.6 323.5 26,759.8 10,444.1
19.2 53.8 Insurance and Financial Service 68.8 3.2 0.0 72.1 22.6
96.5 282.4 Judiciary 310.7 0.7 5.0 316.3 98.8
91.0 266.2 Labor and Economic Opportunity 415.7 301.8 35.6 753.1 206.6
9.4 24.6 Legislative Auditor General 25.9 0.0 1.6 27.6 10.5
58.0 154.8 Legislature 172.2 0.0 71.7 243.9 67.4
207.8 446.3 Licensing and Regulatory Affairs 517.4 (55.2) 39.7 501.9 179.2
0.8 30.2 Marshall Plan for Talent 0.0 0.0 39.9 39.9 0.0
151.8 265.4 Michigan Strategic Fund 89.6 (1.8) 0.0 87.8 26.0
84.9 174.2 Military and Veterans Affairs 168.4 10.5 12.6 191.5 97.8
55.3 139.8 Natural Resources 134.7 5.0 53.4 193.1 67.3
91.0 269.5 State 250.4 15.6 72.6 338.6 96.1
1.5 3.0 State Land Bank Authority 0.5 (0.2) 0.0 0.3 0.0
255.4 696.5 State Police 713.7 45.0 84.7 843.4 277.2
257.3 688.0 Technology, Management and Budget (3) 421.6 35.0 191.6 648.1 150.6
105.1 202.6 Transportation 0.0 47.0 29.5 76.5 2.9
1,018.2 3,451.4 Treasury 1,953.8 96.6 126.9 2,177.3 1,069.3
$14,944.5 $37,521.2 $36,337.2 $883.8 $2,513.4 $39,734.4 $15,069.7
(1) Includes boilerplate appropriations.(2) Includes all capital outlay activity regardless of agency.(3) Includes Civil Service Commission.
SUMMARY OF EXPENDITURES AND ENCUMBRANCESGENERAL FUND - ALL PURPOSE
February 29, 2020($ in millions)
Fiscal Year 2019 Fiscal Year 2020
- 3 -
ESTIMATED BALANCE OF STATE PAYMENTSTO LOCAL UNITS OF GOVERNMENT
Fiscal Year 2020
($ in millions)
EXEC. ORDER TOTALINITIAL and APPROPRIATIONS
APPROPRIATIONS SUPPLEMENTALS YEAR-TO-DATE
Payments to local units of government 19,498.1 147.5 19,645.6
Total state spending from state resources 34,316.0 356.7 34,672.7
Percentage of state spending from state resources paid to local units 56.82% 56.66%
Required payments to local units (48.97%) 16,804.5 16,979.2
Surplus/(deficit) $2,693.6 $2,666.4
February 29, 2020
- 4 -

STATE OF MICHIGANYEAR-TO-DATE BALANCE SHEET
COUNTER - CYCLICAL BUDGET AND ECONOMIC STABILIZATION FUNDFebruary 29, 2020($ in thousands)
ASSETS
Current Assets:Equity in common cash $ 1,154,049
Total Assets $ 1,154,049
LIABILITIES
Current Liabilities:
Total Current Liabilities $ -
Total Liabilities -
FUND BALANCES
Committed 1,154,049
Total Fund Balances 1,154,049
Total Liabilities and Fund Balances $ 1,154,049
- 5 -

STATE OF MICHIGANYEAR-TO-DATE STATEMENT OF REVENUES AND EXPENDITURES
COUNTER - CYCLICAL BUDGET AND ECONOMIC STABILIZATION FUNDOctober 1, 2019 Through February 29, 2020
($ in thousands)
REVENUES
Miscellaneous $ 5,423
Total Revenues 5,423
EXPENDITURES
Current:General government -
Total Expenditures -
Excess of Revenues over (under)Expenditures 5,423
OTHER FINANCING SOURCES (USES)
Transfers from other funds - Transfers to other funds -
Total Other Financing Sources (Uses) -
Excess of Revenues and Other Sourcesover (under) Expenditures andOther Uses $ 5,423 1
1 Balance does not reflect closing adjustments such as accounts receivable,accounts payable, etc.
- 6 -

ASSETS
Current Assets:Equity in common cash $ 72,004 Investments - Other current assets 1
Total Current Assets 72,005
Noncurrent Assets:Investments 672,487
Total Assets $ 744,492
LIABILITIES
Current Liabilities:Accounts payable and other liabilities $ 9,972 Amounts due to other funds -
Total Current Liabilities 9,972
Total Liabilities 9,972
FUND BALANCES
Nonspendable 500,000 Restricted 234,520
Total Fund Balances 734,520
Total Liabilities and Fund Balances $ 744,492
February 29, 2020($ in thousands)
STATE OF MICHIGANYEAR-TO-DATE BALANCE SHEET
MICHIGAN NATURAL RESOURCES TRUST FUND
- 7 -

STATE OF MICHIGANYEAR-TO-DATE STATEMENT OF REVENUES AND EXPENDITURES
MICHIGAN NATURAL RESOURCES TRUST FUNDOctober 1, 2019 through February 29, 2020
($ in thousands)
REVENUES
Taxes $ - From federal agencies - From licenses and permits - Miscellaneous 15,343
Total Revenues 15,343
EXPENDITURES
Current:General government 2,246 Conservation, environment,
recreation, and agriculture 4,742 Capital outlay 3,123
Total Expenditures 10,110
Excess of Revenues over (under)Expenditures 5,233
OTHER FINANCING SOURCES (USES)
Proceeds from bond issues - Proceeds from sale of capital assets 9 Transfers from other funds - Transfers to other funds -
Total Other Financing Sources (Uses) 9
Excess of Revenues and Other Sourcesover (under) Expenditures andOther Uses $ 5,242 1
1 Balance does not reflect closing adjustments such as accounts receivable,accounts payable, etc.
- 8 -

- 9 -
$4.106
$5.773
$1.306
$3.982
$6.098
$1.459
GF-GP Revenue School Aid Revenue Transportation Revenue
Bil
lio
ns
of
$
Source: Office of Revenue and Tax Analysis
REVENUE OVERVIEW Office of Revenue and Tax Analysis Michigan Department of Treasury
This Monthly Financial Report to the Legislature presents the Michigan State government's economic situation and cash collections for February 2020, representing some January and some February economic activity in Michigan.
Total General Fund - General Purpose cash collections were $5.7 million (4.9 percent) lower in February 2020 than in February 2019. The February 2020 School Aid Fund cash collections were $46.3 million (5.6 percent) higher than in February 2019. February 2020 transportation collections were $32.6 million (11.0 percent) higher than in February 2019 (see revenue summary table). February is the fifth month of the state’s fiscal year (FY). Year-to-date collection totals generally provide a more accurate view of collections, since they are less affected by the timing of payments. Year-to-date General Fund - General Purpose cash collections are down $124.0 million (3.0 percent) from a year ago. School Aid Fund cash collections are up $325.2 million (5.6 percent) and transportation collections are up $153.4 million (11.8 percent).
The FY 2019-20 revenue projections presented in the revenue summary table on page 11 are from the Consensus Revenue Estimating Conference held on January 10, 2020. The revenue estimate for net General Fund – General Purpose revenue for FY 2019-20 is $11,012.1 million and the net School Aid revenue forecast is $13,925.5 million. The Transportation Funds revenue forecast is $3,659.7 million. By law, the Consensus Revenue Estimating Conferences are held the second week of January and the third week of May.
October through February CollectionsFY 2018-19 and FY 2019-20
FY 2018-19 FY 2019-20

- 10 -
-$172
$798
$560
$281
-$83
$825
$622
$302
SBT/MBT/CIT Income Withholding Sales Lottery Sales
Mil
lio
ns
of
$
Source: Office of Revenue and Tax Analysis
February Revenue CollectionsFY 2018-19 and FY 2019-20
FY 2018-19 FY 2019-20
$0.006
$4.164
$3.259
$1.489
-$0.113
$4.430
$3.501
$1.571
SBT/MBT/CIT Income Withholding Sales Lottery Sales
Bil
lio
ns
of
$
Source: Office of Revenue and Tax Analysis
October through February CollectionsFY 2018-19 and FY 2019-20
FY 2018-19 FY 2019-20

Revenue Summary FY 2019-20General Fund-General Purpose, School Aid, and Transportation Funds
(in thousands)
For The Month Ended: February 29, 2020
Month-End Cash Collections Data October Through February Cash Collections Data Revenue Projections
February Difference Year-to-Date Difference FY 2018-19 FY 2019-20 FY 2019-20
Prelim. Statutory January 2020
2019 2020 Amount Percent Source of Revenue FY 2018-19 FY 2019-20 Amount Percent Totals (i) Estimate Forecast
Income Taxes
$798,165 $825,253 $27,088 3.4% Withholding $4,164,044 $4,429,692 $265,648 6.4% $9,935,100 $10,194,000 $10,194,000
11,151 10,320 (831) -7.5% Quarterlies 430,180 441,564 11,384 2.6% 1,284,000 1,371,400 1,371,400
25,043 28,849 3,807 15.2% Annuals 126,142 143,862 17,720 14.0% 1,337,500 1,176,500 1,176,500
$834,358 $864,422 $30,064 3.6% Gross Collections $4,720,366 $5,015,118 $294,753 6.2% $12,556,600 $12,741,900 $12,741,900
521,978 626,426 104,448 20.0% Less: Refunds 664,719 797,921 133,201 20.0% 2,124,500 2,163,300 2,163,300
0 0 0 na State Campaign Fund 0 0 0 na 800 800 800
$312,381 $237,996 ($74,385) -23.8% Net Personal Income $4,055,646 $4,217,198 $161,551 4.0% $10,431,300 $10,577,800 $10,577,800
22,000 39,000 17,000 77.3% Less: Disbursements to MTF 110,000 195,000 85,000 77.3% 264,000 468,000 468,000
0 5,750 5,750 na Less: Disbursements to Renew Michigan 0 28,750 28,750 na 69,000 69,000 69,000
194,208 201,230 7,022 3.6% Less: Disbursements to SAF 1,100,635 1,167,489 66,854 6.1% 2,845,000 2,860,700 2,860,700
$96,172 ($7,984) ($104,157) na Net Personal Income To GF-GP $2,845,011 $2,825,959 ($19,053) -0.7% $7,253,300 $7,180,100 $7,180,100
Consumption Taxes
$87,201 $99,683 $12,483 14.3% Sales (a) $534,451 $561,072 $26,621 5.0% $1,277,100 $1,355,900 $1,355,900
39,333 30,889 (8,444) -21.5% Use (a) (h) 274,423 252,627 (21,795) -7.9% 753,400 749,000 749,000
14,287 13,760 (527) -3.7% Tobacco 72,891 71,632 (1,258) -1.7% 175,700 169,100 169,100
3,285 3,373 88 2.7% Beer, Wine & Mixed Spirits 19,806 20,274 468 2.4% 50,200 52,000 52,000
10,293 4,995 (5,298) -51.5% Liquor Specific 21,355 22,679 1,324 6.2% 61,300 61,000 61,000
$154,398 $152,700 ($1,698) -1.1% Total Consumption Taxes $922,925 $928,284 $5,359 0.6% $2,317,700 $2,387,000 $2,387,000
Other Taxes
($1,454) ($2,995) ($1,541) -106.0% Single Business $4,088 ($9,986) ($14,074) na ($67,700) $0 $0
13,251 20,319 7,068 53.3% Insurance Premiums Taxes $202,453 195,784 (6,669) -3.3% 314,900 361,800 361,800
11,797 17,324 5,526 46.8% Sub-total SBT & Insurance 206,541 185,798 (20,743) -10.0% 247,200 361,800 361,800
(185,634) (100,014) 85,620 46.1% Michigan Business Tax (394,484) (552,184) (157,700) -40.0% (511,500) (641,000) (641,000)
15,416 19,678 4,263 27.7% Corporate Income Tax 396,551 448,756 52,206 13.2% 1,278,100 1,210,100 1,210,100
0 0 0 na Inheritance / Estate 5 0 (5) -100.0% 0 0 0
0 1 1 na Telephone & Telegraph 10,436 11,355 919 8.8% 30,300 30,000 30,000
2,892 2,077 (815) -28.2% Oil & Gas Severance 10,085 8,729 (1,356) -13.4% 22,300 22,000 22,000
7,417 9,978 2,561 34.5% Penalties & Interest 37,635 39,465 1,830 4.9% 125,500 128,000 128,000
(28) 86 114 na Essential Services Assessment 783 755 (28) -3.5% 111,200 121,000 121,000
3 0 (3) -86.2% Miscellaneous Other/Railroad 177 91 (86) -48.4% 2,300 2,000 2,000
(12,517) (12,667) (150) -1.2% Treasury Enforcement Programs (e) (63,033) (63,333) (300) -0.5% (147,200) (150,000) (150,000)
($160,653) ($63,536) $97,118 60.5% Total Other Taxes $204,696 $79,433 ($125,263) -61.2% $1,158,200 $1,083,900 $1,083,900
$89,918 $81,180 ($8,737) -9.7% Subtotal GF-GP Taxes $3,972,632 $3,833,676 ($138,956) -3.5% $10,729,200 $10,651,000 $10,651,000
continued
- 11 -

Revenue Summary FY 2019-20General Fund-General Purpose, School Aid, and Transportation Funds
(in thousands)
For The Month Ended: February 29, 2020
Month-End Cash Collections Data October Through February Cash Collections Data Revenue Projections
February Difference Year-to-Date Difference FY 2018-19 FY 2019-20 FY 2019-20
Prelim. Statutory January 2020
2019 2020 Amount Percent Source of Revenue FY 2018-19 FY 2019-20 Amount Percent Totals (i) Estimate Forecast
Non-Tax Revenue (e)
$1,108 $1,108 $0 0.0% Federal Aid $5,542 $5,542 $0 0.0% $2,100 $10,000 $10,000
8 8 0 0.0% Local Agencies 42 42 0 0.0% 0 100 100
583 583 0 0.0% Services 2,917 2,917 0 0.0% 600 7,000 7,000
1,167 1,167 0 0.0% Licenses & Permits 5,833 5,833 0 0.0% 9,300 14,000 14,000
0 0 0 na Investments/Interest Costs (6,486) 0 6,486 100.0% 10,300 9,000 9,000
833 833 0 0.0% Misc. Non-tax Revenue 4,167 4,167 0 0.0% 16,800 10,000 10,000
16,667 19,667 3,000 18.0% Liquor Purchase Revolving Fund 92,083 98,333 6,250 6.8% 253,000 230,000 230,000
6,250 6,250 0 0.0% From Other Funds-Lottery & Escheats 29,000 31,250 2,250 7.8% 86,700 81,000 81,000
$26,617 $29,617 $3,000 11.3% Total Non-Tax Revenue $133,098 $148,083 $14,986 11.3% $378,800 $361,100 $361,100
$116,534 $110,797 ($5,737) -4.9% Total GF-GP Revenue $4,105,730 $3,981,759 ($123,971) -3.0% $11,108,000 $11,012,100 $11,012,100
School Aid Fund
$230,262 $260,480 $30,219 13.1% Sales Tax 4% $1,397,970 $1,465,200 $67,230 4.8% $3,372,100 $3,543,000 $3,543,000
176,272 187,649 11,377 6.5% Sales Tax 2% 929,442 1,058,595 129,154 13.9% 2,636,000 2,779,200 2,779,200
45,748 42,376 (3,372) -7.4% Use Tax 2% 247,723 242,763 (4,960) -2.0% 602,500 610,500 610,500
14,442 20,336 5,894 40.8% State Education Property Tax 1,310,940 1,426,775 115,835 8.8% 2,113,200 2,170,900 2,170,900
27,984 29,965 1,981 7.1% Real Estate Transfer Tax 142,398 153,483 11,085 7.8% 350,100 361,000 361,000
82,000 80,000 (2,000) -2.4% Lottery Transfer (b) 412,000 351,822 (60,178) -14.6% 1,070,600 1,010,000 1,010,000
9,279 9,863 583 6.3% Casino Wagering Tax 48,921 49,760 839 1.7% 117,300 121,300 121,300
10,251 4,923 (5,328) -52.0% Liquor Excise Tax 21,096 22,196 1,100 5.2% 60,200 60,600 60,600
29,004 27,935 (1,069) -3.7% Cigarette/Tobacco Tax 147,979 145,425 (2,554) -1.7% 327,500 319,400 319,400
1,219 1,835 616 50.5% Indus. & Comm. Facilities Taxes 9,850 10,441 590 6.0% 39,500 38,500 38,500
0 110 110 na Recreational Marihuana 0 699 699 na 0 23,600 23,600
287 523 236 82.0% Specific Other 4,076 3,536 (541) -13.3% 25,900 26,800 26,800
194,208 201,230 7,022 3.6% Income Tax Earmarking 1,100,635 1,167,489 66,854 6.1% 2,845,000 2,860,700 2,860,700
$820,958 $867,227 $46,269 5.6% Total School Aid Fund $5,773,031 $6,098,183 $325,152 5.6% $13,559,900 $13,925,500 $13,925,500
Multi-Fund Revenue Summary
$560,042 $621,783 $61,741 11.0% Sales Tax 6% $3,259,392 $3,500,596 $241,203 7.4% $8,246,400 $8,682,800 $8,682,800
383,769 434,134 50,365 13.1% Sales Tax 4% (d) 2,329,951 2,442,000 112,049 4.8% 5,610,400 5,903,600 5,903,600
176,272 187,649 11,377 6.5% Sales Tax 2% 929,442 1,058,595 129,154 13.9% 2,636,000 2,779,200 2,779,200
137,245 127,129 (10,116) -7.4% Use Tax 6% (g) 743,168 728,288 (14,881) -2.0% 1,793,900 1,825,400 1,825,400
71,793 69,147 (2,646) -3.7% Tobacco Taxes 366,285 359,962 (6,323) -1.7% 878,500 869,800 869,800
4 3,270 3,266 na Tobacco Settlement 4 6,539 6,535 na na na na
continued
- 12 -

Revenue Summary FY 2019-20General Fund-General Purpose, School Aid, and Transportation Funds
(in thousands)
For The Month Ended: February 29, 2020
Month-End Cash Collections Data October Through February Cash Collections Data Revenue Projections
February Difference Year-to-Date Difference FY 2018-19 FY 2019-20 FY 2019-20
Prelim. Statutory January 2020
2019 2020 Amount Percent Source of Revenue FY 2018-19 FY 2019-20 Amount Percent Totals (i) Estimate Forecast
Major Transportation Revenues
$18,583 $19,390 $807 4.3% Diesel Fuel / Motor Carrier Fuel Tax $100,594 $103,832 $3,238 3.2% $243,208 $246,000 $246,000
84,585 95,330 10,744 12.7% Gasoline 474,885 500,785 25,900 5.5% 1,214,820 1,213,000 1,213,000
157,530 164,478 6,948 4.4% Motor Vehicle Registration 555,175 594,535 39,361 7.1% 1,348,694 1,388,000 1,388,000
4,017 917 (3,100) -77.2% Other Taxes, Fees & Misc. 21,852 19,506 (2,346) -10.7% 130,899 234,917 234,917
8,916 9,098 181 2.0% Comprehensive Transportation (c) 43,201 45,488 2,286 5.3% 106,783 109,760 109,760
22,000 39,000 17,000 77.3% Income Tax Earmarking 110,000 195,000 85,000 77.3% 264,000 468,000 468,000
$295,631 $328,211 $32,580 11.0% Total Major Trans. Revenues $1,305,707 $1,459,145 $153,438 11.8% $3,308,405 $3,659,677 $3,659,677
Lottery Sales By Games
$127,728 $144,552 $16,823 13.2% Instant Games (f) $651,590 $741,448 $89,858 13.8% na na na
66,475 68,332 1,857 2.8% Daily Games 329,176 359,811 30,635 9.3% na na na
28,938 25,320 (3,617) -12.5% Lotto and Big Game (f) 220,699 145,707 (74,992) -34.0% na na na
675 653 (22) -3.3% Keno Game 3,444 3,382 (62) -1.8% na na na
1,071 1,056 (15) -1.4% Lucky For Life 5,607 5,433 (175) -3.1% na na na
6,452 8,541 2,089 32.4% Other (f) 27,932 49,055 21,122 75.6% na na na
49,179 53,325 4,146 8.4% Club Games 250,383 266,336 15,953 6.4% na na na
$280,517 $301,778 $21,261 7.6% Total Lottery Sales $1,488,831 $1,571,171 $82,340 5.5% na na na
(a) GF-GP Sales has been adjusted based on Comprehensive Transportation Fund, Health Initiative, Constitutional Revenue Sharing, and Aviation Fund. GF-GP Use has beenadjusted based on Aviation Fund.
(b) The statutory estimate does not include an estimate of lottery sales. It only includes an estimate of the School Aid Fund transfer. The transfersshown are actual transfers from Lottery to School Aid Fund.
(c) The Comprehensive Transportation Fund distributions have been estimated (includes sales tax transfer and other miscellaneous revenuesdedicated to the Comprehensive Transportation Fund).
(d) 2.0% collections adjusted to reflect exemption on residential utilities.
(e) Non-tax revenue items other than interest are estimates.
(f) Lottery Sales include iLottery net win amounts; and Other lottery games includes the new Fast Cash games, which began in July 2017.
(g) Gross Use tax collections include the transferred amounts to the Local Community Stabilization Authority, which are front-loaded at the beginning of the fiscal year. The year-to-date 2019revenues were $221.0 million and the year-to date 2020 revenues are $232.9 million. Per 2014 Public Act 80, the total fiscal year 2019 Local Community Stabilization Share (LCSS) was$438.0 million and the total fiscal year 2020 LCSS is $465.9 million.
(h) General Fund Use tax collections are net of LCSS revenue. The year-to-date 2019 LCSS revenues were $221.0 million and the year-to-date 2020 LCSS revenues are $232.9 million.
(i) Official CAFR figures are adjusted to put them on a comparable basis with Consensus Estimates.
Source: Michigan Department of Treasury, Office of Revenue & Tax Analysis, based on reports from theOffice of Financial Management, Michigan Department of Technology, Management and Budget, and otherreports from the Michigan Department of Treasury.
- 13 -

-14-
Economic Highlights (All data seasonally adjusted unless otherwise noted.) U.S. Economy
U.S. Gross Domestic Product continued growth for the 23rd consecutive quarter at the end of 2019. Real GDP increased at a 2.1 percent annual rate for the fourth quarter of 2019 according to the second estimate. According to the second estimates, the annual real GDP for 2019 is 2.3 percent, a decline from the 2.9 percent growth of 2018. With the coronavirus (COVID-19) pandemic that hit the U.S. towards the end of the first quarter of 2020, GDP may decline slightly in the first quarter and significantly in the second quarter.
Source: Bureau of Economic Analysis
Personal consumption expenditures continued to contribute significantly to growth in the fourth quarter, along with government spending, exports, and residential fixed investment. Private inventory investment was a drag on the economy. Real final sales increased an adjusted 3.1 percent in the fourth quarter while on the inflation front, the implicit price deflator decreased slightly to an adjusted 1.3 percent.
The COVID-19 pandemic will have a significant impact on the economy. The extent of the impact depends on the outbreak’s length and severity.
U.S. wage and salary employment growth increased in February by 273,000 jobs. In February, health care and social assistance added 57,000 jobs, food services and drinking places added 53,000 jobs, government added 45,000 jobs, and construction added 42,000 jobs. Average hourly earnings for all employees on private nonfarm payrolls increased by 3.0 percent from a year ago while the average workweek rose by 0.1 hour to 34.4 hours in February. February’s estimates do not include the impact of COVID-19 and individual state-mandated shutdowns to reduce the spread of the virus.
In February, the U.S. unemployment rate remained about the same at 3.5 percent. Civilian employment totaled 158.8 million persons, while the number unemployed remained about the same at 5.8 million.
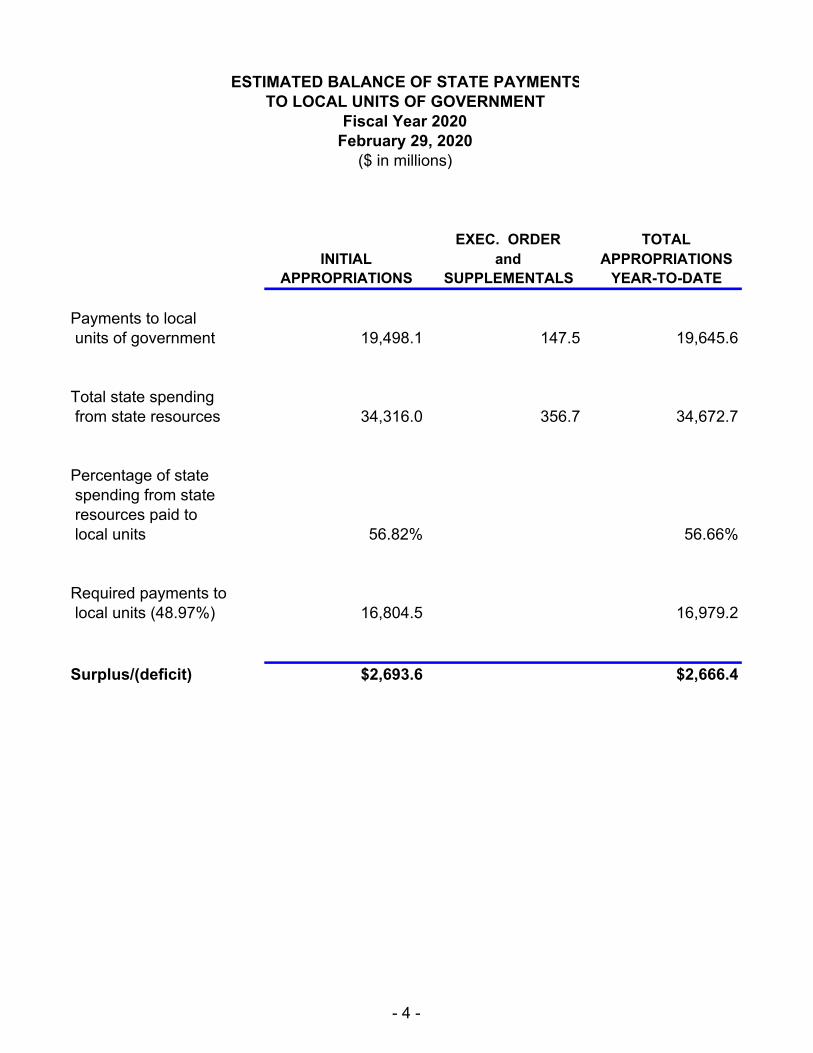
The Index of Consumer Sentiment increased in February to 101.0 index-points, with confidence waning by the end of the month due to COVID-19. Mid-March consumer sentiment estimates have dropped to 95.9 and are expected to decline further as the COVID-19 pandemic worsens. The survey indicates that the lowered consumer sentiment is based on fears regarding health rather than personal finances.
3.0%
2.1%
1.2%
-0.3% -0.1%
1.0%
-0.9%
0.0%
-1.1%
-0.7%-0.1%
1.5%
0.8%
0.3%0.5%
GDP
Growth, 2.0%
GDP
Growth, 2.1%
GDP
Growth, 2.1%
-2%
-1%
0%
1%
2%
3%
4%
-2%
-1%
0%
1%
2%
3%
4%
Q2 Contributions to Growth Q3 Contributions to Growth Q4 Contributions to Growth
2019 Q2, Q3 and Q4 Real GDP Growth and Contributions to Percent Change
Personal consumption expenditures Fixed investment Private inventories Net exports Government
-15-
Short-term interest rates remained about the same for the fourth month in a row, with the 3-month Treasury bill (T-bill) rate at 1.54 percent for February. However, it began declining the end of February and was 1.16 percent as of March 7th. Compared to March one year ago, the T-bill rate decreased 1.25 percentage points. The Aaa corporate bond rate, a long-term interest rate, decreased 0.41 percentage points to an interest yield of 2.53 percent from January to March 7 and was down 1.24 percentage points from its year-ago level. The interest rate on high-grade municipal bonds decreased to 2.53 percent from January to March 7 and was down 0.90 percentage points from a year ago.
U.S. retail prices, as measured by the Consumer Price Index (CPI-U), are up 2.3 percent from February of 2019, but remain relatively level with last month, with a 0.1 percent increase. Gasoline experienced the largest one-year price increase (5.6 percent), followed by medical care (4.6 percent), housing (2.7 percent), and other goods and services (2.7 percent). Apparel (-0.9 percent) was the only major sector to decline. The CPI-Core, which is all items less food and energy, was up 2.4 percent from January of 2019. The retail price of gasoline is expected to be significantly lower in March, due to the recent decline in crude oil prices.
40
60
80
100
2000 2002 2004 2006 2008 2010 2012 2014 2016 2018 2020
Ind
ex V
alu
e (
1966 =
100)
Source: University of Michigan, Survey Research Center
Index of Consumer Sentiment
March 2020 = 95.9
0
2
4
6
8
10
2000 2002 2004 2006 2008 2010 2012 2014 2016 2018 2020
Perc
en
t
Selected Key Interest Rates
Source: Economic Indicators
T-Bills = 1.16%
Moody's Aaa = 2.53%
S & P High Grade = 2.53%
2.3% 2.4%1.7%
2.7%
-0.9%
1.7%
5.6% 4.6%
1.5% 1.5%2.7%
-2%
0%
2%
4%
6%
Perc
en
t
Consumer Price Index, February 2020Year-over-year Percent Change
CPI-U CPI-Core Food and Beverage
Housing Apparel Transportation
Gasoline Medical Care Recreation
Education and Communication Other Goods and Services
Source: Bureau of Labor Statistics
-16 -
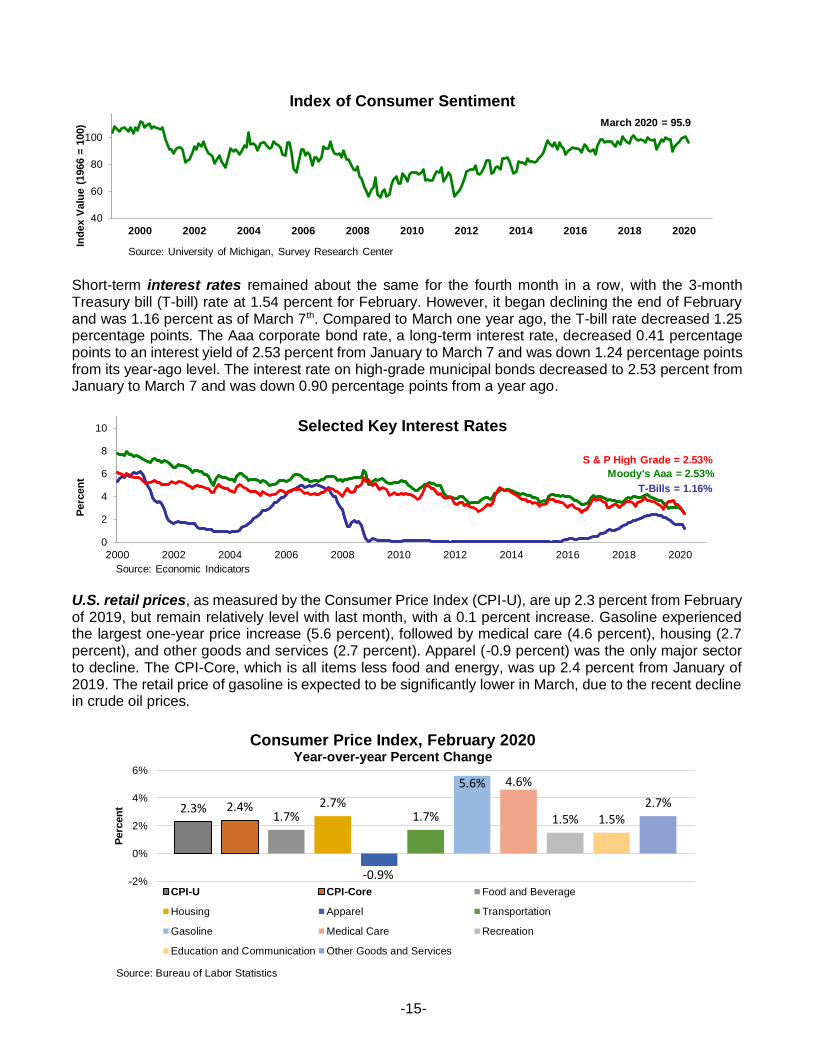
Michigan Economy
In January, the latest data available, the Michigan jobless rate was 3.8 percent, a tenth of a percentage point lower than December, and 0.4 percentage points lower than a year ago. The January labor force increased by 6,000 from December’s level to the highest level since June 2009. Michigan’s adjusted average annual unemployment rate for 2019 is 4.1 percent, four-tenths of a percentage higher than the national rate of 3.7 percent. Michigan’s January jobless rate of 3.8 percent is the lowest since the year 2000.
2.0
4.0
6.0
8.0
2016 2017 2018 2019 2020
Perc
en
t
Source: Bureau of Labor Statistics and Michigan Department of Technology, Management & Budget
Unemployment Rates 2016 - 2020
Michigan - Jan 2020 = 3.8%
United States - Feb 2020 = 3.5%
$0.00
$0.50
$1.00
$1.50
$2.00
$2.50
$3.00
$3.50
$4.00
$4.50
$5.00
Jan-00 Jan-02 Jan-04 Jan-06 Jan-08 Jan-10 Jan-12 Jan-14 Jan-16 Jan-18 Jan-20
Feb 2020
$2.41
June 2008
$4.11
Dec 2008
$1.68
Michigan wage and salary employment remained about the same in January. Professional and business services increased by 4,000 and construction increased by 3,000 jobs from last month, while government declined by 3,000 and other industries remained relatively stable with minor gains or losses.
Michigan gasoline prices decreased in February to $2.41 per gallon, down 8 cents a gallon from last
month’s average of $2.49 per gallon. From a year ago, gasoline prices were up 4.7 percent from the
February 2019 average of $2.30 per gallon. However, with the recent decrease in crude oil demand
due to the COVID-19 pandemic and the production shifts, oil prices have been dropping significantly in
March.
Michigan Gasoline Prices
Source: AAA Michigan

-17-
Michigan motor vehicle production declined to 178.8 units in February, a 1.0 percent decrease from January and a 13.5 percent increase from a year ago. Nationally, motor vehicle production was up 1.5 percent from a year ago. In February, Michigan's car production was 22,939 units while the state's truck production was 157,519 units. Compared with a year ago, car production decreased 16.8 percent in Michigan while it remained flat, with a 0.9 percent decrease nationwide. The state's truck production increased 19.3 percent while national truck production increased 2.3 percent from a year ago. Michigan motor vehicle production data are not seasonally adjusted.
0.0
5.0
10.0
15.0
20.0
2015 2016 2017 2018 2019 2020
Millio
ns (
SA
AR
)
Source: Bureau of Economic Analysis
Motor Vehicle Sector
U.S. light vehicle sales (cars and light trucks) decreased 0.5 percent in February from January levels, selling at a 16.8 million unit seasonally adjusted annual rate. Domestic car sales and domestic light truck sales both decreased 0.7 percent from January. Import car sales decreased 1.9 percent while import light truck sales increased 1.1 percent. Compared to last year, light vehicle sales increased by 1.9 percent. Domestic car sales decreased 12.2 percent from the year ago level while domestic light truck sales increased 9.4 percent. Import car sales were down 4.7 percent from last year while import light truck sales were down 1.2 percent. For February 2020, domestic light vehicles recorded a 75.0 percent share of a 16.8 million-unit market, a decrease of 2.0 percentage points from a year ago.
U. S. Light Vehicle Sales
Cars Lt Trucks
0
100
200
300
2015 2016 2017 2018 2019 2020
Th
ou
san
ds
Source: Office of Revenue and Tax Analysis
Michigan Motor Vehicle Production
Cars Trucks

Summary Estimates of the Constitutional Revenue LimitBased on the January 10, 2020 Consensus Revenue Agreement
(Article IX, Section 26)(in millions)
Fiscal Year Fiscal Year Fiscal Year2018-19 2019-20 2020-21Estimate Estimate Estimate
Applicable Calendar Year Personal Income $460,270 $484,030 $502,423Section 26 Base Ratio 9.49% 9.49% 9.49%
Revenue Limit $43,679.6 $45,934.4 $47,679.9
Revenue Limit $43,679.6 $45,934.4 $47,679.9State Revenue Subject to Limit $33,733.3 $34,387.2 $35,211.5
Amount Under (Over) Limit $9,946.3 $11,547.2 $12,468.4
Sources:
Personal Income Estimate
The FY 2018-19 calculation uses the official personal income estimate for calendar year 2017 (Survey of Current Business, October 2018).
The FY 2019-20 calculation uses the January 10, 2020 Consensus Revenue Agreement.
The FY 2020-21 calculation uses the January 10, 2020 Consensus Revenue Agreement.
Revenue Subject to the Limit
The FY 2018-19 calculation uses the January 10, 2020 Consensus Revenue Agreement.
The FY 2019-20 calculation uses the January 10, 2020 Consensus Revenue Agreement.
The FY 2020-21 calculation uses the January 10, 2020 Consensus Revenue Agreement.
Column detail may not add to totals due to rounding
Prepared By: Office of Revenue and Tax Analysis, Michigan Department of Treasury
- 18-