Embed Size (px)
Citation preview
5 6
How are African Americans, English learners andstudents in special education performing?**
English learners must achieve 3 goals to be reclassified as fluent English proficient (RFEP): 1. Scoreproficient on the California English Language Development Test (CELDT) 2. Show basic skills on theCalifornia Standards Test (CST)-ELA 3. Be recommended by the school by passing English courseswith a “C” or better.
English learners…
123
This section shows information about three major student groups who have been historically under-served and have struggled to meet performance targets in English language arts (ELA) and math.
English language arts
Students in special education scoring proficient or advanced in…
2010-11 2011-12LAUSDAverage
African Americans scoring proficient oradvanced in…
Math
English language arts
Math
...scoring proficient on the CELDT
...scoring basic or above on CST-ELA
...passing English courses with “C” or better
**Student performance is determined by AYP criteria (CST, CMA and CAPA)
LEARNmoreA school must meet targets under No Child Left Behind (NCLB) on standardized testsand graduation rates for all students and for certain groups (economically disadvantagedstudents, students with disabilities, English learners, and students in different ethnicgroups). For information on the specific requirements for your school, visithttp://www.cde.ca.gov/ta/ac/ar/ and click on the link called School Level AYP Reports.
Did this school meet AYP requirements?How many requirements did the school meet?...out of a possible
ATitle I school is in Program Improvement (PI) status when it does not meet AYPrequirements two years in a row. When this happens, an intervention plan is designed tohelp the school meet its requirements. Parents are notified when a school enters PIstatus. You may view a copy of your school’s plan at your school.
What was the school’s PI status as of September 2012?
What is Adequate Yearly Progress (AYP) andProgram Improvement (PI) Status?
About the school
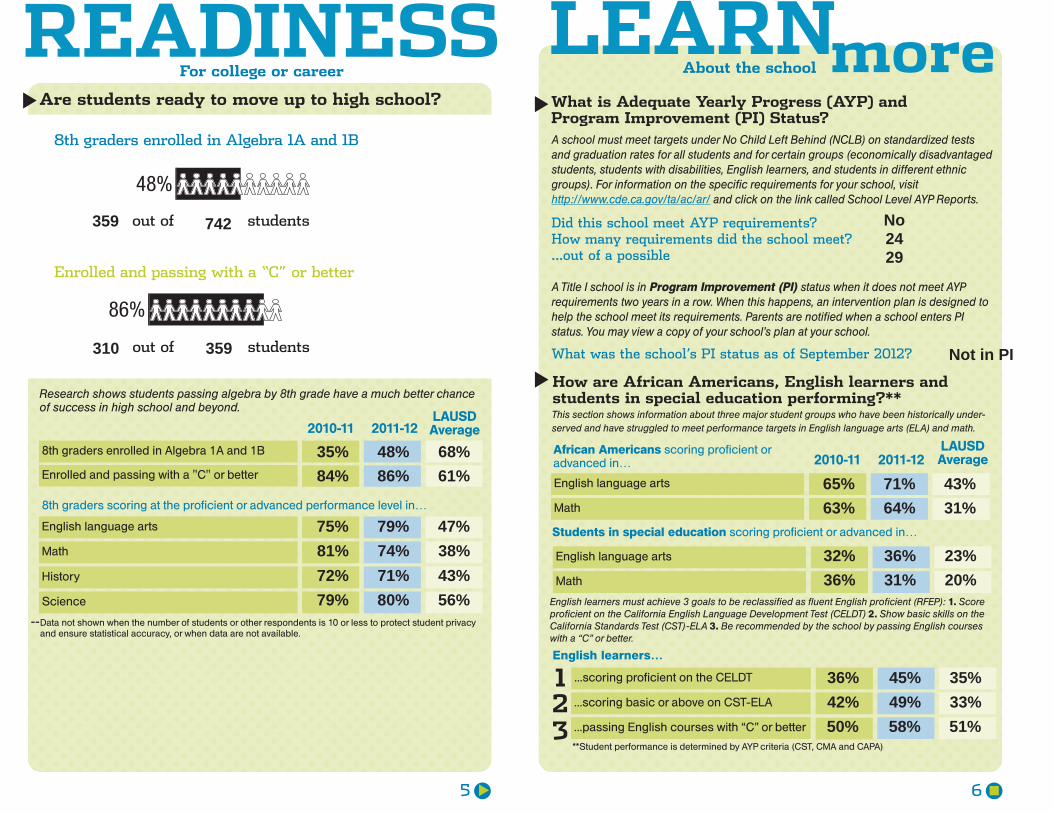
Are students ready to move up to high school?
Research shows students passing algebra by 8th grade have a much better chanceof success in high school and beyond.
8th graders enrolled in Algebra 1A and 1B
Enrolled and passing with a "C" or better
2010-11 2011-12LAUSDAverage
English language arts
Math
History
Science
8th graders scoring at the proficient or advanced performance level in…
8th graders enrolled in Algebra 1A and 1B
Enrolled and passing with a “C” or better
out of students
out of students
READINESSFor college or career
Data not shown when the number of students or other respondents is 10 or less to protect student privacyand ensure statistical accuracy, or when data are not available.
S
DOES
HOW
YOUR
SCHOOL
MEASURE
UP?
Fin
dou
tmor
eat
http://rep
ortcar
d.lau
sd.n
et
Los Angeles Unified School District
SCHOOLreportcard 11
12
SCHOOL
repor
tca
rd11 12
Developedinpartnershipwith
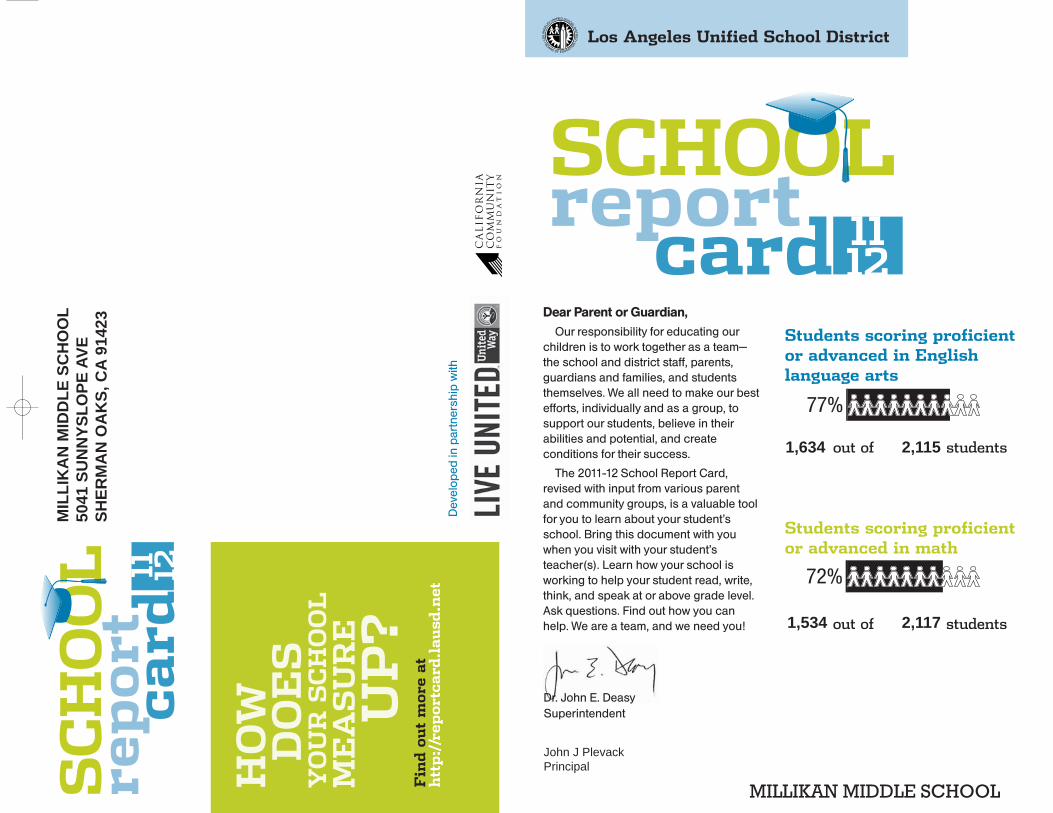
Students scoring proficientor advanced in Englishlanguage arts
Students scoring proficientor advanced in math
out of students
out of students
Dear Parent or Guardian,Our responsibility for educating ourchildren is to work together as a team—the school and district staff, parents,guardians and families, and studentsthemselves. We all need to make our bestefforts, individually and as a group, tosupport our students, believe in theirabilities and potential, and createconditions for their success.
The 2011-12 School Report Card,revised with input from various parentand community groups, is a valuable toolfor you to learn about your student’sschool. Bring this document with youwhen you visit with your student’steacher(s). Learn how your school isworking to help your student read, write,think, and speak at or above grade level.Ask questions. Find out how you canhelp. We are a team, and we need you!
Dr. John E. DeasySuperintendent
Principal
S
ENG - M.S.
--
1,634 2,115
1,534 2,117
MIL
LIK
AN
MID
DLE
SC
HO
OL
5041
SU
NN
YSLO
PE A
VESH
ERM
AN
OA
KS,
CA
9142
3
MILLIKAN MIDDLE SCHOOL
John J PlevackPrincipal
77%
72%
21
Are students showing high attendance and low suspension(Status Measure 2)?
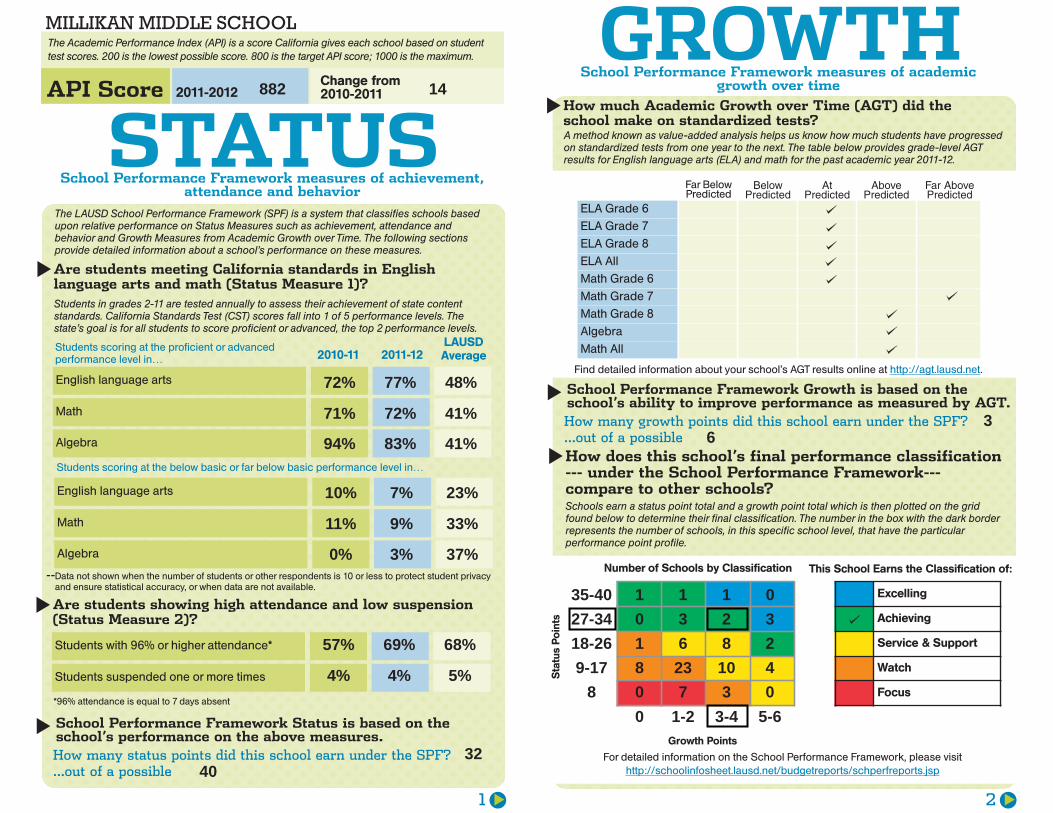
STATUSThe LAUSD School Performance Framework (SPF) is a system that classifies schools basedupon relative performance on Status Measures such as achievement, attendance andbehavior and Growth Measures from Academic Growth over Time. The following sectionsprovide detailed information about a school’s performance on these measures.
The Academic Performance Index (API) is a score California gives each school based on studenttest scores. 200 is the lowest possible score. 800 is the target API score; 1000 is the maximum.
API Score Change from2010-20112011-2012
School Performance Framework measures of achievement,attendance and behavior
2010-11 2011-12
English language arts
Students scoring at the proficient or advancedperformance level in…
Math
Algebra
English language arts
Students scoring at the below basic or far below basic performance level in…
Math
Algebra
Students with 96% or higher attendance*
Students suspended one or more times
LAUSDAverage
Are students meeting California standards in Englishlanguage arts and math (Status Measure 1)?Students in grades 2-11 are tested annually to assess their achievement of state contentstandards. California Standards Test (CST) scores fall into 1 of 5 performance levels. Thestate’s goal is for all students to score proficient or advanced, the top 2 performance levels.
GROWTHSchool Performance Framework measures of academic
growth over time
For detailed information on the School Performance Framework, please visithttp://schoolinfosheet.lausd.net/budgetreports/schperfreports.jsp
How much Academic Growth over Time (AGT) did theschool make on standardized tests?
Far BelowPredicted
BelowPredicted
AtPredicted
AbovePredicted
Far AbovePredicted
ELA Grade 6
ELA Grade 7
ELA Grade 8
ELA All
Math Grade 6
Math Grade 7
Math Grade 8
Algebra
Math All
A method known as value-added analysis helps us know how much students have progressedon standardized tests from one year to the next. The table below provides grade-level AGTresults for English language arts (ELA) and math for the past academic year 2011-12.
*96% attendance is equal to 7 days absent
School Performance Framework Status is based on theschool’s performance on the above measures.How many status points did this school earn under the SPF?...out of a possible
How does this school’s final performance classification--- under the School Performance Framework---compare to other schools?Schools earn a status point total and a growth point total which is then plotted on the gridfound below to determine their final classification. The number in the box with the dark borderrepresents the number of schools, in this specific school level, that have the particularperformance point profile.
School Performance Framework Growth is based on theschool’s ability to improve performance as measured by AGT.How many growth points did this school earn under the SPF?...out of a possible
This School Earns the Classification of:Number of Schools by ClassificationStatusPoints
Growth Points
Data not shown when the number of students or other respondents is 10 or less to protect student privacyand ensure statistical accuracy, or when data are not available.
Find detailed information about your school’s AGT results online at http://agt.lausd.net.
Excelling
Achieving
Service & Support
Watch
Focus
3 4
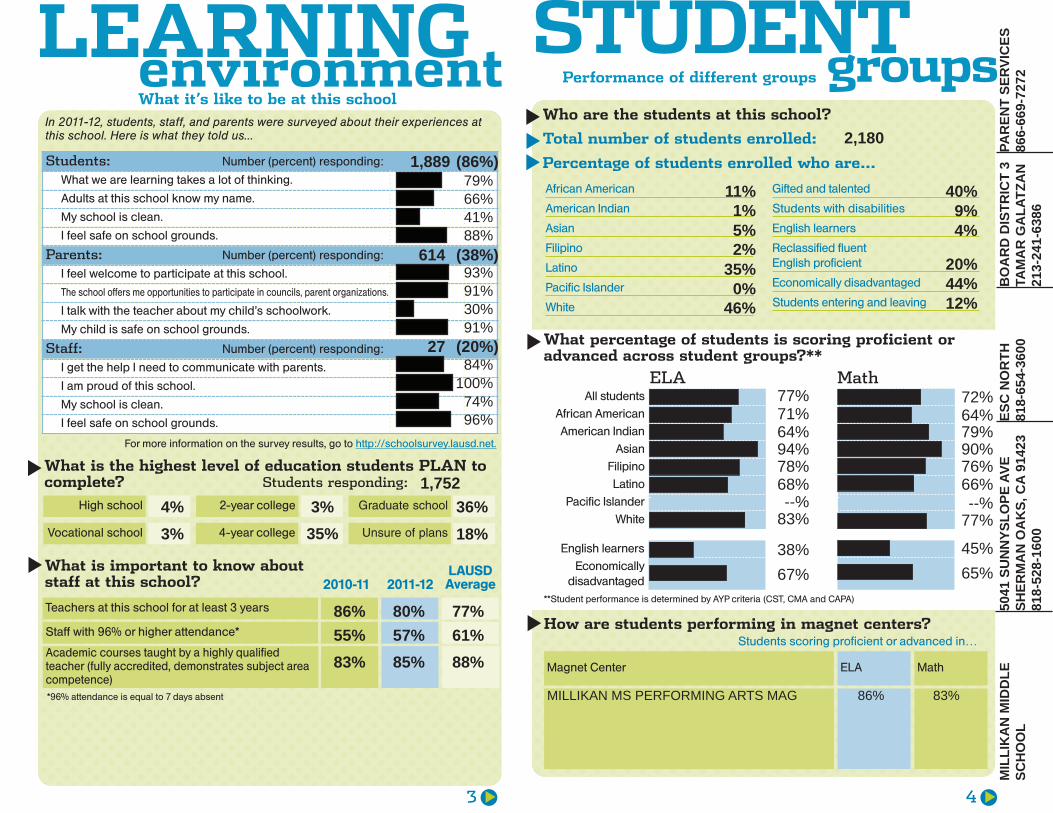
In 2011-12, students, staff, and parents were surveyed about their experiences atthis school. Here is what they told us...
LEARNINGenvironment
For more information on the survey results, go to http://schoolsurvey.lausd.net.
2010-11 2011-12What is important to know aboutstaff at this school?
LAUSDAverage
Students: Number (percent) responding:
What we are learning takes a lot of thinking.
Adults at this school know my name.
My school is clean.
I feel safe on school grounds.
Parents: Number (percent) responding:
I feel welcome to participate at this school.
The school offers me opportunities to participate in councils, parent organizations.
I talk with the teacher about my child’s schoolwork.
My child is safe on school grounds.
Staff: Number (percent) responding:
I get the help I need to communicate with parents.
I am proud of this school.
My school is clean.
I feel safe on school grounds.
Teachers at this school for at least 3 years
Staff with 96% or higher attendance*
What is the highest level of education students PLAN tocomplete? Students responding:
High school
Vocational school
2-year college
Unsure of plans
Graduate school
4-year college
Academic courses taught by a highly qualifiedteacher (fully accredited, demonstrates subject areacompetence)
What it’s like to be at this school
STUDENTgroups
What percentage of students is scoring proficient oradvanced across student groups?**
All students
African American
American Indian
Asian
Filipino
Latino
Pacific Islander
White
MathELA
English learners
Economicallydisadvantaged
Performance of different groups
Percentage of students enrolled who are…
Who are the students at this school?
African American
American Indian
Asian
Filipino
Latino
Pacific Islander
White
Gifted and talented
Students with disabilities
English learners
Reclassified fluentEnglish proficient
Economically disadvantaged
Students entering and leaving
Total number of students enrolled:
How are students performing in magnet centers?
ELAMagnet Center Math
Students scoring proficient or advanced in…
**Student performance is determined by AYP criteria (CST, CMA and CAPA)
*96% attendance is equal to 7 days absent
S
ENG - M.S.
--
882 14
72% 77% 48%
71% 72% 41%
94% 83% 41%
10% 7% 23%
11% 9% 33%
0% 3% 37%
57% 69% 68%
3240
36
35-40 1 1 027-34 0 3 2 318-26 1 6 8 29-17 8 23 10 4
8 0 7 3 00 1-2 3-4 5-6
4% 4% 5%
1
MILLIKAN MIDDLE SCHOOL
21
Are students showing high attendance and low suspension(Status Measure 2)?
STATUSThe LAUSD School Performance Framework (SPF) is a system that classifies schools basedupon relative performance on Status Measures such as achievement, attendance andbehavior and Growth Measures from Academic Growth over Time. The following sectionsprovide detailed information about a school’s performance on these measures.
The Academic Performance Index (API) is a score California gives each school based on studenttest scores. 200 is the lowest possible score. 800 is the target API score; 1000 is the maximum.
API Score Change from2010-20112011-2012
School Performance Framework measures of achievement,attendance and behavior
2010-11 2011-12
English language arts
Students scoring at the proficient or advancedperformance level in…
Math
Algebra
English language arts
Students scoring at the below basic or far below basic performance level in…
Math
Algebra
Students with 96% or higher attendance*
Students suspended one or more times
LAUSDAverage
Are students meeting California standards in Englishlanguage arts and math (Status Measure 1)?Students in grades 2-11 are tested annually to assess their achievement of state contentstandards. California Standards Test (CST) scores fall into 1 of 5 performance levels. Thestate’s goal is for all students to score proficient or advanced, the top 2 performance levels.
GROWTHSchool Performance Framework measures of academic
growth over time
For detailed information on the School Performance Framework, please visithttp://schoolinfosheet.lausd.net/budgetreports/schperfreports.jsp
How much Academic Growth over Time (AGT) did theschool make on standardized tests?
Far BelowPredicted
BelowPredicted
AtPredicted
AbovePredicted
Far AbovePredicted
ELA Grade 6
ELA Grade 7
ELA Grade 8
ELA All
Math Grade 6
Math Grade 7
Math Grade 8
Algebra
Math All
A method known as value-added analysis helps us know how much students have progressedon standardized tests from one year to the next. The table below provides grade-level AGTresults for English language arts (ELA) and math for the past academic year 2011-12.
*96% attendance is equal to 7 days absent
School Performance Framework Status is based on theschool’s performance on the above measures.How many status points did this school earn under the SPF?...out of a possible
How does this school’s final performance classification--- under the School Performance Framework---compare to other schools?Schools earn a status point total and a growth point total which is then plotted on the gridfound below to determine their final classification. The number in the box with the dark borderrepresents the number of schools, in this specific school level, that have the particularperformance point profile.
School Performance Framework Growth is based on theschool’s ability to improve performance as measured by AGT.How many growth points did this school earn under the SPF?...out of a possible
This School Earns the Classification of:Number of Schools by Classification
StatusPoints
Growth Points
Data not shown when the number of students or other respondents is 10 or less to protect student privacyand ensure statistical accuracy, or when data are not available.
Find detailed information about your school’s AGT results online at http://agt.lausd.net.
Excelling
Achieving
Service & Support
Watch
Focus
3 4
In 2011-12, students, staff, and parents were surveyed about their experiences atthis school. Here is what they told us...
LEARNINGenvironment
For more information on the survey results, go to http://schoolsurvey.lausd.net.
2010-11 2011-12What is important to know aboutstaff at this school?
LAUSDAverage
Students: Number (percent) responding:
What we are learning takes a lot of thinking.
Adults at this school know my name.
My school is clean.
I feel safe on school grounds.
Parents: Number (percent) responding:
I feel welcome to participate at this school.
The school offers me opportunities to participate in councils, parent organizations.
I talk with the teacher about my child’s schoolwork.
My child is safe on school grounds.
Staff: Number (percent) responding:
I get the help I need to communicate with parents.
I am proud of this school.
My school is clean.
I feel safe on school grounds.
Teachers at this school for at least 3 years
Staff with 96% or higher attendance*
What is the highest level of education students PLAN tocomplete? Students responding:
High school
Vocational school
2-year college
Unsure of plans
Graduate school
4-year college
Academic courses taught by a highly qualifiedteacher (fully accredited, demonstrates subject areacompetence)
What it’s like to be at this school
STUDENTgroups
What percentage of students is scoring proficient oradvanced across student groups?**
All students
African American
American Indian
Asian
Filipino
Latino
Pacific Islander
White
MathELA
English learners
Economicallydisadvantaged
Performance of different groups
Percentage of students enrolled who are…
Who are the students at this school?
African American
American Indian
Asian
Filipino
Latino
Pacific Islander
White
Gifted and talented
Students with disabilities
English learners
Reclassified fluentEnglish proficient
Economically disadvantaged
Students entering and leaving
Total number of students enrolled:
How are students performing in magnet centers?
ELAMagnet Center Math
Students scoring proficient or advanced in…
**Student performance is determined by AYP criteria (CST, CMA and CAPA)
*96% attendance is equal to 7 days absent
S
ENG - M.S.
--
1,889
614
27
1,7524%
86% 80% 77%55% 57% 61%83% 85% 88%
3%3%35%
36%18%
(38%)
(86%)
(20%)
11%1%5%2%
35%0%
46%
40%9%4%
20%44%12%
77% 72%71% 64%64% 79%94% 90%78% 76%68% 66%--% --%
83% 77%
38% 45%67% 65%
2,180
MIL
LIK
AN
MID
DLE
SC
HO
OL
5041
SU
NN
YSLO
PE A
VESH
ERM
AN
OA
KS,
CA
9142
381
8-52
8-16
00
ESC
NO
RTH
818-
654-
3600
BO
AR
D D
ISTR
ICT
3TA
MA
R G
ALA
TZA
N21
3-24
1-63
86
PAR
ENT
SER
VIC
ES86
6-66
9-72
72
91%
79%66%41%88%
93%91%30%
84%100%74%96%
MILLIKAN MS PERFORMING ARTS MAG 86% 83%
5 6
How are African Americans, English learners andstudents in special education performing?**
English learners must achieve 3 goals to be reclassified as fluent English proficient (RFEP): 1. Scoreproficient on the California English Language Development Test (CELDT) 2. Show basic skills on theCalifornia Standards Test (CST)-ELA 3. Be recommended by the school by passing English courseswith a “C” or better.
English learners…
123
This section shows information about three major student groups who have been historically under-served and have struggled to meet performance targets in English language arts (ELA) and math.
English language arts
Students in special education scoring proficient or advanced in…
2010-11 2011-12LAUSDAverage
African Americans scoring proficient oradvanced in…
Math
English language arts
Math
...scoring proficient on the CELDT
...scoring basic or above on CST-ELA
...passing English courses with “C” or better
**Student performance is determined by AYP criteria (CST, CMA and CAPA)
LEARNmoreA school must meet targets under No Child Left Behind (NCLB) on standardized testsand graduation rates for all students and for certain groups (economically disadvantagedstudents, students with disabilities, English learners, and students in different ethnicgroups). For information on the specific requirements for your school, visithttp://www.cde.ca.gov/ta/ac/ar/ and click on the link called School Level AYP Reports.
Did this school meet AYP requirements?How many requirements did the school meet?...out of a possible
ATitle I school is in Program Improvement (PI) status when it does not meet AYPrequirements two years in a row. When this happens, an intervention plan is designed tohelp the school meet its requirements. Parents are notified when a school enters PIstatus. You may view a copy of your school’s plan at your school.
What was the school’s PI status as of September 2012?
What is Adequate Yearly Progress (AYP) andProgram Improvement (PI) Status?
About the school
Are students ready to move up to high school?
Research shows students passing algebra by 8th grade have a much better chanceof success in high school and beyond.
8th graders enrolled in Algebra 1A and 1B
Enrolled and passing with a "C" or better
2010-11 2011-12LAUSDAverage
English language arts
Math
History
Science
8th graders scoring at the proficient or advanced performance level in…
8th graders enrolled in Algebra 1A and 1B
Enrolled and passing with a “C” or better
out of students
out of students
READINESSFor college or career
Data not shown when the number of students or other respondents is 10 or less to protect student privacyand ensure statistical accuracy, or when data are not available.
S
DOES
HOW
YOUR
SCHOOL
MEASURE
UP?
Fin
dou
tmor
eat
http://rep
ortcar
d.lau
sd.n
et
Los Angeles Unified School District
SCHOOLreportcard 11
12
SCHOOL
repor
tca
rd11 12
Developedinpartnershipwith
Students scoring proficientor advanced in Englishlanguage arts
Students scoring proficientor advanced in math
out of students
out of students
Dear Parent or Guardian,Our responsibility for educating ourchildren is to work together as a team—the school and district staff, parents,guardians and families, and studentsthemselves. We all need to make our bestefforts, individually and as a group, tosupport our students, believe in theirabilities and potential, and createconditions for their success.
The 2011-12 School Report Card,revised with input from various parentand community groups, is a valuable toolfor you to learn about your student’sschool. Bring this document with youwhen you visit with your student’steacher(s). Learn how your school isworking to help your student read, write,think, and speak at or above grade level.Ask questions. Find out how you canhelp. We are a team, and we need you!
Dr. John E. DeasySuperintendent
Principal
S
ENG - M.S.
--
742359 No2429
Not in PI
65%
359310
35% 68%48%84% 61%86%
75% 47%79%81% 38%74%72% 43%71%79% 56%80%
71% 43%63% 64% 31%
32% 36% 23%36% 31% 20%
36% 45% 35%42% 49% 33%50% 58% 51%
48%
86%