Embed Size (px)
Citation preview
Imaging Cajal’s neuronal avalanche:how wide-field optical imaging of thepoint-spread advanced theunderstanding of neocorticalstructure–function relationship
Ron D. FrostigCynthia H. Chen-BeeBrett A. JohnsonNathan S. Jacobs
Ron D. Frostig, Cynthia H. Chen-Bee, Brett A. Johnson, Nathan S. Jacobs, “Imaging Cajal’s neuronalavalanche: how wide-field optical imaging of the point-spread advanced the understanding ofneocortical structure–function relationship,” Neurophoton. 4(3), 031217 (2017),doi: 10.1117/1.NPh.4.3.031217.
Downloaded From: http://neurophotonics.spiedigitallibrary.org/ on 06/12/2017 Terms of Use: http://spiedigitallibrary.org/ss/termsofuse.aspx

Imaging Cajal’s neuronal avalanche: how wide-fieldoptical imaging of the point-spread advanced theunderstanding of neocortical structure–functionrelationship
Ron D. Frostig,a,b,c,* Cynthia H. Chen-Bee,a Brett A. Johnson,a,† and Nathan S. Jacobsa,c,‡
aUniversity of California Irvine, Department of Neurobiology and Behavior, Irvine, California, United StatesbUniversity of California Irvine, Department of Biomedical Engineering, Irvine, California, United StatescUniversity of California Irvine, Center for the Neurobiology of Learning and Memory, Irvine, California, United States
Abstract. This review brings together a collection of studies that specifically use wide-field high-resolutionmesoscopic level imaging techniques (intrinsic signal optical imaging; voltage-sensitive dye optical imaging)to image the cortical point spread (PS): the total spread of cortical activation comprising a large neuronal ensem-ble evoked by spatially restricted (point) stimulation of the sensory periphery (e.g., whisker, pure tone, pointvisual stimulation). The collective imaging findings, combined with supporting anatomical and electrophysiologi-cal findings, revealed some key aspects about the PS including its very large (radius of several mm) and rel-atively symmetrical spatial extent capable of crossing cytoarchitectural borders and trespassing into othercortical areas; its relationship with underlying evoked subthreshold activity and underlying anatomical systemof long-range horizontal projections within gray matter, both also crossing borders; its contextual modulation andplasticity; the ability of its relative spatiotemporal profile to remain invariant to major changes in stimulationparameters; its potential role as a building block for integrative cortical activity; and its ubiquitous presenceacross various cortical areas and across mammalian species. Together, these findings advance our understand-ing about the neocortex at the mesoscopic level by underscoring that the cortical PS constitutes a fundamentalmotif of neocortical structure–function relationship. © 2017 Society of Photo-Optical Instrumentation Engineers (SPIE) [DOI: 10.1117/1
.NPh.4.3.031217]
Keywords: intrinsic optical imaging; voltage-sensitive dye imaging; optical recording; cerebral cortex; neurophysiology.
Paper 17005SSVR received Jan. 14, 2017; accepted for publication May 12, 2017; published online Jun. 12, 2017.
1 IntroductionWhen single electrode-based probing of neocortex was the onlyavailable technique to map cortical function, understanding theneocortical functional organization was solely based on the con-cept of receptive field. In such studies where activity is beingrecorded from single neurons, the receptive field is definedby the area of the sensory periphery where stimulation canevoke a suprathreshold (spikes) response (area-to-point conver-gence). Researchers interested in mapping the functional organi-zation of the cortex typically used the location of the strongest(peak) spiking response within the receptive field to define thecorrespondence between specific sensory stimulation and cort-ical function of the recorded neuron. Recording peak responsesfrom many neurons following methodical stimulation along thesensory periphery led to the establishment of how sensoryperiphery is mapped onto the cortex. Such maps highlighteda fundamental principle of cortical functional organizationknown as topography, where neighboring points in the sensoryperiphery map to neighboring points in the cortex. The topo-graphical principle has been repeatedly verified in several
cortical areas, especially primary sensory ones, such as retino-topy (visual), tonotopy (auditory), and somatotopy (tactile).
With the advance of optical imaging techniques that couldoffer a spatially continuous, high-spatial resolution, wide-field imaging of neocortical function, it became easier tostudy the cortex at the large neuronal ensemble, or mesoscopic,level by investigating a functional mapping measure known asthe cortical point spread (PS). The PS is defined as the spatialextent of evoked cortical activity following delivery of afocused, spatially restricted or point stimulation to the sensoryperiphery (point-to-area divergence) [reviewed in Ref. 1], alsoknown as “cortical response field.”2 The PS could also bedescribed as the continuous spatial distribution over corticalspace of the evoked response amplitudes following a pointstimulation defining the cortical PS function.
There are several potential reasons why the cortex would notrepresent a stimulated point in the sensory periphery as a pointin cortex, and they are due to optical properties of the imagingsystem, the optical properties of the interaction between lightand cortex, and the nature of the cortex itself. Specifically,(1) the PS of the imaging system is typically not ideal due toimperfections of its optical elements that could inflate theimaged size (optical PS), (2) due to light scattering from theskull and cortical tissue that could also inflate the imagedsize, and (3) cortical neurons are heavily interconnected and,
*Address all correspondence to: Ron D. Frostig, E-mail: [email protected]
†Current address: University of California, Department of Pathology andLaboratory Medicine, Irvine
‡Current address: University of California, Department of Neurology, GeffenSchool of Medicine, Los Angeles 2329-423X/2017/$25.00 © 2017 SPIE
Neurophotonics 031217-1 Jul–Sep 2017 • Vol. 4(3)
Neurophotonics 4(3), 031217 (Jul–Sep 2017) REVIEW
Downloaded From: http://neurophotonics.spiedigitallibrary.org/ on 06/12/2017 Terms of Use: http://spiedigitallibrary.org/ss/termsofuse.aspx
therefore, evoked activity could potentially spread in the corticaltissue via these connections from the location of the thalamo-cortical input into the cortex (functional PS). As will beseen, the optical PS and light scattering cannot account forthe large size of the cortical PS. The potential for a largesize of the functional PS in cortex was predicted by NobelPrize Laureate Santiago Ramon y Cajal. Summarizing manyyears of his classical histological studies of cortex in 1937,Cajal noted the potential for what we call now a large functionalcortical PS by establishing the “the law of neuronal avalanche.”The law of neuronal avalanche states that there is a progressiveincrease (avalanche) in the number of neurons that process infor-mation from the periphery to the cortex.3 However, a functionalverification of his histological-based prediction had to waitmany years until the birth of optical imaging techniques, asdescribed in this review.
Until the development of dense microelectrode arrays withconsiderably improved spatial mapping capabilities, the spatialextent of a PS was difficult to map using single microelectroderecordings. Instead, the primary means to study the PS had beenthe use of high-resolution wide-field imaging techniques thatenabled spatially continuous sampling of the PS, as opposedto only spatially discrete microelectrode samplings. Thesewide-field imaging techniques contributed to the revival ofCajal’s “law of neuronal avalanche” by imaging the entirespatial extent of the PS and, therefore, helping to refine ourunderstanding of the cortical structure–function relationship.A key assumption underpinning such refinement is that allevoked cortical activity is important, not just peak responses.This assumption entails that weaker evoked spiking responseslocalized beyond peak activity, as well as evoked subthreshold(synaptic) responses, should also be considered whencortical function is being recorded/imaged and, therefore,contributing to the large size of a cortical PS. This assumptionis in line with the growing evidence for the existence of cortical“nonclassical” or “extraclassical” receptive fields. A nonclass-ical receptive field includes a subthreshold zone surroundingand modulating the classical (spiking) receptive field and, there-fore, increasing the receptive field size; for a recent reviewsee Ref. 4.
Two high-resolution wide-field functional imaging tech-niques have been especially successful in imaging and mappingthe territory of cortical PSs. Both techniques are based on opticalimaging: voltage-sensitive dyes-based optical imaging (VSDOI;also known as VSDI) and intrinsic signal optical imaging(ISOI). VSDOI excels in its temporal resolution (sub-ms) andhas an estimated functional resolution of about 50 μm.5 It is pri-marily sensitive to the sum of subthreshold activation of theimaged cortex, and as the dye is attached to membranes, thistechnique is especially sensitive to neuronal elements thathave a large surface membrane, such as dendritic and axonaltrees, although glial contribution is also possible; see recentreview by Ref. 5. This dye-based technique, however, is invasiveand requires large craniotomies and long staining periods afterdura removal, and like other dye-based techniques, it is limitedin its application due to progressive bleaching of the dye by illu-mination over time. In addition, photodynamic damage andpharmacological side effects could sometimes affect imagingresults, although the potential contribution of these effectshas been diminished with the production of recent dyes.5
These limitations could become irrelevant in the case of arecently developed promising technique of genetically encoded
indicators of voltage, reviewed by Ref. 6. ISOI (reviewed byFrostig and Chen-Bee7 and Grinvald et al.8), on the otherhand, has always excelled in the spatial domain (estimated func-tional resolution of up to 20 μm)8 and its temporal resolution hasbeen reported to be as fast as 80 ms.9 Measuring only activity-dependent reflectance changes from the cortex also means that,unlike VSDOI, one can employ strong illumination that is onlyshot-noise limited. ISOI is based on activity-dependent evokedhemodynamic mechanisms following cortical stimulation andwhen illumination is employed at the orange/red part of thespectrum, the imaged PS has typically three distinct and largelyindependent phases (initial dip, overshoot, and undershoot)in anesthetized rats10 and alert monkeys11 similar to the fMRIevoked hemodynamic response sequence; therefore, ISOIresults offer implications for this popular functional imagingtechnique—a topic not further discussed in this review.Another major advantage of ISOI, especially in rodents, isthat it can functionally image cortical surfaces through the skull(thinned skull in rats, intact, or thinned skull in mice) and, there-fore, ISOI is not invasive to the underlying brain. Also, becauseISOI is based on measuring light reflectance from the illumi-nated cortex (no dyes involved), it is not hindered by limitationssuch as bleaching or pharmacological side effects, and therefore,is not limited in its application. A commonality of both opticalimaging methods is that, due to the limitations inherited in theinteractions between photons and brain tissue, both VSDOI andISOI are more sensitive to neuronal activity within the upperlayers (supragranular layers 2, 3) of cortex; both, however,offer the advantage of comprehensively assaying the collectivepopulation response of the entire evoked neuronal ensemble.Last, while they can be used to map the spatial extent of theimaged PS territory, it should be noted that both imaging tech-niques are more commonly used to map the territory of preferredresponses, such as columns (e.g., orientation or ocular domi-nance columns in the visual cortex); for a detailed discussionof the differences between PS mapping and preference mapping,see Ref. 7.
2 Early Optical Recordings of the PointSpread
The early experiments employing wide-field VSDs were consid-ered optical recording rather than optical imaging studiesbecause they were based on recording evoked voltage-sensitivetraces [(e.g., see Fig. 1(c)] by a diode array mounted on the topof a fluorescent microscope. The importance of these firstoptical recording studies is that they provided the first clearwide-field characterization of the cortical PS. Popular corticaltargets for the early optical recording experiments were thesomatosensory, auditory, and visual cortices of rats and mon-keys [Fig. 1(a)]. The first clear example of a cortical PS wasprovided in the rat posteromedial barrel subfield (PMBSF),the subdivision of the barrel cortex associated with the orderedarray of major facial whiskers (mystacial vibrissae) famous forits one-to-one mapping between each whisker and a layer IV“barrel”—a structure that receives the majority of thalamocort-ical input to the PMBSF. During the period of the first opticalrecording experiments, it was believed that single whiskerstimulation only activates its own associated barrel in a one-to-one fashion.12 By contrast, as characterized by optical record-ing, the PS evoked by a point tactile stimulation—a whisker onthe rat’s snout—was found to be larger than its underlying layerIV associated barrel but was still contained within the PMBSF,
Neurophotonics 031217-2 Jul–Sep 2017 • Vol. 4(3)
Frostig et al.: Imaging Cajal’s “neuronal avalanche”: how wide-field optical. . .
Downloaded From: http://neurophotonics.spiedigitallibrary.org/ on 06/12/2017 Terms of Use: http://spiedigitallibrary.org/ss/termsofuse.aspx

although no attempt was made to quantify its spatial extent.13
Findings regarding the large PS evoked by single-whiskerstimulation were later replicated by employing the same diodearray based set-up. The replication, however, was based on bothVSD recordings and the first recordings of evoked intrinsic sig-nal traces (intrinsic signal recording) from the same PMBSFusing an identical whisker stimulation regimen. As shown in
Figs. 1(b) and 1(c), both recording techniques showed a largePS within the PMBSF, spreading to all directions away fromthe peak response while progressively and smoothly declin-ing in amplitude over cortical distance;14 for another VSDrecording replication, see Ref. 15—yet again, no attempt wasmade to quantify these PSs. Together, the PMBSF studieshave established that the spread evoked by a point (whisker)
Fig. 1 Animal models and early optical recordings using photodiode arrays. (a) Cortical PSs have beenmapped in vivo for various species ranging from mice to monkeys. Provided here are schematics of thecortex depicting the approximate size and location of the various primary sensory regions for a rat (left) ormacaque monkey (right) brain. SI, somatosensory; AI, auditory; VI, visual. Main sulci are labeled as RS(rhinal), CS (central), LS (lateral), STS (superior temporal), and LuS (lunate). Note differences in therelative size and location of the primary sensory regions across different animal models. (b) and(c) Early optical recordings of a PS evoked by a single whisker in the PMBSF cortex of the anesthetizedrat is much larger than its underlying barrel. The recordings of (b) evoked intrinsic signals or (c) VSDsacquired from the same rat PMBSF are illustrated here. A set-up of a 10 × 10 photodiode array mountedon a microscope was employed for both techniques. An average of more than 200 trials is shown in (b)and more than 80 trials in (c). The largest 15 signals in (b) and (c) are denoted by black triangles todemonstrate their identical spatial pattern within the PMBSF. Note that the diameter of a layer IV barrelin SI (whisker anatomical representation) is about 400 μm and that the area of activity evoked by a singlewhisker is large in proportion to the size of its barrel and the size of SI in general [compare panels (b) and(c) to left panel of (a)]. Panels (b) and (c) from Ref. 14. (d) Early VSD optical recordings of a PS evoked bya point stimulation consisting of 1 deg × 0.5 deg small drifting gratings in the VI cortex of the anesthetizedmonkey. 3-D frames of a spatiotemporal movie of the evoked activity spread from a 6 mm × 6 mm cort-ical area, as extrapolated from an array of photodiode traces. The last frame (230 ms) shows that thelateral spread of a PS is also large in the monkey VI cortex, extending beyond the recorded area. FromRef. 18.
Neurophotonics 031217-3 Jul–Sep 2017 • Vol. 4(3)
Frostig et al.: Imaging Cajal’s “neuronal avalanche”: how wide-field optical. . .
Downloaded From: http://neurophotonics.spiedigitallibrary.org/ on 06/12/2017 Terms of Use: http://spiedigitallibrary.org/ss/termsofuse.aspx
stimulation is larger than the underlying anatomical barrel of thesame whisker as recorded by both optical techniques. Single-unit studies by Armstrong-James, Fox and colleagues (reviewedby Fox16) during the 1980s provided supporting evidenceregarding the spread of evoked spiking to neighboringand sometimes second-order neighboring barrels followingsingle-whisker activation.
Optical recordings of PSs were also pursued in the auditorycortex. A pure tone is considered the analogous point stimu-lation for the auditory system as it activates a minimal area ofthe basilar membrane, equivalent to a whisker or point visualstimulation. Using VSD-based optical recordings in the audi-tory cortex of the anesthetized guinea pig, the authors obtaineda large PS following pure tone stimulation; more specifically,they reported that the VSD signals spread beyond the isofre-quency bands obtained by microelectrode recordings, thusindicating that large PSs can also be observed in the auditorycortex.17
In a seminal VSD-based optical recording study that focusedon the characterization of the PS in primary visual cortex (V1) ofthe anesthetized monkey, Grinvald et al.18 clearly demonstratedhow surprisingly large was the PS following a very small point(1 deg × 0.5 deg) stimulation of moving gratings, as comparedto what was known about the location of evoked spiking neuronsin V1 following such stimulation. While the peak VSD responsein the monkey primary visual cortex was located at the appro-priate retinotopic location in VI, the evoked activity beyond thepeak was observed to smoothly and progressively reduce itsamplitude as it propagated in all directions away from thepeak activity, extensively beyond the 6 mm × 6 mm diodearray recording window [Fig. 1(d)]. This study demonstratedthat even in monkey V1, one discovers the same cortical PScharacteristics as in the rodent: (1) a peak activity at the expectedtopographic location; (2) a large spatial extent of the PS, farbeyond what was known about the location of thalamicinput, topographic organization of the cortex, or location ofthe evoked single-unit recordings; and (3) a typically symmetricor near symmetric progressive and smooth decline in evokedamplitude over cortical distance away from the peak location.These findings including those from the auditory cortex sug-gested that PSs, while large, were still confined within the bor-ders of their associated primary sensory cortices.
3 Birth of Point Spread Optical ImagingThe modern era of actual imaging of cortical PSs (rather thanrecording evoked traces of optical activity employing a diodearray) by wide-field techniques was ushered in with the intro-duction of charge-coupled device (CCD)-based camera systemsfor ISOI and specialized camera systems that offered fast imag-ing speeds required for VSDOI. For the first time, one couldemploy these new camera systems to obtain actual high-resolu-tion images of the PS and its spatiotemporal dynamics. Theintroduction of these camera systems also enabled for thefirst time to directly obtain wide-field imaging of large areasof the cortex without mounting the CCD camera on a micro-scope—a major advantage especially for the wide-field imagingof large brains, such as those of cats and monkeys. Thereafter,progressive improvements in camera sensitivity and speedresulted in a significant reduction in the amount of averagingrequired to acquire PS images. These improvements were alsoparalleled by progressive improvements in VSDs sensitivity.The early optical recording studies required the averaging of
hundreds of trials for VSD [Fig. 1(c)] or intrinsic signal[Fig. 1(b)] recordings, whereas subsequent PS imaging withboth optical techniques required only a few trials to obtain agood signal-to-noise quality image of the PS; for ISOI and sin-gle-trial VSDOI examples see Refs. 19 and 20.
It is important to emphasize that there are many sources ofvariability that can influence the amplitude, shape, and extent ofthe evoked PS as characterized by optical imaging techniques.These include potential differences due to different species orstrains of a given species; stimulation parameters (amplitude,duration, speed, orientation, direction, and frequency of stimu-lation); type of dye employed (VSDOI); breathing and heartbeatartifacts; various blood vessel artifacts; wavelength of illumina-tion (ISOI); type of anesthesia; and various movement artifactsin awake animals. Another major source of variability amongreports from different labs is the parameter chosen for theimage analysis, such as the filtering, smoothing, cropping,thresholding, and choice of statistics applied for the quantifica-tion of the imaged data. Finally, differences in sensitivity, signal-to-noise, and speed of different imaging systems could also con-tribute to the variability. Nevertheless, despite the large varietyof variability sources, general conclusions about the PS charac-teristics can be drawn, as described in the following sections,attesting to PS ubiquity and relevance.
4 Optical Imaging of the Point Spread
4.1 Large Spatial Extent of the Point Spread:Further Characterization
It is important to note that for the vast majority of optical im-aging studies, the PS and, in particular, its entire spatial extentwas rarely the intended subject of research. Indeed, it has beenfortuitous for researchers interested in the PS that some popularsensory stimuli such as a single whisker or a pure tone also con-stitute point stimulations. In many functional imaging reports,there was no intention to quantify the spatial extent of thePS. Consequently, in some reports, the information about thespatial extent of the PS could be gleaned only from the scalebar that accompanied the image of the PS. In other reports,the size of the PS spatial extent could be inferred from the super-position of the PS image on the underlying map of cortical archi-tecture, such as cytochrome oxidase maps. Moreover, even ifquantified, there was no standard way to compare the spatialextent of PSs across different sensory cortical areas withinthe same species or across different species [see Fig. 1(a)];for example, should comparisons be made on an absolutescale in units of millimeters, or on a relative scale in units ofpercentage relative to either the entire area of a given primarysensory cortex or perhaps the area of the entire cortical hemi-sphere? Compounding this issue is the difficulty in determininghow similar is the stimulus between the different point stimu-lations being used because: (i) typically, the description ofthe point stimulation is less than complete (e.g., a single whiskerwas stimulated, but what was the angle of deflection?) and(ii) there is ambiguity in identifying the equivalent stimulationparameters across the different sensory modalities (e.g., a par-ticular lumens for visual stimulation versus a particular dB forauditory stimulation versus a particular angular displacement forsomatosensory stimulation). Finally, it is not clear what criteriashould be used to decide where evoked activity is still significantover spontaneous activity, criteria that can strongly influence thesize of the reported spatial extent of the PS. Nevertheless,
Neurophotonics 031217-4 Jul–Sep 2017 • Vol. 4(3)
Frostig et al.: Imaging Cajal’s “neuronal avalanche”: how wide-field optical. . .
Downloaded From: http://neurophotonics.spiedigitallibrary.org/ on 06/12/2017 Terms of Use: http://spiedigitallibrary.org/ss/termsofuse.aspx

despite all the above-mentioned issues, a picture emergesregarding the large spatial extent of the PS and its ubiquity indifferent sensory cortices of different species.
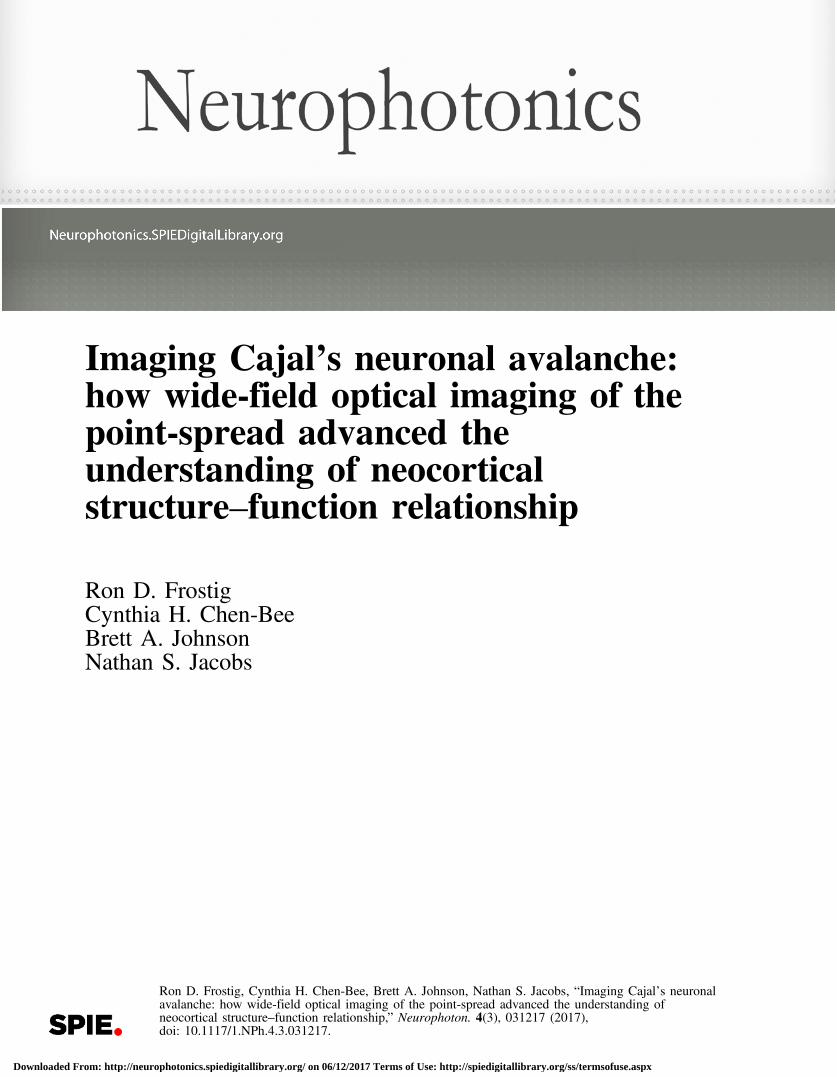
By employing a CCD camera system that permitted the direct(i.e., without a microscope) wide-field imaging of intrinsic sig-nals in the anesthetized rat primary somatosensory cortexthrough the thinned skull, Masino et al.21 achieved the first opti-cal imaging of a PS; more specifically, a PS evoked by stimu-lating a single whisker. In order to create an image of a 3 × 3
matrix of neighboring whisker PSs (each stimulated and imagedseparately), Masino et al.21 needed to apply a high activitythreshold of 2% to 5% of peak evoked optical activity ofeach whisker PS to exclude areas of overlap with the other single
whisker PSs [Fig. 2(a), top right panel]. Without thresholding,however, the total spatial extent of a single whisker PS can beseen and its spatial extent is rather large22 [see Fig. 2(a), leftpanel], ∼15 mm2 and thus, 2 orders of magnitude larger thanthe ∼0.15 mm2 area for a single whisker barrel23 [compareleft panel and bottom right panel of Fig. 2(a); see also Fig. 1(a),left panel, for approximate size of rat SI]. The initial imagingstudies of single whisker PSs strongly suggested that a singlewhisker PS has an even larger spatial extent than indicatedby prior optical recording experiments, a PS that extends farbeyond its own barrel and neighboring barrels22 resulting inhighly overlapping whisker PSs.24 Since then, as long as aquantification threshold was employed that permitted a more
Fig. 2 Cortical PSs in various primary sensory cortices of the anesthetized rat as imaged with ISOI.(a) The large spatial extent of a PS in SI as evoked by a single whisker. Upper right: nine whiskers(B1, B2, B3, C1, C2, C3, Dl, D2, and D3) were individually stimulated and imaged through the thinnedskull. The region of strongest activation was determined for each whisker (plotted in hot colors) and com-piled into the composite image as shown here. Lower right: Photomontage of the cytochrome oxidasestaining of the anatomical representations in layer IV cortex for the same nine whiskers from the same ratthat underwent imaging. Note the similarity in the relative size and location of the whisker representationsas determined by imaging versus anatomy. From Ref. 21. Left: ISOI data from a single whisker (C2) ischosen and a transformation from a 2-D view of the data (specifically containing only peak activity) to a3-D view of the data from the entire recorded area is shown here. The white dotted horizontal line is usedto illustrate the level of high thresholding needed in order to isolate only the peak activity, as shown in thetop right panel. Note that a high thresholding can lead to an incomplete view of the PS by excluding mostof the PS (barrel of C2 ∼0.15 mm2, imaged PS ∼15 mm2). Also note the large spatial extent of a singlewhisker PS relative to the size of the entire SI [see Fig. 1(a), left panel]. Modified from Chen-Bee andFrostig.22 (b) The large spatial extent of a PS for other examples of point stimulation. Left: PS in SI evokedby a somatosensory point stimulus delivered to the fur located on the knuckle of the 4th forepaw digit. Thestimulus consisted of five pulses delivered at 5 Hz, each pulse duration ¼ 10 ms. Middle: PS in VIevoked by a visual point stimulus delivered to the eye. The stimulus consisted of a white LED point(0.35 deg × 0.35 deg) delivered in five 10-ms pulses at 5 Hz. The “break” in the smooth declineof the left side of the PS originates from a blood vessel artifact. Right: PS in AI evoked by an auditorypoint stimulus delivered to the ear. The stimulus consisted of five pure tone pips (8 KHz, 87 dB, 100ms on100 ms off) delivered at 5 Hz. Note that large PSs were observed in all three primary sensory regions[compare to Fig. 1(a), left panel] and also note their similarity. Chen-Bee and Frostig unpublished data.
Neurophotonics 031217-5 Jul–Sep 2017 • Vol. 4(3)
Frostig et al.: Imaging Cajal’s “neuronal avalanche”: how wide-field optical. . .
Downloaded From: http://neurophotonics.spiedigitallibrary.org/ on 06/12/2017 Terms of Use: http://spiedigitallibrary.org/ss/termsofuse.aspx

comprehensive inclusion of the spatial extent25 the Frostig labcontinued to find a large PS evoked by a single whisker;10,23,26,27
for mouse, see Ref. 28.Employing ISOI, Das and Gilbert29 were the first to image a
large PS (diameter ranging between 3.2 to 5.2 mm) in the anes-thetized cat primary visual cortex following a point stimulus(line segment 0.5 deg). Sharon et al.2 were the first to employVSDOI to image the PS from the anesthetized cat visual cortexand they also found a large PS (∼7 mm × 5 mm)—followinga 4-deg diameter of moving gratings stimulation—peakingover the expected retinotopic cortical area. In the first applica-tion of ISOI in the auditory cortex of a rat in response to a puretone, Bakin et al.30 imaged a large auditory PS (4 mm × 2 mm)following 45-dB pure tone (23 KHz) stimulation [see Fig. 1(a),left panel for approximate size of rat A1], findings which werelater replicated by Tsytsarev and Tanaka.31 Additionally, largePSs were imaged with ISOI or VSDOI from the auditory cortexof ferrets,32 cats,33 and guinea pigs.34
The ferret ISOI study also demonstrated that the PS spatialextent could depend on the magnitude of the stimulation: thestronger the stimulation magnitude of the PS the larger theareal extent of the PS; at 70 and 80 dB, large areas coveringthe entire auditory cortex could be activated, as also shown inthe cat auditory cortex33 and using VSDOI imaging in the guineapig auditory cortex.34 Areal extent and amplitude of the whiskerPS were also progressively dependent on stimulation strength.Petersen et al.35 demonstrated that a very weak (0.6 deg) whiskerstimulation evoked a low amplitude PS that lasted for a shortduration and spread over a relatively small area of the cortex(just above the appropriate barrel area). Stronger stimulationamplitudes (2 and 6 deg) evoked a progressively stronger ampli-tude, longer duration, and larger spread, respectively. The 6-degstimulation—still a relatively weak whisker stimulation for theawake, behaving rodent36—resulted in a large PS over the entirePMBSF;35 see also Berger et al.37 and Deneux and Grinvald38 forsimilar findings regarding the spatial extent of the PS followingdifferent whisker stimulation amplitudes. However, the amplitudeof the stimulation is unlikely a major variable that explains thelarge spatial extent, despite differences in anesthetic agent, stimu-lus type (e.g., mechanical, air-puffs, magnetic), stimulationparameters and image analysis techniques, similar large-scale(most or the entire PMBSF, or even larger than PMBSF) whiskerPSs were reported employing both imaging techniques when thewhisker stimulation was at least of a moderate amplitude as canbe inferred from rat studies by Blood et al.;39 Jones et al.;40
Derdikman et al.;41 Devor et al.;42 Nemoto et al.;43 Civillicoand Contreras;44,45 Lippert et al.;46 Devonshire et al.;47 Lustiget al.;48 and Ollerenshaw et al.;49 and in the mouse Prakashet al.;28 Petersen et al.;35 Ferezou et al.;20,50 Berger et al.;37
Lim et al.;51 and Mohajerani et al.52
In most studies, the PSs were imaged in or near the center ofthe cortical area of interest and typically, PSs peaking near bor-ders with other cortical areas were rare. Such preferences couldbias interpretations regarding general characteristics of differentPSs. Case in point are whisker PSs in the PMBSF. In most stud-ies, single-whisker PSs were recorded or imaged followingstimulation of whiskers located at the center of the whiskerarray on the snout and therefore, due to the somatotopic map-ping of these whiskers, at the center of the PMBSF [e.g.,whisker C2 barrel shown in Fig. 3(a)], whereas whisker PSswhose barrels are localized near the border of the PMBSF (bor-der whisker PSs) remained rarely imaged. For example, whisker
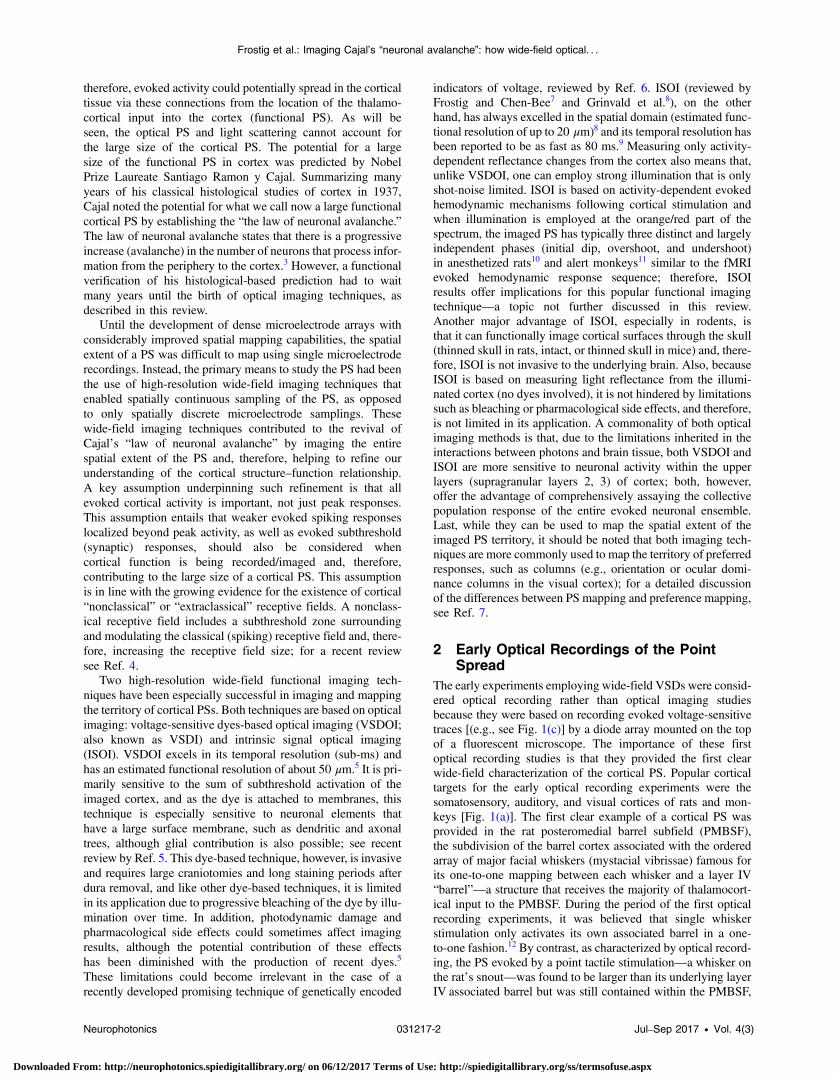
Fig. 3 Electrophysiological confirmation of the large spatial extent ofthe PS in rat SI. Representative case of single units (SU) and LFPresponses evoked by whisker A2 stimulation as recorded using aneight-electrode array arranged in a straight line. (a) Schematic ofcortical cytoarchitecture based on flattened layer IV CO-stainedbrain slice. Barrels A2, C2, and E2 are highlighted in colors.MCx, motor cortex; VCx, visual cortex; ACx, auditory cortex; SII, sec-ondary somatosensory cortex; DZ, dysgranular zone cortex; PV,parietal ventral cortex; IC, insular cortex. (b) Lesions produced bythe eight-electrode array. Note electrode #1 lesion is located atthe A2 barrel while electrodes 2 to 3 are located in the dysgranularzone, and electrodes 4 to 8 span almost the entire auditory cortex(ACx). (c) Evoked SUs (averaged from 128 trials) decay over corticaldistance and completely disappear after electrode 4. (d) EvokedLFPs, recorded from the same microelectrodes, also decay over dis-tance but are still present at the last electrode. (e) Evoked LFPs areabolished in electrodes 7 to 8 (red traces) after lidocaine injectionbetween electrodes 7 and 8, with full recovery after 45 min (f).(g) Control saline injection had no effect. Bottom, magnification oftraces boxed in (d)–(f). From Ref. 58.
Neurophotonics 031217-6 Jul–Sep 2017 • Vol. 4(3)
Frostig et al.: Imaging Cajal’s “neuronal avalanche”: how wide-field optical. . .
Downloaded From: http://neurophotonics.spiedigitallibrary.org/ on 06/12/2017 Terms of Use: http://spiedigitallibrary.org/ss/termsofuse.aspx
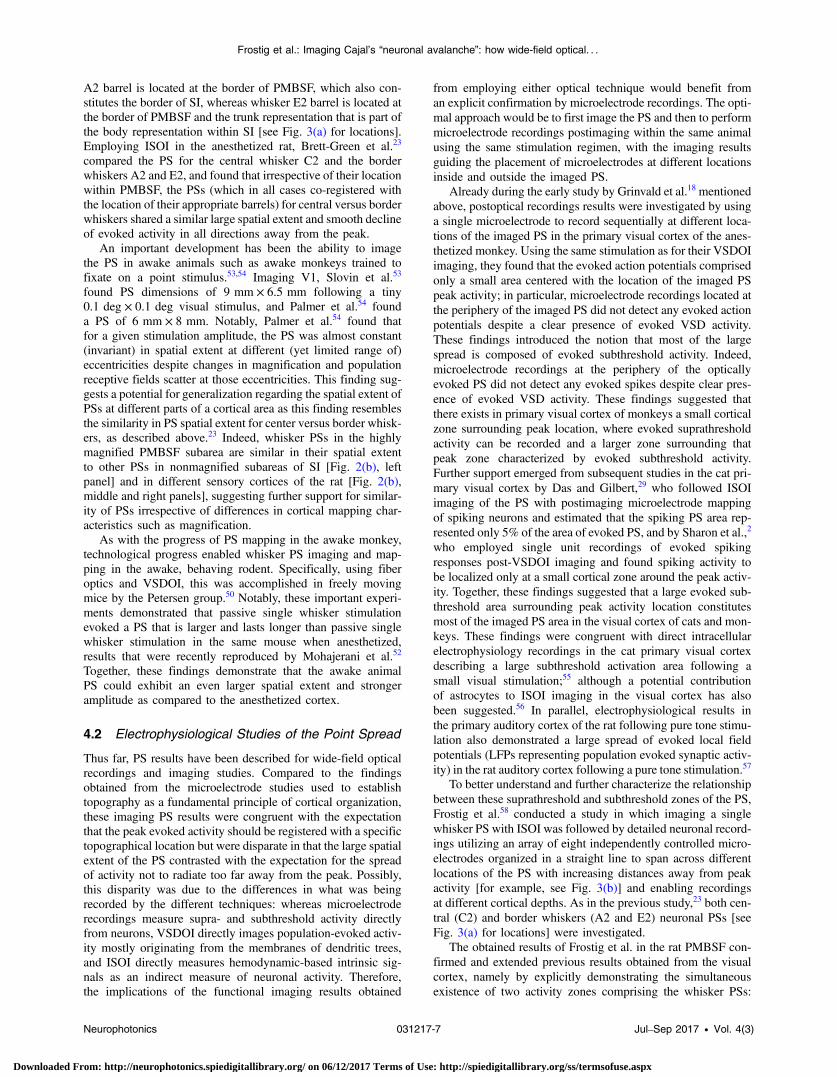
A2 barrel is located at the border of PMBSF, which also con-stitutes the border of SI, whereas whisker E2 barrel is located atthe border of PMBSF and the trunk representation that is part ofthe body representation within SI [see Fig. 3(a) for locations].Employing ISOI in the anesthetized rat, Brett-Green et al.23
compared the PS for the central whisker C2 and the borderwhiskers A2 and E2, and found that irrespective of their locationwithin PMBSF, the PSs (which in all cases co-registered withthe location of their appropriate barrels) for central versus borderwhiskers shared a similar large spatial extent and smooth declineof evoked activity in all directions away from the peak.
An important development has been the ability to imagethe PS in awake animals such as awake monkeys trained tofixate on a point stimulus.53,54 Imaging V1, Slovin et al.53
found PS dimensions of 9 mm × 6.5 mm following a tiny0.1 deg × 0.1 deg visual stimulus, and Palmer et al.54 founda PS of 6 mm × 8 mm. Notably, Palmer et al.54 found thatfor a given stimulation amplitude, the PS was almost constant(invariant) in spatial extent at different (yet limited range of)eccentricities despite changes in magnification and populationreceptive fields scatter at those eccentricities. This finding sug-gests a potential for generalization regarding the spatial extent ofPSs at different parts of a cortical area as this finding resemblesthe similarity in PS spatial extent for center versus border whisk-ers, as described above.23 Indeed, whisker PSs in the highlymagnified PMBSF subarea are similar in their spatial extentto other PSs in nonmagnified subareas of SI [Fig. 2(b), leftpanel] and in different sensory cortices of the rat [Fig. 2(b),middle and right panels], suggesting further support for similar-ity of PSs irrespective of differences in cortical mapping char-acteristics such as magnification.
As with the progress of PS mapping in the awake monkey,technological progress enabled whisker PS imaging and map-ping in the awake, behaving rodent. Specifically, using fiberoptics and VSDOI, this was accomplished in freely movingmice by the Petersen group.50 Notably, these important experi-ments demonstrated that passive single whisker stimulationevoked a PS that is larger and lasts longer than passive singlewhisker stimulation in the same mouse when anesthetized,results that were recently reproduced by Mohajerani et al.52
Together, these findings demonstrate that the awake animalPS could exhibit an even larger spatial extent and strongeramplitude as compared to the anesthetized cortex.
4.2 Electrophysiological Studies of the Point Spread
Thus far, PS results have been described for wide-field opticalrecordings and imaging studies. Compared to the findingsobtained from the microelectrode studies used to establishtopography as a fundamental principle of cortical organization,these imaging PS results were congruent with the expectationthat the peak evoked activity should be registered with a specifictopographical location but were disparate in that the large spatialextent of the PS contrasted with the expectation for the spreadof activity not to radiate too far away from the peak. Possibly,this disparity was due to the differences in what was beingrecorded by the different techniques: whereas microelectroderecordings measure supra- and subthreshold activity directlyfrom neurons, VSDOI directly images population-evoked activ-ity mostly originating from the membranes of dendritic trees,and ISOI directly measures hemodynamic-based intrinsic sig-nals as an indirect measure of neuronal activity. Therefore,the implications of the functional imaging results obtained
from employing either optical technique would benefit froman explicit confirmation by microelectrode recordings. The opti-mal approach would be to first image the PS and then to performmicroelectrode recordings postimaging within the same animalusing the same stimulation regimen, with the imaging resultsguiding the placement of microelectrodes at different locationsinside and outside the imaged PS.
Already during the early study by Grinvald et al.18 mentionedabove, postoptical recordings results were investigated by usinga single microelectrode to record sequentially at different loca-tions of the imaged PS in the primary visual cortex of the anes-thetized monkey. Using the same stimulation as for their VSDOIimaging, they found that the evoked action potentials comprisedonly a small area centered with the location of the imaged PSpeak activity; in particular, microelectrode recordings located atthe periphery of the imaged PS did not detect any evoked actionpotentials despite a clear presence of evoked VSD activity.These findings introduced the notion that most of the largespread is composed of evoked subthreshold activity. Indeed,microelectrode recordings at the periphery of the opticallyevoked PS did not detect any evoked spikes despite clear pres-ence of evoked VSD activity. These findings suggested thatthere exists in primary visual cortex of monkeys a small corticalzone surrounding peak location, where evoked suprathresholdactivity can be recorded and a larger zone surrounding thatpeak zone characterized by evoked subthreshold activity.Further support emerged from subsequent studies in the cat pri-mary visual cortex by Das and Gilbert,29 who followed ISOIimaging of the PS with postimaging microelectrode mappingof spiking neurons and estimated that the spiking PS area rep-resented only 5% of the area of evoked PS, and by Sharon et al.,2
who employed single unit recordings of evoked spikingresponses post-VSDOI imaging and found spiking activity tobe localized only at a small cortical zone around the peak activ-ity. Together, these findings suggested that a large evoked sub-threshold area surrounding peak activity location constitutesmost of the imaged PS area in the visual cortex of cats and mon-keys. These findings were congruent with direct intracellularelectrophysiology recordings in the cat primary visual cortexdescribing a large subthreshold activation area following asmall visual stimulation;55 although a potential contributionof astrocytes to ISOI imaging in the visual cortex has alsobeen suggested.56 In parallel, electrophysiological results inthe primary auditory cortex of the rat following pure tone stimu-lation also demonstrated a large spread of evoked local fieldpotentials (LFPs representing population evoked synaptic activ-ity) in the rat auditory cortex following a pure tone stimulation.57
To better understand and further characterize the relationshipbetween these suprathreshold and subthreshold zones of the PS,Frostig et al.58 conducted a study in which imaging a singlewhisker PS with ISOI was followed by detailed neuronal record-ings utilizing an array of eight independently controlled micro-electrodes organized in a straight line to span across differentlocations of the PS with increasing distances away from peakactivity [for example, see Fig. 3(b)] and enabling recordingsat different cortical depths. As in the previous study,23 both cen-tral (C2) and border whiskers (A2 and E2) neuronal PSs [seeFig. 3(a) for locations] were investigated.
The obtained results of Frostig et al. in the rat PMBSF con-firmed and extended previous results obtained from the visualcortex, namely by explicitly demonstrating the simultaneousexistence of two activity zones comprising the whisker PSs:
Neurophotonics 031217-7 Jul–Sep 2017 • Vol. 4(3)
Frostig et al.: Imaging Cajal’s “neuronal avalanche”: how wide-field optical. . .
Downloaded From: http://neurophotonics.spiedigitallibrary.org/ on 06/12/2017 Terms of Use: http://spiedigitallibrary.org/ss/termsofuse.aspx

a suprathreshold and a subthreshold—both of which registeredwith the peak, with the latter being much larger than and sur-rounding the former [Figs. 3(c) and 3(d)]. Evoked suprathres-hold whisker PS amplitude progressively declined overcortical distance away from peak activity as far as 1.5 mmaway in >50% of rats [see PSTHs in Fig. 3(c)], which wouldbe equivalent to a circular areal extent of 7.1 mm2 and as far as2.5 mm maximal distance, which would be equivalent to a cir-cular areal extent of 19.6 mm2. The evoked subthreshold (LFP)whisker PS also showed a progressive decline of its amplitudeover cortical distance away from peak activity [Fig. 3(d)], butunlike the evoked suprathreshold case, evoked subthresholdPS always reached the last microelectrode (3.5 mm awayfrom peak PS, a radial distance equivalent to a circular arealextent of 38.5 mm2 at the last microelectrode). Notably, theLFP amplitude at the last microelectrode was still, on average,11% of the peak amplitude, suggesting that the evoked LFP mayradiate even farther than 3.5 mm from the peak. These findingson the extent of the subthreshold PS were obtained irrespectiveof recording array direction away from peak location, its corticaldepth, or whether recordings were obtained from central or bor-der whisker PSs. As with previous ISOI results in the PMBSF,both suprathreshold and subthreshold PSs were symmetricallyspreading away from peak location, and the only differenceamong different whisker PSs was the location of their peak.Notably, targeted injections of sodium channel blocker lidocaineinto the territory of the last microelectrodes (3.0 to 3.5 mm awayfrom peak) completely flattened evoked LFPs at these distant
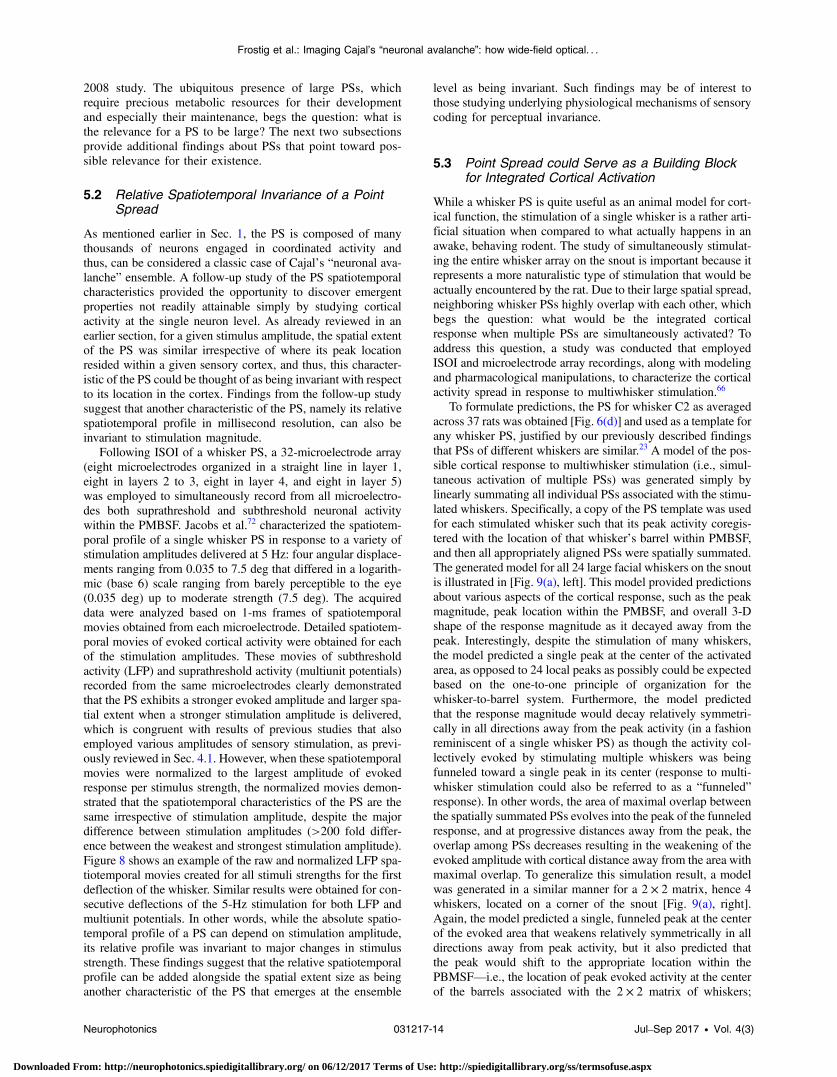
locations, clearly demonstrating that the large subthresholdPS is not a case of “volume conductance” artifact but rathera case of actual long-range subthreshold neuronal activation[Figs. 3(e)–3(g)]. In addition, thin gray-matter transectionsbetween the array’s middle microelectrodes resulted in flatten-ing of the evoked LFP amplitude to noise level for microelectr-odes located beyond the transection line, directly demonstratingfor the first time that evoked single whisker subthresholdactivity spreads horizontally through cortical gray matter(Fig. 4).
4.3 Point Spread and the Underlying CorticalCytoarchitecture
Optical imaging and electrophysiological results summarized inthe previous two subsections support the notion that an evokedPS can be very large, with an activity amplitude smoothlydecaying to far distances in all directions away from thepeak. Because the peak for any given PS is registered at thetopographically correct cortical location, the findings of alarge and relatively symmetrical spatial extent even for PSswhose peaks are located at the border of a sensory corticalregion introduced the possibility of a PS to extend outside itsassociated sensory cortical region and perhaps even into regionsof other sensory modalities. In the Frostig et al. study58 alreadyreviewed in the previous section, it should be noted that immedi-ately following the single unit and LFP recordings acquiredfrom the microelectrode array, the authors performed localizedlesions to mark the location of the recording microelectrodes inorder to explicitly compare the spread of activity to the under-lying cortical cytoarchitecture as stained with cytochrome oxi-dase (CO). In doing so, they were able to directly demonstratethat stimulating border whisker A2 resulted in an evoked sub-threshold PS that not only spanned the dysgranular area sur-rounding SI but also, and more surprisingly, continued andspanned the entire auditory cortex [Fig. 3(b)]. Indeed, as seenin [Fig. 3(b)], only the first microelectrode of the array waslocated within the PMBSF (above the A2 barrel) and, therefore,still within the SI territory, whereas the remaining seven micro-electrodes in the array were located outside the SI territory.Notably, microelectrodes 2 to 3 were located in the dysgranularzone and microelectrodes 4 to 8 spanned almost the entire audi-tory cortex. Furthermore, even stimulating the central whiskerC2, whose barrel is located at the center of the PMBSF and,therefore, farther away from the SI border, still evoked alarge subthreshold PS that crossed dysgranular areas to invadeparts of the visual and auditory cortices. Similarly, stimulatingwhisker E2 on the opposite side of C2 [refer to locations inFig. 3(a)] resulted in a subthreshold PS that spanned thetrunk representation of SI and reached the border of primarymotor cortex MI. These findings suggested that in order tokeep a single whisker PS relatively symmetric and similar inspatial extent (see previous two subsections) irrespective ofwhich whisker was stimulated, it was necessary for a givenPS to cross cytoarchitectural cortical borders. Furthermore,these findings also suggested that as the difference betweenwhisker PSs is only in the location of their evoked peak, thecloser the peak activity location of a whisker PS is to a cytoarch-itectonic cortical border, the deeper the whisker PS invades intoother cortical areas that are located closest to the border.
Further supporting evidence was obtained in the mousePMBSF by the Petersen lab employing VSDOI. When the entiremouse hemisphere was imaged in awake, head-fixed mice, two
Fig. 4 Evoked LFP following single whisker C2 stimulation spreadshorizontally within cortical gray matter. An eight-electrode array isused to record LFPs from the anesthetized rat cortex, with electrode#1 coregistering with whisker C2 barrel. Layers 2 to 3 LFP amplitudesdeclining over cortical distance (denoted on the x -axis as electrodenumber, with 0.5 mm between electrodes) as evoked by whiskerC2 stimulation (black line plot) were almost abolished at electrodes5 to 8 (green line plot) after thin gray matter transection between elec-trodes 4 and 5 (black arrows), an effect not observed after an earliertransection parallel to the electrode array (purple line plot). Inset:Nissl-based micrograph of the gray matter transection (arrows);scale bar ¼ 500 μm. From Ref. 58.
Neurophotonics 031217-8 Jul–Sep 2017 • Vol. 4(3)
Frostig et al.: Imaging Cajal’s “neuronal avalanche”: how wide-field optical. . .
Downloaded From: http://neurophotonics.spiedigitallibrary.org/ on 06/12/2017 Terms of Use: http://spiedigitallibrary.org/ss/termsofuse.aspx

important aspects were revealed: the whisker PS did notstop at the borders of PMBSF, and a second PS was imagedin the motor cortex that was found to be spreading awayfrom the stimulated whisker anatomical motor representation.Specifically, within 40 ms of active whisker stimulation (hittingan object with single whisker), the entire surface of the imagedhemisphere was activated as a result of the merging of bothsomatosensory and motor PSs as the evoked activity radiatedaway from their respective peak activity locations;20 seeFig. 5. Clearly, the whisker PS in this case was spreading farbeyond borders of their respective PMBSF and motor cortexand thus, trespassing deeply into other cortical areas, althoughthe authors did not identify the different cortical areas activatedby these PSs. Similar VSDOI imaging results supporting thespread beyond the border of PMBSF by a whisker PS wereobtained by the Murphy lab52 and recently reproduced by thePetersen lab.59 In addition, similar results about the spreadbeyond borders can also be seen in the mouse when imagedwith genetically encoded indicators of voltage.60 Together,these findings demonstrate that there are two additional charac-teristics shared between imaged PS and subthreshold PS, whichlend further support to the notion that subthreshold activityunderlies imaging PS: (1) both types of PSs cross bordersand (2) both invade into other cortical areas.
4.4 Relationship between Functional andAnatomical Point Spread
The functional results obtained with optical imaging andelectrophysiology recordings summarized so far raise an impor-tant question: what could be the underlying anatomical systemresponsible for supporting the large horizontal spread of PSs?The earlier imaging and electrophysiological studies byGrinvald et al.18 in the monkey visual cortex and Das andGilbert29 in the cat visual cortex proposed that cortical long-range horizontal projection within gray matter could constitutethe underlying system supporting the PS spread of activity.Several studies were conducted to address this possibility inthe PMBSF, but the challenge in this case was the need to dem-onstrate whether such an anatomical system could support thefunctional findings, i.e., a case of a system of long-range hori-zontal projections that are capable of crossing cytoarchitecturalborders and, therefore, spatially match with the imaged and
electrophysiological PSs, although the option of multisynapticprojections could also be relevant.
In the Frostig et al. electrophysiological recording study,58
localized (point) injections of the anterograde tract-tracer bioti-nylated dextran amine (BDA) were deposited into imaged peakactivity locations as a means to characterize the underlyinganatomy of the PS for a single whisker. Findings showedclear spread of axons or axon collateral segments diffusely pro-jecting to all directions away from the PMBSF injection site.The point injection and the resulting spread of projections con-stitute the cortical anatomical PS. The density of the anatomicalPS labeled axon segments declined over cortical distance, indi-cating that the anatomical PS is composed of short, medium, andlong-range axonal projections. Congruent with results obtainedby optical imaging techniques and microelectrode array record-ings, such axonal projections also clearly ignored cytoarchitec-tonic borders by trespassing into the auditory and visual corticesas identified by layer IV flattened cortex cytochrome oxidasestaining of the same rat. After crossing the dysgranular areaseparating PMBSF and visual cortex, traced axonal projectionreached 2.5 mm in length spanning into visual cortex. In addi-tion, the authors found dense staining locations of known area-to-area projections through white matter from the PMBSF intoexpected targets such as secondary somatosensory cortex (SII),dysgranular cortex (ParP, posterior parietal), motor cortex, andinsular cortex.
The preliminary anatomical results demonstrating the exist-ence of horizontal long-range, border crossing, diffuse projec-tion system within the gray matter were followed up andextended by a detailed study of this projection system in thePMBSF by Stehberg et al.61 Using anterograde tract-tracerBDA, injections and detailed mappings of axonal projectionsat different locations within PMBSF, a clear pattern emergedthat supported imaging and electrophysiological PS mappingfindings. These findings suggested that irrespective of BDAinjection location within PMBSF, two major systems can beclearly described: (1) the traditional area-to-areas system,where axons project through white matter into specific areas(e.g., SII, PVT) and (2) a diffuse, apparently nonspecific projec-tion system within gray matter that projects to all directions andincludes very long, border crossing horizontal projections, seeFigs. 6(a)–6(c) for a schematic view of these systems.
Johnson and Frostig62,63 further extended the BDA findingsby employing detailed qualitative and quantitative analysis of
Fig. 5 The large PS following active whisker C2 stimulation as imaged with VSDOI. A single-trial exam-ple of active touch imaged in an awake mouse. The C2 whisker actively touches an object (upper rowimage sequence), evoking a PS first in the somatosensory cortex and then in the motor cortex (lower rowimage sequence). Note after 40 ms activity is detected over the entire hemisphere. From Ref. 20;reprinted from Neuron, 56(5), Ferezou et al., Spatiotemporal dynamics of cortical sensorimotor integra-tion in behaving mice, 907-923, Copyright (2007), with permission from Elsevier.
Neurophotonics 031217-9 Jul–Sep 2017 • Vol. 4(3)
Frostig et al.: Imaging Cajal’s “neuronal avalanche”: how wide-field optical. . .
Downloaded From: http://neurophotonics.spiedigitallibrary.org/ on 06/12/2017 Terms of Use: http://spiedigitallibrary.org/ss/termsofuse.aspx

the anatomical PS within PMBSF using modern tract-tracingtechniques. Specifically, discrete deposits of adeno-associatedvirus (AAV) were injected into the supragranular or infragranu-lar layers of the PMBSF. The AAV vectors used either the directexpression of enhanced green fluorescent protein (GFP) undercytome-galovitus (CMV) or enhanced yellow fluorescent pro-tein under a calcium/calmodulin-dependent protein kinase IIα(CaMKIIα), with the former labeling all types of neurons andthe latter labeling only excitatory neurons. The detailed quali-tative and quantitative analysis of the anatomical PS for both
types of vectors confirmed and further extended previous resultsof Frostig et al.58 and Stehberg et al.61 Analysis revealed ana-tomic PS of labeled axons diffusely radiating in all directionsfor distances >3.5 mm originating both from supragranularand infragranular injections with declining density over corticaldistance—patterns that were common to both types of vectors.Detailed reconstruction of single axons originating from eachinjection site demonstrated how projections radiated awayfrom the injection site and across the PMBSF, branched andsometimes crossed into other sensory cortices as identified by
Fig. 6 Proposed model of anatomical projections for rat PMBSF and comparison between anatomicalversus functional PS as imaged with ISOI. (a–c) Schematic of the proposed distinction between a specificversus a diffuse system of anatomical projections for the rat PMBSF. Schematics depict relevant corticalareas (a) to be compared to the proposed diffuse system of long-range border crossing projections(b) and the more familiar, specific system of main outputs projections (c). VI, primary visual cortex;AI, primary auditory cortex; SI, primary somatosensory cortex; SII, secondary somatosensory cortex;dys, dysgranular cortex; PMBSF, posteromedial barrel subfield of SI; PVT, parietoventral cortex.From Ref. 61. (d) and (e) The similarity between functional PS and anatomical PS of a single whisker.(d) Functional PS. Evoked activity spreads horizontally for long distances following single whisker stimu-lation. The intrinsic signal optical imaging response following stimulation of the C2 whisker (the first500 ms containing the maximal areal extent of the initial dip activity) was averaged across 37 rats,as described by Chen-Bee et al.66 and was plotted as a false-color image of fractional change relativeto prestimulus values. The “outer circle” has a diameter of 7 mm and represents an extrapolation of thefarthest electrode used in the recordings of Frostig et al.,58 at which an evoked field potential responsecould be detected in 100% of animals. Black outlines show locations of whisker barrels and cytoarch-itectonic areas that were detected by cytochrome oxidase staining in a representative animal. Trunk,trunk region of primary somatosensory cortex; VCx, visual cortex; ACx, auditory cortex.(e) Anatomical PS. Average density of projection pattern across all brains and section depths for supra-granular injections of AAV-CMV-GFP. After averaging across four section depths, data arrays corre-sponding to the 7.2-mm diameter analysis region were re-expressed for each of the nine brainsinjected with AAV-CMV-GFP in supragranular layers. The re-expressed arrays were then averagedacross the nine brains to reveal a largely symmetrical axonal radiation in which axonal density declineswith distance from the injection site. Scale: white denotes no detectable projections, the transition fromgreen to yellow denotes the mean density across the analyzed region, and red denotes the maximumdensity across the region. From Ref. 63; Brain Structure and Function, Long, intrinsic horizontal axonsradiating through and beyond rat barrel cortex have spatial distributions similar to horizontal spreads ofactivity evoked by whisker stimulation, 221, 2016, 3617-3639, Johnson and Frostig, © Springer-VerlagBerlin Heidelberg 2015, With permission of Springer.
Neurophotonics 031217-10 Jul–Sep 2017 • Vol. 4(3)
Frostig et al.: Imaging Cajal’s “neuronal avalanche”: how wide-field optical. . .
Downloaded From: http://neurophotonics.spiedigitallibrary.org/ on 06/12/2017 Terms of Use: http://spiedigitallibrary.org/ss/termsofuse.aspx

the underlying layer IV cytochrome oxidase staining. The spa-tial similarity between functional and anatomical PSs is shownin Figs. 6(d) and 6(e). It should be noted that the anatomicalmapping results of the diffuse system constitute a conservativeestimate of the horizontal projections density, because this map-ping was achieved using 20×magnification and while more pro-jections could be seen with 100× magnification, the highermagnification was used only for full-length reconstruction ofsingle axons. Despite the conservative estimate, the anatomicalPS was still spatially matching the imaged and electro-physiological PSs by spanning distances in the order of severalmillimeters.
The combined BDA and AAV findings indicated that atleast for a single whisker in the rat PMBSF, the anatomicalPS [Fig. 6(e)] shared many characteristics with the imagedPS [Fig. 6(d)] or subthreshold electrophysiological recordings(Fig. 3). These include large and relatively symmetrical spatialextent, ability for border crossing and ability for trespassing intoother cortical areas, diffuse and smooth decline over cortical dis-tance. The BDA and AAVexperiments can be combined togetherwith the transection (Fig. 4) and lidocaine (Fig. 3) electrophysiol-ogy experiments of Frostig et al.58 to implicate the diffuse, horizon-tal system—composed of short, medium, and/or long-rangemonosynaptic and multiple synaptic projections—as the underly-ing anatomical PS supporting the functional PS as imaged by opti-cal imaging techniques and confirmed by electrode arrayrecordings. These findings also suggested that a large-scale, struc-ture–function spatial similarity exists involving the functional andanatomical PSs at the mesoscopic level of cortex.
4.5 Point Spread is a Dynamic Entity Capable ofContextual Modulation and Plasticity
As described above, the results from PS imaging and postimag-ing neuronal recording in the visual cortex and PMBSF of anes-thetized and awake animals suggested that the PS spatial extentis relatively constant (invariant) to its location within a givencortical area (i.e., different eccentricities in visual cortex, differ-ent barrels in PMBSF) for a given stimulus amplitude. However,the PS is a dynamic entity that can exhibit contextual modula-tion and plasticity. The dynamic nature of the PS was first dem-onstrated in the anesthetized monkey in the Grinvald et al. studyusing VSDOI.18 The visual cortex PS amplitude was alwaysattenuated by various patterns of flanking stimulations irrespec-tive of their size and orientation, although the degree of attenu-ation was dependent on these variables. Similar findings wereobserved in the awake monkey using ISOI. The PS amplitudewas attenuated following the presentation of identical, twoflanking PSs.64 Similar to the monkey, contextual interactionsamong PSs were observed in the PMBSF of the anesthetizedrat using ISOI. The amplitude of response to simultaneouslystimulating an entire array of whiskers was attenuated as com-pared to what might be expected based on a linear summation ofsingle-whisker PSs associated with each of the whiskers in thearray. In general, this amplitude attenuation was dependent onthe number of whiskers being stimulated: the more whiskersstimulated, the stronger the response attenuation (see moredetails below in Sec. 5.3).65,66 Similar findings were obtainedusing VSDOI for pairs of stimulated whiskers in the anesthetizedmouse and rat.44,48,67,68 Together, these studies suggested that
Fig. 7 Imaging PS plasticity using ISOI. Plasticity of a spared whisker’s functional PS is reversible uponrestoration of normal sensory input. (a) Schematic of the experimental design. (b) Examples of ISOIimages for the spared whisker PS obtained from a sensory-deprived animal that remained in itshome cage (top row) or was given an opportunity for spared whisker guided exploration outside itshome cage (bottom row) are taken before deprivation, after 28 days of deprivation, and after 28days of whisker regrowth. Ratio values are converted to grayscale values in which the prestimulus base-line is shown as gray, and the black and white values on the grayscale bar are set to a decrease orincrease of 2.5 × 10⁻⁴ from baseline values, respectively. For detailed analysis of the plasticity at allactivity levels of the spared whisker PS, see Ref. 69.
Neurophotonics 031217-11 Jul–Sep 2017 • Vol. 4(3)
Frostig et al.: Imaging Cajal’s “neuronal avalanche”: how wide-field optical. . .
Downloaded From: http://neurophotonics.spiedigitallibrary.org/ on 06/12/2017 Terms of Use: http://spiedigitallibrary.org/ss/termsofuse.aspx

attenuation by contextual modulation of the PS by flankingstimulations could be a general rule irrespective of corticalarea imaged, anesthesia versus awake preparation, and imagingtechnique, but more data are needed to further substantiate thispotential rule.
Awhisker PS can exhibit use-dependent plasticity of its spa-tial extent and amplitude when the rat’s environment changes.Repeated imaging supported by single unit recordings demon-strated that a spared whisker PS contracts its spatial extent andits amplitude diminishes when rats have the opportunity forwhisker-dependent scanning of an environment outside theircage.27,69 Conversely, its PS expands when the same singlespared whisker is only used inside its standard cage, and nochanges are found for control, nonspared whisker rats.Allowing the rest of the previously deprived whiskers to regrowto their original length results in the return of the single PS backto its baseline values (Fig. 7).69 Despite this strong case of plas-ticity, the basic characteristics of the PS, such as peaking at theexpected topographical location and the symmetrical decliningaway from the peak, remained intact. Moreover, even withoutdeprivation of whiskers—just allowing rats to live for 28days in a “naturalistic habitat” that promotes tunnel digging,interactions with other rats, and foraging activities—results inPS contraction and reduction in its amplitude as compared to con-trols that are housed in standard cages residing within the sameroom.27 While the findings were obtained after 28 days, cellularand molecular studies comparing rats living in a naturalistic hab-itat to matched standard cage controls in the same room showedthat plasticity can start as early as 2 days after transfer to the natu-ralistic environment,70 therefore, raising the possibility that futureimaging studies of whisker PS could detect such plasticity at shortperiods following transfer to the naturalistic habitat. However,extremely long, continuous living in the naturalistic habitat(∼13 months) showed no difference in PS spatial extent andamplitude compared to standard cage controls within the sameroom (Kvasnak and Frostig, unpublished results). Taken together,these findings suggest that while the whisker PS can exhibit sig-nificant experience dependent plastic changes, there seems to be aspatial extent and amplitude “set point” that it is returning to,implying a possibility for homeostatic control on the spatialextent and amplitude of the PS.
Additional supportive evidence regarding the behaviorallyrelevant dynamic nature of the whisker PS originated fromthe studies of the PMBSF in alert or behaving mice demonstrat-ing that the areal extent and amplitude of a whisker PS weredependent on a wakefulness state and the behavioral context.Passive whisker stimulation during quiet wakefulness resultedin a larger, stronger PS during wakefulness as compared tothe PS in the same mouse when anesthetized.50 Similarly,Mohajerani et al.52 replicated these findings and extendedthem by demonstrating that the large PS imaged in auditory cor-tex in response to pure tone during quiet awake state hasstronger amplitude and lasts longer compared to the PS evokedby an identical stimulus in the same mouse when anesthetized.Furthermore, whisker PS became smaller and exhibited weakeramplitude during active whisking in the air, yet became largeand strong again (similar to quiet wakefulness) following anactive whisker touch.50 Recently, in the Petersen lab, VSDOIimaging was used to image the cortex of mice trained in a sim-ple, goal directed learning task: to lick a water reward spout aftera 1-ms deflection of a single whisker. Hit trials, in which themouse licked after a whisker stimulus, were accompanied by
a larger whisker PS compared to miss trials. Prestimulus whisk-ing decreased behavioral performance by increasing the fractionof miss trials, and these miss trials had attenuated corticalresponses, a strong example of behavioral modulation ofthe PS.59
5 Additional Findings Pointing to PossibleRelevance of Point Spreads
5.1 Point Spread as a Potential Structure–FunctionNeocortical Motif
The findings reviewed thus far collectively introduce the pos-sibility that a large PS, whether it is functional or anatomical,may be a motif repeated across neocortical gray matter. Forexample, as reviewed in Sec. 4.1, large functional PSs havebeen observed for different species (rat, mouse, cat, monkey,ferret, guinea pig) and cortical areas of different sensory modal-ities (visual, somatosensory, auditory). As reviewed in Sec. 4.4,large anatomical PSs have also been described and quantifiedspecifically for the rat somatosensory cortex, in particular,the PMBSF region of somatosensory cortex. Since then, theFrostig research team have pursued additional experiments toexplicitly address whether large functional and anatomicalPSs are observed across a myriad of cortical areas includingeven nonsensory regions.
Both imaging and anatomical experiments were pursued forvarious sensory areas of the rat cortex. While employing thesame technical (e.g., imaging data collection and data process-ing) and surgical (e.g., anesthesia) protocols as those applied forimaging whisker PSs [Fig. 2(a)], the Frostig research teamimaged the functional PSs for various sensory cortical areasin order to address potential variability typically encounteredwhen comparing results obtained from different labs. As seenin [Fig. 2(b)], point tactile stimulation to the skin at the knuckleforepaw area, point visual stimulation to the eye, and point (puretone) stimulation to the auditory system all resulted in a PS thatis similarly large as to the PS obtained in the rat PMBSF, char-acterized by one peak above the appropriate topographical maplocation and declining symmetrically over cortical distance.Therefore, experiments were also conducted to determinewhether a large anatomical PS occurs for cortical areas otherthan the rat PMBSF that could explain the similarity of suchimaged PSs. The anatomical PSs for various primary sensorycortical areas were mapped by the anterograde tract-tracerBDA.61 BDA was injected into the supragranular layers ofthe somatosensory, visual and auditory cortex. Similar to theimaged PSs obtained for these primary sensory areas [Fig. 2(b)],the anatomical PSs were also found to be large and were char-acterized by a progressive reduction of projections density withcortical distance away from peak density. Furthermore, the ana-tomical PSs for these other sensory areas shared other featureswith that for PMBSF: diffuse long-range projections spreadingin all directions and spanning into other primary cortices; thespatial extent of PS projections into other unimodal corticeswas dependent on the location of the injection site (i.e., thecloser to the cytoarchitectonic border the deeper the axonal pro-jections into other cortices); and axonal labeling in specificknown targets were also detected presumably connected bywhite matter projections. When combined with the findings pre-viously described earlier in the review, collectively these imag-ing and anatomical findings suggest that large functional andanatomical PSs may constitute a motif shared across the various
Neurophotonics 031217-12 Jul–Sep 2017 • Vol. 4(3)
Frostig et al.: Imaging Cajal’s “neuronal avalanche”: how wide-field optical. . .
Downloaded From: http://neurophotonics.spiedigitallibrary.org/ on 06/12/2017 Terms of Use: http://spiedigitallibrary.org/ss/termsofuse.aspx

sensory cortices in the rat. Furthermore, they suggest thatbeyond the traditional area-to-area projections to specific targetsthrough white matter, there is a system of diffuse, long-rangehorizontal projections through gray matter that could directlyconnect primary cortices. In other words, the “two-system”schematic of projections [Figs. 6(a)–6c)] that was based onresults obtained in the PMBSF could also be applicable forother sensory areas. The potential implications of these findingsto cross-modal interactions and plasticity have been discussedin Ref. 61.
Still, other experiments have been pursued to determinewhether a large PS can be observed even for nonsensory cort-ical regions. Employing AAV virus vectors and the samequalitative and quantitative analyses as described above forthe PMBSF, Johnson and Frostig71 have further demonstratedthat injections in the supragranular layers of all known typesof neocortical tissue including granular (trunk area of soma-tosensory cortex), dysgranular (several dysgranular areas sur-rounding PMBSF), and agranular cortex (motor cortex) revealdiffuse anatomical PSs that radiate horizontally through gray
matter in all directions and trespass cytoarchitectonic bordersinto other areas surrounding them. Indeed, the quantifiedimages of the anatomical PS mapping in all these corticalareas were quite similar to the ones obtained in the PMBSF.That the findings obtained for nonsensory cortical areas aresimilar to those obtained for SI, AI, and VI suggest thatlarge PSs could constitute a unifying motif of organizationfor the entire neocortex. In other words, a possibility existsfor every point in gray matter to be the source (and recipient)of the diffuse horizontal system in a distance-dependentfashion.
The ubiquity of large PSs observed across different speciesfrom mice to monkeys and across different cortical areasfrom primary sensory to dysgranular and agranular cortex sug-gests the possibility that a large PS may be an evolutionaryconserved general motif of the mammalian neocortex.Moreover, the fact that functional and anatomical PSs trespassborders strengthen the evidence described above that the neo-cortex can be viewed more of a continuum rather than a par-celed entity as already suggested by Frostig et al.58 in their
Fig. 8 Invariance of the relative spatiotemporal response profile of a whisker PS. (a) 7 × 4microelectrodearrays were used to record LFP responses evoked by a single whisker (five deflections delivered at 5 Hz)across a mesoscopic section of SI extending beyond the boundaries of barrel cortex and penetratingthrough most cortical layers in six rats (left and middle panels). A color scale can be applied to theLFP response magnitudes collected from the 7 × 4 electrode arrays as a means to provide “snapshots”of mesoscopic activity at a given time point (example provided in right panel). (b) 1-ms frame movies ofLFP responses evoked by the first deflection of a single whisker for four stimulus amplitudes (0.035, 0.2,1.25, and 7.5 deg). Note the laminar and lateral spread of LFP response across time as evoked by asingle whisker, and that the amplitude of response is dependent on stimulation amplitude. (c) The relativespatial profile of evoked LFP spread for each stimulus amplitude can be obtained by normalizing eachmovie to its own maximum value across all pixels and time points. Note that after normalization, therelative spatiotemporal profile is similar across all stimulus amplitudes. From Ref. 72.
Neurophotonics 031217-13 Jul–Sep 2017 • Vol. 4(3)
Frostig et al.: Imaging Cajal’s “neuronal avalanche”: how wide-field optical. . .
Downloaded From: http://neurophotonics.spiedigitallibrary.org/ on 06/12/2017 Terms of Use: http://spiedigitallibrary.org/ss/termsofuse.aspx
2008 study. The ubiquitous presence of large PSs, whichrequire precious metabolic resources for their developmentand especially their maintenance, begs the question: what isthe relevance for a PS to be large? The next two subsectionsprovide additional findings about PSs that point toward pos-sible relevance for their existence.
5.2 Relative Spatiotemporal Invariance of a PointSpread
As mentioned earlier in Sec. 1, the PS is composed of manythousands of neurons engaged in coordinated activity andthus, can be considered a classic case of Cajal’s “neuronal ava-lanche” ensemble. A follow-up study of the PS spatiotemporalcharacteristics provided the opportunity to discover emergentproperties not readily attainable simply by studying corticalactivity at the single neuron level. As already reviewed in anearlier section, for a given stimulus amplitude, the spatial extentof the PS was similar irrespective of where its peak locationresided within a given sensory cortex, and thus, this character-istic of the PS could be thought of as being invariant with respectto its location in the cortex. Findings from the follow-up studysuggest that another characteristic of the PS, namely its relativespatiotemporal profile in millisecond resolution, can also beinvariant to stimulation magnitude.
Following ISOI of a whisker PS, a 32-microelectrode array(eight microelectrodes organized in a straight line in layer 1,eight in layers 2 to 3, eight in layer 4, and eight in layer 5)was employed to simultaneously record from all microelectro-des both suprathreshold and subthreshold neuronal activitywithin the PMBSF. Jacobs et al.72 characterized the spatiotem-poral profile of a single whisker PS in response to a variety ofstimulation amplitudes delivered at 5 Hz: four angular displace-ments ranging from 0.035 to 7.5 deg that differed in a logarith-mic (base 6) scale ranging from barely perceptible to the eye(0.035 deg) up to moderate strength (7.5 deg). The acquireddata were analyzed based on 1-ms frames of spatiotemporalmovies obtained from each microelectrode. Detailed spatiotem-poral movies of evoked cortical activity were obtained for eachof the stimulation amplitudes. These movies of subthresholdactivity (LFP) and suprathreshold activity (multiunit potentials)recorded from the same microelectrodes clearly demonstratedthat the PS exhibits a stronger evoked amplitude and larger spa-tial extent when a stronger stimulation amplitude is delivered,which is congruent with results of previous studies that alsoemployed various amplitudes of sensory stimulation, as previ-ously reviewed in Sec. 4.1. However, when these spatiotemporalmovies were normalized to the largest amplitude of evokedresponse per stimulus strength, the normalized movies demon-strated that the spatiotemporal characteristics of the PS are thesame irrespective of stimulation amplitude, despite the majordifference between stimulation amplitudes (>200 fold differ-ence between the weakest and strongest stimulation amplitude).Figure 8 shows an example of the raw and normalized LFP spa-tiotemporal movies created for all stimuli strengths for the firstdeflection of the whisker. Similar results were obtained for con-secutive deflections of the 5-Hz stimulation for both LFP andmultiunit potentials. In other words, while the absolute spatio-temporal profile of a PS can depend on stimulation amplitude,its relative profile was invariant to major changes in stimulusstrength. These findings suggest that the relative spatiotemporalprofile can be added alongside the spatial extent size as beinganother characteristic of the PS that emerges at the ensemble
level as being invariant. Such findings may be of interest tothose studying underlying physiological mechanisms of sensorycoding for perceptual invariance.
5.3 Point Spread could Serve as a Building Blockfor Integrated Cortical Activation
While a whisker PS is quite useful as an animal model for cort-ical function, the stimulation of a single whisker is a rather arti-ficial situation when compared to what actually happens in anawake, behaving rodent. The study of simultaneously stimulat-ing the entire whisker array on the snout is important because itrepresents a more naturalistic type of stimulation that would beactually encountered by the rat. Due to their large spatial spread,neighboring whisker PSs highly overlap with each other, whichbegs the question: what would be the integrated corticalresponse when multiple PSs are simultaneously activated? Toaddress this question, a study was conducted that employedISOI and microelectrode array recordings, along with modelingand pharmacological manipulations, to characterize the corticalactivity spread in response to multiwhisker stimulation.66
To formulate predictions, the PS for whisker C2 as averagedacross 37 rats was obtained [Fig. 6(d)] and used as a template forany whisker PS, justified by our previously described findingsthat PSs of different whiskers are similar.23 A model of the pos-sible cortical response to multiwhisker stimulation (i.e., simul-taneous activation of multiple PSs) was generated simply bylinearly summating all individual PSs associated with the stimu-lated whiskers. Specifically, a copy of the PS template was usedfor each stimulated whisker such that its peak activity coregis-tered with the location of that whisker’s barrel within PMBSF,and then all appropriately aligned PSs were spatially summated.The generated model for all 24 large facial whiskers on the snoutis illustrated in [Fig. 9(a), left]. This model provided predictionsabout various aspects of the cortical response, such as the peakmagnitude, peak location within the PMBSF, and overall 3-Dshape of the response magnitude as it decayed away from thepeak. Interestingly, despite the stimulation of many whiskers,the model predicted a single peak at the center of the activatedarea, as opposed to 24 local peaks as possibly could be expectedbased on the one-to-one principle of organization for thewhisker-to-barrel system. Furthermore, the model predictedthat the response magnitude would decay relatively symmetri-cally in all directions away from the peak activity (in a fashionreminiscent of a single whisker PS) as though the activity col-lectively evoked by stimulating multiple whiskers was beingfunneled toward a single peak in its center (response to multi-whisker stimulation could also be referred to as a “funneled”response). In other words, the area of maximal overlap betweenthe spatially summated PSs evolves into the peak of the funneledresponse, and at progressive distances away from the peak, theoverlap among PSs decreases resulting in the weakening of theevoked amplitude with cortical distance away from the area withmaximal overlap. To generalize this simulation result, a modelwas generated in a similar manner for a 2 × 2 matrix, hence 4whiskers, located on a corner of the snout [Fig. 9(a), right].Again, the model predicted a single, funneled peak at the centerof the evoked area that weakens relatively symmetrically in alldirections away from peak activity, but it also predicted thatthe peak would shift to the appropriate location within thePBMSF—i.e., the location of peak evoked activity at the centerof the barrels associated with the 2 × 2 matrix of whiskers;
Neurophotonics 031217-14 Jul–Sep 2017 • Vol. 4(3)
Frostig et al.: Imaging Cajal’s “neuronal avalanche”: how wide-field optical. . .
Downloaded From: http://neurophotonics.spiedigitallibrary.org/ on 06/12/2017 Terms of Use: http://spiedigitallibrary.org/ss/termsofuse.aspx
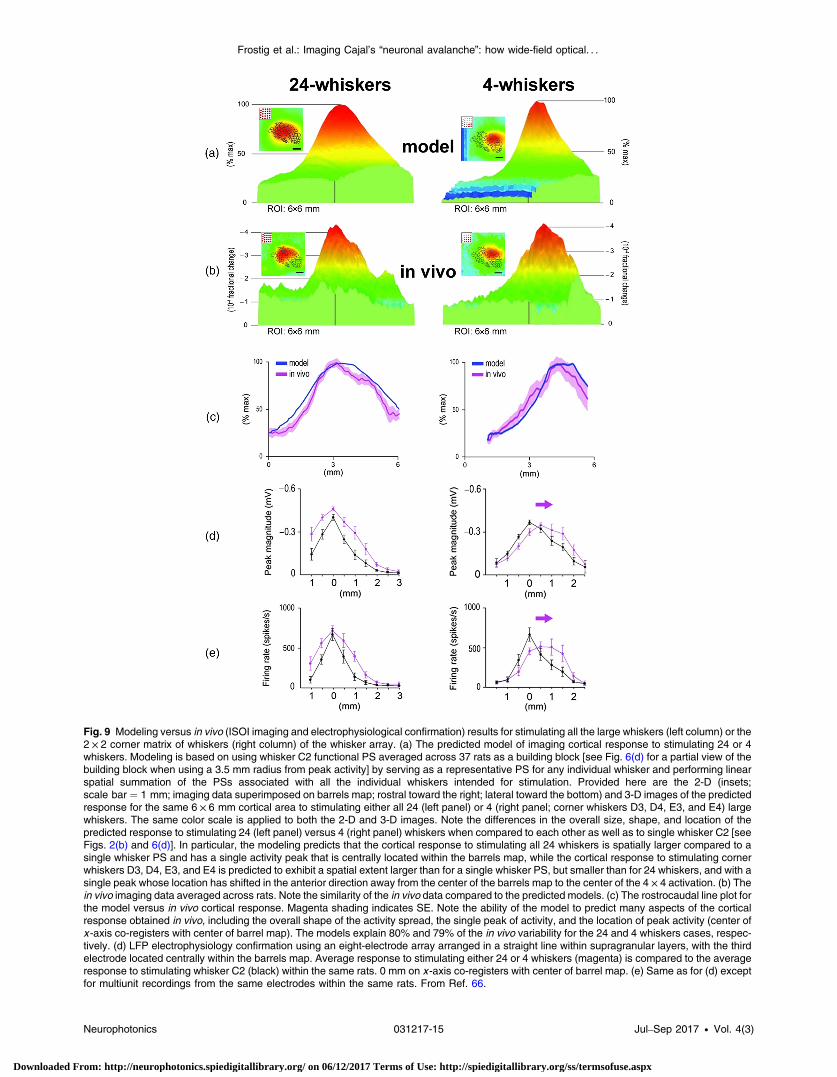
Fig. 9 Modeling versus in vivo (ISOI imaging and electrophysiological confirmation) results for stimulating all the large whiskers (left column) or the2 × 2 corner matrix of whiskers (right column) of the whisker array. (a) The predicted model of imaging cortical response to stimulating 24 or 4whiskers. Modeling is based on using whisker C2 functional PS averaged across 37 rats as a building block [see Fig. 6(d) for a partial view of thebuilding block when using a 3.5 mm radius from peak activity] by serving as a representative PS for any individual whisker and performing linearspatial summation of the PSs associated with all the individual whiskers intended for stimulation. Provided here are the 2-D (insets;scale bar ¼ 1 mm; imaging data superimposed on barrels map; rostral toward the right; lateral toward the bottom) and 3-D images of the predictedresponse for the same 6 × 6 mm cortical area to stimulating either all 24 (left panel) or 4 (right panel; corner whiskers D3, D4, E3, and E4) largewhiskers. The same color scale is applied to both the 2-D and 3-D images. Note the differences in the overall size, shape, and location of thepredicted response to stimulating 24 (left panel) versus 4 (right panel) whiskers when compared to each other as well as to single whisker C2 [seeFigs. 2(b) and 6(d)]. In particular, the modeling predicts that the cortical response to stimulating all 24 whiskers is spatially larger compared to asingle whisker PS and has a single activity peak that is centrally located within the barrels map, while the cortical response to stimulating cornerwhiskers D3, D4, E3, and E4 is predicted to exhibit a spatial extent larger than for a single whisker PS, but smaller than for 24 whiskers, and with asingle peak whose location has shifted in the anterior direction away from the center of the barrels map to the center of the 4 × 4 activation. (b) Thein vivo imaging data averaged across rats. Note the similarity of the in vivo data compared to the predicted models. (c) The rostrocaudal line plot forthe model versus in vivo cortical response. Magenta shading indicates SE. Note the ability of the model to predict many aspects of the corticalresponse obtained in vivo, including the overall shape of the activity spread, the single peak of activity, and the location of peak activity (center ofx -axis co-registers with center of barrel map). The models explain 80% and 79% of the in vivo variability for the 24 and 4 whiskers cases, respec-tively. (d) LFP electrophysiology confirmation using an eight-electrode array arranged in a straight line within supragranular layers, with the thirdelectrode located centrally within the barrels map. Average response to stimulating either 24 or 4 whiskers (magenta) is compared to the averageresponse to stimulating whisker C2 (black) within the same rats. 0 mm on x -axis co-registers with center of barrel map. (e) Same as for (d) exceptfor multiunit recordings from the same electrodes within the same rats. From Ref. 66.
Neurophotonics 031217-15 Jul–Sep 2017 • Vol. 4(3)
Frostig et al.: Imaging Cajal’s “neuronal avalanche”: how wide-field optical. . .
Downloaded From: http://neurophotonics.spiedigitallibrary.org/ on 06/12/2017 Terms of Use: http://spiedigitallibrary.org/ss/termsofuse.aspx

except for the peak location, however, the four-whiskers modelshared many features with the 24-whiskers model.
Comparison between the simulation results and the func-tional imaging (ISOI) results obtained in vivo while simulta-neously stimulating multiple whiskers is summarized inFigs. 9(a)–9(c), along with neuronal recordings (multiunitsand LFP) confirmation [Figs. 9(d) and 9(e)]. The models suc-ceeded in predicting many aspects of the obtained in vivo fun-neled responses, including a single peak, the location of thatpeak within the PMBSF, and the decay in magnitude as theresponse radiated away from the peak activity. Interestingly,the model grossly overestimated the peak amplitude of theexperimental data [Figs. 7(e) and 7(f) in Ref. 66], suggestingthat some form of mutual cortical activity attenuation occurswhen simultaneously stimulating multiple whiskers. Collec-tively, these findings suggest that a PS-based rule (specifically,the linear spatial summation of individual PSs that are topo-graphically aligned) can be used to model various aspects ofthe cortical response to simultaneous stimulation of multiplewhiskers.
Results from additional experiments [Figs. (10) and (11)]further extended these findings. When the temporary sodiumchannel blocker lidocaine was locally injected into one sideof the funneled response evoked by stimulating 24 whiskers
[Fig. 10(a)], rather than simply silencing the portion of the fun-neled response receiving the lidocaine [Fig. 10(b)], the resultantresponse appeared as a new funneled response with its peakshifted away from the site of lidocaine injection [Figs. 10(c)–10(e)]. This result reconfirmed the observation that the evokedfunneled peak response of multiwhisker stimulation is alwaysfound toward the center of the response area. In addition, theresult suggested that such a change in peak location originateswithin the cortex [Fig. 10(c)], because if the single funneledpeak location of multiwhisker activation was only dependenton thalamocortical input, then it would not relocate followingthe lidocaine injection [Fig. 10(b)]. A different set of experi-ments was conducted to determine whether results could bereplicated for a cortical area other than somatosensory cortex.As illustrated in Fig. 11, modeling based on the spatial summa-tion of individual PSs can also be used to predict various fea-tures of the response in visual cortex to simultaneous stimulationof two visual point stimuli. Last, in the previous section, it wasalready mentioned that using subthreshold (LFPs) and supra-threshold (multiunit potential) neuronal recordings, Jacobset al.72 found the relative spatiotemporal profile of a singlewhisker PS to be invariant to major changes in whisker stimu-lation amplitude. The PS-based modeling of the corticalresponse to multiwhisker stimulation, where each whisker’s
Fig. 10 Cortical response evoked by the 24-whiskers array can be predicted by modeling using singlewhisker PSs as building blocks for activity interactions occurring at the cortical level. (a) Eight electrodesspaced 0.5-mm apart recorded the funneled response for 24 whiskers (middle electrodes aimed at thefunneled peak activity location) before and after a local lidocaine injection (green) deposited distal(1.5 mm) to the middle electrodes, at 300- to 450-μm cortical depth. (b) If subcortical activity interactionswere the sole contributors to the funneled response, then no shifting in the funneled peak activity locationwould be expected to occur outside the lidocaine site. (c) If activity interactions occurring at the corticallevel (double-headed arrows) contributed to the funneled response, then the local silencing of corticalactivity should lead to a new spatial overlap of the remaining unsilenced single whisker PSs that in turnshould lead to a shift in the funneled peak location away from the lidocaine site and toward the center ofthe new activated area. Results from (d) sub- and (e) suprathreshold neuronal recordings initiated beforeversus a few minutes after a targeted lidocaine injection are congruent with predictions of panel (c).Recordings initiated 1 h after the lidocaine injection revealed a recovery of response almost to preinjec-tion levels (insets). From Ref. 66.
Neurophotonics 031217-16 Jul–Sep 2017 • Vol. 4(3)
Frostig et al.: Imaging Cajal’s “neuronal avalanche”: how wide-field optical. . .
Downloaded From: http://neurophotonics.spiedigitallibrary.org/ on 06/12/2017 Terms of Use: http://spiedigitallibrary.org/ss/termsofuse.aspx

relative spatiotemporal profile is invariant to stimulus amplitude,would predict that the relative spatiotemporal profile of the fun-neled response evoked by multiwhisker stimulation should alsobe invariant to stimulus strength. Indeed, Jacobs et al.72 obtainedsubthreshold and suprathreshold neuronal recordings resultsevoked by multiwhisker stimulation that were found to be rel-atively invariant to stimulation amplitude. These findings furthersupport the suggestion that a single whisker PS is potentiallya building block of integrated activity following multipointstimulations.
Taken together, the results (Figs. 8–11) collectively suggestthat PSs can be used as a building block for the cortical responseto simultaneous multipoint stimulation. Further research isneeded to test the robustness of such PS-based modeling forother combinations of multipoint stimulation as well as acrossvarious cortical areas and mammalian species. If PS-based inte-gration, based on our modeling, is found to be robust, it wouldbe interesting to see whether it may be useful for addressingquestions related to integrative evoked cortical activity patternsassociated with perception and cognition.
6 SummaryThe development of wide-field optical imaging techniquesopened a new research avenue that enabled, for the first time,high-resolution research into the spatiotemporal functionalorganization of the neocortex at the mesoscopic level. One targetof such studies has been the cortical response to point stimulation.
Optical imaging findings of the cortical PS combined withelectrophysiological and anatomical PS findings suggest thatthe anatomical and functional organization of the sensory cortexat the mesoscopic level shares common themes. By investigatingvarious sensory cortical areas across different mammalianspecies, optical imaging studies revealed that functional PSsexhibit common preserved features, such as one activity peakat the topographically appropriate location within the cortex,progressive decay of activity in all directions away from thepeak activity, and the spatial extent size being similarly largeirrespective of whether the activity peak resides toward thecenter or border of its associated sensory cortical area.Preserving these PS characteristics led to an unexpected findingthat functional PSs could cross cytoarchitectural bordersbetween cortical areas and even trespass into other unimodalcortical territories. Detailed postimaging electrophysiologicalstudies verified these imaged PS characteristics and furtherimplicated the evoked subthreshold activity as underlying thelarge spread of the imaged PS. Detailed mappings of the ana-tomical PS demonstrated that a diffuse system of long-rangehorizontal projections within the cortical gray matter exhibitmany of the same spatial features as the functional PS spread,and combined with pharmacological and anatomical manipula-tions, have implicated this long-range diffuse system as theunderlying system supporting the functional PS spread, sug-gesting a spatial match between structure and function at themesoscopic scale.
Fig. 11 Separate and simultaneous activation of two functional PSs at different locations in rat visualcortex as imaged with ISOI; model and experimental results. Labeling in left column applies to remainingcolumns. Rostral is toward the left and lateral is toward the bottom for all panels in top two rows. In thesame animal, ISOI was used to image the cortical response evoked by two visual point stimulations,whether delivered individually (50 deg azimuth ¼ first column; 80 deg azimuth ¼ second column;both at elevation ofþ15 deg) or simultaneously (third column). The fourth column provides the predictedmodel based on linear spatial summation of the individual PSs as seen in columns 1 and 2. Upper row:2-D maps scaled in fractional change units. Middle row: topographical map displaying isoactivity lines.Bottom row: 3-D images scaled in fractional change units. From Chen-Bee and Frostig, unpublisheddata.
Neurophotonics 031217-17 Jul–Sep 2017 • Vol. 4(3)
Frostig et al.: Imaging Cajal’s “neuronal avalanche”: how wide-field optical. . .
Downloaded From: http://neurophotonics.spiedigitallibrary.org/ on 06/12/2017 Terms of Use: http://spiedigitallibrary.org/ss/termsofuse.aspx
PSs are dynamic, capable of modifying its amplitude andspatial extent size depending on point stimulation parameters,simultaneous activation of neighboring PSs, different states ofbehavior, experience-dependent changes in peripheral use,and involvement in a learning task. Still, an interesting charac-teristic of PSs is that its relative spatiotemporal profile is invari-ant to major changes in stimulus amplitude, which may haveimplications for those researching neuronal correlates of percep-tual invariance. Another interesting facet of PSs is the ability touse them as a building block for modeling the findings of inte-grated cortical response to simultaneous delivery of multiplepoint stimulations in the somatosensory and visual cortex,which may have implications for understanding cortical activityintegration.
Together, these findings would suggest a view of the cortexfrom the perspective of it being more of a continuous entity asopposed to it being exclusively a parceled modular entity withstrict borders surrounding well-defined regions. In addition, theubiquity of functional PSs ranging from mice to monkeys fur-ther suggests that the PS is a fundamental structure–functionmotif that is evolutionarily conserved.
It is hoped that the current review will encourage more sci-entific interest in further investigating functional and anatomicalPSs. To that end, new wide-field mesoscopic imaging tech-niques are currently available that offer new ways for imagingthe PS. Although still limited only to genetically engineeredmice, imaging combined with techniques, such as voltage-sen-sitive fluorescent proteins6 and application of improved calciumindicators73,74 [for a recent review see Ref. 75], could beemployed to further the pursuit of PS-related questions andthereby expand our understanding of the neocortex at the meso-scopic ensemble level—a level of research that has been rela-tively sparse over the years. If so, Santiago Ramon y Cajal’s“law of avalanche” would finally start to attract the attentionit deserves.
DisclosuresThe authors declare that they have no conflict of interest.
AcknowledgmentsThe authors would like to thank previous and current collabo-rators Susan Masino, Michael Kwon, Jonathan Bakin, YehudaDory, Neal Prakash, Daniel Polley, Barbara Brett-Green, SilkePenschuck, Eugene Kvasnak, Jimmy Stehberg, Ying Xiong,Christopher Lay, Melissa Davis, Aneeka Hancock, Yi Zhou,and Ellen Wann for their participation in various aspects ofthe research that led to this review. Supported by NIH grantsNINDS NS-34519, NINDS NS-39760, NINDS NS-43165,NINDS NS-48350, NINDS NS-055832, NINDS NS-066001,and NSF IBN-9507936. This review is dedicated to ProfessorAmiram Grinvald. R.D.F. would like to thank ProfessorGrinvald for introducing him to the point-spread concept andits research, and for introducing him to the barrel cortex withhis memorable dictum: “whenever I want to understand corticalfunction, I study the barrel cortex.”
References1. J. T. McIlwain, “Point images in the visual system: new interest in an old
idea,” Trend Neurosci. 9, 354–358 (1986).2. D. Sharon et al., “Cortical response field dynamics in cat visual cortex,”
Cereb. Cortex 17(12), 2866–2877 (2007).
3. S. Ramon y Cajal, Recollections of My Life, American PhilosophicalSociety, Philadelphia (1937).
4. L. Spillmann, B. Dresp-Langley, and C. H. Tseng, “Beyond the classicalreceptive field: the effect of contextual stimuli,” J. Vision 15(9), 7 (2015).
5. A. Grinvald et al., “Voltage-sensitive dye imaging of neocortical activ-ity,” Cold Spring Harbor Protoc. 2016(1), 13–28 (2016).
6. S. D. Antic, R. M. Empson, and T. Knopfel, “Voltage imaging to under-stand connections and functions of neuronal circuits,” J. Neurophysiol.116(1), 135–152 (2016).
7. R. D. Frostig and C. H. Chen-Bee, “The use of intrinsic signal opticalimaging for mapping cortical function,” in Handbook of NeuronalActivity Measurements, A. D. Romain Brette, Ed., CambridgeUniversity Press, Cambridge, United Kingdom (2012).
8. A. Grinvald et al., “Imaging the neocortex functional architecture usingmultiple intrinsic signals: implications for hemodynamic-based func-tional imaging,” Cold Spring Harbor Protoc. 2016(3), 238–250 (2016).
9. H. D. Lu et al., “Intrinsic signal optical imaging of visual brain activity:tracking of fast cortical dynamics,” Neuroimage 148, 160–168 (2017).
10. C. H. Chen-Bee et al., “The triphasic intrinsic signal: implications forfunctional imaging,” J. Neurosci. 27(17), 4572–4586 (2007).
11. Y. B. Sirotin et al., “Spatiotemporal precision and hemodynamic mecha-nism of optical point spreads in alert primates,” Proc. Natl. Acad. Sci.U. S. A. 106(43), 18390–18395 (2009).
12. C. Welker, “Microelectrode delineation of fine grain somatotopicorganization of (SmI) cerebral neocortex in albino rat,” Brain Res.26(2), 259–275 (1971).
13. H. S. Orbach, L. B. Cohen, and A. Grinvald, “Optical mapping of elec-trical activity in rat somatosensory and visual cortex,” J. Neurosci. 5(7),1886–1895 (1985).
14. A. Grinvald et al., “Functional architecture of cortex revealed by opticalimaging of intrinsic signals,” Nature 324(6095), 361–364 (1986).
15. J. A. London, L. B. Cohen, and J. Y. Wu, “Optical recordings of thecortical response to whisker stimulation before and after the additionof an epileptogenic agent,” J. Neurosci. 9(6), 2182–2190 (1989).
16. K. Fox, Barrel Cortex, Cambridge University Press, Cambridge (2008).17. I. Taniguchi et al., “Spatio-temporal pattern of frequency representation
in the auditory cortex of guinea pigs,” Neurosci. Lett. 146(1), 37–40(1992).
18. A. Grinvald et al., “Cortical point-spread function and long-range lateralinteractions revealed by real-time optical imaging of macaque monkeyprimary visual cortex,” J. Neurosci. 14(5 Pt 1), 2545–2568 (1994).
19. C. H. Chen-Bee et al., “Intrinsic signal optical imaging of brain functionusing short stimulus delivery intervals,” J. Neurosci. Methods 187(2),171–182 (2010).
20. I. Ferezou et al., “Spatiotemporal dynamics of cortical sensorimotorintegration in behaving mice,” Neuron 56(5), 907–923 (2007).
21. S. A. Masino et al., “Characterization of functional organization withinrat barrel cortex using intrinsic signal optical imaging through a thinnedskull,” Proc. Natl. Acad. Sci. U. S. A. 90(21), 9998–10002 (1993).
22. C. H. Chen-Bee and R. D. Frostig, “Variability and interhemisphericasymmetry of single-whisker functional representations in rat barrel cor-tex,” J. Neurophysiol. 76(2), 884–894 (1996).
23. B. A. Brett-Green, C. H. Chen-Bee, and R. D. Frostig, “Comparing thefunctional representations of central and border whiskers in rat primarysomatosensory cortex,” J. Neurosci. 21(24), 9944–9954 (2001).
24. S. A. Masino and R. D. Frostig, “Quantitative long-term imaging of thefunctional representation of a whisker in rat barrel cortex,” Proc. Natl.Acad. Sci. U. S. A. 93(10), 4942–4947 (1996).
25. C. H. Chen-Bee et al., “Visualizing and quantifying evoked corticalactivity assessed with intrinsic signal imaging,” J. Neurosci. Methods97(2), 157–173 (2000).
26. S. Penschuck et al., “In vivo modulation of a cortical functional sensoryrepresentation shortly after topical cholinergic agent application,”J. Comp. Neurol. 452(1), 38–50 (2002).
27. D. B. Polley, E. Kvasnak, and R. D. Frostig, “Naturalistic experiencetransforms sensory maps in the adult cortex of caged animals,” Nature429(6987), 67–71 (2004).
28. N. Prakash et al., “Malformation of the functional organization of soma-tosensory cortex in adult ephrin-A5 knock-out mice revealed by in vivofunctional imaging,” J. Neurosci. 20(15), 5841–5847 (2000).
29. A. Das and C. D. Gilbert, “Long-range horizontal connections and theirrole in cortical reorganization revealed by optical recording of cat
Neurophotonics 031217-18 Jul–Sep 2017 • Vol. 4(3)
Frostig et al.: Imaging Cajal’s “neuronal avalanche”: how wide-field optical. . .
Downloaded From: http://neurophotonics.spiedigitallibrary.org/ on 06/12/2017 Terms of Use: http://spiedigitallibrary.org/ss/termsofuse.aspx

primary visual cortex [see comments],” Nature 375(6534), 780–784(1995).
30. J. S. Bakin et al., “Suprathreshold auditory cortex activation visualizedby intrinsic signal optical imaging,” Cereb. Cortex 6(2), 120–130(1996).
31. V. Tsytsarev and S. Tanaka, “Intrinsic optical signals from rat primaryauditory cortex in response to sound stimuli presented to contralateral,ipsilateral and bilateral ears,” Neuroreport 13(13), 1661–1666 (2002).
32. H. Versnel et al., “Optical imaging of intrinsic signals in ferret auditorycortex: responses to narrowband sound stimuli,” J. Neurophysiol. 88(3),1545–1558 (2002).
33. V. Tsytsarev et al., “Sound frequency representation in cat auditory cor-tex,” Neuroimage 23(4), 1246–1255 (2004).
34. B. J. Farley and A. J. Norena, “Membrane potential dynamics ofpopulations of cortical neurons during auditory streaming,” J.Neurophysiol. 114(4), 2418–2430 (2015).
35. C. C. Petersen, A. Grinvald, and B. Sakmann, “Spatiotemporal dynam-ics of sensory responses in layer 2/3 of rat barrel cortex measured in vivoby voltage-sensitive dye imaging combined with whole-cell voltagerecordings and neuron reconstructions,” J. Neurosci. 23(4), 1298–1309 (2003).
36. G. E. Carvell and D. J. Simons, “Biometric analyses of vibrissal tactilediscrimination in the rat,” J. Neurosci. 10(8), 2638–2648 (1990).
37. T. Berger et al., “Combined voltage and calcium epifluorescenceimaging in vitro and in vivo reveals subthreshold and suprathresholddynamics of mouse barrel cortex,” J. Neurophysiol. 97(5), 3751–3762 (2007).
38. T. Deneux and A. Grinvald, “Milliseconds of sensory input abruptlymodulate the dynamics of cortical states for seconds,” Cereb. Cortex1–15 (2016).
39. A. J. Blood, S. M. Narayan, and A. W. Toga, “Stimulus parametersinfluence characteristics of optical intrinsic signal responses insomatosensory cortex,” J. Cereb. Blood Flow Metab. 15(6), 1109–1120 (1995).
40. M. Jones, J. Berwick, and J. Mayhew, “Changes in blood flow, oxy-genation, and volume following extended stimulation of rodent barrelcortex,” Neuroimage 15(3), 474–487 (2002).
41. D. Derdikman et al., “Imaging spatiotemporal dynamics of surroundinhibition in the barrels somatosensory cortex,” J. Neurosci. 23(8),3100–3105 (2003).
42. A. Devor et al., “Coupling of total hemoglobin concentration, oxygena-tion, and neural activity in rat somatosensory cortex,” Neuron 39(2),353–359 (2003).
43. M. Nemoto et al., “Functional signal- and paradigm-dependentlinear relationships between synaptic activity and hemodynamicresponses in rat somatosensory cortex,” J. Neurosci. 24(15), 3850–3861 (2004).
44. E. F. Civillico and D. Contreras, “Integration of evoked responses insupragranular cortex studied with optical recordings in vivo,” J.Neurophysiol. 96(1), 336–351 (2006).
45. E. F. Civillico and D. Contreras, “Spatiotemporal properties of sensoryresponses in vivo are strongly dependent on network context,” Front.Syst. Neurosci. 6, 25 (2012).
46. M. T. Lippert et al., “Methods for voltage-sensitive dye imaging of ratcortical activity with high signal-to-noise ratio,” J. Neurophysiol. 98(1),502–512 (2007).
47. I. M. Devonshire et al., “Effects of urethane anaesthesia on sensoryprocessing in the rat barrel cortex revealed by combined optical imagingand electrophysiology,” Eur. J. Neurosci. 32(5), 786–797 (2010).
48. B. R. Lustig et al., “Voltage-sensitive dye imaging reveals shifting spa-tiotemporal spread of whisker-induced activity in rat barrel cortex,” J.Neurophysiol. 109(9), 2382–2392 (2013).
49. D. R. Ollerenshaw et al., “The adaptive trade-off between detection anddiscrimination in cortical representations and behavior,” Neuron 81(5),1152–1164 (2014).
50. I. Ferezou, S. Bolea, and C. C. Petersen, “Visualizing the cortical rep-resentation of whisker touch: voltage-sensitive dye imaging in freelymoving mice,” Neuron 50(4), 617–629 (2006).
51. D. H. Lim et al., “In vivo large-scale cortical mapping using channelr-hodopsin-2 stimulation in transgenic mice reveals asymmetric andreciprocal relationships between cortical areas,” Front. NeuralCircuits 6, 11 (2012).
52. M. H. Mohajerani et al., “Spontaneous cortical activity alternatesbetween motifs defined by regional axonal projections,” Nat.Neurosci. 16(10), 1426–1435 (2013).
53. H. Slovin et al., “Long-term voltage-sensitive dye imaging revealscortical dynamics in behaving monkeys,” J. Neurophysiol. 88(6),3421–3438 (2002).
54. C. R. Palmer, Y. Chen, and E. Seidemann, “Uniform spatial spread ofpopulation activity in primate parafoveal V1,” J. Neurophysiol. 107(7),1857–1867 (2012).
55. V. Bringuier et al., “Horizontal propagation of visual activity in the syn-aptic integration field of area 17 neurons, Science 283, 695–699 (1999).
56. J. Schummers, H. Yu, and M. Sur, “Tuned responses of astrocytes andtheir influence on hemodynamic signals in the visual cortex,” Science320(5883), 1638–1643 (2008).
57. S. Kaur, R. Lazar, and R. Metherate, “Intracortical pathways determinebreadth of subthreshold frequency receptive fields in primary auditorycortex,” J. Neurophysiol. 91(6), 2551–2567 (2004).
58. R. D. Frostig et al., “Large-scale organization of rat sensorimotor cortexbased on a motif of large activation spreads,” J. Neurosci. 28(49),13274–13284 (2008).
59. A. Kyriakatos et al., “Voltage-sensitive dye imaging of mouse neocortexduring a whisker detection task,” Neurophotonics 4(3), 031204 (2017).
60. W. Akemann et al., “Route to genetically targeted optical electrophysi-ology: development and applications of voltage-sensitive fluorescentproteins,” Neurophotonics 2(2), 021008 (2015).
61. J. Stehberg, P. T. Dang, and R. D. Frostig, “Unimodal primary sensorycortices are directly connected by long-range horizontal projections inthe rat sensory cortex,” Front. Neuroanat. 8, 93 (2014).
62. B. A. Johnson and R. D. Frostig, “Photonics meets connectomics: caseof diffuse, long-range horizontal projections in rat cortex,”Neurophotonics 2(4), 041403 (2015).
63. B. A. Johnson and R. D. Frostig, “Long, intrinsic horizontal axons radi-ating through and beyond rat barrel cortex have spatial distributionssimilar to horizontal spreads of activity evoked by whisker stimulation,”Brain Struct. Funct. 221(7), 3617–3639 (2016).
64. M. Kinoshita, C. D. Gilbert, and A. Das, “Optical imaging of contextualinteractions in V1 of the behaving monkey,” J. Neurophysiol. 102(3),1930–1944 (2009).
65. G. Mirabella, S. Battiston, and M. E. Diamond, “Integration of multiple-whisker inputs in rat somatosensory cortex,” Cereb. Cortex 11(2), 164–170 (2001).
66. C. H. Chen-Bee et al., “Whisker array functional representation in ratbarrel cortex: transcendence of one-to-one topography and its underly-ing mechanism,” Front. Neural Circuits 6, 93 (2012).
67. D. Kleinfeld and K. R. Delaney, “Distributed representation of vibrissamovement in the upper layers of somatosensory cortex revealed withvoltage-sensitive dyes,” J. Comp. Neurol. 375(1), 89–108 (1996).
68. D. Goldreich, B. E. Peterson, and M. M. Merzenich, “Optical imagingand electrophysiology of rat barrel cortex. II. Responses to paired-vibrissa deflections,” Cereb. Cortex 8(2), 184–192 (1998).
69. D. B. Polley, C. H. Chen-Bee, and R. D. Frostig, “Two directions ofplasticity in the sensory-deprived adult cortex [see comments],”Neuron 24(3), 623–637 (1999).
70. F. Gomez-Pinilla et al., “The influence of naturalistic experience onplasticity markers in somatosensory cortex and hippocampus: effectsof whisker use,” Brain Res. 1388, 39–47 (2011).
71. B. A. Johnson and R. D. Frostig, “Long-range, border crossing, hori-zontal axon radiations are a common feature of multiple distinct corticalregions” (2017) (Submitted).
72. N. S. Jacobs, C. H. Chen-Bee, and R. D. Frostig, “Emergence of spa-tiotemporal invariance in large neuronal ensembles in rat barrel cortex,”Front. Neural Circuits 9, 34 (2015).
73. G. Silasi et al., “Intact skull chronic windows for mesoscopic wide-fieldimaging in awake mice,” J. Neurosci. Methods 267, 141–149 (2016).
74. T. H. Murphy et al., “High-throughput automated home-cage meso-scopic functional imaging of mouse cortex,” Nat. Commun. 7, 11611(2016).
75. Y. Ma et al., “Wide-field optical mapping of neural activity and brainhaemodynamics: considerations and novel approaches,” Philos. Trans.R. Soc. London 371(1705) (2016).
Biographies for the authors are not available.
Neurophotonics 031217-19 Jul–Sep 2017 • Vol. 4(3)
Frostig et al.: Imaging Cajal’s “neuronal avalanche”: how wide-field optical. . .
Downloaded From: http://neurophotonics.spiedigitallibrary.org/ on 06/12/2017 Terms of Use: http://spiedigitallibrary.org/ss/termsofuse.aspx


![Parametric Imaging of [11C]Flumazenil Binding in the Rat Brain · Key words: [11C]flumazenil, Rat, Parametric imaging, Small-animal imaging, PETIntroduction The in vivo study of neuronal](https://img.pdfslide.net/doc/110x75/60501b55634f3c5bf340ac96/parametric-imaging-of-11cflumazenil-binding-in-the-rat-brain-key-words-11cflumazenil.jpg)