Embed Size (px)
Citation preview
This publication may only be reproduced in accordance with London Qualifications Limited copyright policy.Edexcel Foundation is a registered charity. © 2003 London Qualifications Limited
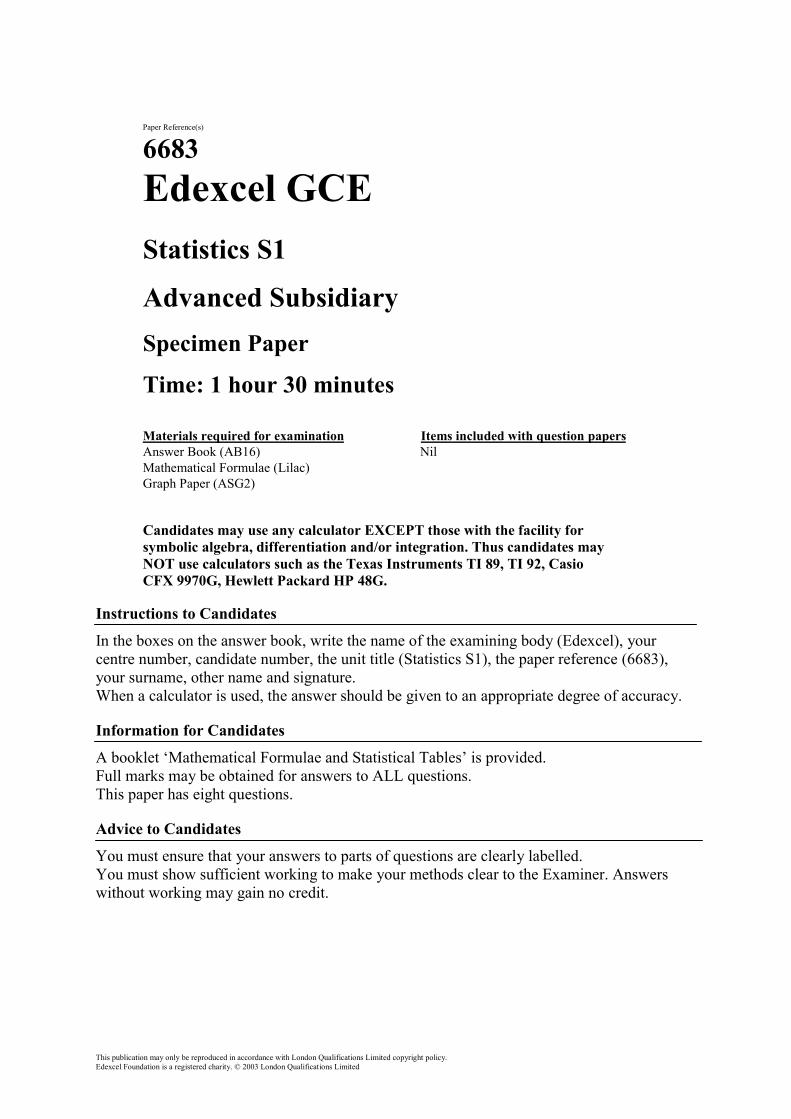
Paper Reference(s)
6683Edexcel GCEStatistics S1
Advanced SubsidiarySpecimen Paper
Time: 1 hour 30 minutes
Materials required for examination Items included with question papersAnswer Book (AB16) NilMathematical Formulae (Lilac)Graph Paper (ASG2)
Candidates may use any calculator EXCEPT those with the facility forsymbolic algebra, differentiation and/or integration. Thus candidates mayNOT use calculators such as the Texas Instruments TI 89, TI 92, CasioCFX 9970G, Hewlett Packard HP 48G.
Instructions to Candidates
In the boxes on the answer book, write the name of the examining body (Edexcel), yourcentre number, candidate number, the unit title (Statistics S1), the paper reference (6683),your surname, other name and signature.When a calculator is used, the answer should be given to an appropriate degree of accuracy.
Information for Candidates
A booklet ‘Mathematical Formulae and Statistical Tables’ is provided.Full marks may be obtained for answers to ALL questions.This paper has eight questions.
Advice to Candidates
You must ensure that your answers to parts of questions are clearly labelled.You must show sufficient working to make your methods clear to the Examiner. Answerswithout working may gain no credit.
2
1. (a) Explain what you understand by a statistical model.(2)
(b) Write down a random variable which could be modelled by
(i) a discrete uniform distribution,
(ii) a normal distribution.(2)
2. A group of students believes that the time taken to travel to college, T minutes, can be assumedto be normally distributed. Within the college 5% of students take at least 55 minutes to travel tocollege and 0.1% take less than 10 minutes.
Find the mean and standard deviation of T.(9)
3. The discrete random variable X has probability function
� ���� �
��otherwise.,0
,5 4, 3, ,2,1,P
xkxxX
(a) Show that .151
�k
(3)
Find the value of
(b) E(2X + 3),(5)
(c) Var(2X � 4).(6)
3
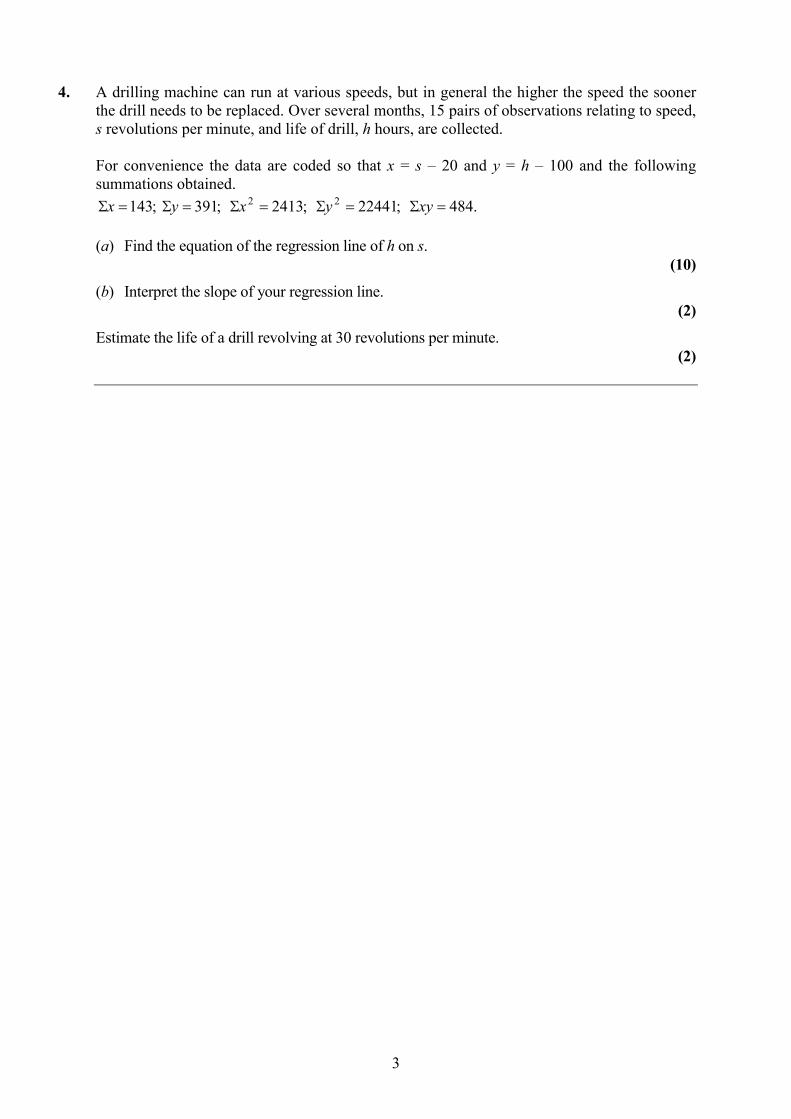
4. A drilling machine can run at various speeds, but in general the higher the speed the soonerthe drill needs to be replaced. Over several months, 15 pairs of observations relating to speed,s revolutions per minute, and life of drill, h hours, are collected.
For convenience the data are coded so that x = s – 20 and y = h – 100 and the followingsummations obtained.
.484;22441;2413;391;143 22���������� xyyxyx
(a) Find the equation of the regression line of h on s.(10)
(b) Interpret the slope of your regression line.(2)
Estimate the life of a drill revolving at 30 revolutions per minute.(2)
Q
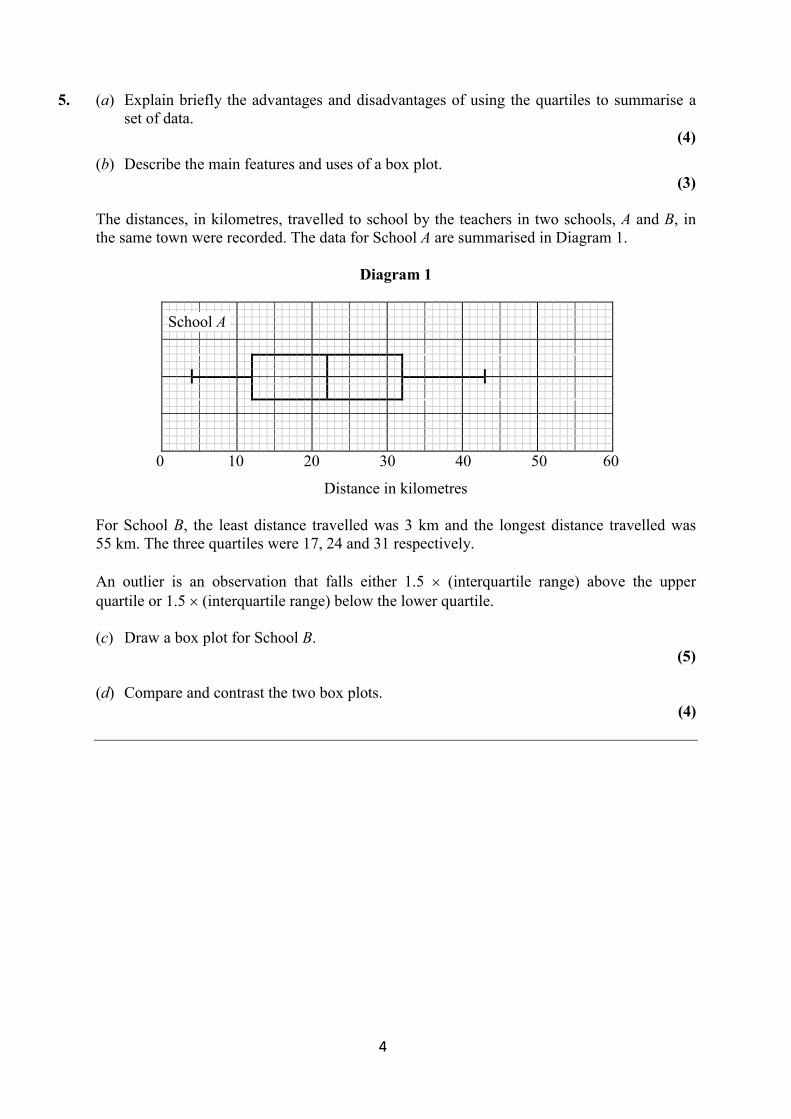
5. (a) Explain briefly the advantages and disadvantages of using the quartiles to summarise aset of data.
(4)
(b) Describe the main features and uses of a box plot.(3)
The distances, in kilometres, travelled to school by the teachers in two schools, A and B, inthe same town were recorded. The data for School A are summarised in Diagram 1.
Diagram 1
0 10 20 30 40 50 60
Distance in kilometres
For School B, the least distance travelled was 3 km and the longest distance travelled was55 km. The three quartiles were 17, 24 and 31 respectively.
An outlier is an observation that falls either 1.5 � (interquartile range) above the upperquartile or 1.5 � (interquartile range) below the lower quartile.
(c) Draw a box plot for School B.(5)
(d) Compare and contrast the two box plots.(4)
School A
5
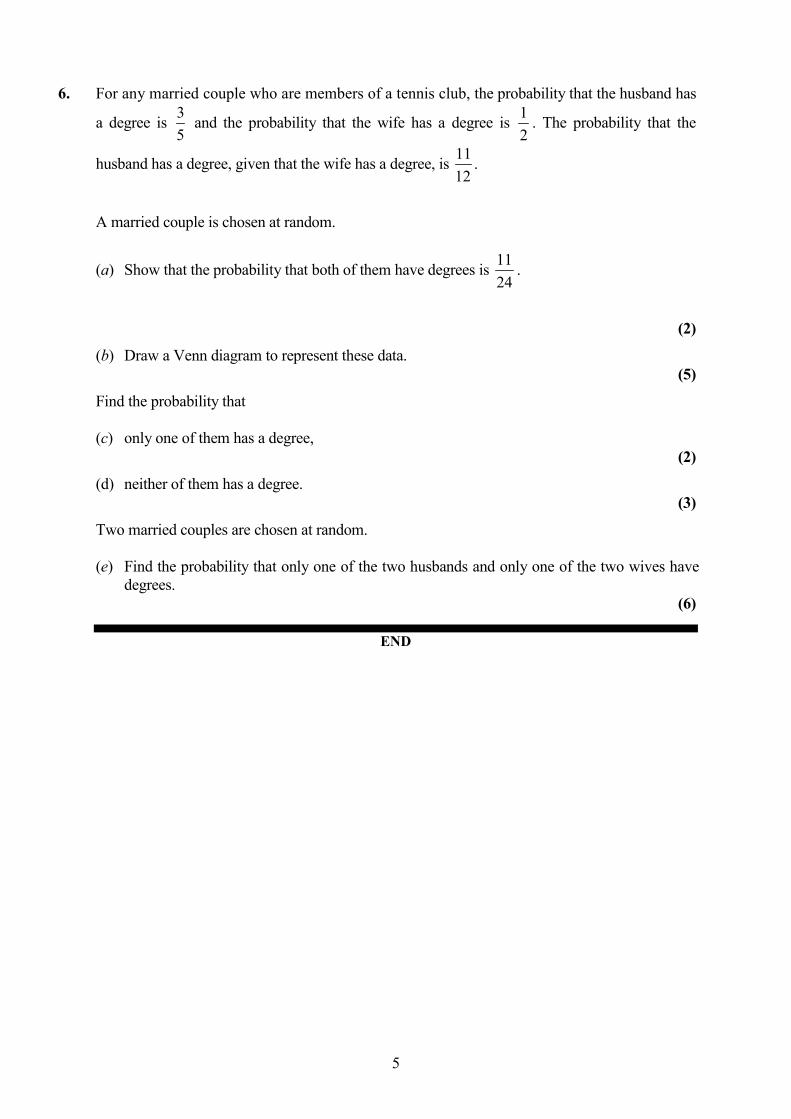
6. For any married couple who are members of a tennis club, the probability that the husband has
a degree is 53 and the probability that the wife has a degree is
21 . The probability that the
husband has a degree, given that the wife has a degree, is 1211 .
A married couple is chosen at random.
(a) Show that the probability that both of them have degrees is 2411 .
(2)
(b) Draw a Venn diagram to represent these data.(5)
Find the probability that
(c) only one of them has a degree,(2)
(d) neither of them has a degree.(3)
Two married couples are chosen at random.
(e) Find the probability that only one of the two husbands and only one of the two wives havedegrees.
(6)
END
This publication may only be reproduced in accordance with London Qualifications Limited copyright policy.Edexcel Foundation is a registered charity. © 2003 London Qualifications Limited
Paper Reference(s)
6684Edexcel GCEStatistics S2
Advanced LevelSpecimen Paper
Time: 1 hour 30 minutes
Materials required for examination Items included with questionpapersAnswer Book (AB16) NilMathematical Formulae (Lilac)Graph Paper (ASG2)
Candidates may use any calculator EXCEPT those with the facility forsymbolic algebra, differentiation and/or integration. Thus candidatesmay NOT use calculators such as the Texas Instruments TI 89, TI 92,Casio CFX 9970G, Hewlett Packard HP 48G.
Instructions to Candidates
In the boxes on the answer book, write the name of the examining body (Edexcel), yourcentre number, candidate number, the unit title (Statistics S2), the paper reference (6684),your surname, other name and signature.When a calculator is used, the answer should be given to an appropriate degree of accuracy.
Information for Candidates
A booklet ‘Mathematical Formulae and Statistical Tables’ is provided.Full marks may be obtained for answers to ALL questions.This paper has seven questions.
Advice to Candidates
You must ensure that your answers to parts of questions are clearly labelled.You must show sufficient working to make your methods clear to the Examiner. Answerswithout working may gain no credit.
7
1. A school held a disco for years 9, 10 and 11 which was attended by 500 pupils. The pupilswere registered as they entered the disco. The disco organisers were keen to assess thesuccess of the event. They designed a questionnaire to obtain information from those whoattended.
(a) State one advantage and one disadvantage of using a sample survey rather than a census.(2)
(b) Suggest a suitable sampling frame.(1)
(c) Identify the sampling units.(1)
2. A piece of string AB has length 12 cm. A child cuts the string at a randomly chosen point P, intotwo pieces. The random variable X represents the length, in cm, of the piece AP.
(a) Suggest a suitable model for the distribution of X and specify it fully(2)
(b) Find the cumulative distribution function of X.(4)
(c) Write down P(X < 4).(1)
3. A manufacturer of chocolates produces 3 times as many soft centred chocolates as hardcentred ones.
Assuming that chocolates are randomly distributed within boxes of chocolates, find theprobability that in a box containing 20 chocolates there are
(a) equal numbers of soft centred and hard centred chocolates,(3)
(b) fewer than 5 hard centred chocolates. (2)
A large box of chocolates contains 100 chocolates.
(c) Write down the expected number of hard centred chocolates in a large box.(2)
U
4. A company director monitored the number of errors on each page of typing done by her newsecretary and obtained the following results:
No. of errors 0 1 2 3 4 5
No. of pages 37 65 60 49 27 12
(a) Show that the mean number of errors per page in this sample of pages is 2.(2)
(b) Find the variance of the number of errors per page in this sample.(2)
(c) Explain how your answers to parts (a) and (b) might support the director’s belief that thenumber of errors per page could be modelled by a Poisson distribution.
(1)
Some time later the director notices that a 4-page report which the secretary has just typedcontains only 3 errors. The director wishes to test whether or not this represents evidence thatthe number of errors per page made by the secretary is now less than 2.
(d) Assuming a Poisson distribution and stating your hypothesis clearly, carry out this test.Use a 5% level of significance.
(6)
5. In Manuel’s restaurant the probability of a customer asking for a vegetarian meal is 0.30.During one particular day in a random sample of 20 customers at the restaurant 3 ordered avegetarian meal.
(a) Stating your hypotheses clearly, test, at the 5% level of significance, whether or not theproportion of vegetarian meals ordered that day is unusually low.
(5)
Manuel’s chef believes that the probability of a customer ordering a vegetarian meal is 0.10.The chef proposes to take a random sample of 100 customers to test whether or not there isevidence that the proportion of vegetarian meals ordered is different from 0.10.
(b) Stating your hypotheses clearly, use a suitable approximation to find the critical region forthis test. The probability for each tail of the region should be as close as possible to 2.5%.
(6)
(c) State the significance level of this test giving your answer to 2 significant figures.(1)
9
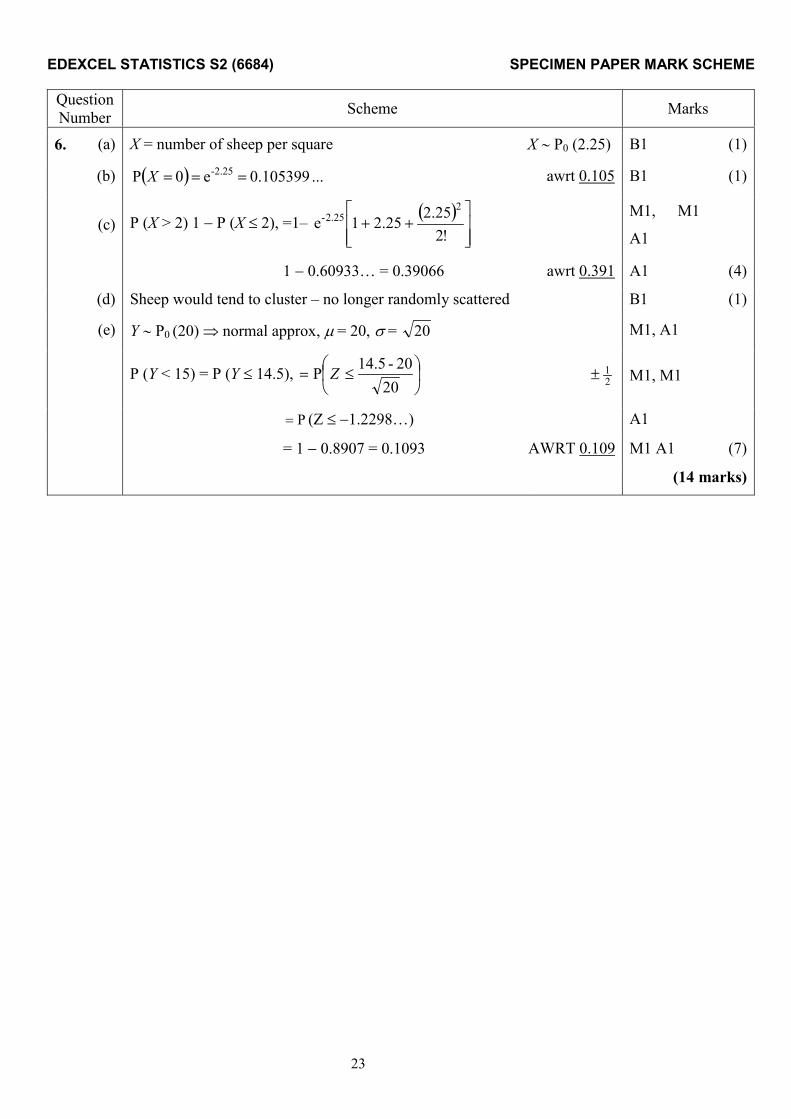
6. A biologist is studying the behaviour of sheep in a large field. The field is divided up into anumber of equally sized squares and the average number of sheep per square is 2.25. Thesheep are randomly spread throughout the field.
(a) Suggest a suitable model for the number of sheep in a square and give a value for anyparameter or parameters required.
(1)
Calculate the probability that a randomly selected sample square contains
(b) no sheep,(1)
(c) more than 2 sheep.(4)
A sheepdog has been sent into the field to round up the sheep.
(d) Explain why the model may no longer be applicable.(1)
In another field, the average number of sheep per square is 20 and the sheep are randomlyscattered throughout the field.
(e) Using a suitable approximation, find the probability that a randomly selected squarecontains fewer than 15 sheep.
(7)
10
7. The continuous random variable X has probability density function f(x) given by
� ���� ��
�otherwise ,0
31 ,f
3201 xx
x
(a) Sketch f(x) for all values of x.(3)
(b) Calculate E(X).(3)
(c) Show that the standard deviation of X is 0.459 to 3 decimal places.(3)
(d) Show that for 1 � x � 3, P(X � x) is given by 801 � �14
�x and specify fully the cumulative
distribution function of X.(5)
(e) Find the interquartile range for the random variable X.(4)
Some statisticians use the following formula to estimate the interquartile range:
interquartile range = 34 × standard deviation.
(f) Use this formula to estimate the interquartile range in this case, and comment.(2)
END
This publication may only be reproduced in accordance with London Qualifications Limited copyright policy.Edexcel Foundation is a registered charity. © 2003 London Qualifications Limited
Paper Reference(s)
6670Edexcel GCEStatistics S3
Advanced LevelSpecimen Paper
Time: 1 hour 30 minutes
Materials required for examination Items included with questionpapersAnswer Book (AB16) NilMathematical Formulae (Lilac)Graph Paper (ASG2)
Candidates may use any calculator EXCEPT those with the facility forsymbolic algebra, differentiation and/or integration. Thus candidatesmay NOT use calculators such as the Texas Instruments TI 89, TI 92,Casio CFX 9970G, Hewlett Packard HP 48G.
Instructions to Candidates
In the boxes on the answer book, write the name of the examining body (Edexcel), yourcentre number, candidate number, the unit title (Statistics S3), the paper reference (6670),your surname, other name and signature.When a calculator is used, the answer should be given to an appropriate degree of accuracy.
Information for Candidates
A booklet ‘Mathematical Formulae and Statistical Tables’ is provided.Full marks may be obtained for answers to ALL questions.This paper has six questions.
Advice to Candidates
You must ensure that your answers to parts of questions are clearly labelled.You must show sufficient working to make your methods clear to the Examiner. Answerswithout working may gain no credit.
NO
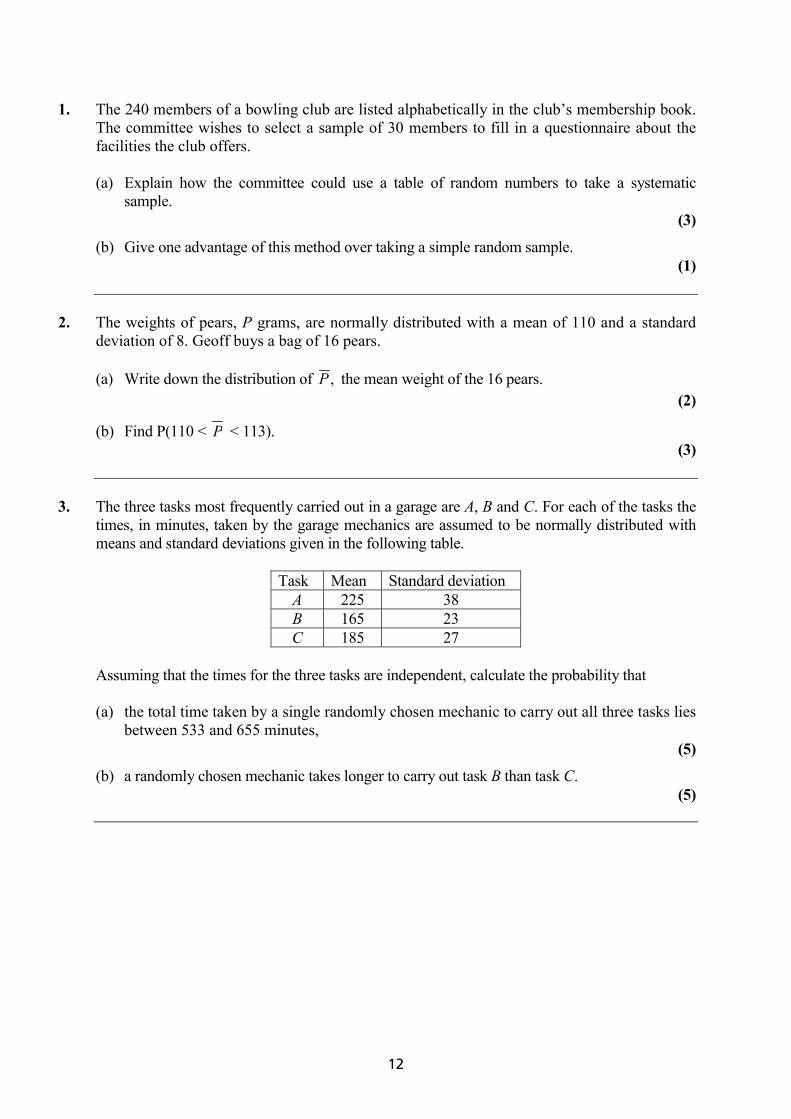
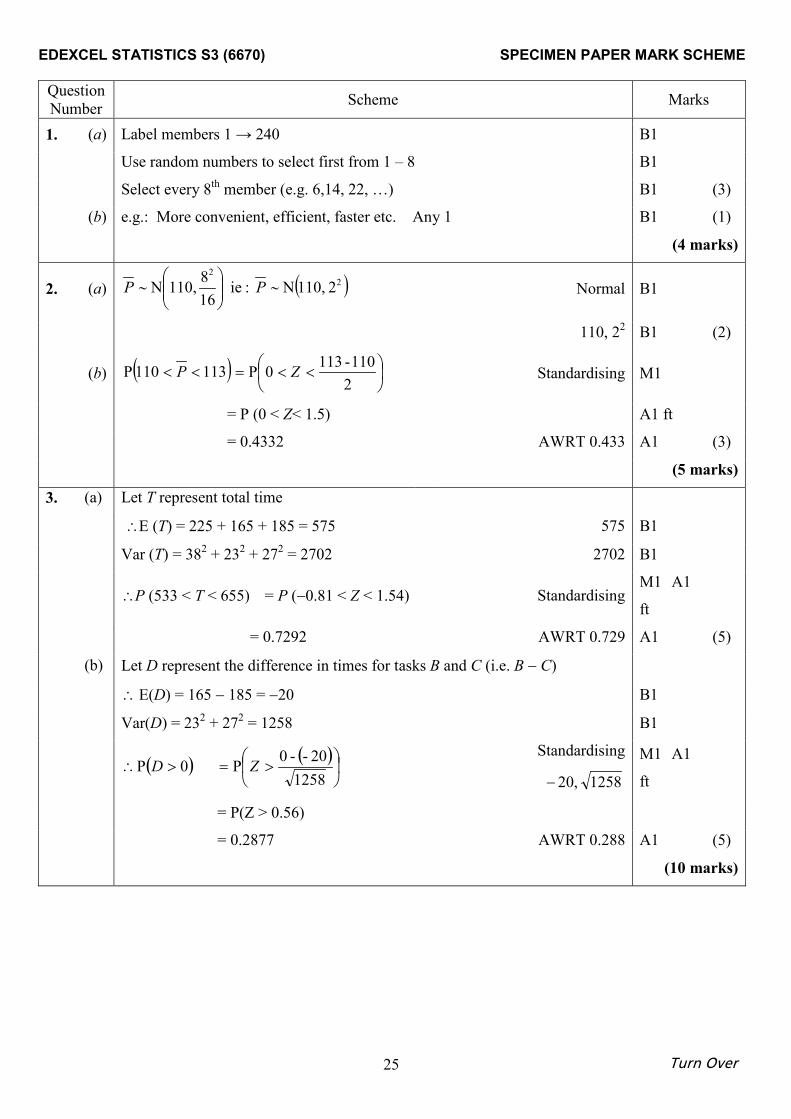
1. The 240 members of a bowling club are listed alphabetically in the club’s membership book.The committee wishes to select a sample of 30 members to fill in a questionnaire about thefacilities the club offers.
(a) Explain how the committee could use a table of random numbers to take a systematicsample.
(3)
(b) Give one advantage of this method over taking a simple random sample.(1)
2. The weights of pears, P grams, are normally distributed with a mean of 110 and a standarddeviation of 8. Geoff buys a bag of 16 pears.
(a) Write down the distribution of ,P the mean weight of the 16 pears.(2)
(b) Find P(110 < P < 113).(3)
3. The three tasks most frequently carried out in a garage are A, B and C. For each of the tasks thetimes, in minutes, taken by the garage mechanics are assumed to be normally distributed withmeans and standard deviations given in the following table.
Task Mean Standard deviationA 225 38B 165 23C 185 27
Assuming that the times for the three tasks are independent, calculate the probability that
(a) the total time taken by a single randomly chosen mechanic to carry out all three tasks liesbetween 533 and 655 minutes,
(5)
(b) a randomly chosen mechanic takes longer to carry out task B than task C.(5)
13
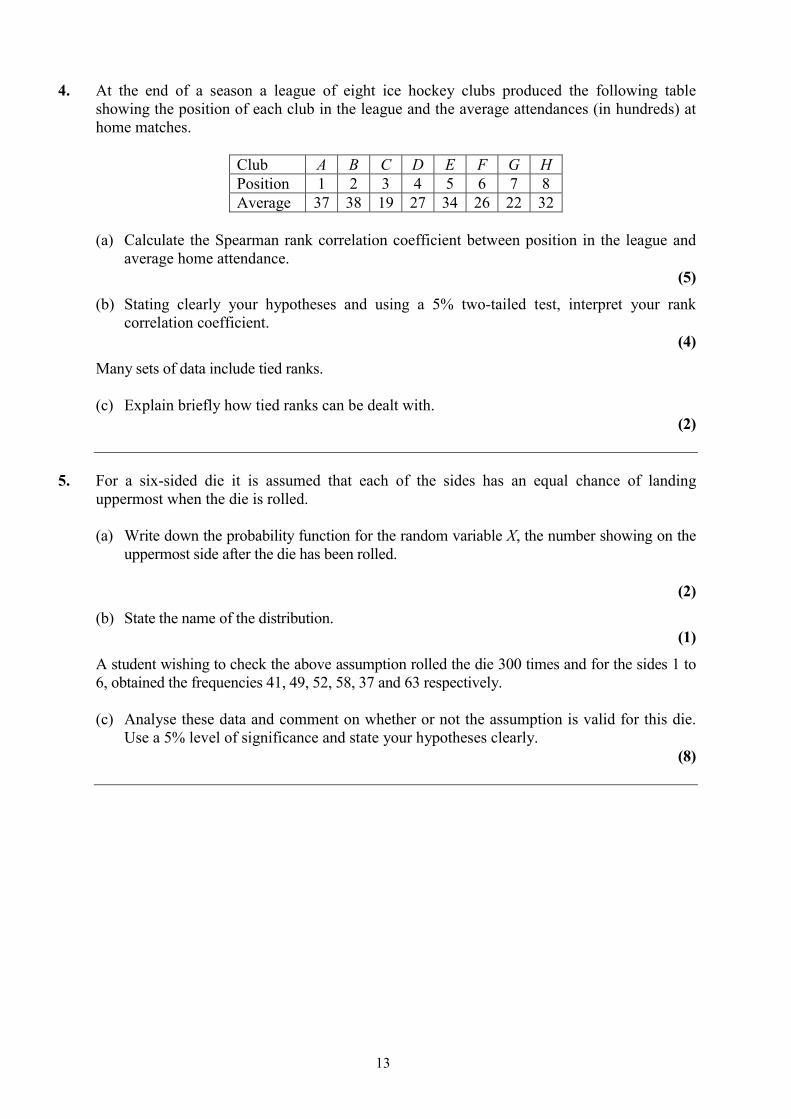
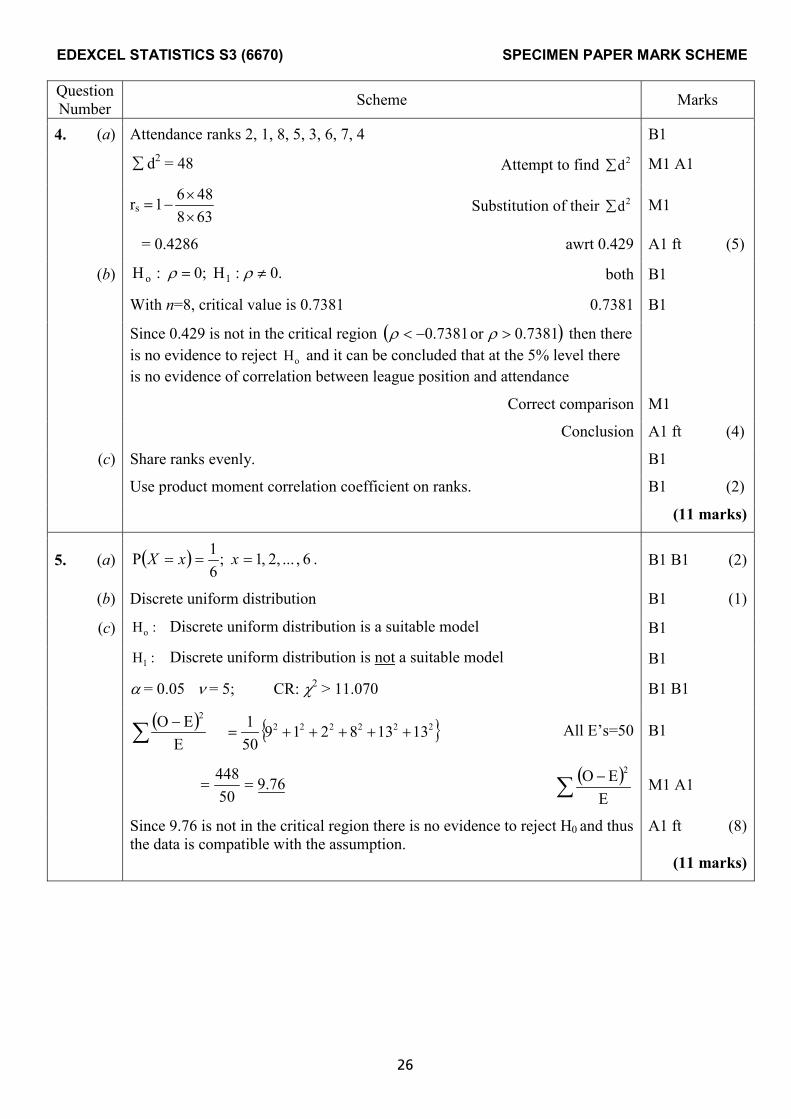
4. At the end of a season a league of eight ice hockey clubs produced the following tableshowing the position of each club in the league and the average attendances (in hundreds) athome matches.
Club A B C D E F G HPosition 1 2 3 4 5 6 7 8Average 37 38 19 27 34 26 22 32
(a) Calculate the Spearman rank correlation coefficient between position in the league andaverage home attendance.
(5)
(b) Stating clearly your hypotheses and using a 5% two-tailed test, interpret your rankcorrelation coefficient.
(4)
Many sets of data include tied ranks.
(c) Explain briefly how tied ranks can be dealt with.(2)
5. For a six-sided die it is assumed that each of the sides has an equal chance of landinguppermost when the die is rolled.
(a) Write down the probability function for the random variable X, the number showing on theuppermost side after the die has been rolled.
(2)
(b) State the name of the distribution.(1)
A student wishing to check the above assumption rolled the die 300 times and for the sides 1 to6, obtained the frequencies 41, 49, 52, 58, 37 and 63 respectively.
(c) Analyse these data and comment on whether or not the assumption is valid for this die.Use a 5% level of significance and state your hypotheses clearly.
(8)
NQ
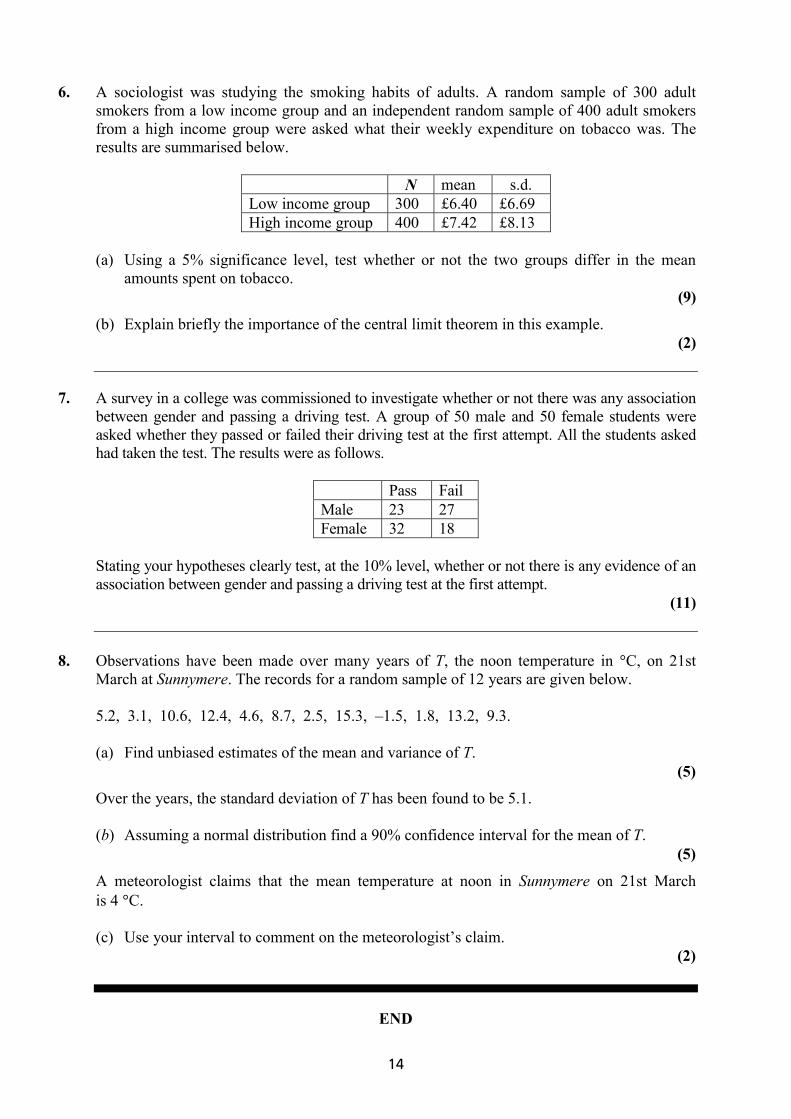
6. A sociologist was studying the smoking habits of adults. A random sample of 300 adultsmokers from a low income group and an independent random sample of 400 adult smokersfrom a high income group were asked what their weekly expenditure on tobacco was. Theresults are summarised below.
N mean s.d.Low income group 300 £6.40 £6.69High income group 400 £7.42 £8.13
(a) Using a 5% significance level, test whether or not the two groups differ in the meanamounts spent on tobacco.
(9)
(b) Explain briefly the importance of the central limit theorem in this example.(2)
7. A survey in a college was commissioned to investigate whether or not there was any associationbetween gender and passing a driving test. A group of 50 male and 50 female students wereasked whether they passed or failed their driving test at the first attempt. All the students askedhad taken the test. The results were as follows.
Pass FailMale 23 27Female 32 18
Stating your hypotheses clearly test, at the 10% level, whether or not there is any evidence of anassociation between gender and passing a driving test at the first attempt.
(11)
8. Observations have been made over many years of T, the noon temperature in �C, on 21stMarch at Sunnymere. The records for a random sample of 12 years are given below.
5.2, 3.1, 10.6, 12.4, 4.6, 8.7, 2.5, 15.3, –1.5, 1.8, 13.2, 9.3.
(a) Find unbiased estimates of the mean and variance of T.(5)
Over the years, the standard deviation of T has been found to be 5.1.
(b) Assuming a normal distribution find a 90% confidence interval for the mean of T.(5)
A meteorologist claims that the mean temperature at noon in Sunnymere on 21st Marchis 4 �C.
(c) Use your interval to comment on the meteorologist’s claim.(2)
END
EDEXCEL STATISTICS S1 (6683) SPECIMEN PAPER MARK SCHEME
15
QuestionNumber Scheme Marks
1. (a) A statistical process devised to describe or make predictions about the expectedbehaviour of a real-world problem.
B1 B1 (2)
(b) (i) The number showing on the uppermost side of a die after it has been rolled. B1
(ii) The height of adult males. B1 (2)
(4 marks)
2.
0–3.0902 1.6449
f(z)
5%0.1%
�
��
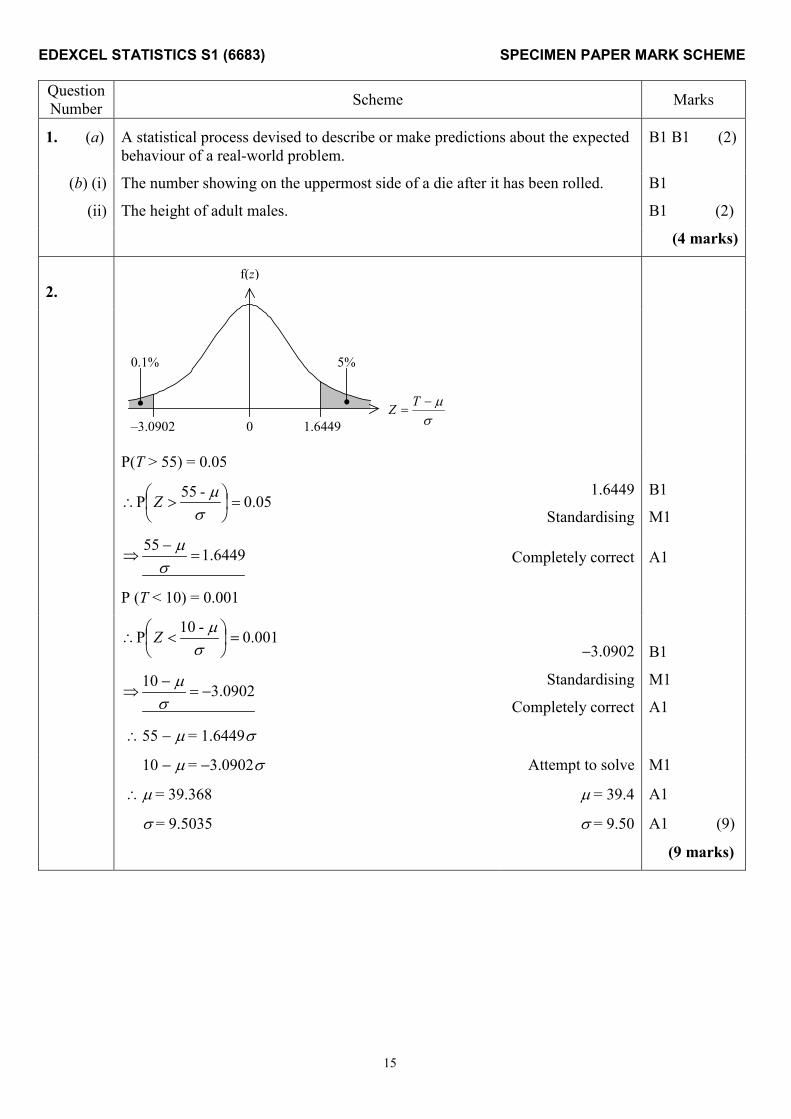
�
TZ
P(T > 55) = 0.05
05.0-55P ���
���
��
�
�Z1.6449
Standardising
B1
M1
6449.155�
�
�
�
�Completely correct A1
P (T < 10) = 0.001
001.0-10P ���
���
��
�
�Z�3.0902 B1
0902.310��
��
�
� Standardising
Completely correct
M1
A1
� 55 � � = 1.6449�
10 � � = �3.0902� Attempt to solve M1
� � = 39.368 � = 39.4 A1
� = 9.5035 � = 9.50 A1 (9)
(9 marks)
EDEXCEL STATISTICS S1 (6683) SPECIMEN PAPER MARK SCHEME
NS
QuestionNumber Scheme Marks
3. (a) k (1 + 2 + 3 + 4 +5) = 1 Use of � �� �� 1P xX M1 A1
� k = 151
� A1 (3)
(b) E(X) = 151 {1 + 2 � 2 + … + 5 � 5 } Use of E (X) = � �� � xXxP M1 A1
= 15 A1
�E(2X + 3) = 2E(X) + 3 M1
331
� A1 ft (5)
(c) E(X2)151
� {1 + 22 � 2 + … + 52 � 5} Use of � � � �xXxX ��� PE 22 M1
= 15 A1
Var (X) = 15 �2
311
��
���
� Use of Var (X) = E (X2) � [E(X)]2 M1
9
14� A1
Var (2X � 4)= 4 Var (X) Use of Var(aX) = a2Var(X) M1
956
� A1 ft (6)
(14 marks)
EDEXCEL STATISTICS S1 (6683) SPECIMEN PAPER MARK SCHEME
17
QuestionNumber Scheme Marks
4.
(a)b
� �214324131539114348415
��
���
� M1 A1
= � 3.0899 AWRT –3.09 A1
a � � ��
���
����
151430899.3
15391
M1 A1
= 55.5237 AWRT 55.5 A1
� y = 55.52 � 3.09x B1 ft
� h � 100 = 55.52 � 3.09(s � 20) M1 A1 ft
� h = 217.32 � 3.09s AWRT 217; 3.09 A1 (10)
(b) For every extra revolution/minute the life of the drill is
reduced by 3 hours.B1 B1 (2)
(c) s = 30 � h = 124.6 AWRT 125 M1 A1 ft (2)
(14 marks)
EDEXCEL STATISTICS S1 (6683) SPECIMEN PAPER MARK SCHEME
QuestionNumber Scheme Marks
5. (a) Advantages: Uses central 50% of the data
Not affected by extreme values (outliers)
Provide an alternative measure of spread to thevariance/standard deviation, i.e. IQR/STQR
Disadvantages: Not always a simple calculation, e.g. interpolation for a grouped frequency distribution
Different measures of calculation – no single argued method
Does not use all the data directly
Any 4 sensible comments – at least one advantage and one disadvantage B1 B1 B1 B1(4)
(b) Indicates maximum/minimum observations and possible outliers
Indicates relative positions of the quartiles
Indicates skewness
When plotted on the same scale enables comparisons of distributions
Any 4 sensible comments B1 B1 B1 (3)
(c) Q1 – 1.5(Q3 – Q1) = –4 � no outlier below lower quartile B1
Q2 + 1.5(Q3 – Q1) = 52 � an outlier (55) above upper quartile B1
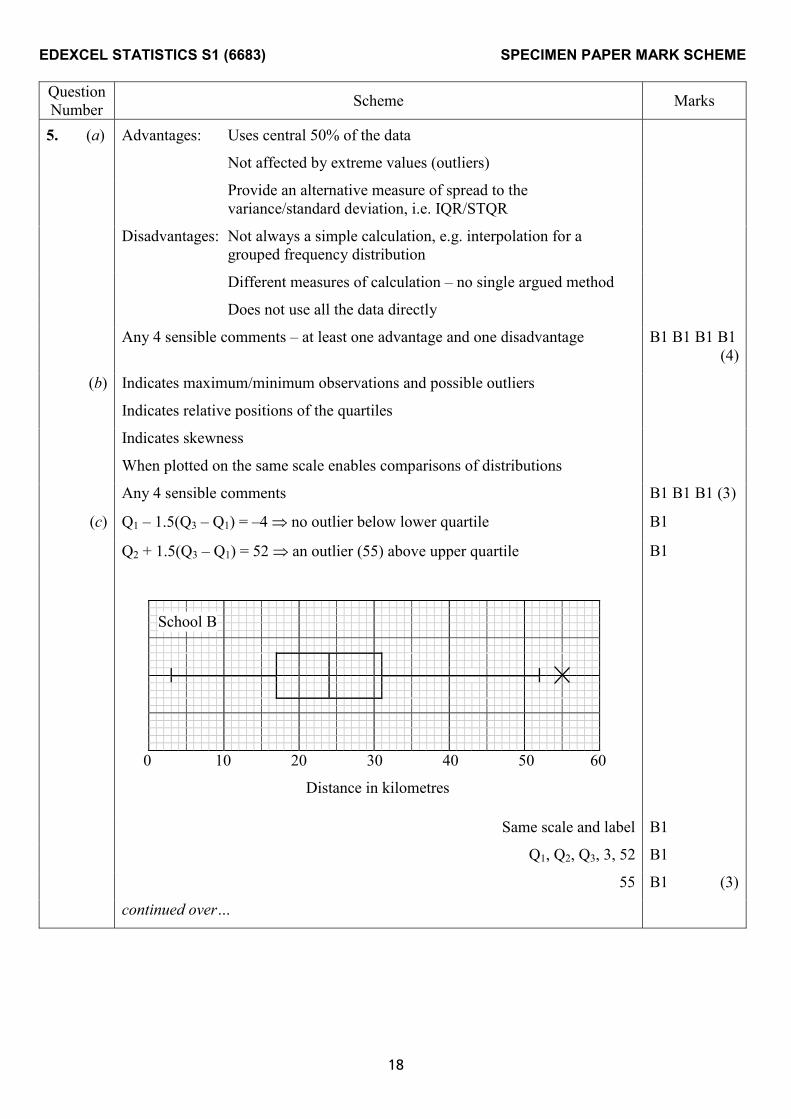
continued over…
0 10 20 3
Distance i
School B
0 40 50 60
n kilometres
NU
Same scale and label B1
Q1, Q2, Q3, 3, 52 B1
55 B1 (3)
EDEXCEL STATISTICS S1 (6683) SPECIMEN PAPER MARK SCHEME
19
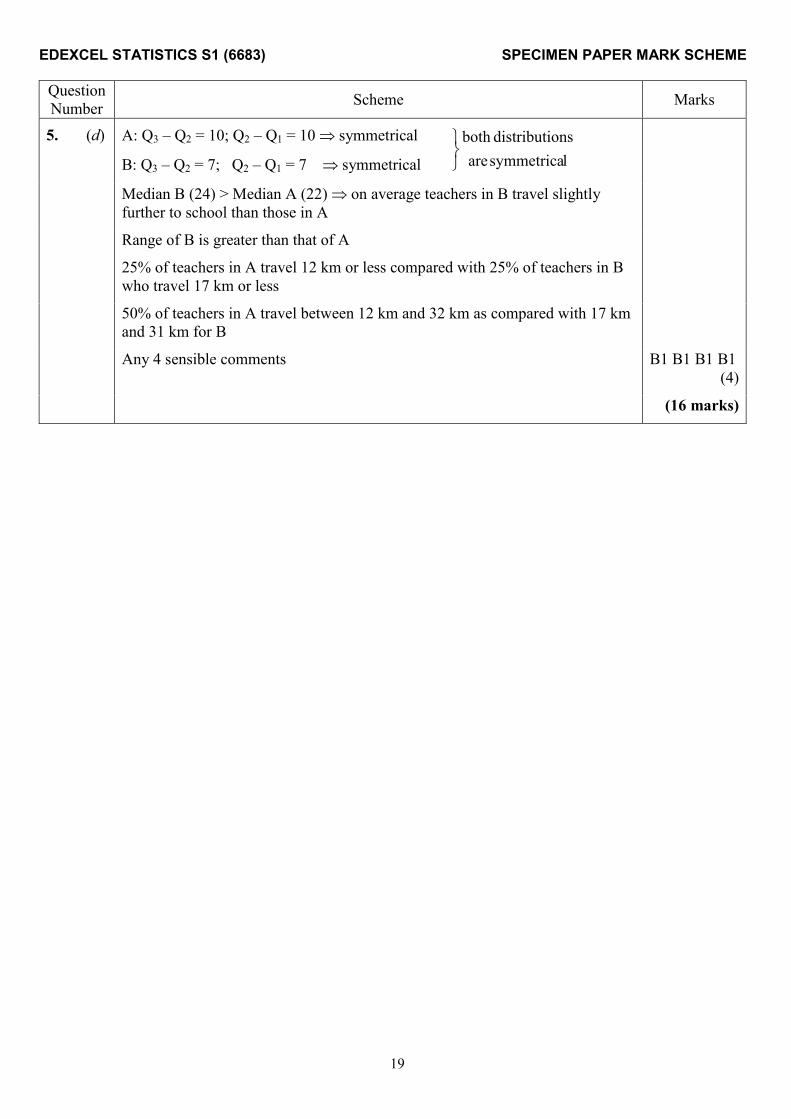
QuestionNumber Scheme Marks
5. (d) A: Q3 – Q2 = 10; Q2 – Q1 = 10 � symmetrical
B: Q3 – Q2 = 7; Q2 – Q1 = 7 � symmetrical lsymmetricaareonsdistributiboth
���
Median B (24) > Median A (22) � on average teachers in B travel slightly further to school than those in A
Range of B is greater than that of A
25% of teachers in A travel 12 km or less compared with 25% of teachers in Bwho travel 17 km or less
50% of teachers in A travel between 12 km and 32 km as compared with 17 kmand 31 km for B
Any 4 sensible comments B1 B1 B1 B1(4)
(16 marks)
EDEXCEL STATISTICS S1 (6683) SPECIMEN PAPER MARK SCHEME
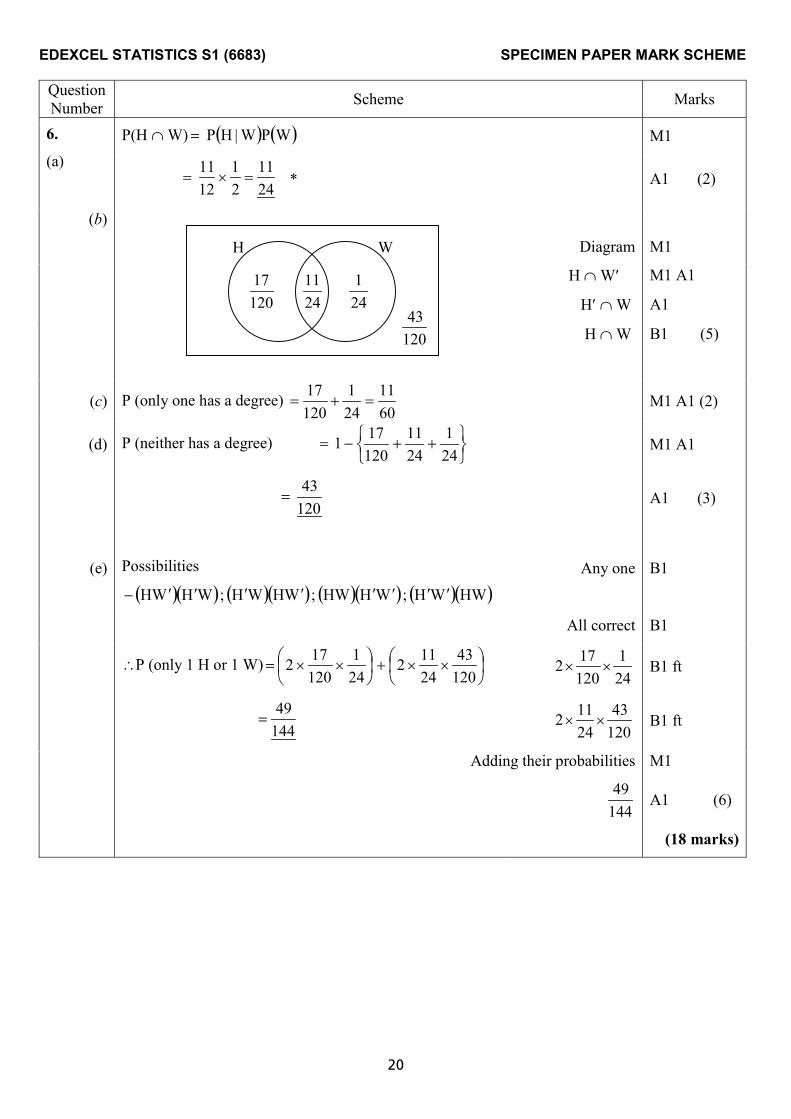
OM
QuestionNumber Scheme Marks
P(H � W) � � � �WP W| HP � M16.
(a) ����
2411
21
1211 A1 (2)
(b)
Diagram M1
H � W� M1 A1
H� � W A1
H � W B1 (5)
2411
WH
12017
241
12043
(c) P (only one has a degree) 6011
241
12017
��� M1 A1 (2)
(d) P (neither has a degree) ���
���
���241
2411
120171 M1 A1
12043 � A1 (3)
(e) Possibilities
� �� � � �� � � �� � � �� �HWWH ; WHHW ; WHWH ; WHWH ���������
Any one B1
All correct B1
�P (only 1 H or 1 W) �
� �
����
�
� �
���
12043
24112
241
120172
241
120172 �� B1 ft
14449
�
12043
24112 �� B1 ft
Adding their probabilities M1
14449
A1 (6)
(18 marks)
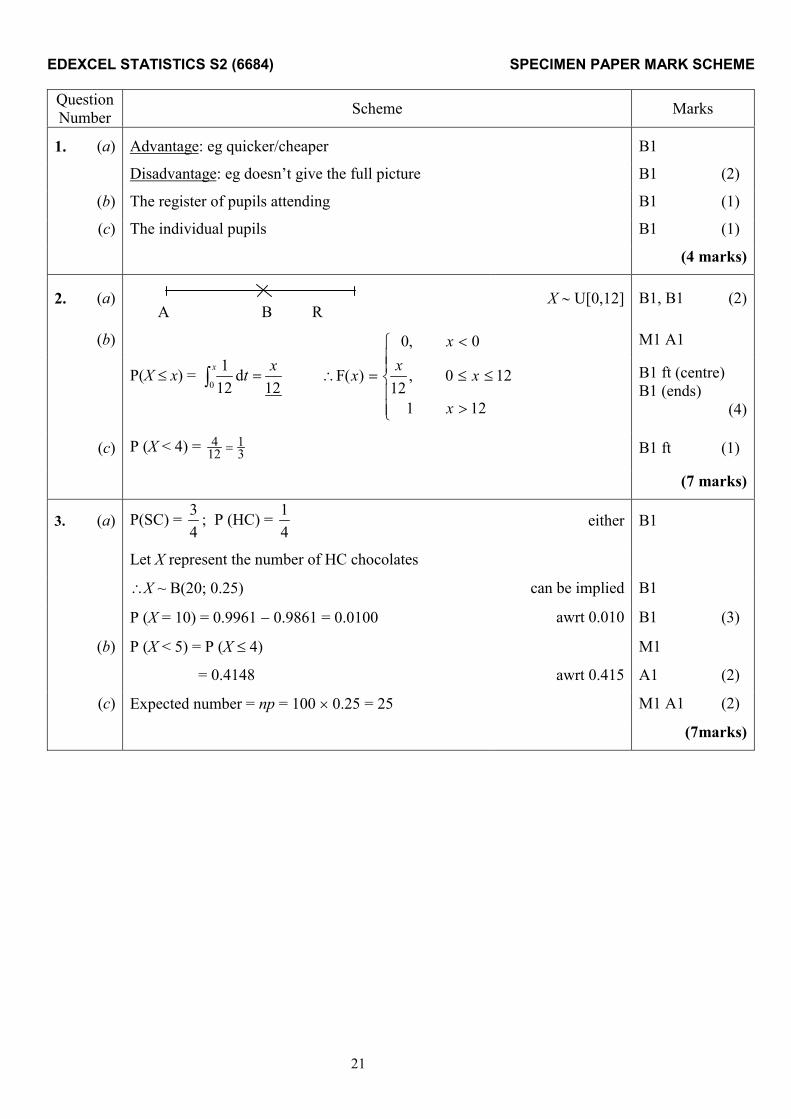
EDEXCEL STATISTICS S2 (6684) SPECIMEN PAPER MARK SCHEME
21
QuestionNumber Scheme Marks
1. (a) Advantage: eg quicker/cheaper B1
Disadvantage: eg doesn’t give the full picture B1 (2)
(b) The register of pupils attending B1 (1)
(c) The individual pupils B1 (1)
(4 marks)
2. (a)
A B RX U[0,12] B1, B1 (2)
(b) M1 A1
P(X x) = � �
x xt
0 12d
121
��
�
��
�
�
�
��
�
�
121
120,12
0,0
)(F
x
xxx
x B1 ft (centre)B1 (ends)
(4)
(c) P (X < 4) = 31
124
� B1 ft (1)
(7 marks)
3. (a) P(SC) = 43 ; P (HC) =
41
either B1
Let X represent the number of HC chocolates
�X ~ B(20; 0.25) can be implied B1
P (X = 10) = 0.9961 � 0.9861 = 0.0100 awrt 0.010 B1 (3)
(b) P (X < 5) = P (X 4) M1
= 0.4148 awrt 0.415 A1 (2)
(c) Expected number = np = 100 � 0.25 = 25 M1 A1 (2)
(7marks)
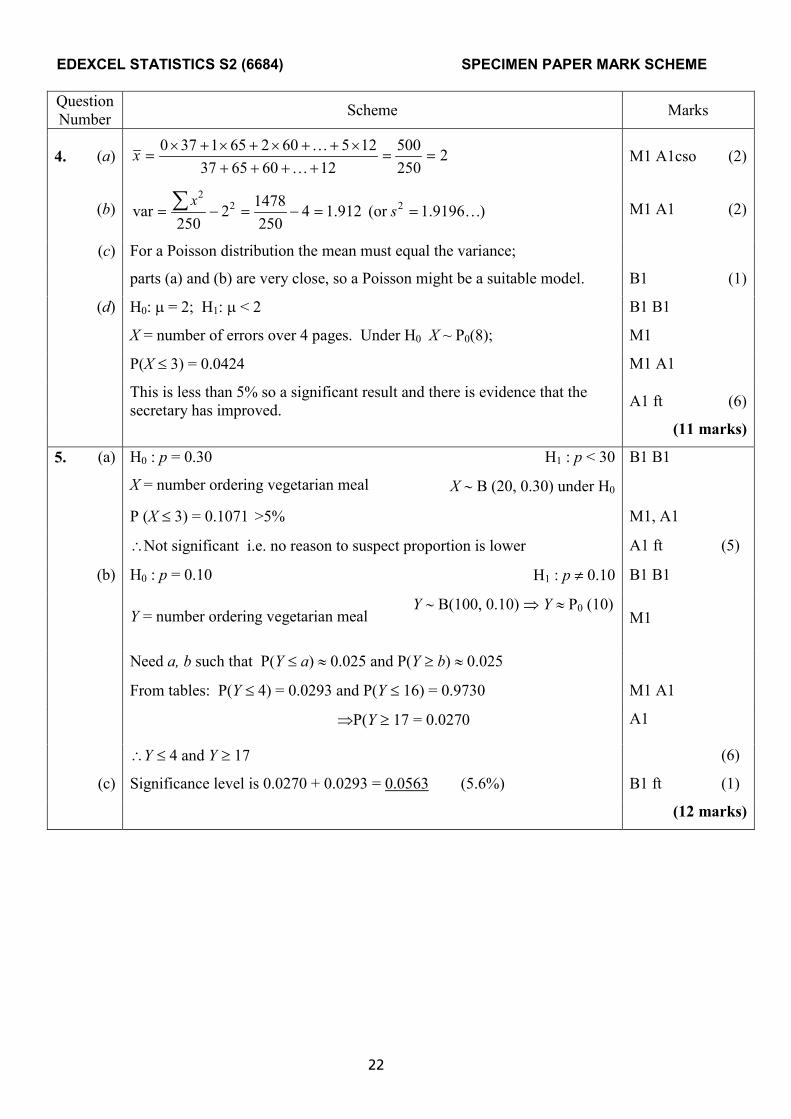
EDEXCEL STATISTICS S2 (6684) SPECIMEN PAPER MARK SCHEME
OO
QuestionNumber Scheme Marks
4. (a) 2250500
12606537125602651370
��
����
��������
�
�
�x M1 A1cso (2)
(b) )9196.1(or 912.14250
14782250
var 222
�������
� sx M1 A1 (2)
(c) For a Poisson distribution the mean must equal the variance;
parts (a) and (b) are very close, so a Poisson might be a suitable model. B1 (1)
(d) H0: � = 2; H1: � < 2 B1 B1
X = number of errors over 4 pages. Under H0 X ~ P0(8); M1
P(X 3) = 0.0424 M1 A1
This is less than 5% so a significant result and there is evidence that thesecretary has improved. A1 ft (6)
(11 marks)
5. (a) H0 : p = 0.30 H1 : p < 30 B1 B1
X = number ordering vegetarian meal X B (20, 0.30) under H0
P (X 3) = 0.1071 >5% M1, A1
�Not significant i.e. no reason to suspect proportion is lower A1 ft (5)
(b) H0 : p = 0.10 H1 : p � 0.10 B1 B1
Y = number ordering vegetarian mealY B(100, 0.10) � Y P0 (10)
M1
Need a, b such that P(Y a) 0.025 and P(Y � b) 0.025
From tables: P(Y 4) = 0.0293 and P(Y 16) = 0.9730 M1 A1
�P(Y � 17 = 0.0270 A1
�Y 4 and Y � 17 (6)
(c) Significance level is 0.0270 + 0.0293 = 0.0563 (5.6%) B1 ft (1)
(12 marks)
EDEXCEL STATISTICS S2 (6684) SPECIMEN PAPER MARK SCHEME
23
QuestionNumber Scheme Marks
6. (a) X = number of sheep per square X P0 (2.25) B1 (1)
(b) � � ... 105399.0e0P -2.25���X awrt 0.105 B1 (1)
(c) P (X > 2) 1 � P (X 2), =1– � �
���
�
���
���
!225.225.21e
22.25- M1, M1
A1
1 � 0.60933… = 0.39066 awrt 0.391 A1 (4)
(d) Sheep would tend to cluster – no longer randomly scattered B1 (1)
(e) Y P0 (20) � normal approx, � = 20, � = 20 M1, A1
P (Y < 15) = P (Y 14.5), ��
���
���
2020-14.5P Z 2
1� M1, M1
P� (Z �1.2298…) A1
= 1 � 0.8907 = 0.1093 AWRT 0.109 M1 A1 (7)
(14 marks)
EDEXCEL STATISTICS S2 (6684) SPECIMEN PAPER MARK SCHEME
OQ
QuestionNumber Scheme Marks
7. (a) B1, B1
B1
��
���
�
2027,
201
(3)
(b) � � 42.2100242
100d
201E
3
1
53
1
4 ����
���
��� �
xxxXM1 [M1]
A1(3)
(c) � �� ������
���
����
3
1 22
3
1
6252 21026.042.2
120728
120d
201
���xxx M1 [M1]
� � = 0.459 A1 cso (3)
(d) � � � ����
���
���
xx
xtttxX1
4
1
43
801
8080d
201P M1 � �xM 11 A1 cso
� � � ���
��
�
�
��
�
�
331
1
1
1801
0F 4
xx
xxx B1 ft, centre
B1 ends(5)
(e) � � � � ... 14.221411
80125.0F 44
�������� pppp M1 A1
� � � � ... 79.261431
80175.0F 44
�������� qqqq A1
IQR=0.65 A1 ft (4)
(f) 612.0459.034IQR ��� , B1
Sensible comment, e.g. reasonable approximation or slight underestimate B1 (2)
(20 marks)
EDEXCEL STATISTICS S3 (6670) SPECIMEN PAPER MARK SCHEME
qìêå=lîÉê25
QuestionNumber Scheme Marks
1. (a) Label members 1 → 240 B1
Use random numbers to select first from 1 – 8 B1
Select every 8th member (e.g. 6,14, 22, …) B1 (3)
(b) e.g.: More convenient, efficient, faster etc. Any 1 B1 (1)
(4 marks)
2. (a) � �22
2 110,N :ie 168 110,N ���
�
����
�� PP Normal B1
110, 22 B1 (2)
(b) � �113110P �� P ��
���
����
2110-1130P Z Standardising M1
= P (0 < Z< 1.5) A1 ft
= 0.4332 AWRT 0.433 A1 (3)
(5 marks)
3. (a) Let T represent total time
�E (T) = 225 + 165 + 185 = 575 575 B1
Var (T) = 382 + 232 + 272 = 2702 2702 B1
�P (533 < T < 655) = P (�0.81 < Z < 1.54) StandardisingM1 A1
ft
= 0.7292 AWRT 0.729 A1 (5)
(b) Let D represent the difference in times for tasks B and C (i.e. B � C)
� E(D) = 165 � 185 = �20 B1
Var(D) = 232 + 272 = 1258 B1
� �0P �� D � ���
���
���
125820--0P Z
Standardising
1258 ,20�
M1 A1
ft
= P(Z > 0.56)
= 0.2877 AWRT 0.288 A1 (5)
(10 marks)
EDEXCEL STATISTICS S3 (6670) SPECIMEN PAPER MARK SCHEME
OS
QuestionNumber Scheme Marks
4. (a) Attendance ranks 2, 1, 8, 5, 3, 6, 7, 4 B1
� d2 = 48 Attempt to find 2d� M1 A1
rs6384861
�
�
�� Substitution of their 2d� M1
= 0.4286 awrt 0.429 A1 ft (5)
(b) .0:H 0; :H 1o �� �� both B1
With n=8, critical value is 0.7381 0.7381 B1
Since 0.429 is not in the critical region � �7381.0or 7381.0 ��� �� then thereis no evidence to reject oH and it can be concluded that at the 5% level there is no evidence of correlation between league position and attendance
Correct comparison M1
Conclusion A1 ft (4)
(c) Share ranks evenly. B1
Use product moment correlation coefficient on ranks. B1 (2)
(11 marks)
5. (a) � � 6 , ... 2, ,1 ;61P ��� xxX . B1 B1 (2)
(b) Discrete uniform distribution B1 (1)
(c) :Ho Discrete uniform distribution is a suitable model B1
:H1 Discrete uniform distribution is not a suitable model B1
� = 0.05 � = 5; CR: �2 > 11.070 B1 B1
� ��
�
EEO 2
� �222222 13138219501
������ All E’s=50 B1
76.950448
��
� ��
�
EEO 2
M1 A1
Since 9.76 is not in the critical region there is no evidence to reject H0 and thusthe data is compatible with the assumption.
A1 ft (8)
(11 marks)
EDEXCEL STATISTICS S3 (6670) SPECIMEN PAPER MARK SCHEME
27
QuestionNumber Scheme Marks
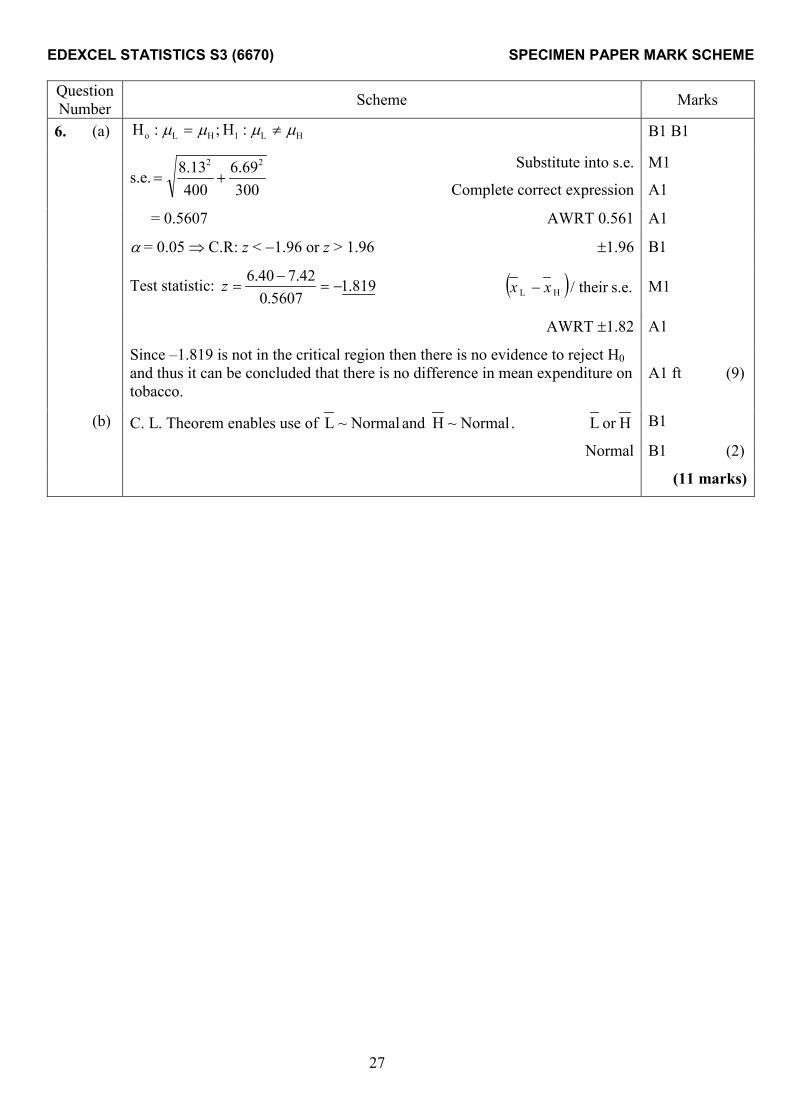
6. (a) HL1HLo :H ;:H ���� �� B1 B1
s.e.30069.6
40013.8 22
��
Substitute into s.e.
Complete correct expression
M1
A1
= 0.5607 AWRT 0.561 A1
� = 0.05 � C.R: z < �1.96 or z > 1.96 �1.96 B1
Test statistic: 819.15607.0
42.740.6��
�
�z � � s.e. their / HL xx � M1
AWRT �1.82 A1
Since –1.819 is not in the critical region then there is no evidence to reject H0and thus it can be concluded that there is no difference in mean expenditure ontobacco.
A1 ft (9)
(b) C. L. Theorem enables use of Normal~H and Normal~L . Hor L B1
Normal B1 (2)
(11 marks)
EDEXCEL STATISTICS S3 (6670) SPECIMEN PAPER MARK SCHEME
OU
QuestionNumber Scheme Marks
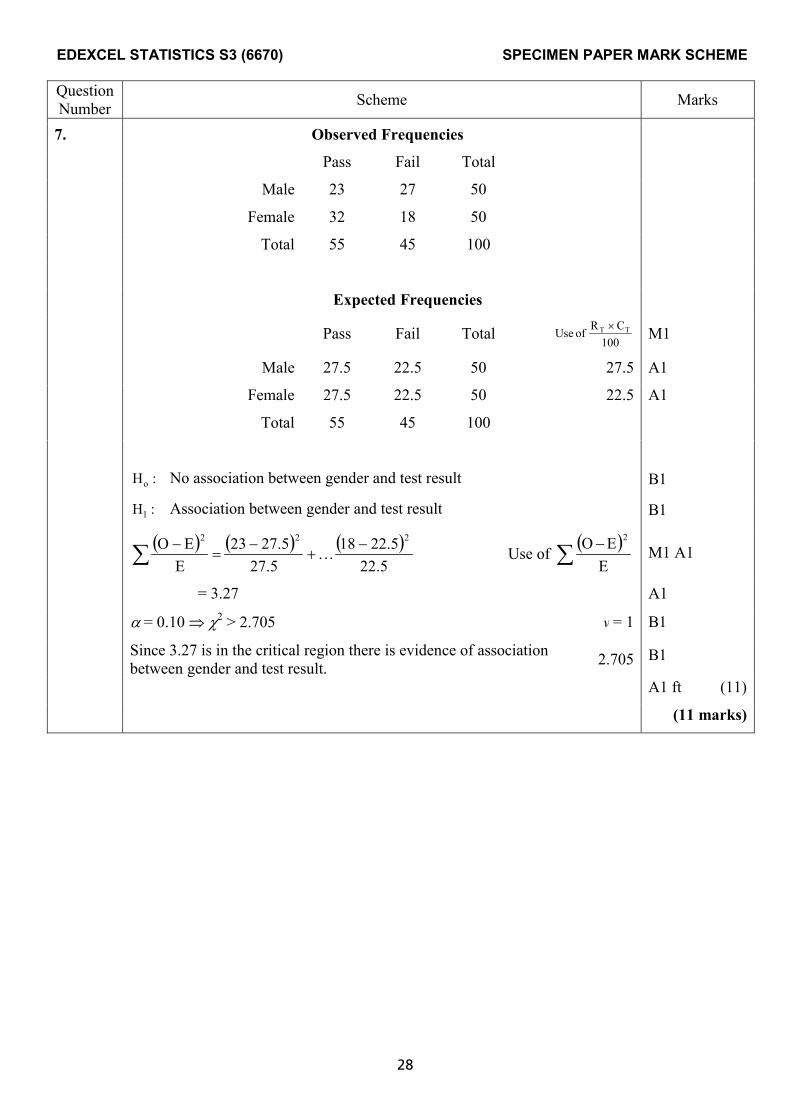
7. Observed Frequencies
Pass Fail Total
Male 23 27 50
Female 32 18 50
Total 55 45 100
Expected Frequencies
Pass Fail Total100
CR of Use TT � M1
Male 27.5 22.5 50 27.5 A1
Female 27.5 22.5 50 22.5 A1
Total 55 45 100
:Ho No association between gender and test result B1
:H1 Association between gender and test result B1
� � � � � �5.22
5.22185.27
5.2723E
E O 222�
��
��
� � Use of � �
��
EEO 2
M1 A1
= 3.27 A1
� = 0.10 � �2 > 2.705 v = 1 B1
Since 3.27 is in the critical region there is evidence of associationbetween gender and test result. 2.705 B1
A1 ft (11)
(11 marks)
EDEXCEL STATISTICS S3 (6670) SPECIMEN PAPER MARK SCHEME
29
QuestionNumber Scheme Marks
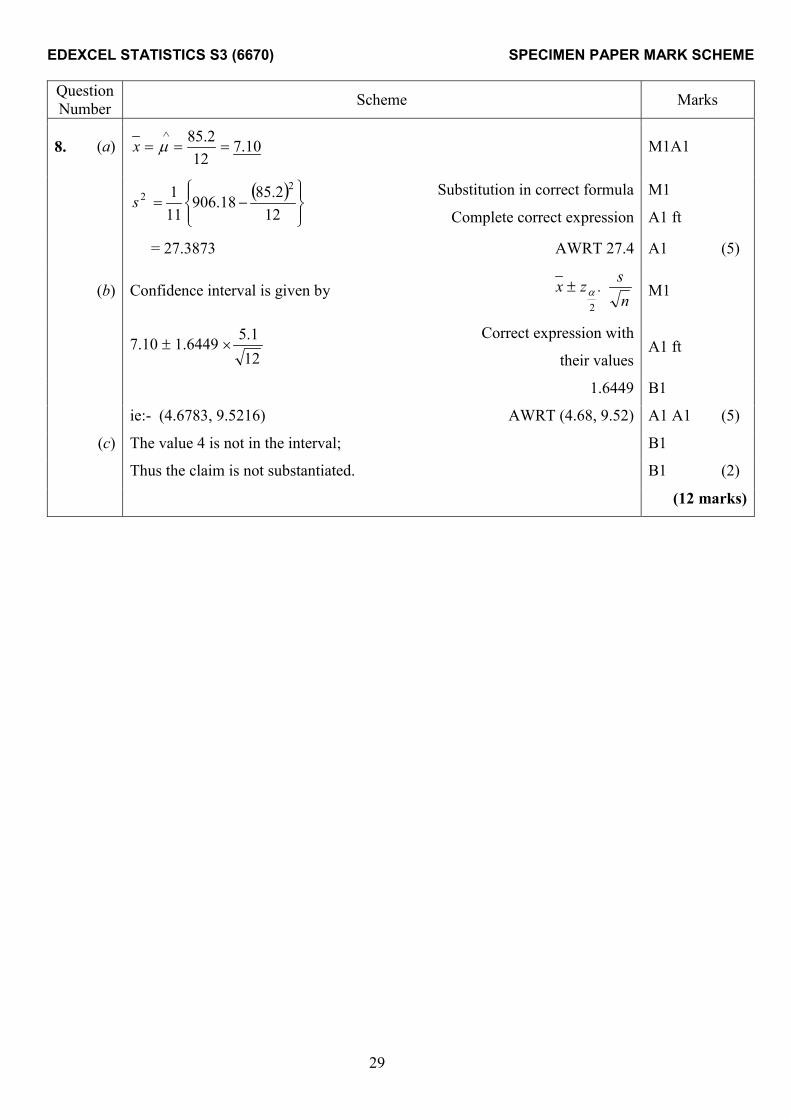
8. (a) 10.712
2.85 ���
�
�x M1A1
2s � �
��
���
��
���
�12
2.8518.906111 2 Substitution in correct formula
Complete correct expression
M1
A1 ft
= 27.3873 AWRT 27.4 A1 (5)
(b) Confidence interval is given by ns. zx
2�
� M1
7.10 � 1.6449 �121.5 Correct expression with
their valuesA1 ft
1.6449 B1
ie:- (4.6783, 9.5216) AWRT (4.68, 9.52) A1 A1 (5)
(c) The value 4 is not in the interval; B1
Thus the claim is not substantiated. B1 (2)
(12 marks)