Embed Size (px)
Citation preview

S10 Timber Supply Analysis, Spatial Harvest Sequence Report
July 25, 2007
March 1, 2012 Final S10 Timber Supply Analysis © 2012 Government of Alberta
Page 1 of 35

Table of Contents Section 1: Timber supply history....................................................................................... 3 Section 2: Selection of the PFMS ....................................................................................... 4 Section 3: Key strategies of the PFMS, from a timber supply perspective ........................ 4 Section 4: Net land base, and Growth & Yield summary.................................................. 6 Section 5: Details on the timber supply ............................................................................. 6
Aspatial parameters:........................................................................................................ 6 Regeneration lag ............................................................................................................. 8 Stand transitions.............................................................................................................. 8 Incidental deciduous ....................................................................................................... 8 Over-mature forest targets .............................................................................................. 9 Cull.................................................................................................................................. 9 Growing stock targets ................................................................................................... 10 Existing cut block and MOF yield assignments ........................................................... 10 Minimum harvest ages.................................................................................................. 10 Fire smart ...................................................................................................................... 11
Section 6: Harvest levels:.................................................................................................. 13 Coniferous harvest levels.............................................................................................. 13 Deciduous harvest levels: ............................................................................................. 14 Proposed AAC: ............................................................................................................. 15
Section 7: Spatial harvest sequence, and assessment....................................................... 16 Section 7.1. Area by seral stage. .................................................................................. 17 Section 7.2: Patch analysis for juvenile stands. ........................................................... 18 Section 7.3. Area disturbed by compartment............................................................... 22 Section 7.4: Over-mature patch analysis. .................................................................... 23 Section 7.5 Permanent access. ..................................................................................... 27 Section 7.6. Salvaged burns ......................................................................................... 28 Section 7.7: Coarse filter management ........................................................................ 28 Section 7.8: Wood profile (Conifer land base only) ..................................................... 32 Section 7.9: Piece size................................................................................................... 33
Section 8: Final thoughts and follow-up items ................................................................ 35
March 1, 2012 Final S10 Timber Supply Analysis © 2012 Government of Alberta
Page 2 of 35

Section 1: Timber supply history The currently approved spatial harvest sequence (SHS) for S10 was developed in 2002. Operationally, there had been issues relating to following the harvest sequence, and the quota holders were allowed to pick up additional blocks on the east side of the forest management unit (FMU). The Area was concerned that this might have impacted the long-term harvest level. The sequence and timber supply analysis (TSA) were revisited in June 2004, in what was described as a TSA/ forest management plan (FMP) update. Since 2004, there has been multiple net land bases developed for the S10 area, along with multiple changes to the preferred scenario, which primarily involved incorporating additional information in the TSA model. The timber supply analysis was completed outside of the current Planning Standard, which was not approved until 2006.This TSA was never expected to meet the standard. However, work was done in some areas of the analysis, mainly reporting, to align the two processes as the Planning Standard got closer to being approved. Various scenarios have been tested over the last three years, and elements of these past runs were used to select a preferred forest management scenario (PFMS). This does not mean that all the older runs were re-done under the new land base conditions, only that the direction suggested by past runs was incorporated either as a constraint, or integrated into the TSA approach. Consistent approaches include:
Allowance of a maintenance cut, which preserves the current AAC with the intent of stepping down to the sustainable harvest level over 20 years.
Subjective harvest deletions for unproductive stands, as described in the net land base documentation.
Yield curves used during analysis. Liability and strata assumptions regarding historic cut blocks. Intent to meet FireSmart needs by pre-blocking areas south-east of Red Earth as a
firebreak, and not to require species conversion as part of the plan. New information includes:
Compartment boundaries, which assist in re-distributing the harvest across the FMU.
Caribou management direction, which prevents harvesting in the caribou zone for the first 30 years of the plan, with the intent of using some harvesting after then to mitigate the impact of linear disturbance.
The decision to realign both Alberta Plywood (APL) and Boucher Brothers’ quotas to 2006, and the sequencing of additional wood in the first quadrant to reflect this.
March 1, 2012 Final S10 Timber Supply Analysis © 2012 Government of Alberta
Page 3 of 35

Section 2: Selection of the PFMS In the fall of 2006, the various components of the plan were presented to the Forest Management Branch senior management for comments. These components were discussed in light of both the past analysis and social issues, and direction was given for a final run. The last major changes were made, and a draft sequence was produced. Staff in the Slave Lake office spent time developing a first-draft of an operational sequence that aggregated blocks within each compartment into a more operable pattern. This work was presented to the quota holders for field review, and accepted without changes. The quota holders divided the scheduled wood between themselves by assigning blocks on a township basis, which will be reflected in the new quota spheres. Once the sequence was reviewed by the entire planning team, it was locked into the model as a series of pre-blocks, and 50 additional years were spatially modelled to produce a 70 year spatial harvest window. The long-term aspatial harvest level was re-calculated in response to these manual changes. The Forest Planning Section had requested a series of tests for the SHS to see how it behaved with respect to future forest conditions, which are found later in this document.
Section 3: Key strategies of the PFMS, from a timber supply perspective The first key strategy was to allow maintenance of the existing approved AAC while gradually stepping down to the sustainable long-term harvest level. Over twenty years, we will step down the current harvest level of 122,903 m3/year to a new long-term harvest level of 91,561 m3/year. The current harvest level does not meet the Planning Standards for the maximum allowable uplift relative to the long-term sustainable harvest level. Future TSA work should reference 91,561 m3/year as the sustainable AAC and the starting conditions for future plans, not the interim step-down values. See figure 3.1 for a generalized view of this approach. The second key strategy was to redistribute the harvest back across the FMU through the integration of compartment boundaries. Exceptions had been made in 2002 to deviate from the spatial harvest sequence, and operations had been concentrated on the east side of the FMU. This strategy will allow a more sustainable harvest flow from each of the three compartments. The spatial harvest sequence will be followed, as per the Planning Standard. If a compartment cut is not accessed within a quadrant, the wood cannot be taken from another compartment. The quota certificates will need to be re-worded to limit the allowable cut to a compartment level, as well as to describe the FMU total. The volumes allocated to deal with a quadrant re-alignment were also assigned to a specific
March 1, 2012 Final S10 Timber Supply Analysis © 2012 Government of Alberta
Page 4 of 35

compartment, in particular the ones that had sufficient mature growing stock to allow for the additional harvest without strongly influencing the long-term harvest level. Period: 1 2 3 4 Long term
OtterCadotteRed Earth
Qua
dran
t
Adj
ustm
ent
Mai
nten
ance
cut
S
usta
inab
le e
ven
flow
+ 123,222 m3, one-time allotment
current AAC = 122,903 m3
A midpoint between current and sustainable
Sustainable harvest
Figure 3.1: Generalized approach to the compartment Timber Flows. Five year periods are presented.
The third key strategy was the approach to harvesting in the caribou zone1. Currently there is no Provincial Strategy for the area, and the S10 approach tried to address this issue in the interim. The original strategy was to exclude harvesting until the next plan, when hopefully the Provincial Strategy would be completed. The revised strategy allowed some harvesting in the Red Earth caribou zone thirty years in the future, but the additional growing stock from this merchantable area could not influence the compartment harvest level through a short-term harvest uplift. From a modelling perspective, the harvest level for Red Earth was capped at the even-flow volume seen in runs that didn’t include the area contributions from the caribou zone. Blocks could be sequenced to a limited degree in starting in year 30. No more than 20 percent of the caribou zone could be in a juvenile state (defined as four periods or
1 The caribou zone is primarily found in the Red Earth compartment, and management activities were focussed there.
March 1, 2012 Final S10 Timber Supply Analysis © 2012 Government of Alberta
Page 5 of 35

younger) during this time. The intent is that future harvesting will be used to restore habitat damage done through the heavy linear industrial use that exists in the area.
Section 4: Net land base, and Growth & Yield summary The net land base was developed using multiple spatial layers to define the productive forest, and account for land use activities that preclude harvesting activities. Details can be found in the net land base documentation. The most significant limitation is that the Alberta Vegetation Inventory (AVI) for the area is old; aerial photography was taken in 1989, and land use depletions are not captured to within 2 years of the effective date of the inventory. Work was done to capture all past harvests, but errors may have occurred due to incomplete or inaccurate block submissions. The best work was done given the available data. Yield curves were developed using temporary sample plots collected by DMI within the FMU, and tied to the AVI label for the sampled stand. Choices in yield strata reflect the management decisions made in 2004, rather than the minimum strata presented in the Planning Standard. Alternate regeneration standards to validate yields were not developed for S10. Detailed yield curve information can be found in the Growth and Yield documentation. One assumption that was not tested through sensitivity analysis was the assignment of all understorey conifer stands to the conifer land base. The D(C) stratum1 describes stands with an overstorey deciduous call and an understorey that could belong to the conifer land base and didn’t have any subjective deletions tied to it. These understorey calls were not assigned through a detailed leaf-off understorey inventory nor refined further to address operational issues such as density or height requirements. Data was not available for older stands in this stratum, so the volume at rotation age has some uncertainty. As this yield stratum covers 30,660 ha (or 20.2 % of the active conifer land base), any changes to this stratum will have an effect on the long-term harvest levels.
Section 5: Details on the timber supply Aspatial parameters: The final timber supply model was run using Remsoft’s Woodstock 2006.10 (abbreviated as WS) system and blocked using Stanley 2006.10. Earlier runs were done on older versions of the software. Aspatial modelling was conducted as an optimization
1 The D(C) stratum may also be referred to its THEME1 attribute of ‘SWI’ in some tables, which is a reference to the common practice of referring to these stands as switch stands.
March 1, 2012 Final S10 Timber Supply Analysis © 2012 Government of Alberta
Page 6 of 35

formulation where the target function (in this case, primary conifer and deciduous volume) is maximised for each compartment. Spatial blocking was conducted through a simulation process where a harvest sequence is chosen while considering cut block size targets, adjacency and proximity weightings. Constraints based on management objectives and department policies were included in the modelling process. Manual changes were made to the raw Stanley output by the Area staff in order to make the 20 year sequence operational; these changes were assessed through re-calculating the long-term sustainable harvests. Values presented for spatial harvest levels include deductions for cull. Stand retention (currently set at 3% representative merchantable timber, in varying patches depending on the final opening size) will be removed as timber drain, rather than from the final AAC. The Planning Standard for 5% reduction of post-harvest area due to roads and landings has not been applied. In lieu, SRD and the quota holders will develop and adhere to a monitoring program to assess their efforts prior to the plan’s approval, which will be appended to the documentation.
Parameter Value used Regeneration lag Con 2 years, Dec 0 years AWC post-harvest transition Area-weighted composite to Closed SW SWI post-harvest transitions Switch stands to Closed CD mixed-wood
Density post-harvest transitions Open (A+B density) to closed (C+D density) Incidental Deciduous rules Step function ( 10%) to smooth flow MOF yield curve assignment Assigned as switch stands Aspatial green-up locks on existing blocks and historic blocks without retention No Method used to assign block ages Skid date, other if unknown Historic block yields Area-weighted composite for conifer LB Lifespan ConLB = 250 years, DecLB = 200 years Firesmart actions Pre-block designated stands in Period 1 Minimum harvest age 90 conifer, 120 DC/SWI, 70 deciduous Model the maintenance cut Yes Growing stock constraint 2005 version: stable for last 1/4 of horizon Old growth targets On Table 5.1: Summary of the aspatial parameters used in the Woodstock model. A divided land base was used, with a primary and incidental harvest coming from both the conifer and deciduous land bases. A wide range of forested stand types contributed to the conifer land base, including conifer leading, all the mixed-woods, the deciduous with a recognizable understorey that could meet the merchantability criteria, and all the MOF
March 1, 2012 Final S10 Timber Supply Analysis © 2012 Government of Alberta
Page 7 of 35

treatment blocks. The remainder of the forest falls under the deciduous land base, and covers the fully- and partially stocked pure deciduous stands. The first four periods (twenty years) had fixed harvest levels to produce the volumes committed through the maintenance harvest level, and the quadrant re-adjustment process. The conifer harvest level was forced to be even flow aspatially from period five and onwards. For the individual parameter descriptions, there is an estimate of the magnitude of the effect for changing the parameter. “Low” describes an AAC impact less than 2.5 percent, “Moderate” describes between 2.5 and 10 percent, and “High” describes an AAC impact of greater than 10%. Regeneration lag A two-year lag was applied to all conifer curves, and no lag was applied to deciduous curves. Local silvicultural data from regenerating stands was not available to help guide this decision. Lag was applied to the yield curves when importing the data into Woodstock. Due to differences in yield curve formats between tabular and .dll inputs, a 1-period lag was applied to the area-weighted composite curves. Not including the described regeneration lags had a low AAC gain. Stand transitions There were a few assumptions made when addressing post-harvest transitions.
Silvicultural practices will convert all A+B density stands into fully stocked stands. Where a fully stocked yield curve was available, it was applied to all regenerated A+B density stands as a regeneration transition.
Harvesting stands that are currently assigned to the area-weighted composite, mainly the historic cut blocks, would also result in a fully stocked spruce stand.
Harvesting a D(C) stand would result in a fully stocked CD mixedwood stand due to the influence of residual mature aspen at the time of harvest, rather than being assigned to the fully stocked Sw curve. This assumption may need to be validated at the time of harvest and adjusted in future TSA work. This applied to both the switch stands and the MOF blocks.
If these modelled transitions do not occur as predicted, there will be a high AAC fall-down. Incidental deciduous The Area had requested that the incidental deciduous harvested from the conifer land base be held at a relatively constant even flow to ensure consistency from year to year. The aspatial model allowed the incidental harvest level to step up or down by 5,000 m3
March 1, 2012 Final S10 Timber Supply Analysis © 2012 Government of Alberta
Page 8 of 35

per consecutive period (which is approximately 10% of the post-SHS incidental volume for period 1). This changed the aspatial wood profile to include mixed-wood blocks in the sequence for all periods, rather than focus the harvest in mature conifer stands and experience spikes in the incidental harvest levels in the future. This was not explicitly addressed when blocking, other than through meeting the aspatial wood profile for each period / compartment. Not including an incidental deciduous constraint had a moderate gain on the conifer AAC, but also caused high spikes of incidental deciduous. Over-mature forest targets The over-mature forest targets for the active land base were set as the difference between the percentage of the total land base currently over mature, and the percentage what will be represented in the Passive Land base (assuming that it all becomes over-mature). This approach tries to ensure that the active land base still contributes the current proportion of over-mature area throughout the planning horizon. This was an aspatial target, and the over-mature area did not have to be in a given compartment, or in discrete patches or connective corridors. Over-mature was defined as 40 years older than the age where the maximum MAI occurs, and varied by stratum.
YC
Target percentage in the TSA
Resulting area (Ha)
Con-Sw 1.40% 471.4 Dec 3.50% 3204.4 Mix 1.00% 200.8
Con-PL 1.00% 51 Table 5.2: Old growth targets for the active land base. The constraint was in effect from years 30 onward for most strata, and year 40 onward for pine to allow stands to grow into the old age class. Constraining the model to provide over-mature area had a low AAC impact. Cull The cull percentages for conifer were based on scale reports produced by APL, and were set at 2.5%. Deciduous cull percentages were set at the provincial average of 10%. Cull was taken off the yield curves when they were put into Woodstock. Merchantable volumes do not include any estimate for waste and breakage.
March 1, 2012 Final S10 Timber Supply Analysis © 2012 Government of Alberta
Page 9 of 35

Growing stock targets Growing stock targets were taken from the 2005 draft planning manual, where the final operable growing stock is required to be stable for the last quarter of the planning horizon. The magnitude of the growing stock isn’t as important as the consistency of supply. This was interpreted by using a non-declining constraint on the growing stock for periods 30-40. Using the growing stock constraint historically used by SRD, which required that the final growing stock be greater than the average growing stock, had a low AAC impact. No runs were done without having some type of growing stock constraint in place. Existing cut block and MOF yield assignments The yield assignments for cut blocks and MOF blocks were described in the net land base documentation. Since these assignments were determined in conjunction with the Harvesting and Renewal section, sensitivity analysis was not performed on this parameter. Not all of the cut blocks could be tied to an ARIS record, or have been surveyed prior to 1991, producing designations which don’t meet the Planning Standard. If new inventory information is available for the next plan, the aerial interpretation should be used to classify the pre-1991 blocks, while retaining any known management information to prevent losing their designation as cut blocks. For this plan, these stands were assigned to an area-weighted composite curve for the conifer land base. The standard approach of using the AVI stand label was not followed, due to the age of the inventory (1989) relative to the 1991 cut-off. Minimum harvest ages Examining the yield curves showed that the maximum MAI for the conifer typically occurred between 100 and 130 years for the majority of the strata. This was considered to be too old by the planning team, so the majority of the harvest ages were reduced to 90 years. The exceptions were the DC and the D(C)1, as these were considered to be reserve stands for future conifer production. Previous field validation had shown that these stands had not been merchantable at 90 years of age, so they were delayed from harvesting until they reached 120 years. Current stands that were older than 120 years were allowed to be sequenced, with the exception of past ground-based deferrals which became passive land base. This decision over-rode the 2002 approach of locking all existing DC stands for 40 years to allow time to mature, and older DC stands could
1 D(C ) are described as stands which have a deciduous overstorey, with a recognizable conifer understorey that meets the merchantability tests for the conifer land base. The majority of these stands are young, with an overstorey age near 60 years old. The deciduous will not be harvested or thinned, but it is expected that succession will produce a conifer crop in the future.
March 1, 2012 Final S10 Timber Supply Analysis © 2012 Government of Alberta
Page 10 of 35
appear in the harvest sequence before they fell apart (i.e. stand break up). Future volume sampling programs should be designed to better capture the growth potential of these understorey stand types. Early analysis showed that using the older harvest ages suggested by the Max MAI would have a moderate drop in AAC. In addition, changing this parameter has an effect on the piece size profile, as discussed in section 3.1. FireSmart Forest Protection had provided an initial risk assessment for the S10 FMU early in the planning process. Red Earth was the only community that warranted action at the strategic level. A series of mature stands to the southeast of the hamlet was identified as high-risk, and flagged for harvest in the first period. The intent is to convert these stands to a younger forest of the same fuel type (i.e. yield stratum), rather than convert them to a deciduous fuel type. There are ground rules relating to the FireSmart program occurring in the 10 km community zone that quota holders and the Area staff will adhere to. A complete FireSmart assessment on the final sequence was not completed by the Forest Planning Section. Long-run sustained yield average Details on LRYSA calculations can be found in tables 5.3 and 5.4. MAI values were taken from the yield curves at the time of harvest, and do not account for cull. After applying cull percentages of 2.5% for conifer and 10% for deciduous, we see the following values. The LRSYA for the conifer land base is 91,010.3 m3/year. The LRSYA for the deciduous land base is 136,448.4 m3/year
March 1, 2012 Final S10 Timber Supply Analysis © 2012 Government of Alberta
Page 11 of 35

Yield Curve
Yield curve description F_area (ha) Con MAI at harvest age
Con Weighted
contribution
Dec MAI at harvest age
Dec Weighted
contribution
AWC Area-weighted comp, Con 8,195.85 0.98 8,062.74 1.01 8,299.33 CBA Black spruce, all 1,427.60 0.96 1,370.50 0.13 185.59 CDC CD, closed 7,215.63 1.25 9,019.53 1.23 8,875.22 CDO CD, open 2,746.43 1.02 2,801.36 0.94 2,581.64 CPA Pine, all 5,099.30 1.33 6,782.06 0.15 764.89 CSC Spruce, closed 14,349.61 1.31 18,797.99 0.66 9,470.74 CSO Spruce, open 11,100.58 1.52 16,872.88 0.51 5,661.30 DCC DC, closed 7,976.56 1.36 10,848.12 0.72 5,743.12 DCO DC, open 2,130.34 0.76 1,619.06 1.51 3,216.81 SWI Switch stand D(C) 30,660.13 0.56 17,169.67 1.41 43,230.78
Table 5.3. Weighted contributions by yield stratum towards the long run sustained yield average for the conifer land base. MAIs used in the table reflect the MAI at the time of harvest rather than the MAX MAI.
Yield Curve
Yield curve description F_area (ha) Con MAI at harvest age
Weighted contribution
Dec MAI at harvest age
Weighted contribution
DAC Decid, closed 46,588.08 0.25 11,647.02 2.64 122,992.53 DAO Decid, open 11,444.22 0.05 572.21 1.88 21,515.14
AWD Area-weighted comp, Dec 2,856.80 0.21 601.47 2.49 7,102.15
Table 5.4. Weighted contributions by yield stratum towards the long run sustained yield average for the deciduous land base. MAIs used in the table reflect the MAI at the time of harvest rather than the MAX MAI.
Spatial parameters: Stanley version 2006.10 was used to produce the spatial harvest sequence. A 50 m proximal distance was used to span seismic lines and other narrow linear features to aggregate blocks together. The target block size was 70 ha, a figure derived from earlier patch analysis done on the raw AVI. A minimum cut block size of 2 ha was used. If smaller patches of merchantable timber are found adjacent to existing sequenced harvest areas, they can be added as opportunity wood and tracked using the rules for harvest variation found in the Planning Standard. Green-up delays were not applied to this sequence. In part, this was to allow the model to mitigate the two-pass harvest system by accessing the reserve areas early. In lieu of applying a green-up constraint to the model, a stand retention program will be developed, applied and tracked.
March 1, 2012 Final S10 Timber Supply Analysis © 2012 Government of Alberta
Page 12 of 35

Section 6: Harvest levels: Coniferous harvest levels The following tables and images show the conifer harvest level for both the spatial phase (0-70 years) and the aspatial phase (75-200 years) for the PFMS.
Incidental conifer from the deciduous land base will not be allocated unless a deciduous tenure is established. Both the primary and incidental deciduous allocations are referenced in the current DTA, and interim deciduous sales will need to be removed from this total volume.
FMU commitment target
FMU quadrant adjustment1
Compartment Harvest levels Total FMU
Harvest Levels
Red Earth Otter Cadotte
Period
(m3/period) (m3/period) (m3/period) (m3/period) (m3/period) (m3/period) (m3/period) 1 614,515 123,222 131,131 379,456 103,928 737,737 147,547 2 614,515 131,131 379,456 103,928 614,515 122,903 3 540,850 131,131 321,629 88,090 540,850 108,170 4 540,850 131,131 321,629 88,090 540,850 108,170
5 + 457,806 131,948 246,302 79,556 457,806 91,561
1 Volume resulting from quota cut control period being re-engineered to commence May 1, 2006 (Quotas: Alberta Plywood CTQS100004 and Boucher Bros. Lumber Ltd. CTQS100005)
Table 6.1: Coniferous harvest levels by compartment.
Figure 6.1: Harvest level overview, showing the spatially sequenced volume flows for the first 14 periods (70 years), along with the non-spatial projections for the remainder of the planning horizon.
March 1, 2012 Final S10 Timber Supply Analysis © 2012 Government of Alberta
Page 13 of 35
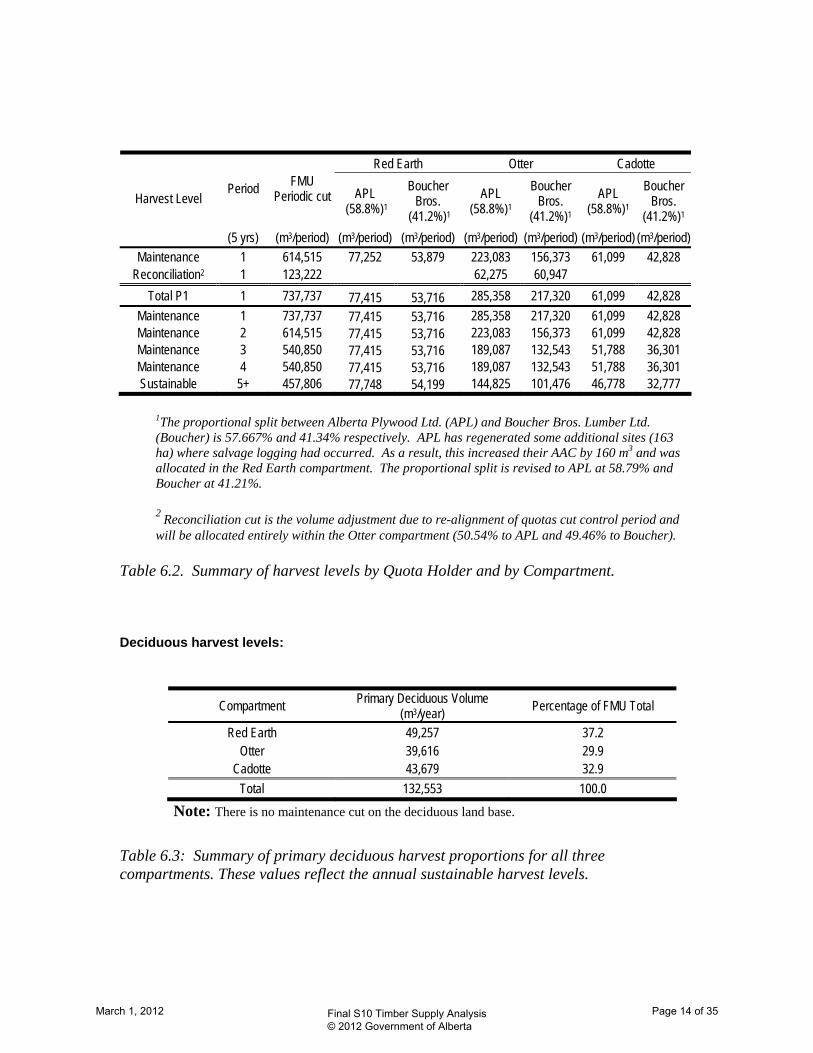
Red Earth Otter Cadotte
Period FMU Periodic cut APL
(58.8%)1
Boucher Bros.
(41.2%)1
APL (58.8%)1
Boucher Bros.
(41.2%)1
APL (58.8%)1
Boucher Bros.
(41.2%)1 Harvest Level
(5 yrs) (m3/period) (m3/period) (m3/period) (m3/period) (m3/period) (m3/period) (m3/period)
Maintenance 1 614,515 77,252 53,879 223,083 156,373 61,099 42,828 Reconciliation2 1 123,222 62,275 60,947
Total P1 1 737,737 77,415 53,716 285,358 217,320 61,099 42,828
Maintenance 1 737,737 77,415 53,716 285,358 217,320 61,099 42,828 Maintenance 2 614,515 77,415 53,716 223,083 156,373 61,099 42,828 Maintenance 3 540,850 77,415 53,716 189,087 132,543 51,788 36,301 Maintenance 4 540,850 77,415 53,716 189,087 132,543 51,788 36,301 Sustainable 5+ 457,806 77,748 54,199 144,825 101,476 46,778 32,777
1The proportional split between Alberta Plywood Ltd. (APL) and Boucher Bros. Lumber Ltd. (Boucher) is 57.667% and 41.34% respectively. APL has regenerated some additional sites (163 ha) where salvage logging had occurred. As a result, this increased their AAC by 160 m3 and was allocated in the Red Earth compartment. The proportional split is revised to APL at 58.79% and Boucher at 41.21%.
2 Reconciliation cut is the volume adjustment due to re-alignment of quotas cut control period and will be allocated entirely within the Otter compartment (50.54% to APL and 49.46% to Boucher).
Table 6.2. Summary of harvest levels by Quota Holder and by Compartment. Deciduous harvest levels:
Compartment Primary Deciduous Volume (m3/year)
Percentage of FMU Total
Red Earth 49,257 37.2 Otter 39,616 29.9
Cadotte 43,679 32.9
Total 132,553 100.0
Note: There is no maintenance cut on the deciduous land base.
Table 6.3: Summary of primary deciduous harvest proportions for all three compartments. These values reflect the annual sustainable harvest levels.
March 1, 2012 Final S10 Timber Supply Analysis © 2012 Government of Alberta
Page 14 of 35

Compartment Incidental Deciduous Volume (m3/year)
Percentage of FMU Total
Red Earth 12,981.9 20.2 Otter 39,907.5 62.2
Cadotte 11,238.0 17.6 FMU Total 64,127.4 100.0
Note: The actual volume varies per period.
Table 6.4: Incidental deciduous harvest levels, using the 70-year average from the blocked coniferous schedule.
Proposed AAC: It is recommended that the long-term conifer harvest level for the S10 FMU be set at 91,561 m3/year. In the interim 20 years, a two-step maintenance cut of 122,903 m3/year for the first ten-year period, and 108,170 m3/year for the second ten year period will be allowed as the operators adjust to the new harvest level. Quadrant adjustment volume is in included in table 6.4 (bringing the first period quadrant harvest to 737,735 m3) and needs to be reflected in the certificate in some capacity. The long-term harvest level reflects the aspatial projections that account for spatial harvest projections for 1/3 of the planning horizon. An average incidental conifer harvest of 16,724 m3/year is predicted off the deciduous land base, but may vary if the deciduous sequence changes. Long-term harvest levels represent the spatial average from years 20 to 70. The current quota allocations issue 58.66% of the allowable harvest to APL, and 41.34% of the allowable harvest to Boucher Brothers. APL regenerated additional sites where salvage logging operations had occurred after a fire, and their harvest level should be increased by 159.7 m3/year to reflect this. This was calculated using a salvage area of 162.98 ha, and the MAI at harvest of 0.98 for the corresponding yield curve.
It is recommended that the long-term deciduous harvest level for S10 be set at 132,534 m3/year. There is no need for a deciduous maintenance cut, as there are currently no deciduous operators in the unit. Any new allocations should be based off this long-term harvest level and corresponding spatial harvest sequence. An average incidental deciduous harvest level of 64,128 m3/year is also expected off the coniferous land base.
March 1, 2012 Final S10 Timber Supply Analysis © 2012 Government of Alberta
Page 15 of 35

Section 7: Spatial harvest sequence, and assessment
Figure 7.1.a: S10 spatial harvest sequence. Two ten-year periods are shown for both the conifer (green) and deciduous (brown) land bases. The spatial harvest sequence has been made near-operational by the Area, and the resulting pattern was confirmed by the quota holders to be acceptable. This sequence will form the basis for AOP submissions for the next 10 years, and the variance will be tracked against it as per the Planning Standard. If there are problems with the sequence due to inventory issues, the errors in blocking will be tracked as per the Planning Standard. The entire 10-year sequence will be harvested before existing reserve blocks are accessed. Most of the work used to establish values for modelling constraints was not redone during plan development. The final sequence was assessed as a stand-alone entity once the process was complete. A reporting structure similar to Annex 4 of the Planning Standard was used to assess the sequence, but very few values were used as targets to be met through the timber supply.
March 1, 2012 Final S10 Timber Supply Analysis © 2012 Government of Alberta
Page 16 of 35

Section 7.1. Area by seral stage. The area for three seral stage groupings was examined over the planning horizon. Snapshot reports were produced through Woodstock for time slices at 0, 10, 50, 100 and 200 years. Three seral groups were used. Juvenile (24 years or less1), Mature + over-mature (all stands greater than the max MAI, by yield stratum) and Over-mature (all stands greater than the max MAI + 40 years, by yield stratum). Reports were produced for the active land base, and the total forested land base (not including freehold land and Indian reserves).
Area per seral group - Active Landbase
0
20,000
40,000
60,000
80,000
100,000
120,000
140,000
160,000
0 10 50 100 200
Time of snapshot (year)
Are
a (h
a) Juvenile
Mature + OM
OM
Active land base 0 10 50 100 200
Juvenile 13,719 22,813 25,451 30,040 28,488 Mature + OM 52,734 55,788 48,699 22,086 19,849 Over-mature 11,943 11,141 15,994 9,127 4,347
Figure 7.1.1: Area (ha) by seral stage for the active land base, for various times in the planning horizon. Freehold and federal land was not included, as the plan has no impact on these areas.
1 Due to the use of a floor function when assigning age classes, the first age class is wider than the rest.
March 1, 2012 Final S10 Timber Supply Analysis © 2012 Government of Alberta
Page 17 of 35

Area per seral group - Total Landbase
0
20,000
40,000
60,000
80,000
100,000
120,000
140,000
160,000
0 10 50 100 200
Time of snapshot (year)
Are
a (
ha
)
Juvenile
Mature + OM
OM
Total forested land base 0 10 50 100 200
Juvenile 16,089 24,157 25,529 34,117 56,478 Mature + OM 83,312 91,187 150,583 117,537 23,711 Over-mature 15,924 17,178 47,961 89,812 5,962
Figure 7.1.2: Area (ha) by seral stage for the total forested land base, for various times in the planning horizon. Freehold and federal land was not included, as the plan has no impact on these areas. It should be noted that the analysis as requested does not contain any information that is in an immature state (between 20 years and the age where max MAI occurs), and that as area transitions into this class it is not represented in the statistics. Section 7.2: Patch analysis for juvenile stands. A management challenge that was addressed through this plan was the clean-up of the older two-pass harvest blocks. S10 contained two main regions where two-pass harvesting occurred, one in the north-west that was cut in the early 1980’s (Bissel Contractors), and one that was cut in the mid-1990s near Bat Lake in the south-east. The reserve portions of these stands were sequenced in the first ten years of the spatial harvest sequence. As this plan does not incorporate a green-up rule, this does not violate any TSA procedures. One thing to consider is the amount of stand retention that should be left with this approach. The intention was to leave retention in lieu of having a green-up constraint, with the amount varying by the final opening size. The original harvesting pattern did
March 1, 2012 Final S10 Timber Supply Analysis © 2012 Government of Alberta
Page 18 of 35

not leave any retention. The stand retention plan will need to determine how much will be left for harvests that create a larger opening size through second-pass clean-up.
Image 7.2.1: Two pass clean-up efforts for the Bissel blocks in the Otter compartment. The first pass was removed in several stages between 1973 and 1987.
Image 7.2.2: Two pass clean up efforts near Bat Lake in the Red Earth compartment. Most of the first pass was removed in 1992 and onward. Blocks in the top part of this image fall within the caribou zone, and cannot be sequenced until year 30.
March 1, 2012 Final S10 Timber Supply Analysis © 2012 Government of Alberta
Page 19 of 35
In addition to the maps, statistics were developed to show the trend in juvenile patch sizes. There are a few things to be noted about the maps and statistics. First, how the line work for past disturbances was interpreted is important to how the patch size stats are calculated. Different rules exist in the layers of source data for defining a patch, and do not capture a patch in the same way that we intended to. Some disturbances are based on the vegetation inventory, where the remaining trees were interpreted as polygons and the disturbed areas end up inter-connected. This creates large patches due to the connections, rather than small openings reflected in the original block plans. Other blocks were from updates to the inventory, where individual blocks comprise the polygon or the series of blocks comprise a single polygon, and the connections aren’t captured. In order to be consistent between past harvests and future blocks, it was decided to use a 50 m adjacency to group smaller openings into a larger disturbed patch. Second, the time frame used in the reporting period is important, given the wide range of harvest dates. It was decided that a 20 year window would be used to assess what was considered disturbed. In some cases, this captures both passes harvested in the two-pass system, and a large patch is produced. In other cases, the older first-pass blocks fall outside this window, and only the multiple smaller patches that represent the remaining stands are captured. It is assumed that areas that are older than this assessment window can be considered recovered forest, rather than disturbed forest. In the case of the Otter compartment, many of the older two-pass blocks fell outside of this reporting window. For the following graphs, Time 0 refers to the window spanning from 20 years in the past (1986), to year 0 in the inventory. Time 10 spans from 10 years in the past to the end of the first 10 years of the SHS. Time 50 spans from year 30 to the start of year 50. Both coniferous and deciduous stands in a juvenile state could contribute to a patch. The percentages presented show the percent of the compartment disturbed by patch size. There may be many patches in the 0-5 ha category, but together they have a low total area, and do not contribute significantly to the total area found in juvenile patches. Conversely, there are few patches in the larger size classes, but they tend to be very large due to the interpreted connections and the proximal distance rule.
March 1, 2012 Final S10 Timber Supply Analysis © 2012 Government of Alberta
Page 20 of 35

Percent of Juvenile area by patch sizeRed Earth compartment
0.0
10.0
20.0
30.0
40.0
50.0
60.0
0-5 100.1-500 20.1-50 5.1-20 50.1-100 500.1+
Size class (ha)
Per
cen
t o
f to
tal c
om
par
tmen
t d
istu
rban
ce Time 0
Time 10
Time 50
Percent of Juvenile area by patch size classOtter compartment
0.0
5.0
10.0
15.0
20.0
25.0
30.0
35.0
40.0
0-5 100.1-500 20.1-50 5.1-20 50.1-100 500.1+
Size class
Per
cen
t o
f to
tal c
om
par
tmen
t
dis
turb
ance Time 0
Time 10
Time 50
Percent of Juvenile area by patch size classCadotte compartment
0.0
10.0
20.0
30.0
40.0
50.0
60.0
70.0
80.0
90.0
0-5 100.1-500 20.1-50 5.1-20 50.1-100 500.1+
Size class
Per
cent
of
tota
l com
part
men
t di
stur
banc
e
Time 0
Time 10
Time 50
Graph 7.2.3 to 7.2.5: Percent of juvenile area by patch size for the Red Earth, Otter and Cadotte compartments. Values can be found in table 7.2.1
March 1, 2012 Final S10 Timber Supply Analysis © 2012 Government of Alberta
Page 21 of 35

Size class, in ha Time Compartment 0-5 100.1-500 20.1-50 5.1-20 50.1-100 500.1+ Time 0 Cadotte 3.9 79.3 5.1 11.7 0.0 0.0 Time 0 Otter 5.5 19.7 36.4 28.8 9.5 0.0 Time 0 RedEarth 1.9 28.1 26.5 15.8 18.1 9.6 Time 10 Cadotte 1.7 31.5 15.3 11.5 25.2 14.8 Time 10 Otter 2.2 35.2 15.7 15.0 15.8 16.2 Time 10 RedEarth 2.5 14.0 10.5 7.0 12.9 53.2 Time 50 Cadotte 3.4 49.6 14.4 13.3 19.2 0.0 Time 50 Otter 4.0 27.7 16.1 17.8 17.4 17.1 Time 50 RedEarth 4.3 30.2 23.8 21.0 20.7 0.0
Table 7.2.1: Summary values for the graphs showing percent of juvenile area by patch size by compartment. Section 7.3. Area disturbed by compartment. One of the key reasons for adding compartments was to distribute the harvest across the FMU in a sustainable manner. The following pie graphs show how this goal was achieved over a 50 year time frame. Currently, the majority of the harvest disturbances are occurring in the Red Earth compartment. In fifty years, the disturbances reflect the proportional contribution to the AAC for each compartment.
March 1, 2012 Final S10 Timber Supply Analysis © 2012 Government of Alberta
Page 22 of 35

Percent of total FMU disturbance
Time0 Cadotte
Time0 Otter
Time0 RedEarth
Percent of total FMU disturbance
Time50 Cadotte
Time50 Otter
Time50 RedEarth
Active land base by compartment
Red Earth
Otter
Cadotte
Percent of total FMU disturbance
Time10 Cadotte
Time10 Otter
Time10 Red Earth
Figure 7.3.1: Change in harvesting emphasis per compartment over time. The same time slices were used in the juvenile patch analysis Section 7.4: Over-mature patch analysis. Another landscape metric that was examined was the patch size of old-growth forest. The emphasis for reporting was on patches that are 120 ha or greater, as it assumes this corresponds to a 100 ha core patch with a suitable buffer around it. Irregular patch shapes may not hold true to this rule. Three time frames were looked at: Time 0, Time 10 and Time 50. These were snapshot assessments for the start of the time described. “Old” as described in the Planning Standard was interpreted as “over-mature”. The same ages used to define over-mature stands was applied to the future forest snapshots at the yield curve level. Once over-mature was calculated, these polygons were extracted to a separate data set. Both the active and the majority of the passive land base could contribute to the patch statistic. (Areas inside freehold land and Indian reserves could not contribute, as there was no forest management in these areas. Maps had a 2 ha patch filter for drawing
March 1, 2012 Final S10 Timber Supply Analysis © 2012 Government of Alberta
Page 23 of 35

patches, which was not duplicated in the stats). Over-mature patches of different yield strata and land bases could contribute to the same patch. In S10, this meant that the majority of the patches consisted of old black spruce and aspen stands (as the aspen reaches over-maturity before other stand types). A 50 m adjacency was used to group patches of old growth. Raw polygons selected from the NLB were buffered out 25 m per side, dissolved to make whole polygons, and then buffered inward by 25 m. This preserved the overall shape of the original patch, but negated the effects of narrow disturbances such as seismic lines. Some additional area may have been captured by this process, so assume a small margin of inflation on all area estimates. Two sets of tables were developed. The first was for the patches smaller than 120 ha. These are considered to have a core area that is too small to be effective once a buffer is applied, assuming the polygon has a regular shape. The second is for patches larger than 120 ha, which have an effective core area for providing habitat.
March 1, 2012 Final S10 Timber Supply Analysis © 2012 Government of Alberta
Page 24 of 35

Area in small patches, by compartment
0.0
2,000.0
4,000.0
6,000.0
8,000.0
10,000.0
12,000.0
Time 0 Time 10 Time 50
Time frame
Are
a (h
a) Cadotte
Otter
Red Earth
Number of small patches, by compartment
0
100
200
300
400
500
600
700
800
900
Time 0 Time 10 Time 50
Time frame
Nu
mb
er o
f d
iscr
ete
pat
ches
Cadotte
Otter
Red Earth
Compartment Patch size
Time period
Total area (ha)
Total patches
Average size (ha)
CADOTTE Small Time 0 2,523.2 319 7.9 CADOTTE Small Time 10 2,546.4 227 11.2 CADOTTE Small Time 50 4,262.3 329 13.0
OTTER Small Time 0 3,214.2 213 15.1 OTTER Small Time 10 4,089.9 356 11.5 OTTER Small Time 50 10,561.3 770 13.7
REDEARTH Small Time 0 4,593.4 692 6.6 REDEARTH Small Time 10 3,890.0 699 5.6 REDEARTH Small Time 50 10,617.0 741 14.3 Total Time 0 10,330.9 1,224.0 8.4 Total Time 10 10,526.3 1,282.0 8.2 Total Time 50 25,440.6 1,840.0 13.8
Table 7.4.1: Number and total area for old-growth patches smaller than 120 ha by compartment. The three snapshot periods requested in the Planning Standard are shown.
March 1, 2012 Final S10 Timber Supply Analysis © 2012 Government of Alberta
Page 25 of 35

Area in 120+ ha patches, by compartment
0.0
2,000.0
4,000.0
6,000.0
8,000.0
10,000.0
12,000.0
14,000.0
16,000.0
18,000.0
20,000.0
Time 0 Time 10 Time 50
Time frame
Are
a (h
a) Cadotte
Otter
Red Earth
Number of 120+ ha patches, by compartment
0
5
10
15
20
25
30
35
40
45
50
Time 0 Time 10 Time 50
Time frame
Are
a (h
a) Cadotte
Otter
Red Earth
Compartment Patch
size Time period
Total area (ha)
Total patches Average size (ha)
CADOTTE Large Time 0 1,710.1 4 427.5 CADOTTE Large Time 10 1,871.0 5 374.2 CADOTTE Large Time 50 8,012.8 19 421.7
OTTER Large Time 0 1,378.9 5 275.8 OTTER Large Time 10 2,860.4 8 357.6 OTTER Large Time 50 17,508.5 43 407.2
REDEARTH Large Time 0 2,567.9 10 256.8 REDEARTH Large Time 10 2,571.9 10 257.2 REDEARTH Large Time 50 13,183.7 35 376.7 Total Time 0 5,656.9 19.0 297.7 Total Time 10 7,303.3 23.0 317.5 Total Time 50 38,705.1 97.0 399.0
Table 7.4.2: Number and total area for old-growth patches greater than 120 ha by compartment. The three snapshot periods requested in the Planning Standard are shown.
March 1, 2012 Final S10 Timber Supply Analysis © 2012 Government of Alberta
Page 26 of 35

Section 7.5 Permanent access. One report requested by the planning team was an estimate for the current road access, by compartment. The Base Features data maintained by RDB was accessed through Citrix and was used to generate statistics. The road spanning the Otter and Cadotte compartment was originally used to designate the compartments. For this roll-up, it was assigned to the Cadotte. The available data source had a pipeline embedded in it, spanning the western portion of the Cadotte compartment, which inflates the statistics for this compartment.
Compartment Compartment area (km2)
Road length (km)
Ratio (km / km2)
Red Earth 1,652.35 763.15 0.462 Otter 1,567.29 649.31 0.414
Cadotte 862.87 233.43 0.271 FMU total 4,082.51 1,645.89 0.403
Table 7.5.1: Permanent road statistics for the S10 FMU.
Figure 7.5.1: Roads and pipelines used in the Net Land Base, by compartment. Red = Red Earth, Purple = Otter, and Green = Cadotte. Smaller access roads were not included in this roll-up.
March 1, 2012 Final S10 Timber Supply Analysis © 2012 Government of Alberta
Page 27 of 35

Section 7.6. Salvaged burns The only recent burn where there was evidence of salvage logging occurred in 2002, in the northern part of the Red Earth compartment. This fire did extend north into the S15 FMU. A total of 3,201.4 ha burned in the S10 FMU. APL had some past blocks in the area, and after the fire they salvage logged in an area adjacent to their previous operations. This salvage area equated to 163 ha, and was used to modify the allocation of the AAC.
Figure 7.6.1: 2002 burn (orange), along with historic blocks (Light green, ~1990 harvest) and the salvage blocks (dark green, 2002). There were other large historic fires on the land base, the biggest of which had been captured in the AVI (photo year = 1989). These fires were assigned a burn year of 1982, and were interpreted mainly as shrub and not included in the net land base. 25,298 ha have an AVI burn call with an extent of 4 or greater. The AVI had been used to assign burned stands to a yield stratum for this analysis, and the majority of the area was considered passive-non forested. Section 7.7: Coarse filter management The planning team was hoping that Fish and Wildlife would be able to provide some additional analysis relating to coarse filter management. In lieu, some of the work done to address wildlife in past iterations of the TSA is presented here. The two species that were addressed were Trumpeter Swans and Caribou. The three lakes that were associated with Trumpeter Swans (as of 2005) were buffered to 200 m, up from the standard 100 m buffer. A map showing these lakes can be found in the Landscape Assessment document.
March 1, 2012 Final S10 Timber Supply Analysis © 2012 Government of Alberta
Page 28 of 35

The caribou were dealt with by incorporating a designated caribou zone into the net land base. The two patches of caribou zone in S10 are a portion of the Red Earth range, which extends to the north. The intent behind this strategy was to pursue a policy of seismic line recovery through harvesting, as the regenerating patch would be less favourable to predators. With the decision to delay harvesting in the zone until 30 years from present, and to harvest in limited amounts, this may not be a viable short-term strategy but may have merit in the long-term.
Figure 7.7.1: Total area in the caribou zone (green) along with the total area in the active land base in a juvenile state for the planning horizon (grey). In addition to changing the harvesting patterns, a habitat suitability assessment was run on the S10 portion of the Red Earth caribou range. Fish and Wildlife provided a paper that provided a method to assess the overall suitability of the range. The planning team was advised that the portion in S10 might be too small to assess as a stand-alone entity, so these statistics should not be given too much weight.
March 1, 2012 Final S10 Timber Supply Analysis © 2012 Government of Alberta
Page 29 of 35

This approach calculates the impact of seismic lines on the over-mature forest for the area designated. The core forest that is 150 meters from a hard opening, such as seismic or roads, or 15 m from soft openings like young stands or cut blocks, is considered viable habitat. The formula below describes the stability of a population, based on habitat:
Y = (-.258 * % interior) – (.212 * % young) + 1.14 Where Y is the stability of the range If we consider cut blocks to be anthropogenic openings, we get a final value of 0.81 with a value of 1 representing a stable population.
Table 7.7.1: The relative linear proportions allowed by the range assessment formula. The absolute minimum (.67) and maximum (1.14) values possible using the formula were provided as a reference to the S10 and Stable values.
March 1, 2012 Final S10 Timber Supply Analysis © 2012 Government of Alberta
Page 30 of 35

Figure 7.7.2: Location and size of viable caribou habitat within the caribou zone, as of 2005. A heavy seismic foot print lead to the elimination of most of the viable habitat. Reds have a lower suitability and greens have a higher suitability, which is tied directly to the size of the patch. More than 90% of the area is in patches that are less than 10 ha in size.
March 1, 2012 Final S10 Timber Supply Analysis © 2012 Government of Alberta
Page 31 of 35

Section 7.8: Wood profile (Conifer land base only) There is a definite shift in the wood profile for the first 70 years of the harvest plan. The amount of pure spruce declines over time, and the understorey stands replace them as the main source of timber. Low-density spruce typically contributes more volume than fully stocked spruce stands. This transition is a potential risk, as it is solely based on the assumption that the understorey stands will all become contributing spruce stands. Updating the inventory may show a whole different trajectory for this stand type. Mixed-wood volumes contribute an irregular amount of wood, but the volume contributed by these strata does spike in year 35 before tapering off. Pine plays a role in the future but not in the short-term, as the majority of the pine stands are currently regenerating.
Area cut by broad yield strata
0
500
1000
1500
2000
2500
3000
3500
4000
4500
1 2 3 4 5 6 7 8 9 10 11 12 13 14
Cut period (5 years)
Are
a cu
t (h
a)
DC - open
DC - closed
Pine
Spruce - open
Spruce - closed
Understorey mgmt.
CD - open
CD - closed
Figure 7.8.1: Area harvested (ha) by yield stratum for the coniferous land base
per five-year period. Operational adjustments for the first 20 years are reflected in this figure.
The wood profile for the deciduous land base is much simpler, as only two yield strata contribute (Aspen, low or high density). No graphs were produced to explore this relationship due to its simplicity.
March 1, 2012 Final S10 Timber Supply Analysis © 2012 Government of Alberta
Page 32 of 35

Section 7.9: Piece size The piece size (trees per cubic meter) was projected over the 200 year planning horizon. The first 70 years are spatial, the remainder are aspatial. All stands that were scheduled on the conifer land base contributed to the statistic, calculated as the total conifer volume harvested / total piece size value predicted. There is a noticeable shift in piece size at the start of the second rotation for the Cadotte and Otter compartments (see figures 7.9.1 to 7.9.3 on the following page). This shift isn’t as significant in the Red Earth, due to both higher piece sizes seen from harvesting young stands in the first rotation, and the old wood in the caribou zone comprising part of the second rotation. This improvement in piece size is balanced with a lower long-term harvest level. The wood profile in the Otter also includes more switch stands, which has a higher piece size at rotation age. Part of this piece size profile is tied to the incidental deciduous harvest rules. By maintaining a percentage of mixed-woods in the profile to balance the deciduous volumes, we also see a slight increase in conifer piece size relative to a pure conifer harvest. Spikes in the piece size profile during the first rotation typically correspond to an influx of young stands or mixed-wood stands in the sequence.
Years Cadotte Otter Red Earth
1-10 2.6 2.8 3.8 11-20 2.2 2.7 2.8 51-60 2.3 2.4 3.4
101-110 5.1 4.3 3.3 191-200 4.8 3.9 3.6
Table 7.9.1. Average piece size (trees per m3) for the age ranges listed. These ages correspond to the typical snapshot reporting periods found in the Planning Standard for aspatial values. A piece size profile for the deciduous land base was not produced.
March 1, 2012 Final S10 Timber Supply Analysis © 2012 Government of Alberta
Page 33 of 35

Red Earth, Conifer piece size
0
0.5
1
1.5
2
2.5
3
3.5
4
4.5
5
1 4 7 10 13 16 19 22 25 28 31 34 37 40
Period (5 years)
Pie
ce s
ize
(tre
es/m
3)
Piece Size
Average
Otter, Conifer piece size
0
1
2
3
4
5
6
1 3 5 7 9 11 13 15 17 19 21 23 25 27 29 31 33 35 37 39
Period (5 years)
Pie
ce s
ize
(tre
es/m
3)
Piece Size
Average
Cadotte, Conifer piece size
0
1
2
3
4
5
6
1 4 7 10 13 16 19 22 25 28 31 34 37 40
Periods (5 years)
Pie
ce s
ize
(tre
es/m
3)
Piece Size
Average
Figures 7.9.1 – 7.9.3: Piece size plotted against an average value based roughly on rotation age. Otter and Cadotte show a large shift in piece size as we start the second rotation, while the Red Earth compartment does not.
March 1, 2012 Final S10 Timber Supply Analysis © 2012 Government of Alberta
Page 34 of 35

Section 8: Final thoughts and follow-up items The S10 timber supply analysis is an interim plan that achieves most of its goals. A sustainable harvest level has been determined, and steps to work toward that level are underway. The harvest has been re-distributed across the FMU, and will no longer be focussed in the Red Earth compartment if the sequence is followed. Many of the non-timber values have been considered, if not met, and an approach which was acceptable to the planning team has been integrated into the plan. There are limitations to the plan. The TSA was done using an older inventory and may not account for all land-use depletions. The next plan needs to be done using an updated inventory, and the long-term harvest levels are likely going to change because of it. In the short term, this will mean that the spatial harvest sequence may have inaccuracies, and the first ten years of blocks may be harvested faster than expected. Variation will be tracked according to the Planning Standard. Depending on the nature of the variation, the AAC may have to be adjusted accordingly. Also, better estimates for understorey conifer stands are needed, which will impact the harvest level. The Area will need to monitor land use activity, and be aware that if the cumulative area disturbed by other industry, fire, or other reasons exceeds 2.5% of the net land base, a new analysis will need to be done. This is in addition to the other monitoring requirements mentioned throughout the plan. This will involve the collection of a new inventory, to see any improvement in accuracy. The Area will also need to ensure that the SHS is the foundation for all AOPs, and that variance from the SHS is tracked properly. Exceeding the allowable variation will trigger a review.
March 1, 2012 Final S10 Timber Supply Analysis © 2012 Government of Alberta
Page 35 of 35