Embed Size (px)
Citation preview
PREPARATION AND OPERATIONS OF THE MISSION PERFORMANCE
CENTRE (MPC) FOR THE COPERNICUS SENTINEL-3 MISSION
S3-A Land and Sea Ice Cyclic Performance Report
Cycle No. 30
Start date: 07/04/2018
End date: 04/05/2018
Ref. S3MPC.UCL.PR.30
Issue: 1.0
Date: 11/07/2018
Contract: 4000111836/14/I-LG
Customer: ESA Document Ref.: S3MPC.UCL.PR.08.30
Contract No.: 4000111836/14/I-LG Date: 11/07/2018
Issue: 1.0
Project: PREPARATION AND OPERATIONS OF THE MISSION PERFORMANCE CENTRE (MPC)
FOR THE COPERNICUS SENTINEL-3 MISSION
Title: S3-A Land and Sea Ice Cyclic Performance Report
Author(s): Land and Sea Ice ESLs
Approved by: G. Quartly, STM ESL
Coordinator
Authorized by Sylvie Labroue, STM Technical
Performance Manager
Distribution: ESA, EUMETSAT, S3MPC consortium
Accepted by ESA P. Féménias, MPC TO
Filename S3MPC_LandSeaIce-CyclicReport-Cycle30
Disclaimer
The work performed in the frame of this contract is carried out with funding by the European Union. The views expressed herein can in no way be taken to reflect the official opinion of either the European Union or the
European Space Agency.
Sentinel-3 MPC
S3-A Land and Sea Ice Cyclic Performance Report
Cycle No. 30
Ref.: S3MPC.UCL.PR.08-030
Issue: 1.0
Date: 11/07/2018
Page: iii
Changes Log
Version Date Changes
1.0 11/07/2018 First Version
List of Changes
Version Section Answers to RID Changes

Sentinel-3 MPC
S3-A Land and Sea Ice Cyclic Performance Report
Cycle No. 30
Ref.: S3MPC.UCL.PR.08-030
Issue: 1.0
Date: 11/07/2018
Page: iv
Table of content
1 INTRODUCTION ............................................................................................................................................ 1
2 CYCLE OVERVIEW .......................................................................................................................................... 2
3 PROCESSING BASELINES ................................................................................................................................ 3
4 DATA AVAILABILITY & INSTRUMENT MODES ................................................................................................ 4
4.1 DATA AVAILABILITY ........................................................................................................................................... 4 4.2 SRAL INSTRUMENT MODE ................................................................................................................................. 5
5 AVAILABILITY OF POLAR GEOPHYSICAL CORRECTIONS ................................................................................. 9
5.1 AVAILABILITY OF GEOPHYSICAL CORRECTIONS OVER ICE SHEETS (NTC PRODUCTS) ........................................................ 9 5.2 AVAILABILITY OF GEOPHYSICAL CORRECTIONS OVER ICE SHELVES (NTC PRODUCTS) .................................................... 12 5.3 AVAILABILITY OF GEOPHYSICAL CORRECTIONS OVER SEA ICE ................................................................................... 13 5.4 AVAILABILITY OF SNOW DENSITY, SNOW DEPTH AND SEA ICE CONCENTRATION OVER SEA ICE ....................................... 15
6 GEOPHYSICAL PARAMETER MONITORING FOR LAND ICE ............................................................................16
6.1 20HZ KU BAND ELEVATION (ELEVATION_ICE_SHEET_20_KU) ................................................................................ 16 6.2 20HZ KU BAND ICE SHEET RANGE (RANGE_ICE_SHEET_20_KU) ............................................................................. 20 6.3 20HZ KU BAND ICE SHEET SIGMA0 (SIG0_ICE_SHEET_20_KU) .............................................................................. 23 6.4 20HZ KU BAND OCOG (ICE-1) ELEVATION (ELEVATION_OCOG_20_KU) ................................................................. 25 6.5 20HZ KU BAND OCOG (ICE-1) RANGE (RANGE_OCOG_20_KU) ............................................................................ 28 6.6 20HZ KU BAND OCOG (ICE-1) SIGMA0 (SIG0_OCOG_20_KU) ............................................................................. 30 6.7 20HZ KU BAND WAVEFORM QUALITY FLAG (WAVEFORM_QUAL_ICE_20_KU) .......................................................... 32 6.8 20HZ KU BAND PLRM ICE RANGE (RANGE_ICE_20_PLRM_KU) ............................................................................. 38 6.9 20HZ KU BAND PLRM SIGMA0 (SIG0_ICE_20_PLRM_KU) ................................................................................... 41 6.10 20HZ KU BAND SURFACE CLASS (SURF_CLASS_20_KU) ........................................................................................ 43
7 SLOPE CORRECTION .....................................................................................................................................45
8 GEOPHYSICAL PARAMETER MONITORING FOR SEA ICE ...............................................................................49
8.1 20HZ KU BAND ALTIMETER DERIVED SURFACE TYPE (SURF_TYPE_CLASS_20_KU) ..................................................... 49 8.2 20HZ KU BAND FREEBOARD ( FREEBOARD_20_KU) .............................................................................................. 51 8.3 20HZ KU BAND INTERPOLATED SEA SURFACE HEIGHT ANOMALY (INT_SEA_ICE_SSHA_20_KU) .................................... 53 8.4 SEA SURFACE HEIGHT ANOMALY (SEA_ICE_SSHA_20_KU) ..................................................................................... 56 8.5 20HZ KU BAND SEA ICE CONCENTRATION (SEA_ICE_CONCENTRATION_20_KU) ......................................................... 60 8.6 20HZ KU BAND PEAKINESS (PEAKINESS_2_20_KU) .............................................................................................. 63
9 CROSSOVER ANALYSIS .................................................................................................................................65
10 EVENTS AND PROCESSING BASELINE CHANGES .......................................................................................67
11 CONCLUSIONS .........................................................................................................................................69
12 APPENDIX A .............................................................................................................................................70
Sentinel-3 MPC
S3-A Land and Sea Ice Cyclic Performance Report
Cycle No. 30
Ref.: S3MPC.UCL.PR.08-030
Issue: 1.0
Date: 11/07/2018
Page: v
List of Figures
Figure 1 : Map of SRAL mode over Antarctic ice sheet and ice shelves for cycle 30 NTC ----------------------- 5
Figure 2: Map of SRAL mode over Greenland ice sheet for cycle 30 NTC ------------------------------------------ 6
Figure 3: Map of SRAL mode over the Antarctic sea ice for cycle 30 NTC ------------------------------------------ 7
Figure 4: Map of SRAL mode over the Arctic sea ice for cycle 30 NTC ----------------------------------------------- 8
Figure 5: Percentage of Geophysical Correction Non-availability over Antarctic Ice Sheets ------------------- 9
Figure 6: Percentage of Geophysical Correction Non-availability over the Greenland Ice Sheet ----------- 11
Figure 7: Availability of Geophysical Corrections over Antarctic Ice Shelves ------------------------------------ 12
Figure 8: % Non Availability of Geophysical Corrections over Sea Ice (NTC) ------------------------------------- 13
Figure 9: Map of elevation_ice_sheet_20_ku over Antarctica and Gridded Parameter Failure ------------ 18
Figure 10: Map of 20Hz Ku band Ice Sheet Elevation over Greenland and Gridded % Parameter Failure 19
Figure 11: Map of range_ice_sheet_20_ku over Antarctica and % Gridded Parameter Failure Rate ------ 21
Figure 12: Maps of 20Hz Ku Band Ice Sheet Range (range_ice_sheet_20_ku) over Greenland and Gridded
Parameter % Failure Rates.--------------------------------------------------------------------------------------------------- 22
Figure 13: Maps of 20Hz Ku Band Ice Sheet Sigma0 (sig0_ice_sheet_20_ku) ----------------------------------- 24
Figure 14: Map of elevation_ocog_20_ku over Antarctica and % Gridded Parameter Failure Rates ------ 26
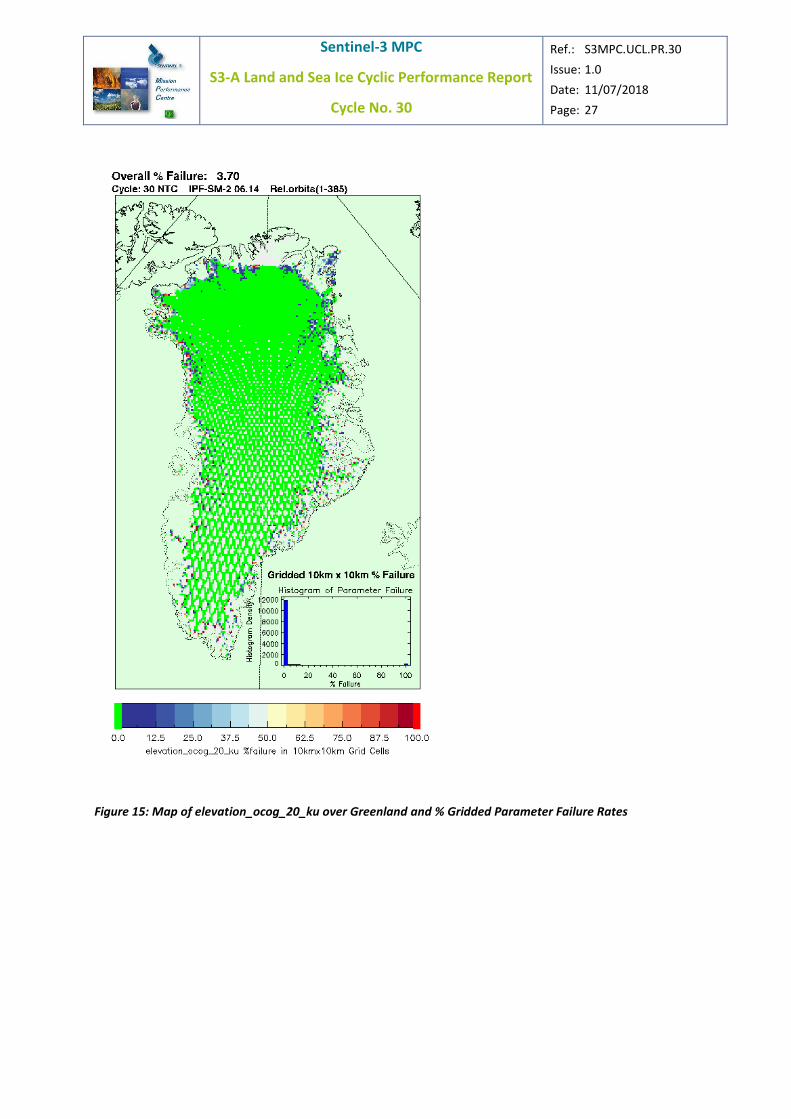
Figure 15: Map of elevation_ocog_20_ku over Greenland and % Gridded Parameter Failure Rates ------ 27
Figure 16: Map of range_ocog_20_ku over Antarctica and % Gridded Parameter Failure ------------------- 28
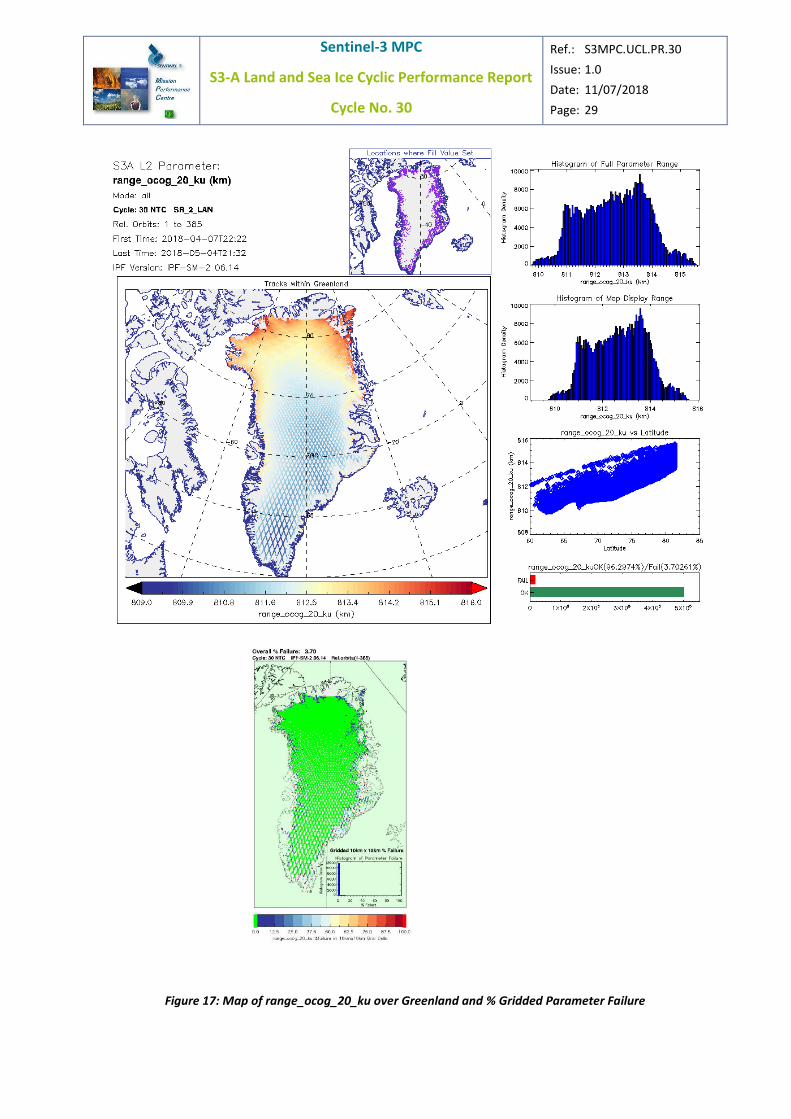
Figure 17: Map of range_ocog_20_ku over Greenland and % Gridded Parameter Failure ------------------ 29
Figure 18: Map of 20Hz Ku Band OCOG (Ice-1) Sigma0 (sig0_ocog_20_ku) over Antarctica ---------------- 30
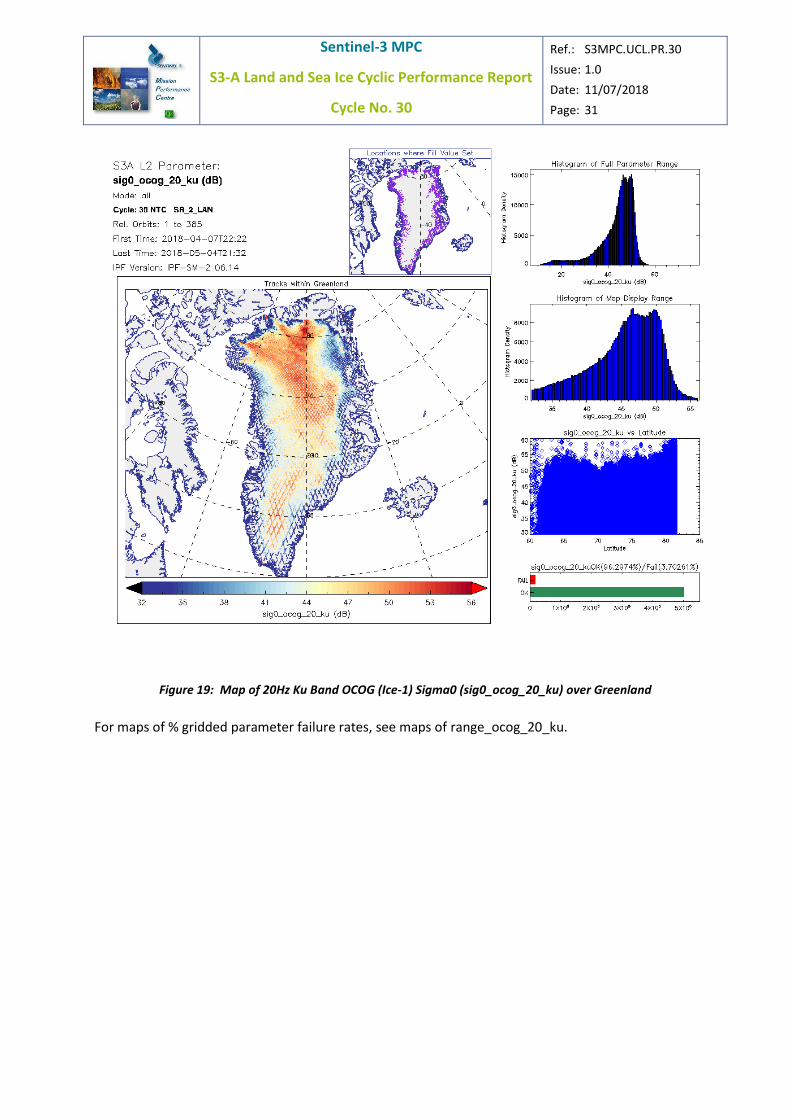
Figure 19: Map of 20Hz Ku Band OCOG (Ice-1) Sigma0 (sig0_ocog_20_ku) over Greenland --------------- 31
Figure 20: Map of Waveform Quality Flag over Antarctica (all tests) ---------------------------------------------- 33
Figure 21: Maps of Waveform Quality Flag over Greenland (all tests) ------------------------------------------- 34
Figure 22: Maps of individual waveform quality flag tests over Antarctica -------------------------------------- 37
Figure 23: Map of range_ice_20_plrm_ku over Antarctica and % Gridded Parameter Failure-------------- 39
Figure 24: Map of range_ice_20_plrm_ku over Greenland and % Gridded Parameter Failure ------------- 40
Figure 25: Maps of 20Hz Ku Band PLRM Sigma0 (sig0_ice_20_plrm_ku) ----------------------------------------- 42
Figure 26: Maps of 20Hz Ku Band Surface Class (surf_class_20_ku) ----------------------------------------------- 44
Figure 27: Maps of Slope Correction Failure Locations over Antarctica ------------------------------------------ 46
Figure 28: Maps of the Failure of the lat_cor_20_c Parameter over Antarctica -------------------------------- 48
Figure 29: Maps of surf_type_class_20_ku classes over the Arctic ------------------------------------------------ 49
Sentinel-3 MPC
S3-A Land and Sea Ice Cyclic Performance Report
Cycle No. 30
Ref.: S3MPC.UCL.PR.08-030
Issue: 1.0
Date: 11/07/2018
Page: vi
Figure 30: Maps of surf_type_class_20_ku classes over the Antarctic -------------------------------------------- 50
Figure 31: Map of Freeboard (freeboard_20_ku) and Gridded Parameter Failure over Antarctica -------- 51
Figure 32: Map of Freeboard (freeboard_20_ku) and Gridded Parameter Failure over the Arctic -------- 52
Figure 33: Map of Interpolated Sea Ice SSHA (int_sea_ice_ssha_20_ku) and Gridded Parameter Failure
over Antarctica ------------------------------------------------------------------------------------------------------------------ 54
Figure 34: Map of Interpolated Sea Ice SSHA (int_sea_ice_ssha_20_ku) and Gridded Parameter Failure
over the Arctic ------------------------------------------------------------------------------------------------------------------- 55
Figure 35: Maps of sea_ice_ssha_20_ku and Gridded Parameter Failure over the Arctic -------------------- 57
Figure 36: Maps of sea_ice_ssha_20_ku and Gridded Parameter Failure over the Antarctic --------------- 59
Figure 37: Maps of 20Hz Ku band Sea Ice Concentration (sea_ice_concentration_20_ku) over the Antarctic
Ocean ------------------------------------------------------------------------------------------------------------------------------ 61
Figure 38: Maps of 20Hz Ku band Sea Ice Concentration (sea_ice_concentration_20_ku) over the Arctic
-------------------------------------------------------------------------------------------------------------------------------------- 62
Figure 39: Maps of 20Hz Ku band Peakiness (peakiness_2_20_ku) over the Antarctic----------------------- 63
Figure 40: Maps of 20Hz Ku band Peakiness (peakiness_2_20_ku) over the Arctic --------------------------- 64
Figure 41: Maps of Crossover Difference of OCOG Elevation over Antarctica ----------------------------------- 65
Figure 42: Maps of Crossover Difference of Ice Sheet Elevation over Antarctica ------------------------------ 66
Sentinel-3 MPC
S3-A Land and Sea Ice Cyclic Performance Report
Cycle No. 30
Ref.: S3MPC.UCL.PR.08-030
Issue: 1.0
Date: 11/07/2018
Page: vii
List of Tables
Table 1: Data Availability for NTC --------------------------------------------------------------------------------------------- 4
Table 3: % Availability of Snow Density, Snow Depth, Sea Ice Concentration over Sea Ice ----------------- 15

Sentinel-3 MPC
S3-A Land and Sea Ice Cyclic Performance Report
Cycle No. 30
Ref.: S3MPC.UCL.PR.30
Issue: 1.0
Date: 11/07/2018
Page: 1
1 Introduction
This document provides a report of the performance and data quality of the Sentinel-3A SRAL Level 2 data
products over land ice (polar ice sheets, ice shelves, and ice caps) and sea ice surfaces.
For land ice the SR_2_LAN Level 2 NTC (Non Time Critical) products which contain the final orbit and
geophysical corrections are assessed. These are produced by the S-3A Instrument Processing Facility (IPF)
at CNES.
For sea ice, we assess the SR_2_WAT Marine Level 2 NTC (Non Time Critical) products, produced by the
S3 Marine Centre.
The objectives of this document are :
• To provide a data quality assessement.
• To report on any changes likely to impact data quality at any level, from instrument status to
software configuration.
• To present the major useful results for cycle 30, from 07/04/2018 to 04/05/2018.
Sentinel-3 MPC
S3-A Land and Sea Ice Cyclic Performance Report
Cycle No. 30
Ref.: S3MPC.UCL.PR.30
Issue: 1.0
Date: 11/07/2018
Page: 2
2 Cycle Overview
This is 27-day cycle 30 (07/04/2018 to 04/05/2018).
Sentinel-3A was launched on 16-February-2016 and entered its routine operational phase in cycle 12 (07-
December-2016) following commissioning.
During this cycle 30, Sentinel-3A SRAL operated in SAR mode over land ice and sea ice surfaces.

Sentinel-3 MPC
S3-A Land and Sea Ice Cyclic Performance Report
Cycle No. 30
Ref.: S3MPC.UCL.PR.30
Issue: 1.0
Date: 11/07/2018
Page: 3
3 Processing Baselines
The versions of the Level-1 and Level-2 Instrument Processing Facility software and Product Baseline used to compute the altimeter parameters for the L2 Land (SR_2-LAN) NTC dataset during this cycle were:
SR_2_LAN NTC
Cycle Processing Baseline L2 IPF Versions L1 IPF Versions
30 PB 2.33 SM2 6.14
SR1 6.14
The versions of the Level-1 and Level-2 Instrument Processing Facility software and Product Baseline were used to compute the altimeter parameters for the L2 Marine (SR_2-WAT) NTC dataset during this cycle were:.
SR_2_WAT NTC
Cycle Processing Baseline L2 IPF Versions L1 IPF Versions
30 PB 2.33 SM2 6.14 SR1 6.14

Sentinel-3 MPC
S3-A Land and Sea Ice Cyclic Performance Report
Cycle No. 30
Ref.: S3MPC.UCL.PR.30
Issue: 1.0
Date: 11/07/2018
Page: 4
4 Data Availability & Instrument Modes
4.1 Data Availability
The percentage of L2 product orbits received during this 27 day cycle by the MPC and contributing to
this report were:
Product Type Latency % Orbits Received
SR_2_LAN NTC 100%
SR_2_WAT NTC 100%
Table 1: Data Availability for NTC
Note that these are percentages of products received by the Mission Performance Centre at the time of
report issue, and may be lower than the final data availability if there have been processing centre delays.
Sentinel-3 MPC
S3-A Land and Sea Ice Cyclic Performance Report
Cycle No. 30
Ref.: S3MPC.UCL.PR.30
Issue: 1.0
Date: 11/07/2018
Page: 5
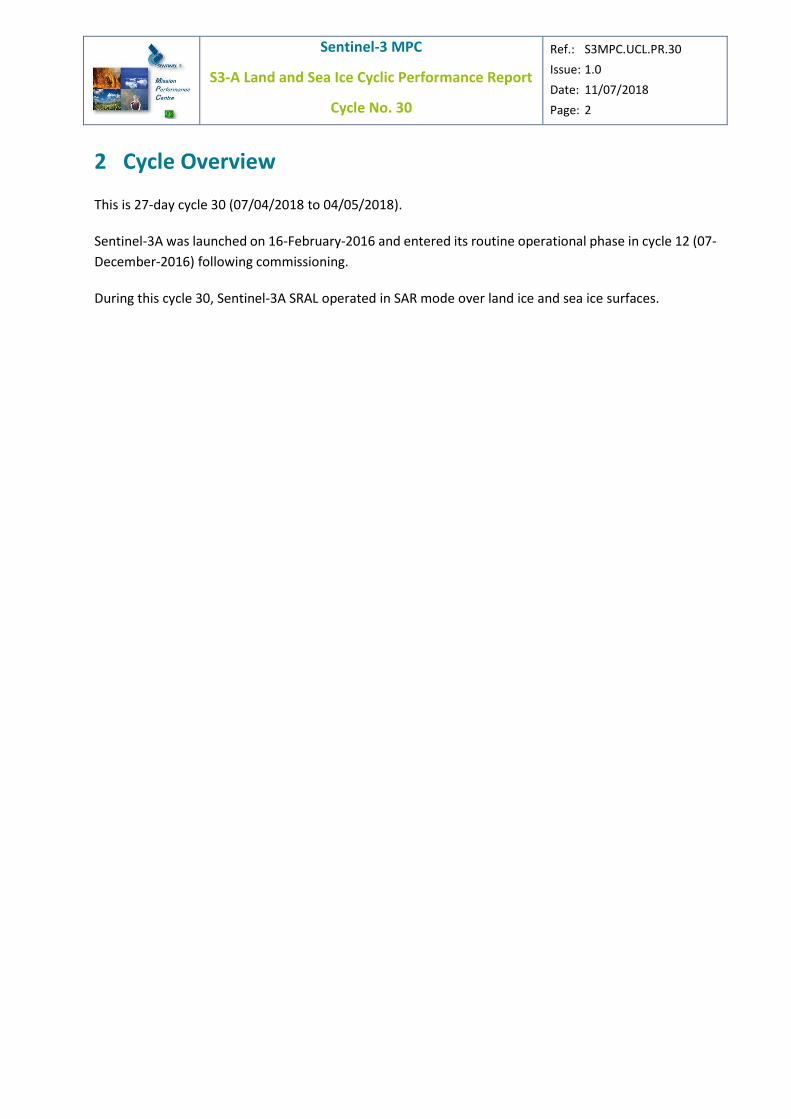
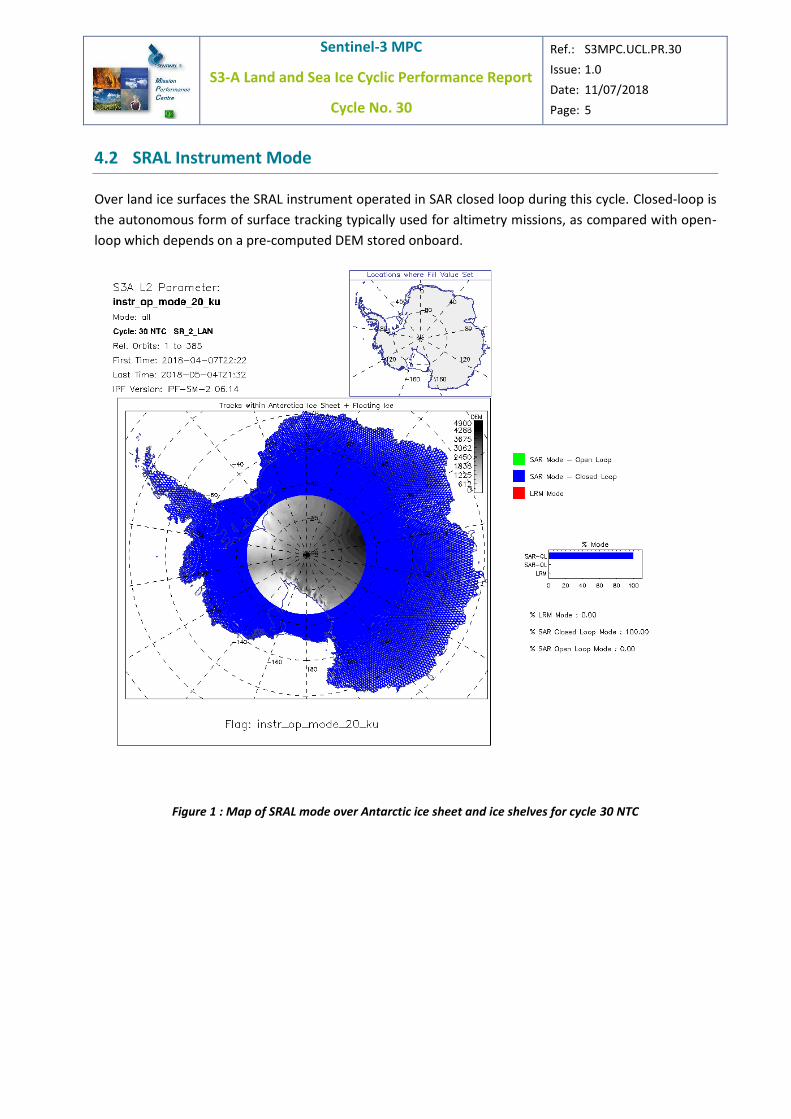
4.2 SRAL Instrument Mode
Over land ice surfaces the SRAL instrument operated in SAR closed loop during this cycle. Closed-loop is
the autonomous form of surface tracking typically used for altimetry missions, as compared with open-
loop which depends on a pre-computed DEM stored onboard.
Figure 1 : Map of SRAL mode over Antarctic ice sheet and ice shelves for cycle 30 NTC
Sentinel-3 MPC
S3-A Land and Sea Ice Cyclic Performance Report
Cycle No. 30
Ref.: S3MPC.UCL.PR.30
Issue: 1.0
Date: 11/07/2018
Page: 6
Figure 2: Map of SRAL mode over Greenland ice sheet for cycle 30 NTC
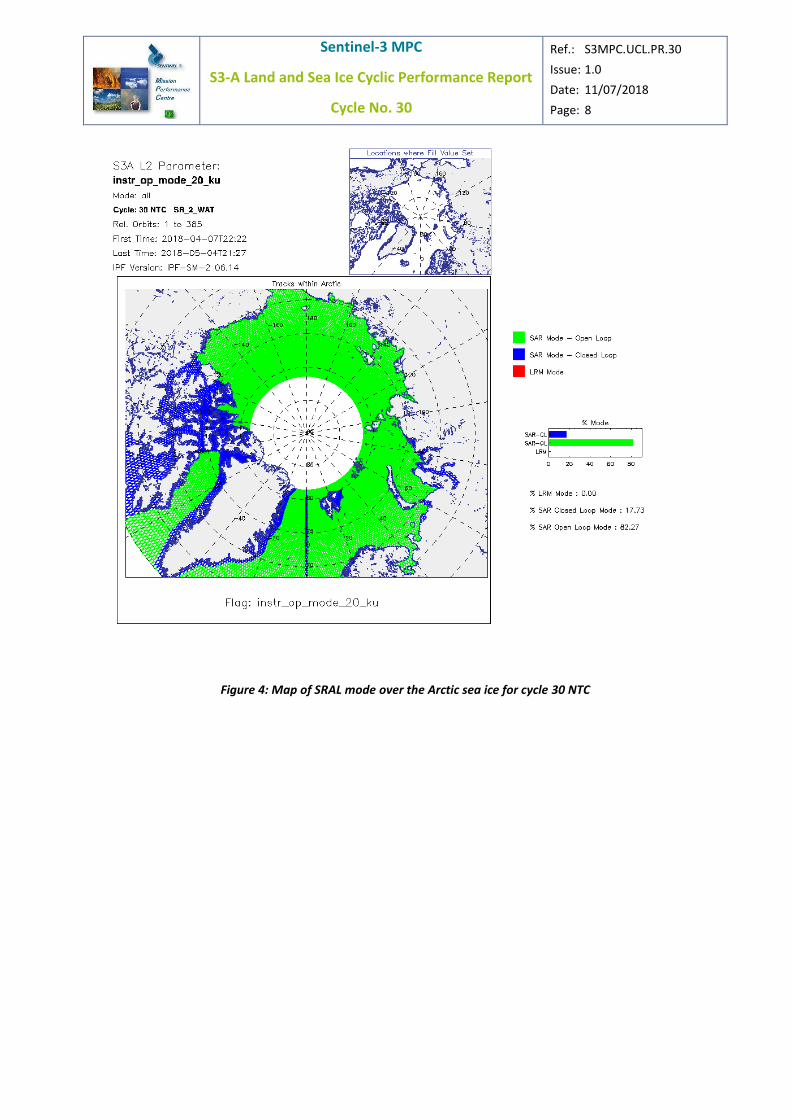
For sea ice and ocean surfaces the SRAL instrument operated in SAR open loop mode during this cycle.
Note that the mode mask is fixed and does not dynamically change from cycle to cycle. In open loop the
range window is positioned using a 1-D along track DEM with a-priori knowledge of the surface height.

Sentinel-3 MPC
S3-A Land and Sea Ice Cyclic Performance Report
Cycle No. 30
Ref.: S3MPC.UCL.PR.30
Issue: 1.0
Date: 11/07/2018
Page: 7
Figure 3: Map of SRAL mode over the Antarctic sea ice for cycle 30 NTC
Sentinel-3 MPC
S3-A Land and Sea Ice Cyclic Performance Report
Cycle No. 30
Ref.: S3MPC.UCL.PR.30
Issue: 1.0
Date: 11/07/2018
Page: 8
Figure 4: Map of SRAL mode over the Arctic sea ice for cycle 30 NTC

Sentinel-3 MPC
S3-A Land and Sea Ice Cyclic Performance Report
Cycle No. 30
Ref.: S3MPC.UCL.PR.30
Issue: 1.0
Date: 11/07/2018
Page: 9
5 Availability of Polar Geophysical Corrections
In this section the availability of geophysical corrections to altimeter range contained in the L2 products
over ice sheets, ice shelves and sea ice are analysed for this cycle. Missing or invalid geophysical
corrections can cause errors in the final L2 elevation parameters, and erroneous steps in derived time
series of ice sheet surface elevation change or sea ice freeboard.
5.1 Availability of Geophysical Corrections over Ice Sheets (NTC Products)
For polar ice sheets, the primary geophysical corrections applied to the range are model dry tropospheric,
model wet tropospheric, GIM ionospheric, solid earth tide, pole tide and ocean loading tide. We would
normally expect 100% availability of all corrections.
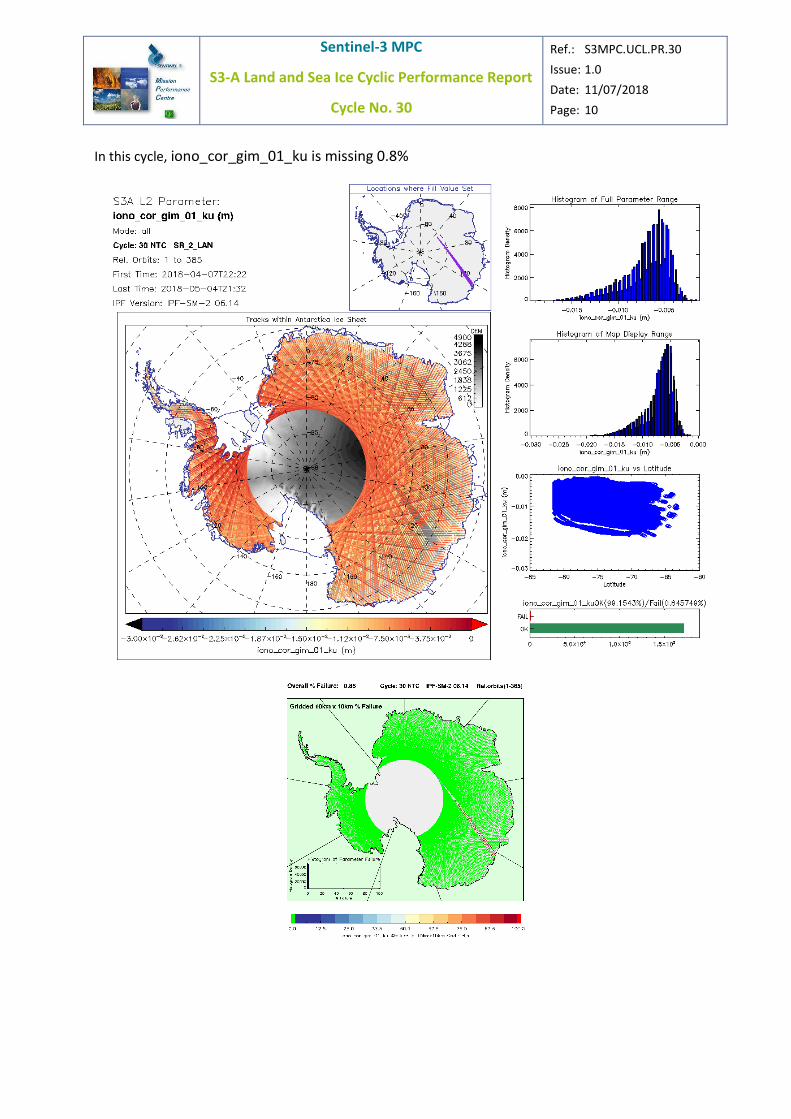
For cycle 30 NTC the percentage of non-available geophysical corrections over Antarctic ice sheets was:
Figure 5: Percentage of Geophysical Correction Non-availability over Antarctic Ice Sheets
Sentinel-3 MPC
S3-A Land and Sea Ice Cyclic Performance Report
Cycle No. 30
Ref.: S3MPC.UCL.PR.30
Issue: 1.0
Date: 11/07/2018
Page: 10
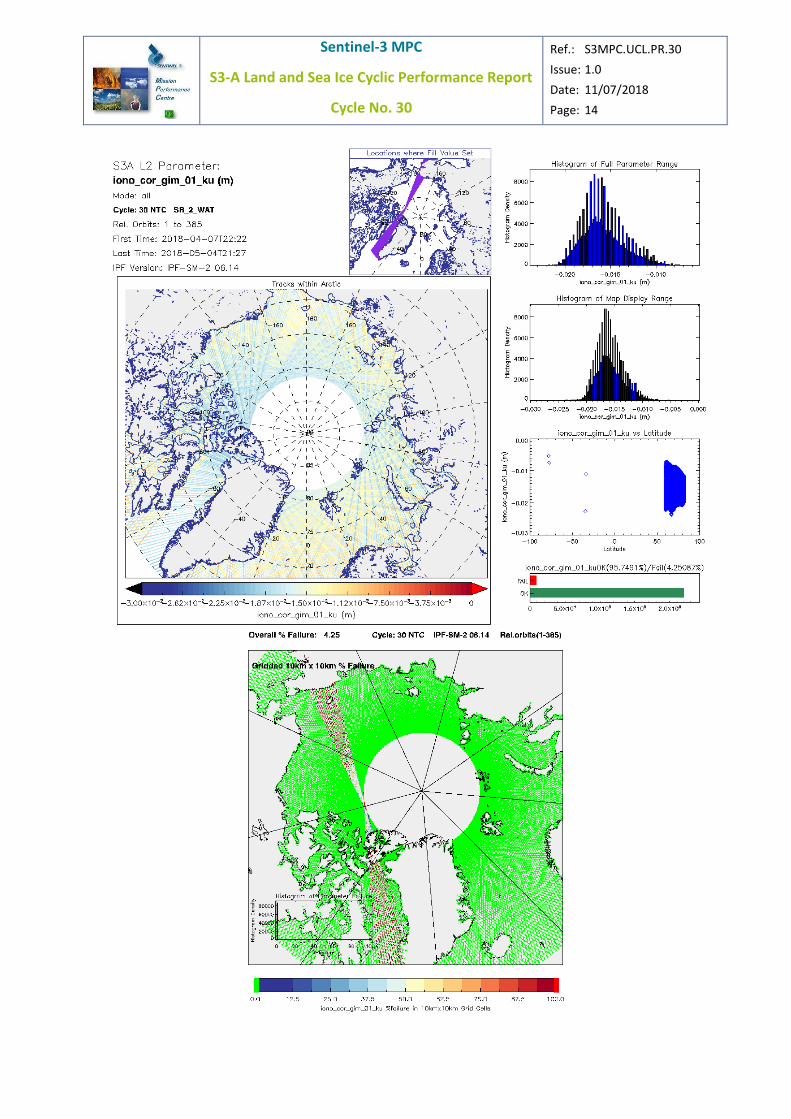
In this cycle, iono_cor_gim_01_ku is missing 0.8%
Sentinel-3 MPC
S3-A Land and Sea Ice Cyclic Performance Report
Cycle No. 30
Ref.: S3MPC.UCL.PR.30
Issue: 1.0
Date: 11/07/2018
Page: 11
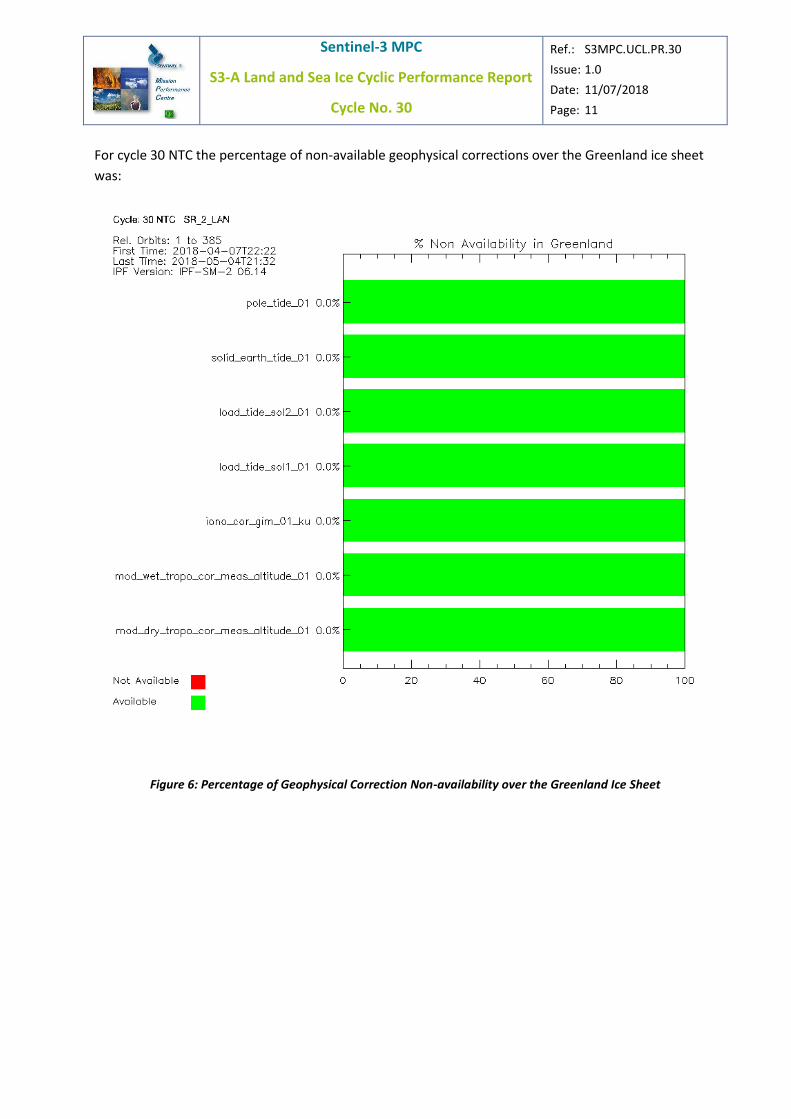
For cycle 30 NTC the percentage of non-available geophysical corrections over the Greenland ice sheet
was:
Figure 6: Percentage of Geophysical Correction Non-availability over the Greenland Ice Sheet
Sentinel-3 MPC
S3-A Land and Sea Ice Cyclic Performance Report
Cycle No. 30
Ref.: S3MPC.UCL.PR.30
Issue: 1.0
Date: 11/07/2018
Page: 12
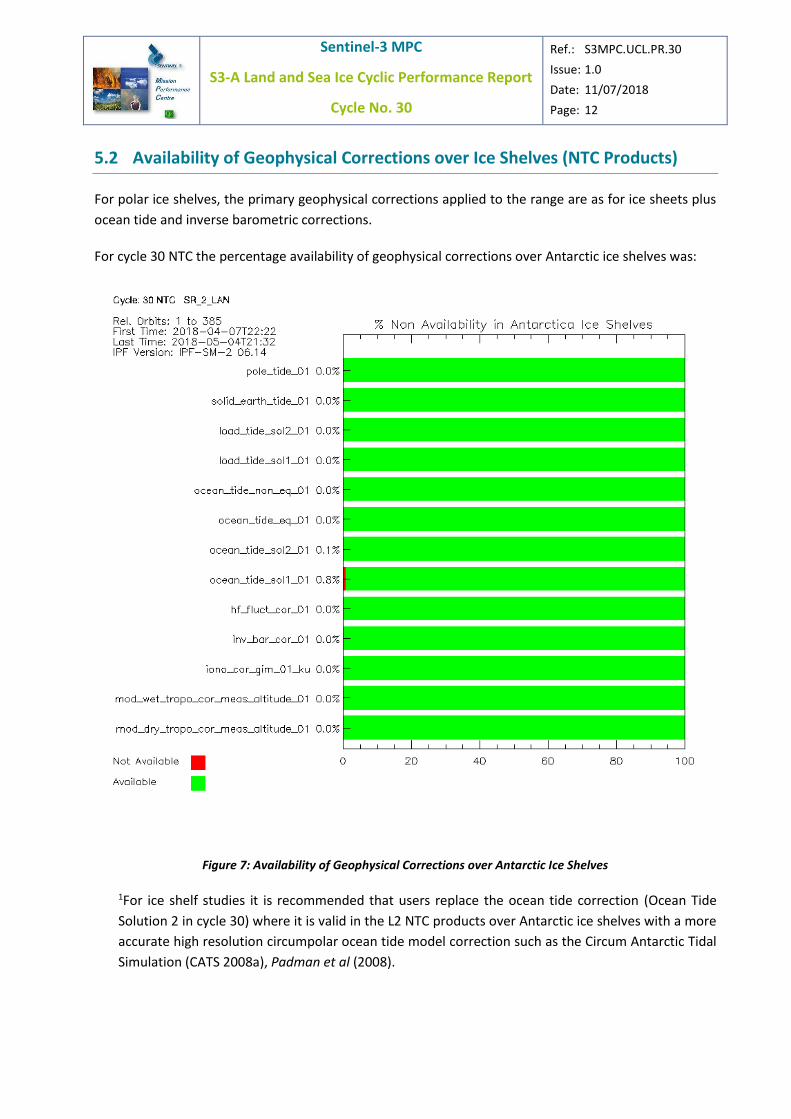
5.2 Availability of Geophysical Corrections over Ice Shelves (NTC Products)
For polar ice shelves, the primary geophysical corrections applied to the range are as for ice sheets plus
ocean tide and inverse barometric corrections.
For cycle 30 NTC the percentage availability of geophysical corrections over Antarctic ice shelves was:
Figure 7: Availability of Geophysical Corrections over Antarctic Ice Shelves
1For ice shelf studies it is recommended that users replace the ocean tide correction (Ocean Tide
Solution 2 in cycle 30) where it is valid in the L2 NTC products over Antarctic ice shelves with a more
accurate high resolution circumpolar ocean tide model correction such as the Circum Antarctic Tidal
Simulation (CATS 2008a), Padman et al (2008).
Sentinel-3 MPC
S3-A Land and Sea Ice Cyclic Performance Report
Cycle No. 30
Ref.: S3MPC.UCL.PR.30
Issue: 1.0
Date: 11/07/2018
Page: 13
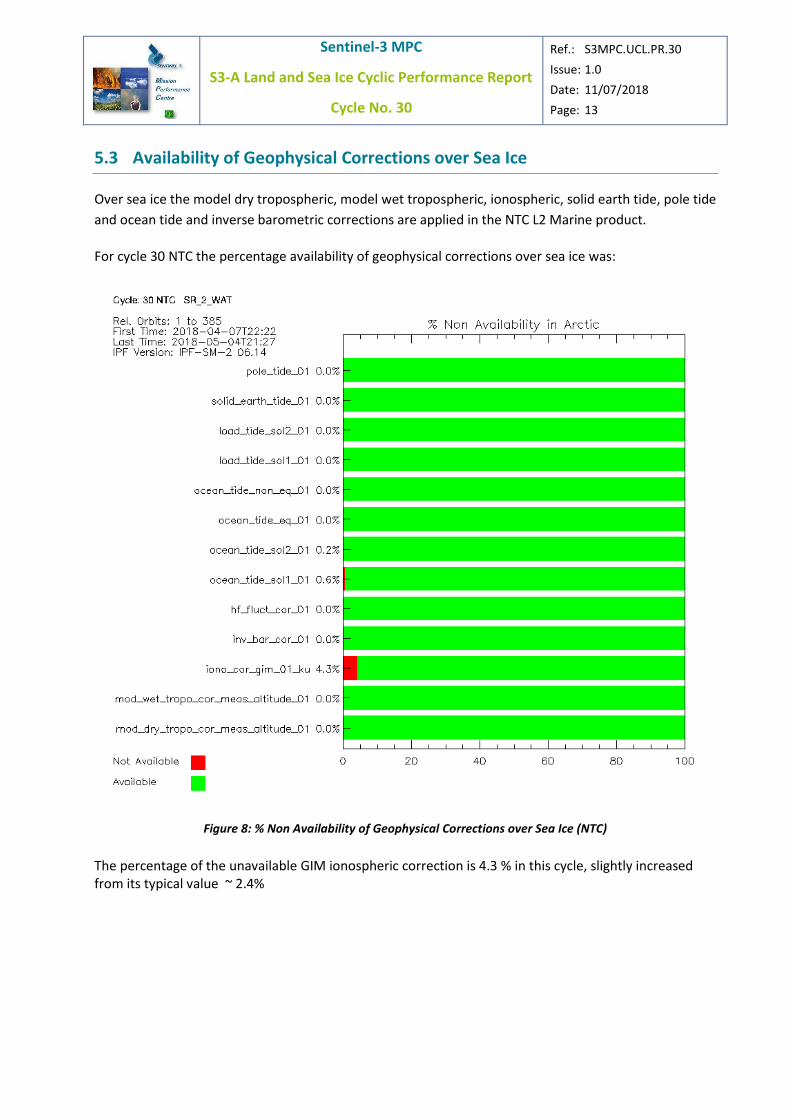
5.3 Availability of Geophysical Corrections over Sea Ice
Over sea ice the model dry tropospheric, model wet tropospheric, ionospheric, solid earth tide, pole tide
and ocean tide and inverse barometric corrections are applied in the NTC L2 Marine product.
For cycle 30 NTC the percentage availability of geophysical corrections over sea ice was:
Figure 8: % Non Availability of Geophysical Corrections over Sea Ice (NTC)
The percentage of the unavailable GIM ionospheric correction is 4.3 % in this cycle, slightly increased from its typical value ~ 2.4%
Sentinel-3 MPC
S3-A Land and Sea Ice Cyclic Performance Report
Cycle No. 30
Ref.: S3MPC.UCL.PR.30
Issue: 1.0
Date: 11/07/2018
Page: 14

Sentinel-3 MPC
S3-A Land and Sea Ice Cyclic Performance Report
Cycle No. 30
Ref.: S3MPC.UCL.PR.30
Issue: 1.0
Date: 11/07/2018
Page: 15
5.4 Availability of Snow Density, Snow Depth and Sea Ice Concentration over
Sea Ice
Correction % Availability Arctic Sea Ice % Availability Antarctic Sea Ice
Sea Ice Concentration3 100 100
Snow Density1 100 100
Snow Depth 100 1002
Table 2: % Availability of Snow Density, Snow Depth, Sea Ice Concentration over Sea Ice
1Snow Density is set to a single value of 400 Kg/m3 as expected.
2 Snow depth over Antarctic sea ice is set to zero as expected.
3Sea Ice Concentration is derived from a dynamic 3 day average of sea ice concentration calculated
from SSM/I daily brightness temperature data.
Sentinel-3 MPC
S3-A Land and Sea Ice Cyclic Performance Report
Cycle No. 30
Ref.: S3MPC.UCL.PR.30
Issue: 1.0
Date: 11/07/2018
Page: 16
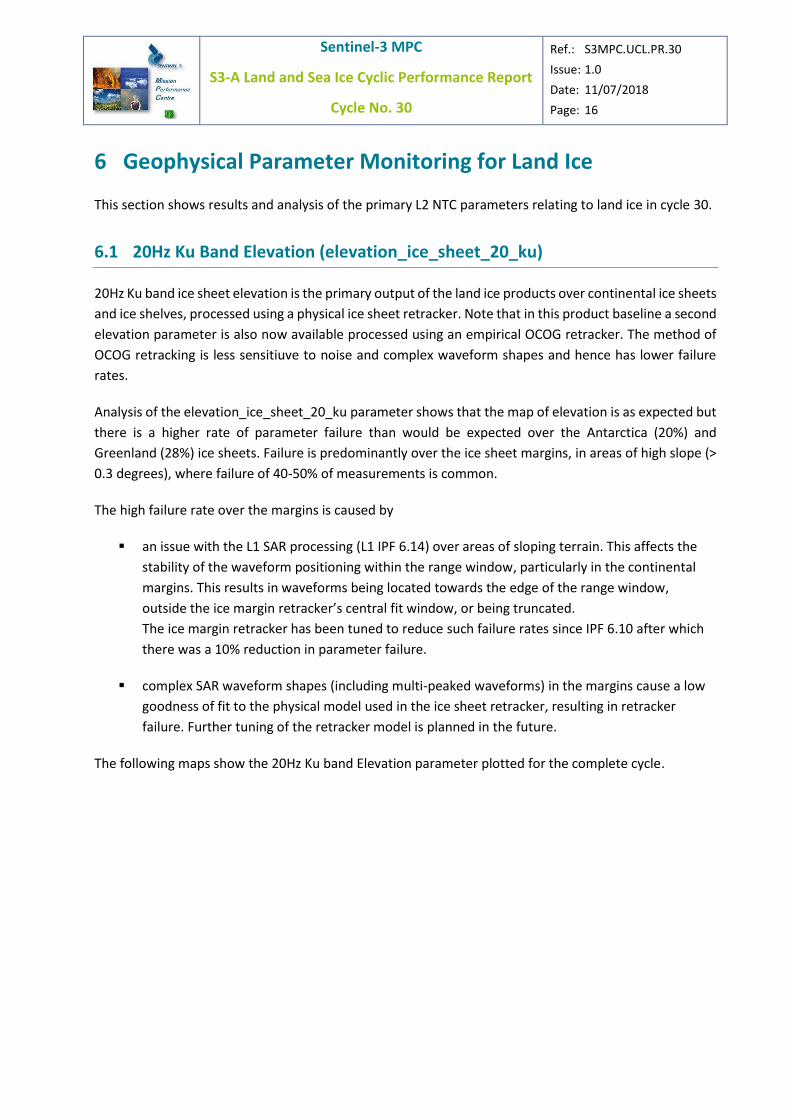
6 Geophysical Parameter Monitoring for Land Ice
This section shows results and analysis of the primary L2 NTC parameters relating to land ice in cycle 30.
6.1 20Hz Ku Band Elevation (elevation_ice_sheet_20_ku)
20Hz Ku band ice sheet elevation is the primary output of the land ice products over continental ice sheets
and ice shelves, processed using a physical ice sheet retracker. Note that in this product baseline a second
elevation parameter is also now available processed using an empirical OCOG retracker. The method of
OCOG retracking is less sensitiuve to noise and complex waveform shapes and hence has lower failure
rates.
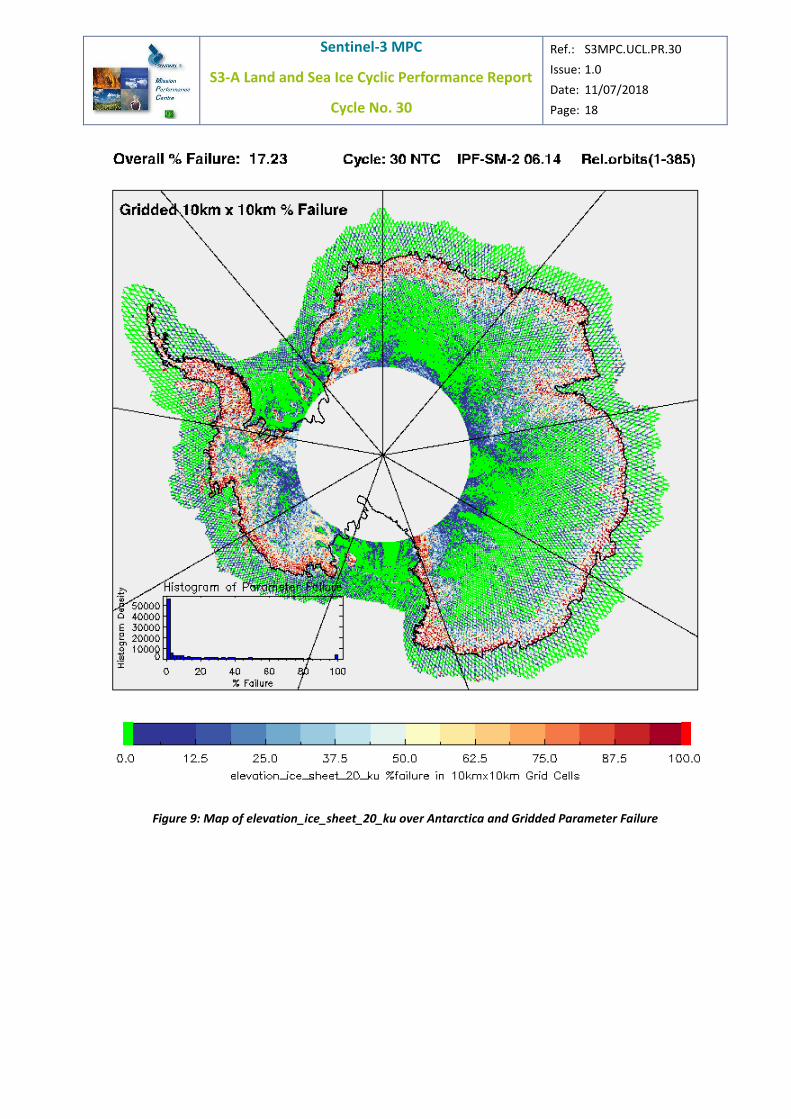
Analysis of the elevation_ice_sheet_20_ku parameter shows that the map of elevation is as expected but
there is a higher rate of parameter failure than would be expected over the Antarctica (20%) and
Greenland (28%) ice sheets. Failure is predominantly over the ice sheet margins, in areas of high slope (>
0.3 degrees), where failure of 40-50% of measurements is common.
The high failure rate over the margins is caused by
▪ an issue with the L1 SAR processing (L1 IPF 6.14) over areas of sloping terrain. This affects the
stability of the waveform positioning within the range window, particularly in the continental
margins. This results in waveforms being located towards the edge of the range window,
outside the ice margin retracker’s central fit window, or being truncated.
The ice margin retracker has been tuned to reduce such failure rates since IPF 6.10 after which
there was a 10% reduction in parameter failure.
▪ complex SAR waveform shapes (including multi-peaked waveforms) in the margins cause a low
goodness of fit to the physical model used in the ice sheet retracker, resulting in retracker
failure. Further tuning of the retracker model is planned in the future.
The following maps show the 20Hz Ku band Elevation parameter plotted for the complete cycle.

Sentinel-3 MPC
S3-A Land and Sea Ice Cyclic Performance Report
Cycle No. 30
Ref.: S3MPC.UCL.PR.30
Issue: 1.0
Date: 11/07/2018
Page: 17
Sentinel-3 MPC
S3-A Land and Sea Ice Cyclic Performance Report
Cycle No. 30
Ref.: S3MPC.UCL.PR.30
Issue: 1.0
Date: 11/07/2018
Page: 18
Figure 9: Map of elevation_ice_sheet_20_ku over Antarctica and Gridded Parameter Failure

Sentinel-3 MPC
S3-A Land and Sea Ice Cyclic Performance Report
Cycle No. 30
Ref.: S3MPC.UCL.PR.30
Issue: 1.0
Date: 11/07/2018
Page: 19
Figure 10: Map of 20Hz Ku band Ice Sheet Elevation over Greenland and Gridded % Parameter Failure

Sentinel-3 MPC
S3-A Land and Sea Ice Cyclic Performance Report
Cycle No. 30
Ref.: S3MPC.UCL.PR.30
Issue: 1.0
Date: 11/07/2018
Page: 20
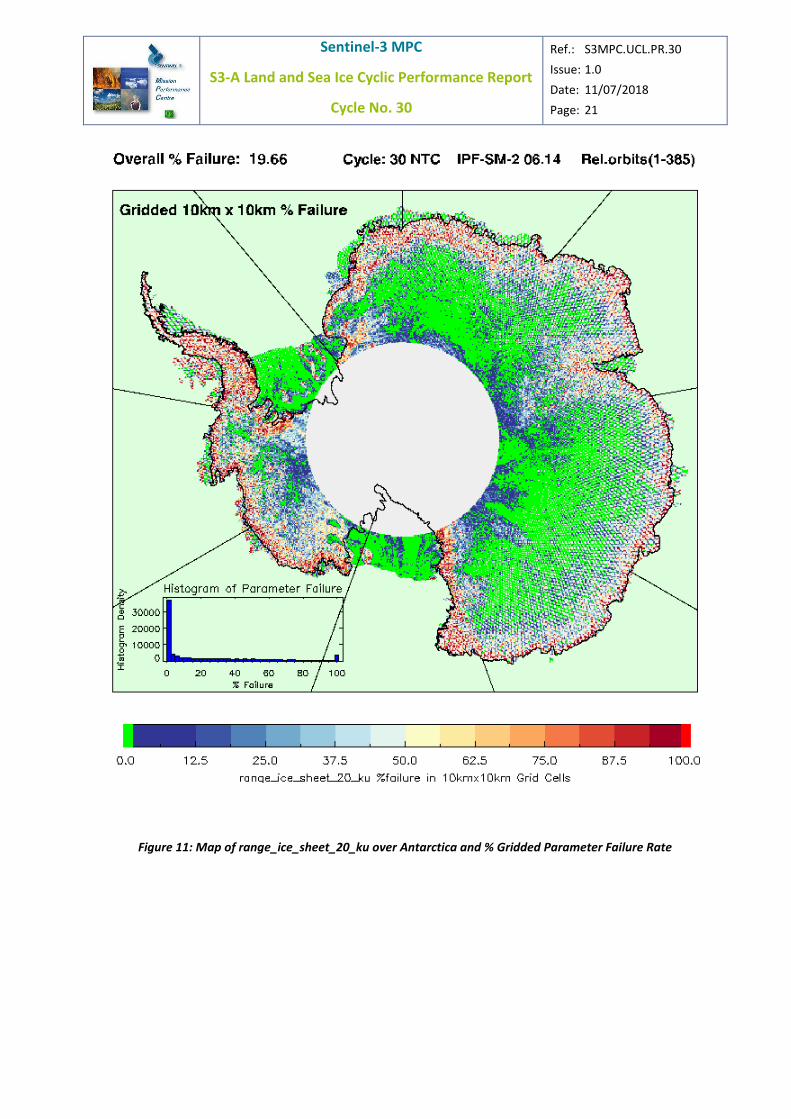
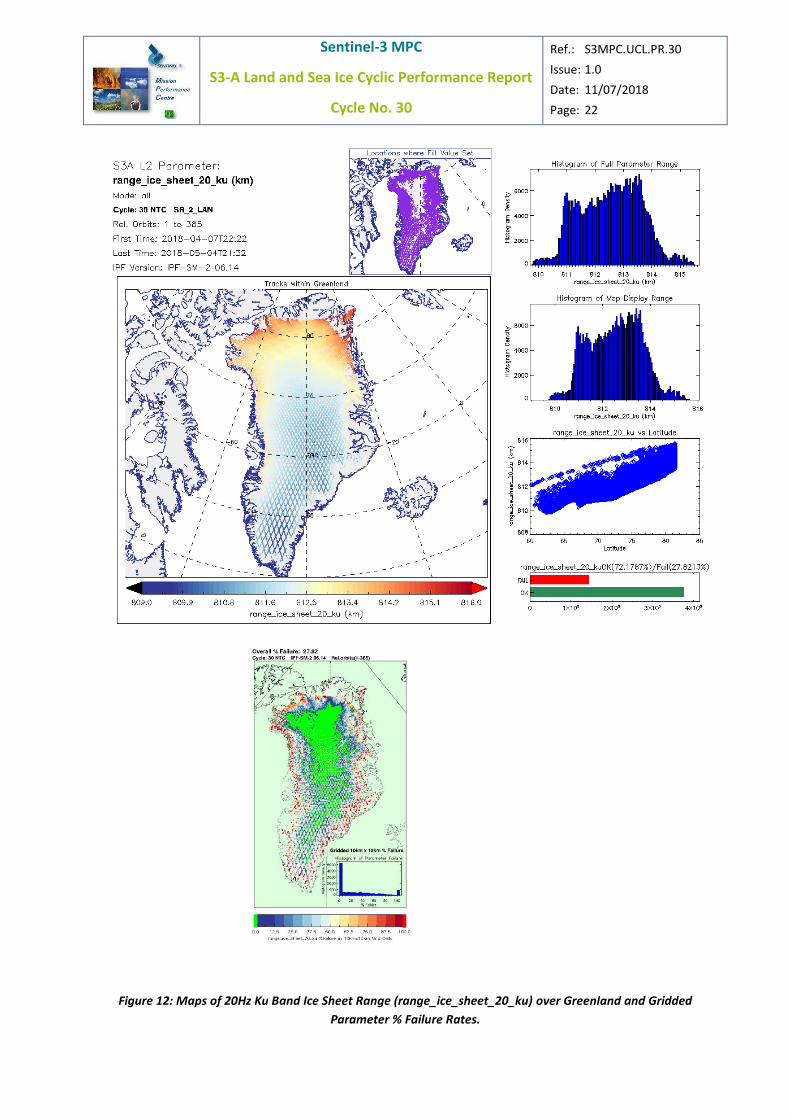
6.2 20Hz Ku Band Ice Sheet Range (range_ice_sheet_20_ku)
The ice sheet range is retracked using the SAR ice margin retracker and is the primary range used to
calculate elevation in the L2 product.
There are higher than expected rates of failure in this parameter over all ice areas. An explanation of this
is given in the preceding section on ice sheet elevation.
Sentinel-3 MPC
S3-A Land and Sea Ice Cyclic Performance Report
Cycle No. 30
Ref.: S3MPC.UCL.PR.30
Issue: 1.0
Date: 11/07/2018
Page: 21
Figure 11: Map of range_ice_sheet_20_ku over Antarctica and % Gridded Parameter Failure Rate
Sentinel-3 MPC
S3-A Land and Sea Ice Cyclic Performance Report
Cycle No. 30
Ref.: S3MPC.UCL.PR.30
Issue: 1.0
Date: 11/07/2018
Page: 22
Figure 12: Maps of 20Hz Ku Band Ice Sheet Range (range_ice_sheet_20_ku) over Greenland and Gridded
Parameter % Failure Rates.
Sentinel-3 MPC
S3-A Land and Sea Ice Cyclic Performance Report
Cycle No. 30
Ref.: S3MPC.UCL.PR.30
Issue: 1.0
Date: 11/07/2018
Page: 23
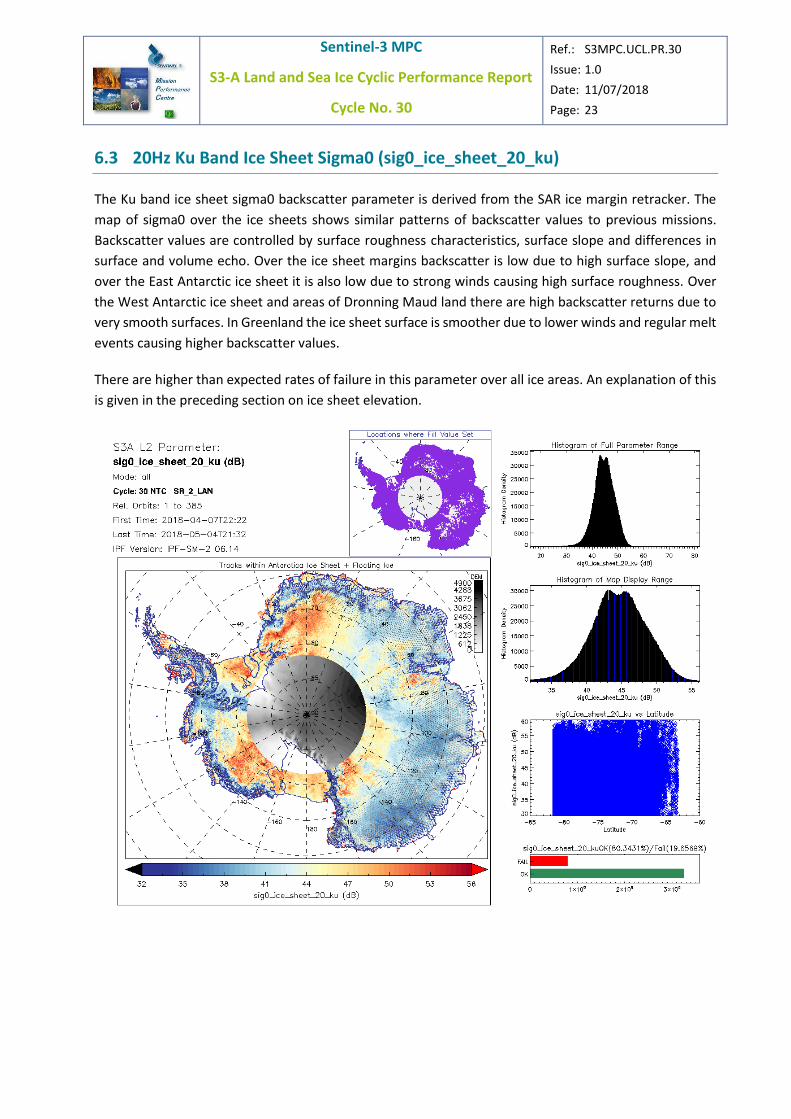
6.3 20Hz Ku Band Ice Sheet Sigma0 (sig0_ice_sheet_20_ku)
The Ku band ice sheet sigma0 backscatter parameter is derived from the SAR ice margin retracker. The
map of sigma0 over the ice sheets shows similar patterns of backscatter values to previous missions.
Backscatter values are controlled by surface roughness characteristics, surface slope and differences in
surface and volume echo. Over the ice sheet margins backscatter is low due to high surface slope, and
over the East Antarctic ice sheet it is also low due to strong winds causing high surface roughness. Over
the West Antarctic ice sheet and areas of Dronning Maud land there are high backscatter returns due to
very smooth surfaces. In Greenland the ice sheet surface is smoother due to lower winds and regular melt
events causing higher backscatter values.
There are higher than expected rates of failure in this parameter over all ice areas. An explanation of this
is given in the preceding section on ice sheet elevation.
Sentinel-3 MPC
S3-A Land and Sea Ice Cyclic Performance Report
Cycle No. 30
Ref.: S3MPC.UCL.PR.30
Issue: 1.0
Date: 11/07/2018
Page: 24
Figure 13: Maps of 20Hz Ku Band Ice Sheet Sigma0 (sig0_ice_sheet_20_ku)
For maps of % gridded parameter failure rates see range_ice_sheet_20_ku.

Sentinel-3 MPC
S3-A Land and Sea Ice Cyclic Performance Report
Cycle No. 30
Ref.: S3MPC.UCL.PR.30
Issue: 1.0
Date: 11/07/2018
Page: 25
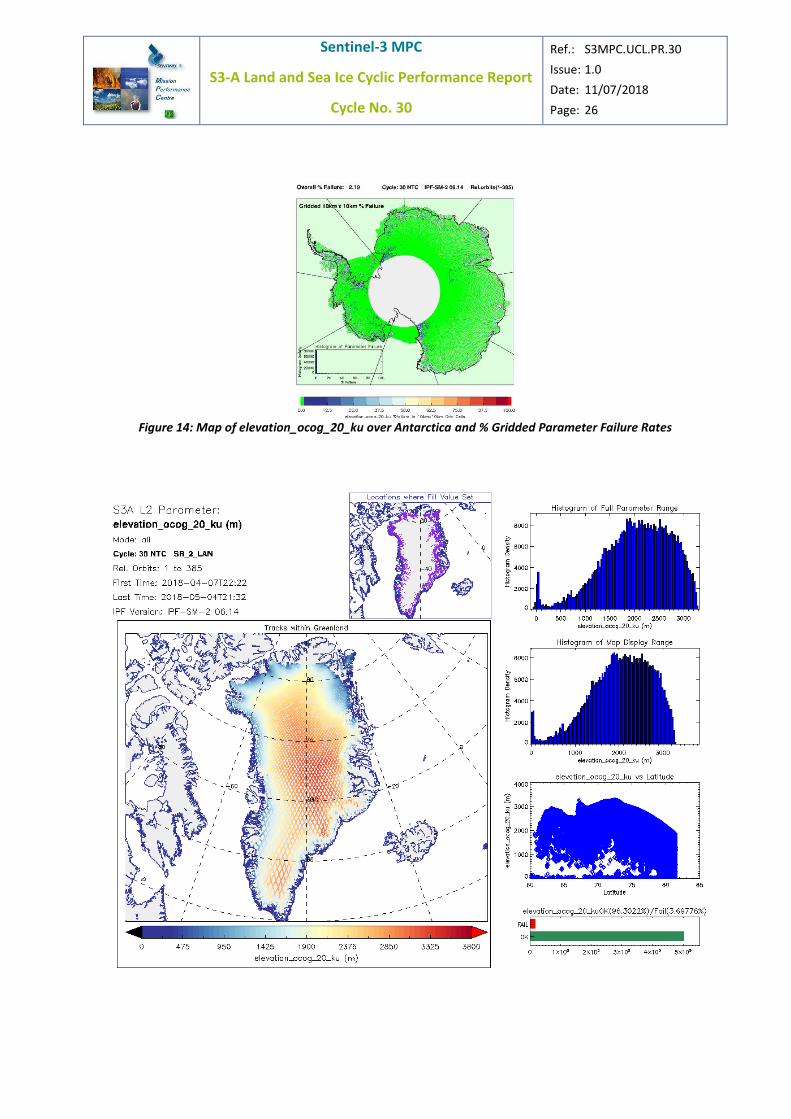
6.4 20Hz Ku Band OCOG (Ice-1) Elevation (elevation_ocog_20_ku)
This parameter is the elevation derived from the OCOG (Ice-1) retracker. Note that there are are much
lower failure rates (~2%) than for the SAR ice sheet retracked elevation (~20%) . This is because the OCOG
centre of gravity retracking algorithm will retrack a wider range of waveform shapes and leading edge
positions than the physical model fit approach used by the SAR ice margin retracker. This results in greater
measurement density, but in some areas lower accuracy.
Sentinel-3 MPC
S3-A Land and Sea Ice Cyclic Performance Report
Cycle No. 30
Ref.: S3MPC.UCL.PR.30
Issue: 1.0
Date: 11/07/2018
Page: 26
Figure 14: Map of elevation_ocog_20_ku over Antarctica and % Gridded Parameter Failure Rates
Sentinel-3 MPC
S3-A Land and Sea Ice Cyclic Performance Report
Cycle No. 30
Ref.: S3MPC.UCL.PR.30
Issue: 1.0
Date: 11/07/2018
Page: 27
Figure 15: Map of elevation_ocog_20_ku over Greenland and % Gridded Parameter Failure Rates

Sentinel-3 MPC
S3-A Land and Sea Ice Cyclic Performance Report
Cycle No. 30
Ref.: S3MPC.UCL.PR.30
Issue: 1.0
Date: 11/07/2018
Page: 28
6.5 20Hz Ku Band OCOG (Ice-1) Range (range_ocog_20_ku)
This parameter is the range derived from the OCOG (Ice-1) retracker. Note that there are are much lower
failure rates (~2%) than for the SAR ice margin retracker (~20%) as explained in the section on
elevation_ocog_20_ku.
Figure 16: Map of range_ocog_20_ku over Antarctica and % Gridded Parameter Failure
Sentinel-3 MPC
S3-A Land and Sea Ice Cyclic Performance Report
Cycle No. 30
Ref.: S3MPC.UCL.PR.30
Issue: 1.0
Date: 11/07/2018
Page: 29
Figure 17: Map of range_ocog_20_ku over Greenland and % Gridded Parameter Failure

Sentinel-3 MPC
S3-A Land and Sea Ice Cyclic Performance Report
Cycle No. 30
Ref.: S3MPC.UCL.PR.30
Issue: 1.0
Date: 11/07/2018
Page: 30
6.6 20Hz Ku Band OCOG (Ice-1) Sigma0 (sig0_ocog_20_ku)
The Ku band OCOG sigma0 backscatter parameter is derived from the OCOG (Ice-1) retracker. The map of
sigma0 over the ice sheets shows similar patterns of backscatter values to previous missions. Backscatter
values are controlled by surface roughness characteristics, surface slope and differences in surface and
volume echo. Over the ice sheet margins backscatter is low due to high surface slope, and over the East
Antarctic ice sheet it is also low due to strong winds causing high surface roughness. Over the West
Antarctic ice sheet and areas of Dronning Maud land there are high backscatter returns due to very
smooth surfaces. In Greenland the ice sheet surface is smoother due to lower winds and regular melt
events causing higher backscatter values.
Figure 18: Map of 20Hz Ku Band OCOG (Ice-1) Sigma0 (sig0_ocog_20_ku) over Antarctica
Sentinel-3 MPC
S3-A Land and Sea Ice Cyclic Performance Report
Cycle No. 30
Ref.: S3MPC.UCL.PR.30
Issue: 1.0
Date: 11/07/2018
Page: 31
Figure 19: Map of 20Hz Ku Band OCOG (Ice-1) Sigma0 (sig0_ocog_20_ku) over Greenland
For maps of % gridded parameter failure rates, see maps of range_ocog_20_ku.
Sentinel-3 MPC
S3-A Land and Sea Ice Cyclic Performance Report
Cycle No. 30
Ref.: S3MPC.UCL.PR.30
Issue: 1.0
Date: 11/07/2018
Page: 32
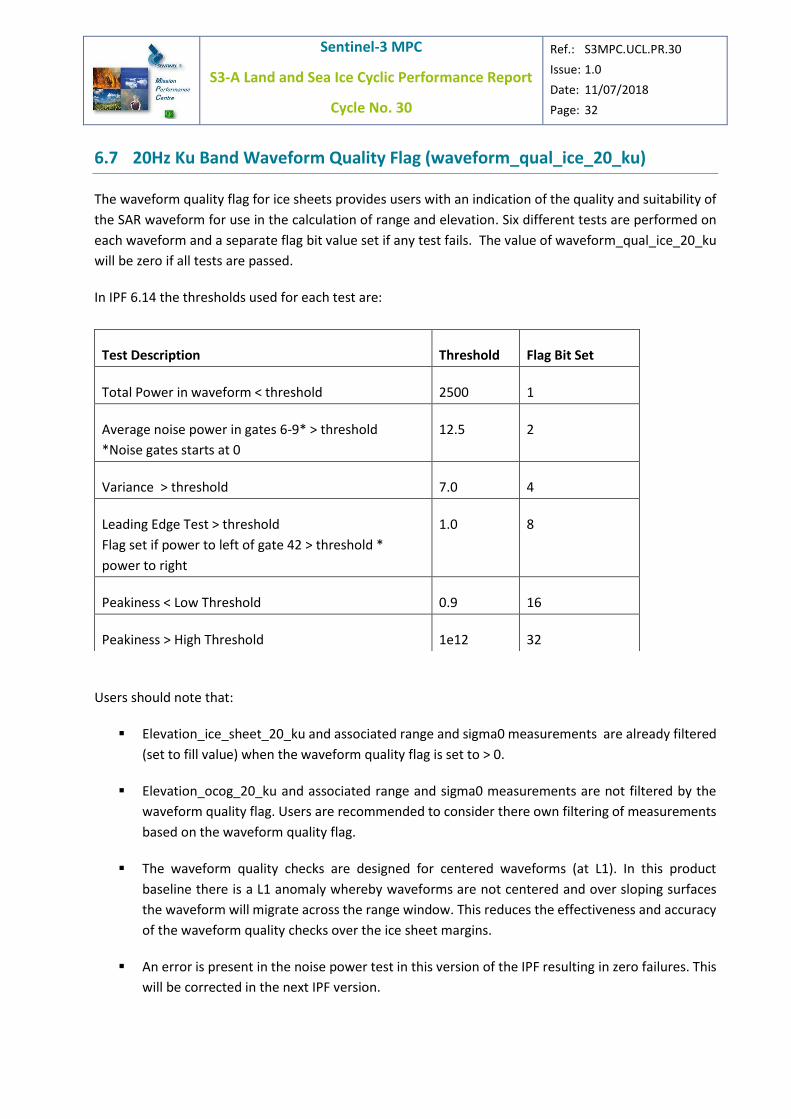
6.7 20Hz Ku Band Waveform Quality Flag (waveform_qual_ice_20_ku)
The waveform quality flag for ice sheets provides users with an indication of the quality and suitability of
the SAR waveform for use in the calculation of range and elevation. Six different tests are performed on
each waveform and a separate flag bit value set if any test fails. The value of waveform_qual_ice_20_ku
will be zero if all tests are passed.
In IPF 6.14 the thresholds used for each test are:
Users should note that:
▪ Elevation_ice_sheet_20_ku and associated range and sigma0 measurements are already filtered
(set to fill value) when the waveform quality flag is set to > 0.
▪ Elevation_ocog_20_ku and associated range and sigma0 measurements are not filtered by the
waveform quality flag. Users are recommended to consider there own filtering of measurements
based on the waveform quality flag.
▪ The waveform quality checks are designed for centered waveforms (at L1). In this product
baseline there is a L1 anomaly whereby waveforms are not centered and over sloping surfaces
the waveform will migrate across the range window. This reduces the effectiveness and accuracy
of the waveform quality checks over the ice sheet margins.
▪ An error is present in the noise power test in this version of the IPF resulting in zero failures. This
will be corrected in the next IPF version.
Test Description Threshold Flag Bit Set
Total Power in waveform < threshold 2500 1
Average noise power in gates 6-9* > threshold
*Noise gates starts at 0
12.5 2
Variance > threshold 7.0 4
Leading Edge Test > threshold
Flag set if power to left of gate 42 > threshold *
power to right
1.0 8
Peakiness < Low Threshold 0.9 16
Peakiness > High Threshold 1e12 32

Sentinel-3 MPC
S3-A Land and Sea Ice Cyclic Performance Report
Cycle No. 30
Ref.: S3MPC.UCL.PR.30
Issue: 1.0
Date: 11/07/2018
Page: 33
Figure 20: Map of Waveform Quality Flag over Antarctica (all tests)

Sentinel-3 MPC
S3-A Land and Sea Ice Cyclic Performance Report
Cycle No. 30
Ref.: S3MPC.UCL.PR.30
Issue: 1.0
Date: 11/07/2018
Page: 34
Figure 21: Maps of Waveform Quality Flag over Greenland (all tests)

Sentinel-3 MPC
S3-A Land and Sea Ice Cyclic Performance Report
Cycle No. 30
Ref.: S3MPC.UCL.PR.30
Issue: 1.0
Date: 11/07/2018
Page: 35
Sentinel-3 MPC
S3-A Land and Sea Ice Cyclic Performance Report
Cycle No. 30
Ref.: S3MPC.UCL.PR.30
Issue: 1.0
Date: 11/07/2018
Page: 36

Sentinel-3 MPC
S3-A Land and Sea Ice Cyclic Performance Report
Cycle No. 30
Ref.: S3MPC.UCL.PR.30
Issue: 1.0
Date: 11/07/2018
Page: 37
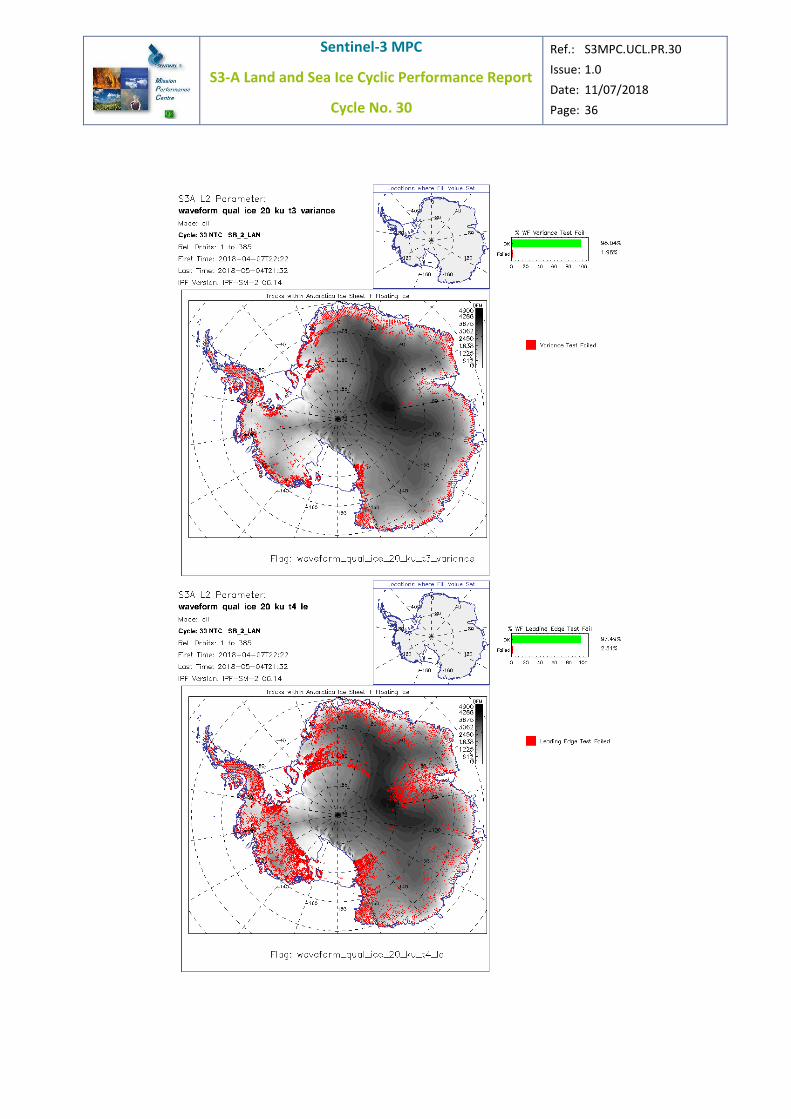
Figure 22: Maps of individual waveform quality flag tests over Antarctica
Sentinel-3 MPC
S3-A Land and Sea Ice Cyclic Performance Report
Cycle No. 30
Ref.: S3MPC.UCL.PR.30
Issue: 1.0
Date: 11/07/2018
Page: 38
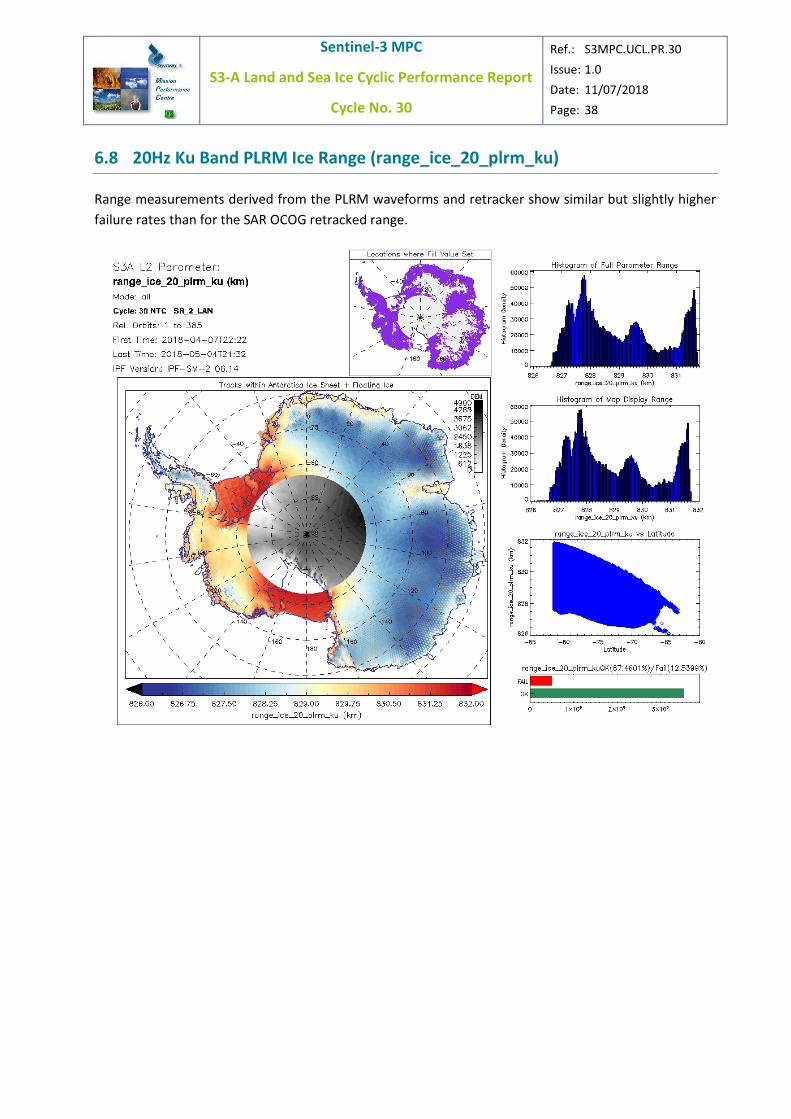
6.8 20Hz Ku Band PLRM Ice Range (range_ice_20_plrm_ku)
Range measurements derived from the PLRM waveforms and retracker show similar but slightly higher
failure rates than for the SAR OCOG retracked range.

Sentinel-3 MPC
S3-A Land and Sea Ice Cyclic Performance Report
Cycle No. 30
Ref.: S3MPC.UCL.PR.30
Issue: 1.0
Date: 11/07/2018
Page: 39
Figure 23: Map of range_ice_20_plrm_ku over Antarctica and % Gridded Parameter Failure

Sentinel-3 MPC
S3-A Land and Sea Ice Cyclic Performance Report
Cycle No. 30
Ref.: S3MPC.UCL.PR.30
Issue: 1.0
Date: 11/07/2018
Page: 40
Figure 24: Map of range_ice_20_plrm_ku over Greenland and % Gridded Parameter Failure

Sentinel-3 MPC
S3-A Land and Sea Ice Cyclic Performance Report
Cycle No. 30
Ref.: S3MPC.UCL.PR.30
Issue: 1.0
Date: 11/07/2018
Page: 41
6.9 20Hz Ku Band PLRM Sigma0 (sig0_ice_20_plrm_ku)
Backscatter sigma0 derived from the 20Hz Ku PLRM waveforms are shown below.

Sentinel-3 MPC
S3-A Land and Sea Ice Cyclic Performance Report
Cycle No. 30
Ref.: S3MPC.UCL.PR.30
Issue: 1.0
Date: 11/07/2018
Page: 42
Figure 25: Maps of 20Hz Ku Band PLRM Sigma0 (sig0_ice_20_plrm_ku)

Sentinel-3 MPC
S3-A Land and Sea Ice Cyclic Performance Report
Cycle No. 30
Ref.: S3MPC.UCL.PR.30
Issue: 1.0
Date: 11/07/2018
Page: 43
6.10 20Hz Ku Band Surface Class (surf_class_20_ku)
The 20Hz Ku surface classification parameter is derived from MODIS and GlobCover data. Users of the
data requiring high resolution ice sheet glacier grounding line and calving front locations should consider
applying their own surface type masks.

Sentinel-3 MPC
S3-A Land and Sea Ice Cyclic Performance Report
Cycle No. 30
Ref.: S3MPC.UCL.PR.30
Issue: 1.0
Date: 11/07/2018
Page: 44
Figure 26: Maps of 20Hz Ku Band Surface Class (surf_class_20_ku)

Sentinel-3 MPC
S3-A Land and Sea Ice Cyclic Performance Report
Cycle No. 30
Ref.: S3MPC.UCL.PR.30
Issue: 1.0
Date: 11/07/2018
Page: 45
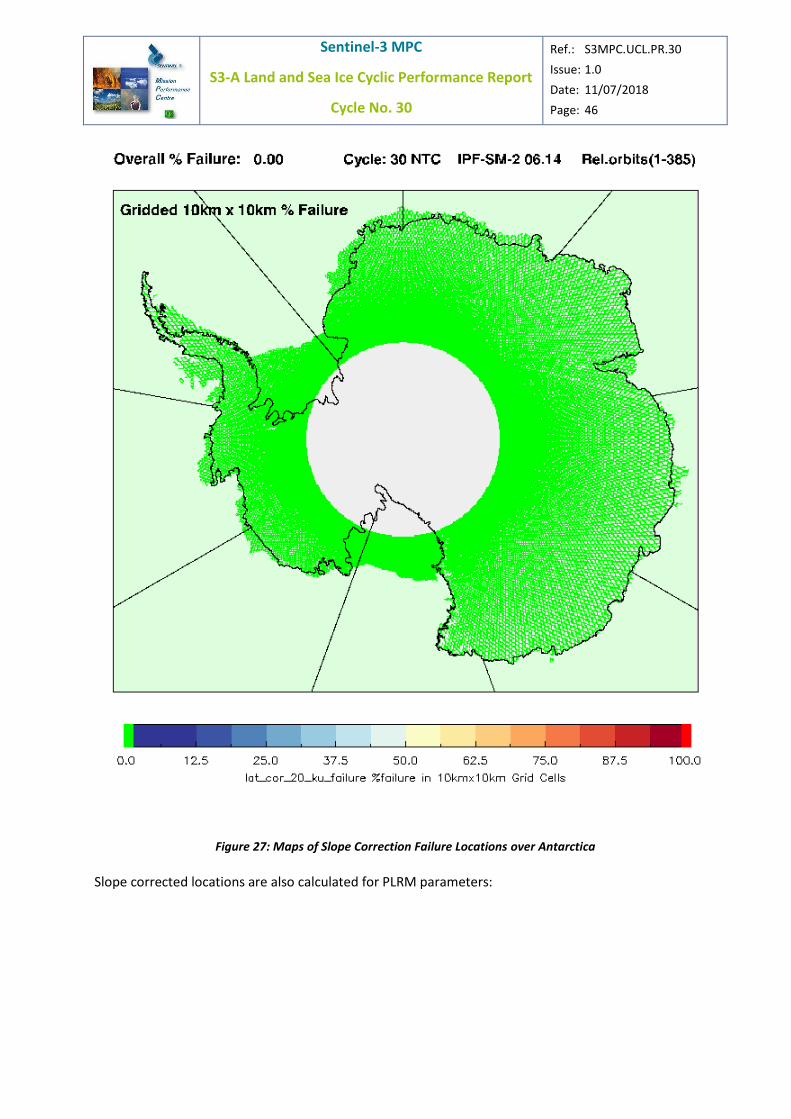
7 Slope Correction
A slope correction is applied to 20Hz Ku band elevation over ice sheets to relocate the SAR echo to the
point of closest approach across track. The slope corrected locations are stored in parameters
lat_cor_20_ku, lon_cor_20_ku. Note that an error in the slope correction was present in all IPF versions
<= 6.10. This was corrected in the current IPF version 6.12.
Maps of where the slope correction is not calculated for cycle 30 are shown below. In this version of the
IPF there are unexpectedly zero failures indicated for slope correction failure. This will be corrected in
the next IPF version.
Sentinel-3 MPC
S3-A Land and Sea Ice Cyclic Performance Report
Cycle No. 30
Ref.: S3MPC.UCL.PR.30
Issue: 1.0
Date: 11/07/2018
Page: 46
Figure 27: Maps of Slope Correction Failure Locations over Antarctica
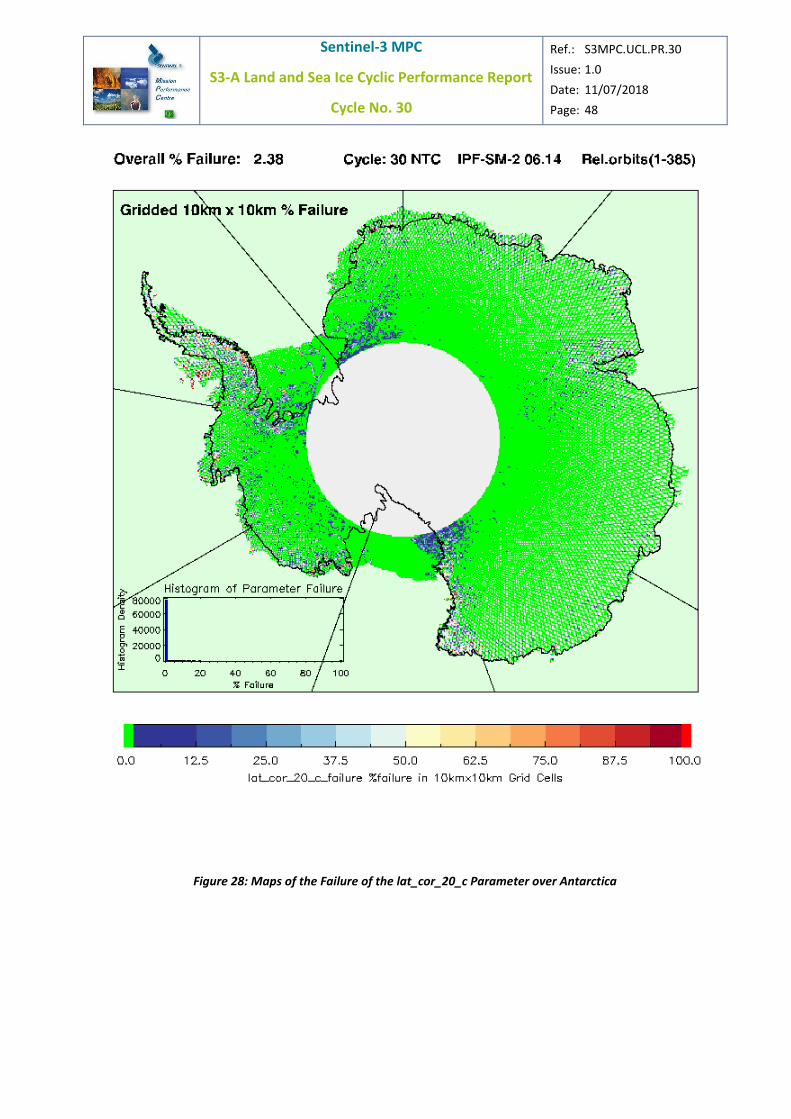
Slope corrected locations are also calculated for PLRM parameters:

Sentinel-3 MPC
S3-A Land and Sea Ice Cyclic Performance Report
Cycle No. 30
Ref.: S3MPC.UCL.PR.30
Issue: 1.0
Date: 11/07/2018
Page: 47
Sentinel-3 MPC
S3-A Land and Sea Ice Cyclic Performance Report
Cycle No. 30
Ref.: S3MPC.UCL.PR.30
Issue: 1.0
Date: 11/07/2018
Page: 48
Figure 28: Maps of the Failure of the lat_cor_20_c Parameter over Antarctica
Sentinel-3 MPC
S3-A Land and Sea Ice Cyclic Performance Report
Cycle No. 30
Ref.: S3MPC.UCL.PR.30
Issue: 1.0
Date: 11/07/2018
Page: 49
8 Geophysical Parameter Monitoring for Sea Ice
This section shows results and analysis of the primary L2 NTC parameters relating to sea ice in cycle 30.
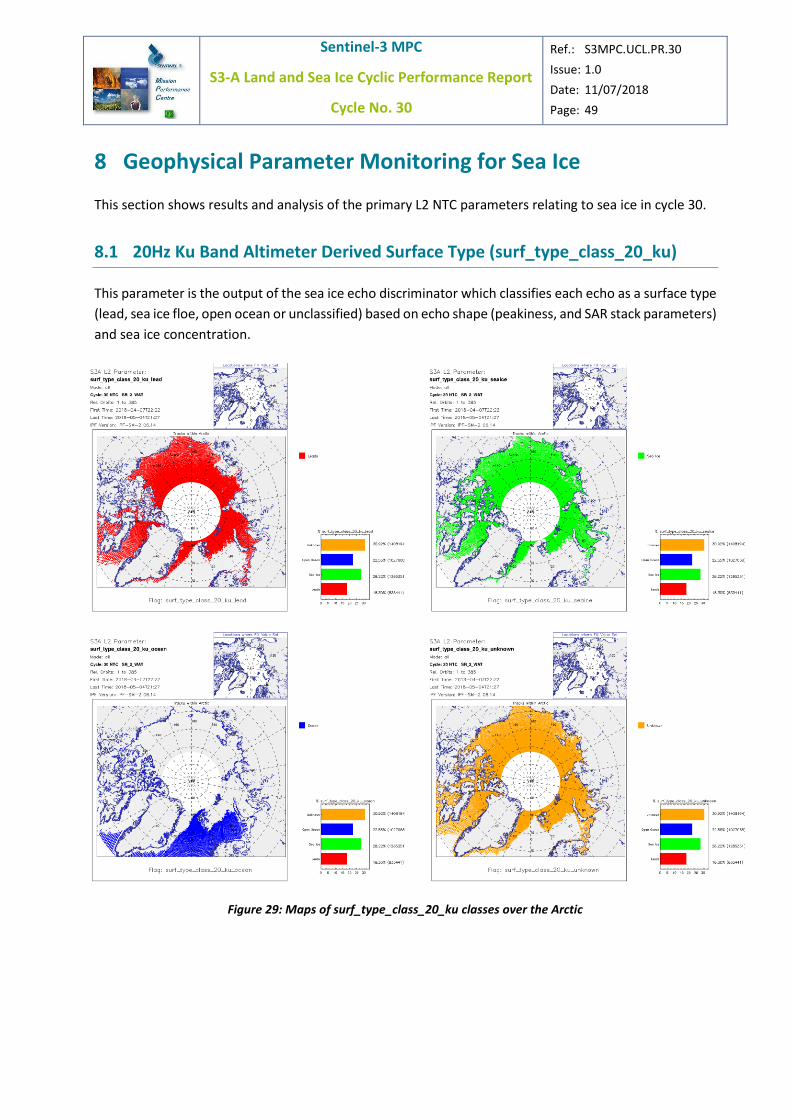
8.1 20Hz Ku Band Altimeter Derived Surface Type (surf_type_class_20_ku)
This parameter is the output of the sea ice echo discriminator which classifies each echo as a surface type
(lead, sea ice floe, open ocean or unclassified) based on echo shape (peakiness, and SAR stack parameters)
and sea ice concentration.
Figure 29: Maps of surf_type_class_20_ku classes over the Arctic

Sentinel-3 MPC
S3-A Land and Sea Ice Cyclic Performance Report
Cycle No. 30
Ref.: S3MPC.UCL.PR.30
Issue: 1.0
Date: 11/07/2018
Page: 50
Figure 30: Maps of surf_type_class_20_ku classes over the Antarctic

Sentinel-3 MPC
S3-A Land and Sea Ice Cyclic Performance Report
Cycle No. 30
Ref.: S3MPC.UCL.PR.30
Issue: 1.0
Date: 11/07/2018
Page: 51
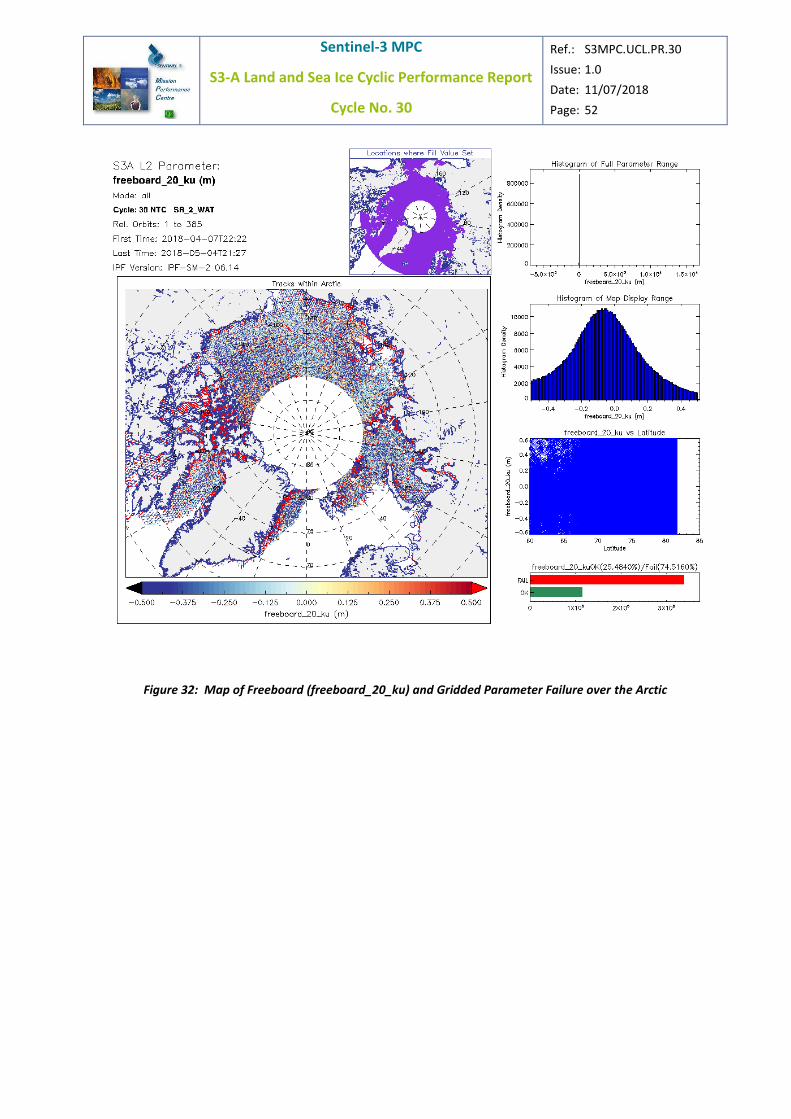
8.2 20Hz Ku band Freeboard ( freeboard_20_ku)
The histogram of freeboard results from this cycle show a greater proportion of negative freeboard values
and a wider spread of freeboard than would be expected. Although negative freeboard is possible due to
snow loading, this spread of values is likely to be erroneous. This is most likely to due to
• the performance of the diffuse echo floe retracker in this version of the IPF, resulting in lower
than expected sea ice elevation and higher than expected retracker failure.
• an issue with incorrect filtering of sea ice lead returns resulting in higher than expected retracker
failure.
• an issue with filtering of SSHA outliers.
• a possible unresolved sea ice lead and floe retracker bias.
These issues will be corrected during 2018 in a future version of the IPF.
Figure 31: Map of Freeboard (freeboard_20_ku) and Gridded Parameter Failure over Antarctica
Sentinel-3 MPC
S3-A Land and Sea Ice Cyclic Performance Report
Cycle No. 30
Ref.: S3MPC.UCL.PR.30
Issue: 1.0
Date: 11/07/2018
Page: 52
Figure 32: Map of Freeboard (freeboard_20_ku) and Gridded Parameter Failure over the Arctic

Sentinel-3 MPC
S3-A Land and Sea Ice Cyclic Performance Report
Cycle No. 30
Ref.: S3MPC.UCL.PR.30
Issue: 1.0
Date: 11/07/2018
Page: 53
8.3 20Hz Ku Band Interpolated Sea Surface Height Anomaly
(int_sea_ice_ssha_20_ku)
This parameter is the sea surface height with respect to the mean sea surface interpolated between leads
in the sea ice (ie represents the SSHA underneath the sea ice floes). In this version of the IPF there are
anomalously large values of interpolated SSHA near the coastline indicating that the interpolation is
contaminated by land elevations. This will be corrected during 2018 in a future version of the IPF.

Sentinel-3 MPC
S3-A Land and Sea Ice Cyclic Performance Report
Cycle No. 30
Ref.: S3MPC.UCL.PR.30
Issue: 1.0
Date: 11/07/2018
Page: 54
Figure 33: Map of Interpolated Sea Ice SSHA (int_sea_ice_ssha_20_ku) and Gridded Parameter Failure over
Antarctica

Sentinel-3 MPC
S3-A Land and Sea Ice Cyclic Performance Report
Cycle No. 30
Ref.: S3MPC.UCL.PR.30
Issue: 1.0
Date: 11/07/2018
Page: 55
Figure 34: Map of Interpolated Sea Ice SSHA (int_sea_ice_ssha_20_ku) and Gridded Parameter Failure over the
Arctic
Sentinel-3 MPC
S3-A Land and Sea Ice Cyclic Performance Report
Cycle No. 30
Ref.: S3MPC.UCL.PR.30
Issue: 1.0
Date: 11/07/2018
Page: 56
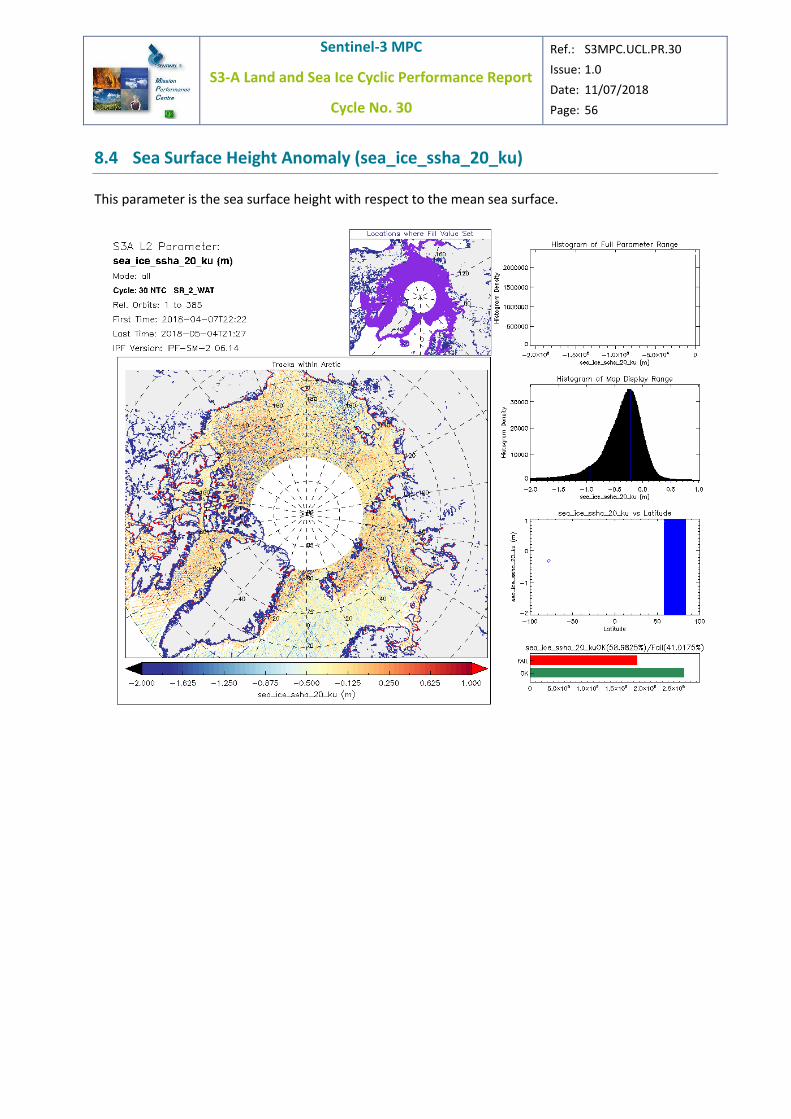
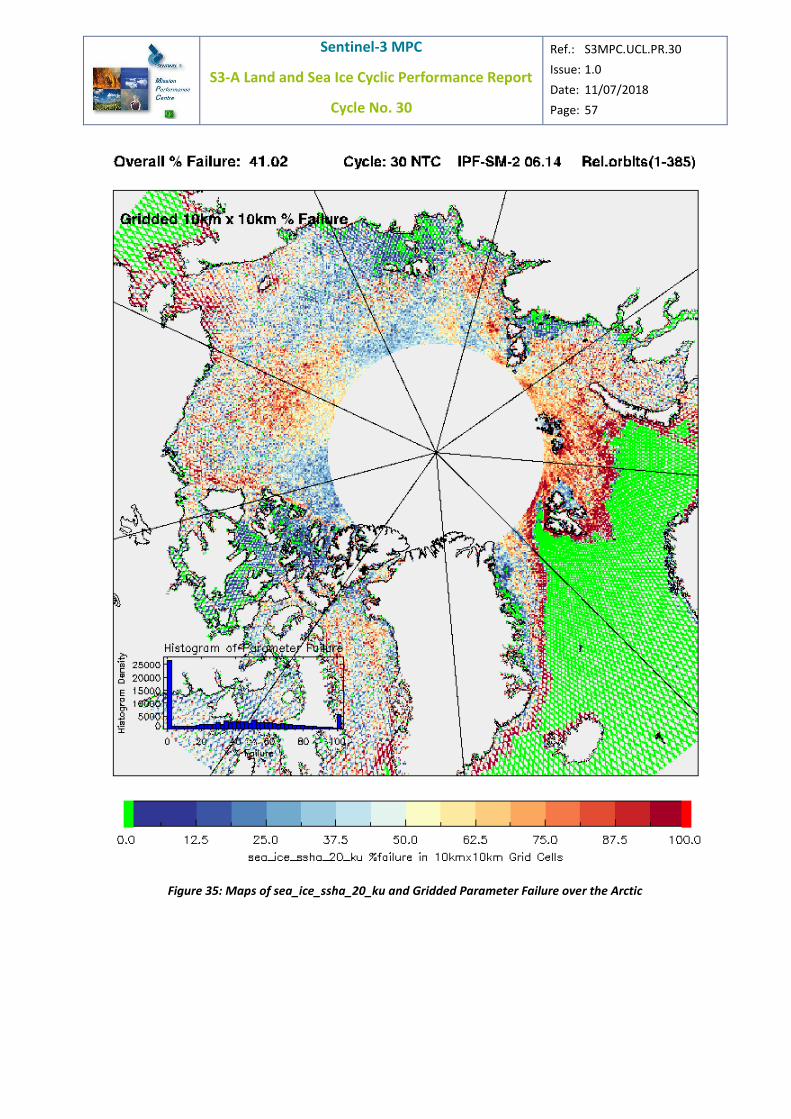
8.4 Sea Surface Height Anomaly (sea_ice_ssha_20_ku)
This parameter is the sea surface height with respect to the mean sea surface.
Sentinel-3 MPC
S3-A Land and Sea Ice Cyclic Performance Report
Cycle No. 30
Ref.: S3MPC.UCL.PR.30
Issue: 1.0
Date: 11/07/2018
Page: 57
Figure 35: Maps of sea_ice_ssha_20_ku and Gridded Parameter Failure over the Arctic

Sentinel-3 MPC
S3-A Land and Sea Ice Cyclic Performance Report
Cycle No. 30
Ref.: S3MPC.UCL.PR.30
Issue: 1.0
Date: 11/07/2018
Page: 58

Sentinel-3 MPC
S3-A Land and Sea Ice Cyclic Performance Report
Cycle No. 30
Ref.: S3MPC.UCL.PR.30
Issue: 1.0
Date: 11/07/2018
Page: 59
Figure 36: Maps of sea_ice_ssha_20_ku and Gridded Parameter Failure over the Antarctic
Sentinel-3 MPC
S3-A Land and Sea Ice Cyclic Performance Report
Cycle No. 30
Ref.: S3MPC.UCL.PR.30
Issue: 1.0
Date: 11/07/2018
Page: 60
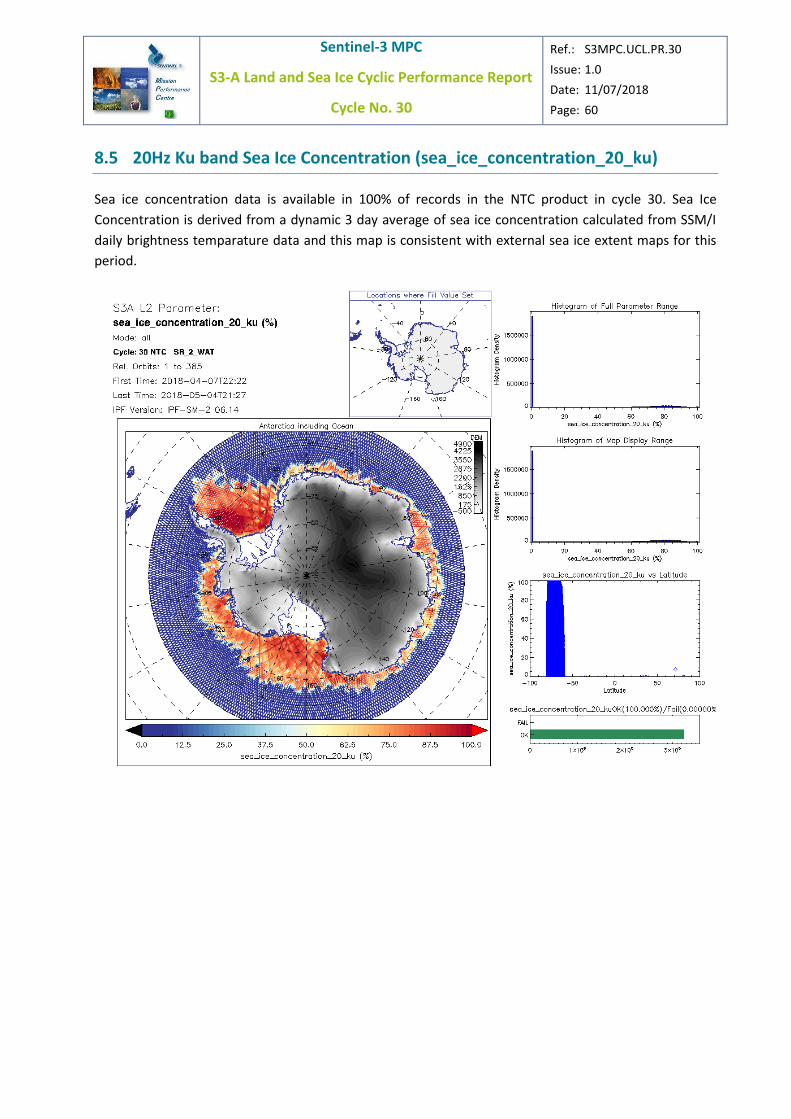
8.5 20Hz Ku band Sea Ice Concentration (sea_ice_concentration_20_ku)
Sea ice concentration data is available in 100% of records in the NTC product in cycle 30. Sea Ice
Concentration is derived from a dynamic 3 day average of sea ice concentration calculated from SSM/I
daily brightness temparature data and this map is consistent with external sea ice extent maps for this
period.

Sentinel-3 MPC
S3-A Land and Sea Ice Cyclic Performance Report
Cycle No. 30
Ref.: S3MPC.UCL.PR.30
Issue: 1.0
Date: 11/07/2018
Page: 61
Figure 37: Maps of 20Hz Ku band Sea Ice Concentration (sea_ice_concentration_20_ku) over the Antarctic Ocean

Sentinel-3 MPC
S3-A Land and Sea Ice Cyclic Performance Report
Cycle No. 30
Ref.: S3MPC.UCL.PR.30
Issue: 1.0
Date: 11/07/2018
Page: 62
Figure 38: Maps of 20Hz Ku band Sea Ice Concentration (sea_ice_concentration_20_ku) over the Arctic

Sentinel-3 MPC
S3-A Land and Sea Ice Cyclic Performance Report
Cycle No. 30
Ref.: S3MPC.UCL.PR.30
Issue: 1.0
Date: 11/07/2018
Page: 63
8.6 20Hz Ku band Peakiness (peakiness_2_20_ku)
Waveform shape peakiness is a primary means of discriminating between sea ice floes and leads. Specular
returns over leads have high peakiness values (> 23) and diffuse echoes over sea ice floes and open ocean
have a less peaky shape with peakiness values (< 11).
Figure 39: Maps of 20Hz Ku band Peakiness (peakiness_2_20_ku) over the Antarctic

Sentinel-3 MPC
S3-A Land and Sea Ice Cyclic Performance Report
Cycle No. 30
Ref.: S3MPC.UCL.PR.30
Issue: 1.0
Date: 11/07/2018
Page: 64
Figure 40: Maps of 20Hz Ku band Peakiness (peakiness_2_20_ku) over the Arctic

Sentinel-3 MPC
S3-A Land and Sea Ice Cyclic Performance Report
Cycle No. 30
Ref.: S3MPC.UCL.PR.30
Issue: 1.0
Date: 11/07/2018
Page: 65
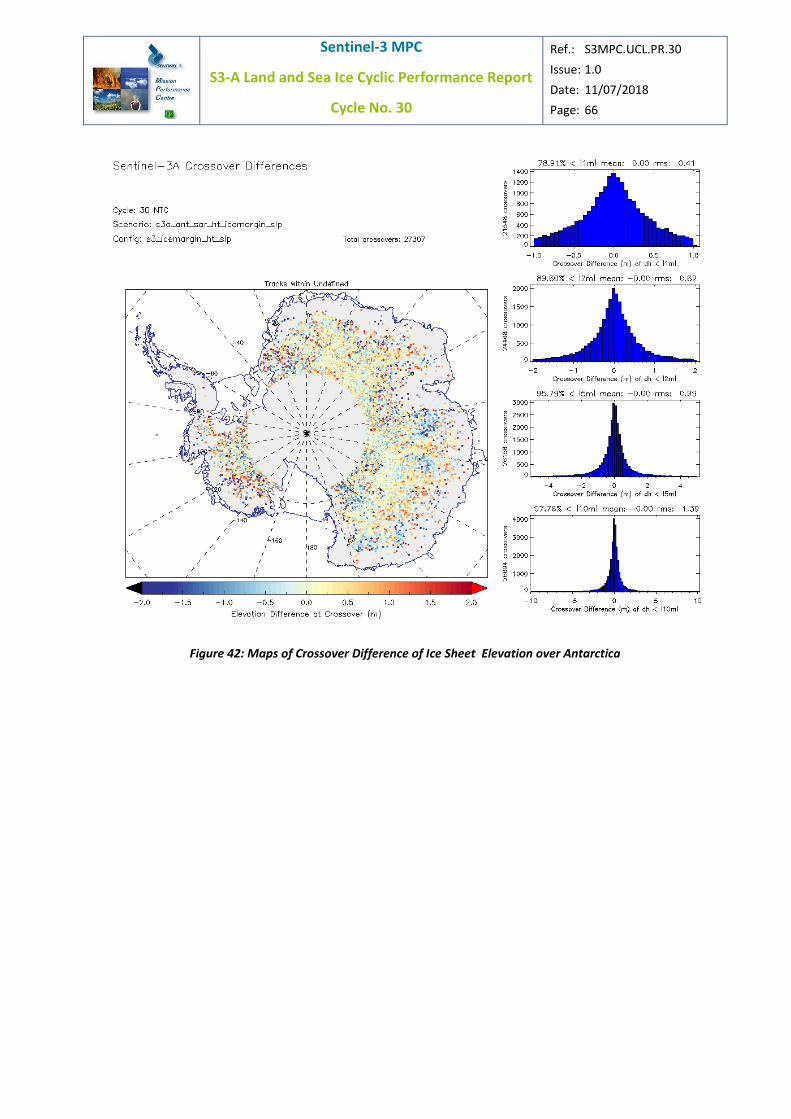
9 Crossover Analysis
Measuring the elevation residual at orbit crossover points is a primary method of assessing the
performance of the altimeter and the processing chain. Over time intervals where there is no expected
change in the surface elevation, the elevation difference at a crossover provides a measure of altimeter
and chain performance, height error and antenna polarity issues.
The crossover difference of the elevation from both ice sheet retrackers shows a mean of 0.0m and an
rms difference of 0.4m+/- 0.02 which is in line with previous missions. There are a greater number of
crossovers from the OCOG retracker due to its lower failure rate.
Figure 41: Maps of Crossover Difference of OCOG Elevation over Antarctica
Sentinel-3 MPC
S3-A Land and Sea Ice Cyclic Performance Report
Cycle No. 30
Ref.: S3MPC.UCL.PR.30
Issue: 1.0
Date: 11/07/2018
Page: 66
Figure 42: Maps of Crossover Difference of Ice Sheet Elevation over Antarctica

Sentinel-3 MPC
S3-A Land and Sea Ice Cyclic Performance Report
Cycle No. 30
Ref.: S3MPC.UCL.PR.30
Issue: 1.0
Date: 11/07/2018
Page: 67
10 Events and Processing Baseline Changes
List of all IPF processing changes and events effecting land and sea ice parameters in this cycle.
The product baseline for this cycle is PB 2.33.
Product
Baseline
L2 IPF Operational
Since
Land Ice/
Sea Ice
Change Description
PB 2.33 6.14 04/04/2018
L Fixed: PFS and Product Map description are wrong for
elevation_ocog_20_ku and elevation_ice_sheet_20_ku (SIIIMPC-
2427)
L Fixed : the field "elevation_ocog_20_ku" is always set to Fill Value in
LRM mode (SIIIMPC-2477)
S Fixed: the field "ssha_20_ku" is always set to Fill Value in LRM mode
L Fixed : elevation_ocog_20_ku field set to NaN on
standard_measurement.nc only (SIIIMPC-2426)
PB 2.27 6.12 12/01/2018
L Fixed slope model anomaly (SIIIMPC-2074)
L Added new OCOG elevation parameter (SIIIMPC-2299)
L Noise power anomaly fixed (SIIIMPC-2076)
S Wrong value for sea ice range in L2 STM products (SIIIMPC-2067)
S When GIM iono is absent, a 3.27m bias appears in SSHA (SIIIMPC-
2271)
PB 2.24 6.10 13/12/2017
L New L2 Parameter: waveform_qual_ice_20_ku
A flag related to the quality of the waveforms over land ice. This is of
interest mainly over land ice to discard data that have corrupted
waveforms.
L Anomaly relating to large negative elevation values present around
ice shelves fixed.
L/S New Parameters: Three additional parameters to facilitate the
connection between the 1 Hz and 20 Hz fields
short index_1hz_meas_20_ku(time_20_ku);
int index_first_20hz_meas_01_ku(time_01);
short num_20hz_meas_01_ku(time_01);
S Implementation of a new Mean Sea Surface model for sea ice SSHA
processing: DTU15 models.
The DTU15 has been selected due to the extended coverage that
includes values over some of the large lakes and a small region in the
Sentinel-3 MPC
S3-A Land and Sea Ice Cyclic Performance Report
Cycle No. 30
Ref.: S3MPC.UCL.PR.30
Issue: 1.0
Date: 11/07/2018
Page: 68
Arctic Ocean whereas the CNES-CLS15 does not provide any value.
The use of the DTU15 Mean Sea Surface model in sea_ice_ssha
parameters because this model performs better over the Arctic
Ocean.
S Implementation of the FES2014 model in replacement of the FES2004
model, for the computation of the solution 2 tide heights.
S the availability of the GIM ionospheric correction in STC products. The
systematic coverage now available for this correction allows
retrieving the expected values of the sea_ice_ssha parameters.
S the evolution of the sea ice classification (Discrimination) parameter
(surf_type_class_20_ku).
L the increase of the coverage of the outputs of the ice sheet retracker
by extending the SAR ice margin retrackers fit window.
Sentinel-3 MPC
S3-A Land and Sea Ice Cyclic Performance Report
Cycle No. 30
Ref.: S3MPC.UCL.PR.30
Issue: 1.0
Date: 11/07/2018
Page: 69
11 Conclusions
For Level-2 NTC Land products over polar ice sheets there is good data quality using the OCOG
elevation parameter up until approximately 50km from the margins.
An issue at L1b resulting in uncentered waveforms affects this cycle, resulting in a lower density
of measurements over such areas of high slope and a reduction in the quality of the ice sheet
elevation parameter. This will be corrected in a future IPF version. Users are recommended to
use the waveform quality flag to filter OCOG elevation measurements over ice sheets.
For Level-2 NTC Marine products, the sea ice freeboard and surface discrimination parameters
requires further tuning and we recommend that they are not used for this product baseline.

Sentinel-3 MPC
S3-A Land and Sea Ice Cyclic Performance Report
Cycle No. 30
Ref.: S3MPC.UCL.PR.30
Issue: 1.0
Date: 11/07/2018
Page: 70
12 Appendix A
Other reports related to the STM mission are:
❖ S3-A SRAL Cyclic Performance Report, Cycle No. 30 (ref. S3MPC.ISR.PR.04-030)
❖ S3-A MWR Cyclic Performance Report, Cycle No. 30 (ref. S3MPC.CLS.PR.05-030)
❖ S3-A Ocean Validation Cyclic Performance Report, Cycle No. 30 (ref. S3MPC.CLS.PR.06-030)
❖ S3-A Land and Sea Ice Cyclic Performance Report, Cycle No. 30 (ref. S3MPC.UCL.PR.08-030)
All Cyclic Performance Reports are available on MPC pages in Sentinel Online website, at:
https://sentinel.esa.int
End of document