Embed Size (px)
Citation preview

Small Business Administration National Women’s Business Council
Study of Women-Owned & Led Businesses An Overview of the Data in NWBC’s Special Tabulations
June 18, 2007
Order Number: SBAHQ06F0408
Prepared by
The statements, findings, conclusions, and recommendations found in this study are those of the authors and do not necessarily reflect the views of the National Women’s Business Council, the United States Small Business Administration, or the United States Government.
th
1220 19 Street NW Suite 502
Washington DC 20036 202-223-8877

Study of Women-Owned & Led Businesses
An Overview of the Data in NWBC’s Special Tabulations
TABLE OF CONTENTS
TABLE OF CHARTS………………………………………………………………. i
I. INTRODUCTION……………………………………………………………….. 1
II. HIGHLIGHTS………………………………………………………………....... 2
III. METHODOLOGY…………………………………………………………… 4 Data Description……………………………………………………………… 4 Data Definitions………………………………………………………………. 5 Groupings……………………………………………………………………... 6 Selections……………………………………………………………………… 7 Calculations and Estimates…………………………………………………….. 8 Data Limitations………………………………………………………………. 8
IV. CHARTS………………………………………………………………………… 10A. Distribution Of Women’s Businesses By Geography And Industry Type…. 11 B. Revenues And Revenues Per Firm Of Women’s Businesses By Geography
And Industry Type………………………………………………………... 21 C. Distribution Of Women’s Businesses By Race/Ethnicity, Age, Education,
Customer Type And Revenue……………………………………………... 40 D. Distribution Of Women’s Businesses By Customer Type……………..…... 56 E. Distribution Of Women’s Businesses By Compensation…………………... 67
V. SUMMARY AND CONCLUSIONS………………………………………….... 79
VII. APPENDICES……………………………………………………………........ 81Appendix A– Example of Estimation of Non-Disclosed Data………………... 82 Appendix B– Example of data limitations due to lack of precision in reporting of Women-Owned & Led firms……………………………………………….. 84 Appendix C – Data Tables…………………………………………………….. 86 Appendix D – NAICS Codes………………………………………………….. 113
Order Number: SBAHQ06F0408 April 12, 2007

Study of Women-Owned & Led Businesses
An Overview of the Data in NWBC’s Special Tabulations
i Order Number: SBAHQ06F0408 May 7, 2007
Firm Distribution
TABLE OF CHARTS
Chart 1: Overview of Women’s Businesses
Chart A1: Number of Firms – All Women's Businesses by Region Chart A2: Number of Firms – All Women's Businesses in the Northeast Chart A3: Number of Firms – All Women's Businesses in the South Chart A4: Number of Firms – All Women's Businesses in the Midwest Chart A5: Number of Firms – All Women's Businesses in the West Chart A6: Number of Firms – All Women’s Businesses by Industry Chart A7: Number of Firms – Employer Firms by Industry Chart A8: Number of Firms – Non-Employer Firms by Industry
Receipts
Chart B1: Receipts – All Women’s Businesses by Region Chart B2: Receipts – All Women’s Businesses in the Northeast Chart B3: Receipts – All Women’s Businesses in the South Chart B4: Receipts – All Women’s Businesses in the Midwest Chart B5: Receipts – All Women’s Businesses in the West Chart B6: Receipts per Firm – All Women’s Businesses by Region Chart B7: Receipts per Firm – All Women’s Businesses in the Northeast Chart B8: Receipts per Firm – All Women’s Businesses in the South Chart B9: Receipts per Firm – All Women’s Businesses in the Midwest Chart B10: Receipts per Firm – All Women’s Businesses in the West Chart B11: Receipts – All Women’s Businesses by Industry Chart B12: Receipts – Employer Firms by Industry Chart B13: Receipts – Non-Employer Firms by Industry Chart B14: Receipts per Firm – All Women’s Businesses by Industry Chart B15: Receipts per Firm – Employer Firms by Industry Chart B16: Receipts per Firm – Non-Employer Firms by Industry
Demographics
Chart C1: Demographics – Women-Led, Women-Owned & Led, and Women-Owned By Race/Ethnicity
Chart C2: Demographics – Women-Led, Women-Owned & Led, and Women-Owned

Study of Women-Owned & Led Businesses
An Overview of the Data in NWBC’s Special Tabulations
i Order Number: SBAHQ06F0408 May 7, 2007
By Race/Ethnicity (Percent) Chart C3: Demographics – Distribution of WOWL Businesses by Age Group Chart C4: Demographics – Distribution of WOWL Businesses by Age Group (Percent) Chart C5: Demographics – Distribution of WOWL Firms by Education Chart C6: Demographics – Distribution of WOWL Firms by Education (Percent) Chart C7: Demographics – Percent of Firms by Race/Ethnicity by Age Chart C8: Demographics – Education by Race/Ethnicity Chart C9: Demographics – Firms by Education by Age Chart C10: Demographics – Receipts by Race/Ethnicity Chart C11: Demographics – Receipts per Firm by Race/Ethnicity Chart C12: Demographics – Receipts for Employer Firms by Race/Ethnicity Chart C13: Demographics – Receipts for Non-Employer Firms by Race/Ethnicity Chart C14: Demographics – Receipts per Firm for Employer Firms by Race/Ethnicity Chart C15: Demographics – Receipts per Firm for Non-Employer Firms by Race/Ethnicity
Customer Type
Chart D1: Customer Type – Distribution of Firms by Customer Type Chart D2: Customer Type – Firms by Customer Type (Percent) Chart D3: Customer Type – Firms by Race/Ethnicity by Customer Type (Percent)
Compensation
Chart E1: Average Compensation – Employer Firms in the Northeast Chart E2: Average Compensation – Employer Firms in the Northeast – Differences from
National Average Chart E3: Average Compensation – Employer Firms in the Midwest Chart E4: Average Compensation – Employer Firms in the Midwest – Differences from
National Average Chart E5: Average Compensation – Employer Firms in the South Chart E6: Average Compensation – Employer Firms in the South – Differences from
National Average Chart E7: Average Compensation – Employer Firms in the West Chart E8: Average Compensation – Employer Firms in the West – Differences from
National Average Chart E9: Average Compensation – Employer Firms by Industry Chart E10: Average Compensation – Employer Firms by Industry – Differences from
National Average

Study of Women-Owned & Led Businesses
An Overview of the Data in NWBC’s Special Tabulations
1 Order Number: SBAHQ06F0408 May 7, 2007
I. INTRODUCTION
The National Women’s Business Council (NWBC) awarded Concentrance Consulting Group, Inc. (Concentrance) a contract to research developments in women’s business issues based on the data NWBC received from the U.S. Census Bureau. This report addresses the requirement to perform a scan of the Special Tabulations of data on women’s businesses and to identify specific areas of interest for further research.
The Special Tabulations that the Census Bureau developed for NWBC were derived from the “2002 Survey of Business Owners and Self-Employed Persons” (SBO). In 2006, the Bureau finished its publication of this data, but it published only a portion of the voluminous data it collected. Data that were published included information about businesses that were at least 51% owned by women. Collected, but not published, were data on Women-Led businesses where a woman owned at least as much as any other owner and managed the day-to-day operations of the firms. NWBC believes that Women-Led firms made a substantial contribution to the American economy and that their omission from the data might have understated the total economic impact of women’s businesses.
The data produced by the Census Bureau for the NWBC included both Women-Owned & Led (WOWL) businesses. We included charts that show Women-Owned & Led data separately, as well as the total of the two. WOWL data were greater than those publicly reported by the Census Bureau for Women-Owned businesses.
While the volume of data in the WOWL dataset was smaller than that of the published dataset, it was still quite large and difficult to assimilate without a general overview. In this report we created a general overview by grouping the data by geographic, industry and demographic distribution; receipts; demographics; customer type; and compensation. These categories provided a manageable and meaningful framework through which we could analyze and compare the data on WOWL businesses.
The task of summarizing this data was complicated by the large amount of data that was not reported by the Census Bureau in the WOWL dataset. The reasons for the missing data and our approaches to developing estimations are described in the Methodology section that follows. Also discussed are the limitations of this report and the ratios that we have developed that allowed us to compare different sized entities.
Most of this report is a collection of charts which display the data at a level of summarization that will allow the reader to understand the broad patterns of WOWL businesses. The charts are complemented by comments identifying our observations and patterns.

Study of Women-Owned & Led Businesses An Overview of the Data in NWBC’s Special Tabulations
II. HIGHLIGHTS This report provides an overview of the Special Tabulations developed by the Census Bureau from the 2002 Survey of Business Owners (SBO) for the National Women’s Business Council. The data included number of firms, industries, revenues, compensation, demographics, and customer type for Women-Owned & Led (WOWL) firms. This report incorporated additional SBO data to differentiate Women-Led firms from Women-Owned firms. Values for Women-Owned firms were subtracted from the Special Tabulations WOWL data to calculate the values for Women-Led firms. The following represent highlights of our data analysis. Women-Led businesses made substantial contributions to the US economy. � Women-Led businesses generated a little more than $300 billion dollars in revenues. � Women- Led businesses produced about twice as much in receipts per firm as did
Women-Owned businesses.
The distribution of receipts across industries varied between WOWL firms with paid employees and WOWL firms without paid employees. The distribution across industries also varied between receipts and receipts per firm.
� WOWL employer firms had highest receipts in the wholesale trade, retail trade,
manufacturing, and construction industries. However, WOWL employer firms had the highest receipts per firm in educational services, accommodation and food services, and health care and social services.
� The receipts of WOWL non-employer firms were highest in real estate and rental and
leasing, professional, scientific and technical services, healthcare and social services, and other services. In contrast, receipts per firm for WOWL non-employer firms were highest in construction, wholesale trade, and transportation and warehousing.
Most WOWL firms catered to household consumers and individuals, although variations in the distribution of customer type were evident when comparing demographic groups.
� Almost half (47.9%) of all customers of WOWL firms were designated as household
consumers and individuals. Other important customer types were other businesses and organizations (21.9% of all customers) and all others (15.5% of all customers). The least
2 Order Number: SBAHQ06F0408 May 7, 2007

Study of Women-Owned & Led Businesses An Overview of the Data in NWBC’s Special Tabulations
common customer type was export sales (around 0.9% of all customers). The export sales industry was dominated by Native Hawaiian or Pacific Islander, Asian, and Hispanic or Latina firms.
� Women-Led firms were more likely to be involved in export sales in comparison to
Women-Owned firms. This contrast was most pronounced in the data for Native Hawaiian or Pacific Islander Firms, where export sales comprised 8.7% of customer type for Women- Led firms but only 2.0% of customer type for Women Owned firms.
Receipts of WOWL firms varied between employer and non-employer firms that were Women-Owned & Led, as well as between firms that belonged to different demographic groups.
� WOWL employer firms produced 86% of all WOWL firm revenues, although WOWL non-employer firms were 84% of the total number of firms.
� Asian WOWL firms produced the highest receipts per firm, although White WOWL
firms dominated in numbers of firms (followed by Hispanic or Latina firms and African American firms.)
Compensation per employee varied between Women-Owned firms and Women-Led firms, as well as between different states.
� Women-Owned firms had higher compensation per employee than Women-Led firms. � Overall, women’s firms in states with large urban populations had higher compensation
per employee than states that were more rural.
There was no dominant level of education for women in business.
� The three education groups with high participation rates as business owners were high
school graduates (21.5%), some college but no degree (20.3%), and bachelor’s degree (22%). The groups with the lowest participation rates were those with less than high school degrees (5.0%), technical school degrees (8.8%), and associate degrees (7.1%).
3
Order Number: SBAHQ06F0408 May 7, 2007

Study of Women-Owned & Led Businesses
An Overview of the Data in NWBC’s Special Tabulations
4 Order Number: SBAHQ06F0408 May 7, 2007
III. METHODOLOGY
Data Description
Concentrance used two sources of data in this report. First, we relied on the NWBC Special Tabulations dataset to provide data on the entire population of women’s businesses: both Women-Owned & Led firms. Second, we used the SBO database to acquire data on Women-Owned1 firms. To calculate the values for Women-Led firms, Concentrance subtracted the values for Women-Owned firms from values of WOWL firms, as shown in the formula below.
Women-Led firms = WOWL firms - Women-Owned firms
The firms in each ownership category were separated further into firms with and without paid employees. Concentrance maintained this format because firms with paid employees, employer firms, typically have a greater economic impact on their communities than firms without paid employees, non-employer firms. The SBO database did not report the number and characteristics of non-employer firms. We calculated the values for non-employer firms as the difference between all firms and employer firms. The NWBC Special Tabulations database provided values for non-employer firms. The following chart depicts the distribution of women’s businesses by ownership, leadership and workforce characteristics.
1 The SBO database used the term Female-Owned. For consistency of reference with the NWBC Special Tabulations data, Concentrance employed the term Women-Owned instead.

Study of Women-Owned & Led Businesses
An Overview of the Data in NWBC’s Special Tabulations
5 Order Number: SBAHQ06F0408 May 7, 2007
Thousands
8,000
7,000
6,000
5,000
4,000
3,000
2,000
1,000
0
7,505
6,296
1,211
6,489 5,573
917
1,016 724 294
All Firms Non-Employer Employer Firms Firms
Women-Led Women-Owned Women-Owned & Led
Overview Chart: Distribution Women’s Businesses
Sources: Women-Owned & Led firms: NWBC Special Tabulations, Women-Owned firms: SBO database, Women-Led firms: Concentrance calculation.
Data Definitions
Due to the large amounts of data available, Concentrance grouped data according to certain criteria that were intuitively compelling. Most important of these groups are listed below. The precise definitions for Industry types are provided in the Appendix C.
Customer Type – organized as reported by the Census Bureau Federal Government
State Government Export Sales
Other Businesses/Organizations (business to business) Household Consumers/Individuals (business to consumer)
All others Item not reported
Industry type – organized by NAICS code Agriculture, Forestry, Fishing and Hunting

Study of Women-Owned & Led Businesses
An Overview of the Data in NWBC’s Special Tabulations
6 Order Number: SBAHQ06F0408 May 7, 2007
Mining Utilities Construction Manufacturing Wholesale Trade Retail Trade Transportation and Warehousing Information Finance and Insurance Real Estate and Rental and Leasing Professional, Scientific, and Technical Services Management of Companies and Enterprises Administrative and Support and Waste Management and Remediation Services Educational Services Health Care and Social Assistance Arts, Entertainment, and Recreation Accommodation and Food Services Other Services (except Public Administration)
Geographic Regions- organized according to U.S. Census Bureau Regions and State divisions
Northeast - Connecticut, Maine, Massachusetts, New Hampshire, New Jersey, New York, Pennsylvania, Rhode Island, Vermont
Midwest - Indiana, Illinois, Iowa, Kansas, Michigan, Minnesota, Missouri, Nebraska, North Dakota, Ohio, South Dakota, Wisconsin
South - Alabama, Arkansas, Delaware, District of Columbia, Florida, Georgia, Kentucky, Louisiana, Maryland, Mississippi, North Carolina, Oklahoma, South Carolina, Tennessee, Texas, Virginia, West Virginia
West - Arizona, Alaska, California, Colorado, Hawaii, Idaho, Montana, Nevada, New Mexico, Oregon, Utah, Washington, Wyoming
Groupings
Our preliminary study of the data shed light on which categories of data were comprehensive and meaningful, and those which were not. In order to maintain a high level of assessment for the Special Tabulations data, we chose the following categories as the framework for our report:
o Distribution of Women’s Businesses by Geography and Industry Type o Revenues and Revenues Per Firm of Women’s Businesses by Geography and
Industry type o Distribution of Women’s Businesses by Race/Ethnicity, Age, and Education

Study of Women-Owned & Led Businesses
An Overview of the Data in NWBC’s Special Tabulations
7 Order Number: SBAHQ06F0408 May 7, 2007
o Distribution of Women’s Businesses by Customer Type o Distribution of Women’s Businesses by Compensation
Each of these groups is distinguished and substantive in a manner that sets parameters to and provides meaning to the provided data.
We began each of these sections of our report with a general overview of the data within the group – for example, the total number of women’s businesses by customer type. Within these groups, we presented the data in more specified subgroups – for example, the number of women’s businesses by customer type segmented by racial/ethnic groups.
Selections
As policy is determined by political jurisdiction, Concentrance presented the data geographically by state. We also accumulated the data into the four regions of the country: Northeast, South, Midwest, and West, adding another level of summarization and comparison. We did not present data by Combined Statistical Areas (CSAs) due to very limited data availability. General Census Bureau rules with respect to disclosure were applied to this data. Also, according to those rules there would be broad disclosure of financial information about individual firms if more detailed data were published.
When we presented data on firm receipts by industry, we showed the data for all firms, employer firms, and non-employer firms. However, when showing receipts by region and state, we only showed the data for all firms, based on our observation that such employer/non-employer differences were less distinct across states than across industries.
In addition, Concentrance generally limited its analysis to two variables at a time (e.g. revenues by industry, revenues and race/ethnicity). Although the scope of data allowed for three levels of analysis (e.g., revenues by industry by race/ethnicity), the intent of this report was to lay out a broad picture of WOWL businesses.
The WOWL data included Family-Ownership status of firms. As we examined the data, we discovered that the overwhelming numbers of firms were in fact designated either as Family-Owned or Family-Owned One Owner. Family Ownership is an interesting dimension of WOWL businesses to explore, but we refrained from distinguishing Family Ownership and non-Family Ownership in our report as most WOWL firms were designated Family-Owned firms.

Study of Women-Owned & Led Businesses
An Overview of the Data in NWBC’s Special Tabulations
8 Order Number: SBAHQ06F0408 May 7, 2007
Calculations and Estimates
To create comparative data, Concentrance developed several ratios. The fact that women’s businesses in the state of Florida had more revenues than those in Idaho was not very informative since the Idaho population was so much smaller. More substantive was the fact that revenues per firm were much greater in Florida than Idaho, indicating a much richer economic environment. Calculating revenues per firm allowed for comparison of economic activity of firms in different industries, geographic areas and racial/ethnic groups. Concentrance also calculated the ratio of annual payroll to the total number of employees for employer firms in different industries and geographic locations. These ratios afforded cross-sectional comparisons and generated an effective index for evaluating economic impact.
We found that the revenues for WOWL firms were often undisclosed. (The reasons for the lack of disclosure are discussed in Data Limitations below.) In those cases, where data was available and reasonable assumptions could be made about the nature of the missing data, Concentrance estimated the values for WOWL firms. This enabled us to provide a more complete description of women’s businesses. For example, when WOWL revenues for one state in a region were undisclosed, we would not have been able to report on the WOWL revenues for the region as a whole. By assuming that the state with the missing data was similar to the other states in the region, we used regional averages to estimate the missing data. Specifically we calculated the average ratio of the disclosed values for WOWL to Women-Owned and then applied that ratio to the disclosed value of Women-Owned firms. This formula yielded an estimate of the value of WOWL firms that is more accurate than assuming that the number of Women-Led firms was zero. An example of an estimation that Concentrance performed is provided in Appendix A.
Where the data showed distributions of firms by the race/ethnicity of the owner, it was instructive to observe the percent distribution by race. However, a small but important number of respondents reported membership in more than one group. As a result, we created percentages based on the total number of races/ethnicities reported; this was greater than the total number of firms in the census.
Data Limitations
Our report was limited by the availability of data from our two primary sources, the SBO dataset and the WOWL dataset. These limitations were largely due to the reporting of the Census Bureau, especially in the case of the WOWL dataset.
Concentrance found that revenues at the state or industry level were withheld to avoid disclosing data of individual companies. Publication of WOWL data implied that values for particular Women-Led businesses could be discerned. Since Women-Led businesses were

Study of Women-Owned & Led Businesses
An Overview of the Data in NWBC’s Special Tabulations
9 Order Number: SBAHQ06F0408 May 7, 2007
the smallest in number among the groups that we studied, it became clear why so many data items were censored. Data were also suppressed when publication standards were not met, such as when the number of firms in a particular category was not statistically important. Non-disclosure of WOWL data prevented a broad review of revenues by CSA, since data for many CSAs were suppressed. Where WOWL data were unavailable, we could not calculate the Women-Led data.
Where we attempted to estimate non-disclosed data, our estimation techniques were limited. First, we could not estimate values if the value of the data to be multiplied by the ratio was zero. Concentrance also could not estimate values if they were self-contradictory. For example, when the estimated number of non-employer firms exceeded the reported number of all firms, we omitted the estimated value.
Finally, WOWL data was only available for a single year, 2002. It was therefore impossible to evaluate how women’s businesses changed over time, or to compare that change to the fluctuation of the economy overall. Also, the observations made for women’s businesses in 2002 might be less indicative of the state of women’s business in 2007.

Study of Women-Owned & Led Businesses
An Overview of the Data in NWBC’s Special Tabulations
10 Order Number: SBAHQ06F0408 May 7, 2007
7,505
6,296
1,211
6,489 5,573
917
1,016 724 294
0
1,000
2,000
3,000
4,000
5,000
6,000
7,000
8,000
Thousands
All Firms Non-Employer Employer Firms Firms
Women-Led Women-Owned Women-Owned & Led
IV. CHARTS
The greatest numbers of women’s businesses are firms with no paid employees, non-employer firms. However, the firms with employees, employer firms, do have an important economic impact, which is evident in our charts examining revenues and revenues per firm.
Chart 1: Overview of Women’s Businesses

Study of Women-Owned & Led Businesses
An Overview of the Data in NWBC’s Special Tabulations
11 Order Number: SBAHQ06F0408 May 7, 2007
IV.A Firm Distribution
In this section, we describe the distribution of women’s businesses by geography and by the industry. In the 2002 Survey of Business Owners, there were 23.0 million respondent firms, 7.5 million of which were owned or led by women.
The majority of women’s businesses were non-employer firms. This type of firm might have been the most common because it might have involved part-time involvement, operation out of the owner’s home, or only provided a source of supplemental income. The distribution of firms across geographic regions was concentrated in states with large urban areas. Women’s businesses also seem to have been concentrated in some industries that are traditionally associated with women, such as retail trade, professional, scientific and technical services, administrative support, and health care and social assistance services (Chart A6).
While only a small number of women’s businesses were led by women (14%), a greater proportion of Women-Led firms had paid employees than Women-Owned firms (29% vs. 14%). Among the four regions, the greatest concentration of women’s businesses was in the South. The greatest numbers of women’s firms in the South were reported in Texas, Florida, Georgia and Virginia (Chart A3). Some of the distribution of women’s firms across industries was surprising. For instance, there were relatively few firms in educational services. At the same time, there was a sizable number of women’s firms in construction, particularly employer firms (Chart A7).
While the distribution of women’s businesses across geographic areas is apparent, it is unclear why women’s businesses were concentrated in certain industries. Further research in this area could contribute to a better knowledge of the choices made by female entrepreneurs. Further study could also provide meaningful consideration as to why Women-Led firms were more likely to have paid employees than Women-Owned firms.

Study of Women-Owned & Led Businesses
An Overview of the Data in NWBC’s Special Tabulations
12 Order Number: SBAHQ06F0408 May 7, 2007
Chart List
Chart A1: Number of Firms – All Women's Businesses by Region
Chart A2: Number of Firms – All Women's Businesses in the Northeast
Chart A3: Number of Firms – All Women's Businesses in the South
Chart A4: Number of Firms – All Women's Businesses in the Midwest
Chart A5: Number of Firms – All Women's Businesses in the West
Chart A6: Number of Firms – All Women’s Businesses by Industry
Chart A7: Number of Firms – Employer Firms by Industry
Chart A8: Number of Firms – Non-Employer Firms by Industry

An Overview of the Data in NWBC’s Special Tabulations
Thousands
0 500 1000 1500 2000 2500
Northeast
Midwest
South
West
Women-Owned Women-Owned & Led Women-Led
Chart A1: Number of Firms – All Women's Businesses by Region
Study of Women-Owned & Led Businesses
13 Order Number: SBAHQ06F0408
May 7, 2007
These data are not adjusted for different levels of population.

Study of Women-Owned & Led Businesses
An Overview of the Data in NWBC’s Special Tabulations
14 Order Number: SBAHQ06F0408 May 7, 2007
Vermont
Rhode Island
Pennsylvania
505New York 545
New Jersey
New Hampshire
Massachusetts
Maine
Connecticut
0 65 130 195 260 Thousands
Women-Owned Women-Owned & Led Women-Led
These data are not adjusted for different levels of population.
Chart A2: Number of Firms – All Women's Businesses in the Northeast
Study of Women-Owned & Led Businesses
An Overview of the Data in NWBC’s Special Tabulations
Order Number: SBAHQ06F0408
May 7, 2007
15
West Virginia
Virginia
Texas
Tennessee
South Carolina
Oklahoma
North Carolina
Mississippi
Maryland
Louisiana
Kentucky
Georgia
Florida
District of Columbia
Delaware
Arkansas
Alabama
470 543
437 500
0 55 110 165 220 Thousands
Women-Owned Women-Owned & Led Women-Led
Chart A3: Number of Firms – All Women's Businesses in the South
These data are not adjusted for different levels of population.

Study of Women-Owned & Led Businesses
An Overview of the Data in NWBC’s Special Tabulations
16 Order Number: SBAHQ06F0408 May 7, 2007
0 55 110 165 220 275 Thousands Women-Owned Women-Owned & Led Women-Led
Wisconsin
South Dakota
Ohio
North Dakota
Nebraska
Missouri
Minnesota
Michigan
Kansas
Iowa
Indiana 285
Illinois 324
These data are not adjusted for different levels of population.
Chart A4: Number of Firms – All Women's Businesses in the Midwest

Utah
Washington
Wyoming
New Mexico
Oregon
Nevada
Montana
Idaho
Hawaii
Arizona
California
Colorado
870 1,022
Alaska
0 25 50 75 100 125 150 175
Thousands
Women-Owned Women-Owned & Led Women-Led
Study of Women-Owned & Led Businesses
An Overview of the Data in NWBC’s Special Tabulations
17 Order Number: SBAHQ06F0408 May 7, 2007
Chart A5: Number of Firms – All Women’s Businesses in the West
These data are not adjusted for different levels of population.

Study of Women-Owned & Led Businesses
An Overview of the Data in NWBC’s Special Tabulations
18 Order Number: SBAHQ06F0408 May 7, 2007
0 200 400 600 800 1000 1200 Thousands Women-Owned Women-Owned & Led Women-Led
Forestry, fishing & hunting, & ag support
Mining
Utilities
Construction
Manufacturing
Wholesale trade
Retail trade
Transportation & warehousing
Information
Finance & insurance
Real estate & rental & leasing
Prof., scientific, & technical services
Mgmt of companies & enterprises
Admin., support, waste mgmt
Educational services
Health care & social assistance
Arts, entertainment, & recreation
Accommodation & food services
Other services (except public admin.)
Industries not classified
Chart A6: Number of Firms – All Women’s Businesses by Industry

Forestry, fishing & hunting, & ag support
Mining
Utilities
Construction
Manufacturing
Wholesale trade
Retail trade
Transportation & warehousing
Information
Finance & insurance
Real estate & rental & leasing
Prof., scientific, & technical services
Mgmt of companies & enterprises *
Admin., support, waste mgmt
Educational services
Health care & social assistance
Arts, entertainment, & recreation
Accommodation & food services
Other services (except public admin.)
Industries not classified*
0 40 80 120 160Thousands
Women-Owned Women-Owned & Led Women-Led
206
* Not reported in the NWBC Special Tabulation.
Study of Women-Owned & Led Businesses
An Overview of the Data in NWBC’s Special Tabulations
19 Order Number: SBAHQ06F0408 May 7, 2007
Chart A7: Number of Firms – Employer Firms by Industry

Forestry, fishing & hunting, & ag support
Mining
Utilities
Construction
Manufacturing
Wholesale trade
Retail trade
Transportation & warehousing
Information
Finance & insurance
Real estate & rental & leasing
Prof., scientific, & technical services
Mgmt of companies & enterprises*
Admin., support, waste mgmt
Educational services
Health care & social assistance
Arts, entertainment, & recreation
Accommodation & food services
Other services (except public admin.)
Industries not classified*
0 200 400 600 800 1000
Women-Owned Women-Owned & Led Women-Led
* Not reported in the NWBC Special Tabulation. The reported number of Women-Owned firms in these industries is zero.
Study of Women-Owned & Led Businesses
An Overview of the Data in NWBC’s Special Tabulations
20 Order Number: SBAHQ06F0408 May 7, 2007
Chart A8: Number of Firms – Non-Employer Firms by Industry

Study of Women-Owned & Led Businesses
An Overview of the Data in NWBC’s Special Tabulations
21 Order Number: SBAHQ06F0408 May 7, 2007
IV.B Receipts
In this section we described the distribution of receipts and receipts per firm of women’s businesses by geography and by industry. We presented the geographic data for all women’s firms without distinguishing employer and non-employer firms. However, we did present the employer and non-employer firms in the charts by industry.
The charts presented in this section can be used to assess the economic impact of women’s businesses. However, as receipts are not profits, the firms with more receipts may or may not be more profitable than those with fewer receipts. The receipts data become meaningful when assessed in the context of the number of firms that generated the receipts. We calculated the ratio for receipts per firm which we included in the charts for this section.
The geographic distribution of receipts data revealed a pattern similar to the numerical distribution of firms: regions with large urban areas and greater concentrations of firms accounted for a greater share of receipts. For example, California’s receipts were much greater than the other states in the West (Chart B5). The geographic distribution of receipts per firm data revealed more subtle differences. If we examine receipts per firm in California (Chart B10), we see that California is still a top performer but has ceded the top spot to Colorado. Some other leaders were New Jersey, District of Columbia, and Wisconsin, where firms generated lower total receipts but higher receipts per firm. In terms of receipts generated by employer firms, there were four strong industries: wholesale trade, retail trade, manufacturing, and construction (Chart B12). However, the receipts of non-employer firms were concentrated in different industries and showed higher volumes of receipts: real estate and rental and leasing, professional, scientific and technical services, healthcare and social services, and other services. Interestingly, non-employer firms showed low volumes of receipts in wholesale trade (Chart B13).
Caution should be taken in reading the charts on receipts per firm. To display differences within each chart the scale was changed, so industry types that appear larger on one chart could be much smaller on another. Because both numbers of firms and total receipts figure into receipts per firm, the relative prominence of different industries changed on each of the charts.
When compared to Women-Owned firms, Women-Led firms had noticeably higher receipts per firm across regions (Chart B6). Women-Led firms are not, however, dominant in receipts per firm across industries; they appeared dominant across industries only in the case of non-employer firms (Chart B16).

Study of Women-Owned & Led Businesses
An Overview of the Data in NWBC’s Special Tabulations
22 Order Number: SBAHQ06F0408 May 7, 2007
It was unclear what factors impacted differences across regions and industries in terms of receipts per firm. More in-depth exploration of Women-Led firms could help to explain their strong performance in non-employer firms.

Study of Women-Owned & Led Businesses
An Overview of the Data in NWBC’s Special Tabulations
23 Order Number: SBAHQ06F0408 May 7, 2007
Chart List
Chart B1: Receipts – All Women’s Businesses by Region
Chart B2: Receipts – All Women’s Businesses in the Northeast
Chart B3: Receipts – All Women’s Businesses in the South
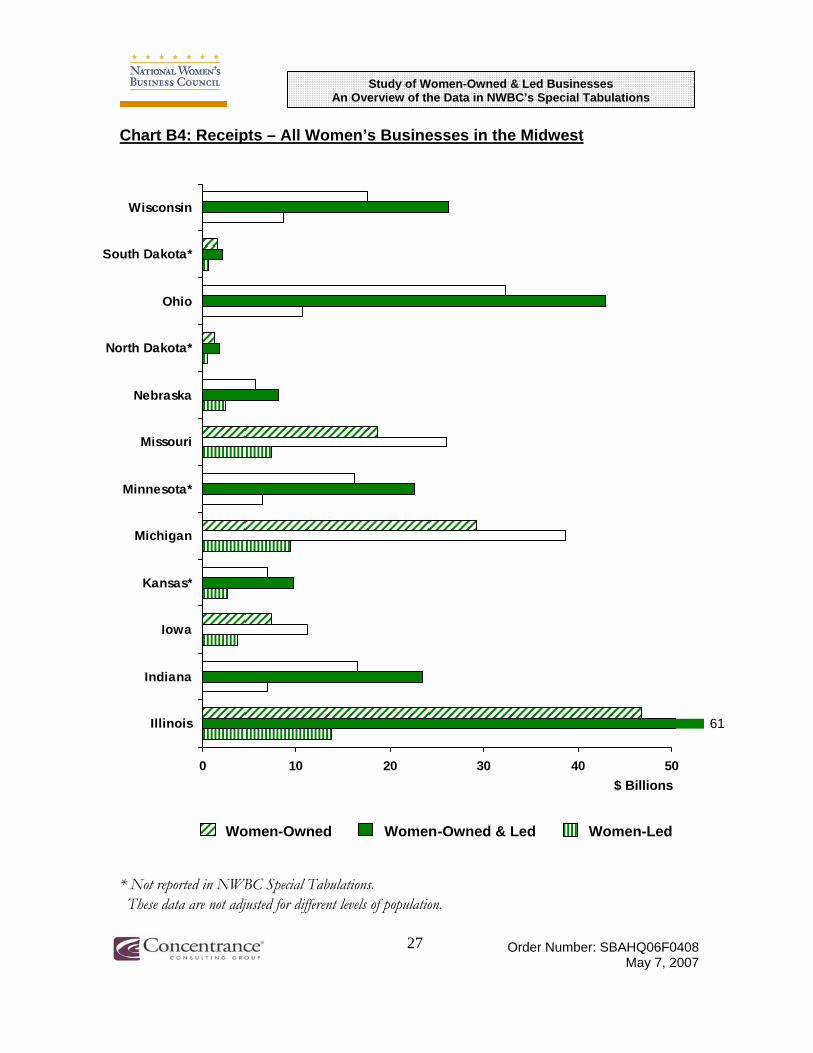
Chart B4: Receipts – All Women’s Businesses in the Midwest
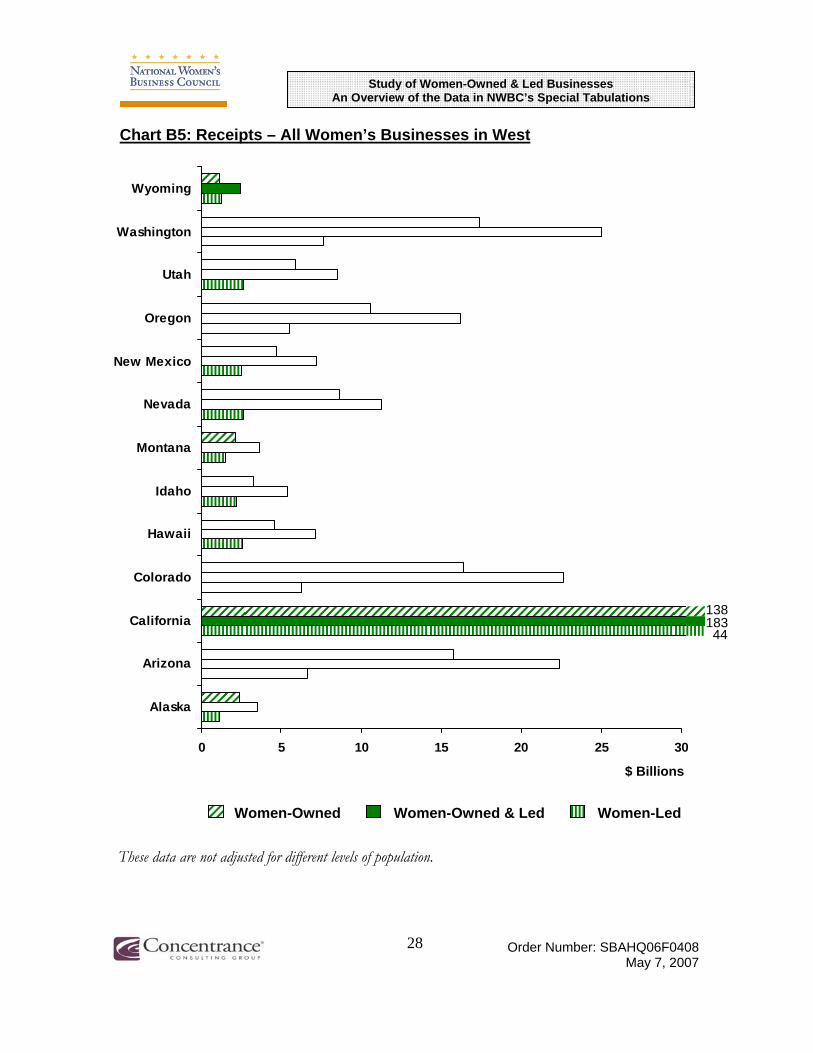
Chart B5: Receipts – All Women’s Businesses in the West
Chart B6: Receipts per Firm – All Women’s Businesses by Region
Chart B7: Receipts per Firm – All Women’s Businesses in the Northeast
Chart B8: Receipts per Firm – All Women’s Businesses in the South
Chart B9: Receipts per Firm – All Women’s Businesses in the Midwest
Chart B10: Receipts per Firm – All Women’s Businesses in the West
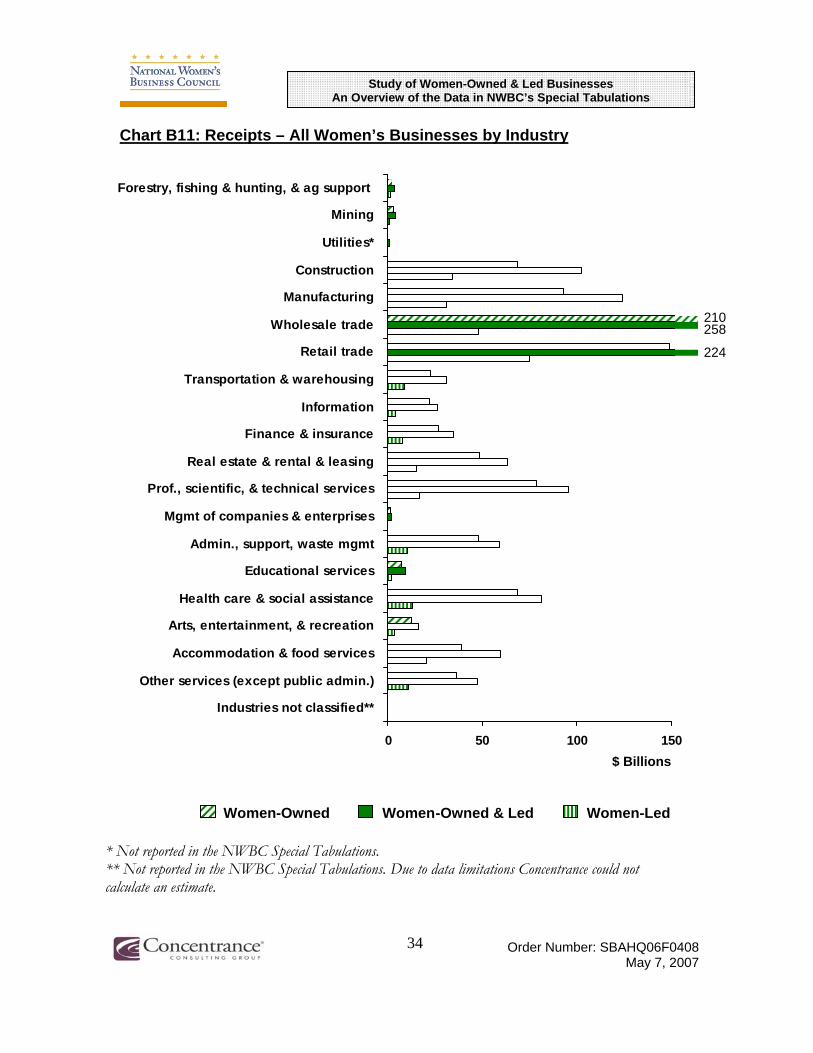
Chart B11: Receipts – All Women’s Businesses by Industry
Chart B12: Receipts – Employer Firms by Industry
Chart B13: Receipts – Non-Employer Firms by Industry
Chart B14: Receipts per Firm – All Women’s Businesses by Industry
Chart B15: Receipts per Firm – Employer Firms by Industry
Chart B16: Receipts per Firm – Non-Employer Firms by Industry

Northeast*
Midwest*
South*
West
0 100 200 300 400
$ Billions
Women-Owned Women-Owned & Led Women-Led
Study of Women-Owned & Led Businesses
An Overview of the Data in NWBC’s Special Tabulations
24 Order Number: SBAHQ06F0408 May 7, 2007
Chart B1: Receipts – All Women’s Businesses by Region
* In NWBC Special Tabulations data was not disclosed for certain states. For instance in the Northeast region, data for New Jersey and Vermont was not disclosed; in the Midwest region data for Kansas, Minnesota, North Dakota and South Dakota was not disclosed; in the South region data for Arkansas, Delaware and the District of Columbia was not disclosed. Data is available for all the states in the West region. Concentrance used estimates of the non-disclosed data to calculate regional totals.
These data are not adjusted for different levels of population.

Vermont*
Rhode Island
Pennsylvania
71 New York 86
New Jersey*
New Hampshire
Massachusetts
Maine
Connecticut
0 10 20 30 40 50
$ Billions
Women-Owned Women-Owned & Led Women-Led
* Not reported in NWBC Special Tabulations.
Study of Women-Owned & Led Businesses
An Overview of the Data in NWBC’s Special Tabulations
25 Order Number: SBAHQ06F0408 May 7, 2007
Chart B2: Receipts – All Women’s Businesses in the Northeast
These data are not adjusted for different levels of population.

West Virginia
Virginia
Texas
Tennessee
South Carolina
Oklahoma
North Carolina
Mississippi
Maryland
Louisiana
Kentucky
Georgia
Florida
District of Columbia*
Delaware*
Arkansas*
Alabama
65 86
61 79
0 10 20 30 40
$ Billions
Women-Owned Women-Owned & Led Women-Led * Not reported in NWBC Special Tabulations.
Study of Women-Owned & Led Businesses
An Overview of the Data in NWBC’s Special Tabulations
26 Order Number: SBAHQ06F0408 May 7, 2007
Chart B3: Receipts – All Women’s Businesses in the South
These data are not adjusted for different levels of population.
Study of Women-Owned & Led Businesses
An Overview of the Data in NWBC’s Special Tabulations
27 Order Number: SBAHQ06F0408 May 7, 2007
Wisconsin
South Dakota*
Ohio
North Dakota*
Nebraska
Missouri
Minnesota*
Michigan
Kansas*
Iowa
Indiana
Illinois
0 10 20 30 40 50$ Billions
Women-Owned Women-Owned & Led Women-Led
61
* Not reported in NWBC Special Tabulations.
Chart B4: Receipts – All Women’s Businesses in the Midwest
These data are not adjusted for different levels of population.
Study of Women-Owned & Led Businesses
An Overview of the Data in NWBC’s Special Tabulations
28 Order Number: SBAHQ06F0408 May 7, 2007
Wyoming
Washington
Utah
Oregon
New Mexico
Nevada
Montana
Idaho
Hawaii
Colorado
California
Arizona
Alaska
138 183 44
0 5 10 15 20 25 30
$ Billions
Women-Owned Women-Owned & Led Women-Led These data are not adjusted for different levels of population.
Chart B5: Receipts – All Women’s Businesses in West
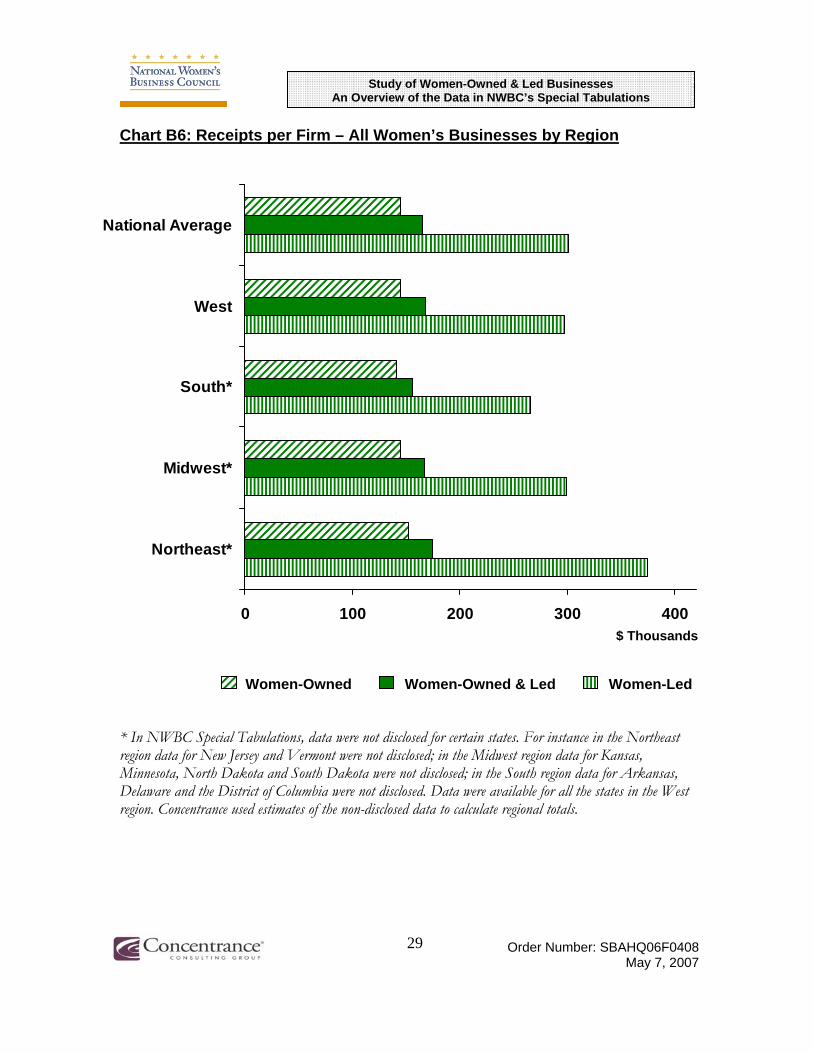
National Average
West
South*
Midwest*
Northeast*
0 100 200 300 400 $ Thousands
Women-Owned Women-Owned & Led Women-Led
Study of Women-Owned & Led Businesses
An Overview of the Data in NWBC’s Special Tabulations
29 Order Number: SBAHQ06F0408 May 7, 2007
Chart B6: Receipts per Firm – All Women’s Businesses by Region
* In NWBC Special Tabulations, data were not disclosed for certain states. For instance in the Northeast region data for New Jersey and Vermont were not disclosed; in the Midwest region data for Kansas, Minnesota, North Dakota and South Dakota were not disclosed; in the South region data for Arkansas, Delaware and the District of Columbia were not disclosed. Data were available for all the states in the West region. Concentrance used estimates of the non-disclosed data to calculate regional totals.

Connecticut
Maine
Massachusetts
New Hampshire
New Jersey*
New York
Pennsylvania
Rhode Island
Vermont*
National Average
0 100 200 300 400 500
$ Thousands
Women-Owned Women-Owned & Led Women-Led
* Not reported in the NWBC Special Tabulations.
Study of Women-Owned & Led Businesses
An Overview of the Data in NWBC’s Special Tabulations
30 Order Number: SBAHQ06F0408 May 7, 2007
Chart B7: Receipts per Firm – All Women’s Businesses in the Northeast

Study of Women-Owned & Led Businesses
An Overview of the Data in NWBC’s Special Tabulations
31 Order Number: SBAHQ06F0408 May 7, 2007
National Average
West Virginia
Virginia
Texas
Tennessee
South Carolina
Oklahoma
North Carolina
Mississippi
Maryland
Louisiana
Kentucky
Georgia
Florida
District of Columbia*
Delaware*
Arkansas*
Alabama
0 65 130 195 260 325
$ Thousands
Women-Owned Women-Owned & Led Women-Led
883
* Not reported in the NWBC Special Tabulations.
Chart B8: Receipts per Firm – All Women’s Businesses in the South

National Average
Wisconsin
South Dakota*
Ohio
North Dakota*
Nebraska
Missouri
Minnesota*
Michigan
Kansas*
Iowa
Indiana
Illinois
0 60 120 180 240 300 360
$ Thousands
Women-Owned Women-Owned & Led Women-Led
* Not reported in the NWBC Special Tabulations.
Study of Women-Owned & Led Businesses
An Overview of the Data in NWBC’s Special Tabulations
32 Order Number: SBAHQ06F0408 May 7, 2007
Chart B9: Receipts per Firm – All Women’s Businesses in the Midwest

Study of Women-Owned & Led Businesses
An Overview of the Data in NWBC’s Special Tabulations
33 Order Number: SBAHQ06F0408 May 7, 2007
Utah
Washington
Wyoming
National Average
New Mexico
Oregon
Nevada
Montana
Idaho
Colorado
Hawaii 415
California
Arizona
Alaska
0 50 100 150 200 250 300 350
$ Thousands
Women-Owned Women-Owned & Led Women-Led
Chart B10: Receipts per Firm – All Women’s Businesses in the West
Study of Women-Owned & Led Businesses
An Overview of the Data in NWBC’s Special Tabulations
34 Order Number: SBAHQ06F0408 May 7, 2007
Forestry, fishing & hunting, & ag support
Mining
Utilities*
Construction
Manufacturing
Wholesale trade
Retail trade
Transportation & warehousing
Information
Finance & insurance
Real estate & rental & leasing
Prof., scientific, & technical services
Mgmt of companies & enterprises
Admin., support, waste mgmt
Educational services
Health care & social assistance
Arts, entertainment, & recreation
Accommodation & food services
Other services (except public admin.)
Industries not classified**
210 258
224
0 50 100 150$ Billions
Women-Owned Women-Owned & Led Women-Led
* Not reported in the NWBC Special Tabulations. ** Not reported in the NWBC Special Tabulations. Due to data limitations Concentrance could not calculate an estimate.
Chart B11: Receipts – All Women’s Businesses by Industry

Study of Women-Owned & Led Businesses
An Overview of the Data in NWBC’s Special Tabulations
35 Order Number: SBAHQ06F0408 May 7, 2007
For estry, fishing & hunting, & ag support* Mining* Utilities*
Construction Manufacturing
Wholesale trade 252 Retail trade
Transportation & warehousing Information
Finance & insurance Real estate & rental & leasing
Prof., scientific, & technical services Mgmt of companies & enterprises*
Admin., support, waste mgmt Educational services*
Health care & social assistance Arts, entertainment, & recreation
Accommodation & food services Other services (except public admin.)
Industries not classified** 0 50 100 150 200 $ Billions Women-Owned Women-Owned & Led Women-Led * Not reported in the NWBC Special Tabulations. ** Not reported in the NWB C Special Tabulations. Due to data limitations Concentrance could not calculate an estimat e.
Chart B12: Receipts – Employer Firms by Industry

Study of Women-Owned & Led Businesses
An Overview of the Data in NWBC’s Special Tabulations
36 Order Number: SBAHQ06F0408
May 7, 2007
Forestry, fishing & hunting, & ag support*
Mining*
Utilities*
Construction
Manufacturing
Wholesale trade
Retail trade
Transportation & warehousing
Information
Finance & insurance
Real estate & rental & leasing
Prof., scientific, & technical services
Mgmt of companies & enterprises**
Admin., support, waste mgmt
Educational services*
Health care & social assistance
Arts, entertainment, & recreation
Accommodation & food services
Other services (except public admin.)
Industries not classified**
26
0 5 10 15 20 25
$ Billions
Women-Owned Women-Owned & Led Women-Led
* Not reported in the NWBC Special Tabulations. ** Not reported in the NWBC Special Tabulations. Due to data limitations Concentrance could not calculate an estimate.
31
Chart B13: Receipts – Non-Employer Firms by Industry

Study of Women-Owned & Led Businesses
An Overview of the Data in NWBC’s Special Tabulations
37 Order Number: SBAHQ06F0408 May 7, 2007
National Average
Forestry, fishing & hunting, & ag support
Mining
Utilities*
Construction
Manufacturing
Wholesale trade
Retail trade
Transportation & warehousing
Information
Finance & insurance
Real estate & rental & leasing
Prof., scientific, & technical services
Mgmt of companies & enterprises
Admin., support, waste mgmt
Educational services
Health care & social assistance
Arts, entertainment, & recreation
Accommodation & food services
Other services (except public admin.)
Industries not classified**
1,7341,654 1,374
0 200 400 600 800 1000
$ Thousands
Women-Owned Women-Owned & Led Women-Led
* Not reported in the NWBC Special Tabulations. ** Not reported in the NWBC Special Tabulations. Due to data limitations Concentrance could not calculate an estimate.
Chart B14: Receipts per Firm – All Women’s Businesses by Industry

Study of Women-Owned & Led Businesses
An Overview of the Data in NWBC’s Special Tabulations
38 Order Number: SBAHQ06F0408
May 7, 2007
National Average
Forestry, fishing & hunting, & ag support*
Mining*
Utilities*
Construction
Manufacturing
Wholesale trade
Retail trade
Transportation & warehousing
Information
Finance & insurance
Real estate & rental & leasing
Prof., scientific, & technical services
Mgmt of companies & enterprises**
Admin., support, waste mgmt
Educational services**
Health care & social assistance*
Arts, entertainment, & recreation
Accommodation & food services
Other services (except public admin.)
Industries not classified**
0 500 1000 1500 2000 2500
$ Thousands
Women-Owned Women-Owned & Led Women-Led
* Not reported in the NWBC Special Tabulations. ** Not reported in the NWBC Special Tabulations. Due to data limitations Concentrance could not calculate an estimate.
4449
Chart B15: Receipts per Firm – Employer Firms by Industry

Study of Women-Owned & Led Businesses
An Overview of the Data in NWBC’s Special Tabulations
39 Order Number: SBAHQ06F0408 May 7, 2007
Totals for all sectors
Utilities
Mining
Forestry, fishing & hunting, & ag support
Retail trade
Wholesale trade
Manufacturing
Construction 84
98
Finance & insurance
Information
Transportation & warehousing
Health care & social assistance
Educational services
Admin., support, waste mgmt
Mgmt of companies & enterprises*
Prof., scientific, & technical services
Real estate & rental & leasing
Accommodation & food services
Arts, entertainment, & recreation
Industries not classified*
Other services (except public admin.)
0 25 50 75
$ Thousands
Women-Owned Women-Owned & Led Women-Led
* Not reported in the NWBC Special Tabulations. Due to data limitations Concentrance could not calculate an estimate.
Chart B16: Receipts per Firm – Non-Employer Firms by Industry

Study of Women-Owned & Led Businesses
An Overview of the Data in NWBC’s Special Tabulations
40 Order Number: SBAHQ06F0408 May 7, 2007
IV.C Demographics
The Special Tabulations provided firm data by demographics. These data highlighted differences in women’s businesses. Several of the Census data tables included racial/ethnic groups: Native Hawaiian and Pacific Islander, Asian, American Indian or Alaska Native, Black or African American, White, and Hispanic or Latina. The data also included demographics of age and level of education.
The data in the following charts did not provide us with a comprehensive assessment on the success of women’s businesses; we would need more information on survival rates, growth and actual income. However, the demographics data painted a picture of women’s businesses which provided insight into the status of women’s businesses and their demographic positioning relative to one another.
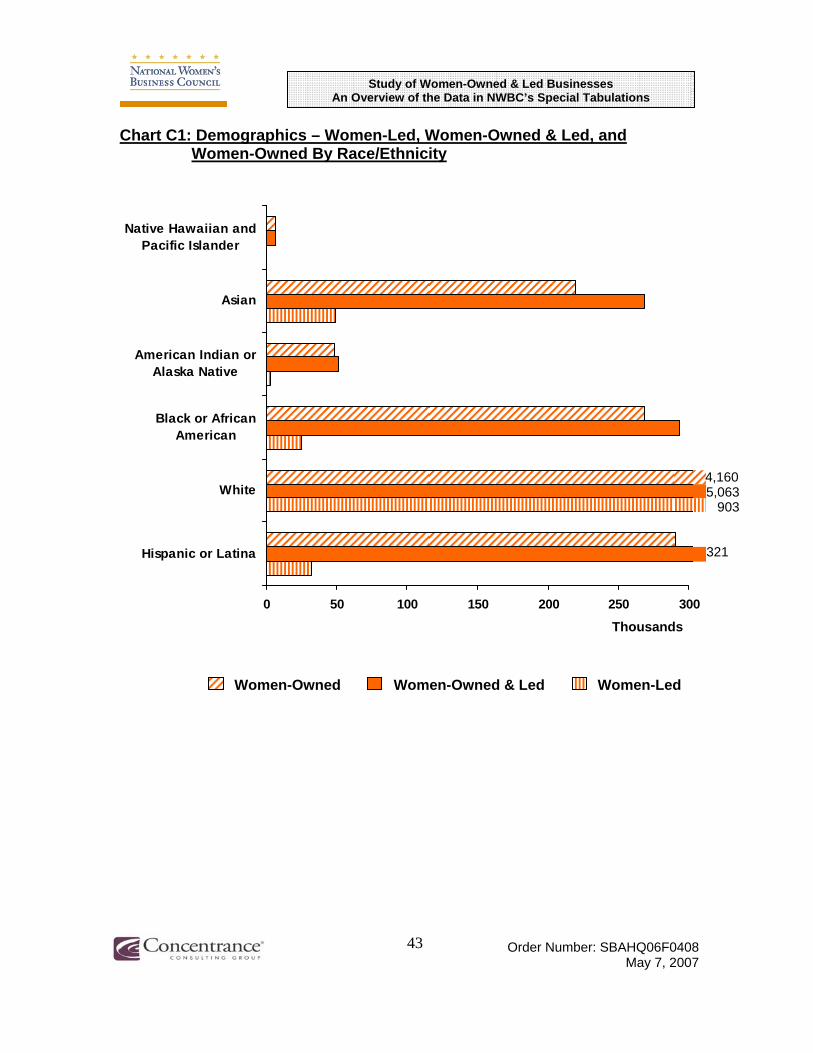
The first three pairs of charts depict all women’s firms by race/ethnicity, age, and education. This provided us with a perspective for comparison when we considered the other data on demographics and receipts. With respect to the distribution of firms by race/ethnicity, data existed for all races/ethnicities but values less than one percent were not displayed (Chart C2).
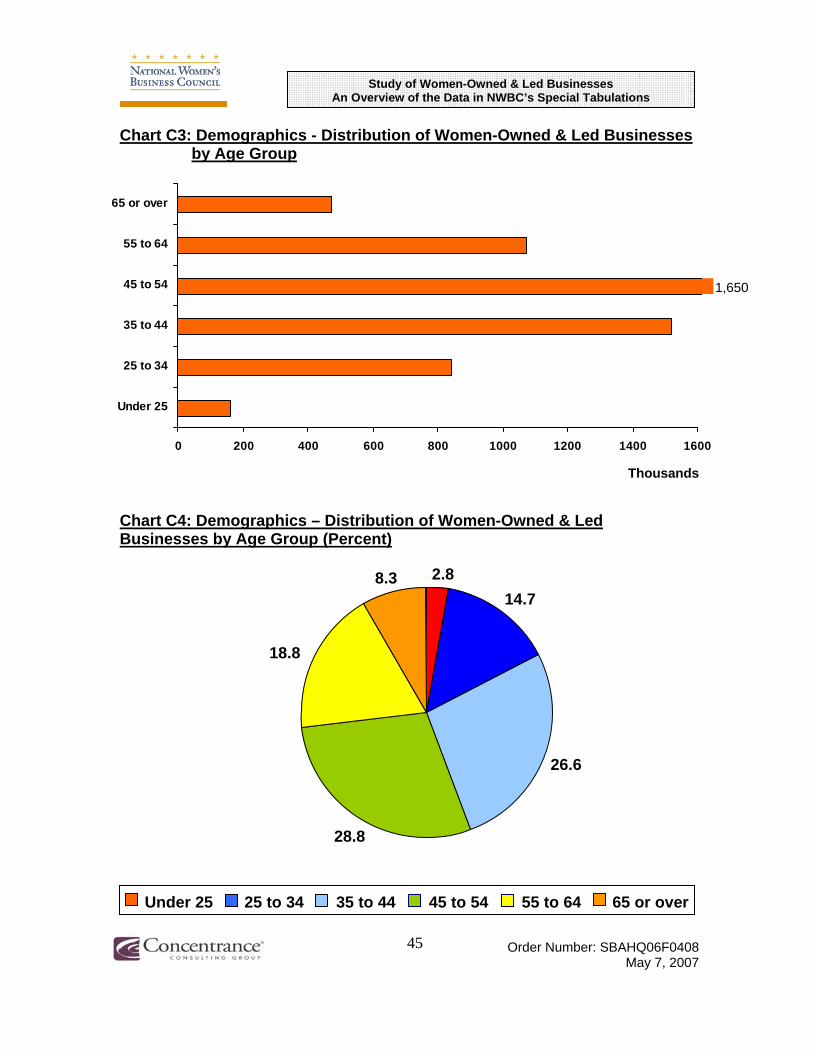
The ages of women in business formed a bell curve, with over fifty percent being between the ages of thirty-five and fifty-four. The levels of education were more spread out along the spectrum. The three education groups that stood out with high participation rates as business owners were high school graduates, some college but no degree, and bachelor’s degree. The groups with the lowest participation rates were those with less than high school, technical schools, and associate degrees. Post graduate degree business owners generally fell between these sets. Differences in level of education were not particularly apparent among the races. However, more Asians had a bachelor’s degree and, in turn, fewer Asians fell into the category some college but no degree. Except for women in the under-25 age group, the younger the age grouping of Women-Owned & Led businesses the greater number of bachelor’s degrees achieved (Chart C9).
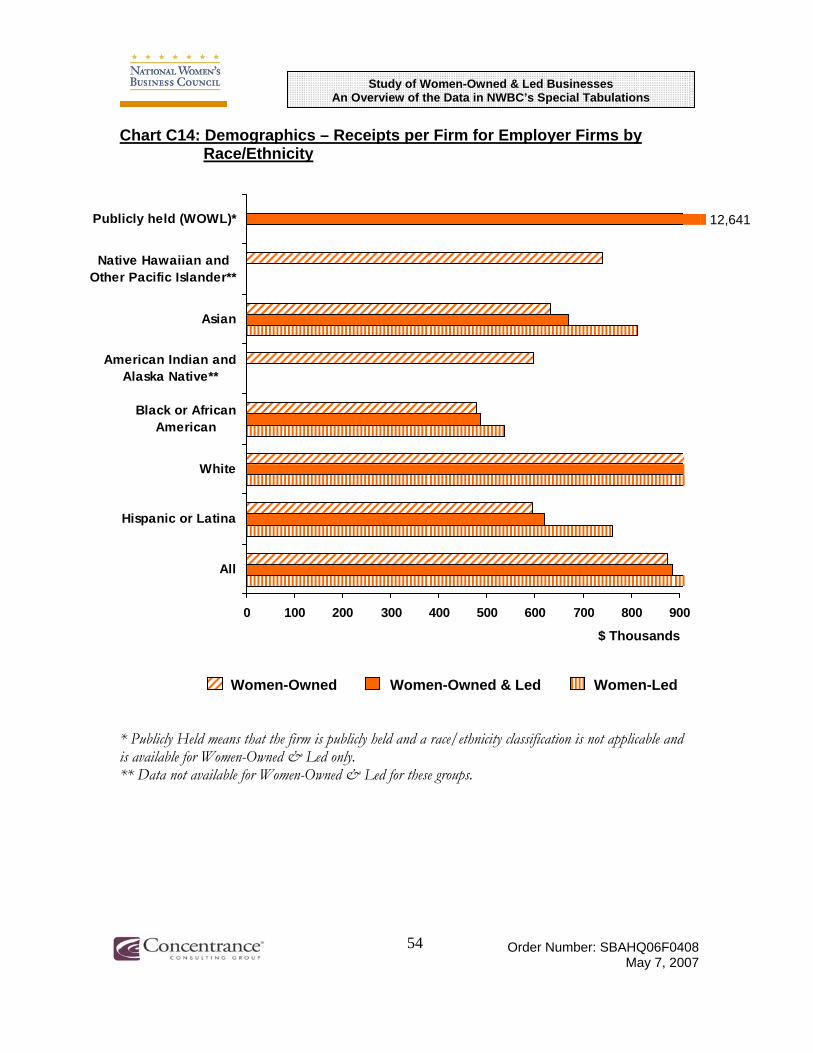
There were also substantial variations across racial/ethnic groups with respect to ownership and receipts. While there were more Hispanic and Black or African American firms than Asian firms, Asian firms had higher receipts. Also, Asian firms had the highest amount of receipts per firm, even higher than White firms which had the highest overall receipts (and substantially more firms overall). Unsurprisingly, all racial/ethnic groups had higher receipts if they had paid employees. Higher receipts for employer firms do not necessarily translate directly to overall performance, however, because we do not know the costs of additional employees.

Study of Women-Owned & Led Businesses
An Overview of the Data in NWBC’s Special Tabulations
41 Order Number: SBAHQ06F0408 May 7, 2007
Demographic analysis and comparison of women’s businesses provide opportunities for further research. Policy initiatives would be substantiated by further research into the success of women’s business ventures across demographic divisions. This research would need to include firm survival rates, income, and growth. Additional insight into varying levels of education may also be helpful to fully understand women’s businesses. Further research may also call for the inclusion of gender in the study.

Study of Women-Owned & Led Businesses
An Overview of the Data in NWBC’s Special Tabulations
42 Order Number: SBAHQ06F0408 May 7, 2007
Chart List
Chart C1: Demographics – Women-Led, Women-Owned & Led, and Women-Owned By Race/Ethnicity
Chart C2: Demographics – Women-Led, Women-Owned & Led, and Women-Owned By Race/Ethnicity (Percent)
Chart C3: Demographics – Distribution of WOWL Businesses by Age Group
Chart C4: Demographics – Distribution of WOWL Businesses by Age Group (Percent)
Chart C5: Demographics – Distribution of WOWL Firms by Education
Chart C6: Demographics – Distribution of WOWL Firms by Education (Percent)
Chart C7: Demographics – Percent of Firms by Race/Ethnicity by Age
Chart C8: Demographics – Education by Race/Ethnicity
Chart C9: Demographics – Firms by Education by Age
Chart C10: Demographics – Receipts by Race/Ethnicity
Chart C11: Demographics – Receipts per Firm by Race/Ethnicity
Chart C12: Demographics – Receipts for Employer Firms by Race/Ethnicity
Chart C13: Demographics – Receipts for Non-Employer Firms by Race/Ethnicity
Chart C14: Demographics – Receipts per Firm for Employer Firms by Race/Ethnicity
Chart C15: Demographics – Receipts per Firm for Non-Employer Firms by Race/Ethnicity
Study of Women-Owned & Led Businesses
An Overview of the Data in NWBC’s Special Tabulations
43 Order Number: SBAHQ06F0408 May 7, 2007
Native Hawaiian and Pacific Islander
Asian
American Indian or Alaska Native
Black or African American
4,160White 5,063
903
321Hispanic or Latina
0 50 100 150 200 250 300
Thousands
Women-Owned Women-Owned & Led Women-Led
Chart C1: Demographics – Women-Led, Women-Owned & Led, and Women-Owned By Race/Ethnicity

Study of Women-Owned & Led Businesses
An Overview of the Data in NWBC’s Special Tabulations
44 Order Number: SBAHQ06F0408 May 7, 2007
2.5
4.8
3.189.3
Women-Led
5.4 1.0 4.4
83.3 5.8
Women-Owned
5.484.3
4.9 0.8 4.5
Women-Owned & Led
Hispanic or Latina White Black or African American American Indian and Alaska Native Asian Native Hawaiian and Pacific Islander
Chart C2: Demographics – Women-Led, Women-Owned & Led, and Women-Owned By Race/Ethnicity (Percent)
Values less than 0.5% are not displayed
Study of Women-Owned & Led Businesses
An Overview of the Data in NWBC’s Special Tabulations
Chart C3: Demographics - Distribution of Women-Owned & Led Businesses by Age Group
Under 25
25 to 34
35 to 44
45 to 54
55 to 64
65 or over
1,650
0 200 400 600 800 1000 1200
Thousands
1400 1600
Chart C4: Demographics – Distribution of Women-Owned & Led Businesses by Age Group (Percent)
8.3 2.8 14.7
26.6
28.8
18.8
Under 25 25 to 34 35 to 44 45 to 54 55 to 64 65 or over
45 Order Number: SBAHQ06F0408 May 7, 2007

Study of Women-Owned & Led Businesses
An Overview of the Data in NWBC’s Special Tabulations
46 Order Number: SBAHQ06F0408 May 7, 2007
Chart C5: Demographics – Distribution of Women-Owned & Led Firms by Education
Less than High School Graduate
High School Graduate - Diploma or GED
Technical, Trade, or Vocational School
Some College, but no Degree
Associate's Degree
Bachelor's Degree
Master's, Doctorate, or Professional Degree
1,247
1,276
0 200 400 600 800 1000 1200
Thousands
Chart C6: Demographics – Distribution of Women-Owned & Led Firms by Education (Percent)
5.0
21.5
8.8
7.1
22.0
15.3
20.3
Less than High School Graduate Associate's Degree High School Graduate - Diploma or GED Bachelor's Degree Technical, Trade or Vocational School Master's, Doctorate or Professional Degree Some College but no Degree

Study of Women-Owned & Led Businesses
An Overview of the Data in NWBC’s Special Tabulations
47 Order Number: SBAHQ06F0408 May 7, 2007
Chart C7: Demographics – Percent of Firms by Race/Ethnicity by Age
0
5
10
15
20
25
30
Under 25 25 to 34 35 to 44 45 to 54 55 to 64 65 or over
Hispanic or Latina White Black or African American American Indian and Alaska Native Asian Native Hawaiian and Pacific Islander
We omitted Native Hawaiians and Pacific Islanders from this chart; their numbers are too small to present meaningful data here.

Study of Women-Owned & Led Businesses
An Overview of the Data in NWBC’s Special Tabulations
48 Order Number: SBAHQ06F0408 May 7, 2007
Chart C8: Demographics – Education by Race/Ethnicity (Percent)
8.2
20.1
9.7
22.9
7.4
16.7
14.9
Black or African American
4.5
21.7
8.9
20.5 7.1
22.1
15.2
White
9.0 20.1
13.3
6.5
23.1
18.4
9.6
Hispanic or Latina
10.3 18.4
19.4
26.9 5.6
13.4 5.8
Asian
10.5 8.9
21.0
7.7 9.0
15.1
27.8
American Indian or Alaska Native
Less than High School Graduate Associate's Degree High School Graduate - Diploma or GED Bachelor's Degree Technical, Trade or Vocational School Master's, Doctorate or Professional Degree Some College but no Degree

Study of Women-Owned & Led Businesses
An Overview of the Data in NWBC’s Special Tabulations
49 Order Number: SBAHQ06F0408 May 7, 2007
Chart C9: Demographics – Firms by Education by Age (Percent)
0
5
10
15
20
25
30 32
Under 25 25 to 34 35 to 44 45 to 54 55 to 64 65 or over
Less than High School Graduate High School Graduate - Diploma or GED Technical, Trade or Vocational School Some College but no Degree Associate's Degree Bachelor's Degree Master's, Doctorate or Professional Degree

Publicly held (WOWL)*
Native Hawaiian and Other Pacific Islander
Asian
American Indian and Alaska Native
Black or African American
863 White 1,135
272
Hispanic or Latina
0 10 20 30 40 50 60 70 80 $ Billions
Women-Owned Women-Owned & Led Women-Led
* Publicly Held means that the firm is publicly held and a race/ethnicity classification is not applicable and is available for Women-Owned & Led only.
Study of Women-Owned & Led Businesses
An Overview of the Data in NWBC’s Special Tabulations
50 Order Number: SBAHQ06F0408 May 7, 2007
Chart C10: Demographics – Receipts by Race/Ethnicity

2112 Publicly held (WOWL)*
Native Hawaiian and Other Pacific Islander
Asian
American Indian and Alaska Native
Black or African American
White
Hispanic or Latina
All
0 50 100 150 200 250 300 350 400
$ Thousands
Women-Owned Women-Owned & Led Women-Led
* Publicly Held means that the firm is publicly held and a race/ethnicity classification is not applicable and is available for Women-Owned & Led only.
51 Order Number: SBAHQ06F0408 May 7, 2007
Study of Women-Owned & Led Businesses An Overview of the Data in NWBC’s Special Tabulations
Chart C11: Demographics – Receipts per Firm by Race/Ethnicity

Publicly held (WOWL)*
Native Hawaiian and Other Pacific Islander**
Asian
American Indian and Alaska Native**
Black or African American
White
Hispanic or Latina
743 982 239
0 10 20 30 40 50 60$ Billions
Women-Owned Women-Owned & Led Women-Led
* Publicly Held means that the firm is publicly held and a race/ethnicity classification is not applicable and is available for Women-Owned & Led only. ** Data not available for Women-Owned & Led for these groups.
Study of Women-Owned & Led Businesses
An Overview of the Data in NWBC’s Special Tabulations
52 Order Number: SBAHQ06F0408 May 7, 2007
Chart C12: Demographics – Receipts for Employer Firms by Race/Ethnicity

Publicly held (WOWL)*
Native Hawaiian and Other Pacific Islander**
Asian
American Indian and Alaska Native**
Black or African American
White
Hispanic or Latina
120 153
33
0 2 4 6 8 10 12$ Billions
Women-Owned Women-Owned & Led Women-Led
* Publicly Held means that the firm is publicly held and a race/ethnicity classification is not applicable and is available for Women-Owned & Led only. ** Data not available for Women-Owned & Led for these groups.
Study of Women-Owned & Led Businesses
An Overview of the Data in NWBC’s Special Tabulations
53 Order Number: SBAHQ06F0408 May 7, 2007
Chart C13: Demographics – Receipts for Non-Employer Firms by Race/Ethnicity
Study of Women-Owned & Led Businesses
An Overview of the Data in NWBC’s Special Tabulations
54 Order Number: SBAHQ06F0408 May 7, 2007
Chart C14: Demographics – Receipts per Firm for Employer Firms by Race/Ethnicity
Publicly held (WOWL)*
Native Hawaiian and Other Pacific Islander**
Asian
American Indian and Alaska Native**
Black or African American
White
Hispanic or Latina
All
12,641
0 100 200 300 400 500 600 700 800 900
$ Thousands
Women-Owned Women-Owned & Led Women-Led
* Publicly Held means that the firm is publicly held and a race/ethnicity classification is not applicable and is available for Women-Owned & Led only. ** Data not available for Women-Owned & Led for these groups.

Chart C15: Demographics – Receipts per Firm for Non-Employer Firms by Race/Ethnicity
Publicly held (WOWL)*
Native Hawaiian and Other Pacific Islander**
Asian
American Indian and Alaska Native**
Black or African American
White
Hispanic or Latina
All
89
78
0 10 20 30 40 50 60 $ Thousands
Women-Owned Women-Owned & Led Women-Led
* Publicly Held means that the firm is publicly held and a race/ethnicity classification is not applicable and is available for Women-Owned & Led only. ** Data not available for Women-Owned & Led for these groups.
Study of Women-Owned & Led Businesses
An Overview of the Data in NWBC’s Special Tabulations
55 Order Number: SBAHQ06F0408 May 7, 2007
Study of Women-Owned & Led Businesses
An Overview of the Data in NWBC’s Special Tabulations
56 Order Number: SBAHQ06F0408 May 7, 2007
IV.D Customer Type
We reviewed data on the customer type of WOWL businesses. Survey respondents had the option of selecting the federal government, state and local government, export sales, other businesses and organizations, household consumers and individuals, and all others. The most predominant customer type selected by WOWL businesses in the survey was household consumers and individuals, and the least selected was export sales. A substantial number of survey respondents did not select a customer type or selected all others, so this data might not provide a comprehensive assessment of WOWL businesses by customer type.
The pie charts “Percent of Firms by Customer Type by Race/Ethnicity” highlight important differences between the racial/ethnic groups and their clientele. Household consumers and individuals remained the predominant customer type across all racial/ethnic groups. However, the distribution of customer types across the racial/ethnic groups varied.
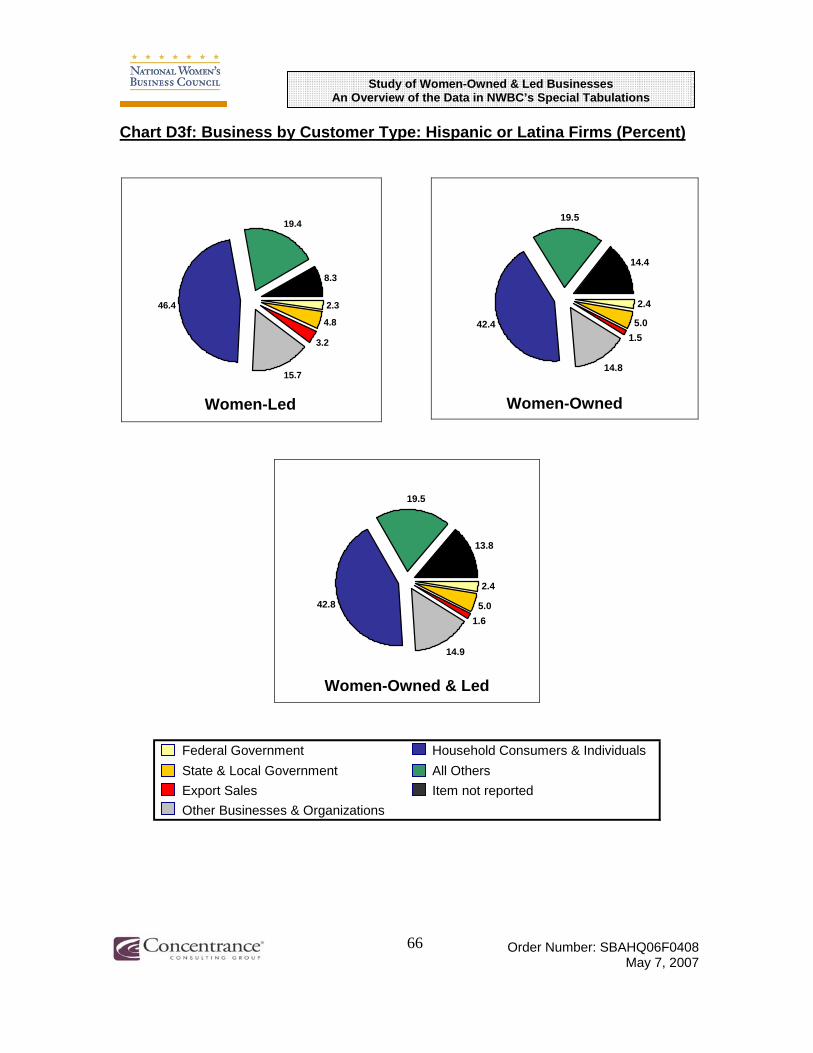
White WOWL businesses had the highest percentage of clients in the category other businesses and organizations. In contrast to White firms, some minority groups had more customers in the export sales category. This was particularly true for Asian and Native Hawaiian or Pacific Islander firms, as well as Hispanic firms to a smaller degree. American Indian or Alaska Native firms and Black or African American firms also included federal and state governments in their clientele more frequently than other racial/ethnic groups.
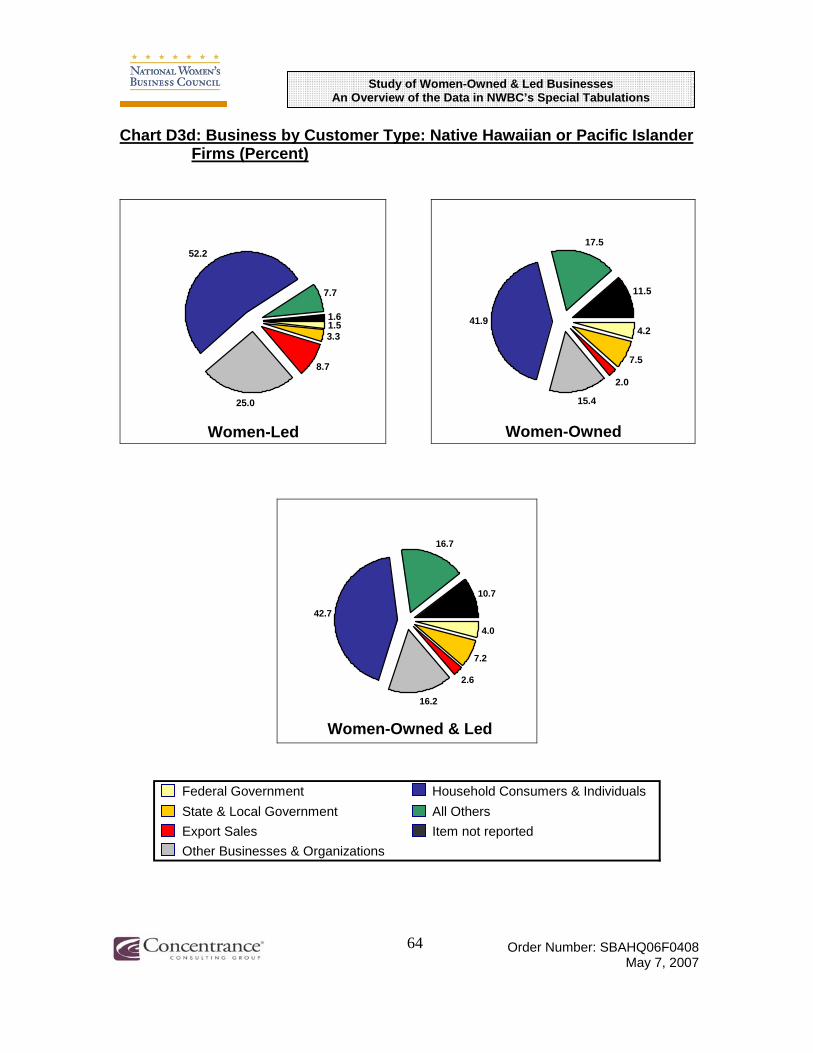
There were also differences in customer types between Women-Owned & Led firms within racial/ethnic groups. For example, Native Hawaiian or Pacific Islander Women-Led firms cited other businesses and organizations or export sales more than Native Hawaiian or Pacific Islander Women-Owned firms. Native Hawaiian or Pacific Islander Women-Owned firms were more likely to cite state and local government. However, these Women-Owned firms commonly selected all others or did not report. There were also more export sales by Hispanic Women-Led firms than Hispanic Women-Owned firms.
Although there was an issue of non-response in the customer type data, it is an interesting aspect of the state of WOWL businesses. It would be interesting to look deeper into the overlap between customer types; for example, did WOWL firms serve only one customer type or multiple types. It would also be informative to analyze additional research by customer type; for example, receipts by customer type or age by customer type.

Study of Women-Owned & Led Businesses
An Overview of the Data in NWBC’s Special Tabulations
57 Order Number: SBAHQ06F0408 May 7, 2007
Chart List
Chart D1: Customer Type – Distribution of Firms by Customer Type
Chart D2: Customer Type – Firms by Customer Type (Percent)
Chart Series D3: Customer Type – Firms by Race/Ethnicity by Customer Type (Percent)
Chart D3a: Business by Customer Type: Black or African American Firms (Percent)
Chart D3b: Business by Customer Type: White Firms (Percent)
Chart D3c: Business by Customer Type: American Indian or Alaska Native Firms (Percent)
Chart D3d: Business by Customer Type: Native Hawaiian or Pacific Islander Firms (Percent)
Chart D3e: Business by Customer Type: Asian Firms (Percent)
Chart D3f: Business by Customer Type: Hispanic or Latina Firms (Percent)

Study of Women-Owned & Led Businesses
An Overview of the Data in NWBC’s Special Tabulations
58 Order Number: SBAHQ06F0408 May 7, 2007
Chart D1: Customer Type – Distribution of Firms by Customer Type
Federal Government
State and Local Government
Export Sales
Other Businesses & Organizations
Household Consumers & Individuals
All Others
Item not Reported
2,451 3,080
0 200 400 600 800 1000 1200 1400
Thousands
Women-Owned Women-Owned & Led Women-Led

Study of Women-Owned & Led Businesses
An Overview of the Data in NWBC’s Special Tabulations
59 Order Number: SBAHQ06F0408 May 7, 2007
Chart D2: Customer Type – Percent of Firms by Customer Type
14.0
1.1
52.1
4.0
4.1 1.2
23.5
Women-Led
15.9
8.3 47.0
1.7
4.8 0.8
21.5
Women-Owned
1.6 4.7
0.9
21.9
47.9
15.5
7.5
Women-Owned & Led
Federal Government Household Consumers & Individuals State & Local Government All Others Export Sales Item not reported Other Businesses & Organizations

Study of Women-Owned & Led Businesses
An Overview of the Data in NWBC’s Special Tabulations
60 Order Number: SBAHQ06F0408 May 7, 2007
Chart Series D3: Firms by Race/ Ethnicity by Customer Type (Percent)
Charts are on the following pages

Study of Women-Owned & Led Businesses
An Overview of the Data in NWBC’s Special Tabulations
61 Order Number: SBAHQ06F0408 May 7, 2007
Chart D3a: Business by Customer Type: Black or African American Firms (Percent)
15.1
7.6 53.2
3.0
6.5
1.0
13.6
Women-Led
18.7
16.4
3.1
40.0 7.8
1.0
13.0
Women-Owned
18.4
3.1
7.7
1.0
13.1
41.1
15.6
Women-Owned & Led
Federal Government Household Consumers & Individuals State & Local Government All Others Export Sales Item not reported Other Businesses & Organizations

Study of Women-Owned & Led Businesses
An Overview of the Data in NWBC’s Special Tabulations
62 Order Number: SBAHQ06F0408 May 7, 2007
Chart D3b: Business by Customer Type: White Firms (Percent)
13.4
52.3
3.6 1.4 3.9
1.1
Women-Led
24.2
7.8
15.3
47.7
1.5 4.6
0.7
22.3
Women-Owned
1.5 4.5
0.8
22.6
48.6
15.0
7.0
Women-Owned & Led
Federal Government Household Consumers & Individuals State & Local Government All Others Export Sales Item not reported Other Businesses & Organizations

Study of Women-Owned & Led Businesses
An Overview of the Data in NWBC’s Special Tabulations
63 Order Number: SBAHQ06F0408 May 7, 2007
Chart D3c: Business by Customer Type: American Indian or Alaska Native Firms (Percent)
3.2
7.1
0.8
16.6
51.5
12.9
7.9
Women-Led
16.8
11.6
41.3 3.3
7.4
0.9
18.8
Women-Owned
16.6
3.3
7.4
0.9
18.7
41.8
11.4
Women-Owned & Led
Federal Government Household Consumers & Individuals State & Local Government All Others Export Sales Item not reported Other Businesses & Organizations
Study of Women-Owned & Led Businesses
An Overview of the Data in NWBC’s Special Tabulations
64 Order Number: SBAHQ06F0408 May 7, 2007
Chart D3d: Business by Customer Type: Native Hawaiian or Pacific Islander Firms (Percent)
52.2
7.7
1.6 1.5 3.3
8.7
25.0
Women-Led
17.5
11.5
41.9 4.2
7.5
2.0
15.4
Women-Owned
16.7
4.0
7.2
2.6
16.2
42.7
10.7
Women-Owned & Led
Federal Government Household Consumers & Individuals State & Local Government All Others Export Sales Item not reported Other Businesses & Organizations

Study of Women-Owned & Led Businesses
An Overview of the Data in NWBC’s Special Tabulations
65 Order Number: SBAHQ06F0408 May 7, 2007
Chart D3e: Business by Customer Type: Asian Firms (Percent)
20.8
5.0
49.8 2.1 3.8
3.3
15.2
Women-Led
23.8
8.2
2.3 40.3 4.0
2.4
19.0
Women-Owned
23.3
2.2 3.9
2.6
18.3
42.1
7.6
Women-Owned & Led
Federal Government Household Consumers & Individuals State & Local Government All Others Export Sales Item not reported Other Businesses & Organizations
Study of Women-Owned & Led Businesses
An Overview of the Data in NWBC’s Special Tabulations
66 Order Number: SBAHQ06F0408 May 7, 2007
Chart D3f: Business by Customer Type: Hispanic or Latina Firms (Percent)
19.4
8.3
46.4 2.3
4.8
3.2
15.7
Women-Led
19.5
14.4
2.4
42.4 5.0 1.5
14.8
Women-Owned
19.5
2.4
5.0 1.6
14.9
42.8
13.8
Women-Owned & Led
Federal Government Household Consumers & Individuals State & Local Government All Others Export Sales Item not reported Other Businesses & Organizations

Study of Women-Owned & Led Businesses
An Overview of the Data in NWBC’s Special Tabulations
67 Order Number: SBAHQ06F0408 May 7, 2007
IV.E Compensation
In this section we presented data for employee compensation of women’s firms by state and by industry. For each region we first showed compensation by state and followed with differences from the national average of all women’s businesses by state. We then showed average employee compensation by industry and their differences from the national averages. The charts of the differences from national averages display the magnitude of the differences among states and industries.
Data was frequently lacking for WOWL firms due to Census Bureau disclosure rules and so we did not provide estimates by region. Because of missing WOWL data, some of the comments that follow are based on data for Women-Owned firms only. However, consistent with our data, WOWL firm trends were similar to those of Women-Owned firms.
Women’s firms in states with large urban populations had higher compensation per employee than states that were more rural. This is to be expected as urban areas typically had higher costs of living than rural areas. The Dakotas and Montana had the lowest compensation per employee while urban-dominated states like New York and California were among the highest, with New Jersey ranking at the very top.
While we showed the variation in compensation by industry for women’s firms and compared those data to the national averages of women’s firms, it would be instructive to learn how the compensation patterns differ within industry by the owner’s gender.
While Women-Led firms were stronger than Women-Owned firms in receipts per firm, they paid their employees less than Women-Owned firms on a national basis. This phenomenon would be an interesting matter to investigate further.
Note that the Census Bureau reported in the Survey of Business Owners that average employee compensation for all women’s and men’s firms was $34,419, which is about fifty percent higher than that for the women’s firms.

Study of Women-Owned & Led Businesses
An Overview of the Data in NWBC’s Special Tabulations
68 Order Number: SBAHQ06F0408 May 7, 2007
Chart List
Chart E1: Average Compensation – Employer Firms in the Northeast
Chart E2: Average Compensation – Employer Firms in the Northeast – Differences from National Average
Chart E3: Average Compensation – Employer Firms in the Midwest
Chart E4: Average Compensation – Employer Firms in the Midwest – Differences from the National Average
Chart E5: Average Compensation – Employer Firms in the South
Chart E6: Average Compensation – Employer Firms in the South – Differences from the National Average
Chart E7: Average Compensation – Employer Firms in the West
Chart E8: Average Compensation – Employer Firms in the West – Differences from the National Average
Chart E9: Average Compensation – Employer Firms by Industry
Chart E10: Average Compensation – Employer Firms by Industry – Differences from the National Average

Chart E1: Average Compensation – Employer Firms in the Northeast
National Average
Vermont
Rhode Island
Pennsylvania
New York*
New Jersey*
New Hampshire*
Massachusetts*
Maine
Connecticut
0 5 10 15 20 25 30 $ Thousands
Women-Owned Women-Owned & Led Women-Led
* Not reported in the NWBC Special Tabulations.
Study of Women-Owned & Led Businesses
An Overview of the Data in NWBC’s Special Tabulations
69 Order Number: SBAHQ06F0408 May 7, 2007

Chart E2: Average Compensation – Employer Firms in the Northeast: Differences from the National Average
Connecticut
Maine
Massachusetts*
New Hampshire*
New Jersey*
New York*
Pennsylvania
Rhode Island
Vermont
-6 -4 -2 0 2 4
$ Thousands
6
Women-Owned Women-Owned & Led Women-Led
National Averages: 22.6 23.9 24.3
*Not reported in the NWBC Special Tabulations.
Study of Women-Owned & Led Businesses
An Overview of the Data in NWBC’s Special Tabulations
70 Order Number: SBAHQ06F0408 May 7, 2007

Chart E3: Average Compensation – Employer Firms in the South
National Average
West Virginia*
Virginia*
Texas
Tennessee
South Carolina
Oklahoma
North Carolina
Mississippi
Maryland*
Louisiana
Kentucky
Georgia*
Florida
District of Columbia**
Delaware*
Arkansas
Alabama
0 5 10 15 20 25 30 $ Thousands
Women-Owned Women-Owned & Led Women-Led
* Not reported in the NWBC Special Tabulations. **Data for this state is not reported
Study of Women-Owned & Led Businesses
An Overview of the Data in NWBC’s Special Tabulations
71 Order Number: SBAHQ06F0408 May 7, 2007
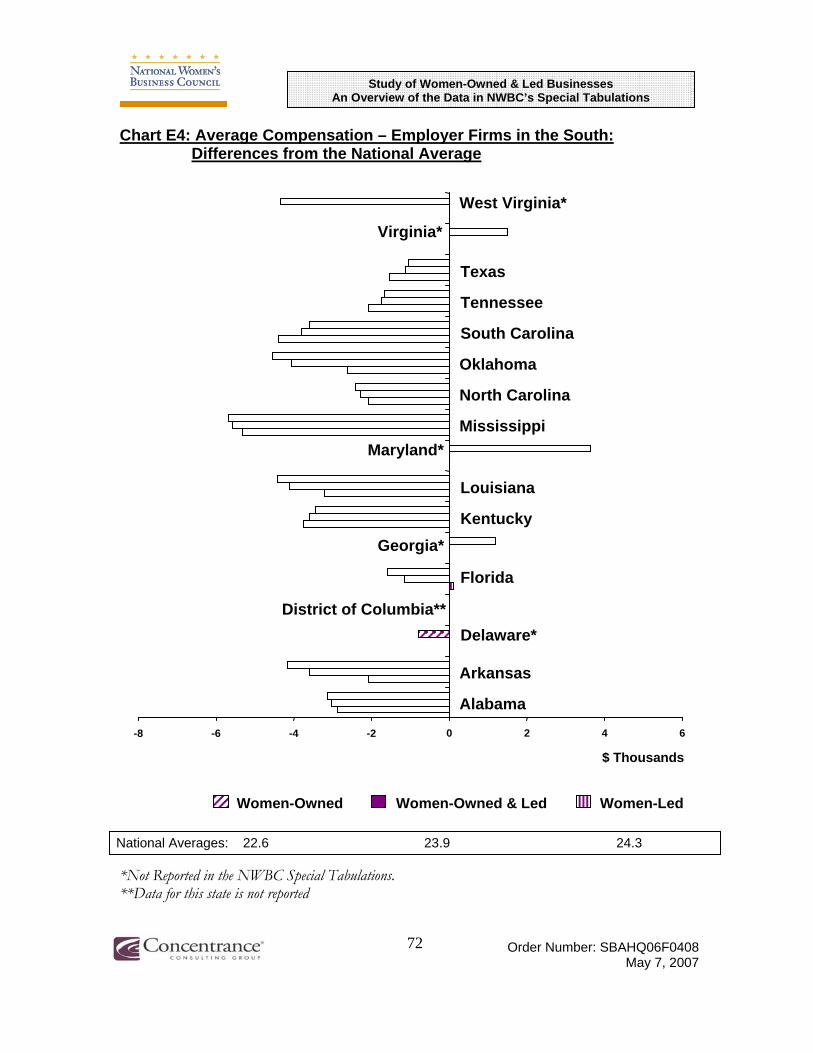
Study of Women-Owned & Led Businesses
An Overview of the Data in NWBC’s Special Tabulations
72 Order Number: SBAHQ06F0408 May 7, 2007
Chart E4: Average Compensation – Employer Firms in the South: Differences from the National Average
Alabama
Arkansas
Delaware* District of Columbia**
Florida
Georgia* Kentucky
Louisiana
Maryland* Mississippi
North Carolina
Oklahoma
South Carolina
Tennessee
Texas
Virginia*
West Virginia*
-8 -6 -4 -2 0 2
$ Thousands
4 6
Women-Owned Women-Owned & Led Women-Led
National Averages: 22.6 23.9 24.3
*Not Reported in the NWBC Special Tabulations. **Data for this state is not reported

Chart E5: Average Compensation – Employer Firms in the Midwest
National Average
Wisconsin
South Dakota
Ohio
North Dakota
Nebraska
Missouri*
Minnesota*
Michigan*
Kansas*
Iowa*
Indiana*
Illinois*
0 5 10 15 20 25 30 $ Thousands
Women-Owned Women-Owned & Led Women-Led
* Not reported in the NWBC Special Tabulations.
Study of Women-Owned & Led Businesses
An Overview of the Data in NWBC’s Special Tabulations
73 Order Number: SBAHQ06F0408 May 7, 2007

Chart E6: Average Compensation – Employer Firms in the Midwest: Differences from the National Average
Illinois*
Indiana*
Iowa*
Kansas*
Michigan*
Minnesota*
Missouri*
Nebraska
North Dakota
Ohio
South Dakota
Wisconsin
-8 -6 -4 -2 0 $ Thousands
2 4
National Averages:
Women-Owned
22.6
Women-Owned & Led
23.9
Women-Led
24.3
*Not Reported in the NWBC Special Tabulations.
Study of Women-Owned & Led Businesses
An Overview of the Data in NWBC’s Special Tabulations
74 Order Number: SBAHQ06F0408 May 7, 2007

Chart E7: Average Compensation – Employer Firms in the West
National Average
Wyoming**
Washington
Utah*
Oregon*
New Mexico
Nevada
Montana*
Idaho*
Hawaii*
Colorado
California
Arizona
Alaska*
0 5 10 15 20 25 30 $ Thousands
Women-Owned Women-Owned & Led Women-Led
*Not Reported in the NWBC Special Tabulations. **Data for this state is not reported.
Study of Women-Owned & Led Businesses
An Overview of the Data in NWBC’s Special Tabulations
75 Order Number: SBAHQ06F0408 May 7, 2007

Chart E8: Average Compensation – Employer Firms in the West: Differences from the National Average
Utah*
Oregon*
New Mexico
Montana*
Idaho*
Hawaii*
Colorado
Arizona
-8 -6 -4 -2 0 2 4 $ Thousands
Women-Owned Women-Owned & Led Women-Led
Washington
Wyoming**
Nevada
California
Alaska*
National Averages: 22.6 23.9 24.3
*Not Reported in the NWBC Special Tabulations. **Data for this state is not reported.
Study of Women-Owned & Led Businesses
An Overview of the Data in NWBC’s Special Tabulations
76 Order Number: SBAHQ06F0408 May 7, 2007

Chart E9: Average Compensation – Employer Firms by Industry
National Average
Forestry, fishing & hunting, & ag support*
Mining*
Utilities*
Construction
Manufacturing
Wholesale trade
Retail trade
Transportation & warehousing
Information
Finance & insurance
Real estate & rental & leasing
Prof., scientific, & technical services
Mgmt of companies & enterprises*
Admin., support, waste mgmt
Educational services*
Health care & social assistance
Arts, entertainment, & recreation
Accommodation & food services
Other services (except public admin.)
Industries not classified*
0 5 10 15 20 25 30 35 40 45$ Thousands
Women-Owned Women-Owned & Led Women-Led
* Not reported in the NWBC Special Tabulations. Values for WOWL and Women-Led firms are Concentrance estimates.
Study of Women-Owned & Led Businesses
An Overview of the Data in NWBC’s Special Tabulations
77 Order Number: SBAHQ06F0408 May 7, 2007

Chart E10: Average Compensation – Employer Firms by Industry: Differences from the National Average
Industries not classified*
Other services (except public admin.)
Accommodation & food services
Arts, entertainment, & recreation
Health care & social assistance
Educational services*
Admin., support, waste mgmt
Mgmt of companies & enterprises*
Prof., scientific, & technical services
Real estate & rental & leasing
Finance & insurance
Information
Transportation & warehousing
Retail trade
Wholesale trade
Manufacturing
Construction
Utilities*
Mining*
Forestry, fishing & hunting, & ag support*
National Average
-15 -10 -5 0 5 10 15 20 25$ Thousands
Women-Owned Women-Owned & Led Women-Led
* Not reported in the NWBC Special Tabulations. Values for WOWL and Women-Led Firms are Concentrance estimates.
Study of Women-Owned & Led Businesses
An Overview of the Data in NWBC’s Special Tabulations
78 Order Number: SBAHQ06F0408 May 7, 2007

Study of Women-Owned & Led Businesses
An Overview of the Data in NWBC’s Special Tabulations
79 Order Number: SBAHQ06F0408 May 7, 2007
V. SUMMARY AND CONCLUSIONS
This report has provided a survey of the contribution of women’s businesses to the national economy along a variety of demographic and economic dimensions. We designed the report to highlight the contributions of Women-Led businesses and to compare those contributions with those of Women-Owned businesses as publicly reported by the Census Bureau.
Women-Led businesses made strong contributions to the economy in 2002. We examined both total WOWL revenues and revenues per firm. In total, Women-Led businesses generated a little more than $300 billion dollars in revenues and produced about twice as much in receipts per firm as did Women-Owned businesses. While the greatest numbers of firms (84%) were non-employer firms, employer firms produced much more revenue: 86% of all WOWL firm revenues. The biggest revenue producing industries for women’s businesses were wholesale and retail trade, manufacturing, and construction; except for retail, these do not represent what is typically thought of as traditional women’s businesses. There was a different pattern of receipts by industry for non-employer firms. Real estate and professional services produced greater revenues than retail trade, as did professional services.
The top three industries for receipts per employer firm were educational services, accommodation and food services, and health care and social services. The top three for non-employer firms were construction, wholesale trade, and transportation and warehousing. Combining employer and non-employer firms, receipts per firm were highest for wholesale trade, manufacturing and management of companies. The view of all women’s businesses produced less insight than the view at the employer or non-employer level because it hid underlying patterns.
Trends in the larger society were shown in the data with respect to racial/ethnic groups. White firms dominated the women’s business landscape. A distant second were Hispanic or Latina firms, which were followed closely by Black or African American firms. Asian firms, also well represented in the number of firms, produced the highest receipts per firm of all groups.
The distribution of firms by age was a rough bell curve. Nearly 56% of the women were between the ages of 35 and 54; the numbers thinned out as we moved to older and younger owners. On the other hand, the distribution of firms by education did not reflect a simple pattern. Generally, more educated women led greater numbers of women’s firms. But the most educated (master’s and doctorates) led a lower percentage (15%) than three other groups: high school graduates, college graduates and some college but no degree (each of these groups comprised roughly 20% of reporting firms).

Study of Women-Owned & Led Businesses
An Overview of the Data in NWBC’s Special Tabulations
80 Order Number: SBAHQ06F0408 May 7, 2007
The dominant customer type for WOWL was household consumers and individuals, accounting for almost half of all customers. Next in size was other businesses and organizations (22%), followed by all others (16%). The next two meaningful customer types were state and federal governments, which combined for a little more than 6%. Export sales accounted for a little less than 1% of all WOWL customers. These numbers formed a base by which to understand the distribution of customer type by race and ethnicity. So while export sales were very small for the totality of WOWL businesses they became substantial when examined for Native Hawaiian and Pacific Islanders, Asians and Hispanics or Latinas. Similarly, the shares of state and federal government customers for minority women business owners were noticeably greater than the share for White business owners.
Compensation was higher in more urbanized states. And while Women-Led firms were stronger than Women-Owned firms in receipts per firm, they paid their employees less than Women-Owned firms on a national basis. WOWL firms paid their employees less than all US firms (men’s and women’s combined); according to the 2002 Survey of Business Owners, compensation by all firms (including both men’s and women’s firms) was about 50% higher than compensation by women’s firms.

Study of Women-Owned & Led Businesses
An Overview of the Data in NWBC’s Special Tabulations
81 Order Number: SBAHQ06F0408 May 7, 2007
VII. APPENDICES

Study of Women-Owned & Led Businesses
An Overview of the Data in NWBC’s Special Tabulations
82 Order Number: SBAHQ06F0408 May 7, 2007
Appendix A: An Example of Estimation of Non-Disclosed Data
Figure 1 on the following page illustrates a case in which Concentrance estimated non-disclosed, state level data. The NWBC Special Tabs dataset did not report the value for receipts of Women-Owned & Led (WOWL) firms in New Jersey and Vermont, although the value for Women-Owned (WO) firms in these states was reported. Without the value for WOWL firms, the value of Women-Led (WL) firms cannot be calculated.
To estimate the undisclosed values, Concentrance assumed that the states with missing data were more similar to the other states in the region than to national averages or to zero. We calculated the ratio of the value of WO firms to WOWL firms for the other states in this region for which complete information was available. These ratios are provided in Table 1 and exhibit fairly low variability (the standard deviation of the ratios does not exceed 9%).
Next, we took an average of those ratios, which is equal to 0.7518. Assuming that the ratio between WO and WOWL firms located in the states in the Northeast region are comparable, this average ratio is the best indicator of how the values of WO firms in Vermont and New Jersey differ from the values for WOWL firms. Thus, we divided the value for WO firms in New Jersey and Vermont by the average ratio for the Northeast of 0.7518 to obtain estimated values for these states. Having estimated the values for WOWL firms, the values for WL firms can be obtained by subtracting the value for WO firms from the value of the WOWL firm.

Study of Women-Owned & Led Businesses
An Overview of the Data in NWBC’s Special Tabulations
83 Order Number: SBAHQ06F0408 May 7, 2007
Figure 1: Receipts for Women’s Businesses in the Northeast ($1000) and estimation of non-disclosed data
State WO WOWL WL Ratio of
WO/WOWL Connecticut 12215939 15366275 3150336 0.7950
Maine 3282306 5530317 2248011 0.5935 Massachusetts 23133981 28688662 5554681 0.8064
New Hampshire 4665353 7051480
Not 2386127 0.6616
New Jersey 35573077 reported Not Calculated N/A New York 70838360 85902184 15063824 0.8246
Pennsylvania 38998092 49235123 10237031 0.7921 Rhode Island 3640614 4611903
Not 971289 0.7894
Vermont 1454095 reported Not Calculated N/A
Average 0.7518 Standard Deviation 9%
State WO Average Est.
WOWL WO Est. WL
New Jersey
Vermont
35573077
1454095
0.7518 47317184
1934150
35573077
1454095
11744107
480055

Study of Women-Owned & Led Businesses
An Overview of the Data in NWBC’s Special Tabulations
84 Order Number: SBAHQ06F0408 May 7, 2007
Appendix B: Example of Data Limitations Due to Lack of Precision in Reporting of Women-Owned & Led Firms
Figure 2 below displays the total number of WOWL firms as well as the number of WOWL firms whose owners have less than a high school degree by race/ethnicity of the firm’s owner. This figure demonstrates a limitation in how WOWL data are reported, as it shows only percentages of numbers of firms in races/ethnicities rather than providing an actual number. Distribution of firms by the other educational levels and by the race/ethnicity of the owner is reported in a similar manner.
Figure 2: Sample of data on Women Owned & Led firms by Education Level and Race
Total Total Highest Education Level of the Owner Hispanic or Latina origin and race Number Percent Total Total 5,882,687 X Total Hispanic or Latina X 6 Total Not Hispanic or Latina X 94 Total White X 89.6 Total Black or African American X 5.2 Total American Indian and Alaska Native X 1 Total Asian X 5 Total Native Hawaiian and Other Pacific Islander X 0.1 Less than high school graduate Total 292,078 X Less than high school graduate Hispanic or Latina X 23.7 Less than high school graduate Not Hispanic or Latina X 76.3 Less than high school graduate White X 80.7 Less than high school graduate Black or African American X 8.4 Less than high school graduate American Indian and Alaska Native X 1.8 Less than high school graduate Asian X 10.2 Less than high school graduate Native Hawaiian and Other Pacific Islander X 0.2
There is also segmentation within educational levels. The reported percentages of business owners by race at specific educational levels relate to the number of business owners of all races/ethnicities at that specific educational level. For instance, in the figure above, to determine the number of business owners that are Asian and are not high school graduates, one must calculate 10.2 % of 292,078, the total figure for less than high school graduates for all races.
This format of presentation limits analysis of education levels within races/ethnicities, especially races/ethnicities with small numbers. The percentages are accurate only to one significant digit, and some of the smaller races/ethnicities make up less than a 1% of the total. In other words, the numbers are sufficiently accurate for larger races/ethnicities, but

Study of Women-Owned & Led Businesses
An Overview of the Data in NWBC’s Special Tabulations
85 Order Number: SBAHQ06F0408 May 7, 2007
an acceptable level of accuracy for the smaller races/ethnicities would require more significant digits. For instance, Native Hawaiian and Other Pacific Islander WOWL firms comprise 0.1 % of the total number of firms. If we round to one significant digit, the actual figure may be anywhere between 0.06% and 0.14%. The margin of error (0.04%) is very substantial for a race/ethnicity that is only 0.1 %.
The margin of error manifested itself when we analyzed the distribution of firms by education level. When we used the reported percentages to calculate the numbers of Native Hawaiian and Other Pacific Islanders WOWL firms at each level of education and added those numbers together, they exceeded the total number of firms in the entire Native Hawaiian and Other Pacific Islander group by more than 40%.
For this reason we did not produce estimates of Native Hawaiian and Other Pacific Islanders for the distribution of firms by education and race.

Study of Women-Owned & Led Businesses
An Overview of the Data in NWBC’s Special Tabulations
86 Order Number: SBAHQ06F0408 May 7, 2007
Appendix C – Data Tables Data Tables
Following are the data tables for the charts above. Note that when we did not have sufficient data upon which to base an estimate we labeled the cell as ‘N/E’ or ‘not estimated’. An ‘S’ in a text box means that estimates were suppressed when publication standards were not met.
Table 1: Overview of Women’s Businesses (Thousands) All Firms Non-Employer Firms Employer Firms
Women-Owned & Led 7,505 6,296 1,211 Women-Owned 6,489 5,573 917 Women-Led 1,016 724 294
Table A1: Number of Firms – All Women's Businesses by Region (Thousands) Women-Led Women-Owned & Led Women-Owned
Northeast 138 1,405 1,267 Midwest 246 1,637 1,391 South 340 2,586 2,245 West 295 1,887 1,592 U.S. 1,019 7,515 6,495
Table A2: Number of Firms – All Women's Businesses in the Northeast (Thousands) Women-Led Women-Owned & Led Women-Owned
Connecticut 10 92 82 Maine 8 40 33 Massachusetts 15 177 162 New Hampshire 6 37 31 New Jersey 22 208 185 New York* 40 545 505 Pennsylvania 30 257 227 Rhode Island 3 26 23 Vermont 4 23 19

Study of Women-Owned & Led Businesses
An Overview of the Data in NWBC’s Special Tabulations
87 Order Number: SBAHQ06F0408 May 7, 2007
Table A3: Number of Firms – All Women's Businesses in the South (Thousands) Women-Led Women-Owned & Led Women-Owned
Alabama 11 93 82 Arkansas 13 62 50 Delaware 3 18 15 District of Columbia 1 16 16 Florida 63 500 437 Georgia 24 220 196 Kentucky 15 92 77 Louisiana 15 102 87 Maryland 16 154 137 Mississippi 8 55 47 North Carolina 26 200 174 Oklahoma 17 92 75 South Carolina 11 88 77 Tennessee 18 136 118 Texas 74 543 469 Virginia 21 178 157 West Virginia 5 36 31
Table A4: Number of Firms – All Women's Businesses in the Midwest (Thousands) Women-Led Women-Owned & Led Women-Owned
Illinois* 39 324 285 Indiana 22 141 119 Iowa 14 78 64 Kansas 14 73 60 Michigan 33 250 218 Minnesota 24 148 124 Missouri 26 146 120 Nebraska 10 49 39 North Dakota 4 17 13 Ohio 31 261 230 South Dakota 5 21 16 Wisconsin 24 129 104

Study of Women-Owned & Led Businesses
An Overview of the Data in NWBC’s Special Tabulations
88 Order Number: SBAHQ06F0408 May 7, 2007
Table A5: Number of Firms – All Women's Businesses in the West (Thousands) Women-Led Women-Owned & Led Women-Owned
Alaska 4 21 16 Arizona 23 133 110 California* 132 1,002 870 Colorado 27 162 135 Hawaii 6 36 30 Idaho 11 40 29 Montana 8 32 25 Nevada 9 56 48 New Mexico 9 51 42 Oregon 21 109 88 Utah 10 58 48 Washington 32 169 137 Wyoming 4 17 13
Table A6: Number of Firms – All Women’s Businesses by Industry (Thousands) Women-Led Women-Owned & Led Women-Owned
Industries not classified 1 7 6 Other services (except public admin.) 110 1,126 1,016 Accommodation & food services 64 231 167 Arts, entertainment, & recreation 40 329 289 Health care & social assistance 63 1,099 1,036 Educational services 14 206 192 Admin., support, waste mgmt 58 627 569 Mgmt of companies & enterprises 1 3 2 Prof., scientific, & technical services 111 1,046 935 Real estate & rental & leasing 115 619 504 Finance & insurance 29 196 167 Information 12 92 80 Transportation & warehousing 37 148 111 Retail trade 200 1,145 945 Wholesale trade 35 156 121 Manufacturing 31 141 110 Construction 82 283 202 Utilities 1 3 2 Mining 4 18 13 Forestry, fishing & hunting, & ag support 13 38 24

Study of Women-Owned & Led Businesses
An Overview of the Data in NWBC’s Special Tabulations
89 Order Number: SBAHQ06F0408 May 7, 2007
Table A7: Number of Firms – Employer Firms by Industry (Thousands) Women-Owned Women-Owned & Led Women-Led
Industries not classified* 6 not estimated not estimated Other services (except public admin.) 86 109 23 Accommodation & food services 87 126 39 Arts, entertainment, & recreation 17 23 6 Health care & social assistance 116 135 19 Educational services 16 20 4 Admin., support, waste mgmt 61 77 17 Mgmt of companies & enterprises * 2 not estimated not estimated Prof., scientific, & technical services 133 160 27 Real estate & rental & leasing 50 66 16 Finance & insurance 32 40 8 Information 11 15 4 Transportation & warehousing 20 29 10 Retail trade** 146 206 61 Wholesale trade 42 57 15 Manufacturing 40 55 15 Construction 52 82 30 Utilities 0 0 0 Mining 2 2 1 Forestry, fishing & hunting, & ag support 3 5 2
* Not reported in the NWBC Special Tabulations.

Study of Women-Owned & Led Businesses
An Overview of the Data in NWBC’s Special Tabulations
90 Order Number: SBAHQ06F0408 May 7, 2007
Table A8: Number of Firms – Non-Employer Firms by Industry (Thousands) Women-Owned Women-Owned & Led Women-Led
Industries not classified* 0 S not estimated Other services (except public admin.) 930 1017 87 Accommodation & food services 80 104 25 Arts, entertainment, & recreation 272 306 34 Health care & social assistance 920 964 44 Educational services 177 187 10 Admin., support, waste mgmt 509 550 41 Mgmt of companies & enterprises* 0 S not estimated Prof., scientific, & technical services 801 886 85 Real estate & rental & leasing 454 554 99 Finance & insurance 135 155 21 Information 69 78 8 Transportation & warehousing 92 119 27 Retail trade 799 938 140 Wholesale trade 80 100 20 Manufacturing 70 86 16 Construction 150 202 51 Utilities 2 2 0 Mining 12 15 4 Forestry, fishing & hunting, & ag support 22 33 12
* Not reported in the NWBC Special Tabulations. The reported number of Women–Owned firms in these industries is zero. S– Estimates are suppressed when publication standards are not met, such as, the firm count is less than 3, or the relative standard error of the sales and receipts is 50 percent or more.

Study of Women-Owned & Led Businesses
An Overview of the Data in NWBC’s Special Tabulations
91 Order Number: SBAHQ06F0408 May 7, 2007
Table B1: Receipts – All Women’s Businesses by Region ($ Billions) Women-Owned Women-Owned & Led Women-Led
Northeast* 194 246 52 Midwest* 200 274 74 South* 315 405 90 West 230 318 88 * In NWBC Special Tabulations data was not disclosed for certain states. For instance in the Northeast region, data for New Jersey and Vermont was not disclosed; in the Midwest region data for Kansas, Minnesota, North Dakota and South Dakota was not disclosed; in the South region data for Arkansas, Delaware and the District of Columbia was not disclosed. Data is available for all the states in the West region. Concentrance used estimates of the non– disclosed data to calculate regional totals.
Table B2: Receipts – All Women’s Businesses in the Northeast ($ Billions) Women-Owned Women-Owned & Led Women-Led
Connecticut 3 15 12 Maine 2 6 3 Massachusetts 6 29 23 New Hampshire 2 7 5 New Jersey* 12 47 36 New York 15 86 71 Pennsylvania 10 49 39 Rhode Island 1 5 4 Vermont* 1 2 2 * Not reported in NWBC Special Tabulations.
Table B3: Receipts – All Women’s Businesses in the South ($ Billions) Women-Owned Women-Owned & Led Women-Led
Alabama 11 15 3 Arkansas* 6 8 2 Delaware* 2 3 1 District of Columbia* 2 3 1 Florida 61 79 17 Georgia 30 37 7 Kentucky 10 13 4 Louisiana 12 16 4 Maryland 17 21 4 Mississippi 7 9 2 North Carolina 27 34 8 Oklahoma 9 13 4 South Carolina 11 14 3 Tennessee 18 22 5 Texas 66 86 20 Virginia 22 28 6 West Virginia 3 4 1 * Not reported in NWBC Special Tabulations.

Study of Women-Owned & Led Businesses
An Overview of the Data in NWBC’s Special Tabulations
92 Order Number: SBAHQ06F0408 May 7, 2007
Table B4: Receipts – All Women’s Businesses in the Midwest ($ Billions) Women-Owned Women-Owned & Led Women-Led
Illinois 47 61 14 Indiana 17 24 7 Iowa 7 11 4 Kansas* 7 10 3 Michigan 29 39 9 Minnesota* 16 23 6 Missouri 19 26 8 Nebraska 6 8 2 North Dakota* 1 2 1 Ohio 32 43 11 South Dakota* 2 2 1 Wisconsin 18 26 9 * Not reported in NWBC Special Tabulations.
Table B5: Receipts – All Women’s Businesses in the West ($ Billions) Women-Owned Women-Owned & Led Women-Led
Alaska 2 4 1 Arizona 16 22 7 California* 138 183 45 Colorado 16 23 6 Hawaii 5 7 3 Idaho 3 5 2 Montana 2 4 1 Nevada 9 11 3 New Mexico 5 7 3 Oregon 11 16 6 Utah 6 9 3 Washington 17 25 8 Wyoming 1 2 1
Table B6: Receipts per Firm – All Women’s Businesses by Region ($ Thousands) Women-Owned Women-Owned & Led Women-Led
Northeast* 153 175 375 Midwest* 144 167 299 South* 140 157 266 West 145 169 297 National Average 145 166 301 * In NWBC Special Tabulations data was not disclosed for certain states. For instance in the Northeast region, data for New Jersey and Vermont was not disclosed; in the Midwest region data for Kansas, Minnesota, North Dakota and South Dakota was not disclosed; in the South region data for Arkansas, Delaware and the District of Columbia was not disclosed. Data is available for all the states in the West region. Concentrance used estimates of the non– disclosed data to calculate regional totals.

Study of Women-Owned & Led Businesses
An Overview of the Data in NWBC’s Special Tabulations
* Not reported in NWBC Special Tabulation s
93
Order Number: SBAHQ06F0408
May 7, 2007
Table B7: Receipts per Firm – All Women’s Businesses in the Northeast ($ Thousands) Women-Owned Women-Owned & Led Women-Led
Connecticut 149 167 313 Maine 101 138 296 Massachusetts 143 162 362 New Hampshire 150 192 416 New Jersey* 192 228 525 New York 140 158 374 Pennsylvania 172 191 341 Rhode Island 157 178 351 Vermont* 77 84 117 National Average 145 166 301 * Not reported in NWBC Special Tabulations
Table B8: Receipts per Firm – All Women’s Businesses in the South ($ Thousands) Women-Owned Women-Owned & Led Women-Led
Alabama 140 159 301 Arkansas* 128 133 151 Delaware* 132 144 211 District of Columbia* ^ 153 189 883 Florida 140 157 275 Georgia 153 167 277 Kentucky 122 147 271 Louisiana 141 158 255 Maryland 126 139 245 Mississippi 143 161 270 North Carolina 154 171 287 Oklahoma 123 140 212 South Carolina 142 159 276 Tennessee 150 164 258 Texas 140 158 271 Virginia 141 158 286 West Virginia 104 123 247 National Average 145 166 301 * Not reported in NWBC Special Tabulations
Table B9: Receipts per Firm – All Women’s Businesses in the Midwest ($ Thousands) Women-Owned Women-Owned & Led Women-Led
Illinois 164 187 349 Indiana 139 167 316 Iowa 116 144 268 Kansas* 117 133 203 Michigan 134 154 289 Minnesota* 131 153 268 Missouri 154 179 293 Nebraska 149 168 244 North Dakota* 100 107 133 Ohio 141 165 341 South Dakota* 99 104 117 Wisconsin 169 204 357 National Average 145 166 301

Study of Women-Owned & Led Businesses
An Overview of the Data in NWBC’s Special Tabulations
94 Order Number: SBAHQ06F0408 May 7, 2007
Table B10: Receipts per Firm – All Women’s Businesses in the West ($ Thousands) Women-Owned Women-Owned & Led Women-Led
Alaska 144 169 264 Arizona 144 169 292 California 158 182 341 Colorado 121 140 235 Hawaii 153 198 415 Idaho 112 136 203 Montana 87 112 189 Nevada 181 201 310 New Mexico 112 143 296 Oregon 120 148 264 Utah 122 146 260 Washington 126 148 241 Wyoming 87 140 299 National Average 145 166 301
Table B11: Receipts – All Women’s Businesses by Industry ($ Billions) Women-Owned Women-Owned & Led Women-Led
Industries not classified** 1 not estimated not estimated Other services (except public admin.) 36 47 11 Accommodation & food services 39 59 21 Arts, entertainment, & recreation 13 16 4 Health care & social assistance 68 82 13 Educational services 7 10 2 Admin., support, waste mgmt 48 59 11 Mgmt of companies & enterprises 2 2 0.4 Prof., scientific, & technical services 79 96 17 Real estate & rental & leasing 48 63 15 Finance & insurance 27 35 8 Information 22 26 4 Transportation & warehousing 22 31 9 Retail trade 149 224 75 Wholesale trade 210 258 48 Manufacturing 93 124 31 Construction 68 103 34 Utilities* 1 1 0.2 Mining 3 4 1 Forestry, fishing & hunting, & ag support 2 4 2
* Not reported in the NWBC Special Tabulations. ** Not reported in the NWBC Special Tabulations. Due to data limitations Concentrance could not calculate an estimate.

Study of Women-Owned & Led Businesses
An Overview of the Data in NWBC’s Special Tabulations
95 Order Number: SBAHQ06F0408 May 7, 2007
Table B12: Receipts – Employer Firms by Industry ($ Billions) Women-Owned Women-Owned & Led Women-Led
Industries not classified** 1 not estimated not estimated Other services (except public admin.) 20 28 8 Accommodation & food services 36 55 19 Arts, entertainment, & recreation 8 11 3 Health care & social assistance 52 63 12 Educational services* 6 7 2 Admin., support, waste mgmt* 41 50 10 Mgmt of companies & enterprises 2 2 1 Prof., scientific, & technical services 57 70 13 Real estate & rental & leasing 24 32 8 Finance & insurance 22 28 6 Information 20 24 4 Transportation & warehousing 19 26 7 Retail trade 131 200 68 Wholesale trade 206 252 46 Manufacturing 91 121 30 Construction 62 92 30 Utilities* 1 1 0.2 Mining* 3 4 1 Forestry, fishing & hunting, & ag support* 1 2 0.4
* Not reported in the NWBC Special Tabulations. ** Not reported in the NWBC Special Tabulations. Due to data limitations Concentrance could not calculate an estimate.

Study of Women-Owned & Led Businesses
An Overview of the Data in NWBC’s Special Tabulations
96 Order Number: SBAHQ06F0408 May 7, 2007
Table B13: Receipts – Non-Employer Firms by Industry ($ Billions) Women-Owned Women-Owned & Led Women-Led
Industries not classified** - S not estimated Other services (except public admin.) 17 20 3 Accommodation & food services 3 4 2 Arts, entertainment, & recreation 5 6 1 Health care & social assistance 17 18 1 Educational services* 2 2 1 Admin., support, waste mgmt 7 9 1 Mgmt of companies & enterprises** - S not estimated Prof., scientific, & technical services 22 26 4 Real estate & rental & leasing 24 31 7 Finance & insurance 5 7 1 Information 2 2 0.4 Transportation & warehousing 3 5 2 Retail trade 17 25 7 Wholesale trade 4 6 2 Manufacturing 2 3 1 Construction 6 10 4 Utilities* 0.0 0.1 0.0 Mining* 0.4 1 0.1 Forestry, fishing & hunting, & ag support* 1 1 0.2
* Not reported in the NWBC Special Tabulations. ** Not reported in the NWBC Special Tabulations. Due to data limitations Concentrance could not
calculate an estimate. S– Estimates are suppressed when publication standards are not met, such as, the firm count is less than 3, or the relative standard error of the sales and receipts is 50 percent or more.

Study of Women-Owned & Led Businesses
An Overview of the Data in NWBC’s Special Tabulations
97 Order Number: SBAHQ06F0408 May 7, 2007
Table B14: Receipts per Firm – All Women’s Businesses by Industry ($ Thousands) Women Owned Women Owned & Led Women Led
Industries not classified** 125 not estimated not estimated Other services (except public admin.) 36 42 103 Accommodation & food services 232 257 323 Arts, entertainment, & recreation 44 49 89 Health care & social assistance 66 74 213 Educational services 38 46 161 Admin.,support, waste mgmt 84 94 185 Mgmt of companies & enterprises 814 771 619 Prof., scientific, & technical services 85 92 151 Real estate & rental & leasing 96 102 131 Finance & insurance 161 176 268 Information 275 283 337 Transportation & warehousing 201 211 241 Retail trade 158 196 377 Wholesale trade 1734 1654 1376 Manufacturing 844 878 998 Construction 339 362 419 Utilities* 360 376 434 Mining 236 233 223 Forestry, fishing & hunting, & ag support 84 97 123
National Average 145 166 301 * Not reported in the NWBC Special Tabulations. ** Not reported in the NWBC Special Tabulations. Due to data limitations Concentrance could not calculate an estimate.

Study of Women-Owned & Led Businesses
An Overview of the Data in NWBC’s Special Tabulations
98 Order Number: SBAHQ06F0408 May 7, 2007
Table B15: Receipts per Firm – Employer Firms by Industry ($ Thousands) Women Owned Women Owned & Led Women Led
Industries not classified** 523 not estimated not estimated Other services (except public admin.) 1,648 1,587 1,425 Accommodation & food services 2,310 2,294 2,246 Arts, entertainment, & recreation 1,206 1,128 993 Health care & social assistance* 2,286 2,213 2,019 Educational services** 4,941 not estimated not estimated Admin.,support, waste mgmt 903 969 1,127 Mgmt of companies & enterprises** 997 not estimated not estimated Prof., scientific, & technical services 1,887 1,665 1,009 Real estate & rental & leasing 663 688 787 Finance & insurance 486 493 515 Information 429 440 497 Transportation & warehousing 814 799 759 Retail trade 670 649 573 Wholesale trade 347 375 496 Manufacturing 444 470 629 Construction 478 465 429 Utilities* 413 436 487 Mining* 229 258 366 Forestry, fishing & hunting, & ag support* 125 122 116
National Average 876 885 913 * Not reported in the NWBC Special Tabulations. ** Not reported in the NWBC Special Tabulations. Due to data limitations Concentrance could not calculate an estimate.

Study of Women-Owned & Led Businesses
An Overview of the Data in NWBC’s Special Tabulations
99 Order Number: SBAHQ06F0408 May 7, 2007
Table B16: Receipts per Firm – Non-Employer Firms by Industry ($ Thousands) Women Owned Women Owned & Led Women Led
Industries not classified* - S not estimated Other services (except public admin.) 18 19 33 Accommodation & food services 34 40 60 Arts, entertainment, & recreation 17 18 30 Health care & social assistance 18 19 33 Educational services 11 13 60 Admin., support, waste mgmt 15 16 28 Mgmt of companies & enterprises* - not estimated not estimated Prof., scientific, & technical services 27 29 43 Real estate & rental & leasing 53 56 70 Finance & insurance 39 43 69 Information 24 26 45 Transportation & warehousing 32 42 75 Retail trade 22 26 52 Wholesale trade 52 61 98 Manufacturing 27 31 48 Construction 40 52 84 Utilities 27 28 34 Mining 36 35 34 Forestry, fishing & hunting, & ag support 31 26 19 Totals for all sectors 25 28 52
* Not reported in the NWBC Special Tabulations. Due to data limitations Concentrance could not calculate an estimate. S – Estimates are suppressed when publication standards are not met, such as, the firm count is less than 3, or the relative standard error of the sales and receipts is 50 percent or more.
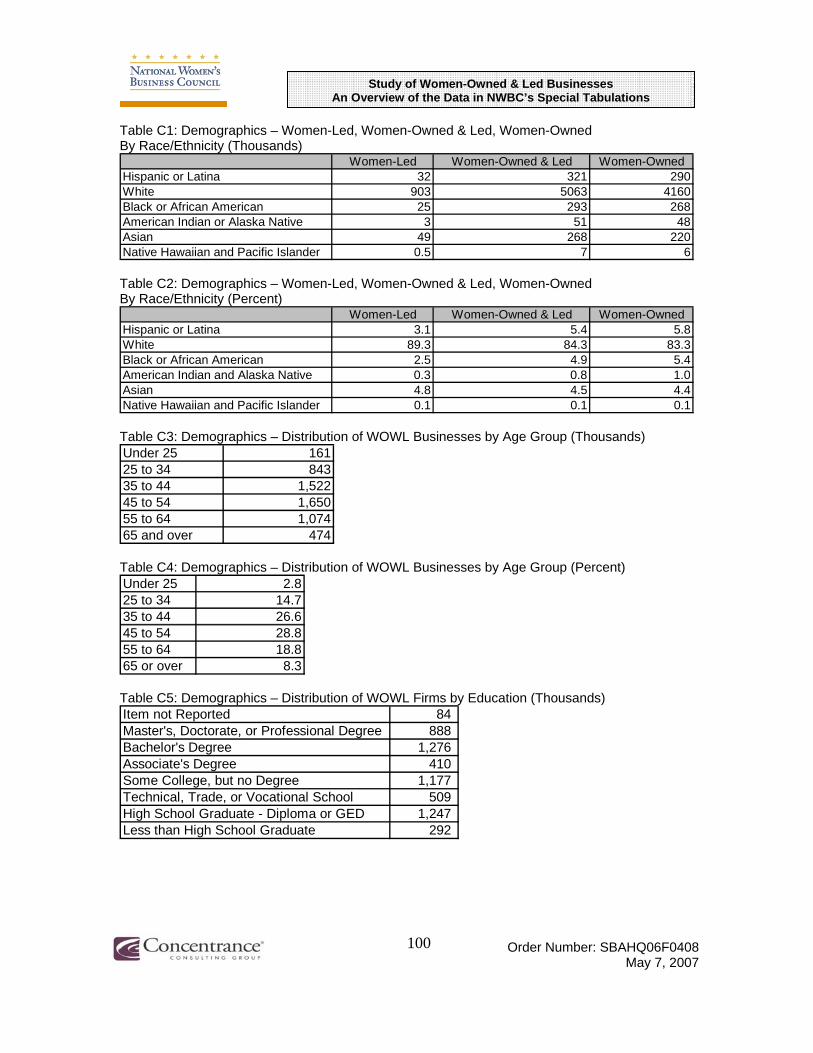
Study of Women-Owned & Led Businesses
An Overview of the Data in NWBC’s Special Tabulations
100 Order Number: SBAHQ06F0408 May 7, 2007
Table C1: Demographics – Women-Led, Women-Owned & Led, Women-Owned By Race/Ethnicity (Thousands)
Women-Led Women-Owned & Led Women-Owned Hispanic or Latina 32 321 290 White 903 5063 4160 Black or African American 25 293 268 American Indian or Alaska Native 3 51 48 Asian 49 268 220 Native Hawaiian and Pacific Islander 0.5 7 6
Table C2: Demographics – Women-Led, Women-Owned & Led, Women-Owned By Race/Ethnicity (Percent)
Women-Led Women-Owned & Led Women-Owned Hispanic or Latina 3.1 5.4 5.8 White 89.3 84.3 83.3 Black or African American 2.5 4.9 5.4 American Indian and Alaska Native 0.3 0.8 1.0 Asian 4.8 4.5 4.4 Native Hawaiian and Pacific Islander 0.1 0.1 0.1
Table C3: Demographics – Distribution of WOWL Businesses by Age Group (Thousands) Under 25 161 25 to 34 843 35 to 44 1,522 45 to 54 1,650 55 to 64 1,074 65 and over 474
Table C4: Demographics – Distribution of WOWL Businesses by Age Group (Percent) Under 25 2.8 25 to 34 14.7 35 to 44 26.6 45 to 54 28.8 55 to 64 18.8 65 or over 8.3
Table C5: Demographics – Distribution of WOWL Firms by Education (Thousands) Item not Reported 84 Master's, Doctorate, or Professional Degree 888 Bachelor's Degree 1,276 Associate's Degree 410 Some College, but no Degree 1,177 Technical, Trade, or Vocational School 509 High School Graduate - Diploma or GED 1,247 Less than High School Graduate 292

Study of Women-Owned & Led Businesses
An Overview of the Data in NWBC’s Special Tabulations
101 Order Number: SBAHQ06F0408 May 7, 2007
Table C6: Demographics – Distribution of WOWL Firms by Education (Percent) Less than High School Graduate 5.0 High School Graduate - Diploma or GED 21.5 Technical, Trade, or Vocational School 8.8 Some College, but no Degree 20.3 Associate's Degree 7.1 Bachelor's Degree 22.0 Master's, Doctorate, or Professional Degree 15.3
Table C7: Demographics – Percent of Firms by Race/Ethnicity by Age Under 25 25 to 34 35 to 44 45 to 54 55 to 64 65 and over
Hispanic or Latina 4.6 20.3 30.2 24.3 12.2 4.0 White 2.7 14.0 25.6 28.1 18.7 8.4 Black or African American 3.3 17.4 27.4 26.4 15.1 6.2 American Indian and Alaska Native 4.1 17.2 28.5 30.9 14.6 4.8 Asian 3.2 18.1 29.5 29.2 13.5 3.9 Native Hawaiian and Pacific Islander 5.5 28.7 51.8 28.1 18.3 8.1

Study of Women-Owned & Led Businesses
An Overview of the Data in NWBC’s Special Tabulations
102 Order Number: SBAHQ06F0408 May 7, 2007
Table C8: Demographics – Education by Race/Ethnicity (Percent) Black or African American Less than High School Graduate 8.2 High School Graduate - Diploma or GED 20.1 Technical, Trade, or Vocational School 9.7 Some College, but no Degree 22.9 Associate's Degree 7.4 Bachelor's Degree 16.7 Master's, Doctorate, or Professional Degree 14.9
White Less than High School Graduate 4.5 High School Graduate - Diploma or GED 21.7 Technical, Trade, or Vocational School 8.9 Some College, but no Degree 20.5 Associate's Degree 7.1 Bachelor's Degree 22.1 Master's, Doctorate, or Professional Degree 15.2
Hispanic or Latina Less than High School Graduate 20.1 High School Graduate - Diploma or GED 23.1 Technical, Trade, or Vocational School 9.6 Some College, but no Degree 18.4 Associate's Degree 6.5 Bachelor's Degree 13.3 Master's, Doctorate, or Professional Degree 9.0
Asian Less than High School Graduate 10.3 High School Graduate - Diploma or GED 19.4 Technical, Trade, or Vocational School 5.6 Some College, but no Degree 13.4 Associate's Degree 5.8 Bachelor's Degree 26.9 Master's, Doctorate, or Professional Degree 18.4
American Indian and Alaska Native Less than High School Graduate 8.9 High School Graduate - Diploma or GED 21.0 Technical, Trade, or Vocational School 7.7 Some College, but no Degree 27.8 Associate's Degree 9.0 Bachelor's Degree 15.1 Master's, Doctorate, or Professional Degree 10.5

Study of Women-Owned & Led Businesses
An Overview of the Data in NWBC’s Special Tabulations
103 Order Number: SBAHQ06F0408 May 7, 2007
Table C9: Demographics – Firms by Education by Age (Percent) Under 25 25 to 34 35 to 44 45 to 54 55 to 64 65 or over
Less than High School Graduate 12.6 3.4 3.5 4.3 6 9.4 High School Graduate - Diploma or GED 23.5 15.4 19.3 20.5 25.2 31.8 Technical, Trade, or Vocational School 9.9 9.7 9.9 8.3 7.9 5.7 Some College, but no Degree 25.8 19.6 18.8 20.4 20.9 20.8 Associate's Degree 6.4 7.9 8.4 7.2 5.4 3.9 Bachelor's Degree 19 29.9 24.5 21 16.8 14.5 Master's, Doctorate, or Professional Degree 1.8 13.4 14.9 17.3 16.9 12.3
Table C10: Demographics – Receipts by Race/Ethnicity ($ Billions) Women-Led Women-Owned & Led Women-Owned
Hispanic or Latina 7 42 35 White 272 1,135 863 Black or African American 3 23 21 American Indian and Alaska Native 0 6 6 Asian 18 72 54 Native Hawaiian and Pacific Islander 0.1 1 1 Publicly held (WOWL) not estimated 6 not estimated
Table C11: Demographics – Receipts per Firm by Race/Ethnicity ($ Thousands) Women-Led Women-Owned & Led Women-Owned
All 301 166 145 Hispanic or Latina 218 74 65 White 300 175 155 Black or African American 103 41 38 American Indian and Alaska Native 154 76 74 Asian 367 185 158 Native Hawaiian and Pacific Islander 114 77 75 Publicly held (WOWL) 2112
Table C12: Demographics – Receipts for Employer Firms by Race/Ethnicity ($ Billions) Women-Led Women-Owned & Led Women-Owned
Hispanic or Latina 6 31 26 White 239 982 743 Black or African American 2 15 13 American Indian and Alaska Native** not estimated not estimated 4 Asian 16 61 45 Native Hawaiian and Pacific Islander** not estimated not estimated 1 Publicly held (WOWL)* not estimated 6 not estimated
Table C13: Demographics – Receipts for Non-Employer Firms by Race/Ethnicity ($ Billions) Women-Led Women-Owned & Led Women-Owned
Hispanic or Latina 1 11 10 White 33 153 120 Black or African American 1 8 8 American Indian and Alaska Native** not estimated not estimated 1 Asian 2 11 9 Native Hawaiian and Pacific Islander** not estimated not estimated 0 Publicly held (WOWL)* 0 0.2 0
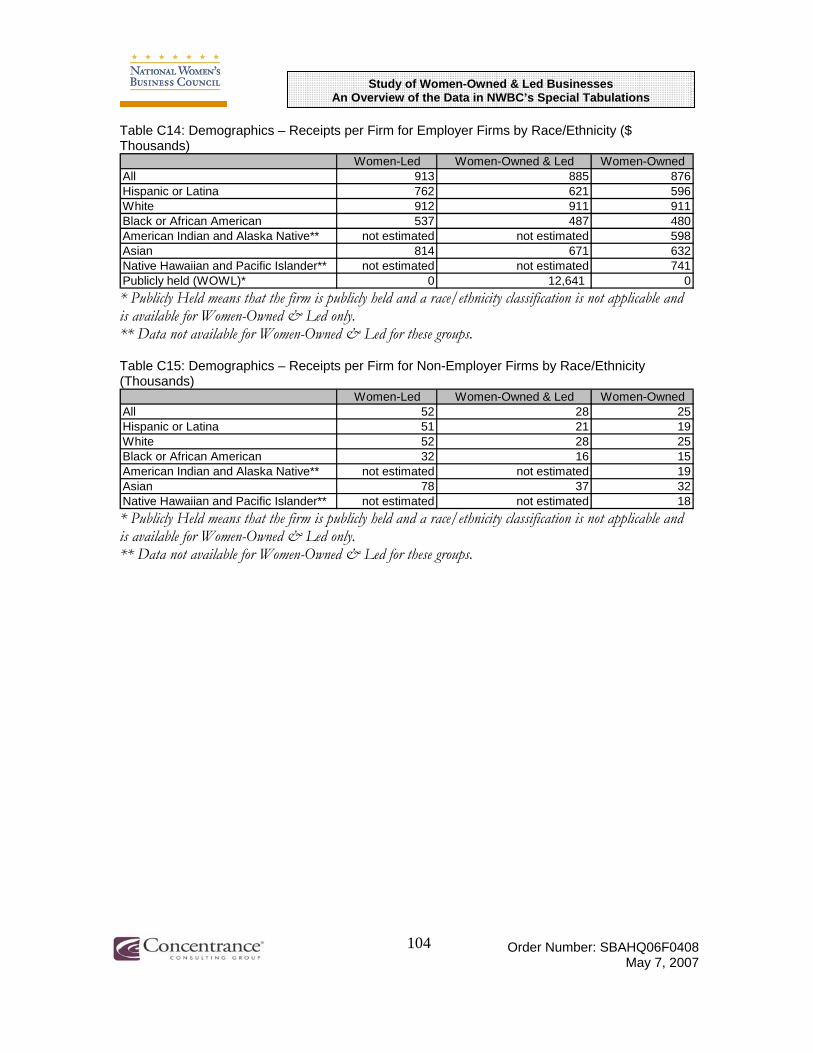
Study of Women-Owned & Led Businesses
An Overview of the Data in NWBC’s Special Tabulations
104 Order Number: SBAHQ06F0408 May 7, 2007
Table C14: Demographics – Receipts per Firm for Employer Firms by Race/Ethnicity ($ Thousands)
Women-Led Women-Owned & Led Women-Owned All 913 885 876 Hispanic or Latina 762 621 596 White 912 911 911 Black or African American 537 487 480 American Indian and Alaska Native** not estimated not estimated 598 Asian 814 671 632 Native Hawaiian and Pacific Islander** not estimated not estimated 741 Publicly held (WOWL)* 0 12,641 0 * Publicly Held means that the firm is publicly held and a race/ethnicity classification is not applicable and is available for Women-Owned & Led only. ** Data not available for Women-Owned & Led for these groups.
Table C15: Demographics – Receipts per Firm for Non-Employer Firms by Race/Ethnicity (Thousands)
Women-Led Women-Owned & Led Women-Owned All 52 28 25 Hispanic or Latina 51 21 19 White 52 28 25 Black or African American 32 16 15 American Indian and Alaska Native** not estimated not estimated 19 Asian 78 37 32 Native Hawaiian and Pacific Islander** not estimated not estimated 18 * Publicly Held means that the firm is publicly held and a race/ethnicity classification is not applicable and is available for Women-Owned & Led only. ** Data not available for Women-Owned & Led for these groups.

Study of Women-Owned & Led Businesses
An Overview of the Data in NWBC’s Special Tabulations
105 Order Number: SBAHQ06F0408 May 7, 2007
Table D1: Customer Type – Distribution of Firms by Customer Type (Thousands) Women-Led Women-Owned & Led Women-Owned
Federal Government 14 102 89 State and Local Government 49 301 252 Export Sales 15 57 42 Other Businesses Organizations 284 1407 1123 Household Consumers Individuals 629 3080 2451 All Others 169 998 829 Item not Reported 49 482 433
Table D2: Customer Type – Firms by Customer Type (Percent) Women-Led Women-Owned & Led Women-Owned
Federal Government 1.1 1.6 1.7 State and Local Government 4.1 4.7 4.8 Export Sales 1.2 0.9 0.8 Other Businesses Organizations 23.5 21.9 21.5 Household Consumers Individuals 52.1 47.9 47.0 All Others 14.0 15.5 15.9 Item not Reported 4.0 7.5 8.3

Study of Women-Owned & Led Businesses
An Overview of the Data in NWBC’s Special Tabulations
106 Order Number: SBAHQ06F0408 May 7, 2007
Tables D3a-f: Customer Type – Firms by Race/Ethnicity (Percent)
Table D3a: Business by Customer Type: Black or African American Firms (Percent) Women-Led Women-Owned & Led Women-Owned
Federal Government 3.0 3.1 3.1 State & Local Government 6.5 7.7 7.8 Export Sales 1.0 1.0 1.0 Other Businesses & Organizations 13.6 13.1 13.0 Household Consumers & Individuals 53.2 41.1 39.9 All Others 15.0 18.4 18.7 Item not Reported 7.6 15.6 16.4
Table D3b: Business by Customer Type: White Firms (Percent) Women-Led Women-Owned & Led Women-Owned
Federal Government 1.4 1.5 1.5 State & Local Government 3.9 4.5 4.6 Export Sales 1.1 0.8 0.7 Other Businesses & Organizations 24.2 22.6 22.3 Household Consumers & Individuals 52.3 48.6 47.7 All Others 13.4 15.0 15.3 Item not Reported 3.6 7.0 7.8
Table D3c: Business by Customer Type: American Indian or Alaska Native Firms (Percent) Women-Led Women-Owned & Led Women-Owned
Federal Government 3.2 3.3 3.3 State & Local Government 7.1 7.4 7.4 Export Sales 0.8 0.9 0.9 Other Businesses & Organizations 16.6 18.7 18.8 Household Consumers & Individuals 51.5 41.8 41.3 All Others 12.9 16.6 16.8 Item not Reported 7.9 11.4 11.6
Table D3d: Business by Customer Type: Native Hawaiian or Pacific Islander Firms (Percent) Women-Led Women-Owned & Led Women-Owned
Federal Government 1.5 4.0 4.2 State & Local Government 3.3 7.2 7.5 Export Sales 8.7 2.6 2.0 Other Businesses & Organizations 25.0 16.2 15.4 Household Consumers & Individuals 52.2 42.7 41.9 All Others 7.7 16.7 17.5 Item not Reported 1.6 10.7 11.5
Table D3e: Business by Customer Type: Asian Firms (Percent) Women-Led Women-Owned & Led Women-Owned
Federal Government 2.1 2.2 2.3 State & Local Government 3.8 3.9 4.0 Export Sales 3.3 2.6 2.4 Other Businesses & Organizations 15.2 18.3 19.0 Household Consumers & Individuals 49.8 42.1 40.3 All Others 20.8 23.3 23.8 Item not Reported 5.0 7.6 8.2

Study of Women-Owned & Led Businesses
An Overview of the Data in NWBC’s Special Tabulations
107 Order Number: SBAHQ06F0408 May 7, 2007
Table D3f: Business by Customer Type: Hispanic or Latina Firms (Percent) Women-Led Women-Owned & Led Women-Owned
Federal Government 2.3 2.4 2.4 State & Local Government 4.8 5.0 5.0 Export Sales 3.2 1.6 1.5 Other Businesses & Organizations 15.7 14.9 14.8 Household Consumers & Individuals 46.4 42.8 42.4 All Others 19.4 19.5 19.5 Item not Reported 8.3 13.8 14.4

Study of Women-Owned & Led Businesses
An Overview of the Data in NWBC’s Special Tabulations
108 Order Number: SBAHQ06F0408 May 7, 2007
Table E1: Average Compensation – Employer Firms in the Northeast ($ Thousands) Women-Led Women-Owned & Led Women-Owned
Connecticut 25 27 27 Maine 23 22 21 Massachusetts* N/E N/E 27 New Hampshire* N/E N/E 23 New Jersey* N/E N/E 29 New York* N/E N/E 27 Pennsylvania 22 23 23 Rhode Island 25 25 25 Vermont 20 19 19 National Average 23 24 24 * Not reported in the NWBC Special Tabulations
Table E2: Average Compensation – Employer Firms in the Northeast: Differences from the National Average ($ Thousands)
Women-Led Women-Owned & Led Women-Owned Connecticut 2 3 3 Maine (0.1) (2) (3) Massachusetts* N/E N/E 3 New Hampshire* N/E N/E (1) New Jersey* N/E N/E 5 New York* N/E N/E 3 Pennsylvania (0.1) (1) (2) Rhode Island 2 1 1 Vermont (3) (4) (5) * Not reported in the NWBC Special Tabulations

Study of Women-Owned & Led Businesses
An Overview of the Data in NWBC’s Special Tabulations
109 Order Number: SBAHQ06F0408 May 7, 2007
Table E3: Average Compensation – Employer Firms in the South ($ Thousands) Women-Led Women-Owned & Led Women-Owned
Alabama 20 21 21 Arkansas 21 20 20 Delaware* N/E N/E 23 District of Columbia N/E N/E N/E Florida 23 23 23 Georgia* N/E N/E 25.5 Kentucky 19 20 21 Louisiana 19 20 20 Maryland* N/E N/E 28 Mississippi 17 18 19 North Carolina 21 22 22 Oklahoma 20 20 20 South Carolina 18 20 21 Tennessee 21 22 23 Texas 21 23 23 Virginia* N/E N/E 26 West Virginia* N/E N/E 20 National Average 23 24 24 * Not reported in the NWBC Special Tabulations
Table E4: Average Compensation – Employer Firms in the South: Differences from the National Average ($ Thousands)
Women-Led Women-Owned & Led Women-Owned Alabama (3) (3) (3) Arkansas (2) (4) (4) Delaware* N/E N/E (1) District of Columbia** N/E N/E N/E Florida 0.1 (1) (2) Georgia* N/E N/E 1 Kentucky (4) (4) (3) Louisiana (3) (4) (4) Maryland* N/E N/E 4 Mississippi (5) (6) (6) North Carolina (2) (2) (2) Oklahoma (3) (4) (5) South Carolina (4) (4) (4) Tennessee (2) (2) (2) Texas (2) (1) (1) Virginia* N/E N/E 1 West Virginia* N/E N/E (4) * Not reported in the NWBC Special Tabulations

Study of Women-Owned & Led Businesses
An Overview of the Data in NWBC’s Special Tabulations
110 Order Number: SBAHQ06F0408 May 7, 2007
Table E5: Average Compensation – Employer Firms in the Midwest ($ Thousands) Women-Led Women-Owned & Led Women-Owned
Illinois* N/E N/E 27 Indiana* N/E N/E 22 Iowa* N/E N/E 19 Kansas* N/E N/E 22 Michigan* 23 24 24 Minnesota* N/E N/E 23 Missouri* N/E N/E 24 Nebraska N/E N/E 23 North Dakota N/E N/E 17 Ohio 22 23 24 South Dakota N/E N/E 17 Wisconsin 22 22 22 National Average 23 24 24 * Not reported in the NWBC Special Tabulations **Table Data for this state is not reported
Table E6: Average Compensation – Employer Firms in the Midwest: Differences from the National Average ($ Thousands)
Women-Led Women-Owned & Led Women-Owned Illinois* N/E N/E 3 Indiana* N/E N/E (2) Iowa* N/E N/E (5) Kansas* N/E N/E (3) Michigan* 0.4 (0.1) (0.3) Minnesota* N/E N/E (1) Missouri* N/E N/E 0 Nebraska N/E N/E (2) North Dakota N/E N/E (7) Ohio (1) (1) (1) South Dakota N/E N/E (7) Wisconsin (1) (2) (3) * Not reported in the NWBC Special Tabulations **Table Data for this state is not reported
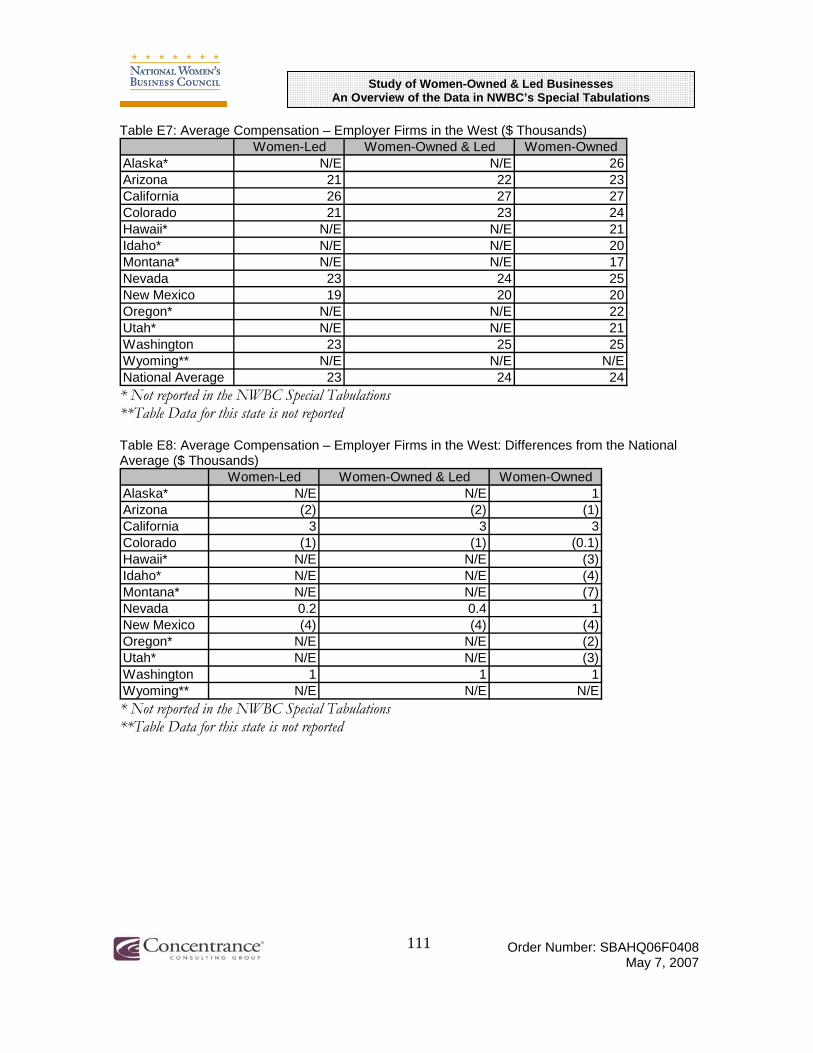
Study of Women-Owned & Led Businesses
An Overview of the Data in NWBC’s Special Tabulations
111 Order Number: SBAHQ06F0408 May 7, 2007
Table E7: Average Compensation – Employer Firms in the West ($ Thousands) Women-Led Women-Owned & Led Women-Owned
Alaska* N/E N/E 26 Arizona 21 22 23 California 26 27 27 Colorado 21 23 24 Hawaii* N/E N/E 21 Idaho* N/E N/E 20 Montana* N/E N/E 17 Nevada 23 24 25 New Mexico 19 20 20 Oregon* N/E N/E 22 Utah* N/E N/E 21 Washington 23 25 25 Wyoming** N/E N/E N/E National Average 23 24 24 * Not reported in the NWBC Special Tabulations **Table Data for this state is not reported
Table E8: Average Compensation – Employer Firms in the West: Differences from the National Average ($ Thousands)
Women-Led Women-Owned & Led Women-Owned Alaska* N/E N/E 1 Arizona (2) (2) (1) California 3 3 3 Colorado (1) (1) (0.1) Hawaii* N/E N/E (3) Idaho* N/E N/E (4) Montana* N/E N/E (7) Nevada 0.2 0.4 1 New Mexico (4) (4) (4) Oregon* N/E N/E (2) Utah* N/E N/E (3) Washington 1 1 1 Wyoming** N/E N/E N/E * Not reported in the NWBC Special Tabulations **Table Data for this state is not reported

Study of Women-Owned & Led Businesses
An Overview of the Data in NWBC’s Special Tabulations
112 Order Number: SBAHQ06F0408 May 7, 2007
Table E9: Average Compensation – Employer Firms by Industry ($ Thousands) Women-Led Women-Owned & Led Women-Owned
Industries not classified* 19 20 20 Other services (except public admin.) 19 17 17 Accommodation & food services 11 11 11 Arts, entertainment, & recreation 17 21 22 Health care & social assistance 22 23 23
Educational services* 17 18 18 Admin., support, waste mgmt 21 20 20
Mgmt of companies & enterprises* 43 44 45 Prof., scientific, & technical services 37 37 37 Real estate & rental & leasing 25 27 28
Finance & insurance 38 39 39 Information 37 38 38 Transportation & warehousing 25 27 28 Retail trade 18 18 18 Wholesale trade 35 34 34 Manufacturing 32 32 32 Construction 32 34 35 Utilities* 34 35 35 Mining* 36 37 37 Forestry, fishing & hunting, & ag support* 14 14 15
National Average 23 24 24 * Not reported in the NWBC Special Tabulations
Table E10: Average Compensation – Employer Firms by Industry: Differences from the National Average ($ Thousands)
Women-Led Women-Owned & Led Women-Owned Industries not classified* (3) (4) (4) Other services (except public admin.) (4) (6) (7) Accommodation & food services (12) (13) (13) Arts, entertainment, & recreation (5) (3) (2) Health care & social assistance (1) (1) (2)
Educational services* (6) (6) (7) Admin., support, waste mgmt (1) (4) (5)
Mgmt of companies & enterprises* 20 20 20 Prof., scientific, & technical services 14 13 13 Real estate & rental & leasing 2 4 4
Finance & insurance 15 15 15 Information 14 14 14 Transportation & warehousing 2 3 4 Retail trade (4) (6) (6) Wholesale trade 13 10 10 Manufacturing 9 8 8 Construction 9 10 11 Utilities* 11 11 11 Mining* 13 13 13 Forestry, fishing & hunting, & ag support* (9) (10) (10)
National Average 23 24 24 * Not reported in the NWBC Special Tabulations

Study of Women-Owned & Led Businesses
An Overview of the Data in NWBC’s Special Tabulations
113 Order Number: SBAHQ06F0408 May 7, 2007
Appendix D – NAICS Codes
Agriculture, Forestry, Fishing and Hunting
The Agriculture, Forestry, Fishing and Hunting sector comprises establishments primarily engaged in growing crops, raising animals, harvesting timber, and harvesting fish and other animals from a farm, ranch, or their natural habitats.
Mining
The Mining sector comprises establishments that extract naturally occurring mineral solids, such as coal and ores; liquid minerals, such as crude petroleum; and gases, such as natural gas.
Utilities
The Utilities sector comprises establishments engaged in the provision of the following utility services: electric power, natural gas, steam supply, water supply, and sewage removal.
Construction
The Construction sector comprises establishments primarily engaged in the construction of buildings or engineering projects (e.g., highways and utility systems). Establishments primarily engaged in the preparation of sites for new construction and establishments primarily engaged in subdividing land for sale as building sites also are included in this sector.
Manufacturing
The Manufacturing sector comprises establishments engaged in the mechanical, physical, or chemical transformation of materials, substances, or components into new products. The assembling of component parts of manufactured products is considered manufacturing, except in cases where the activity is appropriately classified in Sector 23, Construction.
Wholesale Trade
The Wholesale Trade sector comprises establishments engaged in wholesaling merchandise, generally without transformation, and rendering services incidental to the sale of merchandise. The merchandise described in this sector includes the outputs of agriculture, mining, manufacturing, and certain information industries, such as publishing.

Study of Women-Owned & Led Businesses
An Overview of the Data in NWBC’s Special Tabulations
114 Order Number: SBAHQ06F0408 May 7, 2007
Retail Trade
The Retail Trade sector comprises establishments engaged in retailing merchandise, generally without transformation, and rendering services incidental to the sale of merchandise.
Transportation and Warehousing
The Transportation and Warehousing sector includes industries providing transportation of passengers and cargo, warehousing and storage for goods, scenic and sightseeing transportation, and support activities related to modes of transportation. Establishments in these industries use transportation equipment or transportation related facilities as a productive asset. The type of equipment depends on the mode of transportation. The modes of transportation are air, rail, water, road, and pipeline.
Information
The Information sector comprises establishments engaged in the following processes: (a) producing and distributing information and cultural products, (b) providing the means to transmit or distribute these products as well as data or communications, and (c) processing data.
Finance and Insurance
The Finance and Insurance sector comprises establishments primarily engaged in financial transactions (transactions involving the creation, liquidation, or change in ownership of financial assets) and/or in facilitating financial transactions. Three principal types of activities are identified:
Real Estate and Rental and Leasing
The Real Estate and Rental and Leasing sector comprises establishments primarily engaged in renting, leasing, or otherwise allowing the use of tangible or intangible assets, and establishments providing related services. The major portion of this sector comprises establishments that rent, lease, or otherwise allow the use of their own assets by others. The assets may be tangible, as is the case of real estate and equipment, or intangible, as is the case with patents and trademarks.
Professional, Scientific, and Technical Services
The Professional, Scientific, and Technical Services sector comprises establishments that specialize in performing professional, scientific, and technical activities for others. Activities performed include legal advice and representation; accounting, bookkeeping, and payroll

Study of Women-Owned & Led Businesses An Overview of the Data in NWBC’s Special Tabulations
115 Order Number: SBAHQ06F0408 May 7, 2007
services; architectural, engineering, and specialized design services; computer services; consulting services; research services; advertising services; photographic services; translation and interpretation services; veterinary services; and other professional, scientific, and technical services.
Management of Companies and Enterprises
The Management of Companies and Enterprises sector comprises (1) establishments that hold the securities of (or other equity interests in) companies and enterprises for the purpose of owning a controlling interest or influencing management decisions or (2) establishments (except government establishments) that administer, oversee, and manage establishments of the company or enterprise and that normally undertake the strategic or organizational planning and decision-making role of the company or enterprise.
Administrative and Support and Waste Management and Remediation Services
The Administrative and Support and Waste Management and Remediation Services sector comprises establishments performing routine support activities for the day-to-day operations of other organizations. Activities performed include: office administration, hiring and placing of personnel, document preparation and similar clerical services, solicitation, collection, security and surveillance services, cleaning, and waste disposal services.
Educational Services
The Educational Services sector comprises establishments that provide instruction and training in a wide variety of subjects. This instruction and training is provided by specialized establishments, such as schools, colleges, universities, and training centers. These establishments may be privately owned and operated for profit or not for profit, or they may be publicly owned and operated. They may also offer food and accommodation services to their students.
Health Care and Social Assistance
The Health Care and Social Assistance sector comprises establishments providing health care and social assistance for individuals. The sector includes both health care and social assistance because it is sometimes difficult to distinguish between the boundaries of these two activities.
Arts, Entertainment, and Recreation
The Arts, Entertainment, and Recreation sector includes a wide range of establishments that operate facilities or provide services to meet varied cultural, entertainment, and recreational
Study of Women-Owned & Led Businesses
An Overview of the Data in NWBC’s Special Tabulations
116 Order Number: SBAHQ06F0408 May 7, 2007
interests of their patrons. This sector comprises (1) establishments that are involved in producing, promoting, or participating in live performances, events, or exhibits intended for public viewing; (2) establishments that preserve and exhibit objects and sites of historical, cultural, or educational interest; and (3) establishments that operate facilities or provide services that enable patrons to participate in recreational activities or pursue amusement, hobby, and leisure-time interests.
Accommodation and Food Services
The Accommodation and Food Services sector comprises establishments providing customers with lodging and/or preparing meals, snacks, and beverages for immediate consumption. The sector includes both accommodation and food services establishments because the two activities are often combined at the same establishment.
Other Services (except Public Administration)
The Other Services (except Public Administration) sector comprises establishments engaged in providing services not specifically provided for elsewhere in the classification system. Establishments in this sector are primarily engaged in activities, such as equipment and machinery repairing, promoting or administering religious activities, grant making, advocacy, and providing dry cleaning and laundry services, personal care services, death care services, pet care services, photofinishing services, temporary parking services, and dating services.