Embed Size (px)
Citation preview

Arkansas Mathematics StandardsGrades 6-8
2016

Introduction to the Grades 6-8 Arkansas Mathematics Standards
When charged with the task of revising the previous mathematics standards, a group of qualified individuals from across the state came together to craft standards that were specific for the schools and students of Arkansas. The result of this work, the Arkansas Mathematics Standards, is contained in this document. These standards reflect what educators across our state know to be best for our students.
These standards retain the same structure as the previous standards in terms of organization. The standards are organized by domains, clusters, and standards. Domains represent the big ideas that are to be studied at each grade level and sometimes across grade bands. These big ideas support educators in determining the proper amount of focus and instructional time to be given to each of these topics.Clusters represent collections of standards that are grouped together to help educators understand the building blocks of rich and meaningful instructional units. These units help students make connections within clusters and avoid seeing mathematics as a discreet list of skills that they must master. Standards represent the foundational building blocks of math instruction. The standards outlined in this document work together to ensure that students are college and career ready and on track for success.
There are additional similarities shared by these new standards and the previous standards. The main similarity is the structure of the nomenclature. The only change that was made to the naming system was intended to reflect that these standards belong to Arkansas. However, educators may still search for open education resources by using the last part of the label, which will link to the resources for the previous standards. New standards can be found at the end of each cluster in which a new standard was deemed necessary.
Another similarity to the previous standards is the use of the symbols (+) and (*) to distinguish certain standards from others. The plus (+) symbol is used to designate standards that are typically beyond the scope of an Algebra II course. However, some of the plus (+) standards are now included in courses that are not considered to be beyond Algebra II. Standards denoted with the asterisk (*) symbol represent the modeling component of the standards. These standards should be presented in a modeling context where students are required to engage in the modeling process that is outlined in the Standards for Mathematical Practice.
The revision committee opted to include some new elements in the Arkansas Mathematics Standards that represent an attempt at greater clarity and more consistent implementation across the state. Many of the revisions are a rewording of the original Common Core State Standards. The purpose of the rewording is often to help educators better understand the areas of emphasis and focus within the existing standard. Likewise, many of the standards are separated into a bulleted list of content. This does not mean that teachers should treat this content as a checklist of items that they must teach one at a time. The content was bulleted out so that teachers can better understand all that is included in some of the broader standards.

3
Many of the examples that were included in the original standards were either changed for clarity or separated from the body of the actual standard. The committee wanted educators to understand that the examples included in the body of the standards document in no way reflect all of the possible examples. Likewise, these examples do not mandate curriculum or problem types. Local districts are free to select the curriculum and instructional methods they think best for their students.
In some instances, notes of clarification were added. These notes were intended to clarify, for teachers, what the expectations are for the student. Likewise, these notes provide instructional guidance as well as limitations so that teachers can better understand the scope of the standard. This will help the educators in determining what is developmentally appropriate for students when they are working with certain standards.
Finally, the Arkansas Mathematics Standards will become a living document. The staff of the Arkansas Department of Education hopes that this document portrays the hard work of the Arkansas educators who took part in the revision process and that it represents an improvement to the previous set of standards. As these standards are implemented across schools in the state, the Arkansas Department of Education welcomes further suggestions related to notes of clarification, examples, professional development needs, and future revisions of the standards.
Abbreviations:Ratios and Proportional Relationships – RP The Number System – NS Expressions and Equations – EE Geometry – G Statistics and Probability – SP Functions – F

Grade 6 – Arkansas Mathematics Standards3
Ratios and Proportional Relationships
Understand ratio concepts and use ratio reasoning to solve problems
AR.Math.Content.6.RP.A.1 Understand the concept of a ratio and use ratio language to describe a ratio relationship between two quantitiesFor example, "The ratio of wings to beaks in the bird house at the zoo was 2:1, because for every 2 wings there was 1 beak." "For every vote candidate A received, candidate C received nearly three votes."
AR.Math.Content.6.RP.A.2 Understand the concept of a unit rate a/b associated with a ratio a:b with b ≠ 0, and use rate language in the context of a ratio relationshipFor example, "This recipe has a ratio of 3 cups of flour to 4 cups of sugar, so there is 3/4 cup of flour for each cup of sugar." "We paid $75 for 15 hamburgers, which is a rate of $5 per hamburger."
Note: Expectations for unit rates in this grade are limited to non-complex fractions.
AR.Math.Content.6.RP.A.3 Use ratio and rate reasoning to solve real-world and mathematical problems (e.g., by reasoning about tables of equivalent ratios, tape diagrams, double number line diagrams, or equations):
Use and create tables to compare equivalent ratios relating quantities with whole-number measurements, find missing values in the tables, and plot the pairs of values on the coordinate plane
Solve unit rate problems including those involving unit pricing and constant speedFor example: If it took 7 hours to mow 4 lawns, then at that rate, how many lawns could be mowed in 35 hours? At what rate were lawns being mowed?
Find a percent of a quantity as a rate per 100 (e.g., 30% of a quantity means 30/100 times the quantity)
Solve problems involving finding the whole, given a part and the percent Use ratio reasoning to convert measurement units; manipulate and transform units
appropriately when multiplying or dividing quantities
Example: How many centimeters are in 7 feet, given that 1 inch ≈ 2.54 cm?
Note: Conversion factors will be given. Conversions can occur both between and across the metric and English system. Estimates are not expected.

Grade 6 – Arkansas Mathematics Standards4
The Number System Apply and extend previous understandings of multiplication and division to divide fractions by fractions
AR.Math.Content.6.NS.A.1 Interpret and compute quotients of fractions Solve word problems involving division of fractions by fractions (e.g., by using various
strategies, including but not limited to, visual fraction models and equations to represent the problem)
For example: Create a story context for (2/3) ÷ (3/4) and use a visual fraction model to show the quotient; use the relationship between multiplication and division to explain that (2/3) ÷ (3/4) = 8/9 because 3/4 of 8/9 is 2/3. How many 3/4-cup servings are in 2/3 of a cup of yogurt?
Note: In general, (a/b) ÷ (c/d) = ad/bc.
The Number System Compute fluently with multi-digit numbers and find common factors and multiples
AR.Math.Content.6.NS.B.2 Use computational fluency to divide multi-digit numbers using a standard algorithm
Note: A standard algorithm can be viewed as, but should not be limited to, the traditional recording system. A standard algorithm denotes any valid base-ten strategy.
AR.Math.Content.6.NS.B.3 Use computational fluency to add, subtract, multiply, and divide multi-digit decimals and fractions using a standard algorithm for each operation
Note: A standard algorithm can be viewed as, but should not be limited to, the traditional recording system. A standard algorithm denotes any valid base-ten strategy.
AR.Math.Content.6.NS.B.4 Find the greatest common factor of two whole numbers less than or equal to 100 using prime factorization as well as other methods
Find the least common multiple of two whole numbers less than or equal to 12 using prime factorization as well as other methods
Use the distributive property to express a sum of two whole numbers 1-100 with a common factor as a multiple of a sum of two whole numbers with no common factor For example, express 36 + 8 as 4 (9 + 2).

Grade 6 – Arkansas Mathematics Standards
5
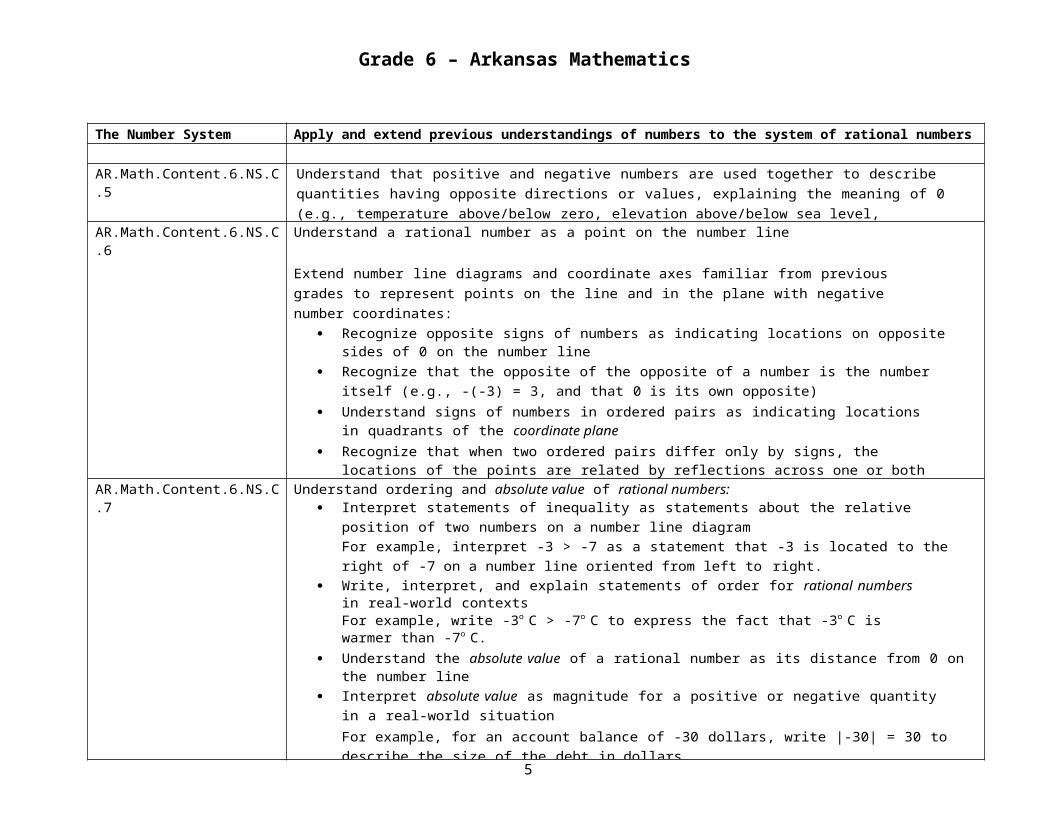
The Number System Apply and extend previous understandings of numbers to the system of rational numbers
AR.Math.Content.6.NS.C.5 Understand that positive and negative numbers are used together to describe quantities having opposite directions or values, explaining the meaning of 0 (e.g., temperature above/below zero, elevation above/below sea level, credits/debits, positive/negative electric charge)
AR.Math.Content.6.NS.C.6 Understand a rational number as a point on the number line
Extend number line diagrams and coordinate axes familiar from previous grades to represent points on the line and in the plane with negative number coordinates:
Recognize opposite signs of numbers as indicating locations on opposite sides of 0 on the number line
Recognize that the opposite of the opposite of a number is the number itself (e.g., -(-3) = 3, and that 0 is its own opposite)
Understand signs of numbers in ordered pairs as indicating locations in quadrants of the coordinate plane
Recognize that when two ordered pairs differ only by signs, the locations of the points are related by reflections across one or both axes
Find and position integers and other rational numbers on a horizontal or vertical number line diagram Find and position pairs of integers and other rational numbers on a coordinate plane
AR.Math.Content.6.NS.C.7 Understand ordering and absolute value of rational numbers: Interpret statements of inequality as statements about the relative position of two numbers on a
number line diagram For example, interpret -3 > -7 as a statement that -3 is located to the right of -7 on a number line oriented from left to right.
Write, interpret, and explain statements of order for rational numbers in real-world contextsFor example, write -3o C > -7o C to express the fact that -3o C is warmer than -7o C.
Understand the absolute value of a rational number as its distance from 0 on the number line Interpret absolute value as magnitude for a positive or negative quantity in a real-world situation
For example, for an account balance of -30 dollars, write |-30| = 30 to describe the size of the debt in dollars.
Distinguish comparisons of absolute value from statements about orderFor example, recognize that an account balance less than -30 dollars represents a debt greater than 30 dollars.

Grade 6 – Arkansas Mathematics Standards
6
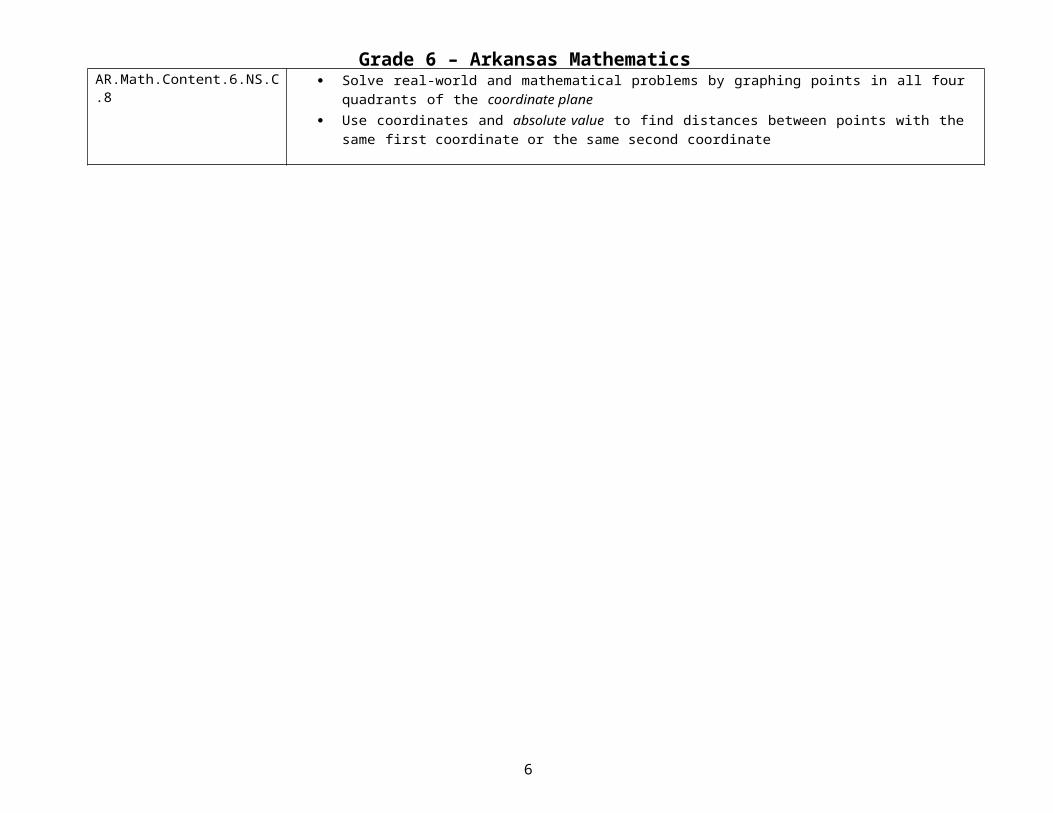
AR.Math.Content.6.NS.C.8 Solve real-world and mathematical problems by graphing points in all four quadrants of the coordinate plane
Use coordinates and absolute value to find distances between points with the same first coordinate or the same second coordinate
Grade 6 – Arkansas Mathematics Standards7
Expressions and Equations Apply and extend previous understandings of arithmetic to algebraic expressions
AR.Math.Content.6.EE.A.1 Write and evaluate numerical expressions involving whole-number exponents
AR.Math.Content.6.EE.A.2 Write, read, and evaluate expressions in which letters (variables) stand for numbers: Write expressions that record operations with numbers and with letters standing for numbers
For example, express the calculation ‘subtract y from 5’ or ‘y less than 5’ as 5 - y. Identify parts of an expression using mathematical terms (sum, term, product, factor, quotient,
coefficient); view one or more parts of an expression as a single entity For example, describe the expression 2 (8 + 7) as a product of two factors; view (8 + 7) as both a single entity and a sum of two terms.
Evaluate expressions at specific values of their variables Include expressions that arise from formulas used in real-world problems Perform arithmetic operations, including those involving whole-number exponents, in the
conventional order when there are no parentheses to specify a particular order (Order of Operations)
For example, use the formulas involved in measurement such as V = s3 and A = 6s2 to find the volume and surface area of a cube with sides of length s = 1/2.
AR.Math.Content.6.EE.A.3 Apply the properties of operations to generate equivalent expressions
For example: Apply the distributive property to the expression 3(2 + x) to produce the equivalent expression 6 + 3x; apply the distributive property to the expression 24x + 18y to produce the equivalent expression 6(4x + 3y); apply properties of operations to y + y + y to produce the equivalent expression 3y.
Note: Includes but not limited to the distributive property.AR.Math.Content.6.EE.A.4 Identify when two expressions are equivalent (i.e., when the two expressions name the same
number regardless of which value is substituted into them)
For example: The expressions y + y + y and 3y are equivalent because they name the same number regardless of which number y stands for.
Grade 6 – Arkansas Mathematics Standards8
Expressions and Equations Reason about and solve one-variable equations and inequalities
AR.Math.Content.6.EE.B.5 Understand solving an equation or inequality as a process of answering a question: Using substitution, which values from a specified set, if any, make the equation or inequality true?
AR.Math.Content.6.EE.B.6 Use variables to represent numbers and write expressions when solving a real-world or mathematical problem
Understand that a variable can represent an unknown number or any number in a specified set
AR.Math.Content.6.EE.B.7 Solve real-world and mathematical problems by writing and solving equations of the form x + p = q and px = qfor cases in which p, q and x are all nonnegative rational numbers
AR.Math.Content.6.EE.B.8 For real world or mathematical problems: Write an inequality of the form x > c, x ≥ c, x < c, or x ≤ c to represent a constraint or condition Recognize that inequalities of the form x > c or x < c have infinitely many solutions Represent solutions of such inequalities on number line diagrams
Expressions and Equations Represent and analyze quantitative relationships between dependent and independent variables
AR.Math.Content.6.EE.C.9 Use variables to represent two quantities in a real-world problem that change in relationship to one another: Write an equation to express one quantity, thought of as the dependent variable, in terms of the
other quantity, thought of as the independent variable Analyze the relationship between the dependent and independent variables using graphs and
tables, and relate these to the equation
For example: In a problem involving motion at constant speed, list and graph ordered pairs of distances and times, and write the equation d = 65t to represent the relationship between distance and time.
Note: The independent variable is the variable that can be changed; the dependent variable is the variable that is affected by the change in the independent variable.

Grade 6 – Arkansas Mathematics Standards9
Geometry Solve real-world and mathematical problems involving area, surface area, and volume
AR.Math.Content.6.G.A.1 Find the area of right triangles, other triangles, special quadrilaterals, and polygons by composing into rectangles or decomposing into triangles and other shapes
Apply these techniques in the context of solving real-world and mathematical problems
Note: Trapezoids will be defined to be a quadrilateral with at least one pair of opposite sides parallel, therefore all parallelograms are trapezoids.
AR.Math.Content.6.G.A.2 Find the volume of a right rectangular prism including whole number and fractional edge lengths by packing it with unit cubes of the appropriate unit fraction edge lengths, and show that the volume is the same as would be found by multiplying the edge lengths of the prism
Apply the formulas V = l w h and V = B h to find volumes of right rectangular prisms including fractional edge lengths in the context of solving real-world and mathematical problems
AR.Math.Content.6.G.A.3 Apply the following techniques in the context of solving real-world and mathematical problems: Draw polygons in the coordinate plane given coordinates for the vertices Use coordinates to find the length of a side joining points with the same first coordinate or the
same second coordinate
AR.Math.Content.6.G.A.4 Apply the following techniques in the context of solving real-world and mathematical problems: Represent three-dimensional figures using nets made up of rectangles and triangles Use the nets to find the surface area of these figures

10Grade 6 – Arkansas Mathematics Standards
Statistics and Probability Develop understanding of statistical variability
AR.Math.Content.6.SP.A.1 Recognize a statistical question as one that anticipates variability in the data related to the question and accounts for it in the answersFor example, ‘How old am I?’ is not a statistical question, but ‘How old are the students in my school?’ is a statistical question because one anticipates variability in students' ages.
Note: Statistics is also the name for the science of collecting, analyzing and interpreting data. Data are the numbers produced in response to a statistical question and are frequently collected from surveys or other sources (i.e. documents).
AR.Math.Content.6.SP.A.2 Determine center, spread, and overall shape from a set of dataAR.Math.Content.6.SP.A.3 Recognize that a measure of center for a numerical data set summarizes all of its values with a single
number (mean, median, mode), while a measure of variation (interquartile range, mean absolute deviation) describes how its values vary with a single numberExample: If the mean height of the students in the class is 48” are there any students in the class taller than 48”?
Statistics and Probability Summarize and describe distributions
AR.Math.Content.6.SP.B.4 Display numerical data in plots on a number line, including dot plots, histograms, and box plotsAR.Math.Content.6.SP.B.5 Summarize numerical data sets in relation to their context, such as by:
Reporting the number of observations Describing the nature of the attribute under investigation, including how it was measured and its
units of measurement Calculate quantitative measures of center (including but not limited to median and mean)
and variability (including but not limited to interquartile range and mean absolute deviation) Use the calculations to describe any overall pattern and any striking deviations (outliers)
from the overall pattern with reference to the context in which the data were gathered
Note: Instructional focus should be on summarizing and describing data distributions.
Relating the choice of measures of center and variability to the shape of the data distribution and the context in which the data were gathered. For example, demonstrate in the case where there are outliers in the data median would be a better measure of center than the mean.

Grade 7 – Arkansas Mathematics Standards11
Ratios and Proportional Relationships
Analyze proportional relationships and use them to solve real-world and mathematical problems
AR.Math.Content.7.RP.A.1 Compute unit rates associated with ratios of fractions, including ratios of lengths, areas, and other quantities measured in like or different units
For example: If a person walks 1/2 mile in each 1/4 hour, compute the unit rate as the complex fraction 1/2/1/4 miles per hour, equivalently 2 miles per hour.
AR.Math.Content.7.RP.A.2 Recognize and represent proportional relationships between quantities: Decide whether two quantities are in a proportional relationship (e.g., by testing for equivalent
ratios in a table or graphing on a coordinate plane and observing whether the graph is a straight line through the origin)
Identify unit rate (also known as the constant of proportionality) in tables, graphs, equations, diagrams, and verbal descriptions of proportional relationships
Represent proportional relationships by equations (e.g., if total cost t is proportional to the number n of items purchased at a constant price p, the relationship between the total cost and the number of items can be expressed as t = pn)
Explain what a point (x, y) on the graph of a proportional relationship means in terms of the situation, with special attention to the points (0, 0) and (1, r) where r is the unit rate
Note: Unit rate connects to slope concept in 8th grade.
AR.Math.Content.7.RP.A.3 Use proportional relationships to solve multi-step ratio and percent problems
Note: Examples include but are not limited to simple interest, tax, markups and markdowns, gratuities and commissions, fees, percent increase and decrease.

Grade 7 – Arkansas Mathematics Standards12
The Number System Apply and extend previous understandings of operations with fractions
AR.Math.Content.7.NS.A.1 Apply and extend previous understandings of addition and subtraction to add and subtract rational numbers
Represent addition and subtraction on a horizontal or vertical number line diagram: Describe situations in which opposite quantities combine to make 0 and show that a number and
its opposite have a sum of 0 (additive inverses) (e.g., A hydrogen atom has 0 charge because its two constituents are oppositely charged.)
Understand p + q as a number where p is the starting point and q represents a distance from p in the positive or negative direction depending on whether q is positive or negative
Interpret sums of rational numbers by describing real-world contexts (e.g., 3 + 2 means beginning at 3, move 2 units to the right and end at the sum of 5; 3 + (-2) means beginning at 3, move 2 units to the left and end at the sum of 1; 70 + (-30) = 40 could mean after earning $70, $30 was spent on a new video game, leaving a balance of $40)
Understand subtraction of rational numbers as adding the additive inverse, p - q = p + (-q) Show that the distance between two rational numbers on the number line is the absolute value of
their difference and apply this principle in real-world contexts (e.g., the distance between -5 and 6 is 11. -5 and 6 are 11 units apart on the number line)
Fluently add and subtract rational numbers by applying properties of operations as strategiesAR.Math.Content.7.NS.A.2 Apply and extend previous understandings of multiplication and division and of fractions to multiply and divide rational numbers:
Understand that multiplication is extended from fractions to all rational numbers by requiring that operations continue to satisfy the properties of operations, particularly the distributive property, and the rules for multiplying signed numbers
Interpret products of rational numbers by describing real-world contexts Understand that integers can be divided, provided that the divisor is not zero, and every quotient of
integers (with non-zero divisor) is a rational number (e.g., if p and q are integers, then -(p/q) = (-p)/q = p/(-q))
Interpret quotients of rational numbers by describing real-world contexts Fluently multiply and divide rational numbers by applying properties of operations as strategies Convert a fraction to a decimal using long division Know that the decimal form of a fraction terminates in 0s or eventually repeats
AR.Math.Content.7.NS.A.3 Solve real-world and mathematical problems involving the four operations with rational numbers, including but not limited to complex fractions

Grade 7 – Arkansas Mathematics Standards13
Expressions and Equations Use properties of operations to generate equivalent expressions
AR.Math.Content.7.EE.A.1 Apply properties of operations as strategies to add, subtract, expand, and factor linear expressions with rational coefficients
AR.Math.Content.7.EE.A.2 Understand how the quantities in a problem are related by rewriting an expression in different forms
For example: a + 0.05a = 1.05a means that ‘increase by 5%’ is the same as ‘multiply by 1.05’ or the perimeter of a square with side length s can be written as s+s+s+s or 4s.
Expressions and Equations Solve real-life and mathematical problems using numerical and algebraic expressions and equations
AR.Math.Content.7.EE.B.3 Solve multi-step, real-life, and mathematical problems posed with positive and negative rational numbers in any form using tools strategically:
Apply properties of operations to calculate with numbers in any form (e.g., -(1/4)(n-4)) Convert between forms as appropriate (e.g., if a woman making $25 an hour gets a 10% raise,
she will make an additional 1/10 of her salary an hour, or $2.50, for a new salary of $27.50) Assess the reasonableness of answers using mental computation and estimation strategies (e.g.,
if you want to place a towel bar 9 3/4 inches long in the center of a door that is 27 1/2 inches wide, you will need to place the bar about 9 inches from each edge; this estimate can be used as a check on the exact computation)
AR.Math.Content.7.EE.B.4 Use variables to represent quantities in a real-world or mathematical problem Construct simple equations and inequalities to solve problems by reasoning about the quantities Solve word problems leading to equations of these forms px + q = r and p(x + q) = r, where p, q, and r
are specific rational numbers. Solve equations of these forms fluently Write an algebraic solution identifying the sequence of the operations used to mirror the arithmetic
solution (e.g., The perimeter of a rectangle is 54 cm. Its length is 6 cm. What is its width? Subtract 2*6 from 54 and divide by 2; (2*6) + 2w = 54)
Solve word problems leading to inequalities of the form px + q > r or px + q < r, where p, q, and r are specific rational numbers
Graph the solution set of the inequality and interpret it in the context of the problem (e.g., As a salesperson, you are paid $50 per week plus $3 per sale. This week you want your pay to be at least $100. Write an inequality for the number of sales you need to make, and describe the solutions.)

Grade 7 – Arkansas Mathematics Standards14
Geometry Draw construct, and describe geometrical figures and describe the relationships between them
AR.Math.Content.7.G.A.1 Solve problems involving scale drawings of geometric figures, including computing actual lengths and areas from a scale drawing and reproducing a scale drawing at a different scale
Note: This concept ties into ratio and proportion.
AR.Math.Content.7.G.A.2 Draw (freehand, with ruler and protractor, and with technology) geometric shapes with given conditions: Given three measures of angles or sides of a triangle, notice when the conditions determine a
unique triangle, more than one triangle, or no triangle Differentiate between regular and irregular polygons
AR.Math.Content.7.G.A.3 Describe the two-dimensional figures that result from slicing three-dimensional figures, as in plane sections of right rectangular prisms and right rectangular pyramids
Geometry Solve real-life and mathematical problems involving angle measure, area, surface area and volume
AR.Math.Content.7.G.B.4 Know the formulas for the area and circumference of a circle and use them to solve problems. Give an informal derivation of the relationship between the circumference and area of a circle
AR.Math.Content.7.G.B.5 Use facts about supplementary, complementary, vertical, and adjacent angles in a multi-step problem to write and solve simple equations for an unknown angle in a figure
AR.Math.Content.7.G.B.6 Solve real-world and mathematical problems involving area of two-dimensional objects and volume and surface area of three-dimensional objects composed of triangles, quadrilaterals, polygons, cubes, and right prisms

Grade 7 – Arkansas Mathematics Standards15
Statistics and Probability Use random sampling to draw inferences about a population
AR.Math.Content.7.SP.A.1 Understand that: Statistics can be used to gain information about a population by examining a sample of the population Generalizations about a population from a sample are valid only if the sample is representative of
that population Random sampling tends to produce representative samples and support valid inferences
AR.Math.Content.7.SP.A.2 Use data from a random sample to draw inferences about a population with a specific characteristic Generate multiple samples (or simulated samples) of the same size to gauge the variation in
estimates or predictions
For example: Estimate the mean word length in a book by randomly sampling words from the book, or predict the winner of a school election based on randomly sampled survey data. Gauge how far off the estimate or prediction might be.
Statistics and Probability Draw informal comparative inferences about two populations
AR.Math.Content.7.SP.B.3 Draw conclusions about the degree of visual overlap of two numerical data distributions with similar variability such as interquartile range or mean absolute deviation, expressing the difference between the centers as a multiple of a measure of variability such as mean, median, or mode
For example: The mean height of players on the basketball team is 10 cm greater than the mean height of players on the soccer team, about twice the variability on either team; on a dot plot, the separation between the two distributions of heights is noticeable.
AR.Math.Content.7.SP.B.4 Draw informal comparative inferences about two populations using measures of center and measures of variability for numerical data from random samples
For example: Decide whether the words in a chapter of a seventh-grade science book are generally longer than the words in a chapter of a fourth-grade science book.

Grade 7 – Arkansas Mathematics Standards16
Statistics and Probability Investigate chance processes and develop, use, and evaluate probability models
AR.Math.Content.7.SP.C.5 Understand that the probability of a chance event is a number between 0 and 1 that expresses the likelihood of the event occurring
A probability near 0 indicates an unlikely event, a probability around 1/2 indicates an event that is neither unlikely nor likely, and a probability near 1 indicates a likely event
AR.Math.Content.7.SP.C.6 Collect data to approximate the probability of a chance event Observe its long-run relative frequency Predict the approximate relative frequency given the probability
For example: When rolling a number cube 600 times, predict that a 3 or 6 would be rolled roughly 200 times, but probably not exactly 200 times.
Note: Emphasis should be given to the relationship between experimental and theoretical probability.
AR.Math.Content.7.SP.C.7 Develop a probability model and use it to find probabilities of events
Compare probabilities from a model to observed frequencies; if the agreement is not good, explain possible sources of the discrepancy:
Develop a uniform probability model, assigning equal probability to all outcomes, and use the model to determine probabilities of events (e.g., If a student is selected at random from a class of 6 girls and 4 boys, the probability that Jane will be selected is .10 and the probability that a girl will be selected is .60.)
Develop a probability model, which may not be uniform, by observing frequencies in data generated from a chance process (e.g., Find the approximate probability that a spinning penny will land heads up or that a tossed paper cup will land open-end down. Do the outcomes for the spinning penny appear to be equally likely based on the observed frequencies?)
AR.Math.Content.7.SP.C.8 Find probabilities of compound events using organized lists, tables, tree diagrams, and simulation: Understand that, just as with simple events, the probability of a compound event is the fraction
of outcomes in the sample space for which the compound event occurs Represent sample spaces for compound events using methods such as organized lists, tables
and tree diagrams Identify the outcomes in the sample space which compose the event
Generate frequencies for compound events using a simulation (e.g., What is the frequency of pulling a red card from a deck of cards and rolling a 5 on a die?)

Grade 8 - Arkansas Mathematics Standards17
The Number System Know that there are numbers that are not rational, and approximate them by rational numbers
AR.Math.Content.8.NS.A.1 Know that numbers that are not rational are called irrational: Understand that every number has a decimal expansion
For example: 2=2.00…
Write a fraction a/b as a repeating decimal Write a repeating decimal as a fraction
AR.Math.Content.8.NS.A.2 Use rational approximations of irrational numbers to compare the size of irrational numbers, locate them approximately on a number line diagram, and estimate the value of expressions (e.g., π2)
For example: By truncating the decimal expansion of √2, show that √2 is between 1 and 2, then between 1.4 and 1.5, and explain how to continue on to get better approximations.

Grade 8 - Arkansas Mathematics Standards18
Expressions and Equations Work with radicals and integer exponents
AR.Math.Content.8.EE.A.1 Know and apply the properties of integer exponents to generate equivalent numerical expressions using product, quotient, power to a power, or expanded form
AR.Math.Content.8.EE.A.2 Use square root and cube root symbols to represent solutions to equations: Use square root symbols to represent solutions to equations of the form x2= p, where p is a
positive rational numberEvaluate square roots of small perfect squares.
Use cube root symbols to represent solutions to equations of the form x3= p, where p is a rational number. Evaluate square roots and cube roots of small perfect cubes
AR.Math.Content.8.EE.A.3 Use numbers expressed in the form of a single digit times an integer power of 10 to estimate very large or very small quantities, and to express how many times as much one is than the other
For example: Estimate the population of the United States as 3 times 108 and the population of the world as 7 times 109, and determine that the world population is more than 20 times larger.
AR.Math.Content.8.EE.A.4 Perform operations with numbers expressed in scientific notation, including problems where both standard form and scientific notation are used
Use scientific notation and choose units of appropriate size for measurements of very large or very small quantities (e.g., use millimeters per year for seafloor spreading)
Interpret scientific notation that has been generated by technology
Expressions and Equations Understand the connections between proportional relationships, lines, and linear equations
AR.Math.Content.8.EE.B.5 Graph proportional relationships, interpreting the unit rate as the slope of the graph. Compare two different proportional relationships represented in different ways (graphs,
tables, equations)
For example: Compare a distance-time graph to a distance-time equation to determine which of two moving objects has greater speed.

Grade 8 - Arkansas Mathematics Standards
19
AR.Math.Content.8.EE.B.6 Using a non-vertical or non-horizontal line, show why the slope m is the same between any two distinct points by creating similar triangles
Write the equation y=mx + b for a line through the origin Be able to write the equation y = mx + b for a line intercepting the vertical axis at b
Expressions and Equations Analyze and solve linear equations and pairs of simultaneous linear equations
AR.Math.Content.8.EE.C.7 Solve linear equations in one variable: Give examples of linear equations in one variable with one solution, infinitely many solutions, or no
solutionsNote: Show which of these possibilities is the case by successively transforming the given equation into simpler forms, until an equivalent equation of the form x = a, a = a, or a = b results (where a and b are different numbers)
Solve linear equations with rational number coefficients, including equations whose solutions require expanding expressions using the distributive property and collecting like terms
Note: Students should solve equations with variables on both sides.
AR.Math.Content.8.EE.C.8 Analyze and solve pairs of simultaneous linear equations: Find solutions to a system of two linear equations in two variables so they correspond to points
of intersection of their graphs Solve systems of equations in two variables algebraically using simple substitution and by
inspection (e.g., 3x + 2y = 5 and 3x + 2y = 6 have no solution because 3x + 2y cannot simultaneously be 5 and 6)
Solve real-world mathematical problems by utilizing and creating two linear equations in two variables.
For example: Given coordinates for two pairs of points, determine whether the line through the first pair of points intersects the line through the second pair.

20Grade 8 - Arkansas Mathematics Standards
Functions Define, evaluate, and compare functions
AR.Math.Content.8.F.A.1 Understand that a function is a rule that assigns to each input exactly one output The graph of a function is the set of ordered pairs consisting of an input and the corresponding
output
Note: An informal discussion of function notation is needed; however, student assessment is not required.
AR.Math.Content.8.F.A.2 Compare properties (e.g., y-intercept/initial value, slope/rate of change) of two functions each represented in a different way (e.g., algebraically, graphically, numerically in tables, or by verbal descriptions)
For example: Given a linear function represented by a table of values and a linear function represented by an algebraic expression, determine which function has the greater rate of change.
AR.Math.Content.8.F.A.3 Identify the unique characteristics of functions (e.g., linear, quadratic, and exponential) by comparing their graphs, equations, and input/output tables
Functions Use functions to model relationships between quantities
AR.Math.Content.8.F.B.4 Construct a function to model a linear relationship between two quantities: Determine the rate of change and initial value of the function from:
o a verbal description of a relationshipo two (x, y) valueso a tableo a graph
Interpret the rate of change and initial value of a linear function in terms of the situation it models, and in terms of its graph or a table of values
AR.Math.Content.8.F.B.5 Describe the functional relationship between two quantities by analyzing a graph (e.g., where the function is increasing or decreasing, linear or nonlinear)
Sketch a graph that exhibits the features of a function that has been described verbally

21Grade 8 - Arkansas Mathematics Standards
Geometry Understand congruence and similarity using physical models, transparencies, or geometry software
AR.Math.Content.8.G.A.1 Verify experimentally the properties of rotations, reflections, and translations: Lines are taken to lines, and line segments to line segments of the same length Angles are taken to angles of the same measure Parallel lines are taken to parallel lines
AR.Math.Content.8.G.A.2 Understand that a two-dimensional figure is congruent to another if the second can be obtained from the first by a sequence of rotations, reflections, and translations
Given two congruent figures, describe a sequence that exhibits the congruence between themAR.Math.Content.8.G.A.3 Given a two-dimensional figure on a coordinate plane, identify and describe the effect (rule or
new coordinates) of a transformation (dilation, translation, rotation, and reflection): Image to pre-image Pre-image to image
AR.Math.Content.8.G.A.4 Understand that a two-dimensional figure is similar to another if the second can be obtained from the first by a sequence of rotations, reflections, translations, and dilations
Given two similar two-dimensional figures, describe a sequence that exhibits the similarity between them
AR.Math.Content.8.G.A.5 Use informal arguments to establish facts about: The angle sum and exterior angle of triangles
For example: Arrange three copies of the same triangle so that the sum of the three angles appears to form a line.
The angles created when parallel lines are cut by a transversal
For example: Give an argument in terms of translations about the angle relationships.
The angle-angle criterion for similarity of triangles

Grade 8 - Arkansas Mathematics Standards22
Geometry Understand and apply the Pythagorean TheoremAR.Math.Content.8.G.B.6 Model or explain an informal proof of the Pythagorean Theorem and its converseAR.Math.Content.8.G.B.7 Apply the Pythagorean Theorem to determine unknown side lengths in right triangles in real-world
and mathematical problems in two and three dimensionsAR.Math.Content.8.G.B.8 Apply the Pythagorean Theorem to find the distance between two points in a coordinate system
Geometry Solve real-world and mathematical problems involving volume of cylinders, cones, and spheres
AR.Math.Content.8.G.C.9 Develop and know the formulas for the volumes and surface areas of cones, cylinders, and spheres and use them to solve real- world and mathematical problems

Grade 8 - Arkansas Mathematics Standards
23
Statistics and Probability Investigate patterns of association in bivariate data
AR.Math.Content.8.SP.A.1 Construct and interpret scatter plots for bivariate measurement data to investigate patterns of association between two quantities
Describe patterns such as clustering, outliers, positive or negative association, linear association, and nonlinear association
AR.Math.Content.8.SP.A.2 Know that straight lines are widely used to model relationships between two quantitative variables For scatter plots that suggest a linear association, informally fit a straight line, and informally
assess the model fit by judging the closeness of the data points to the line
For example: Identify weak, strong, or no correlation.
AR.Math.Content.8.SP.A.3 Use the equation of a linear model to solve problems in the context of bivariate measurement data, interpreting the slope and intercepts
For example: In a linear model for a biology experiment, interpret a slope of 1.5 cm/hr as meaning that an additional hour of sunlight each day is associated with an additional 1.5 cm in mature plant height.

Grade 8 - Arkansas Mathematics Standards
24
AR.Math.Content.8.SP.A.4 Understand that patterns of association can also be seen in bivariate categorical data by displaying frequencies and relative frequencies in a two-way table
Construct and interpret a two-way table on two categorical variables collected from the same subjects Use relative frequencies calculated for rows or columns to describe possible association
between the two variables
Example: Two-Way Frequency Tablehttp://mathbitsnotebook.com/Algebra1/StatisticsReg/ST2TwoWayTable.html
Example: Two-Way Relative Frequency Table
For example: Students might be asked to interpret from the tables above, if they saw an SUV in the parking lot, would it be more likely to belong to a male or female?
Note: Suggested connections for instruction: Standard 8.NS.1. On the Two-Way Relative Frequency Table, it is not required to include the fractional representation for each value, this is simply provided as an example.

25
GlossaryAbsolute Value A numbers’ distance from 0 on the number line which gives its size, or magnitude, whether the number is positive
or negative (in terms of functions, a piecewise defined function is the absolute value function)Additive Inverses Two numbers whose sum is 0 are additive inverses of one anotherBivariate Data Data that has two variablesComplex Fraction A fraction a/b where either a or b are fractions (b nonzero)Coordinate Plane A plane spanned by the x- and y-axisDependent Variable A variable shows values depend on the values of another variableExperimental Probability The ratio of the number of times an event occurs to the total number of trials or times the activity is performedExponent the power p in an expression of the form ap used to show repeated multiplicationExpression A mathematical phrase consisting of numbers, variables, and operationsFirst Quartile For a data set with median M, the first quartile is the median of the data values less than MFunction A rule or relationship in which there is exactly one output value for each input valueFunction notation A method of writing algebraic variables as function of other variables; for example f(x) = 3x is the same as y = 3xGreatest Common Factor The greatest factor that divides two numbersIndependent Variable A variable whose values don’t depend on changes in other variablesInteger A number expressible in the form of a or – a for some whole number aInterquartile Range A measure of variation in a set of numerical data; the interquartile range is the distance between the first and third
quartiles of the data setIrrational Number A number that cannot be expressed as a fraction p/q for any integers p and q; have decimal expansions that
neither terminate nor become periodicLeast Common Multiple The smallest number that is exactly divisible by each member of a set of numbersMean A measure of center in a set of numerical data, computed by adding the values in a slit then dividing by the
number of values in the listMean Absolute Deviation A measure of variation in a set of numerical data, computed by adding the distances between each data value
and the mean, then dividing by the number of data valuesMedian A measure of center in a set of numerical data; the median of a list of values is the value appearing at the center
of a sorted version of the list – or the mean of the two central values, if the list contains an even number of valuesMode A measure of center in a set of numerical data; the most common value in list of valuesOrder of Operations A set of rules that define which procedures to perform first in order to evaluate a given expressionProbability A number between 0 and 1 used to quantify likelihood for processes that have uncertain outcomes (tossing a
coin, selecting a person at random from a group of people, tossing a ball at a target, or testing for a medical condition)
Ratio The ratio of two number r and s is written r/s, where r is the numerator and s is the denominatorRational Number A number that can be written as a ratio of two integersRelation A set of ordered pairs of dataScale Drawing A drawing with dimensions at a specific ratio relative to the actual size of the objectScatter Plot A graph in the coordinate plane representing a set of bivariate dataStandard Algorithm Denotes any valid base-ten strategyTheoretical Probability The number of ways that the event can occur, divided by the total number of outcomesThird Quartile For a data set with median M, the third quartile is the median of the data values greater than MUnit Rate A comparison of two measurements in which one of the terms has a value of 1Variable A symbol used to represent an unknown or undetermined value in an expression or equation

26
AppendixTable 1: Properties of Operations
Associative property of addition (a + b) + c = a + (b + c)Commutative property of addition a + b = b + aAdditive identity property of 0 a + 0 = 0 + a = aExistence of additive inverses For every a there exists –a so that a + (-a) = (-a) + a = 0Associative property of multiplication (a x b) x c = a x (b x c) *Commutative property of multiplication a x b = b x a *Multiplicative identity property 1 a x 1 = 1a = a *Existence of multiplication inverses For every a ≠ 0 there exists 1/a so that a x 1/a = 1/a x a = 1 *Distributive property of multiplication over addition a x (b + c) = a x b + a x c *
*The x represents multiplication not a variable.
Table 2: Properties of Equality
Reflexive property of equality a = aSymmetric property of equality If a = b, then b = a.Transitive property of equality If a = b and b = c, then a = c.Addition property of equality If a = b, then a + c = b + c.Subtraction property of equality If a = b, then a – c = b – c.Multiplication property of equality If a = b, then a x c = b x c. *Division property of equality If a = b and c ≠ 0, then a ÷ c = b ÷ c.Substitution property of equality If a = b, then b may be substituted for a in any expression containing a.
*The x represents multiplication not a variable.
Table 3: Properties of Inequality
Exactly one of the following is true: a < b, a = b, a > b.If a > b and b > c, then a > c.If a > b, b < a.If a > b, then a + c > b + c.If a > b and c > 0, then a x c > b x c. *If a > b and c < 0, then a x c < b x c. *If a > b and c > 0, then a ÷ c > b ÷ c.If a > b and c < 0, then a ÷ c < b ÷ c.
*The x represents multiplication not a variable.