Embed Size (px)
Citation preview
(A free translation of the original in Portuguese)
Braskem S.A. Financial Statements at December 31, 2010

Braskem S.A. and Subsidiaries Independent Auditor’s Report as of December 31, 2010
Independent Auditor’s Report
on the Financial Statements
To the Board of Directors and Shareholders
Braskem S.A
We have audited the accompanying financial statements of Braskem S.A (“Company” or "Parent Company"),
which comprise the balance sheet as at December 31, 2010 and the statements of income, comprehensive
income changes in equity and cash flows for the year then ended, and a summary of significant accounting
policies and other explanatory information.
We have also audited the accompanying consolidated financial statements of Braskem S.A and its subsidiaries
("Consolidated"), which comprise the consolidated balance sheet as at December 31, 2010 and the consolidated
statements of income, comprehensive income, changes in equity and cash flows for the year then ended, and a
summary of significant accounting policies and other explanatory information.
Management’s responsibility for the financial statements
Management is responsible for the preparation and fair presentation of the parent company financial statements
in accordance with accounting practices adopted in Brazil, and for the consolidated financial statements in
accordance with the International Financial Reporting Standards (IFRS) issued by the International Accounting
Standards Board (IASB) and accounting practices adopted in Brazil, and for such internal control as
management determines is necessary to enable the preparation of financial statements that are free from
material misstatement, whether due to fraud or error.
Auditor’s responsibility
Our responsibility is to express an opinion on these financial statements based on our audit. We conducted our
audit in accordance with Brazilian and International Standards on Auditing. Those standards require that we
comply with ethical requirements and plan and perform the audit to obtain reasonable assurance about whether
the financial statements are free from material misstatement.

Braskem S.A. and Subsidiaries Independent Auditor’s Report as of December 31, 2010
An audit involves performing procedures to obtain audit evidence about the amounts and disclosures in the
financial statements. The procedures selected depend on the auditor’s judgment, including the assessment of the
risks of material misstatement of the financial statements, whether due to fraud or error. In making those risk
assessments, the auditor considers internal control relevant to the entity’s preparation and fair presentation of
the financial statements in order to design audit procedures that are appropriate in the circumstances, but not
for the purpose of expressing an opinion on the effectiveness of the entity’s internal control. An audit also
includes evaluating the appropriateness of accounting policies used and the reasonableness of accounting
estimates made by management, as well as evaluating the overall presentation of the financial statements.
We believe that the audit evidence we have obtained is sufficient and appropriate to provide a basis for our audit
opinion.
Opinion on the parent company financial statements
In our opinion, the parent company financial statements present fairly, in all material respects, the financial
position of Braskem S.A as at December 31, 2010, and its financial performance and cash flows for the year then
ended, in accordance with accounting practices adopted in Brazil.
Opinion on the consolidated financial statements
In our opinion, the consolidated financial statements present fairly, in all material respects, the financial
position of Braskem S.A and its subsidiaries as at December 31, 2010, and their financial performance and cash
flows for the year then ended in accordance with the International Financial Reporting Standards (IFRS) issued
by the International Accounting Standards Board (IASB) and accounting practices adopted in Brazil.
Emphasis of matter
As discussed in Note 2 to these financial statements, the parent company financial statements have been
prepared in accordance with accounting practices adopted in Brazil. In the case of Braskem S.A, these practices
differ from IFRS applicable to separate financial statements only in relation to the measurement of investments
in subsidiaries, associates and jointly-controlled entities based on equity accounting, while IFRS requires
measurement based on cost or fair value.

Braskem S.A. and Subsidiaries Independent Auditor’s Report as of December 31, 2010
Other matters
Statements of value added
We also have audited the parent company and consolidated statements of value added for the year ended December 31, 2010, the presentation of which is required by the Brazilian corporate legislation for listed companies, but is considered supplementary information for IFRS. These statements were subject to the same audit procedures described above and, in our opinion, are fairly presented, in all material respects, in relation to the financial statements taken as a whole. Audit of corresponding amounts in the previous year The audit of the financial statements for the year ended December 31, 2009, presented for comparative purposes, was conducted under the responsibility of other auditors, who issued an unqualified opinion thereon dated February 12, 2010, containing an emphasis of matter paragraph regarding the completion of negotiations for the acquisition of Quattor Participações on January 22, 2010. Our opinion is not qualified due to this issue. As part of our audit of the 2010 financial statements, we have also audited the adjustments described in Note 4 that were made to amend the financial statements of 2009. In our opinion, such adjustments are appropriate and were properly recorded.
Salvador 1, March 16, 2011
PricewaterhouseCoopers
Auditores Independentes
CRC 2SP000160/O-5 "F" BA
Felipe Edmond Ayoub
Contador CRC 1SP187402/O-4 "S" BA

Braskem S.A. and Subsidiaries Balance Sheet at December 31 Amounts in thousands of Brazilian reais (continued)
5
Assets Note 2010 2009 01/01/2009 2010 2009 01/01/2009
Current assets
Cash and cash equivalents 6 2,339,060 2,294,124 2,199,862 2,624,270 2,683,068 2,413,749
Available for sale investments investments 7 - 261,453 331,452 - 261,884 331,452
Held for trading 7 236,319 173,616 187,446 236,319 173,616 187,446
Trade accounts receivable 8 1,077,492 1,402,630 2,027,101 1,894,648 1,666,467 2,126,608
Inventories 9 1,789,505 1,547,165 2,474,277 3,015,657 1,721,755 2,709,206
Taxes recoverable 11 400,969 482,494 582,385 698,879 506,298 612,282
Dividends and interest on capital receivable 10,895 3,736 7,162 - - -
Prepaid expenses 29,690 22,085 65,187 41,620 22,295 65,760
Other accounts receivables 151,410 120,518 114,805 268,905 113,272 123,084
6,035,340 6,307,821 7,989,677 8,780,298 7,148,655 8,569,587
Non-current assets
Held-to-maturity 8 28,706 15,811 9,717 28,706 15,811 9,717
Trade accounts receivable 59,026 58,343 46,666 62,303 58,783 47,129
Taxes recoverable 21 (b) 1,096,497 1,253,889 1,197,710 1,444,401 1,259,801 1,201,816
Deferred income tax and social contribution 12 361,299 1,076,679 1,253,931 1,136,685 1,080,804 1,261,569
Judicial deposits 10 227,888 213,533 163,432 250,195 217,769 167,579
Related parties 2,408,371 70,054 84,055 53,742 100,725 45,953
Other accounts receivable 13 95,780 76,920 64,831 107,432 78,590 66,356
Investments in subsidiaries 13 6,549,402 411,647 381,418 - -
Investment in associated companies 157,910 136,677 127,330 160,790 136,677 127,330
Other investments 14 6,575 6,575 11,770 7,485 8,605 13,702
Property, plant and equipment 15 11,100,184 10,828,453 11,007,463 19,366,272 10,947,678 11,094,020
Intangible assets 2,280,111 2,312,011 2,290,506 3,079,182 2,317,859 2,341,887
24,371,749 16,460,592 16,638,829 25,697,193 16,223,102 16,377,058
Total assets 30,407,089 22,768,413 24,628,506 34,477,491 23,371,757 24,946,645
Parent Company Consolidated

Braskem S.A. and Subsidiaries Balance Sheet at December 31 Amounts in thousands of Brazilian reais (continued)
The accompanying notes are an integral part of these financial statements.
6
Liabilities and Equity Note 2010 2009 01/01/2009 2010 2009 01/01/2009
Current liabilities
Suppliers 4,462,552 3,326,678 4,703,070 5,201,162 3,858,783 4,920,758
Loans and financing 17 1,212,975 1,880,577 3,250,925 1,206,444 1,890,494 3,279,463
Debentures 18 517,741 316,729 26,276 517,741 316,729 26,276
Hedge accounting transactions and other derivatives 19.2 27,618 37,913 - 50,124 79,667 31,531
Salaries and social charges 252,694 258,419 206,202 360,368 267,688 215,085
Taxes payable 20 235,339 1,160,990 101,214 390,062 1,175,672 105,258
Dividends and interest on capital 416,648 2,861 6,604 419,981 2,894 6,708
Advances from customers 44,587 66,434 78,910 50,344 67,388 86,136
Other provisions 22 26,036 30,748 17,395 32,602 30,926 18,869
Other accounts payable 16 125,935 5,394 55,787 233,322 24,835 68,306
Related parties 10 64,517 66,798 - - - -
7,386,642 7,153,541 8,446,383 8,462,150 7,715,076 8,758,390
Non-current liabilities
Suppliers - 23,140 18,675 - 23,229 18,675
Loans and financing 17 9,309,704 7,427,865 9,000,602 11,004,301 7,434,939 9,029,941
Debentures 18 500,000 800,000 - 500,000 800,000
Hedge accounting transactions 19 12,526 - - 34,433 31,579 77,913
Taxes payable 20 1,449,704 1,273,149 1,285,778 1,583,569 1,277,148 1,290,043
Related parties 10 83,739 11,397 115,819 31,386 -
Long-term incentives 23 14,442 7,709 10,453 14,442 7,709 10,453
Deferred income tax and social contribution 21 (b) 1,238,340 1,098,591 166,799 2,200,538 1,098,607 174,942
Private pension plans 24 109,894 96,548 97,135 123,517 109,390 113,774
Allowance for losses in subsidiaries 937 3,798 17,458 - -
Other provisions 22 124,495 130,719 125,463 362,265 132,118 126,348
Other payable 16 237,567 63,312 54,513 252,604 63,318 56,738
12,581,348 10,636,228 11,692,695 15,607,055 10,678,037 11,698,827
Equity
Capital 26 8,043,222 5,473,181 5,375,802 8,043,222 5,473,181 5,375,802
Capital reserves 845,998 416,675 396,064 845,998 416,675 396,064
Revenue reserves 1,338,908 - - 1,338,908 - -
Other comprehensive income 221,350 314,838 361,821 221,350 314,838 361,821
Treasury stock (10,379) (10,376) - (59,271) (10,376) -
Accumulated deficit - (1,215,674) (1,644,259) - (1,215,674) (1,644,259)
Total equity attributable to the shareholders of the company 10,439,099 4,978,644 4,489,428 10,390,207 4,978,644 4,489,428
Non-controlling interest - - - 18,079 - -
10,439,099 4,978,644 4,489,428 10,408,286 4,978,644 4,489,428
Total liabilities and equity 30,407,089 22,768,413 24,628,506 34,477,491 23,371,757 24,946,645
Parent Company Consolidated

Braskem S.A. and Subsidiaries Statement of Operations Years ended December 31
Amounts in thousands of Brazilian reais, except for earnings per share (A free translation of the original in Portuguese)
The accompanying notes are an integral part of these financial statements.
7
Note 2010 2009 2010 2009
Net sales 29 17,152,789 14,602,066 25,494,817 16,136,070
Cost of sales and services rendered (14,109,477) (12,203,495) (21,411,775) (13,529,696)
Gross profit 3,043,312 2,398,571 4,083,042 2,606,374
Income (expenses)
Selling (176,325) (250,831) (383,454) (298,847)
Distribution (299,890) (300,735) (335,510) (300,735)
General and administrative (723,118) (584,751) (969,929) (648,310)
Research and development (55,288) (60,898) (78,778) (63,119)
Equity in the results of investees 13 (c) 439,014 (45,948) 20,302 3,188
Gain from business combinations 5 849,194 102,051 975,283 102,051
Other operating expenses (income), net 30 (43,959) 6,887 (95,995) 3,705
Operating profit before financial incomel result 3,032,940 1,264,346 3,214,961 1,404,307
Financial income (expenses) 31
Financial expenses (1,149,483) 641,495 (1,696,949) 685,439
Financial income 340,732 (156,887) 369,426 (331,330)
(808,751) 484,608 (1,327,523) 354,109
Profit before income and tax
social contribution 2,224,189 1,748,954 1,887,438 1,758,416
Income tax and social contribution - current 21 (a) (20,426) (340,079) (61,536) (353,551)
Income tax and social contribution - deferred 21 (a) (308,454) (1,010,384) 63,583 (1,006,374)
(328,880) (1,350,463) 2,047 (1,359,925)
Net income for the year 1,895,309 398,491 1,889,485 398,491
Attributable to:
Company's shareholders - - 1,895,309 398,491
Non-controlling interest - - (5,824) -
Net income per share at the end of period
Basic earnings per share - common and preferred 2.6497 0.7734
Diluted earnings per share - common and preferred 2.6491 0.7737
Parent Company Consolidated
Braskem S.A. and Subsidiaries Statement of Comprehensive Income Years ended December 31
Amounts in thousands of Brazilian reais (A free translation of the original in Portuguese)
The accompanying notes are an integral part of these financial statements.
8
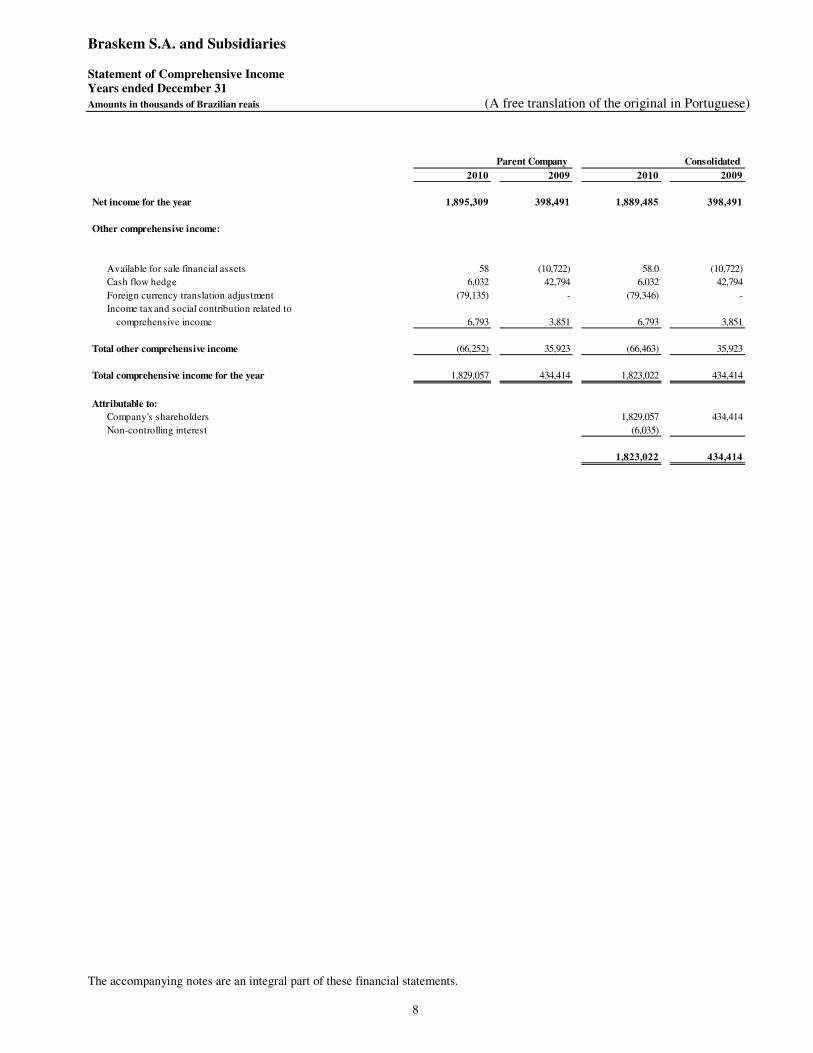
2010 2009 2010 2009
Net income for the year 1,895,309 398,491 1,889,485 398,491
Other comprehensive income:
Available for sale financial assets 58 (10,722) 58.0 (10,722)
Cash flow hedge 6,032 42,794 6,032 42,794
Foreign currency translation adjustment (79,135) - (79,346) -
Income tax and social contribution related to
comprehensive income 6,793 3,851 6,793 3,851
Total other comprehensive income (66,252) 35,923 (66,463) 35,923
Total comprehensive income for the year 1,829,057 434,414 1,823,022 434,414
Attributable to:
Company's shareholders 1,829,057 434,414
Non-controlling interest (6,035)
1,823,022 434,414
Parent Company Consolidated

Braskem S.A. and Subsidiaries Statement of Changes in Equity
Amounts in thousands of Brazilian reais (A free translation of the original in Portuguese)
9 BRASKEM10GHM123 PARTES.DOCX
Parent Company
Retained
Unrealized Additional Other earnings Total
Capital Legal Tax profit proposed comprehensive Treasury (accumulated) shareholders'
Note Capital reserves reserve incentives reserve dividend income shares deficit equity
At December 31, 2008 - previously disclosed 5,375,802 407,964 - - - - (102,100) - (2,001,810) 3,679,856
Adjustment upon initial IFRS adoption 4.3.1(c) - (11,900) - - - - 463,921 - 357,551 809,572
Restated balances at January 1, 2009 5,375,802 396,064 - - - - 361,821 - (1,644,259) 4,489,428
Total comprehensive income for the year:
Net income for the year - - - - - - - - 398,491 398,491
Deferred social contribution on additional price-level restatement
of property, plant and equipment
- - - - - - (55,670) - - (55,670)
Realization of additional property, plant and equipment price-
level restatement, net of taxes 4.4 (c)
- - - - - - (27,236) - 27,236 -
Fair value variation of financial assets - - - - - - (6,871) - - (6,871)
Fair value of cash flow hedges, net of taxes - - - - - - 42,794 - - 42,794
- - - - - - (46,983) - 425,727 378,744
Total shareholders' contributions :
Capital increase 97,379 20,611 - - - - - - - 117,990
Treasury shares 26 (a) - - - - - - - (10,376) - (10,376)
Unclaimed dividends 26 (f) - - - - - - - - 2,858 2,858
97,379 20,611 - - - - - (10,376) 2,858 110,472
At December 31, 2009 5,473,181 416,675 - - - - 314,838 (10,376) (1,215,674) 4,978,644
Total comprehensive income for the year:
Net income for the year - - - - - - - - 1,895,309 1,895,309
Realization of additional property, plant and equipment price-
level restatement, net of taxes 4.4 (c)
- - - - - - (27,236) - 27,236 -
Fair value variation of financial assets - - - - - - 38 - - 38
Fair value of cash flow hedges, net of taxes - - - - - - 12,845 - - 12,845
Foreign currency translation adjustment 13( b) - - - - - - (79,135) - - (79,135)
- - - - - - (93,488) - 1,922,545 1,829,057
Total contributions from and distributions to shareholders:
Capital increase 26 (a) 2,570,041 1,479,294 - - - - - - - 4,049,335
Treasury shares 26 (f) - - - - - - - (3) - (3)
Prescribed dividends/others - - - - - - - - (2,650) (2,650)
Offset of losses - (1,061,871) - - - - - - 1,061,871 -
Transfer to tax incentives reserve 26 (h) - 11,900 - - - - - - (11,900) -
Legal reserve - - 87,710 - - - - - (87,710) -
Minimum mandatory dividends 26 (d) - - - - - - - - (415,284) (415,284)
Additional dividends proposed 26 (g) - - - - - 250,346 - - (250,346) -
Unrealized profit reserves 26 (g) - - - - 995,505 - - - (995,505) -
Tax incentives reserves 26 (g) - - - 5,347 - - - - (5,347) -
26 (g) 2,570,041 429,323 87,710 5,347 995,505 250,346 - (3) (706,871) 3,631,398
At December 31, 2010 8,043,222 845,998 87,710 5,347 995,505 250,346 221,350 (10,379) - 10,439,099
Profit reserves

Braskem S.A. and subsidiaries Statement of Changes in Equity Amounts in thousands of Brazilian reais (continued)
The accompanying notes are an integral part of these financial statements.
10 BRASKEM10GHM123 PARTES.DOCX
Consolidated
Retained Total
Unrealized Additional Other earnings Braskem Total
Capital Legal Tax profit proposed comprehensive Treasury (accumulated) shareholders' Non-controlling shareholders'
Note Capital reserve reserve incentives reserve dividend income stock deficit interest interest equity
At December 31, 2008 - previously disclosed 5,375,802 407,964 - - - - (102,100) - (2,001,810) 3,679,856 - 3,679,856
Adjustment upon initial IFRS adoption 4.3.1(c) - (11,900) - - - - 463,921 - 357,551 809,572 - 809,572
Restated balances at January 1, 2009 5,375,802 396,064 - - - - 361,821 - (1,644,259) 4,489,428 - 4,489,428
Total comprehensive income for the year:
Net income for the year - - - - - - - - 398,491 398,491 - 398,491
Deferred social contribution on additional price-level restatement of property, plant and equipment - - - - - - (55,670) - - (55,670) - (55,670)
Realization of additional property, plant and equipment price-level restatement, net of taxes 4.4 (c) - - - - - - (27,236) - 27,236 - - -
Fair value variation of financial assets - - - - - - (6,871) - - (6,871) - (6,871)
Fair of value of cash flow hedges, net of taxes - - - - - - 42,794 - - 42,794 - 42,794
- - - - - - (46,983) - 425,727 378,744 - 378,744
Total shareholders' contributions :
Capital increase 26 (a) 97,379 20,611 - - - - - - - 117,990 - 117,990
Treasury shares 26 (f) - - - - - - - (10,376) - (10,376) - (10,376)
Prescribed dividends - - - - - - - - 2,858 2,858 - 2,858
97,379 20,611 - - - - - (10,376) 2,858 110,472 - 110,472
At December 31, 2009 5,473,181 416,675 - - - - 314,838 (10,376) (1,215,674) 4,978,644 - 4,978,644
Total comprehensive income for the year:
Net income for the year - - - - - - - - 1,895,309 1,895,309 (5,824) 1,889,485
Realization of additional property, plant and equipment price-level restatement, net of taxes 4.4 (c) - - - - - - (27,236) - 27,236 - - -
Fair value variation of financial assets - - - - - - 38 - - 38 - 38
Fair value of cash flow hedges, net of taxes - - - - - - 12,845 - - 12,845 - 12,845
Foreign currency translation adjustment 13( b) - - - - - - (79,135) - - (79,135) (211) (79,346)
- - - - - - (93,488) - 1,922,545 1,829,057 (6,035) 1,823,022
Total contributions from and distributions to shareholders:
Capital increase 26 (a) 2,570,041 1,479,294 - - - - - - - 4,049,335 - 4,049,335
Treasury shares 26 (f) - - - - - - - (48,892) - (48,892) - (48,892)
Purchase of treasury shares - - - - - - - (3) - (3) - (3)
Prescribed dividends / others - - - - - - - - (2,650) (2,650) - (2,650)
Offset of losses 26 (h) - (1,061,871) - - - - - - 1,061,871 - - -
Transfer to tax incentives reserve - 11,900 - - - - - - (11,900) - - -
Legal reserve 26 (d) - - 87,710 - - - - - (87,710) - - -
Minimum mandatory dividends 26 (g) - - - - - - - - (415,284) (415,284) - (415,284)
Additional dividends proposed 26 (g) - - - - - 250,346 - - (250,346) - - -
Unrealized profit reserves 26 (g) - - - - 995,505 - - - (995,505) - - -
Tax incentives reserve 26 (g) - - - 5,347 - - - - (5,347) - - -
Acquisition of non-controlling interest - - - - - - - - - - 24,114 24,114
2,570,041 429,323 87,710 5,347 995,505 250,346 - (48,895) (706,871) 3,582,506 24,114 3,606,620
At December 31, 2010 8,043,222 845,998 87,710 5,347 995,505 250,346 221,350 (59,271) - 10,390,207 18,079 10,408,286
Attributed to shareholders' interest
Profit reserves

Braskem S.A. and Subsidiaries Statement of Cash Flows Years ended December 31
Amounts in thousands of Brazilian reais (A free translation of the original in Portuguese)
The accompanying notes are an integral part of these financial statements.
11
2010 2009 2010 2009
Profit before income tax and social contribution 2,224,189 1,748,954 1,887,438 1,758,416
Reconciling items:
Depreciation, amortization and depletion 1,036,758 1,028,186 1,606,354 1,038,061
Equity in the results of investees (439,014) 45,948 (20,302) (3,188)
Losses (gains) on investments and others (4,838) (1,565) (4,133) (4,223)
Business combination (849,194) (102,051) (975,283) (102,051)
Provision for losses and write-offs of non-current assets 28,039 75,915 51,342 76,776
Interest, monetary and exchange variations, net 615,497 (904,431) 413,194 (1,108,058)
Other - 283 - 26,894
2,611,437 1,891,239 2,958,610 1,682,627
Changes in operating working capital
Available for Sale and Held-to-maturity (50,460) 8,352 79,764 8,351
Trade accounts receivable 322,674 (879,725) 184,442 (1,044,263)
Inventories (226,778) 973,640 (382,285) 1,035,140
Taxes recoverable 284,139 81,712 622,167 94,372
Prepaid expenses (7,605) 43,434 (5,062) 44,295
Related parties (810,110) 14,001 - -
Other accounts receivable (68,664) (43,540) 1,730 (41,577)
Suppliers 1,112,734 (1,383,122) 683,639 (1,073,838)
Taxes payable (430,828) 405,581 (601,878) 501,718
Long-term incentives 6,733 (2,744) 6,733 (2,744)
Advances from customers (21,847) (16,120) (38,424) (19,218)
Other provisions (10,936) (18,609) 21,128 (17,669)
Other accounts payable 155,701 75,792 177,901 50,116
Cash generated from operations 2,866,190 1,149,891 3,708,465 1,217,310
Interest paid (595,796) (487,762) (929,481) (594,676)
Income tax and social contribution (45,222) (15,590) (58,617) (23,970)
Net cash provided by operating activities 2,225,172 646,539 2,720,367 598,664
Proceeds from the sale of non-current assets 1,781 2,765 1,781 2,949
Additions to investments jointly-controlled and subsidiaries (4,586,233) (50,932) (939,427) 1,464
Additions to property, plant and equipment (1,307,279) (767,128) (1,689,006) (811,740)
Additions to intangible assets - - (17,042) -
Held-to-maturity and available for sale 256,113 (17,346) 256,113 (17,346)
Cash provided by (used in) investing activities (5,635,618) (832,641) (2,387,581) (824,673)
Short-term debt
New loans 358,650 2,177,460 866,097 2,279,801
Repayment of loans (4,839,330) (4,111,651) (10,013,753) (3,010,705)
Long-term debt - - - -
New loans 4,118,701 2,229,247 4,994,464 1,227,188
Related parties - - - -
New loans 484,847 63,603 - -
Repayment of loans (414,277) (77,410) - -
Dividends paid to shareholders (98) (885) (107) (956)
Non-controlling interests - - - -
Repurchase of shares (3) - (3) -
Increase in capital 3,746,892 - 3,764,971 -
Cash provided by (used in) financing activities 3,455,382 280,364 (388,331) 495,328
Exchange variation on cash of foreign subsidiaries - - (3,253) -
Increase (decrease) in cash and cash equivalents 44,936 94,262 (58,798) 269,319
Represented by
Cash and cash equivalents at the beginning of the year 2,294,124 2,199,862 2,683,068 2,413,749
Cash and cash equivalents at the end of the year 2,339,060 2,294,124 2,624,270 2,683,068
Increase (decrease) in cash and cash equivalents 44,936 94,262 (58,798) 269,319
Parent Company Consolidated

Braskem S.A. and Subsidiaries Statement of Cash Flows Years ended December 31
Amounts in thousands of Brazilian reais (A free translation of the original in Portuguese)
The accompanying notes are an integral part of these financial statements.
12
2010 2009 2010 2009
Profit before income tax and social contribution 2,224,189 1,748,954 1,887,438 1,758,416
Reconciling items:
Depreciation, amortization and depletion 1,036,758 1,028,186 1,606,354 1,038,061
Equity in the results of investees (439,014) 45,948 (20,302) (3,188)
Losses (gains) on investments and others (4,838) (1,565) (4,133) (4,223)
Business combination (849,194) (102,051) (975,283) (102,051)
Provision for losses and write-offs of non-current assets 28,039 75,915 51,342 76,776
Interest, monetary and exchange variations, net 615,497 (904,431) 413,194 (1,108,058)
Other - 283 - 26,894
2,611,437 1,891,239 2,958,610 1,682,627
Changes in operating working capital
Available for Sale and Held-to-maturity (50,460) 8,352 79,764 8,351
Trade accounts receivable 322,674 (879,725) 184,442 (1,044,263)
Inventories (226,778) 973,640 (382,285) 1,035,140
Taxes recoverable 284,139 81,712 622,167 94,372
Prepaid expenses (7,605) 43,434 (5,062) 44,295
Related parties (810,110) 14,001 - -
Other accounts receivable (68,664) (43,540) 1,730 (41,577)
Suppliers 1,112,734 (1,383,122) 683,639 (1,073,838)
Taxes payable (430,828) 405,581 (601,878) 501,718
Long-term incentives 6,733 (2,744) 6,733 (2,744)
Advances from customers (21,847) (16,120) (38,424) (19,218)
Other provisions (10,936) (18,609) 21,128 (17,669)
Other accounts payable 155,701 75,792 177,901 50,116
Cash generated from operations 2,866,190 1,149,891 3,708,465 1,217,310
Interest paid (595,796) (487,762) (929,481) (594,676)
Income tax and social contribution (45,222) (15,590) (58,617) (23,970)
Net cash provided by operating activities 2,225,172 646,539 2,720,367 598,664
Proceeds from the sale of non-current assets 1,781 2,765 1,781 2,949
Additions to investments jointly-controlled and subsidiaries (4,586,233) (50,932) (939,427) 1,464
Additions to property, plant and equipment (1,307,279) (767,128) (1,689,006) (811,740)
Additions to intangible assets - - (17,042) -
Held-to-maturity and available for sale 256,113 (17,346) 256,113 (17,346)
Cash provided by (used in) investing activities (5,635,618) (832,641) (2,387,581) (824,673)
Short-term debt
New loans 358,650 2,177,460 866,097 2,279,801
Repayment of loans (4,839,330) (4,111,651) (10,013,753) (3,010,705)
Long-term debt - - - -
New loans 4,118,701 2,229,247 4,994,464 1,227,188
Related parties - - - -
New loans 484,847 63,603 - -
Repayment of loans (414,277) (77,410) - -
Dividends paid to shareholders (98) (885) (107) (956)
Non-controlling interests - - - -
Repurchase of shares (3) - (3) -
Increase in capital 3,746,892 - 3,764,971 -
Cash provided by (used in) financing activities 3,455,382 280,364 (388,331) 495,328
Exchange variation on cash of foreign subsidiaries - - (3,253) -
Increase (decrease) in cash and cash equivalents 44,936 94,262 (58,798) 269,319
Represented by
Cash and cash equivalents at the beginning of the year 2,294,124 2,199,862 2,683,068 2,413,749
Cash and cash equivalents at the end of the year 2,339,060 2,294,124 2,624,270 2,683,068
Increase (decrease) in cash and cash equivalents 44,936 94,262 (58,798) 269,319
Parent Company Consolidated

Braskem S.A. and Subsidiaries Statement of Value-Added Years ended December 31
Amounts in thousands of Brazilian reais (A free translation of the original in Portuguese)
The accompanying notes are an integral part of these financial statements.
13
• The statement of value- added statement is not a required part of a set of financial statements under IFRS.
2010 2009 2010 2009
Revenues 21,031,396 17,769,255 31,217,214 19,549,896
Sale of merchandise, products and services 21,069,290 17,796,341 31,392,470 19,588,832
Other income (expenses), net (27,296) 22,886 (108,360) 22,634
Allowance for doubtful accounts (10,598) (49,972) (66,896) (61,570)
Inputs acquired from third parties (16,458,763) (13,888,075) (24,644,991) (15,401,736)
Cost of products, merchandise and services sold (15,743,445) (12,584,549) (23,687,052) (14,038,168)
Material, energy, outsourced services and other (698,173) (1,274,888) (976,327) (1,334,930)
Loss / recovery of assets (17,145) (28,638) 18,388 (28,638)
Gross value added 4,572,633 3,881,180 6,572,223 4,148,160
Depreciation, amortization and deplention (1,036,758) (1,028,186) (1,606,354) (1,038,061)
Net value added produced by the entity 3,535,875 2,852,994 4,965,869 3,110,099
Value added received in transfer 1,629,421 (109,263) 1,363,071 (232,577)
Equity in the results of investees 439,014 (45,948) 20,302 3,188
Financial income 340,732 (156,887) 369,426 (331,309)
Business combination 849,194 102,051 975,283 102,051
Other 481 (8,479) (1,940) (6,507)
Total value added to distribute 5,165,296 2,743,731 6,328,940 2,877,522
Personnel 485,305 429,012 786,511 472,374
Direct compensation 380,234 313,228 630,795 347,950
Benefits 73,939 78,305 111,486 85,037
FGTS (Unemployment Compensation Fund) 31,132 37,479 44,230 39,387
Taxes, fees and cobtributions 1,486,653 2,367,879 1,781,323 2,499,422
Federal 1,115,770 2,054,866 1,062,174 2,127,067
State 367,890 310,191 704,644 369,615
Municipal 2,993 2,822 14,505 2,740
Remuneration of third-party capital 1,298,029 (451,651) 1,871,621 (492,765)
Financial expenses (including exchange variation) 1,131,747 (673,787) 1,676,227 (718,554)
Rentals 166,282 222,136 195,394 225,789
Remuneration of own capital 1,895,309 398,491 1,889,485 398,491
Earnings reinvested 1,480,025 398,491 1,480,025 398,491
Dividends 415,284 - 415,284 -
Non-controlling interest in earnings reinvested - - (5,824) -
Total value added distributed 5,165,296 2,743,731 6,328,940 2,877,522
Parent Company Consolidated
(A free translation of the original in Portuguese)
Braskem S.A. and Subsidiaries Notes to the Financial Statements at December 31, 2010 and 2009 Amounts in thousands of Brazilian reais, except when otherwise indicated
14
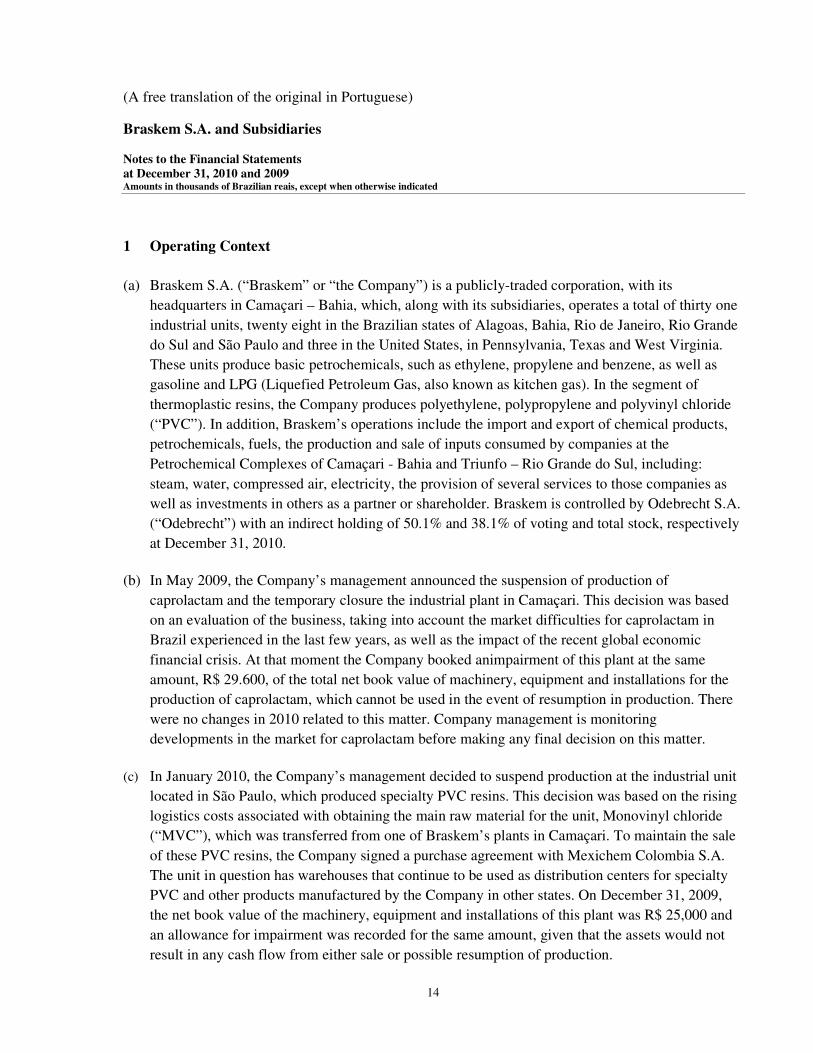
1 Operating Context
(a) Braskem S.A. (“Braskem” or “the Company”) is a publicly-traded corporation, with its
headquarters in Camaçari – Bahia, which, along with its subsidiaries, operates a total of thirty one
industrial units, twenty eight in the Brazilian states of Alagoas, Bahia, Rio de Janeiro, Rio Grande
do Sul and São Paulo and three in the United States, in Pennsylvania, Texas and West Virginia.
These units produce basic petrochemicals, such as ethylene, propylene and benzene, as well as
gasoline and LPG (Liquefied Petroleum Gas, also known as kitchen gas). In the segment of
thermoplastic resins, the Company produces polyethylene, polypropylene and polyvinyl chloride
(“PVC”). In addition, Braskem’s operations include the import and export of chemical products,
petrochemicals, fuels, the production and sale of inputs consumed by companies at the
Petrochemical Complexes of Camaçari - Bahia and Triunfo – Rio Grande do Sul, including:
steam, water, compressed air, electricity, the provision of several services to those companies as
well as investments in others as a partner or shareholder. Braskem is controlled by Odebrecht S.A.
(“Odebrecht”) with an indirect holding of 50.1% and 38.1% of voting and total stock, respectively
at December 31, 2010.
(b) In May 2009, the Company’s management announced the suspension of production of
caprolactam and the temporary closure the industrial plant in Camaçari. This decision was based
on an evaluation of the business, taking into account the market difficulties for caprolactam in
Brazil experienced in the last few years, as well as the impact of the recent global economic
financial crisis. At that moment the Company booked animpairment of this plant at the same
amount, R$ 29.600, of the total net book value of machinery, equipment and installations for the
production of caprolactam, which cannot be used in the event of resumption in production. There
were no changes in 2010 related to this matter. Company management is monitoring
developments in the market for caprolactam before making any final decision on this matter.
(c) In January 2010, the Company’s management decided to suspend production at the industrial unit
located in São Paulo, which produced specialty PVC resins. This decision was based on the rising
logistics costs associated with obtaining the main raw material for the unit, Monovinyl chloride
(“MVC”), which was transferred from one of Braskem’s plants in Camaçari. To maintain the sale
of these PVC resins, the Company signed a purchase agreement with Mexichem Colombia S.A.
The unit in question has warehouses that continue to be used as distribution centers for specialty
PVC and other products manufactured by the Company in other states. On December 31, 2009,
the net book value of the machinery, equipment and installations of this plant was R$ 25,000 and
an allowance for impairment was recorded for the same amount, given that the assets would not
result in any cash flow from either sale or possible resumption of production.

Braskem S.A. and Subsidiaries Notes to the Financial Statements at December 31, 2010 and 2009 Amounts in thousands of Brazilian reais, except when otherwise indicated
15
(d) In September 2010, management of subsidiary Braskem PP Americas, Inc. ("PP Americas")
decided to idle a high-impact copolymer production line at the La Porte plant, located in Texas,
United States. This decision was based on the line's older technology, high production cost and
low production capacity. PP Americas will keep the production of high-impact copolymer on two
other lines at the La Porte plant, without affecting the total production of other resins. As of
December 31, 2010, this production line had a fair value of zero.
(e) On September 24, 2010, the Company inaugurated an ethanol-derived ethylene unit at the Triunfo
Petrochemical Complex (Rio Grande do Sul), which will produce 200,000 tons of green
polyethylene per year. With this new unit, the Company now offers resin from renewable sources
diversifying its competitive raw material sources. The total investment cost was R$ 482,053.
(f) Corporate Reorganization
Since its creation on August 16, 2002, Braskem has undergone an extensive corporate
restructuring process, which has been disclosed to the market in the form of Relevant Fact notices
filed with the Comissão de Valores Mobiliários (“CVM”). The main events in 2009 and 2010 are
summarized below:
(f.1) On April 30, and May 5, 2009, the Extraordinary General Shareholders’ Meetings held by
Braskem and Petroquímica Triunfo S.A. (“Triunfo”), respectively, approved the merger of Triunfo
into the Company. The net asset value merged, at book value, totaled R$ 117,990. A total of
13,387,157 class A preferred shares were issued by Braskem and delivered to shareholders of
Triunfo at an exchange ratio of 0.210428051882238 share of Braskem for each share of Triunfo.
(Note 20.a). This acquisition represents a business combination, as per Accounting
Pronouncement CPC 15 and IFRS 3 and its effects are presented in Note 5.
(f.2) On January 22, 2010, the Company announced the finalization of the negotiations that
resulted in the acquisition of Quattor Participações S.A. (“Quattor”) ( Note 1.f2.iv) by the
Company, in accordance with an Investment Agreement signed on that date between Odebrecht,
Petroleo Brasileiro S.A. – PETROBRAS (“Petrobras”), Braskem and Unipar – União de Indústrias
Petroquímicas S.A. (“Unipar”). The agreement will enable Petrobras to consolidate its main
petrochemical assets in Braskem, which will remain a private-sector publicly-traded company and
improve its ability to compete globally.
In addition, the Investment Agreement gives Braskem first-refusal rights for participating as a
partner in projects involving the Rio de Janeiro Petrochemical Complex (COMPERJ) and the
Suape Petrochemical Complex in Pernambuco.
Braskem S.A. and Subsidiaries Notes to the Financial Statements at December 31, 2010 and 2009 Amounts in thousands of Brazilian reais, except when otherwise indicated
16
The Investment Agreement was sent to the Brazilian Antitrust Agency – CADE (“CADE”) for
review and approval. The Economic Monitoring Office of the Ministry of Finance (SEAE) has
recommended that this acquisition be approved without restrictions by CADE. The Economic Law
Office of the Ministry of Justice (SDE) has also recommended that the transaction be approved
without restrictions. These recommendations were registered by the CADE Attorney’s Office on
January 11, 2011 and approved on February 23, 2011 (Note 37). That transaction was
unanimously approved for this agency.
As of September 30, 2010, the steps already taken in terms of the Investment Agreement include
the following:
(i) The creation of a holding company, BRK Investimentos Petroquímicos S.A. (“BRK”), in
December 2009, to which Odebrecht and Petrobras later transferred all their common shares
in Braskem.
(ii) In April 2010, Odebrecht and Petrobras finalized R$ 3,500,000 share capital increase in BRK
through the issue of new shares paid up in cash.
(iii) On April 14, 2010, the Board of Directors of Braskem ratified the share capital increase in the
Company through a private subscription that resulted in the issue of 243,206,530 common
shares and 16,697,781 class A preferred shares at a unit value of R$ 14.40, for a total of R$
3,742,622, of which R$ 2,378,742 was recorded in the capital stock account and R$ 1,363,880
was recorded in the capital reserve account (Note 26(a)).
(iv) On April 27, 2010, the Company disclosed, in a Relevant Fact notice, the acquisition, together
with Unipar, of shares representing 60% of the total and voting capital of Quattor, through a
cash payment of R$ 659,454. On April 30, 2010, Quattor held the following investments:

Braskem S.A. and Subsidiaries Notes to the Financial Statements at December 31, 2010 and 2009 Amounts in thousands of Brazilian reais, except when otherwise indicated
17
(v) On May 10, 2010, the Company announced the acquisition, from Unipar, of all the shares of
Unipar Comercial e Distribuidora (“Unipar Comercial”) as well as shares representing
33.33% of the total capital of Polibutenos S.A. Indústrias Químicas (“Polibutenos”) for cash
payments of R$ 27,104 and R$ 22,362, respectively.
On May 31, 2010, the Company acquired from Chevron Oronite do Brasil (“Chevron Brasil”), shares representing 33.33% of the total capital of Polibutenos for R$ 22,482. With the acquisitions from Unipar and Chevron Brasil, Braskem now owns, directly and indirectly, 100% of the share capital of Polibutenos. In accordance with the accounting procedures adopted to prepare these financial statements (see Note 2), the acquisitions of Unipar Comercial and Polibutenos represented business combinations, as per Technical Pronouncement - CPC 15 the effects of which are stated in Note 5.
(*)publicly-held company
Quattor
94.10% 65.98%99.32%
Quattor Petroquímica
(*)
5.90%
Quattor Química
Polibutenos
Riopol
BNDESPAR
25.00%
9.02%
33.33%
Non-controlling
shareholders
0.68%

Braskem S.A. and Subsidiaries Notes to the Financial Statements at December 31, 2010 and 2009 Amounts in thousands of Brazilian reais, except when otherwise indicated
18
(vi) On June 18, 2010, the Extraordinary General Shareholders’ Meeting held by Braskem
approved the acquisition of Quattor shares previously held by Petrobras which represented
40% of the total and voting shares of the subsidiary. The net asset value acquired, at book
value on March 31, 2010 was R$ 199,356, of which R$ 164,744 was recorded in the Capital
account and R$ 34,612 was recorded in the Capital reserve account. This operation involved
the issuance of 18,000,087 common shares at an exchange ratio of 0.18855863182 share of
Braskem for each share of Quattor, as established in the economic reports of the companies
prepared by an independent specialist (Note 26(a)). As a result of this acquisition, Braskem
now holds 100% of voting and total capital of Quattor. This operation, along with that
mentioned in item (iv) above, represent business combinations, (as per Technical
Pronouncement CPC 15), the effects of which are stated in Note 5.
(vii) On June 24, 2010, Quattor’s Extraordinary General Shareholders’ Meeting approved an
increase in the capital stock of R$ 4,014,128, without the issue of new shares. The capital
increase was paid up using advances for future capital increase previously made by Braskem.
Additionally, on June 29, 2010, the Extraordinary General Shareholders’ Meeting held by
Quattor approved a R$ 2,578,372 reduction in its share capital, without the cancellation of
shares and restitution to Braskem, its sole shareholder, of all the investments in Rio Polímeros
S.A. (“Riopol”) and Quattor Petroquímica.
(viii) On January 7, 2008, BNDES Participações S.A. ("BNDESPAR") acquired 25% of Riopol and
was also granted a put option to sell 60% and 40% of the acquired interest to Unipar and
Petrobras, respectively. This option was exercisable up to June 2013.
On August 9, 2010, BNDESPAR exercised the put option and Braskem acquired 190,784,674 common shares and 30 preferred shares of Riopol for R$ 209,951. The acquisition corresponds to 15% of the share capital of Riopol and Braskem holds direct and indirect 90% of its subsidiary share capital.
The amount of this acquisition will be paid in three installments, restated by the TJLP (Note
16), as follows:
a. First installment, due on June 11, 2015, corresponding to 15% of the total amount;
b. Second installment, due on June 11, 2016, corresponding to 35% of the total amount and
c. Third installment, due on June 11, 2017, corresponding to 50% of the total amount.

Braskem S.A. and Subsidiaries Notes to the Financial Statements at December 31, 2010 and 2009 Amounts in thousands of Brazilian reais, except when otherwise indicated
19
Also, as a result of the put option exercised by BNDESPAR, Petrobras has acquired 10% of
Riopol's capital stock.
(ix) On August 30, 2010, the Extraordinary General Shareholders’ Meeting held by Braskem's
approved the merger of Riopol's shares, converting Riopol into a wholly-owned subsidiary of
the Company. The book value of the merged net assets on March 31, 2010, the transaction's
base date, amounted to R$ 103,087. Of that amount, R$ 22,285 was allocated to the capital
account, and R$ 80,802 was allocated to the capital reserve account. In that transaction,
2,434,890 preferred class A shares were issued, based on an exchange ratio of
0.010064743789 share of Braskem for each Riopol share, pursuant to economic appraisal
reports of the companies, prepared by an independent expert (Note 26(a)).
Due to this stock merger, subsidiary Quattor Petroquímica, which held 9.02% of Riopol's
capital, has received Braskem shares. In these financial statements, such shares are accounted
for as "treasury shares" (Note 26(a)).
(x) On September 1, 2010, the Extraordinary General Shareholders’ meeting held by Quattor's
approved the merger of the companies referred below. The net assets of the merged
companies were appraised at book value on June 30, 2010 (the transaction's base date).
a. Merger of Quattor Química S.A. ("Quattor Química”)
On the merger date, Quattor Química's capital was owned by Quattor (94.11%) and
Quattor Petroquímica (5.89%). The exchange ratio of Quattor Química shares for Quattor
shares was determined based on the equity of both companies on June 30, 2010, resulting
in a capital increase of R$ 58,231 with the issuance of 7,538,949 common shares delivered
to Quattor Petroquímica.
b. Merger of Polibutenos
On the merger date, Polibutenos's capital was owned by Quattor (33.33%) and Braskem
(66.67%). The exchange ratio of Polibutenos shares for Quattor shares was determined
based on the equity of both companies on June 30, 2010, resulting in a capital increase of
R$ 13,032 with the issuance of 1,687,179 common shares delivered to Braskem.
c. Mergers of Mauá Resinas S.A. ("Mauá Resinas") and Norfolk Distribuidora Ltda
("Norfolk”)

Braskem S.A. and Subsidiaries Notes to the Financial Statements at December 31, 2010 and 2009 Amounts in thousands of Brazilian reais, except when otherwise indicated
20
On the merger date, Mauá Resinas and Norfolk were wholly-owned subsidiaries of
Quattor; accordingly there was no capital increase or issue of shares by the merged
company.
(xi) On May 26, 2010, the Company filed a request to register a public offer with CVM, in order to
acquire the 7,688 common shares and 1,542,006 preferred shares of Quattor Petroquímica S.A. (“Quattor Petroquímica”) held by minority shareholders, as a result of the change in control. These shares represented 0.68% of the total capital of Quattor Petroquímica. CVM’s Board approved the public offer on October 28, 2010. The public offer was completed and settled on December 16, 2010. The total number of shares acquired through the public offer was 224,968, and 1,324,726 preferred shares held by minority shareholders still remained. The remaining shares, valued at book value on March 31, 2010, increased the capital stock of Braskem by R$4,270 and were subscribed and paid-up by Quattor Petroquímica’s shareholders. 398,175 class A preferred shares were issued in this operation based on the ratio of 0.300571316385725 share of Braskem for each share of Quattor Petroquímica, according to the economic appraisal report of the companies, prepared by an independent expert (Note 26(a)). This operation was approved by the Extraordinary General Shareholders’ Meetings held by Braskem and subsidiary Quattor Petroquímica on December 27, 2010, following disclosure in a Relevant Fact notice on December 7, 2010. CVM, by means of an official letter dated February 3, 2011, approved the cancelation of the authorization to trade the shares of subsidiary Quattor Petroquímica on the stock exchanges, which was requested by the Company on January 28, 2011.
On December 31, 2010, after the acquisition of the minority shareholders' shares of subsidiary Quattor Petroquímica item (xi) above Braskem’s interest in the investees is shown below:

Braskem S.A. and Subsidiaries Notes to the Financial Statements at December 31, 2010 and 2009 Amounts in thousands of Brazilian reais, except when otherwise indicated
21
(f.3) On February 1, 2010, Braskem announced that its subsidiary Braskem Americas, Inc. (“Braskem
Americas”) had signed, on that same date, a Share Purchase and Sale Contract with Sunoco Inc., a U.S. oil
company, through which it acquired all the total and voting capital of Sunoco Chemicals, Inc. (“Sunoco
Chemicals”) for US$ 350 million, equivalent to R$ 620,000. Sunoco Chemicals has an annual installed
capacity of 950 million metric tons of polypropylene distributed in three plants located in Pennsylvania,
West Virginia and Texas.
The transaction was completed on April 1, 2010, when full payment for the acquired shares was made. On
the same date the name of the acquired company was changed to PP Americas.
In accordance with the accounting practices adopted when preparing these financial statements (Note 2) the
acquisition represented a “business combination” as per Technical Pronouncement - CPC 15 and IFRS 3
the effects of which are stated in (Note 5).
(f.4) On June 1, 2010, Braskem approved the spin-off of its subsidiary Varient Distribuidora de Resinas
Ltda. (“Varient”) and the merger of the spin-off part by the new subsidiary Alcacer Distribuidora de
Quattor Participações S.A.
BRASKEM
96.96%
UNIPAR Comercial e Distribuidora
100.00%
Quattor Petroquímica S.A.
Rio Polímeros S.A.
100.00% 100.00%
3.04%
0.144%

Braskem S.A. and Subsidiaries Notes to the Financial Statements at December 31, 2010 and 2009 Amounts in thousands of Brazilian reais, except when otherwise indicated
22
Resinas Ltda. (“Alcacer”). On the same date, negotiations were concluded to sell these two subsidiaries for
a total value of R$ 12,700 (Note 13(b)).
(f.5) In November 2009, Braskem and Grupo IDESA Sociedad Anónima de Capital Variable (“IDESA”), a
traditional petrochemical company in Mexico, announced that they had submitted the winning bid in a
tender offer process in Mexico to implement a petrochemical project based on ethane in the Veracruz
region with a supply contract through PEMEX-Gás, of 66,000 barrels/day of this input over a period of 20
years. As a result of winning the bid Braskem and IDESA signed a Memorandum of Understanding and
finalized a definitive contract on February 23, 2010, involving:
(i) a commitment by Braskem and IDESA to invest in the construction of an integrated ethane cracker,
with production capacity of one million metric tons per year of ethylene; and
(ii) to invest in three polyethylene plants producing approximately 1 million metric tons per year. The
investment in the project, which is denominated Etileno XXI, is estimated at some US$2.5 billion,
with conclusion of construction and operational startup of the unit expected in January 2015.
The name of the new investee is Braskem Idesa, Sociedad Anónima Promotora de Inversión (“Braskem
Idesa”). The fully-subscribed share capital of this subsidiary totaled 76,592,000 Mexican pesos
(approximately R$ 11,300) on May 25, 2010, represented by 6,300 shares, of which 65% are owned by
Braskem and 35% by Etileno XXI Sociedad Anónima de Capital Variable. Additionally, on September 30,
2010, the shareholders contributed Mex$ 433,788 thousand (approximately R$ 58,345) to Braskem Idesa's
capital, through the issuance of 35,680 shares. Braskem Idesa's subscribed and paid-up capital is now Mex$
510,380,000 (approximately R$ 69,648), represented by 41,980 shares.
(f.6) On December 17, 2010, the Extraordinary General Meeting held by Braskem approved the merger of Companhia Alagoas Industrial - Cinal (“Cinal”) into the Company, based on its book equity as of September 30, 2010, amounting to R$ 27,834, pursuant to the terms and conditions set forth in the protocol and justification, dated November 29, 2010, without changes in the Company’s capital stock, given that the Company is the only shareholder of Cinal. (g) On December 31, 2010, Braskem’s net working capital (parent company) was negative R$ 1,352,639. As compared with, consolidated net working capital of positive R$ 316,811 on December 31, 2009. Because consolidated figures are used in the management of working capital, given that the Company uses mechanisms to transfer funds between the companies efficiently, without compromising the fulfillment of the commitments of each of the entities forming our consolidated statements, any analysis of parent company working capital will not reflect the actual liquidity position of the consolidated group. In addition, the Company has a US$350 million revolving credit line that may be used permanently for 3 years, which allowed us to reduce the amount of cash held by Braskem.
Braskem S.A. and Subsidiaries Notes to the Financial Statements at December 31, 2010 and 2009 Amounts in thousands of Brazilian reais, except when otherwise indicated
23
2 Summary of the Signigicant Accounting Principles The significant accounting principles applied in the preparation of these financial statements are described below. These practices have been consistently applied in all periods presented. 2.1 Preparation basis The financial statements were prepared based on the historical cost convention, adjusted to reflect the "deemed cost" of machinery and equipment at the date of transition to the CPCs and IFRS, and the fair value of available-for-sale financial assets and financial assets and liabilities (including derivative instruments) held for trading. The preparation of financial statements requires the use of certain critical accounting estimates and the exercise of judgment by the Company's management in the application of its accounting principles. More complex areas that require a higher level of judgment, as well as areas in which assumptions and estimates are significant to the consolidated financial statements, are reported in Note 3.
a) Consolidated financial statements The consolidated financial statements were prepared and are presented in accordance with accounting principles adopted in Brazil, including the pronouncements issued by the Brazilian Accounting Standards Board (CPCs), and the International Financial Reporting Standards (IFRS) issued by the International Accounting Standards Board (IASB). These are the first financial statements reported by the Company under the CPCs and the IFRS. The main differences between the accounting principles previously adopted in Brazil ("BR GAAP") and the CPCs/IFRS, including reconciliations of equity, profit or loss for the period, and statement of comprehensive income, are described in Note 4.
b) Parent company financial statements The parent company's separate financial statements were prepared in accordance with accounting practices in Brazil issued by the CPC, and are disclosed together with the consolidated financial statements. As required on the accounting practices adopted in Brazil applied to the separate financial statements differ from the IFRS only in the recognition of investments in subsidiaries and associated companies using the equity accounting method, whereas the IFRS establishes recognition based on cost or fair value. 2.2 Consolidated financial statements The following accounting policies are applied in the preparation of the consolidated financial statements.
(a) Subsidiaries Subsidiaries are all entities (including special purpose entities) whose financial and operating policies are determined by the Company, and in which the Company holds a majority of the voting rights. The existence and effect of potential voting rights, which are exercisable or convertible, are taken into account when evaluating whether the Company controls another entity. Subsidiaries are fully consolidated as of the date when control is transferred to the Company, and are no longer consolidated as of the date the Company ceases to control the entity.

Braskem S.A. and Subsidiaries Notes to the Financial Statements at December 31, 2010 and 2009 Amounts in thousands of Brazilian reais, except when otherwise indicated
24
The purchase method is used to account for the acquisition of subsidiaries by the Company. The consideration for the acquisition of a subsidiary is the fair value of assets transferred, liabilities assumed and equity instruments issued by the Company. Identifiable assets acquired, and contingencies and liabilities assumed, in a business combination are initially measured at fair value on the acquisition date, regardless of the proportion of any minority interest. The excess of the acquisition cost over the fair value of the Company's interest in net identifiable assets acquired is recorded as goodwill. If the acquisition cost is lower than the fair value of the net assets of the acquire, the difference is directly recognized in the statement of income after all calculations are reviewed and the bargain purchase price is confirmed. When incurred, acquisition costs are recognized in profit or loss for the period. This is an accounting practice on the individual financial statements according CPC 15. The Company accrues provisions for losses on investments in subsidiaries in connection with any net capital deficiency of these companies. Such provision is recorded as non-current liabilities against gains or losses from "interests in subsidiaries and associated companies". Operations between the Company's subsidiaries and jointly controlled companies, as well as unrealized balances, and gains and losses from these operations, were eliminated. The accounting principles of subsidiaries were adjusted to ensure consistency with the accounting principles adopted by the Company.
(b) Jointly-controlled subsidiaries
These are entities whose activities are jointly controlled by the Company and one or more partners, under a
shareholders' agreement. Joint control is the shared control over an economic activity, established by contract,
which only exists when strategic, financial and operating decisions regarding the activity require unanimous
consent from the parties sharing control. These investments are consolidated using the proportional method.
(Note 2.2(d)).
(c) Parent company financial statements In the separate financial statements of the parent company, subsidiaries and jointly-controlled subsidiaries are accounted for using the equity accounting method. Adjustments made to conform with international accounting standards, pursuant to CPC 37 (R1) and IFRS 1, were applied both to the consolidated and separate financial statements, so as to obtain the same profit or loss and equity as those attributable to the parent company's shareholders.
(d) Interests in subsidiaries, jointly-controlled subsidiaries and special purpose entities The consolidated financial statements were prepared pursuant to the consolidation procedures established by CPC 36 and IAS 27, and include the financial statements for the Company and its subsidiaries, jointly-controlled subsidiaries and special purpose entities in which the Company holds a controlling stock position or controls the activities, directly and indirectly, as follows:

Braskem S.A. and Subsidiaries Notes to the Financial Statements at December 31, 2010 and 2009 Amounts in thousands of Brazilian reais, except when otherwise indicated
25
Total interest- %
Headquarters
(Country) 2010 2009 01/01/2009
Direct and indirect subsidiaries
Braskem America Inc. (“Braskem America”) USA 100.00 100.00 100.00
Braskem Chile Limitada (“IPQ Chile”) Chile 100.00 100.00 100.00
Braskem Distribuidora Ltda.(“Braskem Distribuidora”) Brazil 100.00 100.00 100.00
Braskem Europe B.V. (“Braskem Europa”) Netherlands 100.00 100.00 100.00
Braskem Finance Limited (“Braskem Finance”) Cayman Islands 100.00 100.00 100.00
Braskem Idesa, Sociedade Anónima Promotora de Inversión (“Braskem
Idesa”)
Mexico
65.00
Braskem Incorporated (“Braskem Inc”) Cayman Islands 100.00 100.00 100.00
Braskem Importação e Exportação Ltda. (“Braskem Importação”) Brazil 100.00 100.00 100.00
Braskem México, S de RL de CV (“Braskem México”) (i) Mexico 100.00
Braskem Participações S.A. (“Braskem Participações”) Brazil 100.00 100.00 100.00
Braskem Petroquímica S.A. (“IPQ Argentina”) Argentina 100.00 100.00 100.00
Braskem Petroquímica Chile Limitada (“Braskem Chile”) Chile 100.00 100.00 100.00
Braskem PP Americas Inc (“PP Americas”) (ii) USA 100.00
Companhia Alagoas Industrial - CINAL (“CINAL”) (iii) Brazil 100.00 100.00
Copesul International Trading INC. (“CITI”) (iv) British Virgin Islands 100.00
Lantana Trading Co. Inc. (“Lantana”) Bahamas 100.00 100.00 100.00
Ideom Tecnologia Ltda. (“Ideom”) Brazil 100.00 100.00 100.00
IQ Soluções & Químicas S.A.(“Quantiq”) Brazil 100.00 100.00 100.00
Ipiranga Química Armazéns Gerais Ltda. (“IQAG”) Brazil 100.00 100.00 100.00
ISATEC–Pesquisa, Desenv. e Análises Quím.Ltda. (“ISATEC”) Brazil 100.00 100.00 100.00
Natal Trading (iv) British Virgin Islands 100.00
Politeno Empreendimentos Ltda. (“Politeno Empreendimentos”) Brazil 100.00 100.00 100.00
Varient Distribuidora de Resinas Ltda (“Varient”) (v) Brazill 100.00
Quattor Participações S.A. (“Quattor”) (vi) Brazil 100.00
Quattor Petroquímica S.A. (“Quattor Petroquímica”) (vi) Brazil 100.00
Rio Polímeros S.A. (“Riopol”) (vi) Brazil 100.00
Norfolk Trading S.A. (“Norfolk Trading”) (vi) Uruguay 100.00
Commom Industries Ltd. (“Commom”) (vi) British Virgin Islands 100.00
Unipar Comercial e Distribuidora S.A. (“Unipar Comercial”) (vi) Brazil 100.00
Jointly-controlled subsidiaries (vii)
Refinaria de Petróleo Rio-Grandense S.A. (“RPR”) Brazil 33.20 33.20 33.20
Polietilenos de America S.A.(“POLIMERICA”) Venezuela 49.99 49.99
Polipropileno Del Sur S.A.(“PROPILSUR”) Venezuela 49.99 49.99
Specific Purpose Entitites (“SPEs”)
Fundo de Investimento Multimercado Crédito Privado Sol (“FIQ Sol”) (viii) Brazil 100.00 100.00 100.00
(i) Incorporated in September 2010.
(ii) Company acquired in April 2010. (Note 1.f.3)
(iii) Subsidiary merged into the Company in December 2010. (Note 1.f.6)
(iv) Subsidiaries merged into Braskem Inc. in December 2009.
(v) Company created in September 2009 from the spin-off of Quantiq and sold in June 2010. (Note 1.f.4)
(vi) Companies acquired in April 2010. (Note 1.f.2)
(vii) Investments consolidated proportionally, in accordance with CPC 18.
(viii) Fund consolidated in compliance with CPC 36. (R1)
The interest of non-controlling shareholders in the equity and profit or loss of subsidiary Braskem Idesa was separately reported in the consolidated balance sheet and income statement for the year.

Braskem S.A. and Subsidiaries Notes to the Financial Statements at December 31, 2010 and 2009 Amounts in thousands of Brazilian reais, except when otherwise indicated
26
(e) Reconciliation of shareholders' equity and net income between the parent company and consolidated
2.3 Segment reporting Information per operating segment is presented according to the internal report provided to the key operating decision maker. The key operating decision maker, responsible for allocating funds and evaluating the performance of operating segments, is the Chief Executive Officer. 2.4 Foreign currency translation (a) Functional currency and presentation currency The Company's functional and presentation currency is the Brazilian real, as defined by CPC 02 and IAS 21. (b) Transactions and balances Foreign currency transactions are translated into the functional currency based on the exchange rate at the transaction or measurement date, when the items are re-measured. Exchange gains and losses deriving from the settlement of these transactions and the translation based on year-end exchange rates, regarding foreign currency monetary assets and liabilities, are recognized in the statement of income for the year, except when deferred in equity as qualifying cash flow hedging operations. Exchange variations under assets or liabilities from borrowings are reported in the statement of income as Financial income or expenses, respectively. Changes in the fair value of foreign currency monetary instruments, classified as available for sale, are divided between the exchange variations of amortized cost recognized in profit or loss, and other variations in the instrument's book value, recognized in equity as Other comprehensive income. (c) Foreign subsidiaries Some direct or indirect subsidiaries have a different functional currency from that of the Company, as: i) for companies Propilsur and Polimerica, based in Venezuela, the functional currency is the U.S. dollar, because these companies are in the construction phase and the capital investments and the main equipment suppliers are based on this currency; ii) for Braskem Idesa, based in Mexico, the functional currency is the Mexican peso; and iii) for PP Americas, based in the United States, the functional currency is the U.S. dollar.
2010 2009 2010 2009
Parent Company 10,439,099 4,978,644 1,895,309 398,491
Braskem shares (48,892) - - -
Non-controlling interest 18,079 - (5,824) -
Consolidated 10,408,286 4,978,644 1,889,485 398,491
Shareholders' equity Net income of the period

Braskem S.A. and Subsidiaries Notes to the Financial Statements at December 31, 2010 and 2009 Amounts in thousands of Brazilian reais, except when otherwise indicated
27
The financial statements of these subsidiaries are translated to the Company's presentation currency, under CPC 02 and IAS 21, which determines, among other matters, the following conversion rules:
• Assets and liabilities of each balance sheet presented are translated using the foreign exchange rate at the end of each reporting period;
• The equity for the beginning of the period corresponds to the closing equity at the end of the previous reporting period, as translated at the time. Changes in the opening equity during the reporting period are translated using the effective rates on the respective dates; and
• The accounts presented in the statements of income are translated using the foreign exchange rates on the transaction dates or, for practical reasons, an average rate for the periods; provided that the difference between these rates is not material.
All resulting foreign exchange differences are recognized as a separate item in equity, under Foreign currency translation adjustments in Other comprehensive income.
When a foreign operation is partially disposed of or sold, foreign exchange differences recorded in equity are recognized in the statement of income as a part of the gain or loss on sale. 2.5 Cash and cash equivalents Cash and cash equivalents include cash on hand, bank deposits, and highly liquid short-term financial investments maturing in up to three months, less any amounts used on overdraft accounts. Cash and cash equivalents are promptly convertible into a known amount of cash, and subject to an insignificant risk of change in value. 2.6 Financial instruments A financial instrument is a contract that results in a financial asset for an entity, and a financial liability or equity instrument for another entity. 2.6.1 - Classification The Company classifies its financial assets in the categories listed below. The classification depends on the purpose for the acquisition of such financial assets. The Companys’ management determines the classification of the financial assets upon initial recognition. (a) Held for trading – measured at fair value, and are acquired principally for the purpose of active and frequent trading, including derivatives, except for those designated for hedge accounting. Assets in this category are classified under current assets. Gains or losses from changes in the fair value of financial assets held for trading are recognized in the profit or loss for the period. (b) Loans and receivables – non-derivative financial assets with fixed or determinable payments and that are not quoted in an active market. Loans and receivables are recognized under current assets, except for those due in over 12 months following the balance sheet date (these are classified as non-current assets). The Company's loans and receivables include balances of intra-group loan contracts and current accounts with related companies, trade accounts receivable, other accounts receivable, and cash and cash equivalents, except for short- and long-term investments. Loans and receivables are accounted for at amortized cost, based on the effective interest method.

Braskem S.A. and Subsidiaries Notes to the Financial Statements at December 31, 2010 and 2009 Amounts in thousands of Brazilian reais, except when otherwise indicated
28
(c) Held-to-maturity - these are basically the financial assets that cannot be classified as loans and receivables because they are quoted in an active market. In this case, the Company acquires these financial assets with the intention and financial capacity to hold them to maturity. They are recorded at acquisition cost plus income earned, which is included in the profit or loss for the period. The Company's held-to-maturity assets consist mostly of subordinated quotas in investment funds, classified as non-current assets. (d) Available-for-sale – these are non-derivatives recognized in this classification or that are not recognized in any other category. They are included in non-current assets, unless management intends to dispose of the investment in up to 12 months after the balance sheet date. Available-for-sale financial assets are recognized at fair value. Interest on available-for-sale securities, calculated based on the effective interest method, is recognized in the statement of income as financial income. The portion corresponding to changes in fair value is recognized in equity, net of taxes, under Other comprehensive income, and is transferred to profit or loss upon realization or due to impairment losses. 2.6.2 – Recognition and measurement Regular way purchases or sales of financial assets are recognized on the trade date, i.e. date when the Company commits to buy or sell the asset. Investments are initially recognized at fair value. Transaction costs for held-for-trading financial assets are charged to the statement of income. For other financial assets, transaction costs are added to the respective fair value. A financial asset is derecognized when the contractual rights to the cash flows from the financial asset expire or are transferred, provided that the Company has transferred substantially all the risks and rewards of ownership of the financial asset. Available-for-sale and held-for-trading financial assets are always recognized at fair value. Loans and receivables are recorded at amortized cost, based on the effective interest method. Gains or losses from changes in the fair value of financial assets held for trading are recognized in the statement of income, under "financial result", in the period they occur. Changes in the fair value of monetary and non-monetary instruments, classified as available for sale, are recognized in equity under "other comprehensive income." When available-for-sale instruments are sold or become impaired, the cumulative adjustments to fair value, recognized in equity, are transferred to the statement of income as financial income or expense. Interest on available-for-sale securities, calculated based on the effective interest method, is recognized in the statement of income as financial income. Dividends from available-for-sale equity instruments, such as shares, are recognized in the statement of income as other operating revenues as soon as the Company's right to receive payments is established. The fair value of publicly-traded investments is based on the current acquisition price. If the market for a financial asset (instruments not traded on a stock exchange) is not active, the Company establishes the fair value by using valuation techniques. Valuation techniques include the use of recent transactions contracted with third parties, reference to other substantially similar instruments, analysis of discounted cash flows, and option pricing models that make the best use of information generated by the market, and rely the least possible on information generated by the Company's management.

Braskem S.A. and Subsidiaries Notes to the Financial Statements at December 31, 2010 and 2009 Amounts in thousands of Brazilian reais, except when otherwise indicated
29
The Company analyzes, at the balance sheet date, if there is objective evidence that a financial asset or group of financial assets has become impaired. If there is any evidence of impairment of available-for-sale financial assets, the cumulative loss—measured as the difference between the acquisition cost and the current fair value less any impairment loss previously recognized in profit or loss—is transferred from equity to the statement of income. 2.6.3 – Financial instruments offsetting Financial assets and liabilities are offset and the net amount is reported in the balance sheet when there is a legally applicable right to offset the recognized amounts, and there is an intention of settling them on a net basis, or of realizing the asset and settling the liability simultaneously. 2.6.4 – Impairment of financial assets
(a) Assets at amortized cost The Company analyzes at the end of each reporting period whether there is objective evidence that a held-to-maturity financial asset is impaired. Losses are recognized when there is objective evidence of impairment as a result of one or more events occurred after the initial recognition of the assets. The loss amount is calculated as the difference between the asset's recognized amount and the present value of the estimated future cash flows (excluding future credit losses that have not yet occurred) discounted at the assets original effective rate. The Company recognizes impairment of trade accounts receivable as follows: 100% of the amounts over 180 days past due 50% of the amounts over 90 days past due and 100% of the amounts under court collection procedures. This calculation also includes amounts derived from a second renegotiation with clients, as well as all amounts derived from the first renegotiation and with payments due in over 24 months. Accounts receivable with related companies are not included in this calculation.
(b) Available-for-sale assets When the decrease in fair value is recurring, and there is objective evidence that this reduction is other-than-temporary, the Company transfers all cumulative losses from other comprehensive income to the profit or loss for the period. Impairment losses recognized in the separate consolidated income statement on equity instruments are not reversed through the separate consolidated income statement. If, in a subsequent period, the fair value of a debt instrument classified as available for sale increases and the increase can be objectively related to an event occurring after the impairment loss was recognized in profit or loss, the impairment loss is reversed through the separate consolidated income statement. 2.7 Derivative financial instruments and hedge operations
Braskem S.A. and Subsidiaries Notes to the Financial Statements at December 31, 2010 and 2009 Amounts in thousands of Brazilian reais, except when otherwise indicated
30
Derivative financial instruments are recognized initially at fair value on the date the derivative is contracted, and are subsequently re-measured at fair value. The method used to recognize the resulting gain or loss depends on whether or not the derivative is designated as a hedge instrument recording by fair value. If it is, the method depends on the nature of the hedged item. The Company designates certain derivatives as:
(a) fair value hedge of recognized assets or liabilities or a firm commitment (fair value hedging); (b) hedge of a specific risk associated with a recognized asset or liability or a highly probable forecast
transaction (cash flow hedging); or (c) hedge of a net investment in a foreign operation (net investment hedging).
The Company documents, at the inception of the transaction, the relationship among the hedge instruments and hedged items, as well as the objectives of the risk management and the strategy for hedge operations. The Company also documents its evaluation, both at the inception of the hedge transaction and on a continuing basis, that the derivatives used in hedge operations are highly effective in offsetting changes in the fair value or cash flows of hedged items.
The fair value of derivatives used for hedging purposes is disclosed in Note 19. Changes in "Other comprehensive income" in equity are presented in the statement of comprehensive income. The fair value of a hedging derivative is classified as a non-current asset or liability when the remaining maturity of the hedged item is over 12 months; otherwise, it is classified under current assets or liabilities. (a) Fair value hedging Changes in fair value are recognized in the statement of income, in the same line of the hedged asset or liability. A gain or loss related to the non-effective portion is recognized in the statement of income as "other operating revenues (expenses), net." If the hedge no longer meets the hedge accounting criteria, the adjustment to the book value of a hedged item, calculated using the effective interest method, is amortized to profit or loss through maturity. The Company has no fair value hedging operations at the end of the reported periods. (b) Cash flow hedging Changes in the fair value of the effective portion are recognized in equity under Other comprehensive income. Gains or losses related to the non-effective portion are immediately recognized in the statement of entries as Gains/losses in derivative operations under Financial result. When a hedge instrument no longer meets the hedge accounting criteria, or terminates for any reason (expiration, sale or exercise), hedge accounting is prospectively discontinued, and any cumulative gains or losses existing in equity at that time remains in equity and is recognized when the forecast transaction is ultimately recognized in the statement of operations. When a forecast transaction is no longer expected to occur, the cumulative gain or loss that was recognized in equity is immediately transferred to the new statement. The Company's cash flow hedging operations are described in Note 19.

Braskem S.A. and Subsidiaries Notes to the Financial Statements at December 31, 2010 and 2009 Amounts in thousands of Brazilian reais, except when otherwise indicated
31
(c) Net investment hedging Hedges of net investments in foreign operations are recognized in a manner similar to cash flow hedging. Gains or losses from the hedge instrument related to the effective portion of the hedge are recognized in equity under Other comprehensive income. Gains or losses related to the non-effective portion are immediately recognized in the statement of income under Financial result. When a foreign operation is partially disposed of or sold, cumulative gains and losses recorded in equity are transferred to the statement of income. The Company had no net investment hedging operations at the end of the reported periods. (d) Derivatives not designated as hedge instruments Derivatives not designated as hedge instruments are classified as current assets or liabilities. Changes in the fair value of any of these derivative instruments are immediately recognized in the statement of income as Gains/losses in derivative operations under Financial result. 2.8 Trade accounts receivable Trade accounts receivable are recorded at the amount billed, adjusted to present value when applicable, less any provision for impairment losses. 2.9 Inventories Inventories are recognized at lower of the average cost of purchases or production, and net realizable value. Net realizable value is the estimated selling price in the ordinary course of business, less applicable variable selling expenses. Imports in transit are recognized at the cumulative cost of each import. The Company has adopted the absorption costing method for its inventories, using the weighted moving average. Provisions for impairment losses of obsolete or slow-moving inventories are accrued whenever management deems necessary. 2.10 Interests in associated companies and other investments Associated companies are entities over which the Company has significant influence, but not control, with an interest of usually 20% to 50% of the voting rights. Investments in associated companies are accounted for on the equity accounting method, and are initially recognized at cost. The Company's investments in associated companies include the cumulative goodwill on the acquisition, net of impairment losses. Other investments are recognized at acquisition cost less any provision for adjustment to market value, where applicable. 2.11 Property, plant and equipment Property, plant and equipment is recognized at cost less cumulative depreciation and impairment losses, where applicable. Cost includes:

Braskem S.A. and Subsidiaries Notes to the Financial Statements at December 31, 2010 and 2009 Amounts in thousands of Brazilian reais, except when otherwise indicated
32
a) acquisition price, financing charges incurred during construction (Note 17.f), and all other costs necessary to make the asset ready for use;
b) imputed cost related to the monetary restatement of the property, plant and equipment item in the hyperinflationary period; and
c) fair value of assets acquired through business combinations. Costs subsequent to the acquisitions arising from scheduled shutdowns for maintenance and/or replacement of parts, and the corresponding services, are added to the book value of the related asset. Shutdowns occur at scheduled intervals that range from two to six years, and the respective expenses are depreciated through the beginning of the next shutdown. Rights over tangible assets intended for the maintenance of the activities of the Company and its subsidiaries, derived from financial lease operations, are initially recognized at fair value, and depreciated on a straight-line basis through the lower of the remaining useful life or the contract term. Asset depreciation is calculated using the straight-line method, so as to allocate the costs over the estimated useful life of the assets, as follows:
• Buildings and improvements 4.12%
• Machinery, equipment, and facilities 6.72%
• Mines and Well 9.01%
• Furniture and fixtures 10.36%
• Computing equipment 20.50%
• Lab / security equipment 9.88%
• Other 17.26% 2.12 Intangible assets
Intangible assets include the following:
(a) Goodwill
Goodwill is represented by the positive difference between the amount paid and/or payable for the acquisition of a business and the net fair value of the assets and liabilities of the acquisition. Goodwill on the acquisition of subsidiaries is recorded as an intangible asset." Negative goodwill (bargain purchase) on an acquisition is recorded as gain in profit or loss for the period, at the acquisition date.
Goodwill is accounted for at cost less any cumulative impairment loss; impairment losses are not reversed.
The Company's goodwill was calculated in accordance with the criteria determined by generally accepted accounting principles in Brazil prior to the adoption of the pronouncements of the CPC, and represents the positive difference between the amount paid and the value of the net assets of the entity acquired at the time. As described in Note 4.2.1, the Company applied the exemption related to the business combinations formed prior to January 1, 2009 and did not re-measure these amounts. These goodwill not been amortized since January 1, 2009 and are tested annually to verify any probable impairment losses. (b) Trademarks and patents

Braskem S.A. and Subsidiaries Notes to the Financial Statements at December 31, 2010 and 2009 Amounts in thousands of Brazilian reais, except when otherwise indicated
33
These include the registered trademarks, and technologies acquired from third parties and in a business combination. They are recognized at acquisition cost and/or fair value less cumulative amortization and impairment losses, where applicable. Trademarks and patents with a finite life are amortized using the straight-line method based on the estimated useful life of the assets (from 15 to 20 years) or over the period of the contract.
Research expenses are recognized in profit or loss as incurred.
(c) Contractual relationships with clients and suppliers
Contractual relationships with clients and suppliers, acquired in a business combination, are recognized at fair value at the acquisition date. They are recorded at cost less cumulative amortization. Such contractual relationships have a finite life and are amortized using the straight-line method over the period of the contract.
(d) Software
Software is recognized at cost less cumulative amortization and impairment losses, where applicable. Cost includes the acquisition price and all other costs to make the software ready for use. Software with a finite life is amortized using the straight-line method based on its estimated useful life (from 3 to 10 years) or over the period of the contract. Costs related to software maintenance are recognized as expenses as incurred.
2.13 Impairment of non-financial assets
Assets with an indefinite useful life, such as goodwill, are not amortized and are tested for impairment annually. To test for impairment, goodwill is allocated to each of the acquirer’s cash generating units or groups of cash generating units.
Assets that are amortized are tested for impairment whenever events or changes in circumstances indicate that the assets may be impaired.
An impairment loss is recognized at the amount by which the carrying amount of the asset exceeds its recoverable amount. The recoverable amount is the higher of an asset’s fair value less costs to sell and its value in use. To test for impairment, the assets are grouped at the lowest level for which identifiable cash flows are largely independent of the cash flows from other assets or group of assets. Impaired non-financial assets, except for goodwill, are assessed to determine whether impairment losses can be reversed at the balance sheet date.
2.14 Other assets
Other assets are stated at realizable amount, plus, where applicable, income earned and monetary variations or, in the case of prepaid expenses, at cost.
2.15 Suppliers Suppliers consist of amounts payable for goods or services purchased from suppliers in the normal course of business and are stated at the billed amount. Where applicable, this account is recognized at present value, transaction by transaction, based on interest rates that reflect the term, currency and risk of each transaction. The Company usually calculates the adjustment to present value for payment term in excess of 180 days. The adjustment to present value is calculated base on specific interest rates for each transaction and reflected as

Braskem S.A. and Subsidiaries Notes to the Financial Statements at December 31, 2010 and 2009 Amounts in thousands of Brazilian reais, except when otherwise indicated
34
financial expenses. Naphtha is our main raw material, imported by Braskem and that commodity is priced in accordance with Antwerp, Rotterdam and Amsterdam(“ARA”) pricing of the European markets in addition to freights and financial charges for extended payment term.
2.16 Loans and financing and debentures Loans and financing are initially stated at fair value and net of transaction costs incurred on the structured operation. Subsequently, they are presented increasing fees and other proportional charges on the incurred period. The same method adopted for recognition of loans and financing was used for non-convertible debentures.
2.17 Provisions A provision is recognized in the balance sheet when the Company has a legal, contractual or constructive obligation that has arisen as a result of a past event, it is probable that an outflow of resources will be required to settle the obligation and the amount can be estimated reliably. Provisions for tax, labor and other contingencies are recorded based on external legal advisors’ estimates of probable losses from ongoing proceedings, according legal external advisors of the Company (Note 22). Contingencies assessed as involving only possible success that have been assumed in business combinations are recognized at fair value at the acquisition date. Subsequently, such contingent liabilities are measured at the higher of amount booked in the business combination and that amount determined under IAS 37. Provisions are measured at the present value of the estimated expenditure required to settle the obligation, using a pre-tax discount rate that reflects the current market conditions. The increase in the obligation over time is recognized as a financial expense.
2.18 Deferred income tax and social contribution Deferred income tax and social contribution are calculated on tax loss carryforwards, temporarily non-deductible expenses and temporarily non-taxable income arising from differences between the book and tax
Braskem S.A. and Subsidiaries Notes to the Financial Statements at December 31, 2010 and 2009 Amounts in thousands of Brazilian reais, except when otherwise indicated
35
bases in accordance with the liability method. Income tax and social contribution of the Company and its subsidiaries in Brazil are calculated at the rate of 25% and 9%, respectively. Deferred tax assets are recognized to the extent it is probable that sufficient taxable profit will be available in the coming years to allow the benefit of part or all of that deferred tax assets to be utilized, based on projections of profits using internal assumptions and future economic scenarios. The carrying amount of deferred tax assets is periodically reviewed and the effects, including realization or settlement effects, are reflected based on the applicable tax laws. Deferred income tax and social contribution are recognized using the liability method for temporary differences between the tax bases of assets and liabilities and the consolidated financial statement carrying amounts. However, deferred tax is not recognized if the tax arises from the initial recognition of an asset or a liability other than in a business combination which, at the time of the transaction, does not affect either the accounting or the taxable profit. Deferred income tax and social contribution are measured at the tax rates that are expected to apply in the period when the asset is realized or the liability is settled, based on tax rates that have been enacted or substantively enacted at the balance sheet date. Deferred tax assets are recognized only if it is probable that there will be sufficient future taxable profit against which the temporary differences can be utilized. Deferred tax assets and liabilities can be offset when there is the legal right to settle on a net basis and they are levied by the same taxing authority on the same entity or different entities that intend to realize the asset and settle the liability at the same time. Current income tax and social contribution are calculated based on tax laws that have been enacted or substantively enacted at the balance sheet date in the countries in which the Company’s subsidiaries and associated companies operate and generate taxable profit. Management periodically assesses the data reported by the Company in its income tax returns to look for situations which, under prevailing tax regulation, are subject to interpretation. Provisions are recognized where appropriate, based on estimates of the amounts to be paid to the tax authorities. Tax expenses for the period include current and deferred income tax and social contribution. Income tax and social contribution are recognized in profit or loss; however, if the tax relates to items that are credited or charged directly to equity, the tax is also credited or charged directly to equity.
2.19 Employee benefits – pension plan Defined benefit plan obligations are the present value of the defined benefit obligation at the balance sheet date, as adjusted for actuarial gains or losses and past service costs, and reduced by the fair value of the plan assets. The defined benefit obligation is determined annually by independent actuaries using the projected unit credit method. The present value of the defined benefit obligation is determined based on the expected future payments required to settle the obligation, using the interest rates of public securities, whose maturities approximate the maturities of the related liability. Actuarial gains and losses, which arise from experience adjustments and changes in actuarial assumptions and exceed 10% of the greater of the fair value of plan assets or plan liabilities, are charged or credited to expenses or income over the expected remaining working lives of the participating employees.

Braskem S.A. and Subsidiaries Notes to the Financial Statements at December 31, 2010 and 2009 Amounts in thousands of Brazilian reais, except when otherwise indicated
36
Under a defined contribution plan, the Company pays contributions into a privately-managed fund on a compulsory, contractual or voluntary basis but has no obligation to make further payments. Regular contributions are included in personnel costs (Note 24).
2.20 Contingent assets, legal obligations and judicial deposits
The recognition, measurement and disclosure of contingent assets and legal obligations are made in accordance with CPC 25 and IAS 37, as follows:
i) Contingent assets – are not recognized on the accounting, unless management considers that a gain is virtually certain or if there are tangible guarantees or unappealable favorable court decisions.
ii) Legal obligations – arise from tax obligations, whose legality or constitutionality is being challenged in a court of law and regardless of the probability of a successful outcome, are fully recognized in the financial statements.
iii) Judicial deposits – are included in non-current assets, without offset against the related provisions for contingencies or legal obligations, unless such deposit is legally offsetable against the liability and the company plans to set off such amounts. In such cases, the deposit asset is netted against the related liability.
2.21 Offset of financial instruments
Financial assets and liabilities are offset and the net amount is reported in the balance sheet when there is a legally applicable right to offset the recognized amounts, and there is an intention of settling them on a net basis, or of realizing the asset and settling the liability simultaneously.
2.22 Sales revenue recognition
Sales revenue represents the fair value of the consideration received or receivable for sale of goods and services in normal course of business and is recorded on the accrual basis. Revenues are shown net of value-added-tax, returns, rebates and discounts and after eliminating sales within the group.
Revenue arising from the sale of goods is recognized: (i) when the amount of revenue can be measured reliably and the Company retains neither effective control over the goods sold nor continuing managerial involvement to the degree usually associated with ownership; (ii) the costs incurred or to be incurred in respect of the transaction can be measured reliably; (iii) it is probable that the economic benefits associated with the transaction will flow to the Company; and (iv) all the risks and rewards of ownership have been transferred to the buyer. Sales freight is included in cost of sales. Braskem's sales are mostly to industrial customers, and lower volume for retailers. Deliveries are made by truck, rail, ship or pipeline and the revenue recognition occurs when the risks and benefits inherent to the products are substantially transferred to the buyer. Based on the experience of the Company, accrued sales returns and discounts have no material impact in the Company´s financial statements and are not estimated or provisioned and there are no loss guarantees related to product performance.
2.23 Dividend distribution

Braskem S.A. and Subsidiaries Notes to the Financial Statements at December 31, 2010 and 2009 Amounts in thousands of Brazilian reais, except when otherwise indicated
37
The distribution of dividends to the Company’s shareholders is recognized as a liability in the year-end financial statements, based on the Brazilian Corporation Law and the Company’s bylaws.
The amount related to the mandatory minimum dividend payment is recognized in liabilities under dividends payable because it is considered to be a legal obligation under the Company’s bylaws. The amount of dividends greater than the mandatory minimum dividend, declared by the Company’s management after the reporting period but before the date of authorization to issue the financial statements, is not recorded as a liability, but is shown under the caption “proposed additional dividend” in equity. 2.24 Operating leases
Leases under which a significant portion of the risks and rewards of ownership is retained by the lessor are classified as operating leases. Operating lease payments (net of any incentives received from the lessor) are recognized as an expense in the statement of income over the lease term on a straight-line basis.
2.25 Standards, changes and interpretations of standards that is not yet effective Standards, changes and interpretations of current standards that are not yet effective and have not been adopted by the Company and its subsidiaries:
Standards Term Requirements
IFRIC 19 Extinguish Financial Liabilities with Equity Instruments
From fiscal years beginning on 07/01/2010
Extinction of financial liabilities to equity instruments - The standard clarifies the accounting and should be applied when renegotiating terms of a financial liability results in the issuance of an equity instrument by the Company to the lender in order to partially or completely extinguish that debt. This standard will be applied by the Company from January 1, 2011.
a. IFRS 9
b. Financial
instruments
From fiscal years beginning
on 01/01/2013
(earlier adoption permitted)
This standard introduces new requirements for classifying and measuring
financial assets and is likely to affect the recognition and measurement of
financial assets of the Company. The rule does not apply until January 1,
2013 but is available for early adoption.
3 Application of Judgment and Critical Accounting Practices
Critical accounting practices are those which: a) are important to show the financial condition and the results of the Company; and (b) require more difficult, subjective or complex rulings on the part of management frequently resulting in the necessity to make estimates which have an impact on matters that are inherently uncertain. Increases in the number of variables and assumptions that affect the possible future resolution of these uncertainties makes these judgments even more subjective and complex. In the preparation of these financial statements, the Company has adopted variables and assumptions derived from historical experience and various other factors it believes to be reasonable and relevant. Even though these estimates and assumptions are reviewed by the Company in the normal course of business, the presentation of its financial condition and result of operations frequently require the use of judgments about the effects of inherently uncertain matters on the book value of the assets and liabilities. The actual results may differ from the estimates under different variables, assumptions or conditions. An understanding of how the Company forms its judgments about future events, including the variables and assumptions used in the estimates, is included in the following comments

Braskem S.A. and Subsidiaries Notes to the Financial Statements at December 31, 2010 and 2009 Amounts in thousands of Brazilian reais, except when otherwise indicated
38
referring to each critical accounting practice of substantial complexity in the preparation of these financial statements:
3.1 Deferred income tax and social contribution
The liability method described in CPC 32 and IAS12 is used to account for deferred income tax and social contribution relating to temporary differences between the book values of the assets and liabilities and the respective values for tax purposes. The deferred income tax and social contribution assets are reviewed on each date of the financial statements and reduced by any amount not expected to be realized against future taxable profit. Deferred tax assets and liabilities are calculated using the rates applicable to the taxable profit in the years that these temporary differences will be realized. The future taxable profit could be greater or smaller than the estimates considered when the tax asset is recorded.
The deferred tax assets recognized on income tax and social contribution losses are supported by projections of taxable results presented annually to management. These projections consider the history of profitability of the Company and its subsidiaries and the perspectives of generating sufficient taxable profit to recover the credits in the future. Deferred tax liabilities of the same tax payment entity are taken into account as a source of recoverability for deferred tax assets, based on the timing of expected reversal. 3.2 Pension plans
Actuarial gains and losses are recognized in the period that they occur and are recorded in the statement of operations.
The Company recognizes the obligation of the employee defined benefit plans and related costs, net of the plan assets, adopting the following practices:
i) Pension cost is determined by actuaries using the projected unit credit method and the best estimate of management about the expected performance of the plan assets, salary increases and retirement age of employees. The discount rate used to determine the future benefit obligation and is an estimate of the current rate of interest at the date of the balance sheet for a high quality fixed rate investments which matures at the same time as the expected obligations.
ii) Pension plan assets are valued at market value.
iii) Plan curtailments are significant alterations to service time expected from the active employees. A net curtailment loss is recognized when the event is probable, and can be estimated, while a net gain is deferred until it is realized.
Various statistics and other factors are used in the accounting for pension benefits in order to anticipate future events for the calculation of the expense and obligation related to the plans. These factors include discount rate, expected return on plan assets and salary increases. Additionally actuaries use subjective factors such as rate of staff turnover, rotation and mortality to estimate these factors. The actuarial assumptions used by the Company could be materially different for the actual result due to changes in economic conditions and the market such as regulatory events, judicial decisions, higher or lower staff turnover or longevity of the participants being shorter or longer (Note 24).
3.3 Derivative financial instruments

Braskem S.A. and Subsidiaries Notes to the Financial Statements at December 31, 2010 and 2009 Amounts in thousands of Brazilian reais, except when otherwise indicated
39
The Company values the derivative financial instruments at their fair value on the date of the financial statements, mainly based on market quotations. Nevertheless the high volatility of the foreign exchange and interest rate markets in Brazil caused, in certain periods, significant movements in future rates and interest rates over short periods of time, leading to significant variances in the market value of swaps and other financial instruments. The market value recognized in the financial statements may not necessarily represent the amount of cash that the Company would receive or pay, as applicable, if the Company were to settle the transaction at the date of the financial statements (Note 19).
3.4 Useful life of long-lived assets
The Company recognizes the depreciation of its long-lived assets based on the estimated useful life which in turn is based on industry practices and previous experience and reflects the economic life of the long-lived assets. However, the actual useful life can vary based on the current state of technologies at each unit. The useful life of the long-lived asset also affects the impairment testing.
The Company does not believe that have no indications of material change in the estimates and assumptions used in the calculation or the impairment losses of long-lived assets. However, if the actual results are not consistent with the estimates and assumptions used in the future cash flows estimating the fair value of the assets, the Company could be exposed to losses, which could be significant.
3.5 Valuation of assets and liabilities in business combinations
The Company has entered into certain business combinations, as described in Note 5, in accordance with CPC
15 and IFRS 3 in the case of acquisitions occurring after the transition date to IFRS. The Company has allocated the cost of the entity acquired to the assets acquired and liabilities assumed, on a fair value basis, estimated at the date of acquisition. Any difference between the cost of the acquisition and the fair value of the assets acquired and liabilities assumed is recorded as goodwill. The Company exercises significant judgment in the process of identifying the tangible and intangible assets and liabilities, valuing such assets and liabilities in determining the remaining useful life. Assumptions used to value those assets and liabilities include estimates of discounted cash flows or discount rates and may result in a difference between the estimated and actual values. the actual results are not consistent with the estimates and assumptions used, the Company could be exposed to losses If, which could be significant.
3.6 Contingencies
The Company is currently involved in numerous legal and administrative processes as described in Note 25. The Company has accrued amounts relating to contingencies when it believes the unfavorable decision, according to the evaluations of external advisors are considered remote. Additionally, the Company recognizes the fair value of the Quattor contingencies assessed as involving possible losses, as required by the rules applicable to business combinations. The Company’s management believes that the evaluations based on the opinion of the external advisors are appropriate, although such accruals could differ from the actual result when realized.

Braskem S.A. and Subsidiaries Notes to the Financial Statements at December 31, 2010 and 2009 Amounts in thousands of Brazilian reais, except when otherwise indicated
40
3.7 – Impairment test for long-lived assets There are specific rules to test the recoverability of long-lived assets, especially property, goodwill and other intangibles. On the date of each financial statement, the Company makes an analysis to determine if there is evidence that the long-lived assets may not be recoverable. If such evidence is identified, the recoverable amount of the assets is estimated by the Company. The recoverable amount of an asset is determined as the greater of: (a) the fair value minus estimated costs of sale; and (b) the value in use. The value in use is measured based on pre-tax discounted cash flows generated by the continuous use of the asset until the end of its useful life. When the book value exceeds the recoverable amount, the Company recognizes an appropriate provision. Whether or not there are indications that an asset might not be recovered, the balance of goodwill arising from business combinations and intangible assets with an indefinite useful life are tested for impairment at least once a year as at the date of the financial statements. For this test, the Company uses accepted market practices including discounted cash flows for units with goodwill allocated and compares the book value with the recoverable value of the assets. Except in the case of goodwill reversal of an impairment loss on assets is permitted. Non financial assets other than goodwill that suffered an impairment are reviewed for potential reversal of impairment at each reporting date. The recoverability of goodwill is evaluated when facts and circumstances which could result in the necessity to anticipate the annual test are identified. If some fact or circumstance indicates that the recoverability of goodwill is affected, the test is anticipated. In December 2010 the Company tested goodwill for all cash generating units and /or business units representing the lowest level at which goodwill is monitored by management based on projections of expected discounted cash flows and taking into consideration the assumptions about cost of capital, growth rates and adjustments used for perpetuity in the cash flow, methodology for the determination of working capital, investment plan and economic long-term financial forecast. The impairment review process is subjective and requires significant judgment in performing the analysis. The evaluation of cash generating units and/or business units of the Company based on projected cash flows could be negatively affected, mainly if it does not take into account an eventual deterioration of the petrochemical market, significant drop in the world petrochemical spreads, suspension of activities at the Company’s industrial plants or relevant changes in the economy of financial markets that result in a perception of risk of reduction in liquidity and capacity to refinance.
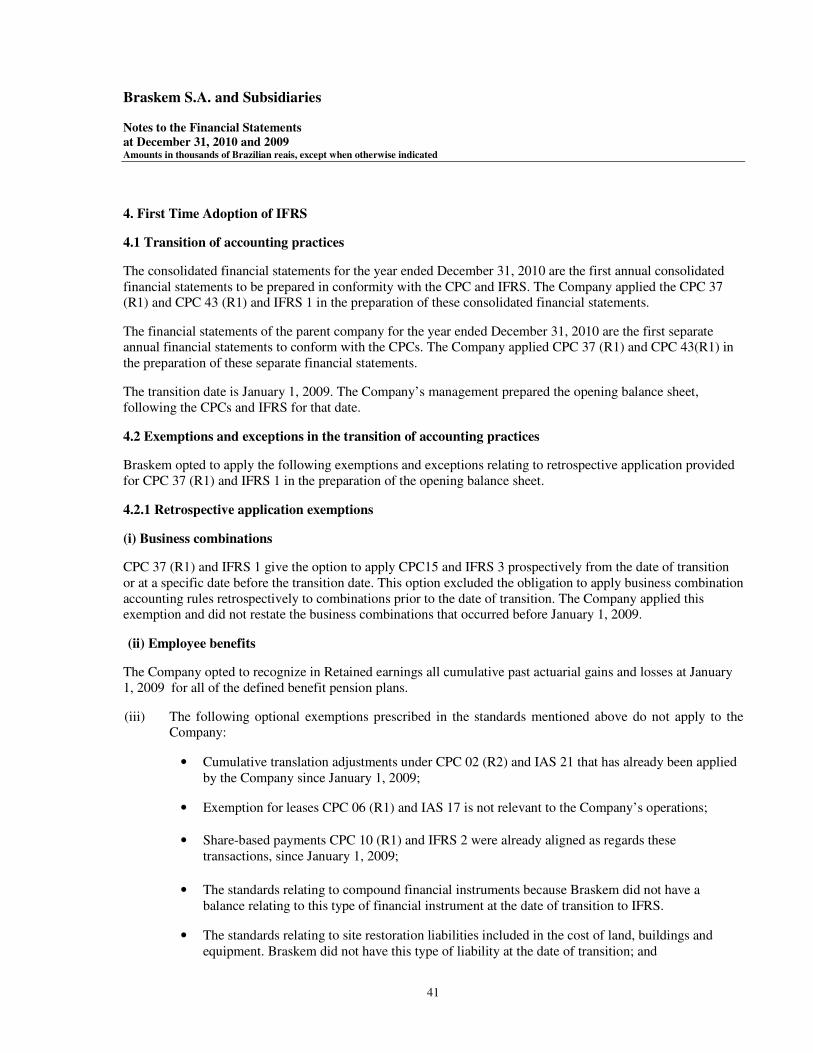
Braskem S.A. and Subsidiaries Notes to the Financial Statements at December 31, 2010 and 2009 Amounts in thousands of Brazilian reais, except when otherwise indicated
41
4. First Time Adoption of IFRS
4.1 Transition of accounting practices
The consolidated financial statements for the year ended December 31, 2010 are the first annual consolidated financial statements to be prepared in conformity with the CPC and IFRS. The Company applied the CPC 37 (R1) and CPC 43 (R1) and IFRS 1 in the preparation of these consolidated financial statements.
The financial statements of the parent company for the year ended December 31, 2010 are the first separate annual financial statements to conform with the CPCs. The Company applied CPC 37 (R1) and CPC 43(R1) in the preparation of these separate financial statements.
The transition date is January 1, 2009. The Company’s management prepared the opening balance sheet, following the CPCs and IFRS for that date.
4.2 Exemptions and exceptions in the transition of accounting practices
Braskem opted to apply the following exemptions and exceptions relating to retrospective application provided for CPC 37 (R1) and IFRS 1 in the preparation of the opening balance sheet.
4.2.1 Retrospective application exemptions
(i) Business combinations
CPC 37 (R1) and IFRS 1 give the option to apply CPC15 and IFRS 3 prospectively from the date of transition or at a specific date before the transition date. This option excluded the obligation to apply business combination accounting rules retrospectively to combinations prior to the date of transition. The Company applied this exemption and did not restate the business combinations that occurred before January 1, 2009.
(ii) Employee benefits
The Company opted to recognize in Retained earnings all cumulative past actuarial gains and losses at January 1, 2009 for all of the defined benefit pension plans.
(iii) The following optional exemptions prescribed in the standards mentioned above do not apply to the Company:
• Cumulative translation adjustments under CPC 02 (R2) and IAS 21 that has already been applied by the Company since January 1, 2009;
• Exemption for leases CPC 06 (R1) and IAS 17 is not relevant to the Company’s operations;
• Share-based payments CPC 10 (R1) and IFRS 2 were already aligned as regards these transactions, since January 1, 2009;
• The standards relating to compound financial instruments because Braskem did not have a
balance relating to this type of financial instrument at the date of transition to IFRS.
• The standards relating to site restoration liabilities included in the cost of land, buildings and equipment. Braskem did not have this type of liability at the date of transition; and

Braskem S.A. and Subsidiaries Notes to the Financial Statements at December 31, 2010 and 2009 Amounts in thousands of Brazilian reais, except when otherwise indicated
42
• Financial assets or intangible assets accounted for in accordance with ICPC 01 and IFRIC 12. Braskem did not have contracts within the scope of these standards.
4.2.2 Retrospective application exceptions
(i) Hedge accounting
Management has used hedge accounting since January 1, 2009 only in cases where the hedging relationship meets the criteria prescribed in CPC 38 and IAS 39. At the date of transition, the Company had derivatives designated as cash flow hedges that qualified for hedge accounting (Note 19).
(ii) Estimates The estimates in accordance with CPCs and IFRS on January 1, 2009 were consistent with the previous accounting practices adopted by the Company.
(iii) Others
The following remaining retrospective application exceptions are not applicable to the Company
• De-recognition of financial assets and liabilities; and
• Participation of non-controlling shareholders in subsidiaries. 4.3 Reconciliation between BR GAAP and CPCs and IFRS CPC 37 (R1) and IFRS 1 require that the Company prepare a reconciliation of equity at the date of transition and as of December 31, 2009 as well as of the statements of income, comprehensive income and cash flows for the year ended December 31, 2009. The following tables present the reconciliation of the consolidated financial statements and parent company for the detailed balance sheet and other statements for December 31, 2009.

Braskem S.A. and Subsidiaries Notes to the Financial Statements at December 31, 2010 and 2009 Amounts in thousands of Brazilian reais, except when otherwise indicated
43
4.3.1. Reconciliation of opening balance sheet
a) Parent Company
BRGAAP Parent Company
Parent Company reclassifications GAAP adjusted to
Assets Note (4.4) BR GAAP (4.5) adjustments CPCs
Current assets
Cash and cash equivalents (j.iv) 2,262,804 - 31,320 2,294,124
Available for sale - 261,453 - - 261,453
Held for trading (j.iv) 204,936 - (31,320) 173,616
Trade accounts receivable (j.i) 1,040,212 - 362,418 1,402,630
Inventories (j.v) 1,769,798 - (222,633) 1,547,165
Taxes recoverable - 482,494 - - 482,494
Dividends and interest on capital - 3,736 - - 3,736
Deferred income tax and social contribution (j.ii) 55,972 - (55,972) -
Prepaid expenses - 22,085 - - 22,085
Other accounts receivables - 120,518 - - 120,518
6,224,008 - 83,813 6,307,821
Non-current assets
Held to maturity - 15,811 - - 15,811
Hedge accounting transactions - 5,334 (5,334) - -
Trade accounts receivable - 58,343 - - 58,343
Inventories (j.v) 29,273 - (29,273) -
Taxes recoverable - 1,253,889 - - 1,253,889
Deferred income tax and social contribution (i) 963,514 - 113,165 1,076,679
Judicial deposits (j.iii) 147,327 (3,816) 70,022 213,533
Related parties - 70,054 - - 70,054
Other accounts receivable - 67,770 9,150 - 76,920
Investments in subsidiaries (a) e (g) 518,907 - (107,260) 411,647
Investment in associated companies (a) 20,686 - 115,991 136,677
Other investments - 6,575 - - 6,575
Property, plant and equipment (c), (h) e (j.v) 9,850,672 - 977,781 10,828,453
Intangible assets (h) 2,329,011 - (17,000) 2,312,011
Deferred charges (e) 70,980 - (70,980) -
15,408,146 - 1,052,446 16,460,592
Total assets 21,632,154 - 1,136,259 22,768,413
December 31, 2009

Braskem S.A. and Subsidiaries Notes to the Financial Statements at December 31, 2010 and 2009 Amounts in thousands of Brazilian reais, except when otherwise indicated
44
BRGAAP Parent Company
Parent Company reclassifications GAAP adjusted to
Assets Note (4.4) BR GAAP (4.5) adjustments CPCs
Current assets
Cash and cash equivalents - 2,199,862 - - 2,199,862
Available for sale - 331,452 - - 331,452
Held to maturity - 187,446 - - 187,446
Trade accounts receivable (j.i) 888,129 - 1,138,972 2,027,101
Inventories (j.v) 2,719,252 - (244,975) 2,474,277
Taxes recoverable - 582,385 - - 582,385
Dividends and interest on capital - 7,162 - - 7,162
Deferred income tax and social contribution (j.ii) 55,972 - (55,972) -
Prepaid expenses - 65,187 - - 65,187
Other receivable - 114,805 - - 114,805
7,151,652 - 838,025 7,989,677
Non-current assets
Held to maturity - 9,717 - - 9,717
Trade accounts receivable - 46,666 - - 46,666
Inventories (j.v) 20,637 - (20,637) -
Taxes recoverable - 1,197,710 - - 1,197,710
Deferred income tax and social contribution (i) 640,008 - 613,923 1,253,931
Judicial deposits (j.iii) 110,540 (20,045) 72,937 163,432
Related parties - 84,055 - - 84,055
Other accounts receivable - 44,786 20,045 - 64,831
Investments in subsidiaries (a) e (g) 476,973 - (95,555) 381,418
Investment in associated companies (a) 23,044 - 104,286 127,330
Other investments - 11,770 - - 11,770
Property, plant and equipment (c), (e) e (j.v) 10,123,154 - 884,309 11,007,463
Intangible assets (d) 2,315,626 - (25,120) 2,290,506
Deferred charges (e) 107,447 - (107,447) -
15,212,133 - 1,426,696 16,638,829
Total assets 22,363,785 - 2,264,721 24,628,506
January 1, 2009
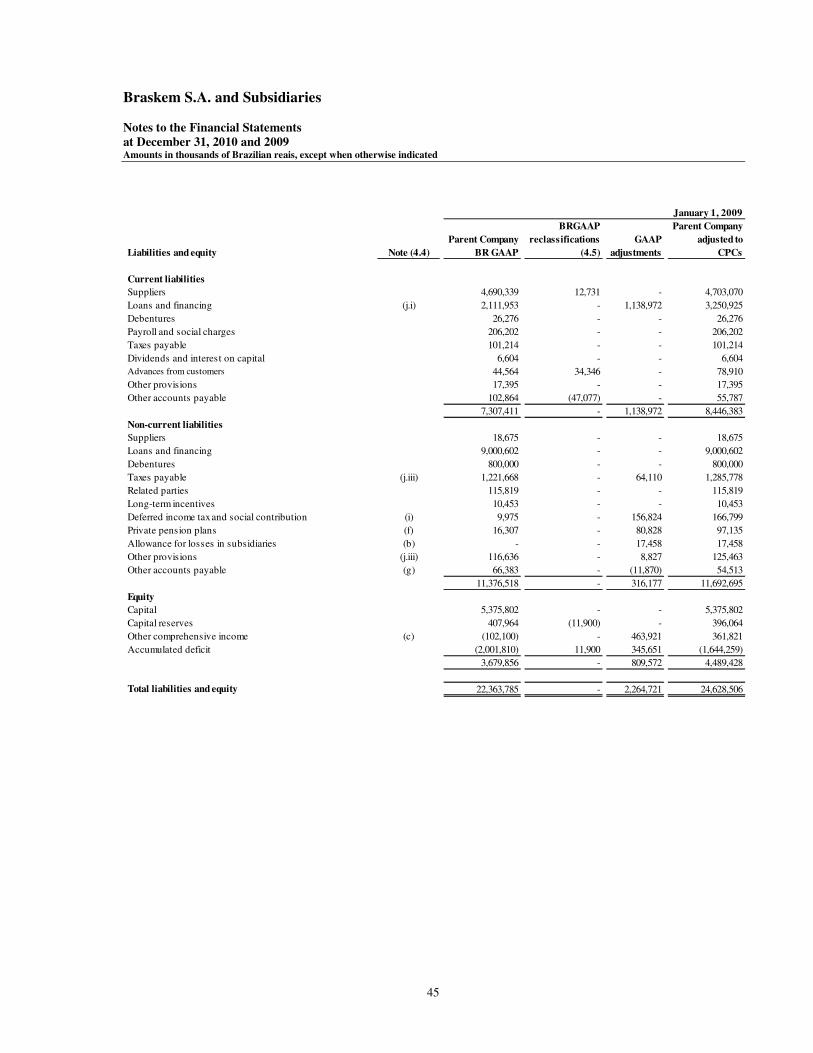
Braskem S.A. and Subsidiaries Notes to the Financial Statements at December 31, 2010 and 2009 Amounts in thousands of Brazilian reais, except when otherwise indicated
45
BRGAAP Parent Company
Parent Company reclassifications GAAP adjusted to
Liabilities and equity Note (4.4) BR GAAP (4.5) adjustments CPCs
Current liabilities
Suppliers - 4,690,339 12,731 - 4,703,070
Loans and financing (j.i) 2,111,953 - 1,138,972 3,250,925
Debentures - 26,276 - - 26,276
Payroll and social charges - 206,202 - - 206,202
Taxes payable - 101,214 - - 101,214
Dividends and interest on capital - 6,604 - - 6,604
Advances from customers - 44,564 34,346 - 78,910
Other provisions - 17,395 - - 17,395
Other accounts payable - 102,864 (47,077) - 55,787
7,307,411 - 1,138,972 8,446,383
Non-current liabilities
Suppliers - 18,675 - - 18,675
Loans and financing - 9,000,602 - - 9,000,602
Debentures - 800,000 - - 800,000
Taxes payable (j.iii) 1,221,668 - 64,110 1,285,778
Related parties - 115,819 - - 115,819
Long-term incentives - 10,453 - - 10,453
Deferred income tax and social contribution (i) 9,975 - 156,824 166,799
Private pension plans (f) 16,307 - 80,828 97,135
Allowance for losses in subsidiaries (b) - - 17,458 17,458
Other provisions (j.iii) 116,636 - 8,827 125,463
Other accounts payable (g) 66,383 - (11,870) 54,513
11,376,518 - 316,177 11,692,695
Equity
Capital - 5,375,802 - - 5,375,802
Capital reserves - 407,964 (11,900) - 396,064
Other comprehensive income (c) (102,100) - 463,921 361,821
Accumulated deficit - (2,001,810) 11,900 345,651 (1,644,259)
3,679,856 - 809,572 4,489,428
Total liabilities and equity 22,363,785 - 2,264,721 24,628,506
January 1, 2009

Braskem S.A. and Subsidiaries Notes to the Financial Statements at December 31, 2010 and 2009 Amounts in thousands of Brazilian reais, except when otherwise indicated
46
b) Consolidated
BRGAAP Cetrel RPR Consolidated
Consolidated reclassifications Desconsolidation proportional GAAP adjusted to
Assets Note (4.4) BR GAAP (4.5) (4.4.a) consolidation (4.4.b) adjustments CPCs and IFRS
Current assets
Cash and cash equivalents - 2,429,717 - (17,812) 1,844 - 2,413,749
Available for sale - 331,452 - - - - 331,452
Held to maturity - 187,446 - - - - 187,446
Trade accounts receivable (j.i) 996,187 - (9,455) 904 1,138,972 2,126,608
Inventories (j.v) 2,948,096 - (1,885) 7,970 (244,975) 2,709,206
Taxes recoverable - 610,712 - (1,754) 3,324 - 612,282
Deferred income tax and social contribution (j.ii) 59,555 - (416) - (59,139) -
Prepaid expenses - 65,840 - (136) 56 - 65,760
Other accounts receivables - 123,076 - 3 5 - 123,084
7,752,081 - (31,455) 14,103 834,858 8,569,587
Non-current assets
Held to maturity - 11,550 - (1,833) - - 9,717
Trade accounts receivable - 47,129 - - - - 47,129
Inventories (j.v) 20,637 - - - (20,637) -
Taxes recoverable - 1,201,816 - - - - 1,201,816
Deferred income tax and social contribution (i) 654,463 - (9,984) - 617,090 1,261,569
Judicial deposits (j.iii) 120,143 (20,211) (5,293) - 72,940 167,579
Related parties - 45,880 - 73 - - 45,953
Other accounts receivable - 46,101 20,211 - 44 - 66,356
Investments in subsidiaries (a) - - 104,286 - (104,286) -
Investment in associated companies (a) 23,044 - - - 104,286 127,330
Other investments - 13,742 - (170) 130 - 13,702
Property, plant and equipment (c), (e) e (j.v) 10,278,401 - (80,269) 11,579 884,309 11,094,020
Intangible assets (d) e (e) 2,378,707 - (11,992) - (24,828) 2,341,887
Deferred charges (e) 108,248 - (509) - (107,739) -
14,949,861 - (5,691) 11,753 1,421,135 16,377,058
Total assets 22,701,942 - (37,146) 25,856 2,255,993 24,946,645
January 1, 2009

Braskem S.A. and Subsidiaries Notes to the Financial Statements at December 31, 2010 and 2009 Amounts in thousands of Brazilian reais, except when otherwise indicated
47
BRGAAP Cetrel RPR Consolidated
Consolidated reclassifications Desconsolidation proportional GAAP adjusted to
Liabilities and equity Note (4.4) BR GAAP (4.5) (4.4.a) consolidation (4.4.b) adjustments CPCs and IFRS
Current liabilities
Suppliers - 4,906,747 12,731 (2,292) 3,572 - 4,920,758
Loans and financing (j.i) 2,119,995 - (4,611) 25,107 1,138,972 3,279,463
Debentures - 26,276 - - - - 26,276
Hedge accounting transactions - 31,531 - - - - 31,531
Payroll and social charges - 218,052 - (3,450) 483 - 215,085
Taxes payable - 105,606 - (1,081) 733 - 105,258
Deferred income tax and social contribution - 247 - (247) - - -
Dividends and interest on capital - 6,604 - - 104 - 6,708
Advances from customers - 49,015 37,520 (399) - - 86,136
Other provisions - 19,831 - (1,078) 116 - 18,869
Other accounts payable - 121,300 (50,251) (2,939) 196 - 68,306
7,605,204 - (16,097) 30,311 1,138,972 8,758,390
Non-current liabilities
Suppliers - 18,675 - - - - 18,675
Loans and financing - 9,039,821 - (9,880) - - 9,029,941
Debentures - 800,000 - - - - 800,000
Hedge accounting transactions - 77,913 - - - - 77,913
Taxes payable (j.iii) 1,231,236 - (5,306) - 64,113 1,290,043
Long-term incentives - 10,453 - - - - 10,453
Deferred income tax and social contribution (i) 23,302 - (5,184) - 156,824 174,942
Private pension plans (f) 20,041 - - 12,905 80,828 113,774
Allowance for losses in subsidiaries (b) - - - (17,458) 17,458 -
Other provisions (j.iii) 117,876 - (453) 98 8,827 126,348
Other accounts payable (g) 77,565 - (226) - (20,601) 56,738
11,416,882 - (21,049) (4,455) 307,449 11,698,827
Equity
Capital - 5,375,802 - - - - 5,375,802
Capital reserves - 396,064 - - - - 396,064
Other comprehensive income (c) (102,100) - - - 463,921 361,821
Accumulated deficit - (1,989,910) - - - 345,651 (1,644,259)
3,679,856 - - - 809,572 4,489,428
Total liabilities and equity 22,701,942 - (37,146) 25,856 2,255,993 24,946,645
January 1, 2009
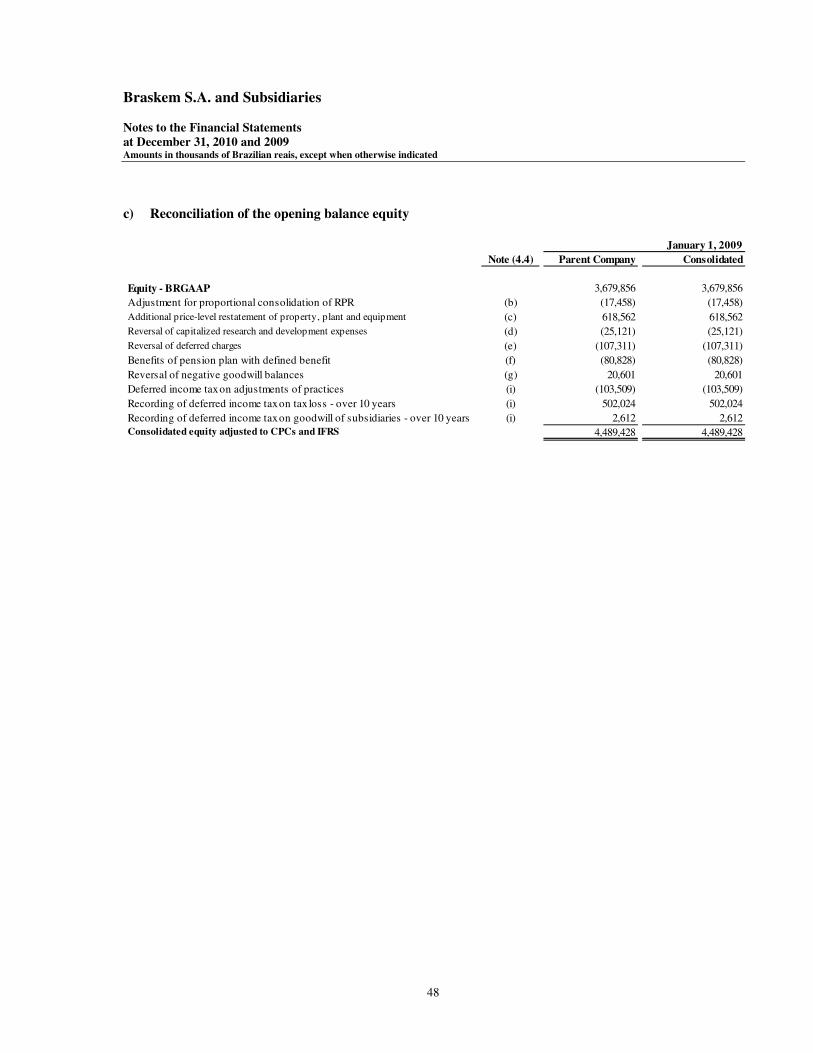
Braskem S.A. and Subsidiaries Notes to the Financial Statements at December 31, 2010 and 2009 Amounts in thousands of Brazilian reais, except when otherwise indicated
48
c) Reconciliation of the opening balance equity
Note (4.4) Parent Company Consolidated
Equity - BRGAAP 3,679,856 3,679,856
Adjustment for proportional consolidation of RPR (b) (17,458) (17,458)
Additional price-level restatement of property, plant and equipment (c) 618,562 618,562
Reversal of capitalized research and development expenses (d) (25,121) (25,121)
Reversal of deferred charges (e) (107,311) (107,311)
Benefits of pension plan with defined benefit (f) (80,828) (80,828)
Reversal of negative goodwill balances (g) 20,601 20,601
Deferred income tax on adjustments of practices (i) (103,509) (103,509)
Recording of deferred income tax on tax loss - over 10 years (i) 502,024 502,024
Recording of deferred income tax on goodwill of subsidiaries - over 10 years (i) 2,612 2,612
Consolidated equity adjusted to CPCs and IFRS 4,489,428 4,489,428
January 1, 2009

Braskem S.A. and Subsidiaries Notes to the Financial Statements at December 31, 2010 and 2009 Amounts in thousands of Brazilian reais, except when otherwise indicated
49
4.3.2. Reconciliation of financial statements a) Parent Company
BRGAAP Parent Company
Parent Company reclassifications GAAP adjusted to
Assets Note (4.4) BR GAAP (4.5) adjustments CPCs
Current assets
Cash and cash equivalents (j.iv) 2,262,804 - 31,320 2,294,124
Available for sale - 261,453 - - 261,453
Held for trading (j.iv) 204,936 - (31,320) 173,616
Trade accounts receivable (j.i) 1,040,212 - 362,418 1,402,630
Inventories (j.v) 1,769,798 - (222,633) 1,547,165
Taxes recoverable - 482,494 - - 482,494
Dividends and interest on capital - 3,736 - - 3,736
Deferred income tax and social contribution (j.ii) 55,972 - (55,972) -
Prepaid expenses - 22,085 - - 22,085
Other accounts receivables - 120,518 - - 120,518
6,224,008 - 83,813 6,307,821
Non-current assets
Held to maturity - 15,811 - - 15,811
Hedge accounting transactions - 5,334 (5,334) - -
Trade accounts receivable - 58,343 - - 58,343
Inventories (j.v) 29,273 - (29,273) -
Taxes recoverable - 1,253,889 - - 1,253,889
Deferred income tax and social contribution (i) 963,514 - 113,165 1,076,679
Judicial deposits (j.iii) 147,327 (3,816) 70,022 213,533
Related parties - 70,054 - - 70,054
Other accounts receivable - 67,770 9,150 - 76,920
Investments in subsidiaries (a) e (g) 518,907 - (107,260) 411,647
Investment in associated companies (a) 20,686 - 115,991 136,677
Other investments - 6,575 - - 6,575
Property, plant and equipment (c), (h) e (j.v) 9,850,672 - 977,781 10,828,453
Intangible assets (h) 2,329,011 - (17,000) 2,312,011
Deferred charges (e) 70,980 - (70,980) -
15,408,146 - 1,052,446 16,460,592
Total assets 21,632,154 - 1,136,259 22,768,413
December 31, 2009

Braskem S.A. and Subsidiaries Notes to the Financial Statements at December 31, 2010 and 2009 Amounts in thousands of Brazilian reais, except when otherwise indicated
50
BRGAAP Parent Company
Parent Company reclassifications GAAP adjusted to
Liabilities and equity Note (4.4) BR GAAP (4.5) adjustments CPCs
Current liabilities
Suppliers - 3,311,103 15,575 - 3,326,678
Loans and financing (j.i) 1,518,159 - 362,418 1,880,577
Debentures - 316,729 - - 316,729
Hedge accounting and derivatives transactions - 10,805 27,108 - 37,913
Salaries and social charges - 258,419 - - 258,419
Taxes payable - 1,160,990 - - 1,160,990
Dividends and interest on capital - 2,861 - - 2,861
Advances from customers - 28,444 37,990 - 66,434
Other provisions - 30,748 - - 30,748
Other accounts payable - 86,067 (80,673) - 5,394
Related parties - 66,798 - - 66,798
6,791,123 - 362,418 7,153,541
Non-current liabilities
Suppliers - 23,140 - - 23,140
Loans and financing - 7,427,865 - - 7,427,865
Debentures - 500,000 - - 500,000
Taxes payable (j.iii) 1,211,954 - 61,195 1,273,149
Related parties - 11,397 - - 11,397
Long-term incentives - 7,709 - - 7,709
Deferred income tax and social contribution (i) 848,823 - 249,768 1,098,591
Private pension plans (f) 23,207 - 73,341 96,548
Allowance for losses in subsidiaries (b) 1,969 - 1,829 3,798
Other provisions (j.iii) 121,892 - 8,827 130,719
Other accounts payable (g) 70,587 - (7,275) 63,312
10,248,543 - 387,685 10,636,228
Equity
Capital - 5,473,181 - - 5,473,181
Capital reserves - 416,675 - - 416,675
Other comprehensive income (c) (66,177) - 381,015 314,838
Treasury stock (h) (11,932) - 1,556 (10,376)
Accumulated deficit - (1,219,259) - 3,585 (1,215,674)
4,592,488 - 386,156 4,978,644
Total liabilities and equity 21,632,154 - 1,136,259 22,768,413
December 31, 2009

Braskem S.A. and Subsidiaries Notes to the Financial Statements at December 31, 2010 and 2009 Amounts in thousands of Brazilian reais, except when otherwise indicated
51
BRGAAP Parent Company
Parent Company reclassifications GAAP adjusted to
Statement of operations Note (4.4) BR GAAP (4.5) adjustments CPCs
Net sales (j.vi) 13,903,577 687,805 10,684 14,602,066
Cost of sales and services rendered (c), (d), (e), (h) (11,515,337) (642,067) (46,091) (12,203,495)
Gross profit 2,388,240 45,738 (35,407) 2,398,571
Income (expenses)
Selling - (203,769) (47,062) - (250,831)
Distribution - (284,238) (16,497) - (300,735)
General and administrative (e) e (g) (528,864) (87,201) 31,314 (584,751)
Research and development - (49,975) (10,923) - (60,898)
Equity in the results of investees (b) (61,577) - 15,629 (45,948)
Business combination (h) - - 102,051 102,051
Depreciation and amortization (e) e (g) (115,945) 115,945 - -
Other operating expenses (income), net (f), (h), (e), (j.vi) 5,118 - 1,769 6,887
Operating income 1,148,990 - 115,356 1,264,346
Financial income (expenses)
Financial expenses - 641,495 - - 641,495
Financial income - (156,887) - - (156,887)
484,608 - - 484,608
Profit before income tax and social contribution 1,633,598 - 115,356 1,748,954
Income tax and social contribution - current - (340,079) - - (340,079)
Income tax and social contribution - deferred (i) (525,727) - (484,657) (1,010,384)
(865,806) - (484,657) (1,350,463)
Net income for the year 767,792 - (369,301) 398,491
December 31, 2009

Braskem S.A. and Subsidiaries Notes to the Financial Statements at December 31, 2010 and 2009 Amounts in thousands of Brazilian reais, except when otherwise indicated
52
b) Consolidated
BRGAAP Proportional Consolidated
Consolidated reclassifications Desconsolidation consolidation GAAP adjusted to
Assets Note (4.4) BR GAAP (4.5) Cetrel (4.4.a) RPR (4.4.b) adjustments CPCs and IFRS
Current assets
Cash and cash equivalents (j.iv) 2,663,642 - (32,994) 21,100 31,320 2,683,068
Available for sale - 261,884 - - - - 261,884
Held to maturity (j.iv) 204,936 - - - (31,320) 173,616
Trade accounts receivable (j.i) 1,297,090 - (6,533) 13,492 362,418 1,666,467
Inventories (j.v) 1,919,124 - (1,818) 27,082 (222,633) 1,721,755
Recoverable taxes - 505,854 - (3,262) 3,706 - 506,298
Deferred income and social contribution taxes (j.ii) 59,164 - (412) - (58,752) -
Prepaid expenses - 22,295 - - - - 22,295
Other accounts receivable - 113,336 - (236) 172 - 113,272
7,047,325 - (45,255) 65,552 81,033 7,148,655
Non-current assets
Held to maturity - 17,787 - (1,976) - - 15,811
Hedge accounting transactions and other derivatives 5,334 (5,334) - - - -
Trade accounts receivable - 58,783 - - - - 58,783
Inventories (j.v) 29,273 - - - (29,273) -
Recoverable taxes - 1,259,801 - - - - 1,259,801
Deferred income and social contribution taxes (i) 973,419 - (8,560) - 115,945 1,080,804
Judicial deposits (j.iii) 154,592 (3,984) (5,953) 103 73,011 217,769
Related parties - 100,725 - - - - 100,725
Other accounts receivable - 69,228 9,318 - 44 - 78,590
Investments in subsidiaries (a) - - 115,991 - (115,991) -
Investments in associated companies (a) 20,686 - - - 115,991 136,677
Other investments - 8,620 - (15) - - 8,605
Property, plant and equipment (c), (h) e (j.v) 10,044,161 - (87,740) 13,476 977,781 10,947,678
Intangible assets (h) e (e) 2,335,955 - (1,332) - (16,764) 2,317,859
Deferred charges (e) 71,618 - (402) - (71,216) -
15,149,982 - 10,013 13,623 1,049,484 16,223,102
Total assets 22,197,307 - (35,242) 79,175 1,130,517 23,371,757
December 31, 2009

Braskem S.A. and Subsidiaries Notes to the Financial Statements at December 31, 2010 and 2009 Amounts in thousands of Brazilian reais, except when otherwise indicated
53
BRGAAP Proportional Consolidated
Consolidated reclassifications Desconsolidation consolidation GAAP adjusted to
Liabilities and equity Note (4.4) BR GAAP (4.5) Cetrel (4.4.a) RPR (4.4.b) adjustments CPCs and IFRS
Current liabilities
Suppliers - 3,823,451 15,584 (2,648) 22,396 - 3,858,783
Loans and financing (j.i) 1,504,063 - (5,055) 29,068 362,418 1,890,494
Debentures - 316,729 - - - - 316,729
Hedge accounting transactions and other derivatives - 52,559 27,108 - - - 79,667
Payroll and social charges - 270,029 - (4,231) 1,890 - 267,688
Taxes payable - 1,171,508 - (2,561) 6,725 - 1,175,672
Dividends and interest on capital - 2,863 - (3) 34 - 2,894
Advances from clients - 29,829 37,990 (431) - - 67,388
Other provisions - 30,748 - - 178 - 30,926
Other accounts payable - 104,702 (80,682) (1,053) 1,868 - 24,835
7,306,481 - (15,982) 62,159 362,418 7,715,076
Non-current liabilities
Suppliers - 23,229 - - - - 23,229
Loans and financing - 7,439,293 - (10,164) 5,810 - 7,434,939
Debentures - 500,000 - - - - 500,000
Hedge accounting transactions - 31,579 - - - - 31,579
Taxes payable (j.iii) 1,218,485 - (5,521) - 64,184 1,277,148
Long-term incentive - 7,709 - - - - 7,709
Deferred income and social contribution taxes (i) 848,839 - - - 249,768 1,098,607
Private pension plans (f) 23,208 - - 12,841 73,341 109,390
Provision for investment losses in subsidiaries (b) - - - (1,829) 1,829 -
Other provisions (j.iii) 123,097 - - 194 8,827 132,118
Other accounts payable (g) 82,899 - (3,575) - (16,006) 63,318
10,298,338 - (19,260) 17,016 381,943 10,678,037
Equity
Capital - 5,473,181 - - - - 5,473,181
Capital reserves - 416,675 - - - - 416,675
Other comprehensive income (c) (66,176) - - - 381,014 314,838
Treasury stock (h) (11,932) - - - 1,556 (10,376)
Accumulated losses - (1,219,260) - - - 3,586 (1,215,674)
4,592,488 - - - 386,156 4,978,644
Total liabilities and equity 22,197,307 - (35,242) 79,175 1,130,517 23,371,757
December 31, 2009
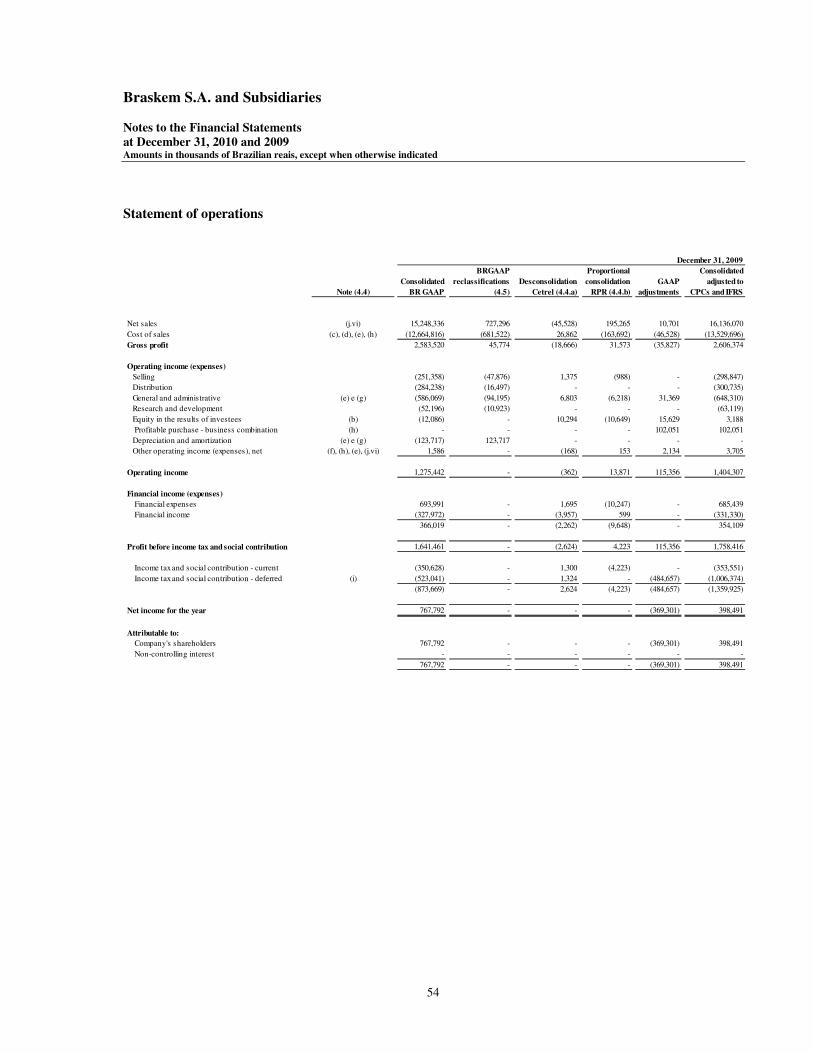
Braskem S.A. and Subsidiaries Notes to the Financial Statements at December 31, 2010 and 2009 Amounts in thousands of Brazilian reais, except when otherwise indicated
54
Statement of operations
BRGAAP Proportional Consolidated
Consolidated reclassifications Desconsolidation consolidation GAAP adjusted to
Note (4.4) BR GAAP (4.5) Cetrel (4.4.a) RPR (4.4.b) adjustments CPCs and IFRS
Net sales (j.vi) 15,248,336 727,296 (45,528) 195,265 10,701 16,136,070
Cost of sales (c), (d), (e), (h) (12,664,816) (681,522) 26,862 (163,692) (46,528) (13,529,696)
Gross profit 2,583,520 45,774 (18,666) 31,573 (35,827) 2,606,374
Operating income (expenses)
Selling - (251,358) (47,876) 1,375 (988) - (298,847)
Distribution - (284,238) (16,497) - - - (300,735)
General and administrative (e) e (g) (586,069) (94,195) 6,803 (6,218) 31,369 (648,310)
Research and development - (52,196) (10,923) - - - (63,119)
Equity in the results of investees (b) (12,086) - 10,294 (10,649) 15,629 3,188
Profitable purchase - business combination (h) - - - - 102,051 102,051
Depreciation and amortization (e) e (g) (123,717) 123,717 - - - -
Other operating income (expenses), net (f), (h), (e), (j.vi) 1,586 - (168) 153 2,134 3,705
Operating income 1,275,442 - (362) 13,871 115,356 1,404,307
Financial income (expenses)
Financial expenses - 693,991 - 1,695 (10,247) - 685,439
Financial income - (327,972) - (3,957) 599 - (331,330)
366,019 - (2,262) (9,648) - 354,109
Profit before income tax and social contribution 1,641,461 - (2,624) 4,223 115,356 1,758,416
Income tax and social contribution - current - (350,628) - 1,300 (4,223) - (353,551)
Income tax and social contribution - deferred (i) (523,041) - 1,324 - (484,657) (1,006,374)
(873,669) - 2,624 (4,223) (484,657) (1,359,925)
Net income for the year 767,792 - - - (369,301) 398,491
Attributable to:
Company's shareholders 767,792 - - - (369,301) 398,491
Non-controlling interest - - - - - -
767,792 - - - (369,301) 398,491
December 31, 2009

Braskem S.A. and Subsidiaries Notes to the Financial Statements at December 31, 2010 and 2009 Amounts in thousands of Brazilian reais, except when otherwise indicated
55
Statement of comprehensive income
No comprehensive income was presented in BR GAAP, and therefore the above reconciliation starts with the net income for the year. c) Reconciliation of equity at 12/31/2009
Consolidated and Consolidated
Parent Company Adjustments and Parent Company
Note BR GAAP reclassifications CPCs and IFRS
Net income for the year 767,792 (369,301) 398,491
Other comprehensive income:
Fair value variation in financial assets (10,722) - (10,722)
Fair value of cash flow hedges, net of taxes 42,794 - 42,794
Deferred income tax and social contribution - effects on other comprehensive 3,851 - 3,851
Total other comprehensive income 35,923 - 35,923
Comprehensive income for the period attributable to shareholders' 803,715 (369,301) 434,414
Year ended December 31, 2009
Note (4.4) Shareholders' equity Net income
Equity -BRGAAP 4,592,488 767,792
Adjustment of proportional consolidation - RPR (b) (1,829) 15,629
Additional price-level restatement of property, plant and equipment (c) 577,296 (41,266)
Reversal of capitalized research and development expenses (d) - 25,121
Reversal of deferred charges (e) (70,980) 36,330
Pension plan benefits - Defined benefit (f) (73,341) 7,487
Reversal of negative goodwill balances (g) 16,006 (4,595)
Business combination - Triunfo (h) 95,206 93,650
Write-off of goodwill - Triunfo Business Combination (h) (17,000) (17,000)
Deferred income tax - IFRS Adjustments (i) (141,546) 17,636
Recording of deferred income on tax losses - over 10 years (i) - (502,024)
Recording of deferred income tax on goodwill of subsidiaries - over 10 years (i) 2,344 (269)
Equity - Adjusted by CPCs and IFRS 4,978,644 398,491
December 31, 2009
Consolidated and Parent Company

Braskem S.A. and Subsidiaries Notes to the Financial Statements at December 31, 2010 and 2009 Amounts in thousands of Brazilian reais, except when otherwise indicated
56
d) Cash flow reconciliation
Breakdown of adjustments to reconcile the cash flow presentation:
Nota (4.4)
Consolidated
BR GAAP
RPR proportional
consolidation and Cetrel
Desconsolidation
Practice
Adjustments
Consolidated
adjstemented to
CPC's and IFRS
Net income before income tax and social contribution 1,641,461 1,599 115,356 1,758,416
Adjustments ro reconcile net income (loss) 144,546 (95,467) (124,869) (75,790)
Variation of assets and liabilities (420,844) 85,962 (766,426) (1,101,308)
Cash provided by operating activities 1,365,163 (7,906) (775,939) 581,318
Cash provided by investing activities (h) (842,934) 4,901 30,706 (807,327)
Cash provided by financing activities (288,304) 7,079 776,553 495,328
Net cash provided in the period 233,925 4,074 31,320 269,319
Cash at the begining of the period 2,429,717 (15,968) - 2,413,749
Cash at the end of the period (j.iv) 2,663,642 (11,894) 31,320 2,683,068
Net cash provided in the period 233,925 4,074 31,320 269,319
December 31, 2009
Adjustments Reclassifications
to effect to effect
Note (4.4) the Cash flow the Cash flow Total
Net income adjusted before income tax and social contribution
Bargain purchase (h) 102,051 - 102,051
Depreciation - Triunfo (*) (h) (4,315) - (4,315)
Inventories realization of capital gains - Triunfo (h) (4,086) - (4,086)
Write off of negative goodwill (h) (17,000) - (17,000)
Negative goodwill reversion (*) (g) (4,595) - (4,595)
Depreciation of additional indexation of property, plant and equipment (*) (c) (41,266) - (41,266)
Actuarial gain/loss (f) 7,487 - 7,487
Reversal in amortization of the capitalized interest on researchs and development (*) (d) 25,121 - 25,121
Deferred amortization reversal (*) (e) 36,330 - 36,330
Provision for loss on jointly controlled company (b) 15,629 - 15,629
115,356 - 115,356
Adjustments to reconcile net income
Depreciation and amortization of the period (*) (11,275) - (11,275)
Equity investees (b) (15,629) - (15,629)
Bargain purchase (h) (102,051) - (102,051)
Others (h) 4,086 - 4,086
(124,869) - (124,869)
Variação dos ativos e passivos
Held for trading (j.iv) - 31,320 31,320
Trade accounts receivable (j.i) - (776,553) (776,553)
Inventories (j.v) - (13,706) (13,706)
Other accounts payable (f) (7,487) - (7,487)
(7,487) (758,939) (766,426)
Cash used in investing activities
Goodwill write-off (h) 17,000 - 17,000
Additions to property, plant and equipment (j.v) - 13,706 13,706
17,000 13,706 30,706
Cash used in financial activities
Short term debt capture (j.i) - 776,553 776,553
- 776,553 776,553
(*) Adjustments on depreciation and reversal of the amortization that effects the net income of the period.

Braskem S.A. and Subsidiaries Notes to the Financial Statements at December 31, 2010 and 2009 Amounts in thousands of Brazilian reais, except when otherwise indicated
57
4.4 Notes to the reconciliation between BR GAAP and CPCs and IFRS
a) Investment in associated companies CPC 18 and IAS28 establish that an investment over which the investor has significant influence without exercising any form of individual or joint control should be classified as an associate and recorded in the financial statements on the equity method. The Company has classified Cetrel as a jointly-controlled investee and its financial statements were proportionally consolidated. However, upon the application of CPC 18 and IAS 28, Cetrel became classified as an associate and recorded in the financial statements on the equity method. On December 31, 2009, Braskem held 53,66% of Cetrel’s interests (54,24% on December 31, 2008). Despite this participation, the Company cannot guarantee the permanent nomination of most members of the board (body responsible for setting the general business of Cetrel). The board has five members, including two appointed by a minority shareholder. Of the three remaining board, one is appointed by other minority shareholders, as stipulated in the Corporations Act, while Braskem appoints the other two board members. Therefore Braskem does not have control over Cetrel. In the opening balance sheet and at December 31, 2009, the balance of Cetrel was reclassified from investments in Subsidiaries to investments in associates in the amount of R$104,286 and R$115,991 respectively. The Company's consolidated financial statements were affected by the deconsolidation of Cetrel whose balance sheets and income statement are as follows:

Braskem S.A. and Subsidiaries Notes to the Financial Statements at December 31, 2010 and 2009 Amounts in thousands of Brazilian reais, except when otherwise indicated
58
Balance sheet 2009 2008 2009 2008
Assets Liabilities and Equity
Current assets Current liabilities
Cash and cash equivalents 61,486 32,838 Suppliers 6,478 4,745
Trade accounts receivable 13,717 17,950 Loans and financing 9,421 8,501
Inventories 3,388 3,476 Salaries and social charges 7,884 6,360
Taxes recoverable 6,078 3,233 Taxes payable 4,773 1,993
Deferred taxes 767 767 Deferred taxes - 456
Prepaid expenses - 250 Dividends and interest on capital 5 1,637
Related parties - 1,472 Advances from customers 804 735
Other accounts receivable 447 166 Other provisions and accounts payable 1,962 7,407
85,883 60,152 31,327 31,834
Non-current assets
Held to maturity 3,682 3,380 Non-current liabilities
Deferred taxes 15,952 18,406 Loans and financing 18,941 18,215
Judicial deposits 11,094 9,757 Taxes payable 10,289 9,782
Other investments 28 314 Deferred taxes - 9,557
Property, plant and equipment 146,726 147,984 Other accounts payable 6,662 1,388
Intangible assets 2,482 2,237 35,892 38,942
Deferred charges 749 939
180,713 183,017 Equity 199,377 172,393
Total assets 266,596 243,169 Total liabilities and equity 266,596 243,169
Statement of operations 2009
Net sales 102,133
Cost of services provided (67,571)
Gross profit 34,562
Operating expenses, net (15,257)
Financial results 4,190
Profit before income tax and social
contribution
23,495
Income tax and social contribution (4,861)
Net income for the year 18,634

Braskem S.A. and Subsidiaries Notes to the Financial Statements at December 31, 2010 and 2009 Amounts in thousands of Brazilian reais, except when otherwise indicated
59
b) Investment in jointly-controlled companies In accordance with IAS 31, jointly-controlled companies may be recognized either on the proportional consolidation or equity methods. CPC19, however, deals only with proportional consolidation. The investment in the jointly-controlled company RPR was therefore included in the consolidated financial statements of the Company using the proportional consolidation method which requires that assets, liabilities, income and expenses be combined line by line with similar items in the financial statements proportionally to the participation in the total capital of the investee. The shared management of RPR between Braskem, Ultrapar and Petrobras is provided for the Shareholder Agreement. In the opening balance sheet and at December 31, 2009, RPR had a net capital deficiency, and consequently, a provision for a loss in the amount of R$ 17,458 and R$ 1,829 respectively. The financial statements of RPR at the date of the transition and at December 31, 2009 are as follows:
(i) Braskem held 33.20% of RPR’s capital at December 31, 2009 and 2008 . The consolidation of the financial statements was made on a proportional basis, with applicable eliminations.
Balance sheet December 2009 December 2008 December 2009 December 2008
(i) (i) (i) (i)
Current assets Current liabilities
Cash and cash equivalents 63,554 5,555 Suppliers 68,568 10,758
Trade accounts receivable 41,748 2,724 Loans and financing 87,555 75,625
Inventories 81,574 24,007 Payroll and social charges 6,228 1,454
Recoverable taxes 11,162 10,014 Taxes payable 20,255 2,207
Prepaid expenses - 168 Dividends and interest on capital 103 313
Other accounts receivable 517 16 Other provisions - 3,521
198,555 42,484 Other accounts payable 5,627 597
Non-current assets 188,336 94,475
Judicial deposits 311 - Non-current liabilities
Other accounts receivable 134 134 Loans and financing 17,500 -
Investments - 392 Other accounts payable 39,263 35,994
Property, plant and equipment 40,591 34,875 56,763 35,994
41,036 35,401
Equity (5,508) (52,584)
Total assets 239,591 77,885 Total liabilities and equity 239,591 77,885
Statement of income December 2009
(i)
Net Sales 752,922
Cost of sales and services rendered (659,111)
Gross profit 93,811
Operating expenses, net (21,242)
Financial income (29,060)
Profit before income tax and social 43,509
Income tax and social contribution (12,719)
Net income for the year 30,790
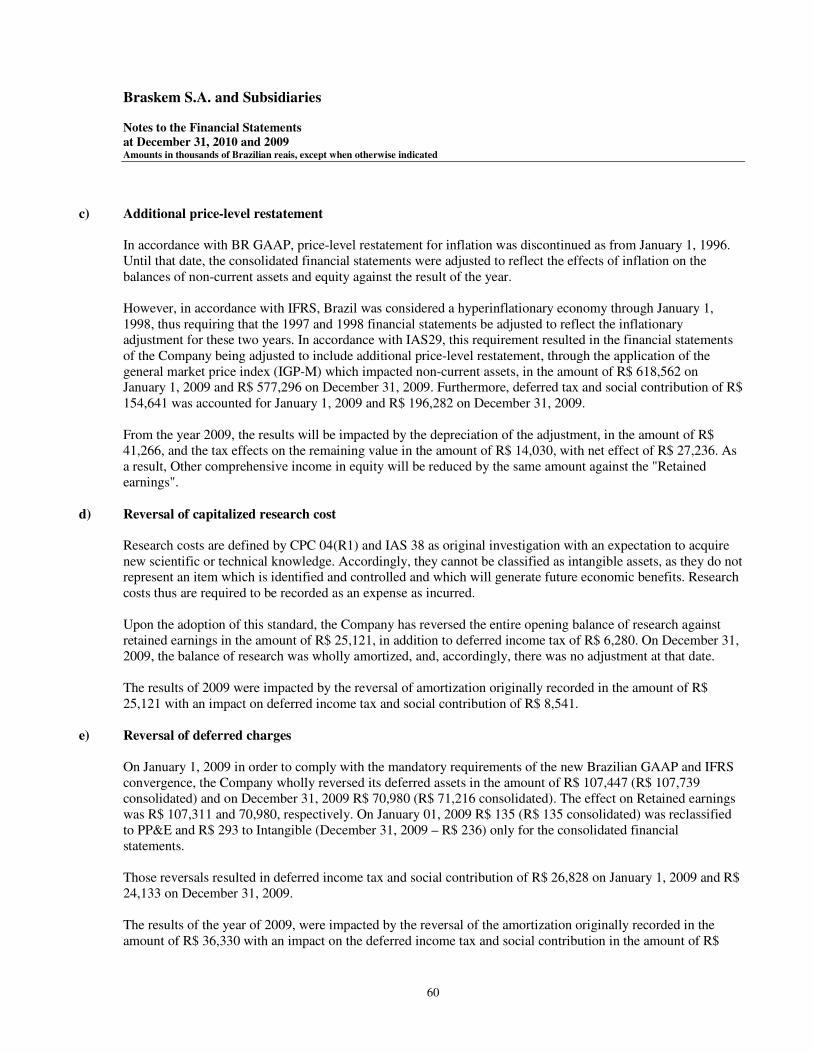
Braskem S.A. and Subsidiaries Notes to the Financial Statements at December 31, 2010 and 2009 Amounts in thousands of Brazilian reais, except when otherwise indicated
60
c) Additional price-level restatement In accordance with BR GAAP, price-level restatement for inflation was discontinued as from January 1, 1996. Until that date, the consolidated financial statements were adjusted to reflect the effects of inflation on the balances of non-current assets and equity against the result of the year. However, in accordance with IFRS, Brazil was considered a hyperinflationary economy through January 1, 1998, thus requiring that the 1997 and 1998 financial statements be adjusted to reflect the inflationary adjustment for these two years. In accordance with IAS29, this requirement resulted in the financial statements of the Company being adjusted to include additional price-level restatement, through the application of the general market price index (IGP-M) which impacted non-current assets, in the amount of R$ 618,562 on January 1, 2009 and R$ 577,296 on December 31, 2009. Furthermore, deferred tax and social contribution of R$ 154,641 was accounted for January 1, 2009 and R$ 196,282 on December 31, 2009. From the year 2009, the results will be impacted by the depreciation of the adjustment, in the amount of R$ 41,266, and the tax effects on the remaining value in the amount of R$ 14,030, with net effect of R$ 27,236. As a result, Other comprehensive income in equity will be reduced by the same amount against the "Retained earnings".
d) Reversal of capitalized research cost Research costs are defined by CPC 04(R1) and IAS 38 as original investigation with an expectation to acquire new scientific or technical knowledge. Accordingly, they cannot be classified as intangible assets, as they do not represent an item which is identified and controlled and which will generate future economic benefits. Research costs thus are required to be recorded as an expense as incurred. Upon the adoption of this standard, the Company has reversed the entire opening balance of research against retained earnings in the amount of R$ 25,121, in addition to deferred income tax of R$ 6,280. On December 31, 2009, the balance of research was wholly amortized, and, accordingly, there was no adjustment at that date. The results of 2009 were impacted by the reversal of amortization originally recorded in the amount of R$ 25,121 with an impact on deferred income tax and social contribution of R$ 8,541.
e) Reversal of deferred charges On January 1, 2009 in order to comply with the mandatory requirements of the new Brazilian GAAP and IFRS convergence, the Company wholly reversed its deferred assets in the amount of R$ 107,447 (R$ 107,739 consolidated) and on December 31, 2009 R$ 70,980 (R$ 71,216 consolidated). The effect on Retained earnings was R$ 107,311 and 70,980, respectively. On January 01, 2009 R$ 135 (R$ 135 consolidated) was reclassified to PP&E and R$ 293 to Intangible (December 31, 2009 – R$ 236) only for the consolidated financial statements. Those reversals resulted in deferred income tax and social contribution of R$ 26,828 on January 1, 2009 and R$ 24,133 on December 31, 2009. The results of the year of 2009, were impacted by the reversal of the amortization originally recorded in the amount of R$ 36,330 with an impact on the deferred income tax and social contribution in the amount of R$

Braskem S.A. and Subsidiaries Notes to the Financial Statements at December 31, 2010 and 2009 Amounts in thousands of Brazilian reais, except when otherwise indicated
61
12,352.
f) Defined benefit pension plans With the adoption of the exception in CPC 37 (R1) and IFRS 1 (Note 24), the Company recognized the opening balance an actuarial loss against retained earnings in the amount of R$ 80,828 with a deferred income tax and social contribution effect of R$ 20,207 on January 1, 2009 and R$ 24,936 on December 31, 2009. On December 31, 2009, this actuarial loss totaled R$ 73,341 with a positive impact in the results for the year of 2009 R$7,487 and a deferred income tax and social contribution effect of R$ 2,546.
g) Reversal of negative goodwill Upon the adoption of CPC 37 (R1) and IFRS 1, the previously recorded negative goodwill on January 1, 2009 were wholly reversed against retained earnings in the amount of R$ 20,601 (R$ 16,006 on December 31, 2009). The amount is related to R$ 11,870 and R$ 8,731 (R$7,275 and R$ 8,731 on December 31, 2009) from the acquisition of Nova Camaçari and Cinal. For 2009 the profit or loss account was impacted by the negative goodwill reversal amortization of Nova Camaçari in the amount of R$ 4,595. On the parent company open balance and on December 31, 2009 the negative goodwill of Cinal was reclassified to investment.
On the amount of R$ 8,731 relating to negative goodwill on the investment in Cinal deferred income tax of R$ 2,183 on January 1, 2009 and deferred income tax and social contribution of R$ 2,969 on December 31, 2009 was accounted for.
h) Business combinations - Triunfo
CPC 15 and IFRS 3 establish that a transaction represents a business combination when an entity acquires control of a business, and that identifiable assets acquired and the liabilities assumed in connection with the operation, should be measured at respective fair values on the date of acquisition. As mentioned in Note 1(f.1), on May 5, 2009, the Company acquired the control of Triunfo. The payment for the translation was made with the issue of 13,387,157 preferential Braskem shares, class “A” which were delivered to Triunfo shareholders. The fair value of the shares on the date of acquisition was R$92,505. The Company recognized R$155,425 in the result of 2009 as an advantageous purchase with impact on the deferred income tax of R$53,374. The acquires assets were adjusted to fair value as follows: fixed assets R$ 152,895; inventories R$4,086; and treasury shares, R$ 1,556. The resulting goodwill based on BR GAAP of R$17,000 was wholly reversed to the results of 2009, with an effect of deferred income tax and social contribution of R$5,780. Also, the results of 2009 were adjusted by depreciation on the appreciation of fixed assets of R$4,315 and full realization of inventories of R$4,086 with effect on deferred income tax and social contributions of R$2,856.
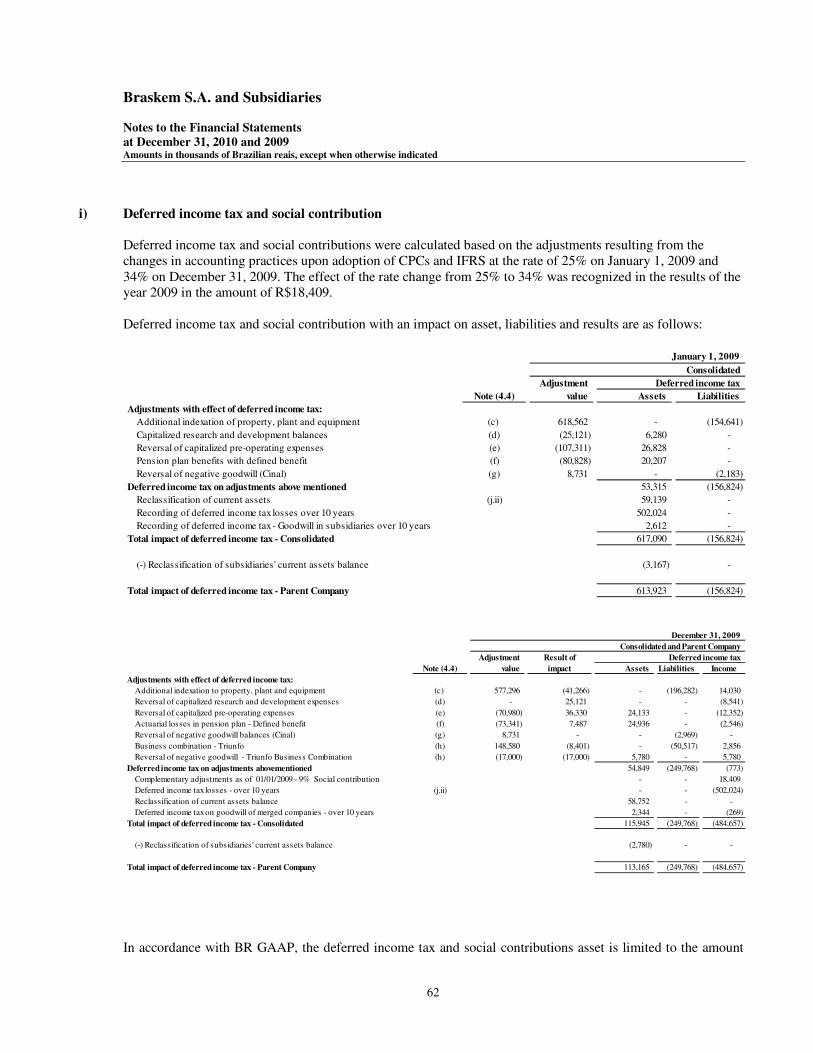
Braskem S.A. and Subsidiaries Notes to the Financial Statements at December 31, 2010 and 2009 Amounts in thousands of Brazilian reais, except when otherwise indicated
62
i) Deferred income tax and social contribution Deferred income tax and social contributions were calculated based on the adjustments resulting from the changes in accounting practices upon adoption of CPCs and IFRS at the rate of 25% on January 1, 2009 and 34% on December 31, 2009. The effect of the rate change from 25% to 34% was recognized in the results of the year 2009 in the amount of R$18,409. Deferred income tax and social contribution with an impact on asset, liabilities and results are as follows:
In accordance with BR GAAP, the deferred income tax and social contributions asset is limited to the amount
Adjustment
Note (4.4) value Assets Liabilities
Adjustments with effect of deferred income tax:
Additional indexation of property, plant and equipment (c) 618,562 - (154,641)
Capitalized research and development balances (d) (25,121) 6,280 -
Reversal of capitalized pre-operating expenses (e) (107,311) 26,828 -
Pension plan benefits with defined benefit (f) (80,828) 20,207 -
Reversal of negative goodwill (Cinal) (g) 8,731 - (2,183)
Deferred income tax on adjustments above mentioned 53,315 (156,824)
Reclassification of current assets (j.ii) 59,139 -
Recording of deferred income tax losses over 10 years 502,024 -
Recording of deferred income tax - Goodwill in subsidiaries over 10 years 2,612 -
Total impact of deferred income tax - Consolidated 617,090 (156,824)
(-) Reclassification of subsidiaries' current assets balance (3,167) -
Total impact of deferred income tax - Parent Company 613,923 (156,824)
January 1, 2009
Consolidated
Deferred income tax
Adjustment Result of
Note (4.4) value impact Assets Liabilities Income
Adjustments with effect of deferred income tax:
Additional indexation to property, plant and equipment (c) 577,296 (41,266) - (196,282) 14,030
Reversal of capitalized research and development expenses (d) - 25,121 - - (8,541)
Reversal of capitalized pre-operating expenses (e) (70,980) 36,330 24,133 - (12,352)
Actuarial losses in pension plan - Defined benefit (f) (73,341) 7,487 24,936 - (2,546)
Reversal of negative goodwill balances (Cinal) (g) 8,731 - - (2,969) -
Business combination - Triunfo (h) 148,580 (8,401) - (50,517) 2,856
Reversal of negative goodwill - Triunfo Business Combination (h) (17,000) (17,000) 5,780 - 5,780
Deferred income tax on adjustments abovementioned 54,849 (249,768) (773)
Complementary adjustments as of 01/01/2009 - 9% Social contribution - - 18,409
Deferred income tax losses - over 10 years (j.ii) - - (502,024)
Reclassification of current assets balance 58,752 - -
Deferred income tax on goodwill of merged companies - over 10 years 2,344 - (269)
Total impact of deferred income tax - Consolidated 115,945 (249,768) (484,657)
(-) Reclassification of subsidiaries' current assets balance (2,780) - -
Total impact of deferred income tax - Parent Company 113,165 (249,768) (484,657)
Deferred income tax
December 31, 2009
Consolidated and Parent Company
Braskem S.A. and Subsidiaries Notes to the Financial Statements at December 31, 2010 and 2009 Amounts in thousands of Brazilian reais, except when otherwise indicated
63
that, supported by projections of taxable profits, are expected to be realized by the Company in up to 10 years. For this reason, the Company did not recognize a deferred income tax and social asset in the amount of R$504,636. With the adoption of CPCs and IFRS, the Company adjusted the opening balances in its financial statements to recognize the deferred income tax and social contribution asset which exceeded the 10-year limit - since in accordance with the new accounting practice, there is no limit on the time in which the deferred income tax and social contribution can be realized. In 2009, the Company realized R$502,024 upon joining the REFIS federal tax installment program and has adjusted the financial statements to recognize this amount in the results of the year of 2009.
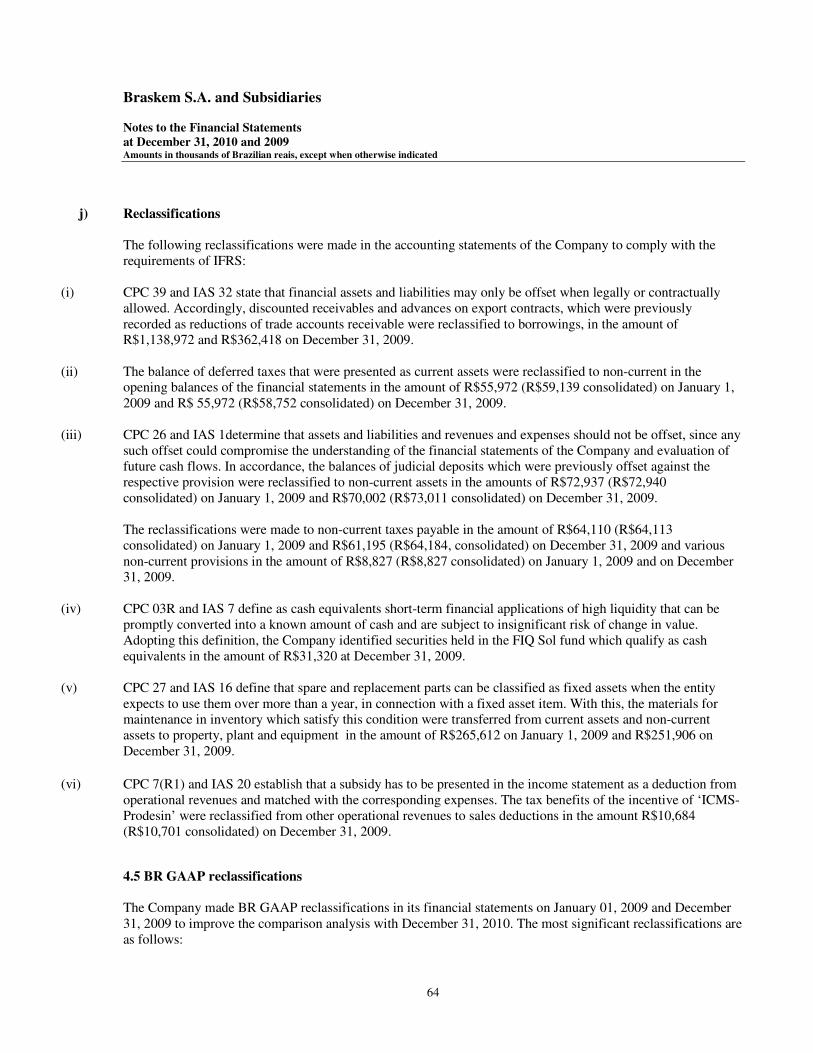
Braskem S.A. and Subsidiaries Notes to the Financial Statements at December 31, 2010 and 2009 Amounts in thousands of Brazilian reais, except when otherwise indicated
64
j) Reclassifications The following reclassifications were made in the accounting statements of the Company to comply with the requirements of IFRS:
(i) CPC 39 and IAS 32 state that financial assets and liabilities may only be offset when legally or contractually allowed. Accordingly, discounted receivables and advances on export contracts, which were previously recorded as reductions of trade accounts receivable were reclassified to borrowings, in the amount of R$1,138,972 and R$362,418 on December 31, 2009.
(ii) The balance of deferred taxes that were presented as current assets were reclassified to non-current in the opening balances of the financial statements in the amount of R$55,972 (R$59,139 consolidated) on January 1, 2009 and R$ 55,972 (R$58,752 consolidated) on December 31, 2009.
(iii) CPC 26 and IAS 1determine that assets and liabilities and revenues and expenses should not be offset, since any such offset could compromise the understanding of the financial statements of the Company and evaluation of future cash flows. In accordance, the balances of judicial deposits which were previously offset against the respective provision were reclassified to non-current assets in the amounts of R$72,937 (R$72,940 consolidated) on January 1, 2009 and R$70,002 (R$73,011 consolidated) on December 31, 2009. The reclassifications were made to non-current taxes payable in the amount of R$64,110 (R$64,113 consolidated) on January 1, 2009 and R$61,195 (R$64,184, consolidated) on December 31, 2009 and various non-current provisions in the amount of R$8,827 (R$8,827 consolidated) on January 1, 2009 and on December 31, 2009.
(iv) CPC 03R and IAS 7 define as cash equivalents short-term financial applications of high liquidity that can be promptly converted into a known amount of cash and are subject to insignificant risk of change in value. Adopting this definition, the Company identified securities held in the FIQ Sol fund which qualify as cash equivalents in the amount of R$31,320 at December 31, 2009.
(v) CPC 27 and IAS 16 define that spare and replacement parts can be classified as fixed assets when the entity expects to use them over more than a year, in connection with a fixed asset item. With this, the materials for maintenance in inventory which satisfy this condition were transferred from current assets and non-current assets to property, plant and equipment in the amount of R$265,612 on January 1, 2009 and R$251,906 on December 31, 2009.
(vi) CPC 7(R1) and IAS 20 establish that a subsidy has to be presented in the income statement as a deduction from
operational revenues and matched with the corresponding expenses. The tax benefits of the incentive of ‘ICMS-Prodesin’ were reclassified from other operational revenues to sales deductions in the amount R$10,684 (R$10,701 consolidated) on December 31, 2009.
4.5 BR GAAP reclassifications The Company made BR GAAP reclassifications in its financial statements on January 01, 2009 and December 31, 2009 to improve the comparison analysis with December 31, 2010. The most significant reclassifications are as follows:

Braskem S.A. and Subsidiaries Notes to the Financial Statements at December 31, 2010 and 2009 Amounts in thousands of Brazilian reais, except when otherwise indicated
65
• Reclassification of Insurance payable previously presented as Other accounts payable to Suppliers in the current liabilities group (on the open balance R$ 12,731 and R$ 15,575 on December 31, 2009 on the parent company financial statements. On the open balance R$ 12,731 and R$ 15,584 on December 31, 2009 on the consolidated financial statements).
• Reclassification of advance from customers previously presented as Other accounts payable to an exclusive current liability own line (R$ 34,346 on the open balance and R$ 37.990 on December 31, 2009 on the individual financial statements. On the open balance R$ R$ 37,520 and R$ 37,990 on December 31, 2009 on the consolidated financial statements).
• Reclassification of Derivative financial instruments previously classified as Other accounts payable to Hedge accounting transactions on the non-current liabilities (R$ 27,108 on December 31, 2009).
• Reclassification of Derivative financial instruments previously presented in a current asset own line to Other accounts receivable (R$ 5,334 on December 31, 2009, consolidated).
• Reclassification of Eletrobrás compusory deposits which were previously presented as Judicial deposits to Other accounts receivable on the non-current asset group (R$ 20,045 on the open balance and R$ 3,816 on December 31, 2009. On the individual financial statements on the open balance R$ 20,211 and R$ 3,984 on December 31, 2009 on the consolidated financial statements.
• The result of 2009 had been published in BR GAAP with expenses classified by nature, was adjusted to demonstrate the expenses classified by function. Expenses with depreciation and amortization were proportionally reclassified for expenses with sales, with distribution, general and administrative and Research and development (R$ 115,945 in the individual financial demonstrations; R$ 123,717 in the consolidated financial demonstrations).
• Reclassification of expenses with reduction to recoverable value of fixed assets and discontinued projects disposal that were registered as Other operating income (expenses), net to an exclusive own line on the amounts of R$ 84,498 in 2009 and R$ 18,200 respectively in 2009.
On the consolidated financial statements of 2009 the published balance on discontinued projects was reclassified to amount to be recovered on property, plant and equipment in the amount of R$ 60,387. On the financial statements of 2009, freights under sales and other selling expenses presented on the line net sales revenues were reclassified to cost of sales products and selling expenses in the amounts of R$ 642,067 and R$ 34,738, respectively (R$ 681,522 and R$ 45,774, consolidated respectively).
5 Business Combinations
5.1 Quattor Participações S.A.
On January 22, 2010 the shareholders of Braskem S.A. (Odebrecht S.A. – ODB, Odebrecht Serviços e Participações S.A. – OSP, Petróleo Brasileiro S.A. – Petrobras and Petrobras Química S.A. – Petroquisa, the “Companies”), together with União de Indústrias Petroquímicas S.A. - Unipar entered into an Investment Agreement (“Investment Agreement”) to regulate the terms and conditions for the acquisition by Braskem, of the investments held by Unipar in the Petrochemical industry. Petrobras consolidated its investments in the

Braskem S.A. and Subsidiaries Notes to the Financial Statements at December 31, 2010 and 2009 Amounts in thousands of Brazilian reais, except when otherwise indicated
66
Petrochemical industry in Braskem.
On April 27, 2010, Braskem purchased 143,192,231 of the outstanding capital of Quattor Participações S.A (“Quattor”) representing 60% of its voting capital and made an advance payment of R$ 659,454. The initially agreed price was subject to monetary correction through the acquisition date based on the terms of the Investment Agreement. On April 30, 2010, Braskem acquired control over the Company and appointed the members of Quattor’s Board of Directors April 30, 2010 constitutes the acquisition date for the purpose of the business combination. Under of the Investment Agreement, when Braskem acquired the 60% voting interest in Quattor it assumed an obligation to acquire the following interests:
(i) 40% of interest in Quattor Participações S.A. held by Petrobras through an exchange of 18,000,087 Braskem S.A.’s shares;
(ii) 33,3% of Polibutenos S.A interest held by Unipar Participações S.A. for a cash consideration of R$ 22,326;
(iii) 0,68% non-controlling voting interest in Quattor Química S.A., the non-controlling shareholders had a tag along right under the Brazilian Corporation Law; and
(iv) 25% voting interest in Rio Polímeros S.A (“RioPol”) held by BNDESPAR.
Although the Company did not obtain the legal right over the aforementioned participations on the acquisition date, all described events were accounted for on April 30, 3010, since the Investment Agreement set forth the Company’s obligation to acquire all remaining non-controlling interest (after acquiring the 60% voting interest in Quattor). The table below summarizes the consideration paid, shares issued to the stockholders’ of the Quattor Group, as well as liabilities assumed by Braskem, and the value of the acquired assets and liabilities assumed which were accounted on the acquisition date:
Consideration paid
Cash 704,298 Shares issued (the amount of R$250,049 also includes Braskem shares issued for the
purchase of other interests in this business combination) 250,049 BNDESPAR put option assumed by the Company and other obligations 218,739 Total consideration transferred (A) 1,173,086
Fair value of identifiable assets and assumed liabilities
Current assets
Inventory 823,012
Other current assets 1,383,104
Non-current assets
Property, plant & Equipment 7,531,158
Intangible 560,430
Other non-current assets 990,850
Current liabilities 2,903,113

Braskem S.A. and Subsidiaries Notes to the Financial Statements at December 31, 2010 and 2009 Amounts in thousands of Brazilian reais, except when otherwise indicated
67
Non-current liabilities
Other provisions 220,619
Deffered income tax and social contribution 623,173
Other non-current liabilities 5,527,104
Total identifiable assets and assumed liabilities (B) 2,014,545
Business combination result ( A) – (B) 841,459
The R$ 841,459 bargain purchase gain was accounted under Gain from business combination in the statement of operations. The bargain purchase was attributable to the terms of negotiation with the shareholders of Quattor.
The shares issued by the Company as part of the acquisition payment were valued based on the BM&FBovespa
stock price on April, 30, 2010 totaling R$ 197,101. The fair value of the assets acquired and liabilities assumed were determined by an independent appraiser hired by the Company, whose main results are summarized below:
i. The fair value of inventory was determined based on its sale value net of taxes at the appraisal report date by applying the market approach method. The difference between the book value and the fair value was R$ 68,009, and
ii. The method used to determine the fair value of fixed assets was the cost replacement approach. The
Company’s management, together with the independent external appraisers concluded that it was not practicable to apply the market approach, as the individual value of each asset does not reflect the economical value of a petrochemical plant, which includes the value of the technology, costs of the supporting buildings and the linkage with the production and finished products transportation system. When valuing these assets the Company and its independent appraisers took into consideration (i) the cost of new similar plants; (ii) budgets for the expansion and exchange of similar assets; and (iii) market price for the purchase of a new similar asset, under the same usage conditions, at the date of its inspection, among other assumptions. Property, plant and equipment at fair value totaled R$1,492,091 on April 30, 2010; and
iii. As a result of the fair value allocation assessment the Company identified net gains in the future cash
flows of supplier and customer contracts which were brought to present value at a 14.1% discount rate. Additionally, the Company fair valued (i) existing trademarks based on its registration costs and technology, based on the payroll and administrative costs incurred in the research carried out in a partnership with the Federal University of Rio de Janeiro. The identifiable intangible assets, trademarks and the new technology were valued at R$ 393,878;
iv. The Company recorded the fair value of possible tax contingencies contingencies. The amounts
recorded refer to VAT, PIS, COFINS, Income Tax and Social contribution contingencies totaling R$210,695; and
v. The fair value of Loans and Financings was determined based on the income approach. The Company
did not record this fair value since those loans and financings contracts contained anticipated repayment clauses (with potential immediate repayment) and were fully recognized during the period.

Braskem S.A. and Subsidiaries Notes to the Financial Statements at December 31, 2010 and 2009 Amounts in thousands of Brazilian reais, except when otherwise indicated
68
The net revenues included in the consolidated statement of operations since April 30, 2010 includes R$ 4,412,244 in net revenues from the Quattor Participações S.A. Quattor also contributed with net income of R$58,461 in the same period based on the contingencies value and the loss probability estimates by external legal advisors. The Quattor acquisition was subject to final approval by CADE. Brazilian law permits to consummate the transaction before the final approval by the Brazilian antitrust authorities. That transaction was submitted to CADE appreciation on February 05, 2010Under Brazilian Corporation Law, CADE may issue a writ of prevention blocking the transaction or it may require the parties to enter into an agreement to sell part or all interests acquired. On February 23, 2011, CADE approved the transaction with no significant restriction (Note 37).
5.2 Petroquímica Triunfo S.A.
On April 30 and May 5, 2009, the General Extraordinary Shareholders Meetings held by Braskem and Triunfo,
respectively, approved the acquisition and merger of Triunfo by the Company. This represents the final phase of the merger of the petrochemical assets held by Petroquisa and it was conducted under the terms of the Investment Agreement dated on November 30, 2007 between Petrobras, Petroquisa, Odebrecht and Norquisa.
Braskem acquired control over Triunfo on May 05, 2009 when it acquired 100% of its voting capital. On this
same date, the Company legally merged Triunfo into Braskem.
The table below summarizes the consideration paid through the issuance of shares, and the value of the acquired assets and liabilities assumed which were accounted on the acquisition date:
Consideration transferred
Shares issued ( 13,387,157 Braskem shares issued in exchange of 100% of Triunfo’s voting capital 92,505
Total consideration transferred (A) 92,505
Fair value of the identifiable assets and liabilities assumed
Current assets
Inventory 46,268
Other current assets 95,566
Non-current assets
Property, plant & equipment 179,957
Other non-current assets 20,657
Current liabilities 23,283
Non-current liabilities 124,609
Total identifiable assets and liabilities assumed (B) 194,556
Business combination result (A) – (B) 102,051
For purposes of determining the relation of the exchange of shares issued by Triunfo for stock issued by

Braskem S.A. and Subsidiaries Notes to the Financial Statements at December 31, 2010 and 2009 Amounts in thousands of Brazilian reais, except when otherwise indicated
69
Braskem, Banco Brasdesco BBI S.A. was contracted to perform an independent financial and economic analysis of Triunfo and Braskem, by means of the financial statements. In consideration for incorporating the accounting net assets of Triunfo, Braskem issued 13,387,157 new preferred class A shares, valued at R$ 92,505. This fair value was adjusted to reflected the share price of Braskems’ stok at the closing stock price on the BM&FBovespa on the date of the incorporation.
The amount of R$ 102,051 refers to gain from the bargain purchase and was accounted under Gain from business combination in the statement of operations during 2009. The fair value of the assets acquired and liabilities assumed were determined by an independent appraiser hired by the Company, which main results are summarized below:
i. The fair value of inventory was determined based on its sale value net of taxes at the appraisal report date by applying the market approach method. The difference between the book value and the fair value was R$ 4,086;
ii. The method used to determine the fair value of fixed assets was the cost replacement approach. The Company’s management, together with the independent external appraisers; concluded that it was not practicable to apply the market approach, as the individual value of each asset does not reflect the economical value of a petrochemical plant, which includes the value of the technology, costs of the supporting buildings and the linkage with the production and finished products transportation system. When valuing these assets the Company and its independent appraisers took into consideration: (i) the cost of new similar plants; (ii) budgets for the expansion and exchange of similar assets; and (iii) market price for the purchase of a new similar asset, under the same usage conditions, at the date of its inspection, among other assumptions. Property, plant and equipment at fair value totaled R$152,895 on April 30, 2010; and
iii. Braskem shares were valued at R$1,556 based on the market value on May 5, 2010.
Triunfo was merged into the Company immediately after the purchase date.
The acquisition of Triunfo was approved by CADE on July 09, 2009.
5.3 Sunoco Chemicals, Co. On April 1, 2010, the Company acquired 100% of the outstanding capital stock of Sunoco Chemicals (renamed Braskem PP Americas) headquartered on Philadelphia and pay a cash consideration of R$620,838 (US$ 350,721). That subsidiary has three polypropylene plants located in the states of Pennsylvania, West Virginia and Texas, with an aggregate annual production installed capacity of 950,000 tons, which represents 13% of the total polypropylene installed production capacity of the United States. Braskem PP Americas also have a petrochemicals research facility in Pittsburgh, Pennsylvania. The acquisition of control under operating and financial policies ocurred on April 1, 2010. The Company approved this transaction designated all of the members of the Board of this entity. The following table summarizes the consideration transferred to former shareholders of Sunoco Chemicals, and the values of assets acquired and liabilities assumed recognized at the acquisition date.

Braskem S.A. and Subsidiaries Notes to the Financial Statements at December 31, 2010 and 2009 Amounts in thousands of Brazilian reais, except when otherwise indicated
70
On March 29, 2010, the Company entered into a unsecured credit agreement in an aggregate principal amount of R$379,344 (US$210.0 million) to finance the Sunoco Chemicals acquisition. The loans under this credit agreement bear interest at the rate of LIBOR plus 2.625% per annum, payable quarterly in arrears through April 2015. The principal amount of these loans is payable in five equal semi-annual installments, commencing in April 2013. Braskem PP Americas recognized a bargain purchase gain of R$ 126,089 during 2010 which were accounted under the Gain from business combination, net of deferred tax liabilities in the amount of R$ 31,228 in the respective line on the statement of operations. The fair value of the assets acquired and liabilities assumed were determined by an independent appraiser retained by the Company, which main results are summarized below:
(a) The fair value of inventory was determined based on its sale value net of taxes at the appraisal report date by applying the market approach method. The difference between the book value and the fair value was R$ 177,070;
The method used to determine the fair value of fixed assets was the cost replacement approach. The Company’s management, together with the independent external appraisers concluded that it was not practicable to apply the market approach, as the individual value of each asset does not reflect the economical value of a petrochemical plant, which includes the value of the technology, costs of the supporting buildings and the linkage with the production and finished products transportation system. When valuing these assets the Company and its independent appraisers took into consideration (i) the cost of new similar plants; (ii) budgets for the expansion and exchange of similar assets; and (iii) the market price for the purchase of a new similar asset, under the same usage conditions, at the date of its inspection, among
Consideration transferred
Cash 620,838
Total consideration transferred (A) 620,838
Fair value of identifiable assets and liabilities assumed
Current assets
Inventory 177,070
Non-current assets
PP&E 628,698
Intangible 285,464
Other non-current assets 11,262
Current liabilities 6,597
Non-current liabilities
Deferred income tax and social contribution 330,421
Other non-current liabilities 18,549
Total identifiable assets and liabilities assumed (B) 746,927
Business combination result (A) – (B) 126,089

Braskem S.A. and Subsidiaries Notes to the Financial Statements at December 31, 2010 and 2009 Amounts in thousands of Brazilian reais, except when otherwise indicated
71
other assumptions. The fair value allocated to fixed assets totaled R$628,698; and
(b) As a result of the fair value allocation assessment the Company identified net gains in the future cash flows of supplier and customer contracts which were brought to present value at a 15% discount rate. The identifiable intangible assets and technology developments were valued at R$ 285,464 on the date of the acquisition.
The consolidated net revenues included in the statement of operations as from April 1, 2010 includes R$ 1,891,487 in net revenues from the PP Americas operations. PP Americas also contributed with a net income of R$172,735 in the same period. The PP Americas acquisition was submitted to analysis by the Brazilian antitrust authorities. Brazilian law permits Braskem to consummate the transaction, and to obtain legal and economic control over the acquired business prior to receiving this final approval. Under Brazilian Corporate in Law, CADE may issue a writ of prevention blocking the transaction or it may require the parties to enter into an agreement to sell part or all interests acquired. The transaction was submitted for analysis on February 23, 2010 and received the approval on November 3, 2010. The transaction was also subject to U.S. antitrust review, on February 23, 2010 and was approved on March 22, 2010.
5.4 Unipar Comercial e Distribuidora On May 10, 2010 the Company acquired 100% of the voting capital of Unipar Comercial. On that same date, the Company acquired the control over the management and, therefore, established the acquisition date of May 10, 2010 for accounting purpose. The total cash consideration transferred totaled R$ 27,104. The net fair value of the identifiable assets and liabilities assumed was R$ 35,138. All the valuation, R$ 8,342, came from fixed assets. A deferred income tax and social contribution of R$ 4,139 was also recognized. A bargain purchase gain of R$7,735 was recognized in the statement of operations under Gain from business combination. On February 23, 2011, CADE, approved that transaction without restrictions.

Braskem S.A. and Subsidiaries Notes to the Financial Statements at December 31, 2010 and 2009 Amounts in thousands of Brazilian reais, except when otherwise indicated
72
6 Cash and Cash Equivalents
The financial investments in Brazil are represented, mainly, by investment in Braskem’s exclusive fund (FIQ
Sol) that, in turn, holds fixed income instruments and time deposits. The applications overseas consist of fixed
income instruments issued by top tier financial institutions (Time Deposit), which are very liquid in the market.
All the financial investments were classified as “held for trading” and are measured at their fair values with
variations recognized in the results of operations.
7 Marketable Securities
U.S. treasury securities were classified by the Company as available-for-sale securities, and were fully disposed of during the year 2010. The amount related to the change in fair value, previously recognized as “other comprehensive income” in equity, was recognized on the income statement.
2010 2009 01/01/2009 2010 2009 01/01/2009
Cash and banks 62,752 140,800 105,234 252,925 335,167 147,647
Financial investments:
Domestic 2,181,690 1,612,534 1,635,367 2,208,475 1,613,189 1,636,428
Foreign 94,618 540,790 459,261 162,870 734,712 629,674
2,339,060 2,294,124 2,199,862 2,624,270 2,683,068 2,413,749
Parent Company Consolidated
2010 2009 01/01/2009 2010 2009 01/01/2009
Financial assets
Available for sale
U.S Treasury bonds - 261,453 331,452 - 261,884 331,452
Held for trading
Shares held for trading 84 25,761 - 84 25,761 -
Investments in FIQ Sol 204,123 91,607 181,883 204,123 91,607 181,883
Investments in foreign currencies 32,112 56,248 - 32,112 56,248 -
Other - - 5,563 - - 5,563
Held to maturity
Subordinated investment
fund quotas
28,706 15,811 9,717 28,706 15,811 9,717
Total 265,025 450,880 528,615 265,025 451,311 528,615
Current assets 236,319 435,069 518,898 236,319 435,500 518,898
Non-current assets 28,706 15,811 9,717 28,706 15,811 9,717
Total 265,025 450,880 528,615 265,025 451,311 528,615
Parent Company Consolidated

Braskem S.A. and Subsidiaries Notes to the Financial Statements at December 31, 2010 and 2009 Amounts in thousands of Brazilian reais, except when otherwise indicated
73
8 Trade Accounts Receivable
The aging list for trade accounts receivable is presented as follows:
The change in the allowance for doubtful accounts is as follows:
2010 2009 01/01/2009 2010 2009 01/01/2009
Clients
Domestic market 910,636 1,032,022 1,369,650 1,638,449 1,089,760 1,475,228
Foreign market 438,245 633,985 898,520 587,661 855,754 897,250
Allowance for doubtful accounts (212,363) (205,034) (194,403) (269,159) (220,264) (198,741)
1,136,518 1,460,973 2,073,767 1,956,951 1,725,250 2,173,737
Current assets 1,077,492 1,402,630 2,027,101 1,894,648 1,666,467 2,126,608
Non-current assets 59,026 58,343 46,666 62,303 58,783 47,129
1,136,518 1,460,973 2,073,767 1,956,951 1,725,250 2,173,737
Parent Company Consolidated
2010 2009 2010 2009
Past-due securities:
Up to 90 days 173,300 134,211 132,850 143,527
91 to 180 days 28,548 44,710 1,936 117,002
As of 180 days 174,279 176,699 230,477 163,631
Allowance for doubtful accounts (212,363) (205,034) (269,159) (220,264)
Total past-due securities 163,764 150,586 96,104 203,896
Falling due securities 972,754 1,310,387 1,860,847 1,521,354
Total client portfolio 1,136,518 1,460,973 1,956,951 1,725,250
27.88% 21.35% 16.41% 21.80%% of past-due securities on total client portfolio
Parent Company Consolidated
2010 2009 2010 2009
Balance of provision at the beginning of the year (205,034) (194,403) (220,264) (198,741)
Provisions in the period (10,599) (49,973) (66,896) (60,865)
Disposal of securities considered uncollectible 3,400 61,569 18,131 61,569
Addition by merger of subsidiary (130) (22,227) (130) (22,227)
Balance of provision at the end of the year (212,363) (205,034) (269,159) (220,264)
Parent Company Consolidated

Braskem S.A. and Subsidiaries Notes to the Financial Statements at December 31, 2010 and 2009 Amounts in thousands of Brazilian reais, except when otherwise indicated
74
Credit quality – trade accounts receivable Few of the Company's customers have risk ratings assigned by credit rating agencies. Thus, the Company developed its own credit rating system based on the following criteria: a) qualitative analysis made by the commercial and credit departments, focusing on general characteristics of the customers and their business segment, as well as their history/relationship with Braskem and other suppliers and banks; b) analysis of financial statements; and c) use of the risk rating of SERASA Experian as a basis (SERASA Experian is the largest credit bureau outside the United States with Latin America’s largest database of consumers, companies and economic groups). The combination of these three items provides a risk rating, which is shown below together with the portfolio of receivables from domestic customers as of December 31, 2010. The Company does not apply this rating to all of its foreign customers because most receivables are covered by an insurance policy or letters of credit issued by banks.
1 Minimum risk
23.59%
2 Low risk 27.73%
3 Moderate risk 36.66%
4 High risk 1.35%
5 Very high risk (i) 10.66%
(i) Most customers in this range are inactive and the respective accounts are in the process of collection actions. Customers within this range that are still active pay for products purchased from Braskem and in advance.
Default rates (*):
• December 2007: 0.16%
• December 2008: 0.71%
• December 2009: 0.25%
• December 2010: 0.13%
(*) Default rate = total of billings issued in the last 12 months which are in default/total billings in the last 12 months.
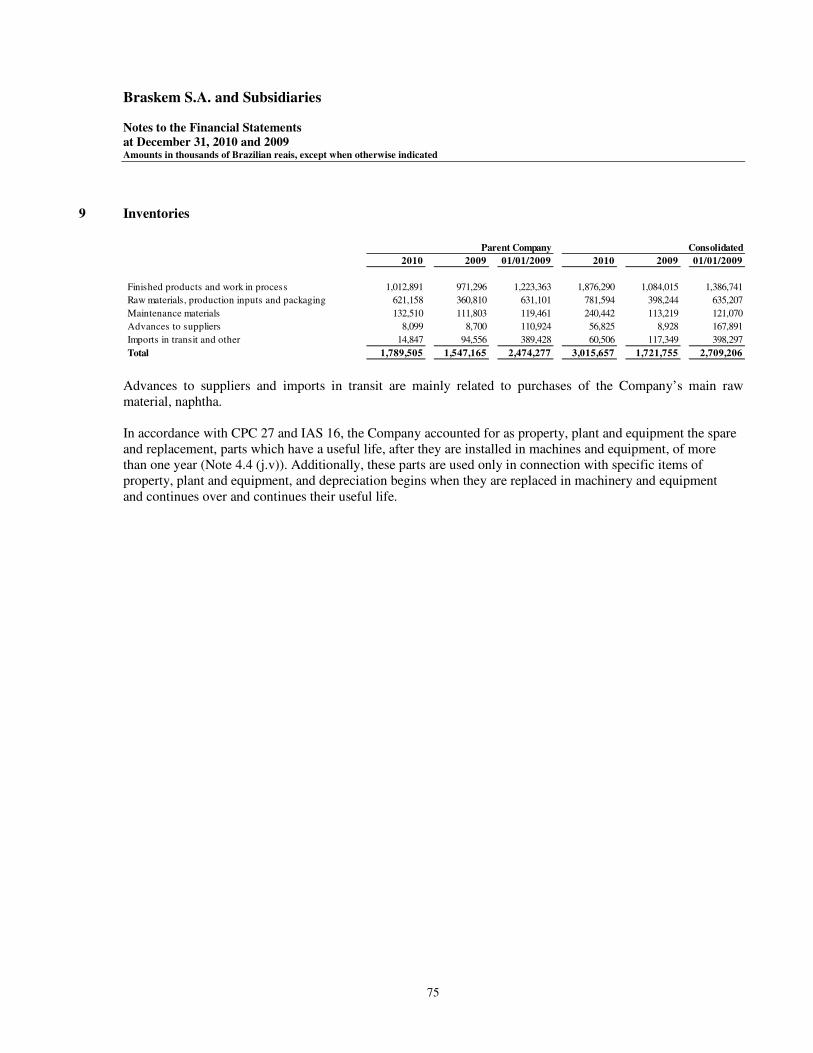
Braskem S.A. and Subsidiaries Notes to the Financial Statements at December 31, 2010 and 2009 Amounts in thousands of Brazilian reais, except when otherwise indicated
75
9 Inventories
Advances to suppliers and imports in transit are mainly related to purchases of the Company’s main raw material, naphtha. In accordance with CPC 27 and IAS 16, the Company accounted for as property, plant and equipment the spare and replacement, parts which have a useful life, after they are installed in machines and equipment, of more than one year (Note 4.4 (j.v)). Additionally, these parts are used only in connection with specific items of property, plant and equipment, and depreciation begins when they are replaced in machinery and equipment and continues over and continues their useful life.
2010 2009 01/01/2009 2010 2009 01/01/2009
Finished products and work in process 1,012,891 971,296 1,223,363 1,876,290 1,084,015 1,386,741
Raw materials, production inputs and packaging 621,158 360,810 631,101 781,594 398,244 635,207
Maintenance materials 132,510 111,803 119,461 240,442 113,219 121,070
Advances to suppliers 8,099 8,700 110,924 56,825 8,928 167,891
Imports in transit and other 14,847 94,556 389,428 60,506 117,349 398,297
Total 1,789,505 1,547,165 2,474,277 3,015,657 1,721,755 2,709,206
Parent Company Consolidated

Braskem S.A. and Subsidiaries Notes to the Financial Statements at December 31, 2010 and 2009 Amounts in thousands of Brazilian reais, except when otherwise indicated
76
10 Related Parties Parent Company
Current
assets
Related
parties
Related
parties
O ther
accounts
Related
parties
O ther
accounts
Subsidiaries
Braskem America 26 ( i) - - - - -
Braskem Distribuidora - - - - 3,040 (viii) -
Braskem Europa 123,885 ( i) - - - - -
Braskem Importação - - - - 118 (viii) -
Braskem Inc - 5,601 (vii) 64,517 (xii) 314,693 (xiii) 6,399 (xii) 3,038,265
Braskem Participações 96 ( ii) - - - - -
Cinal - - - - (xiv) - -
Ideom 899 ( i) 7,181 (viii) - - - -
IPQ Argentina 33,172 ( i) - - - - -
IPQ Chile 3,348 ( i) - - - - -
IQAG - - - - 367 (viii) -
ISATEC - 3,004 (viii) - 68 (xiv) - -
Lantana - 48 (vii) - - - -
Politeno Empreendimentos - 34 (viii) - - - -
PP Americas 1,587 ( ii) - - - - -
Quantiq 10,453 ( iii) 38,894 (viii) - - - -
Quattor 6,144 ( i) 817,976 (viii) - 15,871 (xiv) - -
Quattor Petroquimica 29,962 ( i) 649,639 (x) - 9,148 (xiv) 73,153 (viii) -
Riopol 9,734 ( i) 820,740 ( ix) - 40,885 (xiv) - -
Unipar Comercial 1,391 ( iv) 11,512 (viii) - 91 (xiv) - -
220,697 2,354,629 64,517 380,756 83,077 3,038,265
Jo intly-c o ntro lle d s ubs idiarie s
Braskem Idesa 4,015 ( ii) - - - - -
RP R 1,356 ( i) - - - - -
P ROP ILSUR 4,257 ( ii) - - - - -
P OLIMERICA 3,497 ( ii) - - - - -
13,125 - - - - -
As s o c iate d c o mpanie s
Borealis 7,337 (v) - - - - -
CETREL 2,630 ( iv) - - 1,877 (xiv) - -
Sansuy - - - 219 (xiv) - -
9,967 - - 2,096 - -
Affiliate d c o mpanie s
BRK - - - - 662 (vii) -
OCS - Corretora de Seguros - - - 29 (xiv) - -
P etrobras 40,905 ( i) 53,742 (xi) - 420,369 (xiv) - -
Refinaria Alberto P asqualini ("REFAP ") - - - 110,008 (xiv) - -
Other 845 ( i) - - 700 (xiv) - -
41,750 53,742 - 531,106 662 -
S pe c ial P urpo s e Entity
Multimarket Inves tment Fund Crédito
P rivado Sol ("FIQ Sol") 2,250,186 (vi) - - - - -
2,250,186 - - - - -
At De c e mbe r 31, 2010 2,535,725 2,408,371 64,517 913,958 83,739 3,038,265
At De c e mbe r 31, 2009 1,603,278 70,054 66,798 1,214,174 11,397 21,386
Assets LiabilitiesCurrent Non-current
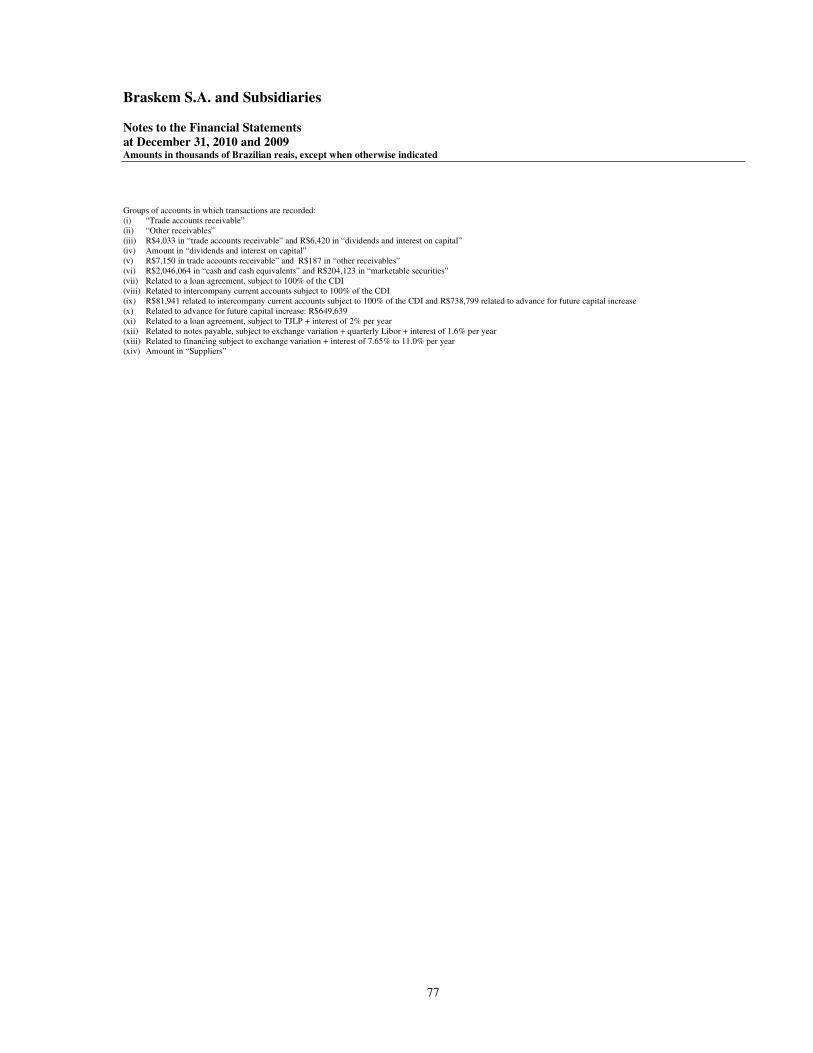
Braskem S.A. and Subsidiaries Notes to the Financial Statements at December 31, 2010 and 2009 Amounts in thousands of Brazilian reais, except when otherwise indicated
77
Groups of accounts in which transactions are recorded: (i) “Trade accounts receivable” (ii) “Other receivables” (iii) R$4,033 in “trade accounts receivable” and R$6,420 in “dividends and interest on capital” (iv) Amount in “dividends and interest on capital” (v) R$7,150 in trade accounts receivable” and R$187 in “other receivables” (vi) R$2,046,064 in “cash and cash equivalents” and R$204,123 in “marketable securities” (vii) Related to a loan agreement, subject to 100% of the CDI (viii) Related to intercompany current accounts subject to 100% of the CDI (ix) R$81,941 related to intercompany current accounts subject to 100% of the CDI and R$738,799 related to advance for future capital increase (x) Related to advance for future capital increase: R$649,639 (xi) Related to a loan agreement, subject to TJLP + interest of 2% per year (xii) Related to notes payable, subject to exchange variation + quarterly Libor + interest of 1.6% per year (xiii) Related to financing subject to exchange variation + interest of 7.65% to 11.0% per year (xiv) Amount in “Suppliers”

Braskem S.A. and Subsidiaries Notes to the Financial Statements at December 31, 2010 and 2009 Amounts in thousands of Brazilian reais, except when otherwise indicated
78
Parent Company (continued)
(i) Includes exchange rate variation
Cost of
production/Purshase of Financial general and
Sale raw materials, income administrative
of products services and uti lities (expenses) (i) expenses
Subsidiaries
Alcacér Distribuidora de Resinas Ltda
Braskem America 594 - (16) -
Braskem Argentina - - 2,698 -
Braskem Distribuidora - 919 82 -
Braskem Europa 311,146 - (8,233) -
Braskem Importação - - (11) -
Braskem Inc - 352,177 158,186 -
Braskem México - - (5) -
CINAL 378 11,356 135 -
Ideom - 16,300 986 -
IPQ Argentina 78,645 - (4,728) -
IPQ Chile 13,827 - (71) -
IQAG - 2 (27) -
ISATEC - 90 169 -
Lantana - - (2) -
Polibutenos - - 608 -
Politeno Empreendimentos - - 2 -
Quant iq 77,502 885 7,031 -
Quattor 407 23,864 32,674 -
Quattor Petroquimica 134,794 9,916 7,457 -
Quattor Química 143,250 - 4,198 -
Riopol 19,227 142,821 2,063 -
Tegal - - - -
Unipar Comercial 19,084 2,750 3,230 -
Varient - - (112) -
798,854 561,080 206,314 -
Jointly-controlled subsidiaries
RPR 142,103 37,743 - -
142,103 37,743 - -
Associated companies
Borealis 158,368 5 1,300 -
CETREL 316 21,258 - -
158,684 21,263 1,300 -
Related companies
BRK - - (33) -
Construtora Norberto Odebrecht ("CNO") - 82,580 - -
OCS - Corretora de Seguros - 1,966 - -
Odebrecht Plantas Industriais ("OPIP") - 135,731 - -
Petrobras 420,996 6,150,686 2,432 -
Petrobras International Finance ("PIFCo") 51,757 - - -
Refinaria Alberto Pasqualini ("REFAP") 306,395 1,235,782 - -
779,148 7,606,745 2,399 -
Post-employment benefit plans
("Petros") - - - 3,640
Odebrecht Previdência Privada ("Odeprev") - - - 11,315
Triunfo Vida - - - 126
- - - 15,081
At December 31, 2010 1,878,789 8,226,831 210,013 15,081
At December 31, 2009 1,409,112 6,354,358 680,745 14,779
Transactions in the income statement from January to December 2010
Braskem S.A. and Subsidiaries Notes to the Financial Statements at December 31, 2010 and 2009 Amounts in thousands of Brazilian reais, except when otherwise indicated
79
The Company has transactions with related parties in the normal course of its operations and activities. The Company believes that all the conditions set forth in contracts with related parties meet the Company’s interests and plans to continue to ensure that future contracts with any related party provides terms and conditions as favorable to the Company as would be the case if they were to be entered into with a third party.
As per the Company’s bylaws, the Board of Directors has the power to decide on any contract between
the Company and its common shareholders, companies controlled by them, or persons that hold common shares or are quotaholders of companies that are common shareholders of the Company, in amounts above R$5,000 per operation. Furthermore, the Company has a Finance and Investment Committee (CFI), whose duties are, among others, to monitor the investments and contracts with related parties approved by the Company's Board of Directors.
It is worth noting that the Brazilian Corporation Law forbids officers and board members from: (i) rashly
using the Company’s assets and with prejudice thereto; (ii) intervening in operations where such officers and board members have a conflict of interest with the Company or decisions they may participate in; and (iii) receiving, as a result of their position, any kind of direct or indirect personal advantage from third parties, without prior consent of the appropriate body.
Transactions with related companies that are not wholly controlled by the Company are summarized below:
• Construtora Noberto Odebrecth (“CNO”): The Company and CNO entered into an agreement for scheduled maintenance and inspection at the plants. This agreement stipulates a price for each type of service rendered by CNO
• Odebrecht Corretora de Seguros (“OCS”): The Company and OCS entered into a risk management service agreement. The aggregate amount of the agreement is R$2,000 per year, already including taxes, adjusted annually based on the IGPM-FGV. The agreement is valid for 3 years from the date of execution in October 2008, and can be renewed for another 3 years.
• Odebrecth Plantas Industriais (“OPIP”): The Company and OPIP entered into an agreement for construction and implementation of an ethylene plant, located in Triunfo, Rio Grande do Sul. The agreement terminated in September 2010 when the ethylene plant started operations (Note 1(e)) and the balance shown in the note above refers to costs incurred during 2010.
• PETROBRAS: The Company has an agreement with Petrobras for supply of naphtha to the basic petrochemicals units located in the Triunfo and Camaçari Petrochemical Complexes. The price of the naphtha agreed between the Company and Petrobras is based on several factors, such as the market price of the naphtha and other oil byproducts, the volatility of the prices of these products in the international markets, the dollar to real exchange rate and the concentration of paraffinic content and contaminants present in the naphtha delivered. The agreement also establishes a minimum consumption of 3,800,000 tons/year and a maximum of 7,979,600 tons/year. A propylene supply agreement was also signed between the Company and Petrobras, whereby the Company must buy 300,000 tons propylene a year. The subsidiary of Petrobras, PFIco, also supplies naphtha to the Company and its subsidiaries.
• The subsidiary Riopol has an ethylene and propylene supply agreement with Petrobras, of approximately 391 thousand tons of ethylene a year and 396 thousand tons of propylene a year.

Braskem S.A. and Subsidiaries Notes to the Financial Statements at December 31, 2010 and 2009 Amounts in thousands of Brazilian reais, except when otherwise indicated
80
• Refinaria Alberto Pasqualini (“REFAP): The Company signed two five-year propylene supply agreements with REFAP. Under these agreements, the Company must buy an initial amount of 92,500 tons to 100,000 tons propylene a year, representing between 92.5% and 100% of REFAP’s annual propylene production capacity of 100,000 tons.
• Refinaria de Petróleo Rio-Grandense (“RPR”): The Company has agreements for supply of gas, naphtha, diesel and oil to RPR. The amount of the agreements is approximately R$331,600 and there are no specific provisions for rescission or termination.
(a.1) Consolidated The caption “related parties” in consolidated non-current assets, in the amount of R$53,742, relates to a loan
made to Petrobras, subject to TJLP + interest of 2% per year. Also, in the consolidated non-current liabilities,
the amount of R$ 31,386 refers principally to Advance for future capital increase in the joint controlled
subsidiaries Polimerica and Propilsur made only by the other shareholders.
(b) Key management personnel
The Company considers Key management personnel to be the members of the Board of Directors and of the Executive Board, comprised of the Chief Executive Officer and vice-presidents. Not all the members of the Executive Board are statutory directors.
Statement of operations Consolidated
2010 2009 2010 2009
Remuneration
Short-term benefits to employees and managers 26,917 25,542 30,886 26,164
Post-employment benefits 209 225 383 225
Benefits on contract termination - 36 892 36
Long-term incentives 2,320 2,879 2,320 2,879
Total 29,446 28,682 34,481 29,304
Balance sheet accounts - Parent Company / Consolidated
2010 2009
Long-term incentives 5,372 2,604
Total 5,372 2,604
Parent Company

Braskem S.A. and Subsidiaries Notes to the Financial Statements at December 31, 2010 and 2009 Amounts in thousands of Brazilian reais, except when otherwise indicated
81
11 Taxes Recoverable
(a) ICMS (Value Added Tax on Sales and Services)
The Company has accumulated a balance of ICMS recoverable over the past few years largely from acquisitions
of fixed assets, domestic sales with tax deferral incentives and export sales. This accumulation is most notable
in the states of Bahia, Rio Grande do Sul and São Paulo, where the majority of the production units is located.
The tax credit in São Paulo State relates to the Quattor Participações and Quattor Petroquímica production units
that total R$143,983.
Company management has been prioritizing a series of actions to maximize the use of these credits and does not
currently expect to incur any loss in connection with them. Of particular note among the actions of management
are:
• agreement with the State of Rio Grande do Sul to maintain full deferral of ICMS on the import of naphtha
and limit the use of accumulated ICMS credits to a monthly average of R$ 8,250 for offset against the
monthly balances due by the units in this state;
• agreement with the state government of Bahia to increase the percentage reduction in the calculation base
for ICMS due on the imported petrochemical naphtha, lowering the effective rate to 5.8%, as defined in
paragraphs 9 and 10 of Article 347 of the ICMS Regulation of the State of Bahia (Decree No. 11,059 of
May 19, 2008);
• signing in November 2009, with no effect on the previous item, of an Agreement with the State of Bahia,
ensuring the effective implementation of State Decree No. 11,807, of October 27, 2009, which gradually
reduces the effective ICMS rate on domestic naphtha acquired in the same state from 17% to 0% up to
March 2011. On December 31, 2010, the rate was 5.5%.
2010 2009 01/01/2009 2010 2009 01/01/2009
Excise tax (IPI) 26,008 24,698 26,871 29,128 25,643 28,331
Value-added tax on sales and services 795,390 1,059,900 1,187,751 1,211,256 1,069,115 1,201,034
Social Integration Program (PIS) and COFINS 322,191 201,871 161,584 441,367 207,075 167,159
PIS - Decree-Law Nos. 2,445 and 2,449/88 55,194 55,194 55,194 55,317 55,194 55,194
Income tax and social contribution 125,151 254,497 204,077 220,525 263,779 216,776
Tax on net income (ILL) 61,126 59,510 57,299 61,126 59,510 57,299
Other 112,406 80,713 87,319 124,561 85,783 88,305
Total 1,497,466 1,736,383 1,780,095 2,143,280 1,766,099 1,814,098
Current assets 400,969 482,494 582,385 698,879 506,298 612,282
Non-current assets 1,096,497 1,253,889 1,197,710 1,444,401 1,259,801 1,201,816
Total 1,497,466 1,736,383 1,780,095 2,143,280 1,766,099 1,814,098
Parent Company Consolidated
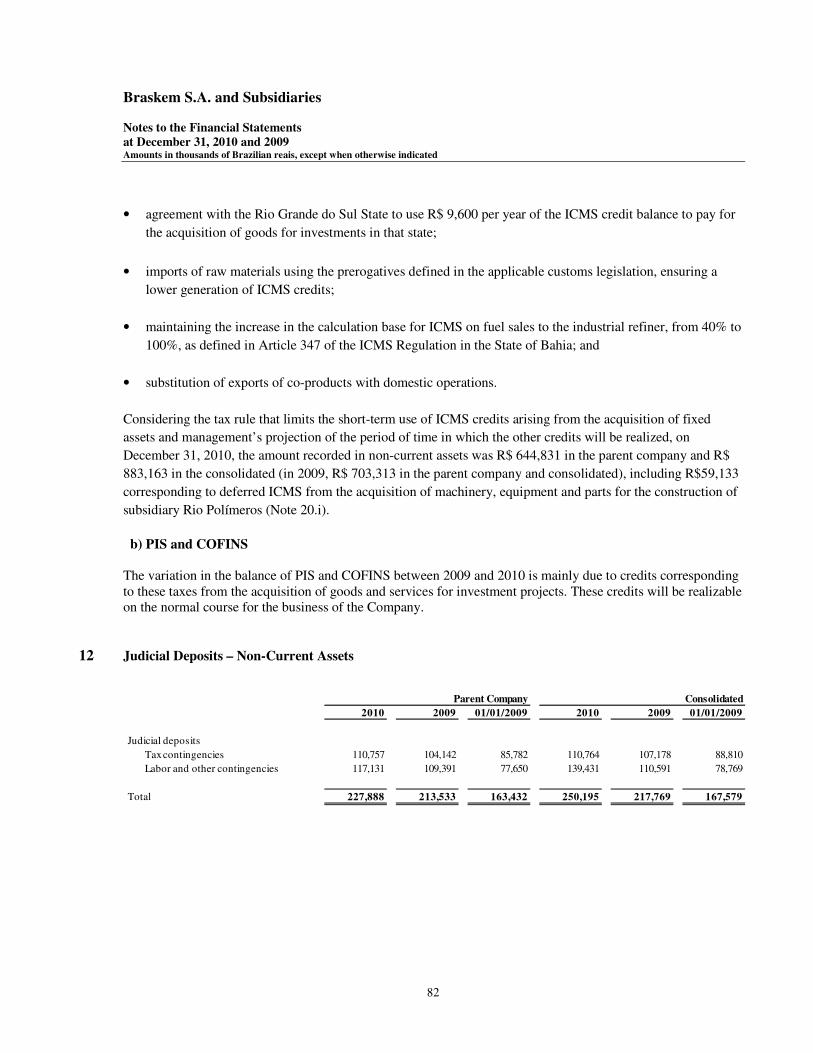
Braskem S.A. and Subsidiaries Notes to the Financial Statements at December 31, 2010 and 2009 Amounts in thousands of Brazilian reais, except when otherwise indicated
82
• agreement with the Rio Grande do Sul State to use R$ 9,600 per year of the ICMS credit balance to pay for
the acquisition of goods for investments in that state;
• imports of raw materials using the prerogatives defined in the applicable customs legislation, ensuring a
lower generation of ICMS credits;
• maintaining the increase in the calculation base for ICMS on fuel sales to the industrial refiner, from 40% to
100%, as defined in Article 347 of the ICMS Regulation in the State of Bahia; and
• substitution of exports of co-products with domestic operations.
Considering the tax rule that limits the short-term use of ICMS credits arising from the acquisition of fixed
assets and management’s projection of the period of time in which the other credits will be realized, on
December 31, 2010, the amount recorded in non-current assets was R$ 644,831 in the parent company and R$
883,163 in the consolidated (in 2009, R$ 703,313 in the parent company and consolidated), including R$59,133
corresponding to deferred ICMS from the acquisition of machinery, equipment and parts for the construction of
subsidiary Rio Polímeros (Note 20.i).
b) PIS and COFINS The variation in the balance of PIS and COFINS between 2009 and 2010 is mainly due to credits corresponding to these taxes from the acquisition of goods and services for investment projects. These credits will be realizable on the normal course for the business of the Company.
12 Judicial Deposits – Non-Current Assets
2010 2009 01/01/2009 2010 2009 01/01/2009
Judicial deposits
Tax contingencies 110,757 104,142 85,782 110,764 107,178 88,810
Labor and other contingencies 117,131 109,391 77,650 139,431 110,591 78,769
Total 227,888 213,533 163,432 250,195 217,769 167,579
Parent Company Consolidated

Braskem S.A. and Subsidiaries Notes to the Financial Statements at December 31, 2010 and 2009 Amounts in thousands of Brazilian reais, except when otherwise indicated
83
13 Investments
(a) Information on investments
Ownership of
total capital (% )
(a.1) Parent Company's investments 2010 2010 2009 2010 2009
Subsidiaries
Braskem America 100.00 154,048 (4,249) 451,068 3,821
Braskem Chile 100.00 646 (325) 5,686 4,989
Braskem Distribuidora 100.00 (3,552) (24,029) 85,575 89,127
Braskem Europa 100.00 (3,039) 9,848 84,871 114,826
Braskem Finance 100.00 (1,663) 26,908 31,034 32,697
Braskem Idesa 65.00 (17,391) - 51,654 -
Braskem Inc. 100.00 (53,982) (12,170) 167,949 15,679
Braskem Participações 100.00 (1,417) (130) 957 2,331
CINAL (i) - (119) (1,373) - 28,319
Ideom 99.90 1,052 (2,669) (917) (1,969)
IPQ Argentina 96.77 (2,997) 1,600 5,203 8,200
IPQ Chile 99.02 62 (94) 1,578 1,481
IQAG 0.12 682 256 1,562 881
ISATEC 100.00 (1,994) (300) (77) 1,917
Polibutenos (ii) - 2,658 - - -
Politeno Empreendimentos 100.00 (29) 713 (20) 9
Quantiq 100.00 10,033 14,945 102,059 94,244
Quattor (ii) 96.96 (632,963) - 2,129,820 -
Quattor Petroquímica (ii) 100.00 (5,504) - 860,791 -
Riopol (ii) 100.00 (42,718) - 1,687,047 -
Unipar Comercial (ii) 100.00 13,325 - 38,973 -
- - - - -
Jointly-controlled Subsidiary - - - - -
RPR 33.20 57,587 30,790 47,679 (14,193)
- - - - -
Associated companies - - - - -
CETREL 53.40 23,916 17,292 254,785 226,179
Borealis 20.00 15,028 9,704 130,940 103,422
CODEVERDE 35.75 (1,004) (770) 83,546 102,182
Sansuy Administração, Participação, 20.00 (13) (40) 1,972 1,986
Representação e Serviços Ltda
Parent Company
Adjusted equity
Adjusted net net capital deficiency

Braskem S.A. and Subsidiaries Notes to the Financial Statements at December 31, 2010 and 2009 Amounts in thousands of Brazilian reais, except when otherwise indicated
84
(i) Subsidiary merged into the Company in December 2010. (ii) Net income (loss) for the period from January to December 2010. Equity accounting is applied as from the acquisition of each investment.
(Note 1.f). (iii) Company incorporated in September 2010.
Ownership of
total capital (% )
2010 2010 2009 2010 2009
(a.2) Subsidiaries' invesments
Braskem America 100.00 162,312 - 737,914 -
PP Americas - - - - -
Braskem Distribuidora - - - - -
Braskem Importação 100.00 13 19 199 186
IPQ Argentina 0.06 (2,997) 1,600 5,203 8,200
Lantana 96.35 (3,531) (1,774) 78,410 2,235
Braskem Participações - - - - -
Ideom 0.10 1,052 (2,669) (917) (1,969)
Braskem México (iii) 100.00 (380) - 1,052 -
Braskem Inc - - - - -
Lantana 3.65 (3,531) (1,774) 78,410 2,235
Quantiq - - - - -
IQAG 99.88 682 256 1,562 881
IPQ Chile - - - - -
IPQ Argentina 3.17 (2,997) 1,600 5,203 8,200
Braskem Europe - - - - -
Jointly-controlled subsidiaries - - - - -
Propilsur 49.00 (3,564) (5,476) 86,313 (5,288)
Polimerica 49.00 (2,625) (5,950) 57,067 (5,760)
Quattor (ii) - - - - -
Commom Industries Ltd 100.00 (284) - 5,713 -
Norfolk Trading 100.00 266 - 52,992 -
Quattor Petroquímica (ii) - - - - -
Quattor (ii) 3.04 (632,963) - 2,129,820 -
-
Parent Company
Adjusted equity
Adjusted net net capital deficiency
Ownership of
total capital (% )
2010 2010 2009 2010 2009
Associated companies
CETREL 53,40 23,916 17,292 254,785 226,179
Borealis 20,00 15,028 9,704 130,940 103,422
CODEVERDE 35,75 (1,004) (770) 83,546 102,182
Sansuy Administração, Participação, 20,00 (13) (40) 1,972 1,986
Representação e Serviços Ltda
Consolidated
Adjusted equity
Adjusted net net capital deficiency

Braskem S.A. and Subsidiaries Notes to the Financial Statements at December 31, 2010 and 2009 Amounts in thousands of Brazilian reais, except when otherwise indicated
85
(b) Changes in investments in subsidiaries, jointly-controlled subsidiaries and associated companies
(i) The evolution of investment in Quattor, Quattor Petroquímica and Riopol is detailed in note 5.
Merger/ Capital Dividends Interest Provision for Equity Currency Sale
Balance on merger of Acquisition IFRS Business increase and interest on Equity Goodwill gain losses and valuation translation of Balance on
12/31/2009 shares and spin-off of shares adjustments combination (decrease) shareholders' equity pick-up amortization (loss) other adjustments adjustment investments 12/31/2010
Subsidiaries and
jointly-controlled companies
Domestic Subsidiaries
Alcácer - - 1,320 - - - - - - - - - - (1,320) -
Braskem Distribuidora 89,127 - - - - - - (3,552) - - - - - - 85,575
Braskem Participações 2,331 - - - - 1,532 - (1,417) - - (1,388) - (101) - 957
CINAL 28,319 (28,200) - - - - - (119) - - - - - - -
Ideom - - - - - - - - - - - - - - -
ISATEC 1,917 - - - - - - (1,994) - - - - - - (77)
Polibutenos - (13,032) 12,699 - - - - 333 - - - - - - -
Politeno Empreendimentos 9 - - - - - - - - - (9) - - - -
Quantiq 94,244 - - - - - (2,148) 8,213 - - 387 - - - 100,696
Quattor (i) - 13,032 498,391 29,167 1,044,637 1,435,756 - 88,698 - - - - - - 3,109,681
Quattor Petroquímica (i) - 4,270 1,781 (26,030) - 724,920 - 157,863 (2,004) - (9) - - - 860,791
Riopol (i) - 184,383 - 298,163 - 898,723 - 171,275 - - - - - - 1,552,544
RPR (i) - - - - - - - 19,121 - - (4,415) (929) - - 13,777
UNIPAR Comercial - - 30,932 - 5,523 - - 8,040 - - - - - - 44,495
Varient 14,007 (1,319) - - - - (1,256) 1,071 - - - - - (12,503) -
229,954 159,134 545,123 301,300 1,050,160 3,060,931 (3,404) 447,532 (2,004) - (5,434) (929) (101) (13,823) 5,768,439
- -
Foreign Subsidiaries - -
Braskem America 3,821 - - - - 335,467 - 154,048 - - 2,756 1,511 (46,535) - 451,068
Braskem Chile 4,989 - - - - - - 646 - - 51 - - - 5,686
Braskem Europa 114,826 - - - - 7,836 - (3,039) - - (2,645) - (32,107) - 84,871
Braskem Idesa - - 7,347 - - 37,924 - (11,304) - - - - (392) - 33,575
Braskem Inc. 15,679 - - - - 180,760 - (53,982) - - - 25,491 - - 167,948
Braskem Finance 32,697 - - - - - - (1,663) - - - - - - 31,034
IPQ Argentina 8,200 - - - - - - (2,997) - - - - - - 5,203
IPQ Chile 1,481 - - - - - - 62 - - 35 - - - 1,578
181,693 - 7,347 - - 561,987 - 81,771 - - 197 27,002 (79,034) - 780,963
- -
Total subsidiaries 411,647 159,134 552,470 301,300 1,050,160 3,622,918 (3,404) 529,303 (2,004) - (5,237) 26,073 (79,135) (13,823) 6,549,402
- -
Associated companies - -
CETREL 115,993 - - - - 5,369 (4,531) 12,882 (1,980) 3,881 108 - - - 131,722
Borealis 20,684 - - - - - - 5,504 - - - - - - 26,188
Total associated companies 136,677 - - - - 5,369 (4,531) 18,386 (1,980) 3,881 108 - - - 157,910
-
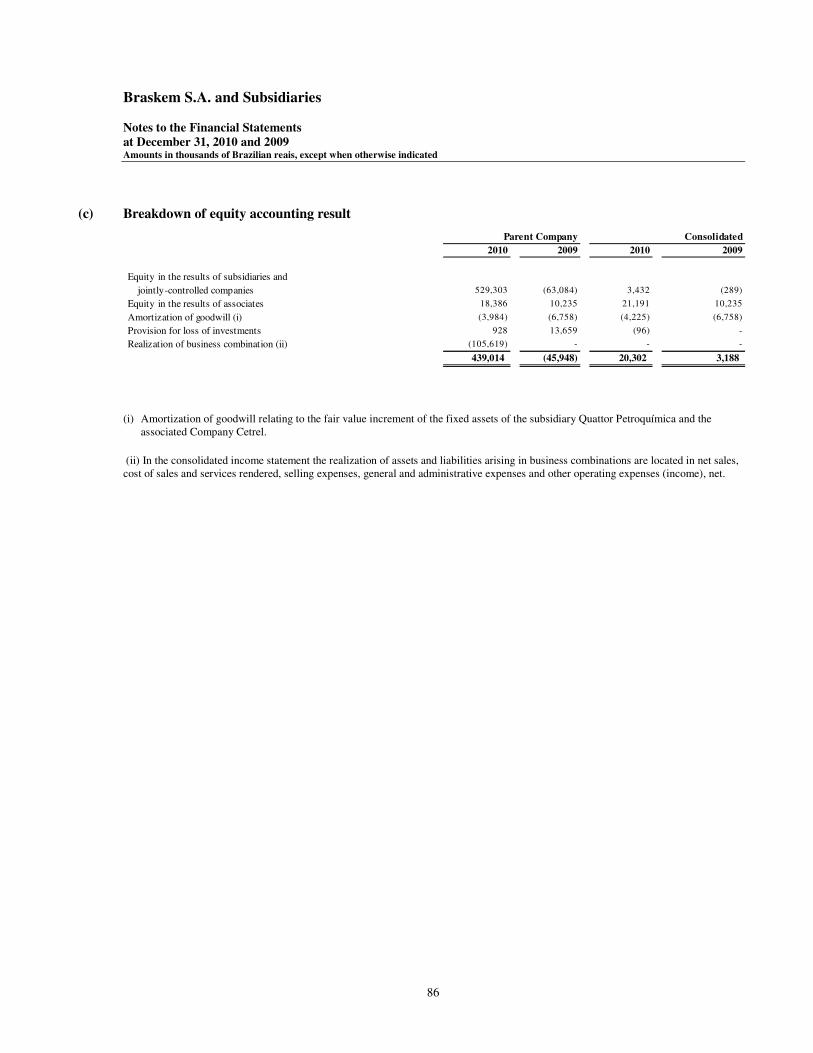
Braskem S.A. and Subsidiaries Notes to the Financial Statements at December 31, 2010 and 2009 Amounts in thousands of Brazilian reais, except when otherwise indicated
86
(c) Breakdown of equity accounting result
(i) Amortization of goodwill relating to the fair value increment of the fixed assets of the subsidiary Quattor Petroquímica and the
associated Company Cetrel.
(ii) In the consolidated income statement the realization of assets and liabilities arising in business combinations are located in net sales, cost of sales and services rendered, selling expenses, general and administrative expenses and other operating expenses (income), net.
Consolidated
2010 2009 2010 2009
Equity in the results of subsidiaries and
jointly-controlled companies 529,303 (63,084) 3,432 (289)
Equity in the results of associates 18,386 10,235 21,191 10,235
Amortization of goodwill (i) (3,984) (6,758) (4,225) (6,758)
Provision for loss of investments 928 13,659 (96) -
Realization of business combination (ii) (105,619) - - -
439,014 (45,948) 20,302 3,188
Parent Company
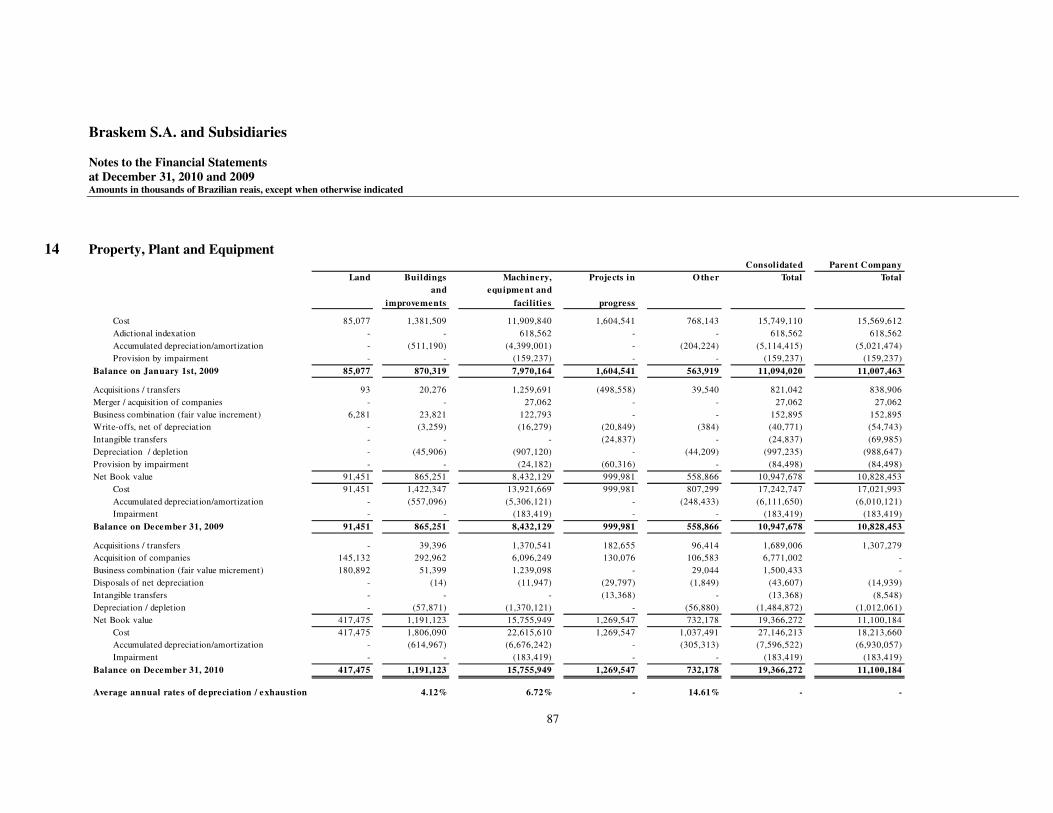
Braskem S.A. and Subsidiaries Notes to the Financial Statements at December 31, 2010 and 2009 Amounts in thousands of Brazilian reais, except when otherwise indicated
87
14 Property, Plant and Equipment
Parent Company
Land Buildings
and
improvements
Machinery,
equipment and
facil ities
Projects in
progress
O ther Total Total
Cost 85,077 1,381,509 11,909,840 1,604,541 768,143 15,749,110 15,569,612
Adictional indexation - - 618,562 - - 618,562 618,562
Accumulated depreciation/amortization - (511,190) (4,399,001) - (204,224) (5,114,415) (5,021,474)
Provision by impairment - - (159,237) - - (159,237) (159,237)
Balance on January 1st, 2009 85,077 870,319 7,970,164 1,604,541 563,919 11,094,020 11,007,463
Acquisit ions / transfers 93 20,276 1,259,691 (498,558) 39,540 821,042 838,906
Merger / acquisit ion of companies - - 27,062 - - 27,062 27,062
Business combination (fair value increment) 6,281 23,821 122,793 - - 152,895 152,895
Write-offs, net of depreciation - (3,259) (16,279) (20,849) (384) (40,771) (54,743)
Intangible transfers - - - (24,837) - (24,837) (69,985)
Depreciation / depletion - (45,906) (907,120) - (44,209) (997,235) (988,647)
Provision by impairment - - (24,182) (60,316) - (84,498) (84,498)
Net Book value 91,451 865,251 8,432,129 999,981 558,866 10,947,678 10,828,453
Cost 91,451 1,422,347 13,921,669 999,981 807,299 17,242,747 17,021,993
Accumulated depreciation/amortization - (557,096) (5,306,121) - (248,433) (6,111,650) (6,010,121)
Impairment - - (183,419) - - (183,419) (183,419)
Balance on December 31, 2009 91,451 865,251 8,432,129 999,981 558,866 10,947,678 10,828,453
Acquisit ions / transfers - 39,396 1,370,541 182,655 96,414 1,689,006 1,307,279
Acquisit ion of companies 145,132 292,962 6,096,249 130,076 106,583 6,771,002 -
Business combination (fair value micrement) 180,892 51,399 1,239,098 - 29,044 1,500,433 -
Disposals of net depreciation - (14) (11,947) (29,797) (1,849) (43,607) (14,939)
Intangible transfers - - - (13,368) - (13,368) (8,548)
Depreciation / depletion - (57,871) (1,370,121) - (56,880) (1,484,872) (1,012,061)
Net Book value 417,475 1,191,123 15,755,949 1,269,547 732,178 19,366,272 11,100,184
Cost 417,475 1,806,090 22,615,610 1,269,547 1,037,491 27,146,213 18,213,660
Accumulated depreciation/amortization - (614,967) (6,676,242) - (305,313) (7,596,522) (6,930,057)
Impairment - - (183,419) - - (183,419) (183,419)
Balance on December 31, 2010 417,475 1,191,123 15,755,949 1,269,547 732,178 19,366,272 11,100,184
Average annual rates of depreciation / exhaustion 4.12% 6.72% - 14.61% - -
Consolidated
Braskem S.A. and Subsidiaries Notes to the Financial Statements at December 31, 2010 and 2009 Amounts in thousands of Brazilian reais, except when otherwise indicated
88
The projects in progress largely involve the implementation of projects in industrial units, operating improvements to increase the useful life of machinery and equipment and projects in the areas of health, safety and the environment.
Impairment test for property, plant and equipment In preparing the Business Plan for the 2011/2015 period, the Company’s management analyzed expectations for the major variables that affect the Company’s business, in both domestic and international markets. In general, the Business Plan was prepared taking into consideration that 1) it does not include any situation that may prevent the continued operation of Braskem’s assets, both in terms of obsolescence of the industrial park and technology used, as well as of legal restrictions. The Company’s Management believes that the plants will operate at full capacity, or close to it, within the projected timeframe. Also, no substantial changes to the Company’s business are expected, such as a significant excess in the offer by other manufacturers that may negatively affect future businesses, with the exception of the seasonal price and profitability increases and decreases, which are historically associated to petrochemical businesses worldwide. Furthermore, no new technologies or raw materials are expected, which could negatively impact Braskem’s future performance. The Company expects to continue to operate in a regulatory environment that targets environmental preservation, which is absolutely in line with Braskem’s practices. The major variables analyzed and respective conclusions are as follows:
• Industrial GDP growth – historically there has been a correlation between the volume of sales of polypropylene, polyethylene, and PVC and Brazil’s industrial GDP growth. Based on the scenario projected by specialist consultants, management expects an average GDP growth of 4% per year for the period analyzed, which should be reflected in the Company’s volume of domestic sales.
• Naphtha price – based on the scenario projected by specialist consultants, management expects price increases to average 11% per year, despite the oversupply in Europe and Arabian Gulf. In addition, there is a trend toward crackers substituting Naphtha for gas-based materials. This increase will be reflected in the resin price.
• Brazil’s GDP growth – In 2011 GDP will reflect growth due to the increased share of emerging countries. In the coming years the growth rates of developed countries will continue their downward trend (average 2% per year) due to the high level of debt incurred to sustain the increase in government spending to counteract the effects of the financial crisis.
• Inflation – Inflation remains high, due to higher consumption after 2009 as a result of an increase in consumer confidence. In addition, a decrease in the unemployment rate has led to an increase in income and wages.
• Exchange rate – An appreciation of the Real is expected for 2011 due to the significant foreign investments attracted by high interest rates. In the long run a rise in international interest rates tends to reduce foreign capital inflow, resulting in devaluation of the Real.
Based on the above-mentioned analyses, the Company’s management believes that the assets of the Quattor, Braskem Americas and Chemicals Distribution business units and the UNIB Bahia cash generating unit need

Braskem S.A. and Subsidiaries Notes to the Financial Statements at December 31, 2010 and 2009 Amounts in thousands of Brazilian reais, except when otherwise indicated
89
not be tested for impairment. Despite this conclusion, the Company tested the Polyolefins and Vinyls business units and the Unib Sul cash generating unit for impairment because they have goodwill based on expected future profitability (Note 15). Additional indexation of property, plant and equipment The Company elected to adopt the additional indexation, adjusting the opening balances as of January 1, 2009, the transition date (Note 4.b).

Braskem S.A. and Subsidiaries Notes to the Financial Statements at December 31, 2010 and 2009 Amounts in thousands of Brazilian reais, except when otherwise indicated
90
15 Intangible Assets
(i) Impairment test of goodwill based on future profitability The goodwill grounded on future profitability was amortized up to December 31, 2008, taking into account the maximum period of 10 years. As from 2009, this type of goodwill will no longer be systematically amortized, being subject to the annual impairment test, pursuant to the provisions of CPC 01 (R1) and IAS 36. The impairment test as applied to the business units and cash generating units containing the allocated goodwill the test it is realized in December or in other months depends of the circumstances and necessity.
Parent Company
Goodwill
based on Costumers
expected future Brands and Software and
profitabili ty (i) patents licenses agreements Total Total
Cost 3,246,668 131,249 281,485 - 3,659,402 3,612,182
Accumulated amortization (1,182,961) (42,876) (91,678) - (1,317,515) (1,321,676)
Balance on January 1, 2009 2,063,707 88,373 189,807 - 2,341,887 2,290,506
Write-offs - (2) (4,779) - (4,781) (4,707)
T ransfer - 19 24,837 - 24,856 69,961
Amortization - (31,779) (12,324) - (44,103) (43,749)
Net book value 2,063,707 56,611 197,541 - 2,317,859 2,312,011
Cost 3,246,668 131,266 301,543 - 3,679,477 3,677,436
Accumulated amortization (1,182,961) (74,655) (104,002) - (1,361,618) (1,365,425)
Balance on December 31, 2009 2,063,707 56,611 197,541 - 2,317,859 2,312,011
Acquisit ions / t ransfers - - 17,042 - 17,042 -
Merger / acquisition - 87,380 94,583 252,266 434,229 -
Business combinat ion - 1,697 - 392,181 393,878 -
Write-offs - - (1,245) - (1,245) -
T ransfer from PP&E - - 13,368 - 13,368 8,548
Amortization - (8,477) (48,607) (38,865) (95,949) (40,448)
Net balance 2,063,707 137,211 272,682 605,582 3,079,182 2,280,111
Cost 3,246,668 220,343 425,291 644,447 4,536,749 3,685,984
Accumulated amortization (1,182,961) (83,132) (152,609) (38,865) (1,457,567) (1,405,873)
Balance on December 31, 2010 2,063,707 137,211 272,682 605,582 3,079,182 2,280,111
Weight average rate annual amortization - 5.23% 12.85% 6.63% - -
Consol idated

Braskem S.A. and Subsidiaries Notes to the Financial Statements at December 31, 2010 and 2009 Amounts in thousands of Brazilian reais, except when otherwise indicated
91
At December 31, 2010, the Company evaluates the profitability of goodwill using the method of value in use and based on the test results there is no loss to be registered as demonstrated on the table below:
Cash generating units and
Business Units
Goodwill
Cash Flow
Book value
(with goodwill)
% Cash Flow/ Book value
CGU – UNIB-RS 1,007,433 6,604,427 1,537,206 330
UN – Polyolefins (segment) 863,921 12,241,079 5,293,953 131
UN – Vinyls (segment) 192,353 2,826,600 2,340,541 21
Total 2,063,707 21,672,106 9,171,700 136
The cash generating unit UNIB-RS is part of the Basic Petrochemicals segment which is divided into two separate units. The other cash generating unit, named UNIB-BA does not have any goodwill registered in it. Polyolefins UN is also a segment and is divided in two UGC´s: polyethylene and polypropylene. The impairment test is performed considering the UN as a whole business. UN - Vinyls is a separate CGU and also a segment. The cash flow projection is 5 years for the period ended at December 2010. The premises used to determine the discounted cash flow includes: Projection of cash flow based on estimates of business for the future cash flows, discounted rates based on the WACC and growth rate to determine the perpetuity based on annual national consumer price index (“IPCA”). The growth rate and the discounted WACC were 4.6% and 10.69% per annum, respectively. Sensitivity Analysis According the impact in the potential cash flow related to “discount rate” and “growth rate to perpetuity” the Company executed sensitivity analysis with changes and the result is presented on the table below:
Cash generating units and Business Units and Business Units
+0.5% on discount rate
-0.5% on growth rate
to perpetuity Cash generating units and Business Unities – Unib-RS 6,307,744 6,553,038 UN – Polyolefins (segment) 11,610,637 12,173,872 UN – Vinyls (segment) 2,681,144 2,808,478
Total 20,599,525 21,535,388

Braskem S.A. and Subsidiaries Notes to the Financial Statements at December 31, 2010 and 2009 Amounts in thousands of Brazilian reais, except when otherwise indicated
92
16 Other Accounts Payable
The composition of other accounts payable is as follows:
(i) The December 31, 2010 balance includes the amount of R$ 217,006 relating to notes payable to BNDESPAR for acquisition of Riopol shares. (Note 1 (f.2)(ix)).
2010 2009 01/01/2009 2010 2009 01/01/2009
Credit notes 828 1,249 36,978 6,365 1,249 37,113
Commissions / customer bonus 1,026 6,776 23,668 4,823 6,776 23,668
Leasing agreements 13,187 18,741 - 27,693 18,741 -
Trade notes payable (i) 226,894 - - 230,085 - -
Labor agreements (Note 25(a)) 72,437 - - 83,875 - -
Other accounts payable 49,130 41,940 49,654 133,085 61,387 64,263
Total 363,502 68,706 110,300 485,926 88,153 125,044
Current liabilities 125,935 5,394 55,787 233,322 24,835 68,306
Non-current liabilities 237,567 63,312 54,513 252,604 63,318 56,738
363,502 68,706 110,300 485,926 88,153 125,044
Parent Company Consolidated

Braskem S.A. and Subsidiaries Notes to the Financial Statements at December 31, 2010 and 2009 Amounts in thousands of Brazilian reais, except when otherwise indicated
93
17 Loans and Financing
C o ns o lida t e d
M o ne ta ry re s ta te m e nt A v e ra g e int e re s t (e xc e pt whe re ind ic a te d) 2 0 10 2 0 0 9 0 1/ 0 1/ 2 0 0 9
F o re ig n c urre nc y
Euro bo nds No te 17 (a) No te 17 (a ) 3,927,712 2,250,037 3,023,099
Advances o n exchange co ntrac ts US$ exchange varia tio n 6.61% - 1,098 149,852
P repaym ent o f expo rts No te 17 (b) No te 17 (b) 2,287,738 2,669,597 4,000,282
Medium-Term No tes US$ exchange varia tio n 11.75% 438,031 457,748 618,684
FINIMP US$ exchange varia tio n 4.02% - 16,586 -
Raw m ate ria ls financ ing US$ exchange varia tio n 6.42% 15,142 16,077 21,532
Financ ing o f fixed as s e ts US$ exchange varia tio n 4.45% 352,480 - -
BNDES P o s t-fixed mo ne ta ry res ta tement (UMBNDES) (i) 6.62% 11,383 14,565 33,624
US$ exchange varia tio n 6.37% 296,318 181,293 202,666
Wo rking capita l US$ exchange varia tio n 7.49% 658,942 674,373 905,216
P o s t-fixed mo ne ta ry res ta tement 105.5% o f the CDI 1,301 - -
P ro jec t Ffnanc ing (NEXI) YEN exchange variatio n 0.95% abo ve the TIBOR 66,602 101,895 195,713
Trade bills dis co unted - 361,939 587,705
Funding co s t, ne t No te 17 (h) No te 17 (h) (29,195) (28,041) (45,806)
- - - Lo c a l c urre nc y - - -
Wo rking capita l P o s t-fixed mo ne ta ry res ta tement 100.0% to 116% o f the CDI 867,570 687,638 363,630
12.14% 266,145 18,292 -
115% to 130% o f the CDI + IOF - - 25,107
TR Fixed inte res t o f 9.93% - 79,473 -
FINAME TJ LP 1.34% 9,842 160 2,000
5.46% 1,024 - -
BNDES TJ LP 3.03% 2,419,712 1,363,294 1,369,308
BNDES EXIM 7.00% 150,452 - -
BNB 8.50% 213,686 385,428 248,296
FINEP P o s t-fixed mo ne ta ry res ta tement (TJ LP ) 0.01% 61,975 84,246 57,229
4.50% 10,004 - -
FUNDES 6.00% 187,419 - -
Trade bills dis co unted - 479 551,267
Funding co s t, ne t No ta 17 (h) No te 17 (h) (3,538) (10,744) -
To ta l 12 ,2 10 ,7 4 5 9 ,3 2 5 ,4 3 3 12 ,3 0 9 ,4 0 4
Current liabilitie s 1,206,444 1,890,494 3,279,463
No n-current liabilitie s 11,004,301 7,434,939 9,029,941
To ta l 12 ,2 10 ,7 4 5 9 ,3 2 5 ,4 3 3 12 ,3 0 9 ,4 0 4
A nnua l f ina nc ia l c ha rg e s
(i) UMBNDES = BNDES mo ne ta ry unit

Braskem S.A. and Subsidiaries Notes to the Financial Statements at December 31, 2010 and 2009 Amounts in thousands of Brazilian reais, except when otherwise indicated
94
(a) Eurobonds
The breakdown of Eurobond operations is shown below:
(b) Export Prepayments (“EPP”)
The breakdown of operations is shown below:
(i) Prepaid operation liquidity
Issue amount Interest
Issue Date (US$ in thousands) Maturity (% per annum) 2010 2009 01/01/2009
July 1997 250,000 June 2015 9.38 251,861 263,198 353,265
June 2005 150,000 N/A 9.75 - 262,231 351,960
April 2006 200,000 N/A 9.00 339,143 354,409 475,680
September 2006 275,000 January 2017 8.00 473,886 495,216 667,811
June 2008 500,000 June 2018 7.25 837,294 874,983 1,174,383
May 2010 400,000 May 2020 7.00 673,348 - -
May 2010 350,000 May 2020 7.00 589,180 - -
October/2010 450,000 N/A 7.38 763,000 - -
Total 2,575,000 3,927,712 2,250,037 3,023,099
Consolidated
Initial transaction
Issue Date
amount (US$
thousand) Maturity Charges (% per annum) 2010 2009 1/1/2009
June 2005 10,000 June 2009 US$ FX variation + 3-month Libor + 1.88% - - 11,713
July 2005 10,000 June 2010 US$ FX variation + 6-month Libor + 2.05% - 3,486 14,032
December 2005 55,000 December 2012 US$ FX variation + 6-month Libor + 1.60% 45,837 - -
May 2006 10,000 May 2009 US$ FX variation + 6-month Libor + 1,88% (0.70% - 01/01/2009) - - 23,464
May 2006 20,000 January 2010 US$ FX variation + 1-year Libor + 0.30% - - 48,912
July 2006 95,000 June 2013 US$ FX variation + 2.67% 51,166 74,148 114,202
July 2006 75,000 July 2014 US$ FX variation + 2.73% 89,561 119,718 178,265
March 2007 35,000 March 2014 US$ FX variation + 4.10% 58,630 61,298 82,691
April 2007 150,000 April 2014 US$ FX variation + 3.40% 250,662 262,749 354,588
October 2007 315,525 January 2010 US$ FX variation + 4-month Libor + 1.0% - 545,210 738,033
November 2007 150,000 November 2013 US$ FX variation + 3.53% 250,410 261,822 351,817
February 2008 150,000 February 2009 US$ FX variation + average interest rate of 1.59% - - 362,445
October 2008 725,000 October 2013 US$ FX variation + 5.64% 670,378 1,269,210 1,720,120
May 2009 20,000 January 2011 US$ FX variation + 6-month Libor + 4.06% (i) - 36,315 -
August 2009 20,000 July 2011 US$ FX variation + 6-month Libor + 5.00% 34,482 35,641 -
March 2010 100,000 March 2015 US$ FX variation + 4.67% 168,752 - -
May 2010 150,000 May 2015 US$ FX variation + 6-month Libor + 2.40% 250,631 - -
June 2010 150,000 June 2016 US$ FX variation + 6-month Libor + 2.60% 250,419 - -
December 2010 100,000 December 2017 US$ FX variation + 6-month Libor + 2.47% 166,810 - -
Total 2,340,525 2,287,738 2,669,597 4,000,282
Consolidated

Braskem S.A. and Subsidiaries Notes to the Financial Statements at December 31, 2010 and 2009 Amounts in thousands of Brazilian reais, except when otherwise indicated
95
(c) Project financing
In March and September 2005, the Company obtained loans in Japanese yen from Nippon Export
and Investment Insurance ("NEXI"), of YEN 5,256,500 thousand R$ 136,496 and YEN
6,628,200 thousand R$ 141,529 respectively. The principal is payable in eleven semi-annual
installments, with the first in March 2007 and the last in June 2012.
As described in Note 19(f.3), the Company entered into swap contracts for all of this debt which
in effect changes the annual interest cost of the tranche drawn down in March 2005 to 101.59%
of the CDI and that of the tranches drawn down in September 2005 to 104.29% and 103.98% of
the CDI. The swap contracts were made with first-tier foreign banks and their maturities,
currency, rates and amounts are perfectly matched to the debt contracted. The result of the swap
contracts is included in the financial result (Note 31).
(d) Payment schedule
The amounts of borrowing maturing in the long-term is as follows:
2010 2009 01/01/2009
2010 - - 639,155
2011 - 1,131,545 864,305
2012 1,238,243 1,262,752 1,258,640
2013 1,814,902 1,209,739 1,401,705
2014 1,691,089 809,365 948,423
2015 1,069,774 345,353 393,906
2016 671,495 88,702 72,210
2017 683,258 493,438 641,016
2018 1,082,112 1,092,855 1,466,806
2019 159,965 130,590 175,275
2020 and thereafter 2,593,463 870,600 1,168,500
Total 11,004,301 7,434,939 9,029,941
Consolidated

Braskem S.A. and Subsidiaries Notes to the Financial Statements at December 31, 2010 and 2009 Amounts in thousands of Brazilian reais, except when otherwise indicated
96
(e) Guarantees
The Company has provided the following guarantees for part of its financing:
(f) Borrowing costs capitalized
The Company capitalized financial charges during 2010 (Note 2.11) in the amount of R$ 43,491.
The average rate of these charges in the period was 6.0% per annum including foreign exchange
and monetary variation.
(g) Covenants
Some of the loan and financing agreements of the Company and its subsidiaries establish limits
for certain financial measures linked to the capacity for indebtedness and payment of interest.
Parenty Company
Guaranteed Financing
Maturity total amount Guarantees
BNB June 2016 181,770 181,770 Mortgage of plants, pledge of machinery and
equipment and bank surety
BNDES January 2020 1,907,729 1,907,729 Mortgage of plants, land and property, pledge of
machinery and equipment
NEXI June 2012 66,602 66,602 Insurance policy
Prepayments March 2014 58,630 58,630 Mortgage guarantees and lands
FINEP January 2019 71,978 71,978 Bank surety
FINAME May 2012 532 532 Pledge of equipment
Total 2,287,241 2,287,241
Consolidated
Guaranteed Financing
Maturity total amount Guarantees
BNB June 2016 181,770 181,770 Mortgage of plants, pledge of machinery and
equipment and bank surety
BNDES January 2020 2,727,413 2,727,413 Mortgage of plants, land and property, pledge of
machinery and equipment
NEXI June 2012 66,602 66,602 Insurance policy
Working capital financing activities April 2017 30,561 152,806 Factoring
Prepayments March 2014 58,630 58,630 Mortgage guarantees and lands
FINEP January 2019 71,978 71,978 Bank surety
FINAME May 2014 10,220 10,220 Pledge of equipment
Total
3,147,174 3,269,419

Braskem S.A. and Subsidiaries Notes to the Financial Statements at December 31, 2010 and 2009 Amounts in thousands of Brazilian reais, except when otherwise indicated
97
The first indicator establishes a limit for the indebtedness of the Company and its subsidiaries
based on their EBITDA generating capacity. This is calculated by dividing the Company’s
consolidated net debt by its consolidated EBITDA over the past twelve months. This indicator is
expressed in reais or U.S. dollars, depending on the contractual conditions. If expressed in US$,
the closing PTAX is used to calculate the net debt and the average US$ over the last four quarters
to calculate the EBITDA.
The second indicator defined in the contracts is the division of consolidated EBITDA by net
interest, which corresponds to the difference between interest paid and interest received. This
indicator is determined on a quarterly basis and only calculated in U.S. dollars.
A summary of these trnasactions and their limiting factors is:
Operation Indicator/Limit Currency
Debentures Net Debt/EBITDA < 4.5 R$
NEXI financing
Net Debt /EBITDA < 4.5
US$
EBITDA /Net interest > 1.5
Prepayment of exports
Net Debt /EBITDA < 4.5
US$
EBITDA/Net Interest > 2.0
The calculation of EBITDA for these transaction is determined as follows:
Consolidated
Debentures EBITDA = GP (-)GAS (+) DAC (+/-) OIE
NEXI, prepayment of exports EBITDA = GP (-)GAS (+) DAC (+/-) OIE (+) DIOC
GP=Gross profit OIE = Other operating income and expenses
GAS=General, administrative and selling expenses DIOC = Dividends and interest on capital
received from non-consolidated companies
DAC=Depreciation allocated to the cost of products sold
The penalty for failing to comply with these financial measures is the possibility of accelerating
debt maturities, except for involving debentures, where debt can only be prepaid by the issuance
of new debt with a new indicator limit, after the issue, of more than 4.5.
On December 31, 2010, all the were complied with.
(h) Transaction costs
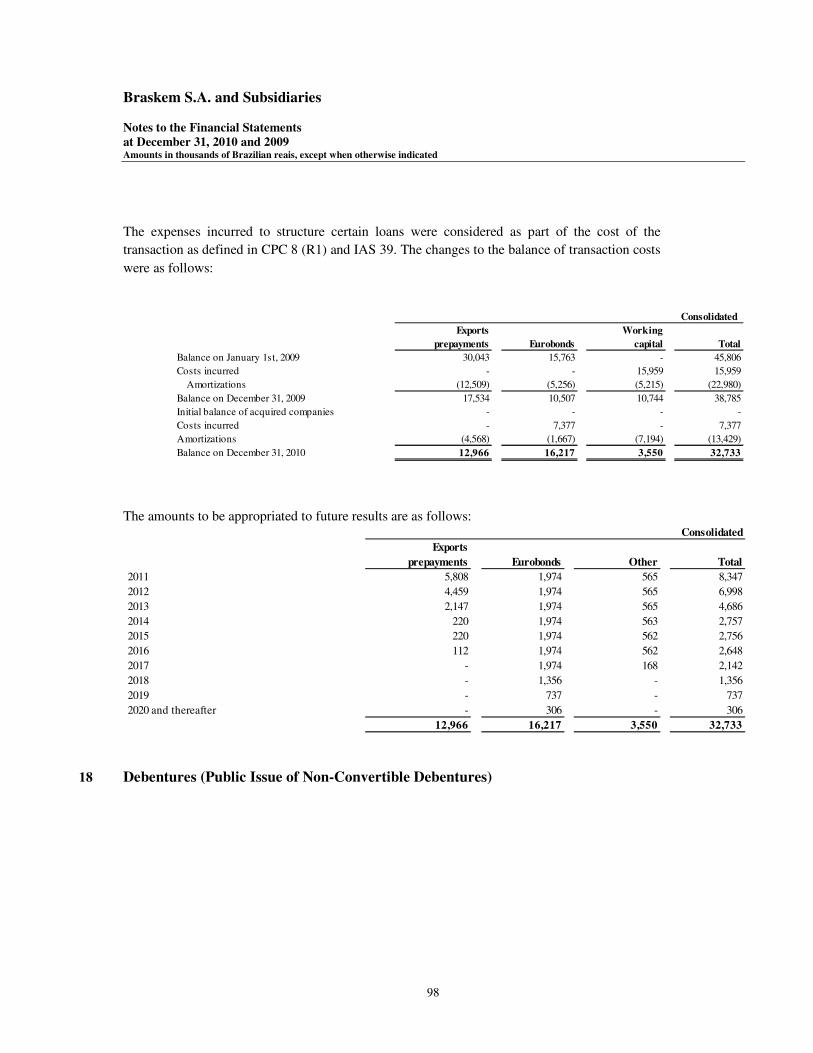
Braskem S.A. and Subsidiaries Notes to the Financial Statements at December 31, 2010 and 2009 Amounts in thousands of Brazilian reais, except when otherwise indicated
98
The expenses incurred to structure certain loans were considered as part of the cost of the
transaction as defined in CPC 8 (R1) and IAS 39. The changes to the balance of transaction costs
were as follows:
The amounts to be appropriated to future results are as follows:
18 Debentures (Public Issue of Non-Convertible Debentures)
Consolidated
Exports Working
prepayments Eurobonds capital Total
Balance on January 1st, 2009 30,043 15,763 - 45,806
Costs incurred - - 15,959 15,959
Amortizations (12,509) (5,256) (5,215) (22,980)
Balance on December 31, 2009 17,534 10,507 10,744 38,785
Initial balance of acquired companies - - - -
Costs incurred - 7,377 - 7,377
Amortizations (4,568) (1,667) (7,194) (13,429)
Balance on December 31, 2010 12,966 16,217 3,550 32,733
Consolidated
Exports
prepayments Eurobonds Other Total
2011 5,808 1,974 565 8,347
2012 4,459 1,974 565 6,998
2013 2,147 1,974 565 4,686
2014 220 1,974 563 2,757
2015 220 1,974 562 2,756
2016 112 1,974 562 2,648
2017 - 1,974 168 2,142
2018 - 1,356 - 1,356
2019 - 737 - 737
2020 and thereafter - 306 - 306
12,966 16,217 3,550 32,733

Braskem S.A. and Subsidiaries Notes to the Financial Statements at December 31, 2010 and 2009 Amounts in thousands of Brazilian reais, except when otherwise indicated
99
19 Financial Instruments
19.1 - Non-derivative financial instruments
Braskem and its subsidiaries held on December 31, 2010 and 2009 the following non-derivative financial
instruments, as defined by CPC 38 and IAS 39.
Unit
Issue value Maturity Interest Payment of interest 2010 2009 01/01/2009
13th R$ 10 January 2010 104.1% of CDI Semi-annually, of December/2005 - 302,261 303,481
14th R$ 10 September 2011 103.5% of CDI Semi-annually, of March/2007 517,741 514,468 522,795
517,741 816,729 826,276
Current liabilities 517,741 500,000 26,276
Non-current liabilities - 316,729 800,000
Total 517,741 816,729 826,276
Consolidated
2010 2009 01/01/2009 2010 2009 01/01/2009
Cash and cash equivalents (Note 6)
Cash and banks Loans and receivables 252,925 335,167 147,647 252,925 335,167 147,647
Financial investments in Brazil Held for trading Level 1 2,208,475 1,613,189 1,636,428 2,208,475 1,613,189 1,636,428
Financial investments abroad Held for trading Level 1 162,870 734,712 629,674 162,870 734,712 629,674
2,624,270 2,683,068 2,413,749 2,624,270 2,683,068 2,413,749
Marketable securities (Note 7)
Available for sale Available for sale Level 1 - 261,884 331,452 - 261,884 331,452
Held for trading Held for trading Level 1 84 25,761 - 84 25,761 -
Held for trading Held for trading Level 2 236,235 147,855 187,446 236,235 147,855 187,446
Held to maturity Held to maturity 28,706 15,811 9,717 28,706 15,811 9,717
236,319 435,500 518,898 236,319 435,500 518,898
Trade accounts receivable (Note 8) Loans and receivables 1,956,951 1,725,250 2,173,737 1,956,951 1,725,250 2,173,737
Related parties (Note 10)
Assets Loans and receivables 53,742 100,725 45,953 53,742 100,725 45,953
Liabilities Loans and receivables 31,386 - - 31,386 - -
Suppliers Other financial liabilities 5,201,162 3,882,012 4,939,433 5,201,162 3,882,012 4,939,433
Financing (Note 17)
Foreign currency Other financial liabilities 8,055,649 6,745,208 9,738,373 8,127,648 6,645,480 8,592,302
Local currency Other financial liabilities 4,187,829 2,619,010 2,616,837 4,187,829 2,618,531 2,054,954
12,243,478 9,364,218 12,355,210 12,315,477 9,264,011 10,647,256
Debentures (Note 18) Other financial liabilities 517,741 816,729 826,276 516,562 810,016 803,360
Book value Fair value
Classification by category and level

Braskem S.A. and Subsidiaries Notes to the Financial Statements at December 31, 2010 and 2009 Amounts in thousands of Brazilian reais, except when otherwise indicated
100
Fair value of financial assets and liabilities is estimated as the amount for which a financial instrument could be exchanged in an arms’ length transaction and not in a forced sale or settlement. The following methods and assumptions were adopted to estimate the fair value:
a) The fair value of held for trading and held to maturity: Level 1 – active market price quotation; Level 2 – market price quotation or financial institution, agencies and similar instruments quotation.
b) Trade accounts receivables, suppliers and other short term obligations close to its accounting value according the due date on short term of these instruments.
c) The fair value of related parties is the fair value of the transaction at the end of each period, i.e., equal to the carrying amount.
d) The fair value of loans and financing is estimated by discounting future contractual cash flows at the market interest rate for similar financial instruments.
e) The fair value of debentures is obtained from secondary market prices disclosed by ANDIMA (National
Association of Financial Market Institutions).
19.2 - Risks and derivative financial instruments
(a) Risk management
The Company is exposed to market risks arising from changes in commodity prices, exchange
rates, and interest rates, as well as credit risk arising from the possibility of default of
counterparties in financial investments, accounts receivable, and derivatives.
The Company has adopted procedures for managing market and credit risks in conformity with a
new Financial Policy approved by the Board of Directors on August 9, 2010. The objective of
risk management is to protect the Company's cash flow and reduce threats to the funding of its
operating working capital and investment programs.
(b) Exposure to foreign exchange risks
The Company has business operations denominated in or indexed to foreign currencies. The
Company's raw materials and products are in accordance with or heavily influenced by
international commodity prices, which are usually denominated in U.S. dollars. Additionally, the
Company has long-term loans in foreign currencies, which cause exposure to changes in
exchange rates between the Brazilian real and the foreign currency. The Company manages its
exposure to exchange rates through a mix of debt in foreign currencies, investments in foreign
currencies, and derivatives. The Company's financial policy for foreign exchange risk
management includes maximum and minimum limits of coverage that must be followed, which
are continuously monitored by management.
Braskem S.A. and Subsidiaries Notes to the Financial Statements at December 31, 2010 and 2009 Amounts in thousands of Brazilian reais, except when otherwise indicated
101
(c) Exposure to interest rate risks
The Company is exposed to the risk that a change in floating interest rates may cause an increase
in its expenses related to payments of future interest. Its debt in foreign currency at floating rates
is mainly subject to fluctuations in LIBOR. Its local currency debt is mainly subject to the
variation of TJLP, fixed rates in designated for hedge accounting Brazilian real and the daily
variation of the CDI. Braskem has swap contracts designated for hedge accounting with
receiving positions in floating Libor and paying positions at fixed rates.
(d) Exposure to commodity risks
The Company is exposed to price fluctuations of various petrochemical commodities, in
particular, its main raw material naphtha. The Company seeks to pass on price fluctuations of
raw materials caused by fluctuations in international prices. However, part of its sales may be
made through contracts with fixed prices or with a maximum and/or minimum fluctuation band.
These contracts can be commercial agreements or derivative contracts relating to future sales.
Subsidiary Braskem PP Americas has fixed price purchase agreements, has entered into
derivatives, designated for hedge accounting, changing fixed prices for market prices.
(e) Exposure to credit risks and liquidity
• Credit risks
The operations that subject the Company to a concentration of credit risk mainly relate to bank
current accounts, financial investments, and accounts receivables where the Company is exposed
to the risk of the financial institution or the customer involved. In order to manage this risk, the
Company maintains bank current accounts and financial investments with large financial
institutions, considering the concentrations according to their rating and the price observed daily
in the market for credit default swaps referenced to the institutions, as well as net settlement
contracts that minimize the total credit risk arising from the various financial transactions entered
into between the parties.
With respect to customer credit risk, the Company protects itself by performing a rigorous
analysis before granting credit and obtaining collateral and guarantees when considered
necessary.
• Liquidity risks

Braskem S.A. and Subsidiaries Notes to the Financial Statements at December 31, 2010 and 2009 Amounts in thousands of Brazilian reais, except when otherwise indicated
102
The management of liquidity risk assures to the Company that it will have sufficient cash to attend
operational necessities, through the drawdown of committed credit lines available at any times.
The table below analyses the financial liabilities of the company by maturity, corresponding to the
period remaining on the balance sheet until the contractual maturity date.
(i) Maturity range presented is not determined by the Standards, but, based on contracts signed
(f) Derivative financial instruments
Derivative financial instruments are recognized in the balance sheet at their fair value as an asset
or liability depending on whether the fair value represents a positive or negative balance for the
Company, respectively. Derivative financial instruments are necessarily classified as "held for
trading". The periodic variations of the fair value of derivatives are recognized as financial
income or expense in the period in which they occur, except when the derivative is designated
and qualified as a hedge for accounting purposes.
Less than Between 1 and Between 2 and More than Fair Value
1 year (i) 2 years (i) 5 years (i) 5 years (i) Total
At December 31, 2010
Current
Suppliers 5,201,162 - - - 5,201,162
Financing 1,206,444 - - - 1,206,444
Debentures 517,741 - - - 517,741
Hedge accounting (f.3 (i)) 36,424 - - - 36,424
Derivatives (f.3 (i)) 12,002 1,698 - - 13,700
Non-Current
Financing - 1,238,243 4,575,765 5,190,293 11,004,301
Hedge accounting - 29,558 4,875 - 34,433
At December 31, 2009
Current
Suppliers 3,858,783 - - - 3,858,783
Financing 1,890,494 - - - 1,890,494
Debentures 316,729 - - - 316,729
Hedge accounting (f.3 (i)) 52,559 - - - 52,559
Derivatives (f.3 (i)) 16,607 9,411 1,090 - 27,108
Non-Current - - - - -
Suppliers - 23,229 - - 23,229
Financing - 1,131,545 3,281,856 3,021,538 7,434,939
Debentures - 500,000 - - 500,000
Hedge accounting (f.3 (i)) - 29,204 (2,959) - 26,245
Consolidated
Braskem S.A. and Subsidiaries Notes to the Financial Statements at December 31, 2010 and 2009 Amounts in thousands of Brazilian reais, except when otherwise indicated
103
All derivative financial instruments held at December 31, 2010 were contracted on the OTC
market with large financial counterparties under global derivative contracts in Brazil and abroad.
The Company uses derivative financial instruments for the following purposes:
f.1) Hedging: The Company's Financial Policy includes an ongoing program of short-term
hedging of the currency risk arising from its operations and financial items. The other market
risks are addressed on a case-by-case basis for each operation. In general, the Company includes
the need of a hedge in the analysis of prospective transactions and tries to tailor it to the
operations being considered in addition to maintaining it for the full term of the operation that it
is covering.
The Company may elect derivatives as hedges for the purposes of applying hedge accounting
according to CPCs 38, 39 and 40 (IAS 32, 39 and IFRS 7). The designation as a hedge for
accounting purposes is not mandatory. In general the Company would choose to designate
derivatives for hedge accounting when it is expected that this results in a significant
improvement in showing the offsetting effects of derivatives on the variations of the hedged
items.
On December 31, 2010, the Company had financial derivative contracts with a nominal value of
R$ 2,257,789 (December/2009 - R$2,338,466) of which R$279,495 was related to hedge
transactions linked to financing of projects and R$1,978,294 linked to EPP and loan transactions
(see Notes f, f.3 (i.a) and (i.b) below). Also in 2010, Braskem and its wholly-owned subsidiary
Braskem Inc. settled in advance US$ 545 million of the export prepayment obligations.
Consequently, it settled the interest rate swap, which was linked to the EPP, of the same amount.
This debt settlement was made at the accrued value and the swap at its market value. Braskem
and that subsidiary incurred a financial expense of US$ 33.16 million as a result of the early
swap settlement.
f.2) Modifying return on other instruments: The Company may use derivatives to modify the
return on investments or interest rates or the monetary restatement of financial liabilities
according to its judgment as to the most appropriate conditions for the Company. If the risk of
the modified return through derivatives is substantially lower for the Company, the transaction is
considered a hedge. When the Company uses derivatives to modify the returns on investments, it
seeks to equalize the obligations of the derivative with the rights represented by the investments.
When it uses derivatives to modify the interest rate or the monetary restatement of liabilities, its
purpose is to equalize the rights of the derivative with the obligations in the liabilities. These
operations to modify the return on investments or interest rate or index to adjust financial
commitments are made for an amount not exceeding the investment or underlying commitment.

Braskem S.A. and Subsidiaries Notes to the Financial Statements at December 31, 2010 and 2009 Amounts in thousands of Brazilian reais, except when otherwise indicated
104
The Company does not take leveraged positions in derivatives. On December 31, 2010, the
Company had no transactions of this nature.
f.3) Monetization of certain risks: the Company may use derivatives to monetize certain risks
that it deems acceptable due to its export profile. When monetizing a risk, Braskem earns a
financial income in exchange for financial compensation to the counterparty on the occurrence of
a specific event. On December 31, 2010, the Company had no trasactions of this nature.
• Hierarchy fair value
The Company applies CPC 40 and IFRS 7 for financial instruments measured at fair value in the
balance sheet, which require the disclosure of measurements through the fair value hierarchy:
a) Level 1 - Public sources, when the derivative is traded on an exchange;
b) Level 2 - By discounted cash flow techniques when the derivative is a forward purchase or
sale agreement or swap contract, or models for evaluating option contracts such as the Black-
Scholes model when the derivative has the characteristics of an option; and
c) Level 3 – Inputs for assets and liabilities that are not based on data adopted by the market
(that is, unobservable inputs).
The inputs of the valuation models are obtained from sources that reflect the most current
observable market prices, particularly the future interest curves and prices of currencies
published by the commodities and Futures Exchange, the spot exchange rates published by the
Central Bank of Brazil, and international interest curves published by widely known pricing
service companies, such as Bloomberg or Reuters.
On December 31, 2010, the Company did not have derivatives that required unobservable
assumptions for calculating their fair value.
The table below shows the operations with derivative financial instruments of Braskem and its
subsidiaries as of December 31, 2010. The Loss (gain) column shows the effect recognized in
financial income or expense associated with the settlements and the variation in fair value of
derivatives in the period ended December 31, 2010:

Braskem S.A. and Subsidiaries Notes to the Financial Statements at December 31, 2010 and 2009 Amounts in thousands of Brazilian reais, except when otherwise indicated
105
Consolidated
Carrying
Nominal Balance on Loss value Balance on
Identification value Maturity December 2009 (gain) adjustments December 2010
Derivative transaction
Yen-CDI swap
(Note 25, f.3i (i.a)) (*) R$ 279,495 June 2012 27,108 (13,408) - 13,700
27,108 (13,408) - 13,700
Current liabilit ies (hedge accounting operations and o ther derivatives) 27,108 13,700
27,108 13,700
Fair value rank: Level 2 - Interest and foreign exchange curves are obtained from Bloomberg
Hedge accounting transactions
Braskem Inc.
Interest rate
swaps (Libor x fixed) (**) US$ 400,000 thousand October 2013 73,333 30,334 (60,777) 42,890
US$ 400,000 thousand 73,333 30,334 (60,777) 42,890
Braskem
Interest rate
swaps (Libor x fixed) (**) US$ 426,146 thousand July 2014 5,471 17,490 (1,846) 21,115
Interest rate
swaps (Libor x fixed) (**) US$ 100,000 thousand March 2015 - 12,653 (7,780) 4,873
US$ 526,146 thousand 5,471 30,143 (9,626) 25,988
Interest rate
swaps (fixed rate x %CDI) (**) US$ 42,612 thousand September 2012 - - 456 456
Braskem America
Interest rate
swaps (Libor x fixed) (**) US$ 210,000 thousand April 2015 - 4,837 (3,314) 1,523
PP Americas
Sale price swaps (***) US$ 5,732 thousand June 2011 - - (1,300) (1,300)
US$ 1,184,490 thousand 78,804 65,314 (74,561) 69,557
Current assets (other trade accounts receivables) - - - (1,300)
Non-current assets (other trade accounts receivable) (5,334) - - -
Current liabilit ies (accounting hedge transactions and other derivat ives) 52,559 - - 36,424
Non-current liabilit ies (accounting hedge transactions) 31,579 - - 34,433
78,804 69,557
Fair value rank: Level 2 - Interest and foreign exchange curves are obtained from Bloomberg
(*) Exchange hedge on NEXI financing
(**) Interest rate hedge (designated for hedge accounting)
(***) Sales price hedge (designated for hedge accounting).
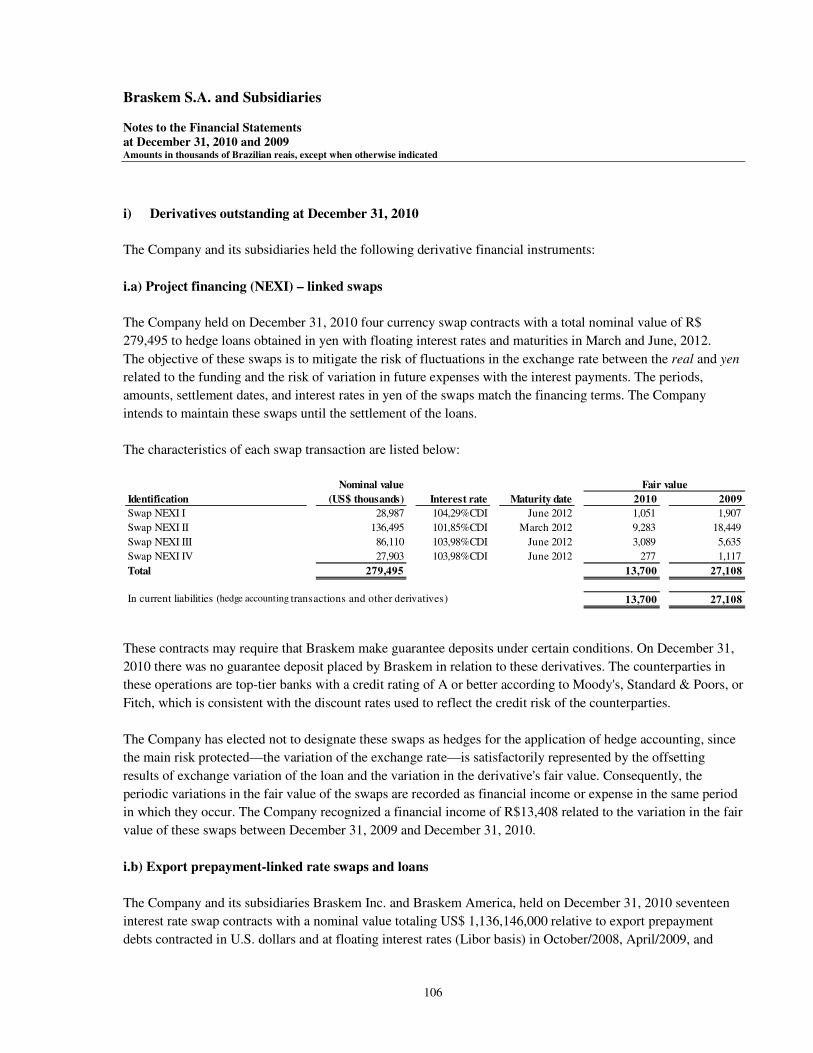
Braskem S.A. and Subsidiaries Notes to the Financial Statements at December 31, 2010 and 2009 Amounts in thousands of Brazilian reais, except when otherwise indicated
106
i) Derivatives outstanding at December 31, 2010
The Company and its subsidiaries held the following derivative financial instruments:
i.a) Project financing (NEXI) – linked swaps
The Company held on December 31, 2010 four currency swap contracts with a total nominal value of R$
279,495 to hedge loans obtained in yen with floating interest rates and maturities in March and June, 2012.
The objective of these swaps is to mitigate the risk of fluctuations in the exchange rate between the real and yen
related to the funding and the risk of variation in future expenses with the interest payments. The periods,
amounts, settlement dates, and interest rates in yen of the swaps match the financing terms. The Company
intends to maintain these swaps until the settlement of the loans.
The characteristics of each swap transaction are listed below:
These contracts may require that Braskem make guarantee deposits under certain conditions. On December 31,
2010 there was no guarantee deposit placed by Braskem in relation to these derivatives. The counterparties in
these operations are top-tier banks with a credit rating of A or better according to Moody's, Standard & Poors, or
Fitch, which is consistent with the discount rates used to reflect the credit risk of the counterparties.
The Company has elected not to designate these swaps as hedges for the application of hedge accounting, since
the main risk protected—the variation of the exchange rate—is satisfactorily represented by the offsetting
results of exchange variation of the loan and the variation in the derivative's fair value. Consequently, the
periodic variations in the fair value of the swaps are recorded as financial income or expense in the same period
in which they occur. The Company recognized a financial income of R$13,408 related to the variation in the fair
value of these swaps between December 31, 2009 and December 31, 2010.
i.b) Export prepayment-linked rate swaps and loans
The Company and its subsidiaries Braskem Inc. and Braskem America, held on December 31, 2010 seventeen
interest rate swap contracts with a nominal value totaling US$ 1,136,146,000 relative to export prepayment
debts contracted in U.S. dollars and at floating interest rates (Libor basis) in October/2008, April/2009, and
Nominal value
(US$ thousands) 2010 2009
Swap NEXI I 28,987 104,29%CDI June 2012 1,051 1,907
Swap NEXI II 136,495 101,85%CDI March 2012 9,283 18,449
Swap NEXI III 86,110 103,98%CDI June 2012 3,089 5,635
Swap NEXI IV 27,903 103,98%CDI June 2012 277 1,117
Total 279,495 13,700 27,108
In current liabilities (hedge accounting transactions and other derivatives) 13,700 27,108
Identification Interest rate Maturity date
Fair value

Braskem S.A. and Subsidiaries Notes to the Financial Statements at December 31, 2010 and 2009 Amounts in thousands of Brazilian reais, except when otherwise indicated
107
June/2010 maturing in October/2013, July/2014, and March and April/2015. In these swaps the Company
receives floating rates (LIBOR) and pays fixed rates, periodically, coinciding with the cash flow of the export
prepayment debt. The purpose of these swaps is to mitigate the variation of future service expenses caused by
fluctuations in the LIBOR rate. The periods, amounts, settlement dates, and floating interest rates match the
financing terms. The Company intends to maintain these swaps until the settlement of the loans.
For hedge accounting purposes, these swaps were designated as hedges of the risk in LIBOR fluctuations on the
specified debts. The periodic variation of the fair value of the derivatives designated as cash flow hedges that
are highly effective in offsetting the variations in cash flow of the item hedged are recognized in the equity as
Other comprehensive income until the respective variation of the hedged item impacts the statement of income.
The effects of LIBOR on the hedged item are expected to impact the results of the Company and its subsidiaries
in each period of appropriation of the interest on the debt, beginning on the date of disbursement until its
maturity.
The Company tests the effectiveness of these hedges on each reporting date by the cumulative monetary offset
method. Under this method the hedge is considered effective if the cash flow variation of the derivative is
between 80% and 125% of the hedged item caused by the risk that is being covered.
The test of effectiveness as of December 31, 2010, showed that derivatives were effective in offsetting
variations of the hedged item caused by fluctuations in LIBOR from the time of contracting the derivatives until
the end of the reporting period, and that all other conditions for qualification of these instruments for hedge
accounting are met. Consequently, the effective portion of the variation in fair value of the derivatives,
amounting to R$74,561 (Note 19, f.3(iii)), was recorded as Other comprehensive income. The Company
reclassified the amount of R$ 68,529 from carrying value adjustments to financial income. These figures refer to
the portion of the offsetting effect of the derivatives on the hedged item relative to the period ended December
31, 2010. The characteristics of each swap transaction are listed below, by company:

Braskem S.A. and Subsidiaries Notes to the Financial Statements at December 31, 2010 and 2009 Amounts in thousands of Brazilian reais, except when otherwise indicated
108
• Braskem Inc.:
• Braskem
Nominal value
(US$ thousands) 2010 2009
Swap EPP V 50.000 3.3050 October 2013 4,945 4,329
Swap EPP VI 100.000 3.5800 October 2013 11,064 10,276
Swap EPP VII 50.000 3.3150 October 2013 4,966 4,362
Swap EPP VIII 100.000 3.5250 October 2013 10,830 9,979
Swap EPP IX 100.000 3.5850 October 2013 11,085 10,302
Subtotal 400.000 42,890 39,248
Settled in advance in 2010
Swap EPP I 100.000 3.9100 October 2013 - 10,432
Swap EPP II 100.000 3.9100 October 2013 - 10,432
Swap EPP III 100.000 3.9250 October 2013 - 10,652
Swap EPP IV 25.000 3.8800 October 2013 - 2,569
Total 725.000 42,890 73,333
Current liabilities (hedge accounting transactions and other derivatives) 19,270 41,754
Non-current liabilties (hedge accounting transactions) 23,620 31,579
Total 42,890 73,333
Identification
Interest rate Maturity date Fair value
Nominal value
(US$ thousands) 2010 2009
Swap EPP X 35.000 2.5040 March 2014 1,786 1,108
Swap EPP XI 57.500 1.9500 July 2014 1,455 2,114
Swap EPP XII 100.000 2.1200 November 2013 4,061 133
Swap EPP XIII 50.000 2.1500 November 2013 2,082 (94)
Swap EPP XIV 50.000 2.6400 April 2014 3,734 740
Swap EPP XV 100.000 2.6200 April 2014 7,392 448
Swap EPP XVI 33.646 1.6700 June 2013 606 1,022
Swap EPP XVII 75.000 2.1975 March 2015 3,684 -
Swap EPP XIX 25.000 2.1700 March 2015 1,188 -
Subtotal 526.146 25,988 5,471
Settled in advance in 2010
Swap EPP XVIII 75.000 2.1850 March 2015 - -
Swap EPP XX 70.000 2.1675 March 2015 - -
Total 671.146 25,988 5,471
Non-current liabilities (other trade account receivables) - (5,334)
Current liabilities (hedge accounting transactions and other derivatives) 13,918 10,805
Non-current liabilties (hedge accounting transactions) 12,070 -
Total 25,988 5,471
Identification
Interest rate Maturity date Fair value

Braskem S.A. and Subsidiaries Notes to the Financial Statements at December 31, 2010 and 2009 Amounts in thousands of Brazilian reais, except when otherwise indicated
109
• Braskem America
The "Interest Rate" column shows the contractual fixed rate that the Company pays in exchange for receiving
Libor.
i.c) Loan-related interest rate swaps
On December 31, 2010, the Company had an interest rate swap contract, designated for hedge accounting, with a nominal value of US$ 42,612thousand, contracted in September 2010 in connection with a fixed-rate credit line in reais, maturing in September 2012. These swap contracts pay fixed rates to the Company and the Company periodically pays a CDI-based rate, according to the debt's cash flow.
• Braskem
This contract may require that the Company make guarantee deposits under certain conditions. On December
31, 2010 there was no guarantee deposit placed by the Company with respect to this derivative. The
counterparties in these operations are banks with a credit rating of A or better according to Moody's, Standard &
Poors, or Fitch, which is consistent with the discount rates used to reflect the credit risk of the counterparties.
• Maximum estimated loss
The amount at risk from the derivatives held by the Company on December 31, 2010, defined as the highest loss that could result in one month and in 95% of cases, under normal market conditions, was estimated by the Company at US$ 23,746 thousand for the EPP/Loan swaps and R$127 for the NEXI swaps.
Nominal value Fair value
(US$ thousands) 2010
Swap loans XXI 70,000 0,8275 April 2015 (2,262)
Swap loans XXII 70,000 1,8500 April 2015 1,887
Swap loans XXIII 70,000 1,8475 April 2015 1,898
Total 210,000 1,523
Current liabilities (hedge accounting transactions and other derivatives) 3,236
Non-current liabilties (hedge accounting transactions) (1,713)
Total 1,523
Identification
Interest rate Maturity date
Nominal value Fair value
(US$ thousands) 2010
Swap NCA I 42,612 100,70% CDI September 2012 456
Total 42,612 456
Non-current liabilties (hedge accounting transactions) 456
Identification
Interest rate Maturity date

Braskem S.A. and Subsidiaries Notes to the Financial Statements at December 31, 2010 and 2009 Amounts in thousands of Brazilian reais, except when otherwise indicated
110
i.d) Sale price swaps As of December 31, 2010, subsidiary PP Americas had sale price swap agreements designated for hedge accounting, in the total amount of US$5,732 thousand, which were entered into in July 2010 and December 2010 and mature in 2011. Under these swap agreements, the Company receives floating prices of polypropylene (Clearport Polypropylene Futures Contract - Nymex) and pays a fixed price of polypropylene on maturity of each agreement. The objective of these swaps is to establish a fixed price for raw material sale agreements.
• PP Americas:
ii) Exposure by counterparty
The Company’s policy is to compare credit rating disclosed by Moody’s, Standard and Poor´s and Fitch’s, and
use the lowest of the three.
The Company's exposure to risk of default by counterparties to derivative financial instruments and the rating given by rating agencies are listed in the table below, considering the market values of the derivatives together with guarantees:
PP America
Nominal value Fair value
(US$ thousands) 2010
Swap sales price 5,732 1,478 December 2011 (1,300)
Total 5,732 (1,300)
Non-current liabilities (other trade account receivables) (1,300)
Identification
Interest rate Maturity date
Counterparty Rating agencies
External credit
classification Principal Exposure December, 2010
Barclays Standard and poors A+ 56,061 606
BES Standard and poors A- 416,550 13,535
Caixa Geral Standard and poors A- 124,965 3,684
Calyon Standard and poors AA- 83,310 4,945
Citibank Standard and poors A 280,633 14,430
Deutsche Bank Standard and poors A+ 183,282 6,708
HSBC Standard and poors AA- 329,075 5,240
JP Morgan Standard and poors AA- 324,129 7,477
Nymex 14,248 896
Santander Standard and poors AA 445,537 27,932
2,257,790 85,453
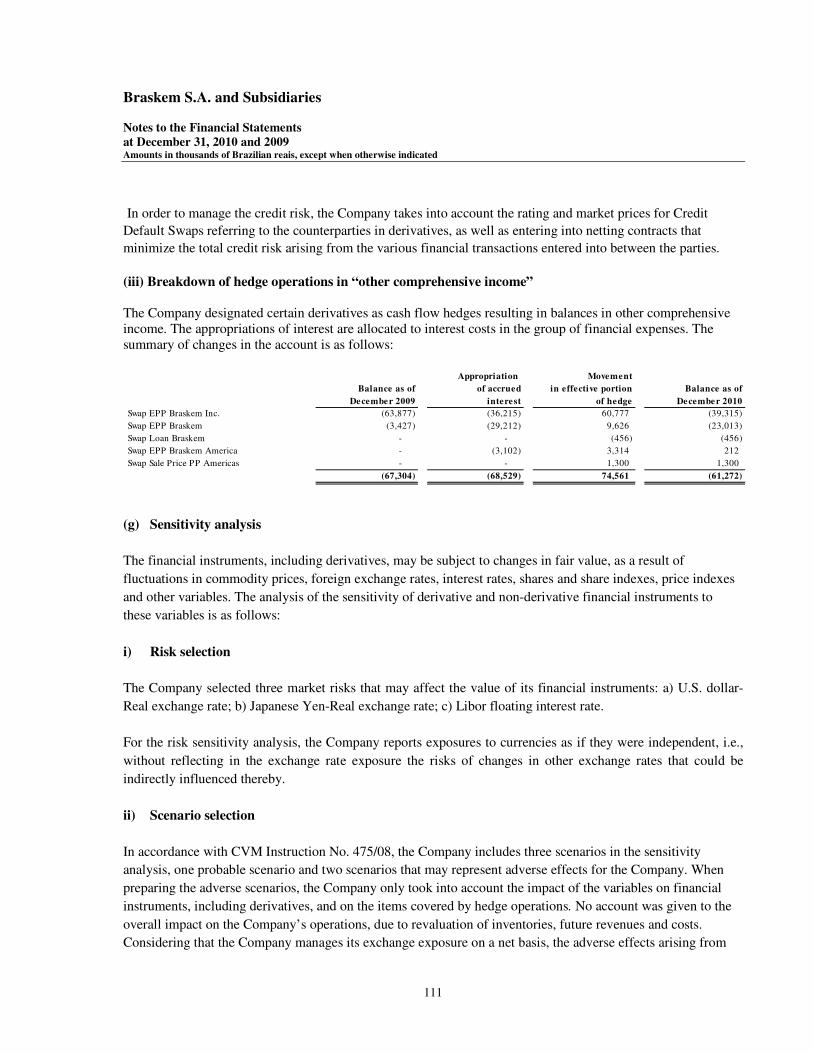
Braskem S.A. and Subsidiaries Notes to the Financial Statements at December 31, 2010 and 2009 Amounts in thousands of Brazilian reais, except when otherwise indicated
111
In order to manage the credit risk, the Company takes into account the rating and market prices for Credit
Default Swaps referring to the counterparties in derivatives, as well as entering into netting contracts that
minimize the total credit risk arising from the various financial transactions entered into between the parties.
(iii) Breakdown of hedge operations in “other comprehensive income” The Company designated certain derivatives as cash flow hedges resulting in balances in other comprehensive income. The appropriations of interest are allocated to interest costs in the group of financial expenses. The summary of changes in the account is as follows:
(g) Sensitivity analysis
The financial instruments, including derivatives, may be subject to changes in fair value, as a result of
fluctuations in commodity prices, foreign exchange rates, interest rates, shares and share indexes, price indexes
and other variables. The analysis of the sensitivity of derivative and non-derivative financial instruments to
these variables is as follows:
i) Risk selection
The Company selected three market risks that may affect the value of its financial instruments: a) U.S. dollar-
Real exchange rate; b) Japanese Yen-Real exchange rate; c) Libor floating interest rate.
For the risk sensitivity analysis, the Company reports exposures to currencies as if they were independent, i.e.,
without reflecting in the exchange rate exposure the risks of changes in other exchange rates that could be
indirectly influenced thereby.
ii) Scenario selection
In accordance with CVM Instruction No. 475/08, the Company includes three scenarios in the sensitivity
analysis, one probable scenario and two scenarios that may represent adverse effects for the Company. When
preparing the adverse scenarios, the Company only took into account the impact of the variables on financial
instruments, including derivatives, and on the items covered by hedge operations. No account was given to the
overall impact on the Company’s operations, due to revaluation of inventories, future revenues and costs.
Considering that the Company manages its exchange exposure on a net basis, the adverse effects arising from
Appropriation Movement
Balance as of of accrued in effective portion Balance as of
December 2009 interest of hedge December 2010
Swap EPP Braskem Inc. (63,877) (36,215) 60,777 (39,315)
Swap EPP Braskem (3,427) (29,212) 9,626 (23,013)
Swap Loan Braskem - - (456) (456)
Swap EPP Braskem America - (3,102) 3,314 212
Swap Sale Price PP Americas - - 1,300 1,300
(67,304) (68,529) 74,561 (61,272)

Braskem S.A. and Subsidiaries Notes to the Financial Statements at December 31, 2010 and 2009 Amounts in thousands of Brazilian reais, except when otherwise indicated
112
the appreciation of the U.S. dollar against the Brazilian Real may be mitigated by opposite effects in Braskem’s
results of operations.
The probable scenario considered was the FOCUS research published by the Brazilian Central Bank on
December 24, 2010. Concerning interest rate variables not included in the FOCUS research, the probable
scenario considered was the same percentage variation as the CDI and, as to exchange rate variables not
included in the FOCUS research, the probable scenario considered was the same percentage variation of the
U.S. dollar-real exchange rate.
A 25% increase in the U.S. dollar-real exchange rate was considered in the possible adverse scenario and 50%
in the extreme scenario compared with the closing U.S. dollar-real rate at December 31, 2010.
A 25% increase in the Japanese Yen-real exchange rate was considered in the possible adverse scenario and
50% in the extreme scenario compared with the closing Japanese Yen-Real exchange rate at December 31,
2010.
A 25% decrease in the Libor interest rate was considered in the possible adverse scenario and 50% in the
extreme scenario compared with the rate quoted at December 30, 2010.
The sensitivity amounts in the tables below are variations in the value of financial instruments according to each
scenario, except for table (v), which shows the future cash flow variations.
iii) Sensitivity to the U.S. dollar-real exchange rate
The sensitivity of each financial instrument, including derivatives and the items covered by them, to the U.S. dollar-real exchange rate variations is as follows:
iv) Sensitivity to Japanese yen-real exchange rate
Possible adverse Extreme adverse Instrument Probable scenario (25%) scenario (50%)
BNDES (4,793) (59,068) (118,137)
Eurobonds (79,676) (981,928) (1,963,856)
Working capital / structured operations (7,150) (88,120) (176,240)
Raw material financing (234) (2,887) (5,774)
Investment funds in foreign currency 608 7,489 14,978
Medium-Term Notes (8,885) (109,507) (219,015)
Export prepayments (40,399) (497,871) (995,741)
Time Deposits 1,363 16,798 33,596
Export prepayment debt, plus hedge, of which: Prepayment debt (23,047) (284,036) (568,073)
Swap EPP (see Notes f, f.3, i.b) (1,417) (17,466) (34,932)

Braskem S.A. and Subsidiaries Notes to the Financial Statements at December 31, 2010 and 2009 Amounts in thousands of Brazilian reais, except when otherwise indicated
113
The sensitivity of each financial instrument, including derivatives and the items covered by them,
to the Japanese yen-real exchange rate variation is as follows:
v) Sensitivity of future cash flows to floating LIBOR interest rates
The sensitivity of future interest income and expenses of each financial instrument, including
derivatives and the items covered by them, is stated in the table below. The figures represent the
impact on financial income (expenses), considering the average term of the respective
instrument.
19.3 – Embedded derivatives The procedures for identification of derivative instruments that are embedded in purchase, sale and service contracts are intended for timely recognition and adequate control and accounting treatment.
The contracts that may have derivative instruments embedded in them are assessed to determine whether or not the economic characteristics of the embedded derivatives are closely related to those of the host contract and, if not, the embedded derivatives are separated from the host contract and stated at fair value through profit or loss. The Company identifies embedded derivatives by means of pre established internal controls. The contracts that may have derivatives embedded in them are assessed to determine whether or not their economic characteristics are closely related to those of the host contract. At present the Company has no contract that requires separation of embedded derivatives.
Possible adverse Extreme adverse Instrument Probable scenario (25%) scenario (50%)
Working capital / structured operations (246) (5,905) (11,702)
Raw material financing (1) (17) (33)
Export prepayments (1) (32) (64)
Export prepayment debt, plus hedge, of which: Prepayment debt (2,317) (53,562) (102,425)
Swap EPP (Note f.3(i.b)) 2,244 51,873 99,195
Possible adverse Extreme adverse Instrument Probable scenario (25%) scenario (50%)
Project financing (NEXI), plus swaps, of which:
Debt (NEXI) (1,349) (16,623) (33,246) Swaps (NEXI) (Note f.3 (i.a)) 1,333 16,433 32,865
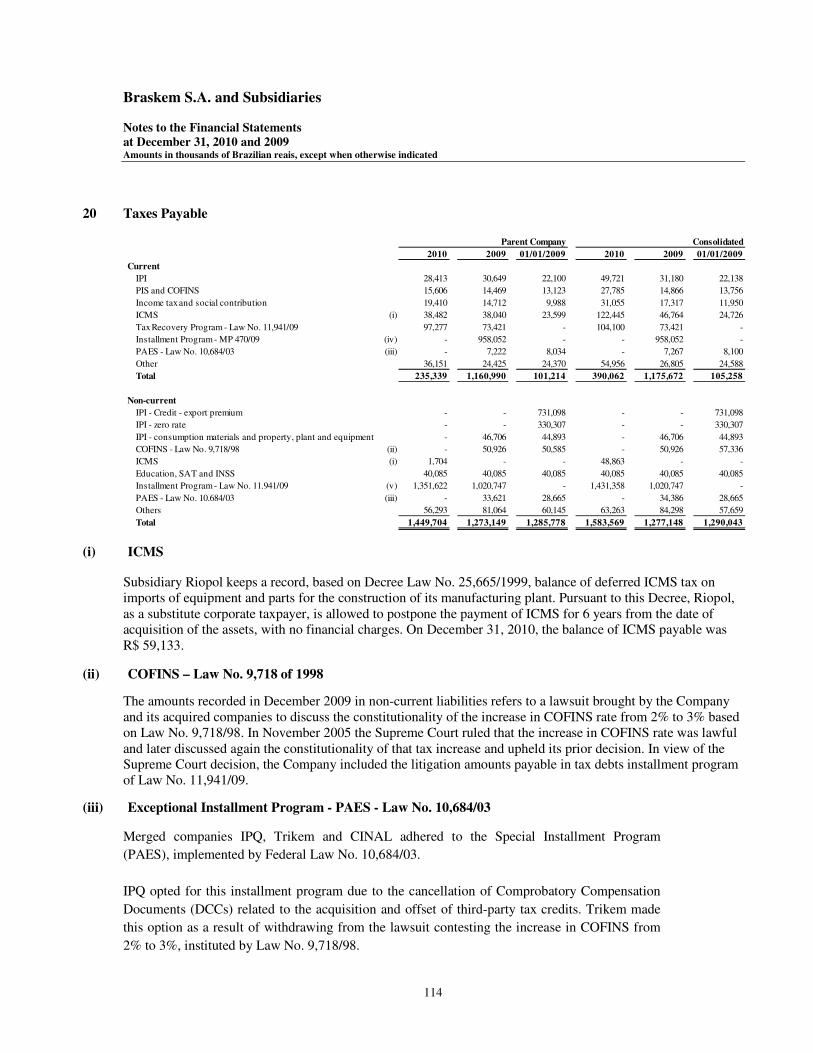
Braskem S.A. and Subsidiaries Notes to the Financial Statements at December 31, 2010 and 2009 Amounts in thousands of Brazilian reais, except when otherwise indicated
114
20 Taxes Payable
(i) ICMS
Subsidiary Riopol keeps a record, based on Decree Law No. 25,665/1999, balance of deferred ICMS tax on imports of equipment and parts for the construction of its manufacturing plant. Pursuant to this Decree, Riopol, as a substitute corporate taxpayer, is allowed to postpone the payment of ICMS for 6 years from the date of acquisition of the assets, with no financial charges. On December 31, 2010, the balance of ICMS payable was R$ 59,133.
(ii) COFINS – Law No. 9,718 of 1998
The amounts recorded in December 2009 in non-current liabilities refers to a lawsuit brought by the Company and its acquired companies to discuss the constitutionality of the increase in COFINS rate from 2% to 3% based on Law No. 9,718/98. In November 2005 the Supreme Court ruled that the increase in COFINS rate was lawful and later discussed again the constitutionality of that tax increase and upheld its prior decision. In view of the Supreme Court decision, the Company included the litigation amounts payable in tax debts installment program of Law No. 11,941/09.
(iii) Exceptional Installment Program - PAES - Law No. 10,684/03
Merged companies IPQ, Trikem and CINAL adhered to the Special Installment Program
(PAES), implemented by Federal Law No. 10,684/03.
IPQ opted for this installment program due to the cancellation of Comprobatory Compensation
Documents (DCCs) related to the acquisition and offset of third-party tax credits. Trikem made
this option as a result of withdrawing from the lawsuit contesting the increase in COFINS from
2% to 3%, instituted by Law No. 9,718/98.
2010 2009 01/01/2009 2010 2009 01/01/2009
Current
IPI 28,413 30,649 22,100 49,721 31,180 22,138
PIS and COFINS 15,606 14,469 13,123 27,785 14,866 13,756
Income tax and social contribution 19,410 14,712 9,988 31,055 17,317 11,950
ICMS (i) 38,482 38,040 23,599 122,445 46,764 24,726
Tax Recovery Program - Law No. 11,941/09 97,277 73,421 - 104,100 73,421 -
Installment Program - MP 470/09 (iv) - 958,052 - - 958,052 -
PAES - Law No. 10,684/03 (iii) - 7,222 8,034 - 7,267 8,100
Other 36,151 24,425 24,370 54,956 26,805 24,588
Total 235,339 1,160,990 101,214 390,062 1,175,672 105,258
Non-current
IPI - Credit - export premium - - 731,098 - - 731,098
IPI - zero rate - - 330,307 - - 330,307
IPI - consumption materials and property, plant and equipment - 46,706 44,893 - 46,706 44,893
COFINS - Law No. 9,718/98 (ii) - 50,926 50,585 - 50,926 57,336
ICMS (i) 1,704 - - 48,863 - -
Education, SAT and INSS 40,085 40,085 40,085 40,085 40,085 40,085
Installment Program - Law No. 11.941/09 (v) 1,351,622 1,020,747 - 1,431,358 1,020,747 -
PAES - Law No. 10.684/03 (iii) - 33,621 28,665 - 34,386 28,665
Others 56,293 81,064 60,145 63,263 84,298 57,659
Total 1,449,704 1,273,149 1,285,778 1,583,569 1,277,148 1,290,043
Parent Company Consolidated

Braskem S.A. and Subsidiaries Notes to the Financial Statements at December 31, 2010 and 2009 Amounts in thousands of Brazilian reais, except when otherwise indicated
115
Even though the Company was making the payments on time and meeting all the legal
requirements, the National Treasury Attorney excluded Trikem from PAES on two occasions. In
both cases, the Company obtained legal rulings determining it could remain in the installment
program.
The Company opted to exercise the right conceded by Law No. 11,941/09 to pay the outstanding balance of PAES in revised installments and, as a result, withdrew from all the litigation related to its exclusion from the previous installment program. At December 31, 2010 that balance was included on the Installment Payment Program of Law No. 11,941/09.
(iv) Installment plan based on Executive Act No. 470/09
Due to the benefits granted by Executive Act No. 470/09 of October 13, 2009 and based on the legal advisors’ opinion, the Company’s management withdrew from the judicial and administrative proceedings that sought recognition of the tax credits arising from purchase of zero-tax goods and the IPI premium credit and confirmed its decision to apply the installment payment plan permitted by the Executive Act. This payment plan was settled in 12 monthly installments in accordance with the due dates established by the executive act and the related balances for 2010 are as follows:
In connection with the Company's enrollment on the MP 470/09 program, during 2009, the Company recorded a liability totaling R$ 1.152.167. The corresponding expense was recorded under other operating income in the statement of operations, net of the effects of deferred tax assets on tax loss carryforwards and negative basis of social contribution totaling R$ 1.225.087 used to offset the liability related to the MP 470/09 program.
(v) Installment Payment Program of Law No. 11,941/09
Law No. 11,941 was published on May 27, 2009, and established the conditions for paying
federal tax debts in installments. Of particular note among these conditions are: i) the payment
can be made in up to 180 months; ii) the discounts related to fines, interest and charges vary
according to the installment payment period; iii) there is the possibility of using income tax and
social contribution loss carryforwards to settle the fines and interest. In accordance with this
Law, Braskem and its subsidiaries Quattor and Quattor Petroquímica has adhered to the
installment program and have been paying the minimum amounts established by the Law. The
Brazilian Tax Authority is expected to make available a computer application, during 2011, to
consolidate the debt included in the program, which should confirm the values recorded.
Balance of installments on December 31, 2009 958,052
(-) Installments paid (389,709)
(+) SELIC restatement 30,165
(-) Offset with tax losses and negative bases (598,508)
Balance of installments on December 31, 2010 -

Braskem S.A. and Subsidiaries Notes to the Financial Statements at December 31, 2010 and 2009 Amounts in thousands of Brazilian reais, except when otherwise indicated
116
Based on an analysis of the expected outcomes of the legal and administrative processes,
prepared by external legal advisors, the following main taxes were included in the installment
program: i) CSL of R$ 1,012,235; ii) IPI credit arising from the purchase of raw materials and
fixed assets of R$ 91,461; and iii) COFINS resulting from the legal discussion on the increase in
rate from 2% to 3% established in Law No. 9,718/98 of R$ 61,570 and iv) sundry taxes
amounting to R$114,578. In relation to the installment period, Company management opted for
180 months.
The installments due are shown below:
(i) Quattor– R$ 85,762 and Quattor Petroquímica – R$ 797.
As established in the Law, the Company will lose all the reductions of arrears charges if it fails to
pay three installments, whether or not consecutive.
Parent Company Consolidated
Balance of installments on December 31, 2009 1,094,168 1,094,168
(+) New taxes and charges on arrears included in the installment 185,676 185,676
(-) Symbolic payments (120) (120)
(+) SELIC restatement 133,141 133,141
(+) PAES - Law No. 10,684/03 36,034 36,034
(+) Initial balance of companies acquired - 86,559
Balance of installments on December 31, 2010 1,448,899 1,535,458
Current liabilities 97,277 104,100
Non-current liabilities 1,351,622 1,431,358
1,448,899 1,535,458

Braskem S.A. and Subsidiaries Notes to the Financial Statements at December 31, 2010 and 2009 Amounts in thousands of Brazilian reais, except when otherwise indicated
117
21 Income Tax (“IR”) and Social Contribution on Net Income (“CSLL”)
(a) Reconciliation of the effects of IR and CSL on the Company’s income
(i) Income tax and social contribution credits on loss carryfowards used to offset IPI liabilities as described in Note 20(iv).
(ii) Deferred income tax and social contribution on tax loss carryforwards on subsidiaries Quattor and Riopol acquired in
2010.
(iii) Current and deferred social contribution recorded as consequence of the adoption of the Law 11.941/09 and the
Company´s decision to withdraw the lawsuits challenging the constitutionality of Law 7,689/88 (Note 21(e)).
(iv)Effect of the non taxable bargain gain of Quattor and Sunoco business combinations.
2010 2009 2010 2009
Profit before income tax, social contribution and non-controlling
shareholders
2,224,189 1,748,954 1,887,438 1,758,416
Income tax and social contribution (expense)
at the rate of 34% (756,224) (594,644) (641,729) (597,862)
Equity in associated companies 186,214 (17,985) 8,372 (18,241)
Temporary differences on social contribution not previously
recognized (iii)
- 87,282 - 87,282
Permanent differences related the REFIS program 38,718 (53,100) 38,718 (53,100)
Recognition of deferred income tax not previously recognized (ii) - - 282,997 -
Adjustments related to Law Nos. 11,638/07 and 11,941/09 (10,705) - (10,705) -
Tax exemption (Sudene and PAT) 5,479 - 5,479 -
Social contribution recorded from previous years (iii) (18,335) (339,280) (18,186) (342,203)
Loss carryforward used to offset other taxes (i) - (502,292) - (502,292)
Business combination effects (iv) 233,440 34,697 331,596 34,697
Other permanent differences (7,467) 34,859 5,505 31,794
Effect of income tax and social contribution on results of operations (328,880) (1,350,463) 2,047 (1,359,925)
Breakdown of Income Tax (IRPJ) and Social Contribution (CSL):
IR and CSL - Current (7,570) (799) (48,829) (11,348)
Tax benefits (Sudene and PAT) 5,479 - 5,479 -
Social contribution recorded in previous years (18,335) (339,280) (18,186) (342,203)
Income tax and social contribution - current (20,426) (340,079) (61,536) (353,551)
BRGAAP - Deferred (232,868) (617,973) 85,944 (615,287)
IFRS - Deferred (75,586) (392,411) (22,361) (391,087)
Income tax and social contribution - deferred (308,454) (1,010,384) 63,583 (1,006,374)
Total income tax and social contribution on results of operations (328,880) (1,350,463) 2,047 (1,359,925)
Parent Company Consolidated

Braskem S.A. and Subsidiaries Notes to the Financial Statements at December 31, 2010 and 2009 Amounts in thousands of Brazilian reais, except when otherwise indicated
118
(b) Deferred income tax and social contribution
(b.1) Breakdown of deferred income tax and social contribution
Breakdown of deferred income tax2010 2009 01/01/2009 2010 2009 01/01/2009
Assets
Tax losses 7,096 453,764 404,880 372,064 455,850 409,129
Amortized goodwill 77,157 122,151 167,156 80,222 122,151 167,156
Temporary provisions 55,150 79,480 79,589 73,870 89,724 82,922
Adjustments related to equacy Law Nos. 11,638/07 and 11,941/09 7,293 13,002 22,835 7,293 13,002 22,835
Other temporary differences 15,878 19,827 21,520 17,279 19,827 21,926
IFRS effects - (Note 21 (b.2)) 106,793 110,502 557,951 289,375 103,906 550,303
269,367 798,726 1,253,931 840,103 804,460 1,254,271
Non-current assets 269,367 798,726 1,253,931 840,103 804,460 1,254,271
Total 269,367 798,726 1,253,931 840,103 804,460 1,254,271
Liabilities
Adjustments related to equacy Law Nos. 11,638/07 and 11,941/09 228,726 131,996 2,666 258,430 131,996 2,666
Exchange variations 474,834 487,198 - 474,834 487,198 -
Other temporary differences 6,130 6,720 7,309 289,200 6,735 18,480
IFRS effects - (Note 21 (b.2)) 202,477 183,653 156,824 671,797 183,653 153,012
912,167 809,567 166,799 1,694,261 809,582 174,158
Non-current 912,167 809,567 166,799 1,694,261 809,582 174,158
Total 912,167 809,567 166,799 1,694,261 809,582 174,158
Composition of deferred social contribution
Assets
Social contribution losses 1,863 163,535 - 133,486 163,634 -
Amortized goodwill 28,524 44,818 - 29,628 44,818 -
Temporary provisions 18,621 28,612 - 24,764 29,279 -
Adjustments related to equacy Law Nos. 11,638/07 and 11,941/09 2,112 314 - 2,112 314 -
Other temporary differences 3,113 1,738 - 3,164 1,738 10,051
IFRS effects - (Note 21 (b.2)) 37,699 38,936 - 103,428 36,561 (2,753)
91,932 277,953 - 296,582 276,344 7,298
Non-current 91,932 277,953 - 296,582 276,344 7,298
Total 91,932 277,953 - 296,582 276,344 7,298
- - -
Liabilities
Adjustments related to equacy Law Nos. 11,638/07 and 11,941/09 82,341 47,519 - 93,000 47,519 -
Exchange variations 170,940 175,391 - 170,940 175,391 -
Other temporary differences - - - 491 - 2,403
IFRS effects - (Note 21 (b.2)) 72,892 66,114 - 241,846 66,115 (1,619)
326,173 289,024 - 506,277 289,025 784
Non-current 326,173 289,024 - 506,277 289,025 784
Total 326,173 289,024 - 506,277 289,025 784
Parent Company Consolidated
Parent Company Consolidated

Braskem S.A. and Subsidiaries Notes to the Financial Statements at December 31, 2010 and 2009 Amounts in thousands of Brazilian reais, except when otherwise indicated
119
(b.2) Changes in deferred income tax and social contribution – by nature
Parent Company
Deferred tax - assets As of December
31, 2008 Charged (debited)
As of January 1st,
2009
Charge (debited)
to the statement of
income
Charge (debited)
to business
combination
Charge (debited)
to equity
As of December
31, 2009
Charge (debited)
to the statement of
income
Credited (debited)
to burgain
purchase
Charge (debited)
to equity
Charge (debited)
to Investment
Installment
Program MP
470
As of December
31, 2010
Income tax and social contribution losses 404,880 - 404,880 212,419 - - 617,299 (9,833) - - - (598,508) 8,958
Goodwill amortized 167,156 - 167,156 (187) - - 166,969 (61,288) - - - - 105,681
Temporary adjustments 79,589 - 79,589 28,503 - - 108,092 (34,321) - - - - 73,771
Adequacy Law Nos. 11,638/07 and 11,941/09 22,835 - 22,835 (13,370) - 3,851 13,316 (10,705) - 6,795 - - 9,406
Other temporary differences 21,520 - 21,520 (6,489) - 6,533 21,564 (2,574) - - - - 18,990
Total BRGAAP 695,980 - 695,980 220,876 - 10,384 927,240 (118,721) - 6,795 - (598,508) 216,806
Business combination - Quattor - - - - - - - 2,899 - - 86,870 - 89,769
Deferred tax on goodwill - merged companies - 2,612 2,612 (268) - - 2,344 (268) - - - - 2,076
Deferred tax on tax losses - 502,024 502,024 (409,779) - - 92,245 (92,245) - - - - -
Pension plan - 20,207 20,207 4,729 - - 24,936 4,537 - - - - 29,473
Intangible write-off (R&D) - 6,280 6,280 (6,280) - - - - - - - - -
Goodwill write-off of Triunfo - - - 5,780 - - 5,780 - - - - - 5,780
Deferred charges write-off - 26,828 26,828 (2,694) - - 24,134 (6,739) - - - - 17,395
Total IFRS - 557,951 557,951 (408,512) - - 149,439 (91,816) - - 86,870 - 144,493
Total assets 695,980 557,951 1,253,931 (187,636) - 10,384 1,076,679 (210,537) - 6,795 86,870 (598,508) 361,299
Deferred tax - liabilities As of December
31, 2008
Debited (credited)
to equty
As of January 1st,
2009
Debited (credited)
to the statement of
income
Credited (debited)
to business
combination
Debited (credited)
to equty
As of December
31, 2009
Debited (credited)
to the statement of
income
Credited (debited)
to burgain
purchase
Debited (credited)
to equty
Debited (credited)
to Investment
Installment
Program MP
470
As of December
31, 2010
Adjustments related to Law Nos. 11638/07 and 2,666 - 2,666 176,849 - - 179,515 131,552 - - - - 311,067
Exchange variations - - - 662,589 - - 662,589 (16,814) - - - - 645,775
Other temporary differences 20,883 - 20,883 (589) - - 6,720 (591) - - - - 6,129
Total BRGAAP 23,549 - 23,549 838,849 - - 848,824 114,147 - - - - 962,971
Business combination - Triunfo - - - (2,857) 53,374 - 50,517 (2,201) - - - - 48,316
Business combination - Quattor - - - - - - - - - - 40,529 - 40,529
Business combination - UNIPAR - - - - - - - - 1,303 - - - 1,303
Write-off negative goodwill of Cinal - 2,183 2,183 786 - - 2,969 - - - - - 2,969
Additional indexation - 154,641 154,641 (14,030) - 55,671 196,282 (14,029) - - - - 182,252
Total IFRS - 156,824 156,824 (16,101) 53,374 55,671 249,768 (16,230) 1,303 - 40,529 - 275,369
Total liabilities 23,549 156,824 180,373 822,748 53,374 55,671 1,098,591 97,917 1,303 - 40,529 - 1,238,340
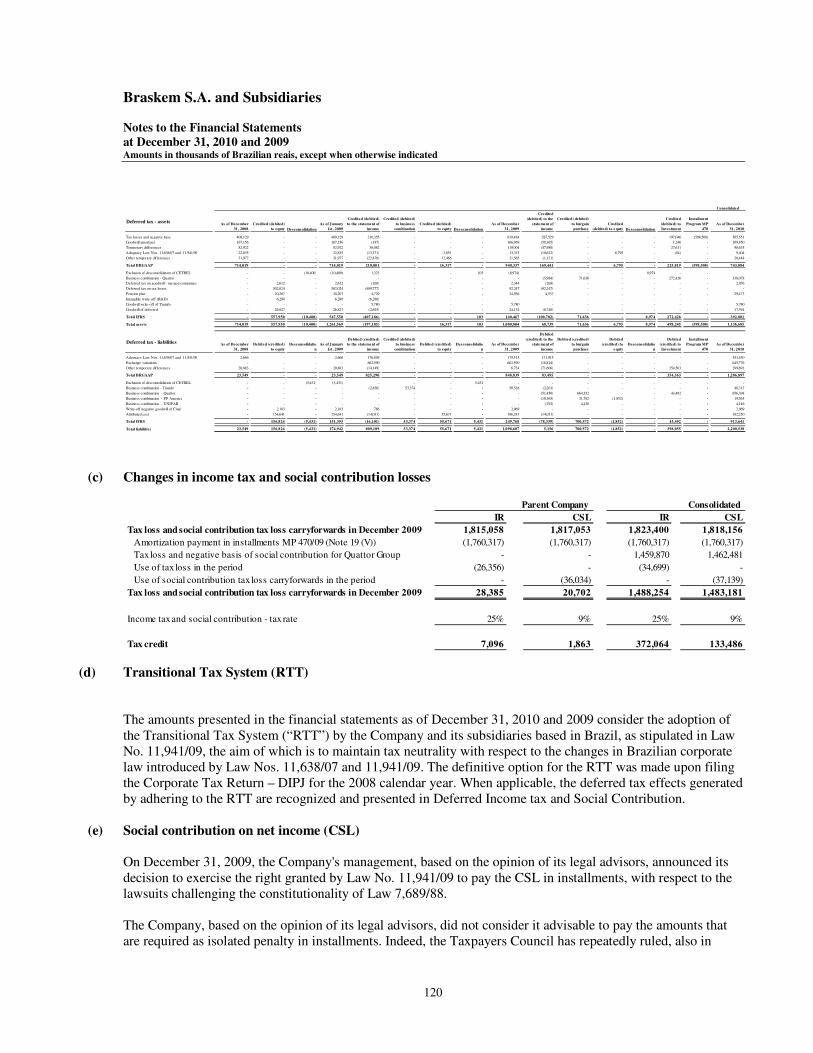
Braskem S.A. and Subsidiaries Notes to the Financial Statements at December 31, 2010 and 2009 Amounts in thousands of Brazilian reais, except when otherwise indicated
120
(c) Changes in income tax and social contribution losses
(d) Transitional Tax System (RTT) The amounts presented in the financial statements as of December 31, 2010 and 2009 consider the adoption of the Transitional Tax System (“RTT”) by the Company and its subsidiaries based in Brazil, as stipulated in Law No. 11,941/09, the aim of which is to maintain tax neutrality with respect to the changes in Brazilian corporate law introduced by Law Nos. 11,638/07 and 11,941/09. The definitive option for the RTT was made upon filing the Corporate Tax Return – DIPJ for the 2008 calendar year. When applicable, the deferred tax effects generated by adhering to the RTT are recognized and presented in Deferred Income tax and Social Contribution.
(e) Social contribution on net income (CSL)
On December 31, 2009, the Company's management, based on the opinion of its legal advisors, announced its decision to exercise the right granted by Law No. 11,941/09 to pay the CSL in installments, with respect to the lawsuits challenging the constitutionality of Law 7,689/88. The Company, based on the opinion of its legal advisors, did not consider it advisable to pay the amounts that are required as isolated penalty in installments. Indeed, the Taxpayers Council has repeatedly ruled, also in
Consolidated
Deferred tax - assetsAs of December
31, 2008
Credited (debited)
to equty Desconsolidation
As of January
1st, 2009
Credited (debited)
to the statement of
income
Credited (debited)
to business
combination
Credited (debited)
to equty Desconsolidation
As of December
31, 2009
Credited
(debited) to the
statement of
income
Credited (debited)
to burgain
purchase
Credited
(debited) to equty Desconsolidation
Credited
(debited) to
Investment
Installment
Program MP
470
As of December
31, 2010
Tax losses and negative base 409,129 - - 409,129 210,355 - - - 619,484 287,529 - - - 197,046 (598,508) 505,551
Goodwill amortized 167,156 - - 167,156 (187) - - - 166,969 (58,365) - - - 1,246 - 109,850
Temporary differences 82,922 - - 82,922 36,082 - - - 119,004 (47,980) - - - 27,611 - 98,635
Adequacy Law Nos. 11,638/07 and 11,941/09 22,835 - - 22,835 (13,371) - 3,851 - 13,315 (10,622) - 6,795 - (84) - 9,404
Other temporary differences 31,977 - - 31,977 (22,878) - 12,466 - 21,565 (1,121) - - - - - 20,444
Total BRGAAP 714,019 - - 714,019 210,001 - 16,317 - 940,337 169,441 - 6,795 - 225,819 (598,508) 743,884
Exclusion of desconsolidation of CETREL - - (10,400) (10,400) 1,323 - - 103 (8,974) - - - 8,974 - -
Business combination - Quattor - - - - - - - - - (5,984) 71,636 - - 272,426 - 338,078
Deferred tax on goodwill - merged companies - 2,612 - 2,612 (268) - - - 2,344 (268) - - - - - 2,076
Deferred tax on tax losses - 502,024 - 502,024 (409,777) - - - 92,247 (92,247) - - - - - -
Pension plan - 20,207 - 20,207 4,729 - - - 24,936 4,537 - - - - - 29,473
Intangible write-off (R&D) - 6,280 - 6,280 (6,280) - - - - - - - - - - -
Goodwill write-off of Triunfo - - - - 5,780 - - - 5,780 - - - - - - 5,780
Goodwill of deferred - 26,827 - 26,827 (2,693) - - - 24,134 (6,740) - - - - - 17,394
Total IFRS - 557,950 (10,400) 547,550 (407,186) - - 103 140,467 (100,702) 71,636 - 8,974 272,426 - 392,801
Total assets 714,019 557,950 (10,400) 1,261,569 (197,185) - 16,317 103 1,080,804 68,739 71,636 6,795 8,974 498,245 (598,508) 1,136,685
Deferred tax - liabilities As of December
31, 2008
Debited (credited)
to equty
Desconsolidatio
n
As of January
1st, 2009
Debited (credited)
to the statement of
income
Credited (debited)
to business
combination
Debited (credited)
to equty
Desconsolidatio
n
As of December
31, 2009
Debited
(credited) to the
statement of
income
Debited (credited)
to burgain
purchase
Debited
(credited) to
equty
Desconsolidatio
n
Debited
(credited) to
Investment
Installment
Program MP
470
As of December
31, 2010
Adequacy Law Nos. 11,638/07 and 11,941/09 2,666 - - 2,666 176,849 - - - 179,515 171,915 - - - - - 351,430
Exchange variations - - - - 662,590 - - - 662,590 (16,814) - - - - - 645,776
Other temporary differences 20,883 - - 20,883 (14,149) - - - 6,734 (71,606) - - - 354,563 - 289,691
Total BRGAAP 23,549 - - 23,549 825,290 - - - 848,839 83,495 - - - 354,563 - 1,286,897
Exclusion of desconsolidation of CETREL - - (5,431) (5,431) - - - 5,431 - - - - - - - -
Business combination - Triunfo - - - - (2,856) 53,374 - - 50,518 (2,201) - - - - - 48,317
Business combination - Quattor - - - - - - - - - (51,450) 664,352 - - 43,492 - 656,394
Business combination - PP America - - - - - - - - - (10,365) 31,782 (1,852) - - - 19,565
Business combination - UNIPAR - - - - - - - - - (292) 4,438 - - - - 4,146
Write-off negative goodwill of Cinal - 2,183 - 2,183 786 - - - 2,969 - - - - - - 2,969
Attributed cost - 154,641 - 154,641 (14,031) - 55,671 - 196,281 (14,031) - - - - - 182,250
Total IFRS - 156,824 (5,431) 151,393 (16,101) 53,374 55,671 5,431 249,768 (78,339) 700,572 (1,852) - 43,492 - 913,641
Total liabilities 23,549 156,824 (5,431) 174,942 809,189 53,374 55,671 5,431 1,098,607 5,156 700,572 (1,852) - 398,055 - 2,200,538
IR CSL IR CSL
Tax loss and social contribution tax loss carryforwards in December 2009 1,815,058 1,817,053 1,823,400 1,818,156
Amortization payment in installments MP 470/09 (Note 19 (V)) (1,760,317) (1,760,317) (1,760,317) (1,760,317)
Tax loss and negative basis of social contribution for Quattor Group - - 1,459,870 1,462,481
Use of tax loss in the period (26,356) - (34,699) -
Use of social contribution tax loss carryforwards in the period - (36,034) - (37,139)
Tax loss and social contribution tax loss carryforwards in December 2009 28,385 20,702 1,488,254 1,483,181
Income tax and social contribution - tax rate 25% 9% 25% 9%
Tax credit 7,096 1,863 372,064 133,486
Parent Company Consolidated
Braskem S.A. and Subsidiaries Notes to the Financial Statements at December 31, 2010 and 2009 Amounts in thousands of Brazilian reais, except when otherwise indicated
121
cases to which the Company is party, that the imposition of an isolated penalty and fine on assessment for the same taxable event is illegal. The amount of the fines under discussion, updated by the SELIC rate through December 31, 2010, is R$ 122,743. Furthermore, considering that in the case of the merged company OPP Química S.A., the government has not proposed an action for reconsideration, the Company believes that, legally, the first decision in its favor is still valid. Therefore, the assessment notices issued by the Federal Revenue Service related to OPP Química S.A. were not included in the installment program. The amount under discussion, updated by the SELIC rate through December 31, 2010, is R$ 229,736. Finally, the Company is still studying the possibility of challenging in court the validity of the fine on assessment that was charged by the tax authorities. The reason for this is that the Company, based on the opinion of its legal advisors, believes that up until the filing of the request to withdraw its administrative and judicial appeals, it is not in arrears with the government. The amount under analysis, updated by the SELIC rate through December 31, 2010, is R$ 185,029.
(f) Tax incentives
(f.1) Income tax
Up to the base year 2011, the Company has the right to a 75% reduction in the income tax due on profits from the sale of basic petrochemical products and utilities produced at the Camaçari plant. The three polyethylene plants and the polypropylene plant located in Camaçari enjoy the same reduction until 2011, 2012, 2013 and 2016. The PVC plants in Camaçari and Marechal Deodoro (AL) also have a right to the benefit until 2013 and 2019 respectively. The production of caustic soda, chlorine, ethylene dichloride, and caprolactam have the benefit of a 75% reduction in the income tax rate up until the base year of 2012.
(f.2) Value-added Tax on Sales and Services - ICMS
The Company has ICMS tax incentives granted by the State of Alagoas under the Integrated Development Program of the State of Alagoas (PRODESIN). This incentive is designed to foster installation and expansion of industries in that state and is recorded in the results for the year under the account "Deductions from sales".
22 Sundry Provisions
a) The breakdown of the balance is as follows:

Braskem S.A. and Subsidiaries Notes to the Financial Statements at December 31, 2010 and 2009 Amounts in thousands of Brazilian reais, except when otherwise indicated
122
a) Bonus provisions – certain sales agreements of the Company determine that it will give the customer products free of charge if a certain quantity of products is sold within a year. The Company provides monthly for these free products assuming that the minimum amount set forth in the agreement will be met.
b) Provision for the remediation of environmental damage – the Company has a provision for future environmental remediation expenditure in some of its plants. The estimated term of these expenditures, which are measured at present value, is five years.
c) Provisions for sundry lawsuits – based on its external legal advisors’ opinion, the Company records a provision for probable loss contingencies. The provision for civil and labor lawsuits is calculated based on the amount claimed by the plaintiffs and the Company’s history of settlement of similar lawsuits. In addition, upon the business combination of Quattor (Note 5), the Company recorded at fair value Quattor’s lawsuits with chances of possible successful outcome in the amount of R$224,625, of which R$172,409 refers to state taxes and R$52,216 refers to federal taxes (Note 25(b.3) e (d)). Provisions for sundry lawsuits are as follows:
2010 2009 2009 2010 2009 2009
Bonus provisions (a) 17,554 10,845 17,395 21,538 10,845 18,753
Provision for the recovery of environmental damage (b) 35,555 57,797 51,168 36,282 57,797 51,168
Sundry legal provisions (c) 97,422 92,825 74,295 330,807 94,402 75,296
Other - - - 6,240 - -
Total 150,531 161,467 142,858 394,867 163,044 145,217
Current liabilities 26,036 30,748 17,395 32,602 30,926 18,869
Non-current liabilities 124,495 130,719 125,463 362,265 132,118 126,348
150,531 161,467 142,858 394,867 163,044 145,217
Parent Company Consolidated
2010 2009 2009 2010 2009 2009
Labor claims 25,129 23,616 16,705 33,302 25,177 17,658
Tax claims 57,911 55,389 47,086 282,729 55,405 47,134
Civil claims 13,711 13,149 10,160 14,105 13,149 10,160
Other 671 671 344 671 671 344
97,422 92,825 74,295 330,807 94,402 75,296
Parent Company Consolidated

Braskem S.A. and Subsidiaries Notes to the Financial Statements at December 31, 2010 and 2009 Amounts in thousands of Brazilian reais, except when otherwise indicated
123
• Changes in provisions:
Recovery of Sundry Total
Bonus environmental
damage
legal provisions
January 1st, 2009 17,395 51,168 74,295 142,858
Additions 18,126 35,784 14,923 68,833
Additions through mergers - - - -
Write-offs through usage and payments (24,676) (29,155) (32) (53,863)
Restatement - - 3,639 3,639
Reclassification and transfer - - - -
December 31, 2009 10,845 57,797 92,825 161,467
Additions 33,350 - 1,571 34,921
Additions through mergers - - 941 941
Write-offs through usage and payments (26,641) (22,242) (1,000) (49,883)
Restatement - - 3,085 3,085
December 31, 2010 17,554 35,555 97,422 150,531
Parent Company
Recovery of Sundry Total
Bonus environmental
damage
legal Other provisions
January 1st, 2009 18,753 51,168 75,296 - 145,217
Additions 18,126 35,784 15,604 - 69,514
Additions through mergers - - - - -
Write-offs through usage and payments (26,034) (29,155) (327) - (55,516)
Restatement - - 3,829 - 3,829
Reclassification and transfer - - - - -
December 31, 2009 10,845 57,797 94,402 - 163,044
Additions 44,680 727 3,153 6,240 54,800
Additions through mergers - - 233,029 - 233,029
Write-offs through usage and payments (33,987) (22,242) (3,368) - (59,597)
Restatement - - 3,591 - 3,591
December 31, 2010 21,538 36,282 330,807 6,240 394,867
Consolidated
Braskem S.A. and Subsidiaries Notes to the Financial Statements at December 31, 2010 and 2009 Amounts in thousands of Brazilian reais, except when otherwise indicated
124
23 Long-term Incentives A long-term non-share-based incentive plan was approved at the Shareholders’ Meeting in September 2005, under which the participants designated annually by management can acquire securities issued by the Company that are called “investment units”. The objective of the plan is, among others, to align participants’ interest with that of shareholders to create long-term value, help participants develop a sense of ownership and motivate vision and commitment to the Company's long-term results. The investment unit does not give its holder rights as a shareholder of Braskem, or any other rights or privileges of shareholders, especially voting right and other political rights. On an annual basis, the Board of Directors approves the eligible participants, the quantity of investment units to be issued, the Company’s share in participants’ acquisition and the quantity of units offered per participant. The acceptance by the participant implies cash payment of the amount attributed to the participant and execution of the unit purchase agreement, with Braskem being responsible for issuing the Certificate of Investment Units. In 2009 and 2010, there was no new issue of investment units. The investment unit is issued in the first semester of each year and its value is updated annually based on the average quoted price of the Company’s Class A preferred share at the close of business at the São Paulo Stock Exchange (BM&FBovespa) from October to March. In addition to the change in its par value, the investment unit yields the same as dividend and/or interest on capital distributed by Braskem. There are three types of investment units: • unit acquired by the participant, called “Alpha”; • unit received by the participant from Braskem, called “Beta”; and • unit received by the participant as income, called “Gama”.
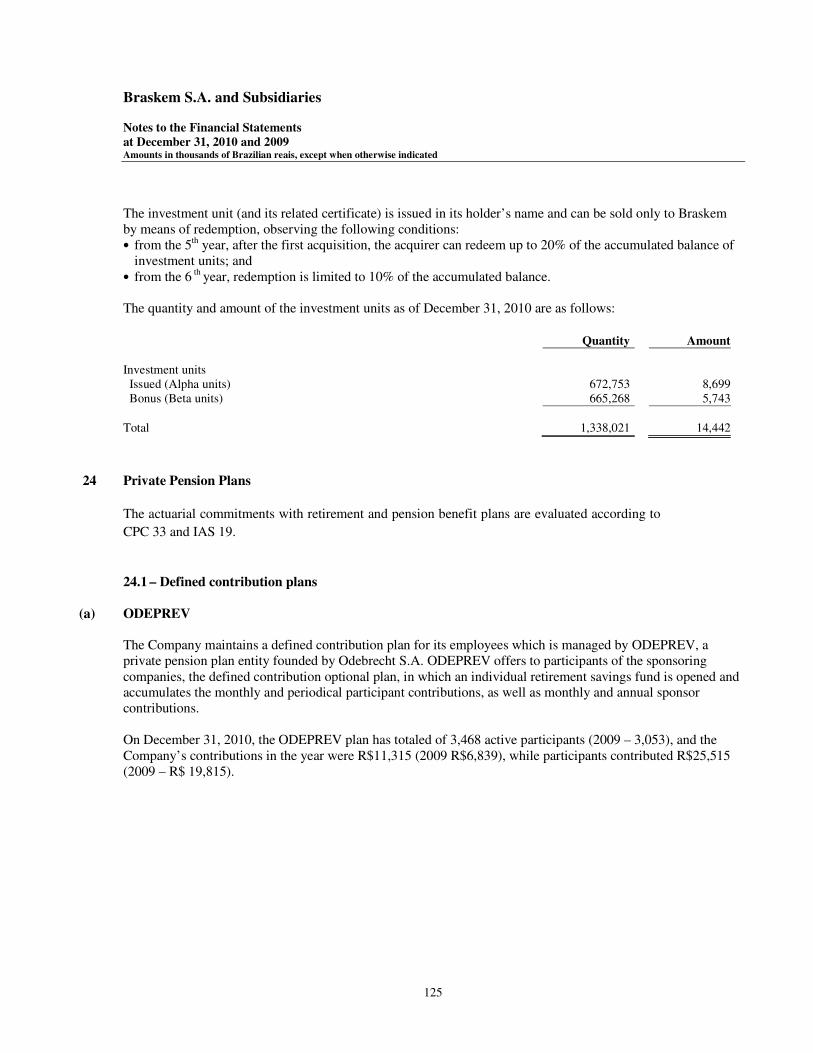
Braskem S.A. and Subsidiaries Notes to the Financial Statements at December 31, 2010 and 2009 Amounts in thousands of Brazilian reais, except when otherwise indicated
125
The investment unit (and its related certificate) is issued in its holder’s name and can be sold only to Braskem by means of redemption, observing the following conditions: • from the 5th year, after the first acquisition, the acquirer can redeem up to 20% of the accumulated balance of
investment units; and • from the 6 th year, redemption is limited to 10% of the accumulated balance. The quantity and amount of the investment units as of December 31, 2010 are as follows:
Quantity Amount
Investment units Issued (Alpha units) 672,753 8,699 Bonus (Beta units) 665,268 5,743
Total 1,338,021 14,442
24 Private Pension Plans
The actuarial commitments with retirement and pension benefit plans are evaluated according to
CPC 33 and IAS 19.
24.1 – Defined contribution plans
(a) ODEPREV The Company maintains a defined contribution plan for its employees which is managed by ODEPREV, a private pension plan entity founded by Odebrecht S.A. ODEPREV offers to participants of the sponsoring companies, the defined contribution optional plan, in which an individual retirement savings fund is opened and accumulates the monthly and periodical participant contributions, as well as monthly and annual sponsor contributions. On December 31, 2010, the ODEPREV plan has totaled of 3,468 active participants (2009 – 3,053), and the Company’s contributions in the year were R$11,315 (2009 R$6,839), while participants contributed R$25,515 (2009 – R$ 19,815).
Braskem S.A. and Subsidiaries Notes to the Financial Statements at December 31, 2010 and 2009 Amounts in thousands of Brazilian reais, except when otherwise indicated
126
(b) COPESULPREV – Plano Copesul de Previdência Complementar This defined contribution plan was created in May 2003 for the employees of subsidiary Copesul that were not included in the Petros plan. In August 2009, Braskem withdrew sponsorship for this plan, which is independently managed by Petros and is no longer connected to any other pension plan currently managed by Petros, pursuant to Supplementary Law No. 109/2001. There were no contributions by the Company or employees in 2010 (in 2009, R$1,011 and 816, respectively).
(c) Triunfo Vida The Company, when it merged Triunfo, became the sponsor of Triunfo Vida, a private supplemental pension entity, whose objective is to manage and provide a defined contribution pension plan for the acquires’ employees.
Due to the Company’s request for withdrawal as plan sponsor in June 2010, contributions made by the Company and the plan participants until that date were R$126 and R$197, respectively. 24.2 – Defined benefit plans

Braskem S.A. and Subsidiaries Notes to the Financial Statements at December 31, 2010 and 2009 Amounts in thousands of Brazilian reais, except when otherwise indicated
127
The amounts recognized for defined benefit plans are as follows:
(i) This amount is part of the balance of other accounts receivable of the non current assets
(a) Actuarial assets
Parent company Consolidated
2010 2009 01/01/2009 2010 2009 01/01/2009
Actuarial asset with:
Novamont PP Americas (i) - - - 270 - -
Actuarial liability with:
Petros Copesul 109,894 96,548 79,029 110,744 96,548 79,028
Fundação Francisco Martins Bastos (FFMB) - - 18,106 12,773 12,842 34,746
109,894 96,548 97,135 123,517 109,390 113,774
2010
Benefit obligations (17,680)
Fair value of plan assets 17,190
Funded status of the plan (490)
Actuarial gains 760
Actuarial asset in the Parent company's balance sheet 270
(b) Changes in plan elements (Novamont)
2010
Change in defined benefit obligations
Balance at beginning of the year 16,520
Current service cost 403
Interest cost 736
Benefit paid (578)
Actuarial losses (gains) 640
Other expenses (41)
Balance at the end of the year 17,680
Change in fair value of plan assets
Balance at beginning of the year 17,800
Actual return on plan assets 10
Current expenses (42)
Benefits paid (578)
Balance at the end of the year 17,190
Amounts recognized in the income statement
Current service cost 403
Interest cost 736
Expected return on plan assets (130)
1,009
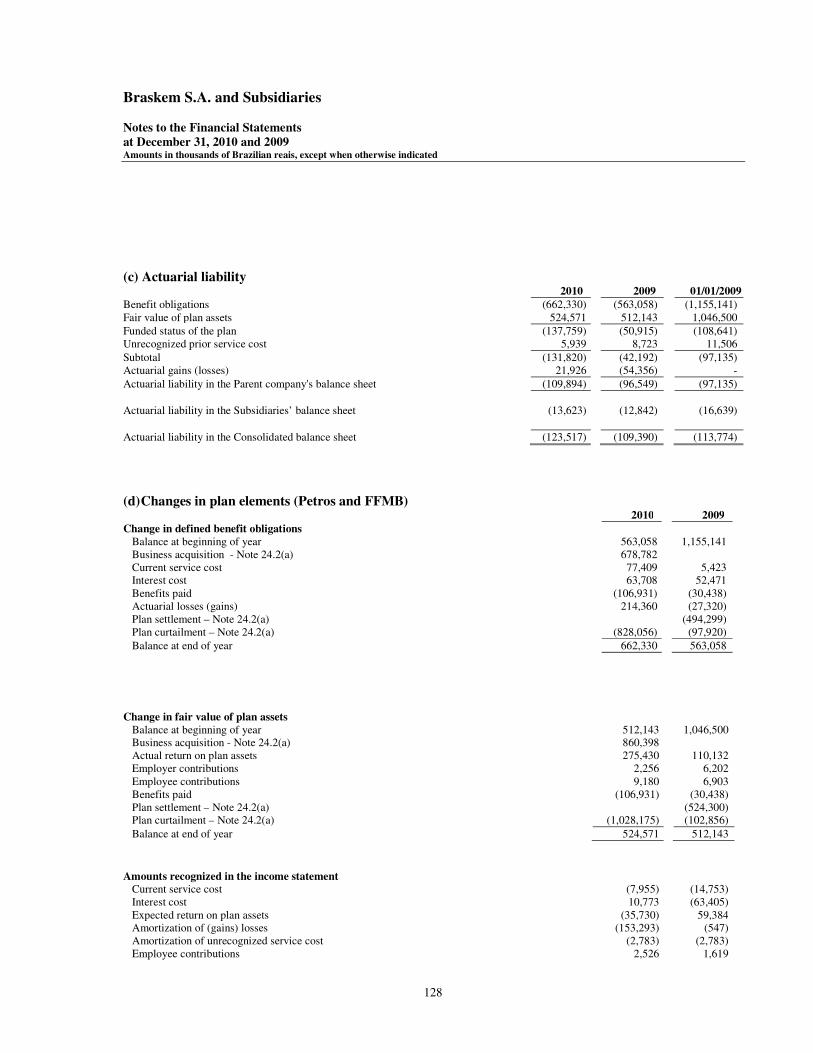
Braskem S.A. and Subsidiaries Notes to the Financial Statements at December 31, 2010 and 2009 Amounts in thousands of Brazilian reais, except when otherwise indicated
128
(c) Actuarial liability 2010 2009 01/01/2009 Benefit obligations (662,330) (563,058) (1,155,141) Fair value of plan assets 524,571 512,143 1,046,500
Funded status of the plan (137,759) (50,915) (108,641) Unrecognized prior service cost 5,939 8,723 11,506
Subtotal (131,820) (42,192) (97,135) Actuarial gains (losses) 21,926 (54,356) -
Actuarial liability in the Parent company's balance sheet (109,894) (96,549) (97,135)
Actuarial liability in the Subsidiaries’ balance sheet (13,623) (12,842) (16,639)
Actuarial liability in the Consolidated balance sheet (123,517) (109,390) (113,774)
(d) Changes in plan elements (Petros and FFMB) 2010 2009 Change in defined benefit obligations
Balance at beginning of year 563,058 1,155,141 Business acquisition - Note 24.2(a) 678,782 Current service cost 77,409 5,423 Interest cost 63,708 52,471 Benefits paid (106,931) (30,438) Actuarial losses (gains) 214,360 (27,320) Plan settlement – Note 24.2(a) (494,299) Plan curtailment – Note 24.2(a) (828,056) (97,920)
Balance at end of year 662,330 563,058
Change in fair value of plan assets
Balance at beginning of year 512,143 1,046,500 Business acquisition - Note 24.2(a) 860,398 Actual return on plan assets 275,430 110,132 Employer contributions 2,256 6,202 Employee contributions 9,180 6,903 Benefits paid (106,931) (30,438) Plan settlement – Note 24.2(a) (524,300) Plan curtailment – Note 24.2(a) (1,028,175) (102,856)
Balance at end of year 524,571 512,143
Amounts recognized in the income statement
Current service cost (7,955) (14,753) Interest cost 10,773 (63,405) Expected return on plan assets (35,730) 59,384 Amortization of (gains) losses (153,293) (547) Amortization of unrecognized service cost (2,783) (2,783) Employee contributions 2,526 1,619
Braskem S.A. and Subsidiaries Notes to the Financial Statements at December 31, 2010 and 2009 Amounts in thousands of Brazilian reais, except when otherwise indicated
129
Plan curtailment - Note 24.2(a) 173,117 21,071
Total actuarial expenses incurred in the year (13,345) 586
(e) Actuarial assumptions The main actuarial assumptions used were: 2010 2009 Discount rate 6.0% 6.0% Inflation rate 4.5% 4.5% Expected return on plan assets 10.5% 10.5% Rate of increase in future compensation levels 4.5% 4.5% Rate of increase in future pension plans 4.5% 4.5%

Braskem S.A. and Subsidiaries Notes to the Financial Statements at December 31, 2010 and 2009 Amounts in thousands of Brazilian reais, except when otherwise indicated
130
(f) Plan assets The classification of the plan assets according the fair value hierarchy (Note 19) is presented below:
• Petros
The defined benefit plan assets of Petros consist principally of Treasury Notes (NTN), fixed-income and variable-income investment funds, variable-income funds managed by large financial institutions and shares in large domestic companies. • Novamont The assets of the defined benefit plan Novamont consist of shares of funds in fixed income.
Level 1 Level 2 Level 3 Total %
Cash and cash equivalents 267 - - 267 0.05%
Certificate of bank deposits 12,423 - - 12,423 2.30%
Debt securities - corporate - 5,955 281 6,236 1.15%
Debt securities - government 73,218 - - 73,218 13.53%
Investment fund - fixed income 154,244 - - 154,244 28.50%
Investment fund – equity 149,292 - - 149,292 27.58%
Equity securities 107,989 - - 107,989 19.95%
Real state - - 30,015 30,015 5.55%
Loans to participants - - 7,576 7,576 1.40%
Fair value of plan assets 497,433 5,955 37,872 541,260
Liabilities - - - (16,689)
Fair value net, plan assets 497,433 5,955 37,872 524,571
Level 1 Level 2 Level 3 Total %
Cash and cash equivalents 430 - - 430 0.08%
Accounts receivable 1,503 1,503 0.29%
Certificate of bank deposits 12,360 - - 12,360 2.41%
Debt securities - 5,082 426 5,508 1.08%
Debt securities - government 69,636 - - 69,636 13.60%
Investment fund - fixed income 133,297 - - 133,297 26.03%
Investment fund – equity 133,985 - - 133,985 26.16%
Equity securities 117,359 - - 117,359 22.92%
Real state - - 29,922 29,922 5.84%
Loans to participants - - 8,143 8,143 1.59%Fair value net, plan assets 468,570 5,082 38,491 512,143
December, 2010
December, 2009

Braskem S.A. and Subsidiaries Notes to the Financial Statements at December 31, 2010 and 2009 Amounts in thousands of Brazilian reais, except when otherwise indicated
131
(a) PETROS - Fundação PETROBRAS de Seguridade Social PETROS Braskem Plan On June 30, 2005, the Company informed PETROS of its intent to terminate sponsorship of the defined benefit plan (Petros Braskem Plan). The termination of sponsorship was approved by PREVIC (National Supplementary Pension Department) on April 29, 2009. The financial settlement of the Plan occurred in 2009, and total individual reserves were made available to the Plan participants. The process of withdrawal of sponsorship was completed in 2010. PETROS Copesul Plan Braskem and some employees of merged Copesul contribute to retirement and defined benefit plans of PETROS, in retirement plans and defined benefit pension. As of December 31, 2010, the group of participants is composed of 293 active employees (293 in December 2009) and the Company’s and participants’ contributions in 2010 amounted to R$1,160 (R$4,876 in 2009) and R$944 (R$3,626 in 2009), respectively. Under the PETROS regulations and prevailing legislation, sponsors and participants must make further contributions if the technical reserves are not sufficient to pay all of the participants’ entitlements to pension benefits, or the benefits will be paid according to available funds. In 2010 there was no need for further contributions. PETROS PQU Plan The responsibility for this defined benefit plan was transferred to Braskem in the Quattor acquisition process in April 2010. As the former sponsor, Quattor notified PREVIC to withdraw its sponsorship from the plan and set September 30, 2009 as the date of withdrawal, when the sponsor ceased to make its contributions to the plan. The calculations of the participants’ mathematical reserves have not yet been completed and, accordingly, for December 31, 2010, the Company requested an actuarial valuation of the status of the plan, which has a surplus.
(b) Fundação Francisco Martins Bastos – FFMB The Company, upon the merger of IPQ, became the sponsor of FFMB, a private supplemental pension entity, whose objective is to manage and provide a defined benefit plan to the former employees of the Ipiranga Group. In June 2009 the Company formalized its request to withdraw from the FFMB Benefit Plan, in accordance with the FFMB regulations, from the 30th of that month. The calculation of the participants’ mathematical reserves was completed in November 2009. In the same month, the withdrawal request was filed with PREVIC and this was approved on December 16, 2010. Due to the plan surplus, no further contribution was required in the settlement process.
(c) Novamont – PP Americas
Braskem S.A. and Subsidiaries Notes to the Financial Statements at December 31, 2010 and 2009 Amounts in thousands of Brazilian reais, except when otherwise indicated
132
On April 1, 2010 with the acquisition of Sunoco Chemicals, PP Americas became a sponsor of Novamont defined benefit plan of the members of the plant Neal, West Virginia. This plan is associated with a local entity union. On December 31, 2010, Novamont is composed of 70 active participants. During 2010 there were no Company and participants contributions.
25 Contingencies The Company has contingent liabilities related to judicial and administrative proceedings arising in the normal course of business. The Company is involved in labor and social security, tax, civil and corporate lawsuits, which are assessed by management as possible losses, based on the opinion of the external legal advisors. No provision has been recognized for these possible loss contingencies, except for those derived from the business combination with Quattor. Probable contingencies are accrued and disclosed in Note 22.
(a) Labor and social security a.1) Collective bargaining agreement – Section 4
The Company and Quattor Petroquímica challenged in court the validity of the salary adjustment clause contained in the collective bargaining agreement, based on the government's economic plan established in 1990 that restricted salary increases. In September 2010, the Company, Quattor Petroquímica and the Petrochemical, Chemical, Plastics and Related Workers Union of the State of Bahia entered into an agreement to settle this litigation. Under the agreement, a payment of R$163,667, is be made in three installments, which includes indemnities with respective late payment fines and interest, attorneys’ fees and taxes. The first installment was paid in September 2010 in the amount of R$81,208. At December 31, 2010, the balance was R$83,875 (already restated by the Reference Rate), to be paid in two installments, in March and September 2011. The amount of R$73,036 is recorded in the statement of income under cost of sales and the remaining amount, which refers to late payment interest and fine, is recorded as Other in financial expenses (Notes 16 and 31). The balance of R$83,875 is recorded under Other accounts payable under Current liabilities.
a.2) INSS
The Company is a party to several administrative and judicial proceedings involving social security matters, in the total amount of R$274,944 as of December 31, 2010, which is adjusted based on SELIC.
Management believes, based on the opinion of the external legal advisors that the chance of success in these proceedings is possible, that no amount under dispute is due and thus has recorded no provision for these cases.
a.3) Other labor and social security contingencies
In the second semester of 2005, the Petrochemical and Chemical Industries Workers Union of Triunfo – RS, and of Camaçari - BA, filed claims requiring the payment of overtime in several proceedings. These claims were

Braskem S.A. and Subsidiaries Notes to the Financial Statements at December 31, 2010 and 2009 Amounts in thousands of Brazilian reais, except when otherwise indicated
133
duly challenged and the Company’s management, based on the opinion of its legal advisors, does not expect losses to result from the process. The total amount of these claims is R$ 116.485. In the third quarter of 2010, the Chemical and Petrochemical Industries Workers Union of Triunfo (Rio Grande do Sul) filed a class action requiring the payment of overtime referring to working hour breaks, and the integration into salary of the remunerated weekly day-off. The opinion of the external legal advisors is that it is possible that the Company wins these lawsuits, and therefore no provision has been made. The amount of these lawsuits totalized R$ 165,000.
• As of December 31, 2010, the Company and its subsidiaries are defendants in 1,244 indemnification and labor actions, including those previously mentioned, with losses, based on the opinion of its external advisors, deemed as possible. The amount of these actions on December 31, 2010 was R$614,785. According to the external legal advisors, the outcome of most of these actions should be favorable to the Company, and therefore no provisions were recorded.
• For lawsuits assessed as probable loss (365), the Company and its subsidiaries have a provision of R$33,302 (R$25,177 in 2009) (Note 22).
(b) Tax
b.1) Corporate Income Tax (IRPJ) and Social Contribution on Net Income (CSL)
The Brazilian Federal Revenue Service (SRF) sent an official notification to the merged company Copesul in 1999, claiming underpayment of IRPJ and CSL for 1994, related to the monetary restatement of the balance sheet and equity method adjustment, arising from accounting recognition of dividends distributed by its subsidiary overseas. The updated amount of the action totals R$ 22,137 on December 31, 2010. The case awaits judgment of appeal made by National Treasury with the High Court of Tax Appeals. The Company's legal advisors assessed the chance of success of this process as possible. b.2) IPC/BTNF - Law No. 8,200/91
In 1995 the Federal Revenue Service assessed the merged company Copesul for allegedly underpaying income tax (IRPJ) and social contribution (CSL) in fiscal years 1992 to 1994 due to the use of differences between the IPC/BTNF indexes without the restrictions imposed by Law No. 8,200/91. The assessment notice was judged valid in 1996. Since then, the National Treasury Attorney could have filed for Tax Enforcement to collect the debts from the merged company Copesul. The Government, however, under a preliminary order issued in an action to prevent the Federal Revenue Service from demanding the IRPJ and CSL in and after the fiscal year 1995, understood that it would be barred from receiving these debts. Despite having passed the statute of limitations period, the Treasury filed for Tax Enforcement in 2006 intending to collect them. Braskem filed a writ of prevention to cancel the record of this outstanding debt. The TRF of the 4th region granted Braskem's claim. The Treasury appealed to the Superior Court of Justice ("STJ"), which denied the appeal filed by the Treasury.

Braskem S.A. and Subsidiaries Notes to the Financial Statements at December 31, 2010 and 2009 Amounts in thousands of Brazilian reais, except when otherwise indicated
134
The Company has not made any provision related to this matter because, based on the opinion of its external legal advisors, it believes that the chances of success are probable.
b.3) ICMS/São Paulo In 2009, subsidiary Quattor Química, which was merged into Quattor, was fined by the São Paulo State Tax authorities (SEFAZ SP) for alleged underpayment of ICMS due to the utilization of tax credits derived from goods which were purchased from a taxpayer located in the State of Bahia and exported by the subsidiary. The updated amount involved is R$313,392. The tax delinquency notice has not yet been judged at the first administrative level. Management believes, based on the advice of its external legal advisors, that the chance of success in this proceeding is possible; however, on account of the standard applicable to business combination (Notes 5 and 22(c)) the Company recognized a provision equivalent to 40% of the value of this Notice of Infraction. b.4) ICMS/Bahia On December 30, 2010, the State of Bahia tax authorities issued a tax delinquency notice directing Braskem S/A to pay R$212,435, for alleged violations of ICMS legislation, including, among others: i) non-reversal of tax credits upon receipts of goods which were shipped with a reduced tax base; ii) non-fulfillment of record-keeping and reporting obligations; and iii) transfers between Braskem establishments of goods with prices lower than production cost. The Company will file a defense within the time limit prescribed by applicable legislation. The Company has recorded no provision for this case since it believes, based on the opinion of the external legal advisors, that its chances of success are possible.
(c) Other lawsuits of the Company and its subsidiaries c.1) Civil The Company is defendant in civil lawsuits filed by the owner of a former distributor of caustic soda and by the transportation company that provided services to this former distributor in total amount on December 31, 2010 of R$ 30,312. The plaintiffs seek compensation for damages related to alleged breach of distribution contract by the Company. The evaluation of the management, supported by the opinion of its legal advisors responsible for these cases, is that the actions are likely to be dismissed and therefore no provisions were made. c.2) Corporate matters
Some holders of incentive preferred stock proposed actions originally against Copene, previous name of the Company, and against the merged companies Nitrocarbono, OPP Química, Salgema, Trikem, Polialden, and Politeno. They claim participation in the profits remaining after the payment of preferential dividends on the same basis as other holders, along with voting rights until the distribution of dividends is restored as intended. The amount involved in the lawsuits, with a chance of a possible success, is R$ 13,450.

Braskem S.A. and Subsidiaries Notes to the Financial Statements at December 31, 2010 and 2009 Amounts in thousands of Brazilian reais, except when otherwise indicated
135
(d) Possible contingencies arising from business combination with Quattor On April 30, 2010, in addition of the item (b.3) above, the Company provisioned the amount of R$ 93,417 (December 2010 – R$ 99,268) referred to several tax contingencies with possible chances of successful according the opinion of our external legal advisors. The provision was recorded based on the business combination recognition upon acquisitions of Quattor. The amount of taxes, updated monetarily until December 31, 2010 are as follows: PIS and COFINS (total amount of R$ R$ 24,704) and Income Tax (“IR”) and Social contribution (total amount of R$ 27,512) and VAT (R$ 47,052), according to Note 22(c).
26 Equity
(a) Capital stock On December 31, 2010, the Company's subscribed and paid up capital is R$ 8,043,222 represented by 801,665,617 shares without par value divided into 451,669,063 common shares, 349,402,736 class A preferred shares, and 593,818 preferred shares class B. In May 2009, due to the merger of Triunfo (Note 1 (f.1)), the Company's capital increased by R$ 97,379, from R$ 5,375,802 to R$ 5,473,181, by issuing 13,387,157 preferred shares class A. The Company's Extraordinary General Meeting held on February 25, 2010 authorized a capital increase, independently of changes in the bylaws, up to the limit of 1,152,937,970 shares, of which 535,661,731 are common shares, 616,682,421 are preferred shares class "A" and 593,818 preferred shares class "B". The amount of preferred shares without voting rights or with restricted voting rights may not exceed the limit of two thirds of the Company's total capital. On April 14, 2010, the Company's Board of Directors approved the increase of capital in the form of private subscription by issuing 259,904,311 shares of which 243,206,530 are common shares and 16,697,781 are preferred shares class “A” with an issue value of R$ 14.40 per share totaling R$ 3,742,622. The amount of R$ 1,363,880 was credited to the capital reserve account and R$ 2,378,742 to the capital account, which increased from R$ 5,473,181 to R$ 7,851,923, representing 780,832,465 shares divided into 433,668,976 common shares, 346,569,671 class A preferred shares, and 593,818 class B preferred shares. The General and Extraordinary Meeting held on June 18, 2010 approved the merger of Quattor shares by Braskem. This merger resulted in the issue of 18,000,087 common shares totaling R$ 199,356, of which R$ 164,744 was allocated to the Capital account and R$ 34,612 to the Capital reserve account. As a result, the Company's capital increased from R$ 7,851,923 to R$ 8,016,667. The Extraordinary General Meeting held on August 30, 2010, approved the merger of Riopol shares by Braskem. This merger resulted in the issuance of 2,434,890 class A preferred shares for R$ 103,087, of which R$ 22,285 was allocated to the capital account and R$ 80,802 to the capital reserve account. As a result, the Company's capital increased from R$ 8,016,667 to R$ 8,038,952. The merger of shares of Quattor Petroquímica into Braskem was approved at the Extraordinary General Meeting held on December 27, 2010. This merger resulted in the issue of 398,175 Class A preferred shares in the total

Braskem S.A. and Subsidiaries Notes to the Financial Statements at December 31, 2010 and 2009 Amounts in thousands of Brazilian reais, except when otherwise indicated
136
amount of R$ 4,270 credited to the capital account. As a result, the Company’s capital increased from R$8,038,952 to R$8,043,222.
(b) Rights attached to shares Preferred shares carry no voting rights but they have priority over common shares in the annual payment of a cumulative dividend of 6% of their unit value, according to net income available for distribution. The share unit value is capital divided by the total number of shares outstanding. Only Class A preferred shares will have the same claim on the remaining income as common shares and will be entitled to receive dividends only after the priority dividend is paid to preferred shareholders. Only Class A preferred shares have the same claims as common shares on the distribution of shares resulting from capitalization of other reserves. Only Class A preferred shares can be converted into common shares upon approval by majority vote in a general shareholders’ meeting. Class B preferred shares can be converted into Class A preferred shares at any time, at the ratio of 2 Class B preferred shares for each Class A preferred share, upon written request sent to the Company, after the expiration of the period of non-transferability prescribed by specific legislation which allowed issue and payment of such shares with tax incentive funds. Class A and B preferred shares have preference in the reimbursement of capital in the event of the Company is wound up. Shareholders are entitled to receive a mandatory minimum dividend of 25% of the net income for the year, adjusted based on the provisions of Brazilian Corporation Law.
(c) Capital reserve – tax incentives Prior to adoption of Laws No. 11,638/07 and 11,941/09, income tax incentives (Note 21, f.1) were classified in capital reserve, without flowing through the income statement. Since January 1, 2007, tax incentives are recorded in the income statement, and allocated to a revenue reserve account as proposed by management and approved at the general shareholders’ meeting. Regardless of the change introduced by Laws No. 11,638/07 and 11,941/09, the income tax incentive can be used only for capital increase or offset of losses.
(d) Legal reserve Under the Brazilian Corporation Law, the Company must transfer 5% of the net income for the year determined in accordance with Brazilian accounting practices to a legal reserve until this reserve equals 20% of the paid-up capital. The legal reserve can be used for capital increase or offset of losses. (e) Unrealized profit reserves This reserve was established on the basis of unrealized profits in accordance with sections I and II, paragraph 1 of article 197 of Law No. 6,404/76, as amended by Law No. 11.638/07, whose future realization will occur in accordance with relevant legislation.

Braskem S.A. and Subsidiaries Notes to the Financial Statements at December 31, 2010 and 2009 Amounts in thousands of Brazilian reais, except when otherwise indicated
137
(f) Treasury shares On December 31, 2010, the Company held in treasury 1,506,060 preferred shares class "A" with the value of R$ 11,932 due to the percentage that the merged company Triunfo owned in Braskem. The total market value of these shares calculated at the average price of trading at BM&FBovespa on December 31, 2010 was R$ 25,874. The merger of Riopol shares into Braskem was approved at the Extraordinary General Meeting held on August 30, 2010, (Note 1(f.2) (x)) above. Because of this act, some holders of 411 ordinary shares of Braskem exercised their right to withdraw. The reimbursement of these shares was at the book value per share of R$9.15237722 based on the balance sheet as of December 31, 2009, totaling R$3. Such shares are included in the “treasury shares” account in equity. In the consolidated financial statements of December 31, 2010, the Company recorded the amount of R$ 48,891 under treasury shares, corresponding to 1,154,758 preferred class A shares issued by Braskem and held by the subsidiary Quattor Petroquímica. These shares were received by Quattor Petroquímica as a result of the merger of Riopol shares into Braskem. (Note 1(f.2)(ix)).
(g) Allocation of net income Under the Company’s Bylaws, net income for the year, adjusted as determined by Law No. 6404/76, is appropriated as follows: (i) 5% to a legal reserve, which must not exceed 20% of capital; (ii) 25% to pay mandatory, non-cumulative dividends, observing the privileges of the preferred shares as determined by law and the Company’s bylaws. When the priority dividend paid to preferred shareholders is equal to or greater than 25% of the net income for the year calculated based on article 202 of the Corporate Law, it constitutes the full payment of the mandatory dividend. Any surplus remaining after the payment of the priority dividend will be used: (i) to pay dividends to common shareholders up to the limit of the priority dividends of preferred shares; (ii) if there is still any surplus, to distribute additional dividends to common shareholders and Class "A" preferred shareholders on an equal footing, so that each common share or Class "A" preferred share receives the same amount of dividend. The Management proposed the payment of total dividends of R$ 665,630. This corresponds to 40% of net income adjusted for the dividend calculation. The proposed total dividend represents R$ 0.833247140 for common shares and preferred class “A” and R$ 0.601988304 to the preferred shares class "B" in accordance with the provisions of the bylaws of the Company. The Company's management proposes to the Annual General Meeting the following allocation of net income 2010:

Braskem S.A. and Subsidiaries Notes to the Financial Statements at December 31, 2010 and 2009 Amounts in thousands of Brazilian reais, except when otherwise indicated
138
(h) Loss Absorption
During the General Meeting of shareholders held on April 30, 2010, the absorption of R$ 1,061,871, which is
part of the account balance of accumulated losses existing at December 31, 2009, was approved.
2010
Net income for the period 1,895,309
Additional indexation 27,236
Prescribed dividens/others (2,650)
First adoption adjustments - Loss absportion (165,703)
Adjusted income for the period 1,754,192
Legal reserves distribution (87,710)
Destination of tax incentives reserves (5,347)
Net income adjusted by dividends calculation 1,661,135
Proposed dividends (665,630)
Portion allocated to unrealized profit reserves (995,505)
Net income -
Minimum dividends - 25% adjusted net income 415,284 (i)
Additional dividends proposed 250,436 (ii)
Total dividends 665,630
(i) Current liabilities presentation
(ii) Presented on the shareholders' equity at the line "additional proposed dividend".

Braskem S.A. and Subsidiaries Notes to the Financial Statements at December 31, 2010 and 2009 Amounts in thousands of Brazilian reais, except when otherwise indicated
139
27 Earnings per Share (EPS)
As required by CPC 41 corresponding to IAS 33 - Earnings per Share, the tables below show a reconciliation of adjusted net income to the amounts used to calculate basic and diluted EPS.
Basic EPS is calculated by dividing net income attributable to the Company’s shareholders by the weighted average number of common shares outstanding, excluding treasury shares and respecting the distribution of prescribed dividends as described on the Company’s bylaws (estatuto social) according Note 26(b) and (g). Diluted EPS is calculated by dividing net income attributable to the Company’s shareholders by the weighted average number of common shares outstanding, excluding treasury shares and respecting the distribution of prescribed dividends as described on the Company’s bylaws (estatuto social) according Note 26(b) and (g).
28 Segment Information
Management defined Braskem’s operating segments based on the reports used to make operational and strategic decisions on December 31, 2010. These segments are as follows:
• Vinyls – includes activities related to the production of PVC, caustic soda and chlorine.
• Polyolefins – includes activities related to the production of polyethylene and polypropylene.
• Basic Petrochemicals – includes activities of basic petrochemicals and supply of electricity, steam and compressed air to second generation producers at the Camaçari and Triunfo industrial complexes. This segment is dependent on Petrobras for supply of raw material.
• Chemicals Distribution – includes activities related to the distribution of polyethylene, polypropylene and basic petrochemicals of subsidiaries Quantiq and Unipar Comercial, the latter acquired in May 2010, as mentioned in Note 1 (f.2) (v). This segment also includes the results of operations of Varient up to May 2010, when that subsidiary was spun off and merged into Alcacer, as mentioned in Note 1 (f.4).
• Quattor – includes the activities related to the production of basic petrochemicals in the São Paulo and Rio de Janeiro Complexes and the production of polyethylene and polypropylene of the Quattor Group. This segment started to be reported in May 2010 due to the acquisition of control of Quattor, see Note 1 (f.2) (iv).
Basic Diluted Basic Diluted
Net income for the period 1,895,309 1,895,309 398,491 398,491
Net income attributed to preferred shareholders class "B" 357 - 375 -
Net income attributed to other shareholders 1,894,952 1,895,309 398,116 398,491
Weighted average numbers of common and preferred shares class "A" 715,168,348 715,465,257 514,735,898 515,032,807
Earnings per share (in R$) 2.6497 2.6491 0.7734 0.7737
2010 2009

Braskem S.A. and Subsidiaries Notes to the Financial Statements at December 31, 2010 and 2009 Amounts in thousands of Brazilian reais, except when otherwise indicated
140
• PP Americas – includes the operations of Braskem PP Americas Inc, related to the production of polypropylene. This segment started to be reported on April 1, 2010 due to the acquisition of Sunoco, as disclosed in Note 1 (f.3). The Company reviews on a retrospective basis the segment information for the reported period and assesses and manages the segment performance based on the information generated from the accounting records kept in accordance with Brazilian accounting practices, CPCs and IFRS, and included in the consolidated financial statements. Eliminations shown in information per operating segment when compared with the consolidated balances disclosed in accordance with CPCs and IFRS, are represented by intersegment receivables and sales, which are made on an arm's-length basis. Reclassifications are represented mainly by revenues arising from the provision of services which are reported as “Other operating income (expenses), net”, by operating segment and as “Net sales revenue” in the consolidated financial statements. Management of the Company accounts for jointly-controlled companies using the proportionate consolidation method and the jointly-controlled companies’ information is reported in “Other Segments”. As of December 31, 2010, Braskem’s jointly-controlled companies are RPR, Propilsur and Polimerica. Investments in associated companies are accounted for under the equity method and, as these investees are not controlled by the Company, they are not allocated to segments. The amount of the investment and the equity in earnings (loss) of associated companies included in the Company’s income statement is reported in the Corporate Unit. In addition, operating segments are evaluated based on the results of operations which do not include financial income and expenses and current and deferred income tax and social contribution expenses.

Braskem S.A. and Subsidiaries Notes to the Financial Statements at December 31, 2010 and 2009 Amounts in thousands of Brazilian reais, except when otherwise indicated
141
a) Operating results by segment

Braskem S.A. and Subsidiaries Notes to the Financial Statements at December 31, 2010 and 2009 Amounts in thousands of Brazilian reais, except when otherwise indicated
142
Total Braskem Braskem
Basic Chemical Reporting Other Corporate Consoldiated Reclassifications adjusted to
Vinyls Polyolefins Petrochemicals Distribution Quattor PP Americas Segments segments Unit before adjust. Eliminations CPC's and IFRS
Net sales revenue 1,799,335 8,378,664 14,436,999 777,923 4,431,679 1,697,843 31,522,443 548,246 - 32,070,689 (6,575,872) 25,494,817
Cost of goods sold (1,605,930) (7,249,151) (12,623,401) (658,464) (3,591,458) (1,558,042) (27,286,446) (450,333) - (27,736,779) 6,325,004 (21,411,775)
Gross profit 193,405 1,129,513 1,813,598 119,459 840,221 139,801 4,235,997 97,913 - 4,333,910 (250,868) 4,083,042
Operating expenses
Selling, general and distribution expenses (140,981) (509,449) (417,292) (87,107) (298,531) (66,966) (1,520,326) (77,036) (91,531) (1,688,893) - (1,688,893)
Equity results of associateds - - - - - - - - 20,302 20,302 - 20,302
Gain on business combination - - - - - - - - 975,283 975,283 - 975,283
Other operating revenues (expenses) 33 1,127 (24,879) 2,737 (45,888) (20,430) (87,300) (258) (87,215) (174,773) - (174,773)
(140,948) (508,322) (442,171) (84,370) (344,419) (87,396) (1,607,626) (77,294) 816,839 (868,081) - (868,081)
Operating profit before financial result 52,457.0 621,191 1,371,427 35,089 495,802 52,405 2,628,371 20,619 816,839 3,465,829 (250,868) 3,214,961
December, 2009
Braskem Braskem
Basic Chemical Total Other Corporate Consoldiated Corporate Reclassifications adjusted to
Vinyls Polyolefins Petrochemicals Distribution Reporting
Segments
Segments Unit before adjust. Unit Eliminations CPC's and IFRS
Net sales revenue 1,613,377 7,412,389 11,325,387 567,163 20,918,316 551,839 - 21,470,155 (5,334,085) (5,334,085) 16,136,070
Cost of goods sold (1,580,557) (6,674,781) (9,861,077) (488,479) (18,604,894) (491,208) - (19,096,102) 5,566,406 5,566,406 (13,529,696)
Gross profit 32,820 737,608 1,464,310 78,684 2,313,422 60,631 2,374,053 232,321 232,321 2,606,374
Operating expenses
Selling, general and distribution expenses (153,813) (583,718) (379,221) (60,498) (1,177,250) (60,459) (10,183) (1,247,892) - - (1,247,892)
Equity results of associateds - - - - - - 3,188 3,188 - - 3,188
Gain on business combination - - - - - - 102,051 102,051 - - 102,051
Other operating revenues (expenses) 13,564 6,343 61,256 1,298 82,461 2,228 (144,103) (59,414) - - (59,414)
(140,249) (577,375) (317,965) (59,200) (1,094,789) (58,231) (49,047) (1,202,067) - - (1,202,067)
Operating profit before financial result (107,429) 160,233 1,146,345 19,484 1,218,633 2,400 (49,047) 1,171,986 232,321 232,321 1,404,307
December, 2010
Reporting segments
Reporting segments

b) Sales by geographic regions
29 Gross Sales Revenue
Net Sales
2010 2009
Headquarters - Brazil 16,648,760 12,711,161
United States 3,251,863 848,346
Argentina 1,243,790 544,621
Switzerland 999,932 347,811
Netherlands 413,148 200,891
Singapore 141,558 186,102
United Kingdom 376,652 165,925
Mexico 284,985 196,660
Colombia 304,466 108,149
Barbados 531,833 60,942
Uruguay 108,656 71,650
Chile 116,084 86,183
Spain 50,435 50,897
China 40,598 65,435
Paraguay 62,592 49,221
Portugal 45,923 46,828
Italy 42,425 38,652
Bolivia 44,625 38,482
Belgium - 11,920
Germany 655 4,885
Other 785,837 301,309 25,494,817 16,136,070
2010 2009 2010 2009
Gross sales revenue
Domestic market 16,580,094 13,773,870 22,700,555 15,277,311
Foreign market 4,591,367 4,132,712 8,846,057 4,427,658
21,171,461 17,906,582 31,546,612 19,704,969
Deductions from sales
Taxes (3,916,501) (3,194,275) (5,897,653) (3,452,762)Returned sales (102,171) (110,241) (154,142) (116,137)
(4,018,672) (3,304,516) (6,051,795) (3,568,899)
Sales revenue 17,152,789 14,602,066 25,494,817 16,136,070
Parent Company Consolidated
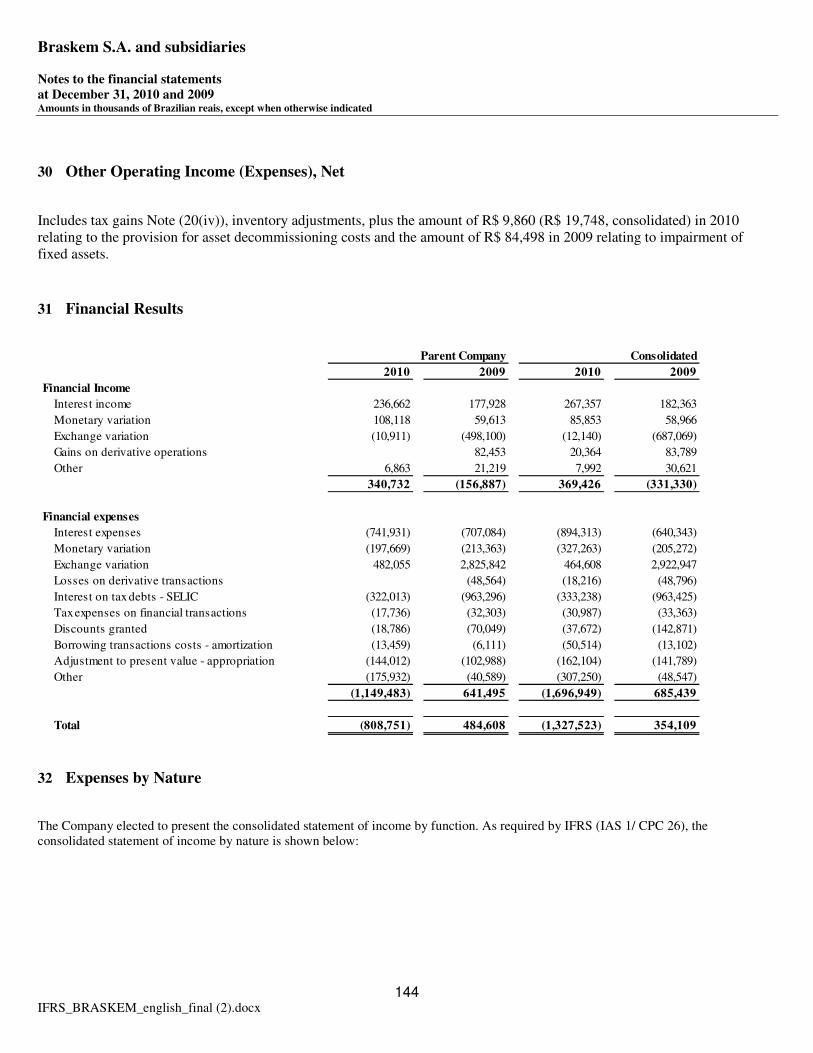
Braskem S.A. and subsidiaries Notes to the financial statements at December 31, 2010 and 2009 Amounts in thousands of Brazilian reais, except when otherwise indicated
144 IFRS_BRASKEM_english_final (2).docx
30 Other Operating Income (Expenses), Net
Includes tax gains Note (20(iv)), inventory adjustments, plus the amount of R$ 9,860 (R$ 19,748, consolidated) in 2010 relating to the provision for asset decommissioning costs and the amount of R$ 84,498 in 2009 relating to impairment of fixed assets.
31 Financial Results
32 Expenses by Nature
The Company elected to present the consolidated statement of income by function. As required by IFRS (IAS 1/ CPC 26), the consolidated statement of income by nature is shown below:
2010 2009 2010 2009
Financial Income
Interest income 236,662 177,928 267,357 182,363
Monetary variation 108,118 59,613 85,853 58,966
Exchange variation (10,911) (498,100) (12,140) (687,069)
Gains on derivative operations - 82,453 20,364 83,789
Other 6,863 21,219 7,992 30,621
340,732 (156,887) 369,426 (331,330)
Financial expenses
Interest expenses (741,931) (707,084) (894,313) (640,343)
Monetary variation (197,669) (213,363) (327,263) (205,272)
Exchange variation 482,055 2,825,842 464,608 2,922,947
Losses on derivative transactions - (48,564) (18,216) (48,796)
Interest on tax debts - SELIC (322,013) (963,296) (333,238) (963,425)
Tax expenses on financial transactions (17,736) (32,303) (30,987) (33,363)
Discounts granted (18,786) (70,049) (37,672) (142,871)
Borrowing transactions costs - amortization (13,459) (6,111) (50,514) (13,102)
Adjustment to present value - appropriation (144,012) (102,988) (162,104) (141,789)
Other (175,932) (40,589) (307,250) (48,547)
(1,149,483) 641,495 (1,696,949) 685,439
Total (808,751) 484,608 (1,327,523) 354,109
Parent Company Consolidated

Braskem S.A. and subsidiaries Notes to the financial statements at December 31, 2010 and 2009 Amounts in thousands of Brazilian reais, except when otherwise indicated
145 IFRS_BRASKEM_english_final (2).docx
33 Insurance Coverage
Braskem and its subsidiaries, pursuant to the policy approved by the Board of Directors, have an extensive risk management program. Specifically in the risk management area, the risk assessment practices and procedures have been extended to the units of Quattor, observing the principles adopted by Braskem. Also in 2010, an insurance program was established for the PP Americas operation, associated with the Company’s insurance and risk policy. The all-risk insurance policies of Braskem, which include the assets of Quattor and PP Americas, have maximum indemnity limits established based on the amounts of maximum possible loss, deemed as sufficient to cover eventual losses, in view of the nature of the Company’s activities and advice of its insurance consultants. Braskem’s insurance policy, which includes Quattor, is effective for 18 months, ending on October 8, 2011. For Riopol, the insurance policy is effective for 12 months starting on March 30, 2010, and at the end of this period, its assets could be included in Braskem’s insurance policy. Limits and volume of assets insured in all-risk insurance policy are as follows:
2010 2009 2010 2009
Classification by function:
Cost of sales (14,109,477) (12,203,495) (21,411,775) (13,529,696)
Selling (176,325) (250,831) (383,454) (298,847)
Distribution (299,890) (300,735) (335,510) (300,735)
General and administrative (723,118) (584,751) (969,929) (648,310)
Research and development (55,288) (60,898) (78,778) (63,119)
Total (15,364,098) (13,400,710) (23,179,446) (14,840,707)
Classification by nature:
Raw materials or feedstocks (11,730,839) (9,720,004) (18,059,704) (10,900,495)
Employees expenses (920,009) (901,342) (1,273,617) (1,007,702)
Rendered services (496,301) (479,137) (694,487) (534,351)
Tax expenses (31,386) (21,763) (60,222) (23,005)
Depreciation, depletion and exahustion (1,032,774) (1,028,186) (1,606,354) (1,038,061)
Despesas variáveis de vendas (303,885) (363,833) (449,459) (377,800)
Freights (653,544) (671,049) (786,353) (710,604)
Other expenses (195,360) (215,396) (249,250) (248,689)
Total (15,364,098) (13,400,710) (23,179,446) (14,840,707)
Parent Company Consolidated
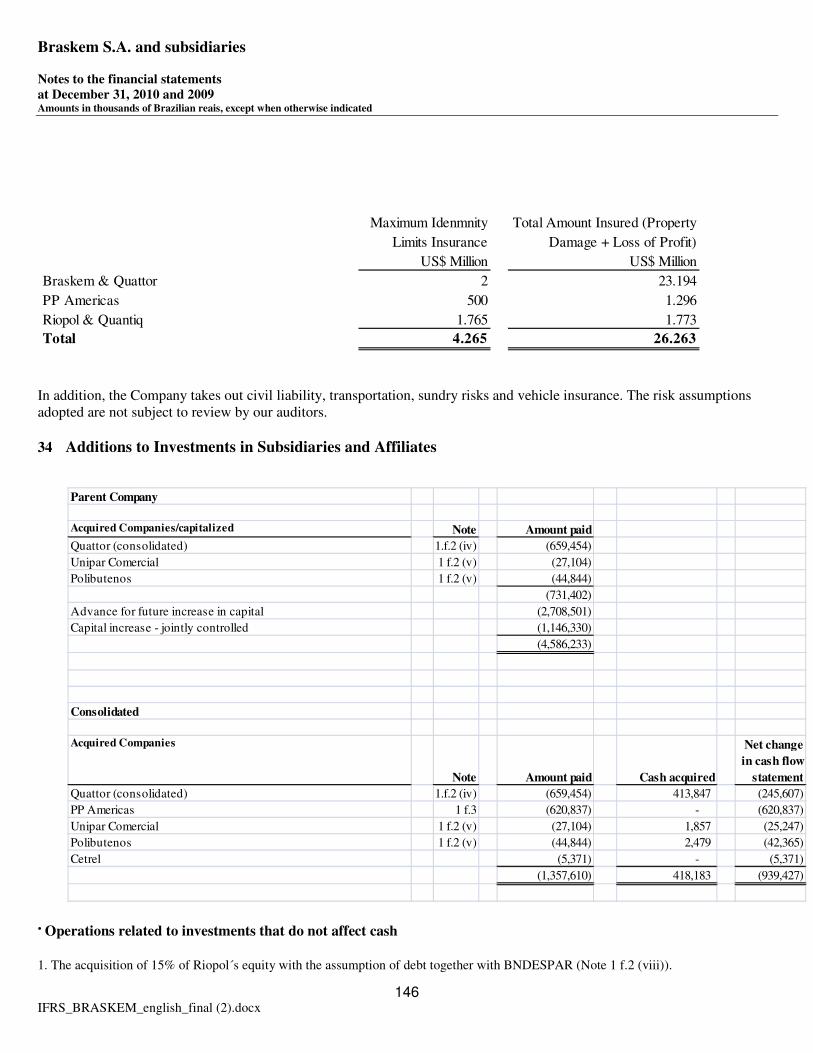
Braskem S.A. and subsidiaries Notes to the financial statements at December 31, 2010 and 2009 Amounts in thousands of Brazilian reais, except when otherwise indicated
146 IFRS_BRASKEM_english_final (2).docx
In addition, the Company takes out civil liability, transportation, sundry risks and vehicle insurance. The risk assumptions adopted are not subject to review by our auditors.
34 Additions to Investments in Subsidiaries and Affiliates
• Operations related to investments that do not affect cash
1. The acquisition of 15% of Riopol´s equity with the assumption of debt together with BNDESPAR (Note 1 f.2 (viii)).
Maximum Idenmnity
Limits Insurance
Total Amount Insured (Property
Damage + Loss of Profit)
US$ Million US$ Million
Braskem & Quattor 2 23.194
PP Americas 500 1.296
Riopol & Quantiq 1.765 1.773
Total 4.265 26.263
Parent Company
Acquired Companies/capitalized Note Amount paid
Quattor (consolidated) 1.f.2 (iv) (659,454)
Unipar Comercial 1 f.2 (v) (27,104)
Polibutenos 1 f.2 (v) (44,844)
(731,402)
Advance for future increase in capital (2,708,501)
Capital increase - jointly controlled (1,146,330)
(4,586,233)
Consolidated
Acquired Companies
Note Amount paid Cash acquired
Net change
in cash flow
statement
Quattor (consolidated) 1.f.2 (iv) (659,454) 413,847 (245,607)
PP Americas 1 f.3 (620,837) - (620,837)
Unipar Comercial 1 f.2 (v) (27,104) 1,857 (25,247)
Polibutenos 1 f.2 (v) (44,844) 2,479 (42,365)
Cetrel (5,371) - (5,371)
(1,357,610) 418,183 (939,427)
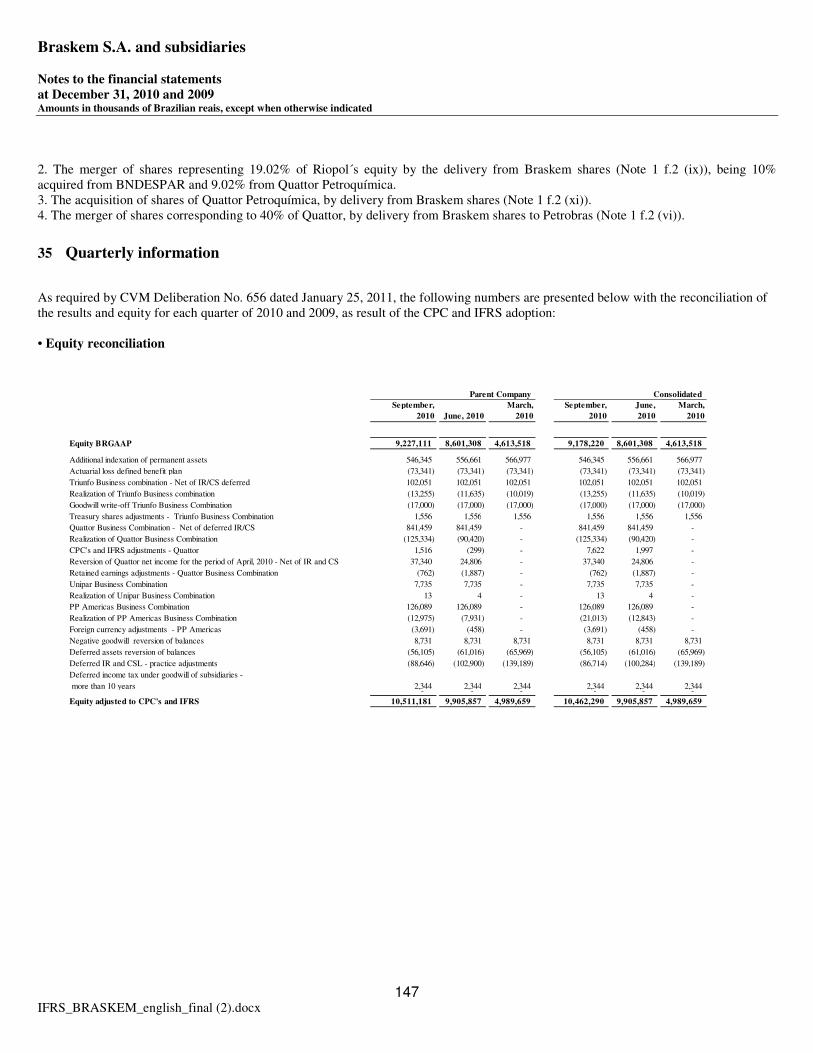
Braskem S.A. and subsidiaries Notes to the financial statements at December 31, 2010 and 2009 Amounts in thousands of Brazilian reais, except when otherwise indicated
147 IFRS_BRASKEM_english_final (2).docx
2. The merger of shares representing 19.02% of Riopol´s equity by the delivery from Braskem shares (Note 1 f.2 (ix)), being 10% acquired from BNDESPAR and 9.02% from Quattor Petroquímica. 3. The acquisition of shares of Quattor Petroquímica, by delivery from Braskem shares (Note 1 f.2 (xi)). 4. The merger of shares corresponding to 40% of Quattor, by delivery from Braskem shares to Petrobras (Note 1 f.2 (vi)).
35 Quarterly information
As required by CVM Deliberation No. 656 dated January 25, 2011, the following numbers are presented below with the reconciliation of the results and equity for each quarter of 2010 and 2009, as result of the CPC and IFRS adoption: • Equity reconciliation
September,
2010 June, 2010
March,
2010
September,
2010
June,
2010
March,
2010
Equity BRGAAP 9,227,111 8,601,308 4,613,518 9,178,220 8,601,308 4,613,518
Additional indexation of permanent assets 546,345 556,661 566,977 546,345 556,661 566,977
Actuarial loss defined benefit plan (73,341) (73,341) (73,341) (73,341) (73,341) (73,341)
Triunfo Business combination - Net of IR/CS deferred 102,051 102,051 102,051 102,051 102,051 102,051
Realization of Triunfo Business combination (13,255) (11,635) (10,019) (13,255) (11,635) (10,019)
Goodwill write-off Triunfo Business Combination (17,000) (17,000) (17,000) (17,000) (17,000) (17,000)
Treasury shares adjustments - Triunfo Business Combination 1,556 1,556 1,556 1,556 1,556 1,556
Quattor Business Combination - Net of deferred IR/CS 841,459 841,459 - 841,459 841,459 -
Realization of Quattor Business Combination (125,334) (90,420) - (125,334) (90,420) -
CPC's and IFRS adjustments - Quattor 1,516 (299) - 7,622 1,997 -
Reversion of Quattor net income for the period of April, 2010 - Net of IR and CS 37,340 24,806 - 37,340 24,806 -
Retained earnings adjustments - Quattor Business Combination (762) (1,887) - (762) (1,887) -
Unipar Business Combination 7,735 7,735 - 7,735 7,735 -
Realization of Unipar Business Combination 13 4 - 13 4 -
PP Americas Business Combination 126,089 126,089 - 126,089 126,089 -
Realization of PP Americas Business Combination (12,975) (7,931) - (21,013) (12,843) -
Foreign currency adjustments - PP Americas (3,691) (458) - (3,691) (458) -
Negative goodwill reversion of balances 8,731 8,731 8,731 8,731 8,731 8,731
Deferred assets reversion of balances (56,105) (61,016) (65,969) (56,105) (61,016) (65,969)
Deferred IR and CSL - practice adjustments (88,646) (102,900) (139,189) (86,714) (100,284) (139,189)
Deferred income tax under goodwill of subsidiaries -
more than 10 years 2,344 2,344 2,344 2,344 2,344 2,344 - - - - - -
Equity adjusted to CPC's and IFRS 10,511,181 9,905,857 4,989,659 10,462,290 9,905,857 4,989,659
Parent Company Consolidated

Braskem S.A. and subsidiaries Notes to the financial statements at December 31, 2010 and 2009 Amounts in thousands of Brazilian reais, except when otherwise indicated
148 IFRS_BRASKEM_english_final (2).docx
• Net income reconciliation
September,
2010 June, 2010
March,
2010
September,
2010
June,
2010
March,
2010
Equity BRGAAP 5,625,817 4,998,059 3,682,690 5,625,817 4,998,059 3,682,690
Additional indexation of permanent assets 587,611 597,928 608,245 587,611 597,928 608,245
Property, plant and equipment useful live review (130,821) (87,034) (43,198) (130,821) (87,034) (43,198)
Actuarial loss defined benefit plan (80,828) (80,828) (80,828) (80,828) (80,828) (80,828)
Goodwill write-off Triunfo Business Combination 116,180 116,180 - 116,180 116,180 -
Realization of Triunfo Business Combination (6,783) (5,165) - (6,783) (5,165) -
Goodwill write-off Triunfo Business Combination (17,000) (17,000) - (17,000) (17,000) -
Treasury shares adjustments - Triunfo Business Combination 1,556 1,556 - 1,556 1,556 -
Negative goodwill reversion of balances 17,155 18,304 19,452 17,155 18,304 19,452
Deferred assets reversion of balances (93,463) (97,522) (101,724) (93,463) (97,522) (101,724)
Reversion of capitalized expenses with research (10,231) (19,150) (24,153) (10,231) (19,150) (24,153)
Adjustments to proportional consolidation of RPR (4,345) (3,194) (9,032) (4,345) (3,194) (9,032)
Deferred IR and CS - practice adjustments (97,008) (96,749) (102,568) (97,008) (96,749) (102,568)
Deferred income tax under goodwill of subsidiaries -
more than 10 years not registered before 504,636 504,636 504,636 504,636 504,636 504,636 - - - - - -
Equity adjusted to CPC's and IFRS 6,412,476 5,830,021 4,453,520 6,412,476 5,830,021 4,453,520
Parent Company Consolidated
September,
2010
June,
2010
March,
2010
September,
2010
June,
2010
March,
2010
Net income under Brazilian GAAP 625,148 71,494 26,037 625,148 71,494 26,037
Additional indexation of permanent assets (30,950) (20,634) (10,317) - (20,634) (10,317)
Realization of Triunfo Business Combination (4,854) (3,238) (1,618) (4,854) (3,238) (1,618)
Quattor Business Combination - Net of deferred IR/CS 841,459 841,459 - 841,459 841,459 -
Realization of Quattor Business Combination (125,334) (90,420) - (125,334) (90,420) -
Reversion of Quattor net income for the period of April, 2010 37,340 24,806 - 37,340 24,806 -
CPC's and IFRS adjustments - Quattor 1,516 (299) - 7,622 1,997 -
Unipar Comercial - Business Combinations 7,735 7,735 - 7,735 7,735 -
Realization of Unipar Comercial - Business Combination 13 4 - 13 4 -
PP Americas Business Combinations 126,089 126,089 - 126,089 126,089 -
Realization of PP Americas Business Combination (12,975) (7,931) - (21,013) (12,843) -
Negative goodwill reversion of balances (383) (383) (383) - (383) (383)
Deferred assets reversion of balances 14,874 9,963 5,011 14,874 9,963 5,011
Adjustments to proportional consolidation of RPR 1,829 1,829 1,829 1,829 1,829 1,829
Deferred IR and CS under practice adjustments 52,898 38,645 2,353 54,830 41,261 2,353
Net income adjusted by CPC's and IFRS 1,534,405 999,119 22,912 1,565,738 999,119 22,912
Parent Company Consolidated
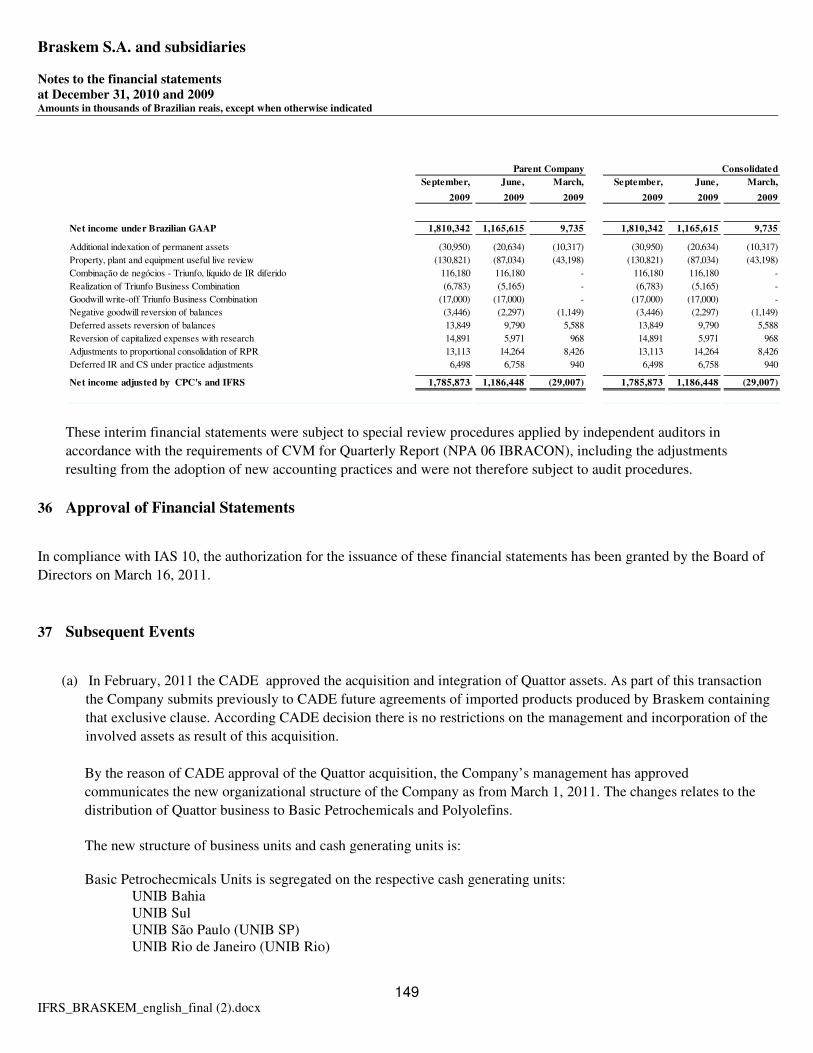
Braskem S.A. and subsidiaries Notes to the financial statements at December 31, 2010 and 2009 Amounts in thousands of Brazilian reais, except when otherwise indicated
149 IFRS_BRASKEM_english_final (2).docx
These interim financial statements were subject to special review procedures applied by independent auditors in
accordance with the requirements of CVM for Quarterly Report (NPA 06 IBRACON), including the adjustments
resulting from the adoption of new accounting practices and were not therefore subject to audit procedures.
36 Approval of Financial Statements
In compliance with IAS 10, the authorization for the issuance of these financial statements has been granted by the Board of
Directors on March 16, 2011.
37 Subsequent Events
(a) In February, 2011 the CADE approved the acquisition and integration of Quattor assets. As part of this transaction
the Company submits previously to CADE future agreements of imported products produced by Braskem containing
that exclusive clause. According CADE decision there is no restrictions on the management and incorporation of the
involved assets as result of this acquisition.
By the reason of CADE approval of the Quattor acquisition, the Company’s management has approved
communicates the new organizational structure of the Company as from March 1, 2011. The changes relates to the
distribution of Quattor business to Basic Petrochemicals and Polyolefins.
The new structure of business units and cash generating units is:
Basic Petrochecmicals Units is segregated on the respective cash generating units:
UNIB Bahia UNIB Sul UNIB São Paulo (UNIB SP) UNIB Rio de Janeiro (UNIB Rio)
September,
2009
June,
2009
March,
2009
September,
2009
June,
2009
March,
2009
Net income under Brazilian GAAP 1,810,342 1,165,615 9,735 1,810,342 1,165,615 9,735
Additional indexation of permanent assets (30,950) (20,634) (10,317) (30,950) (20,634) (10,317)
Property, plant and equipment useful live review (130,821) (87,034) (43,198) (130,821) (87,034) (43,198)
Combinação de negócios - Triunfo, líquido de IR diferido 116,180 116,180 - 116,180 116,180 -
Realization of Triunfo Business Combination (6,783) (5,165) - (6,783) (5,165) -
Goodwill write-off Triunfo Business Combination (17,000) (17,000) - (17,000) (17,000) -
Negative goodwill reversion of balances (3,446) (2,297) (1,149) (3,446) (2,297) (1,149)
Deferred assets reversion of balances 13,849 9,790 5,588 13,849 9,790 5,588
Reversion of capitalized expenses with research 14,891 5,971 968 14,891 5,971 968
Adjustments to proportional consolidation of RPR 13,113 14,264 8,426 13,113 14,264 8,426
Deferred IR and CS under practice adjustments 6,498 6,758 940 6,498 6,758 940
Net income adjusted by CPC's and IFRS 1,785,873 1,186,448 (29,007) 1,785,873 1,186,448 (29,007)
Parent Company Consolidated
Braskem S.A. and subsidiaries Notes to the financial statements at December 31, 2010 and 2009 Amounts in thousands of Brazilian reais, except when otherwise indicated
150 IFRS_BRASKEM_english_final (2).docx
Polyolefins Business Unit consists of the respective cash generating units: Polyethylene, including Quattor plants Polypropylene, including Quattor plants
Vinyls Business Unit
International Business Unit, until now consists of the cash generating unit: PP Americas
(b) As already reported on February 4, 2011 there was an interruption on the supply of electricity on north and northwest of Brazil, that affected the plants of the Company located in the Camaçari Petrochemical Complex, located in Bahia and Alagoas. This interruption in the electricity supply lasted for nine days and the production resumed on February 12, 2011. The impacts on the results of the Company are being analyzed.