Embed Size (px)
Citation preview
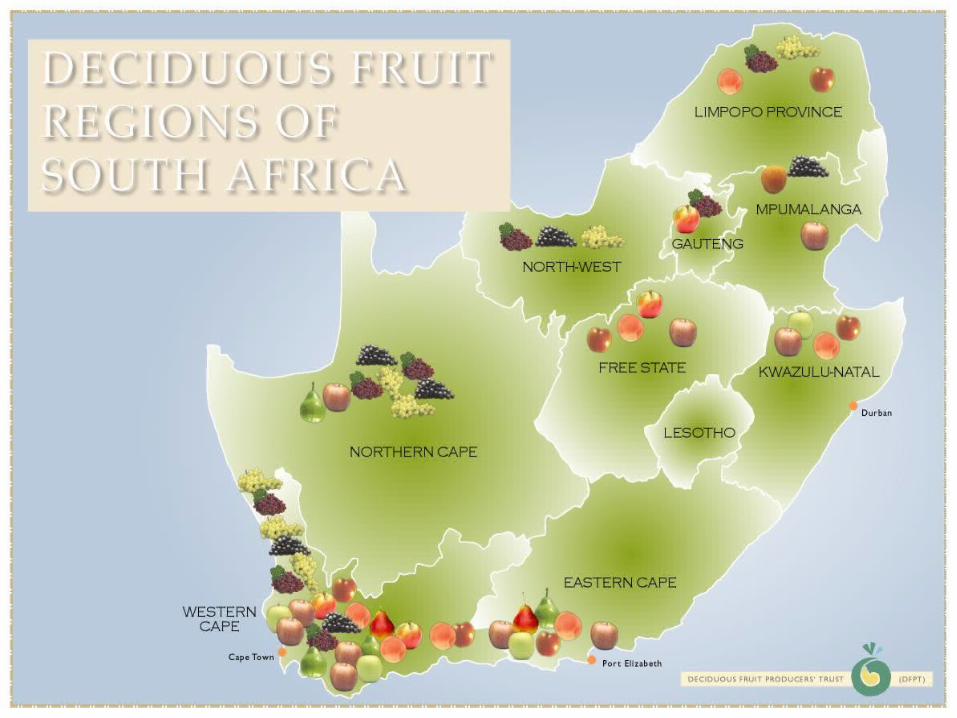
SA Pome Fruit OverviewSA Pome Fruit Overview2006/20072006/2007
Stefan ConradieStefan ConradieProduct Manager: SA Pome & Stone FruitProduct Manager: SA Pome & Stone Fruit
August 2007August 2007
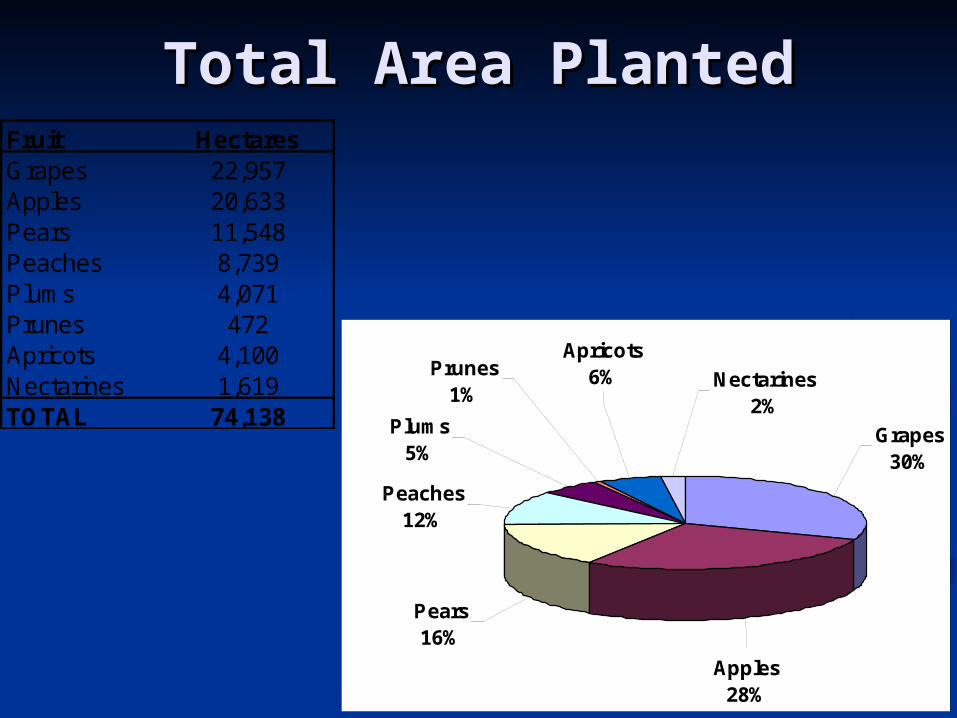
Total Area PlantedTotal Area Planted
Peaches12%
Grapes30%
Apples28%
Pears16%
Apricots6%Prunes
1%
Plums5%
Nectarines2%
Fruit HectaresGrapes 22,957Apples 20,633Pears 11,548Peaches 8,739Plums 4,071Prunes 472Apricots 4,100Nectarines 1,619TOTAL 74,138
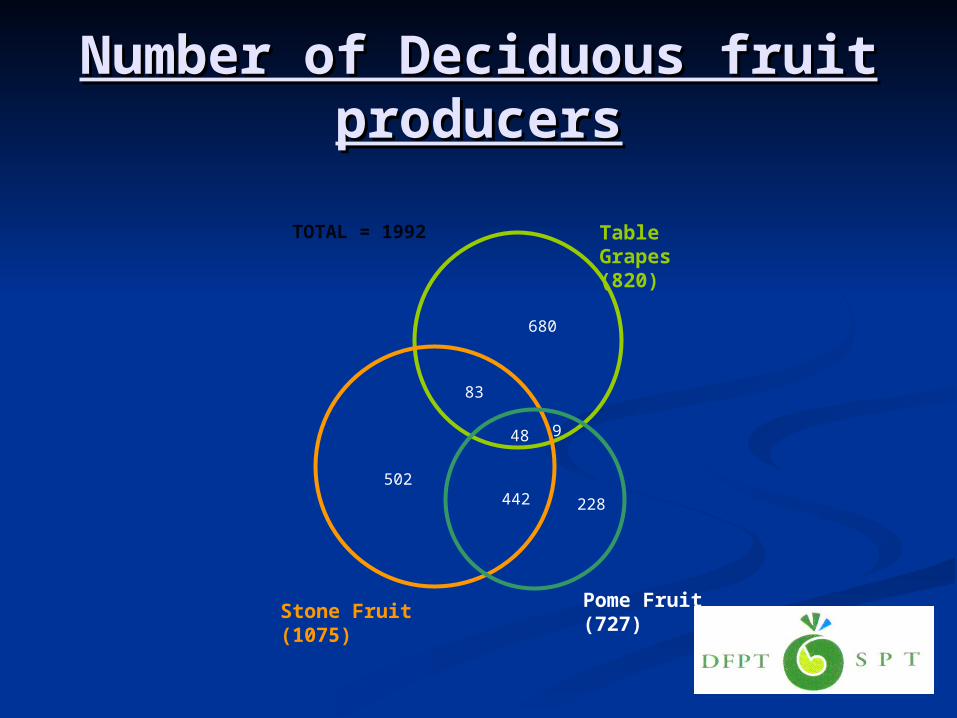
Number of Deciduous fruit Number of Deciduous fruit producersproducers
680
83
228442502
Table Grapes (820)
Stone Fruit (1075)
48 9
TOTAL = 1992
Pome Fruit (727)
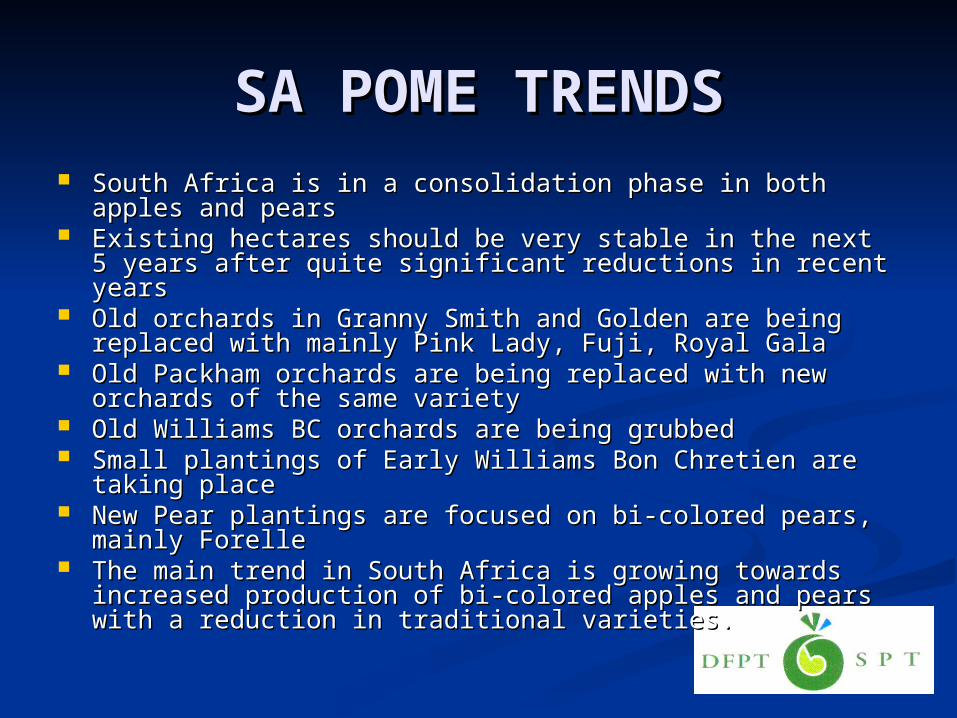
SA POME TRENDSSA POME TRENDS South Africa is in a consolidation phase in both apples and pearsSouth Africa is in a consolidation phase in both apples and pears Existing hectares should be very stable in the next 5 years after Existing hectares should be very stable in the next 5 years after
quite significant reductions in recent yearsquite significant reductions in recent years Old orchards in Granny Smith and Golden are being replaced with Old orchards in Granny Smith and Golden are being replaced with
mainly Pink Lady, Fuji, Royal Galamainly Pink Lady, Fuji, Royal Gala Old Packham orchards are being replaced with new orchards of the Old Packham orchards are being replaced with new orchards of the
same varietysame variety Old Williams BC orchards are being grubbed Old Williams BC orchards are being grubbed Small plantings of Early Williams Bon Chretien are taking placeSmall plantings of Early Williams Bon Chretien are taking place New Pear plantings are focused on bi-colored pears, mainly ForelleNew Pear plantings are focused on bi-colored pears, mainly Forelle The main trend in South Africa is growing towards increased The main trend in South Africa is growing towards increased
production of bi-colored apples and pears with a reduction in production of bi-colored apples and pears with a reduction in traditional varieties.traditional varieties.
APPLESAPPLES
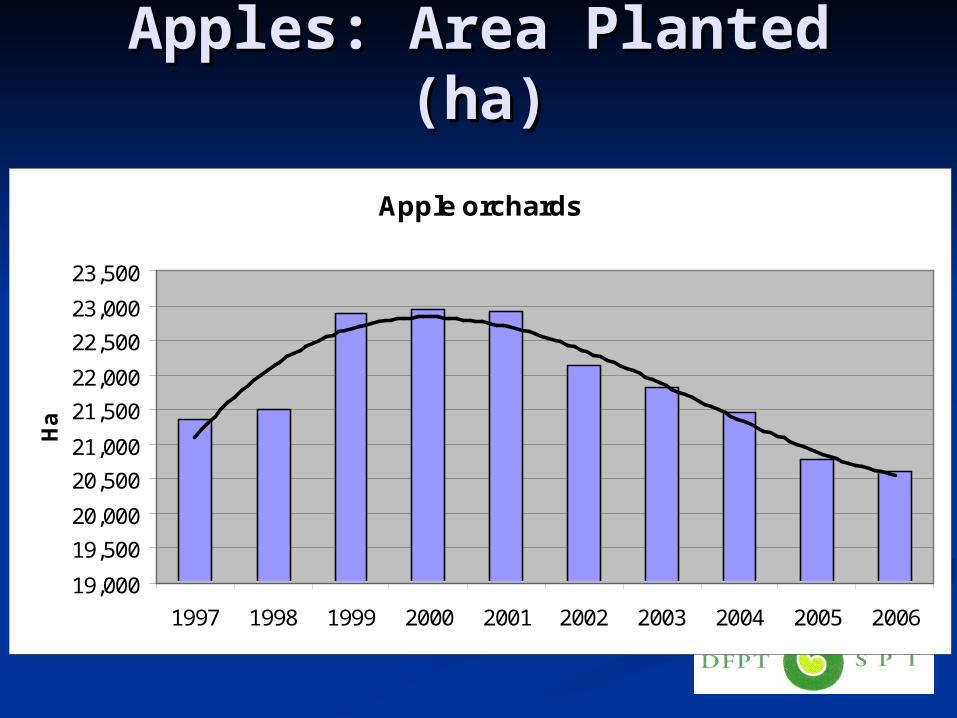
Apples: Area Planted (ha)Apples: Area Planted (ha)
Apple orchards
19,000
19,500
20,000
20,500
21,000
21,500
22,000
22,500
23,000
23,500
1997 1998 1999 2000 2001 2002 2003 2004 2005 2006
Ha
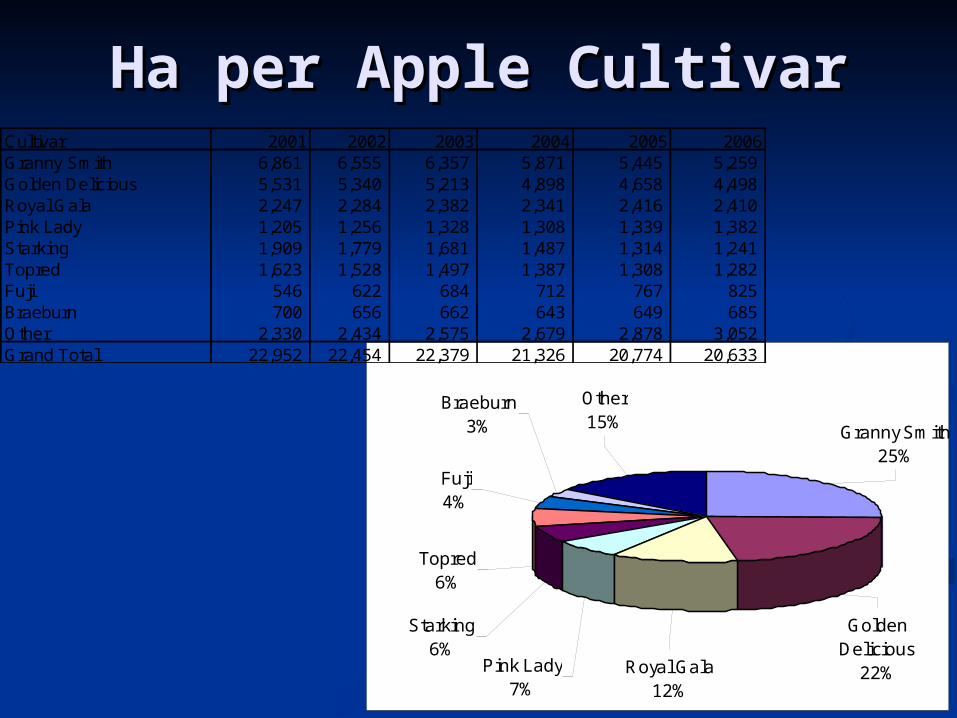
Ha per Apple CultivarHa per Apple Cultivar
Other15%
Granny Smith25%
Golden Delicious
22%Royal Gala12%
Pink Lady7%
Starking6%
Topred6%
Fuji4%
Braeburn3%
Cultivar 2001 2002 2003 2004 2005 2006Granny Smith 6,861 6,555 6,357 5,871 5,445 5,259 Golden Delicious 5,531 5,340 5,213 4,898 4,658 4,498 Royal Gala 2,247 2,284 2,382 2,341 2,416 2,410 Pink Lady 1,205 1,256 1,328 1,308 1,339 1,382 Starking 1,909 1,779 1,681 1,487 1,314 1,241 Topred 1,623 1,528 1,497 1,387 1,308 1,282 Fuji 546 622 684 712 767 825 Braeburn 700 656 662 643 649 685 Other 2,330 2,434 2,575 2,679 2,878 3,052 Grand Total 22,952 22,454 22,379 21,326 20,774 20,633
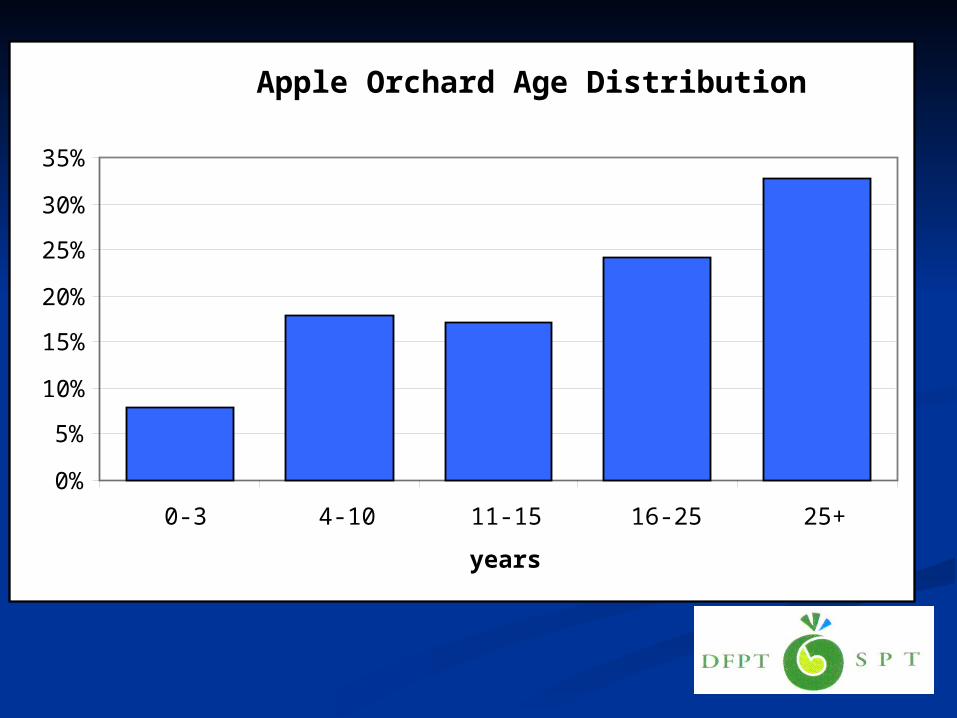
Apple Orchard Age Distribution
0%
5%
10%
15%
20%
25%
30%
35%
0-3 4-10 11-15 16-25 25+
years
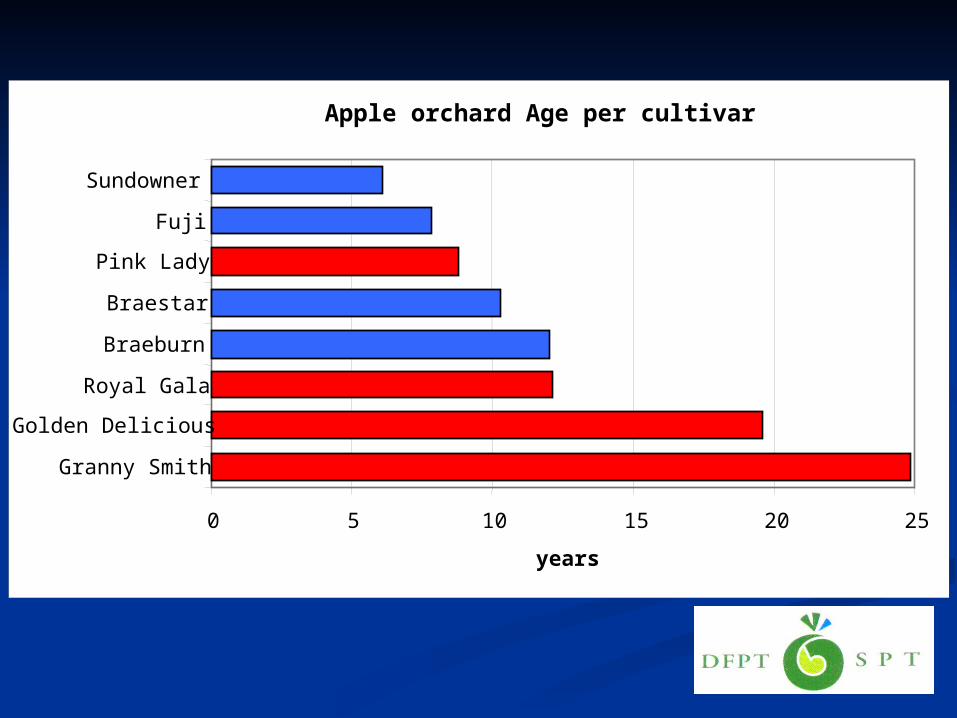
Apple orchard Age per cultivar
0 5 10 15 20 25
Granny Smith
Golden Delicious
Royal Gala
Braeburn
Braestar
Pink Lady
Fuji
Sundowner
years
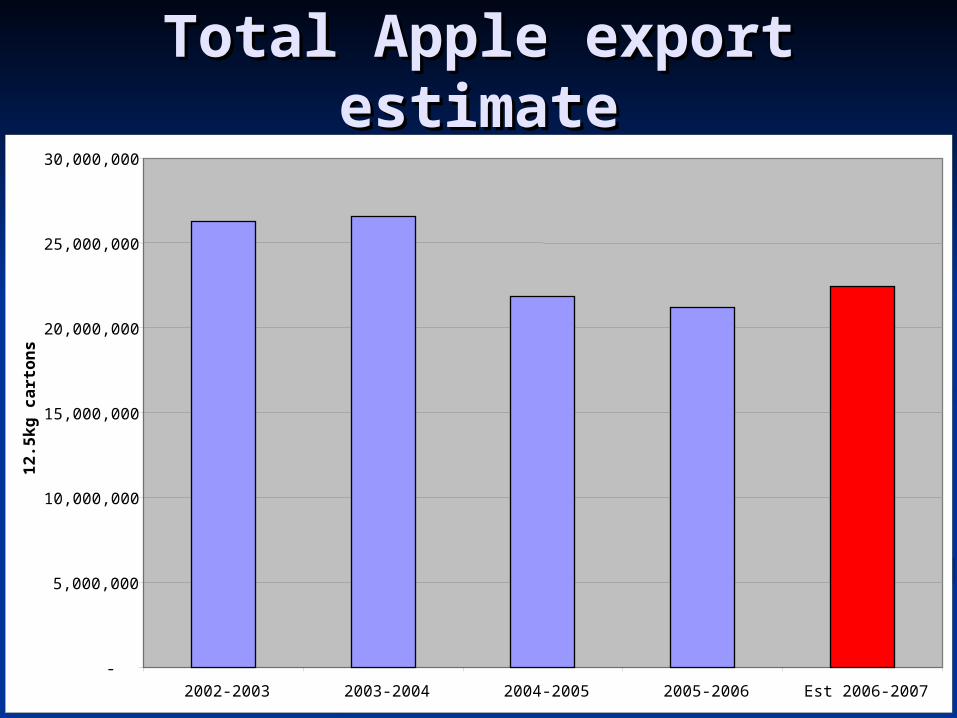
Total Apple export Total Apple export estimateestimate
-
5,000,000
10,000,000
15,000,000
20,000,000
25,000,000
30,000,000
2002-2003 2003-2004 2004-2005 2005-2006 Est 2006-2007
12
.5k
g c
art
on
s
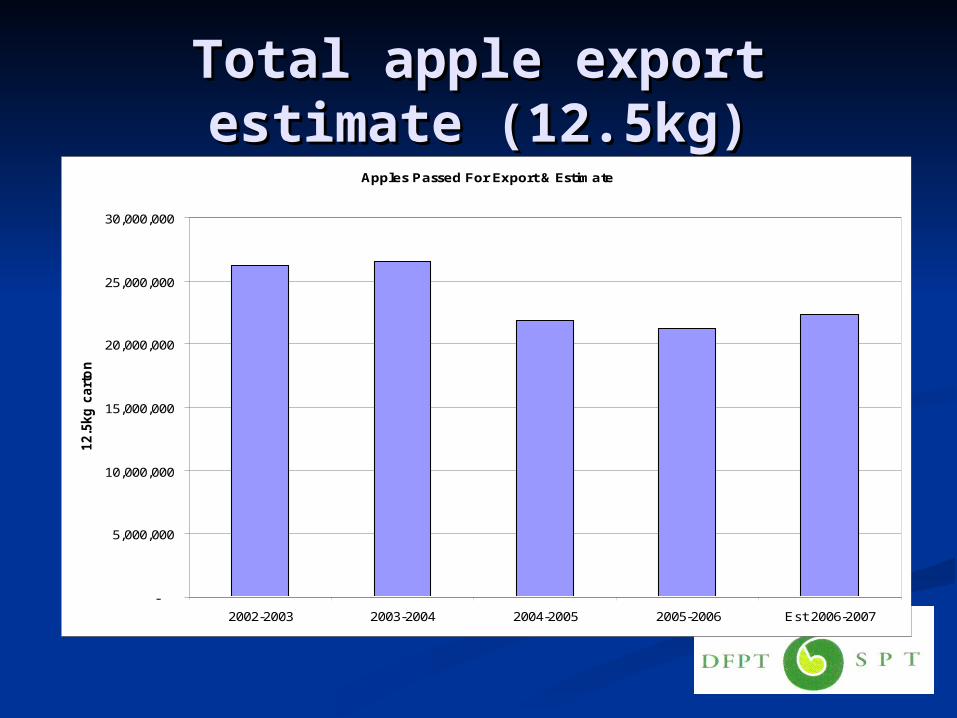
Total apple export estimate Total apple export estimate (12.5kg)(12.5kg)Apples Passed For Export & Estimate
-
5,000,000
10,000,000
15,000,000
20,000,000
25,000,000
30,000,000
2002-2003 2003-2004 2004-2005 2005-2006 Est 2006-2007
12.5
kg
cart
on
s
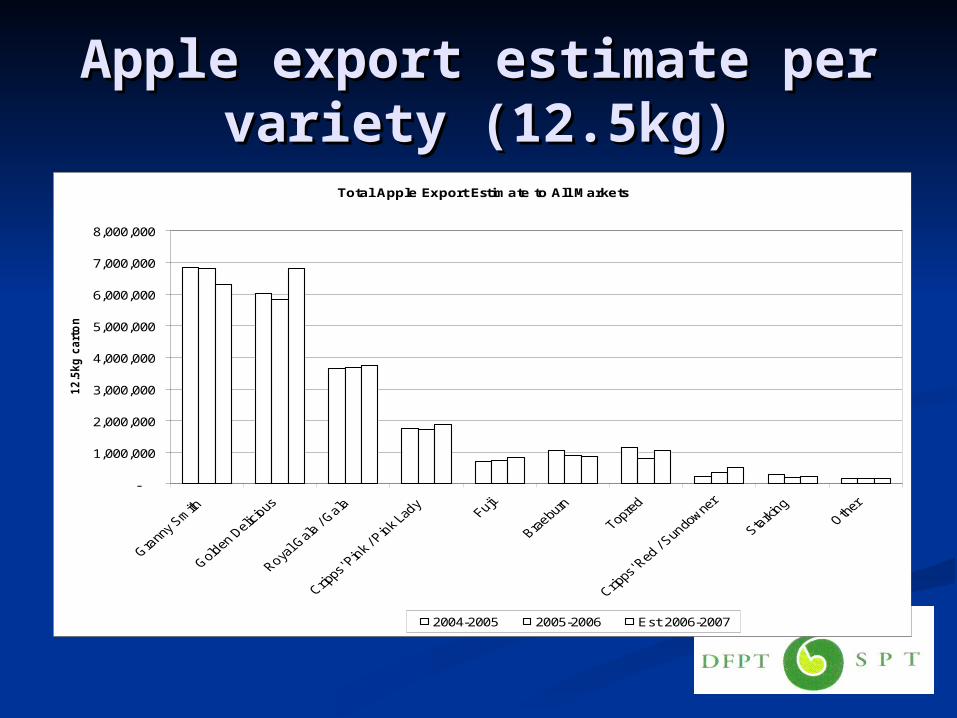
Apple export estimate per Apple export estimate per variety (12.5kg)variety (12.5kg)
Total Apple Export Estimate to All Markets
-
1,000,000
2,000,000
3,000,000
4,000,000
5,000,000
6,000,000
7,000,000
8,000,000
12.5
kg
cart
on
s
2004-2005 2005-2006 Est 2006-2007
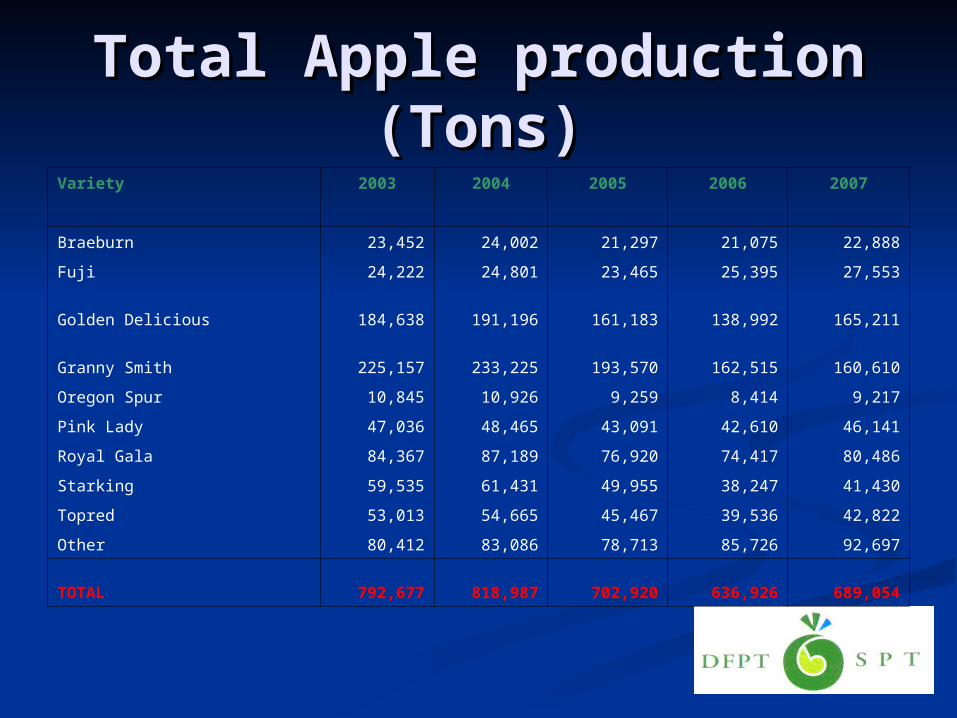
Total Apple production Total Apple production (Tons)(Tons)
Variety 2003 2004 2005 2006 2007
Braeburn 23,452 24,002 21,297 21,075 22,888
Fuji 24,222 24,801 23,465 25,395 27,553
Golden Delicious 184,638 191,196 161,183 138,992 165,211
Granny Smith 225,157 233,225 193,570 162,515 160,610
Oregon Spur 10,845 10,926 9,259 8,414 9,217
Pink Lady 47,036 48,465 43,091 42,610 46,141
Royal Gala 84,367 87,189 76,920 74,417 80,486
Starking 59,535 61,431 49,955 38,247 41,430
Topred 53,013 54,665 45,467 39,536 42,822
Other 80,412 83,086 78,713 85,726 92,697
TOTAL 792,677 818,987 702,920 636,926 689,054
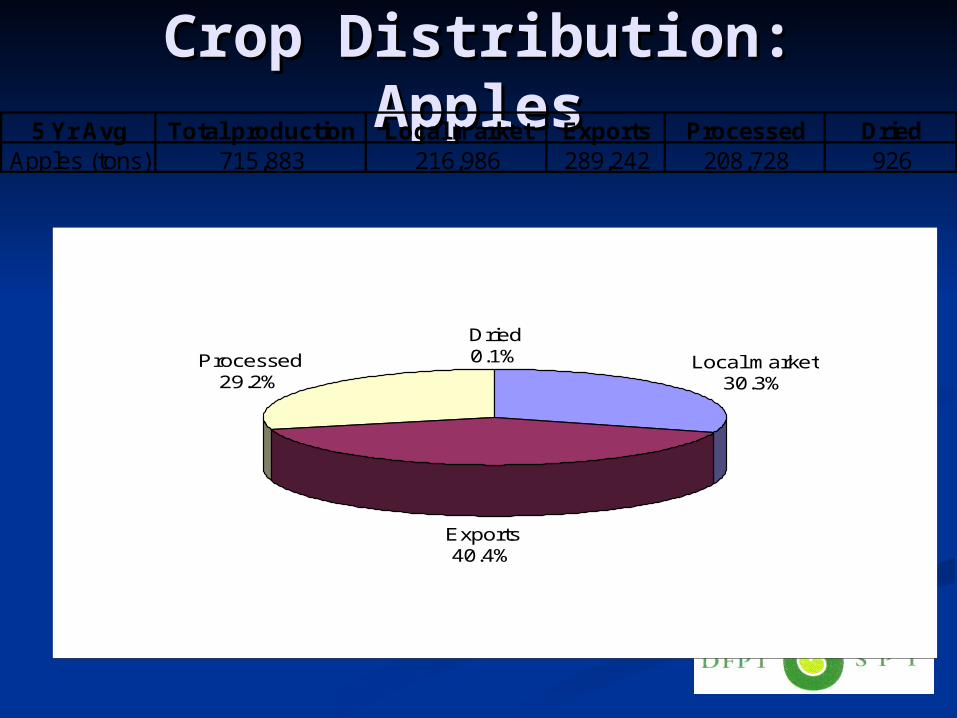
Crop Distribution: ApplesCrop Distribution: Apples
Local market30.3%
Exports40.4%
Processed29.2%
Dried0.1%
5 Yr Avg Total production Local market Exports Processed DriedApples (tons) 715,883 216,986 289,242 208,728 926
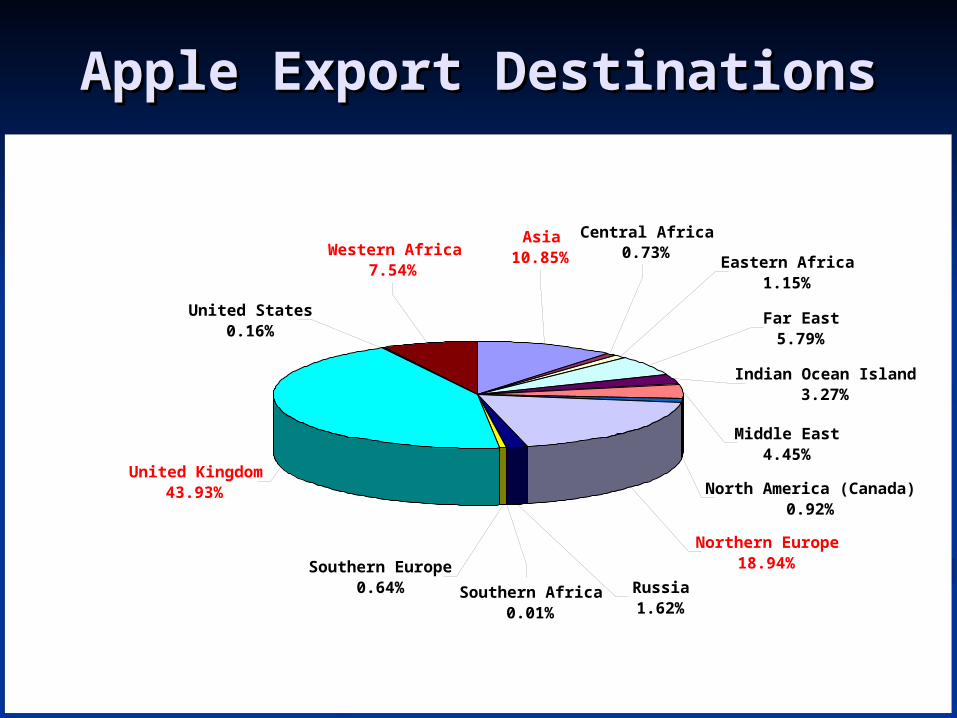
Apple Export DestinationsApple Export Destinations
Eastern Africa1.15%
Central Africa0.73%
Far East5.79%
Indian Ocean Island3.27%
Middle East4.45%
United Kingdom43.93%
United States0.16%
Western Africa7.54%
Asia10.85%
Russia1.62%
Southern Africa0.01%
Southern Europe0.64%
North America (Canada)0.92%
Northern Europe18.94%

PEARSPEARS
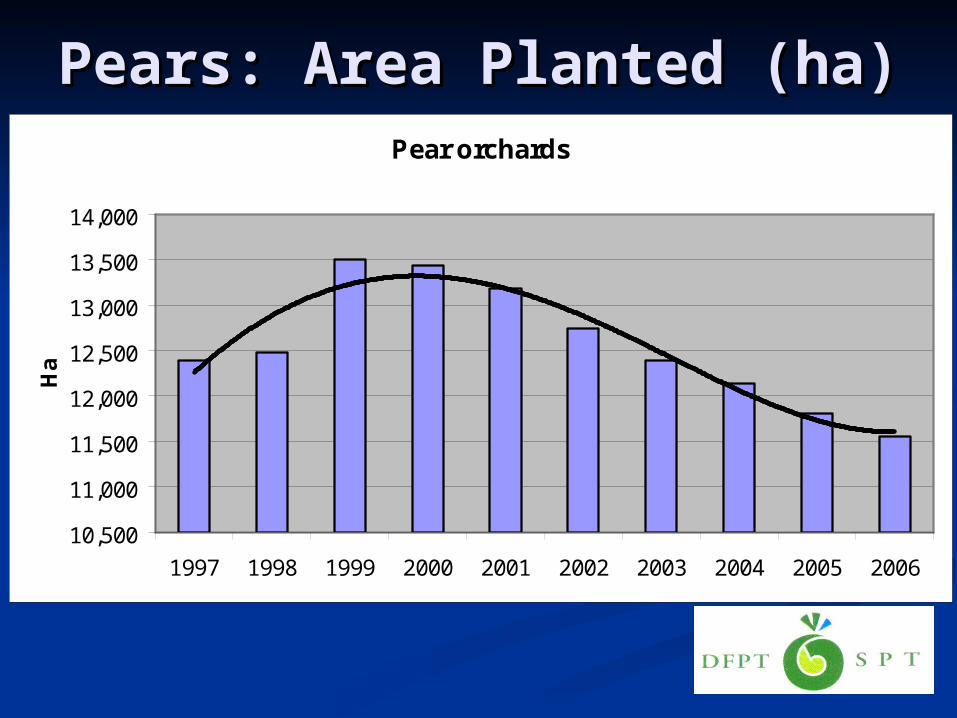
Pears: Area Planted (ha)Pears: Area Planted (ha)
Pear orchards
10,500
11,000
11,500
12,000
12,500
13,000
13,500
14,000
1997 1998 1999 2000 2001 2002 2003 2004 2005 2006
Ha
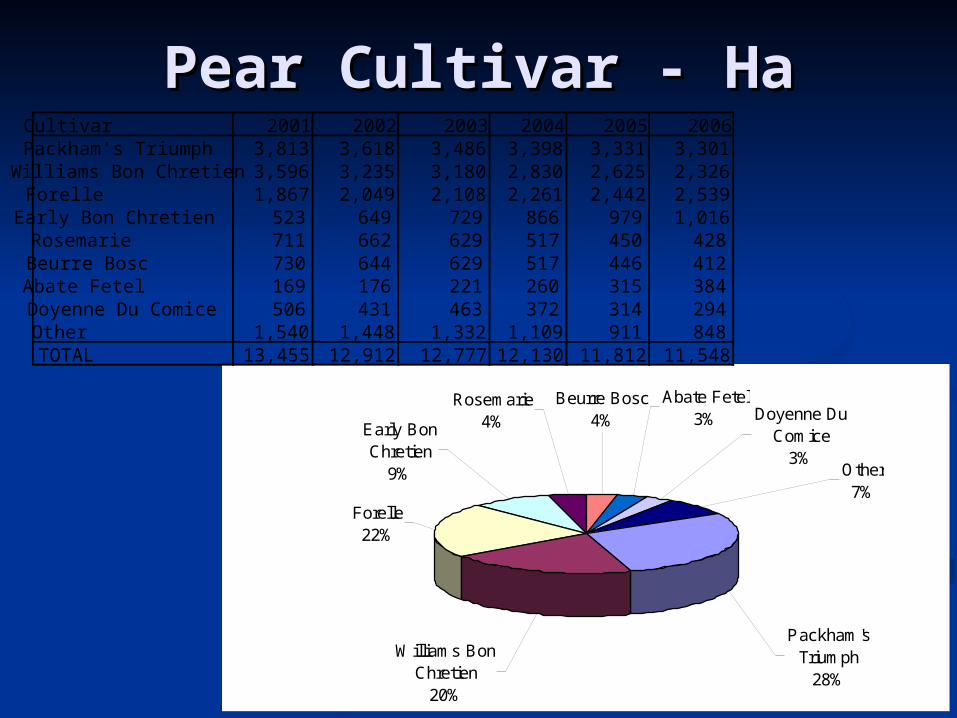
Pear Cultivar - HaPear Cultivar - Ha
Packham's Triumph
28%
Williams Bon Chretien
20%
Forelle22%
Rosemarie4%Early Bon
Chretien9%
Beurre Bosc4%
Abate Fetel3% Doyenne Du
Comice3%
Other7%
Cultivar 2001 2002 2003 2004 2005 2006Packham's Triumph 3,813 3,618 3,486 3,398 3,331 3,301 Williams Bon Chretien 3,596 3,235 3,180 2,830 2,625 2,326 Forelle 1,867 2,049 2,108 2,261 2,442 2,539 Early Bon Chretien 523 649 729 866 979 1,016 Rosemarie 711 662 629 517 450 428 Beurre Bosc 730 644 629 517 446 412 Abate Fetel 169 176 221 260 315 384 Doyenne Du Comice 506 431 463 372 314 294 Other 1,540 1,448 1,332 1,109 911 848 TOTAL 13,455 12,912 12,777 12,130 11,812 11,548
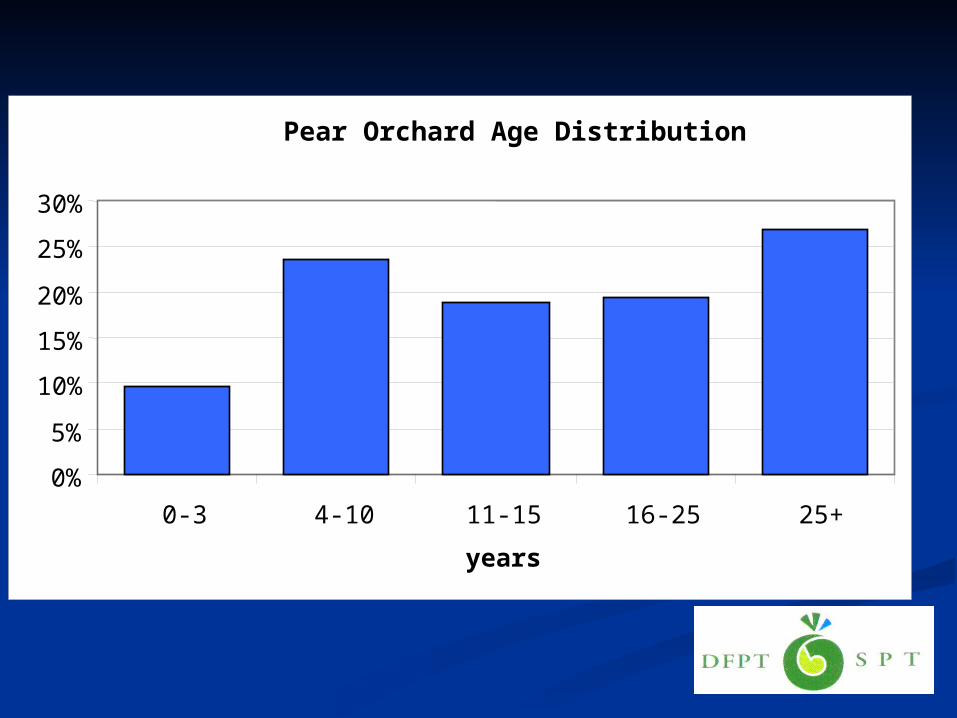
Pear Orchard Age Distribution
0%
5%
10%
15%
20%
25%
30%
0-3 4-10 11-15 16-25 25+
years
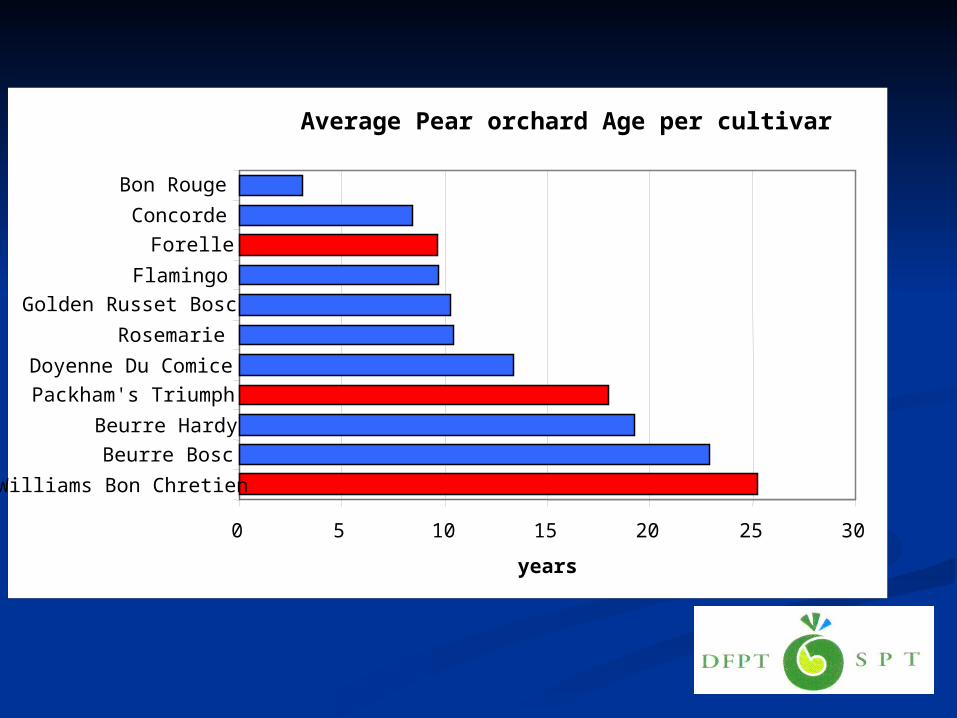
Average Pear orchard Age per cultivar
0 5 10 15 20 25 30
Williams Bon Chretien
Beurre Bosc
Beurre Hardy
Packham's Triumph
Doyenne Du Comice
Rosemarie
Golden Russet Bosc
Flamingo
Forelle
Concorde
Bon Rouge
years
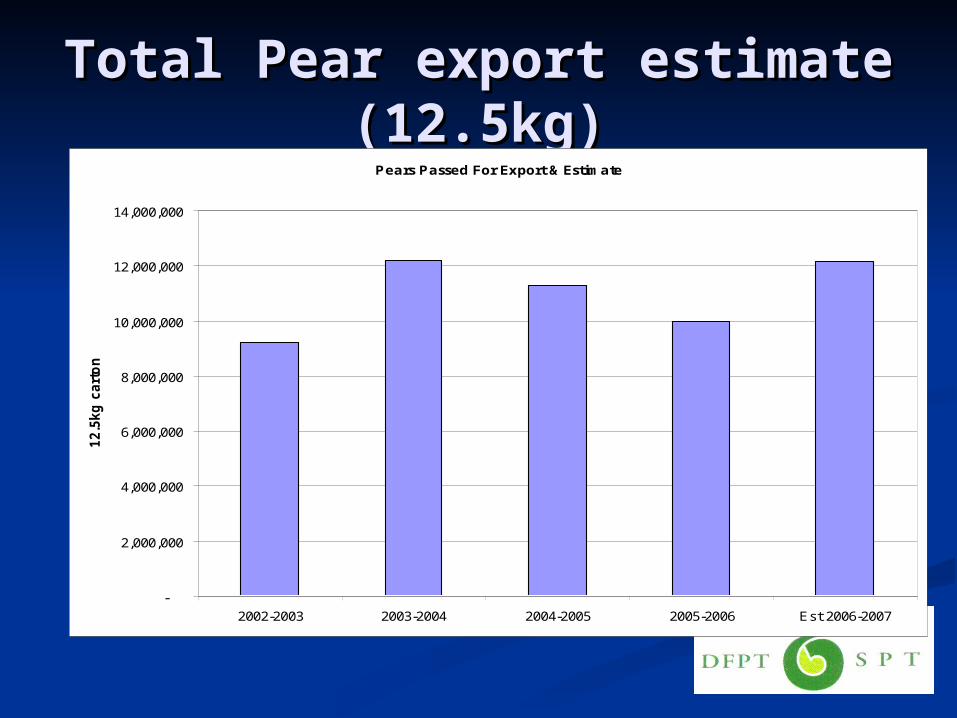
Total Pear export estimate Total Pear export estimate (12.5kg)(12.5kg)
Pears Passed For Export & Estimate
-
2,000,000
4,000,000
6,000,000
8,000,000
10,000,000
12,000,000
14,000,000
2002-2003 2003-2004 2004-2005 2005-2006 Est 2006-2007
12.5
kg
cart
on
s
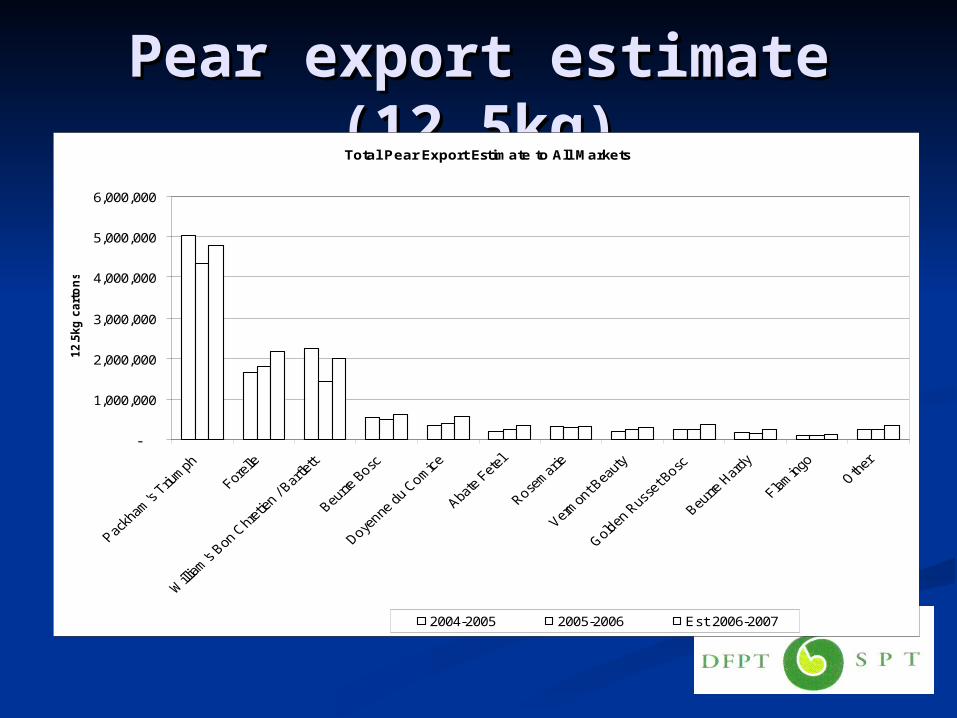
Pear export estimate Pear export estimate (12.5kg)(12.5kg)Total Pear Export Estimate to All Markets
-
1,000,000
2,000,000
3,000,000
4,000,000
5,000,000
6,000,000
12.5
kg
cart
on
s
2004-2005 2005-2006 Est 2006-2007
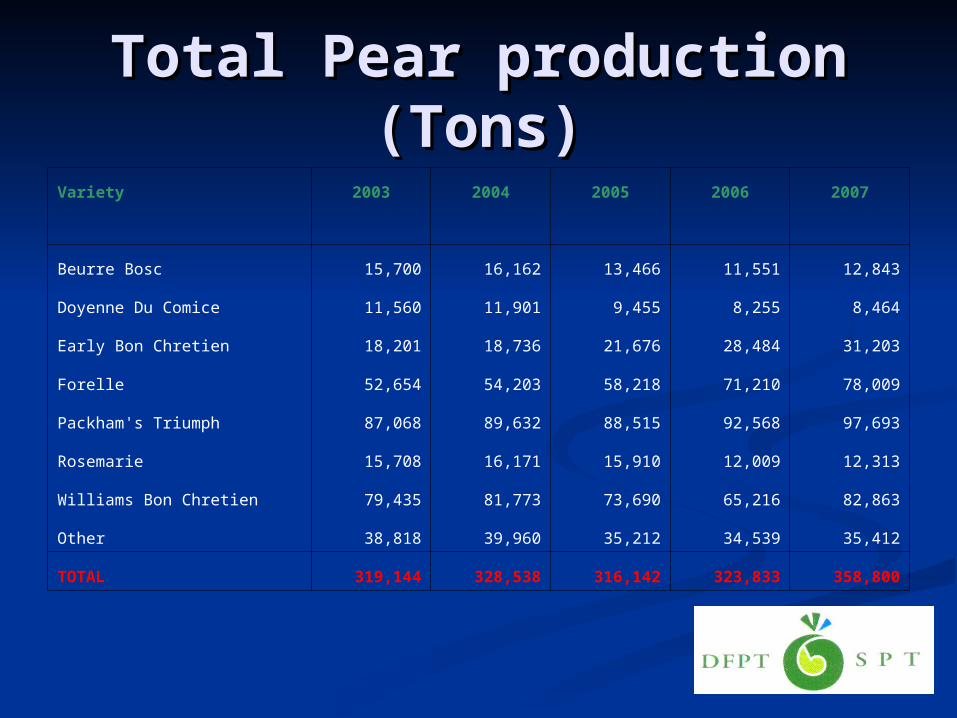
Total Pear production Total Pear production (Tons)(Tons)
Variety 2003 2004 2005 2006 2007
Beurre Bosc 15,700 16,162 13,466 11,551 12,843
Doyenne Du Comice 11,560 11,901 9,455 8,255 8,464
Early Bon Chretien 18,201 18,736 21,676 28,484 31,203
Forelle 52,654 54,203 58,218 71,210 78,009
Packham's Triumph 87,068 89,632 88,515 92,568 97,693
Rosemarie 15,708 16,171 15,910 12,009 12,313
Williams Bon Chretien 79,435 81,773 73,690 65,216 82,863
Other 38,818 39,960 35,212 34,539 35,412
TOTAL 319,144 328,538 316,142 323,833 358,800
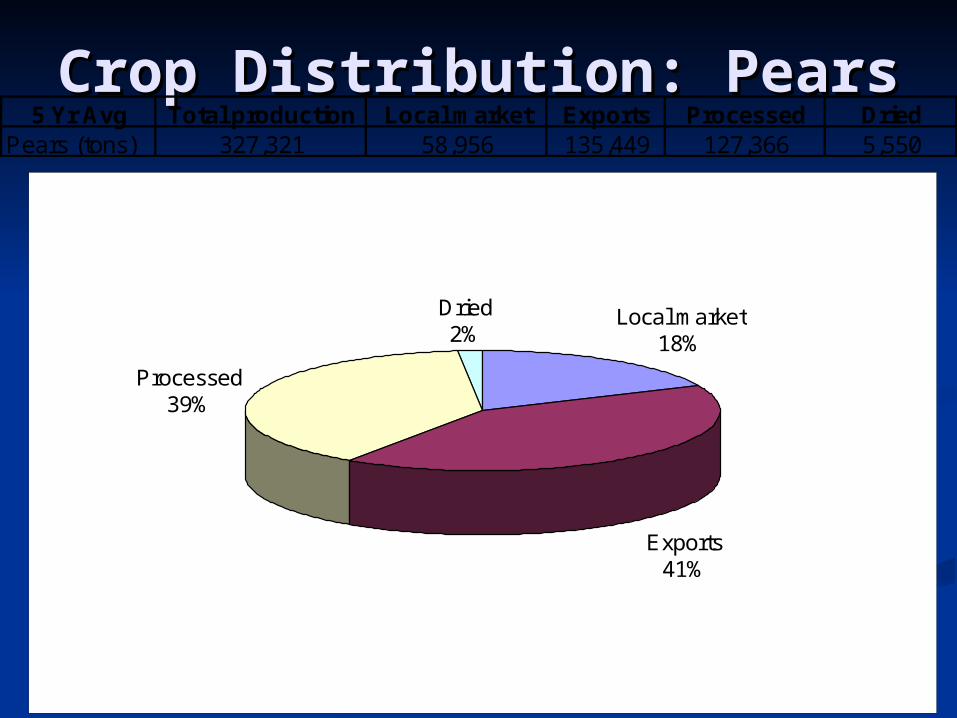
Crop Distribution: PearsCrop Distribution: Pears
Local market18%
Exports41%
Processed39%
Dried2%
5 Yr Avg Total production Local market Exports Processed DriedPears (tons) 327,321 58,956 135,449 127,366 5,550
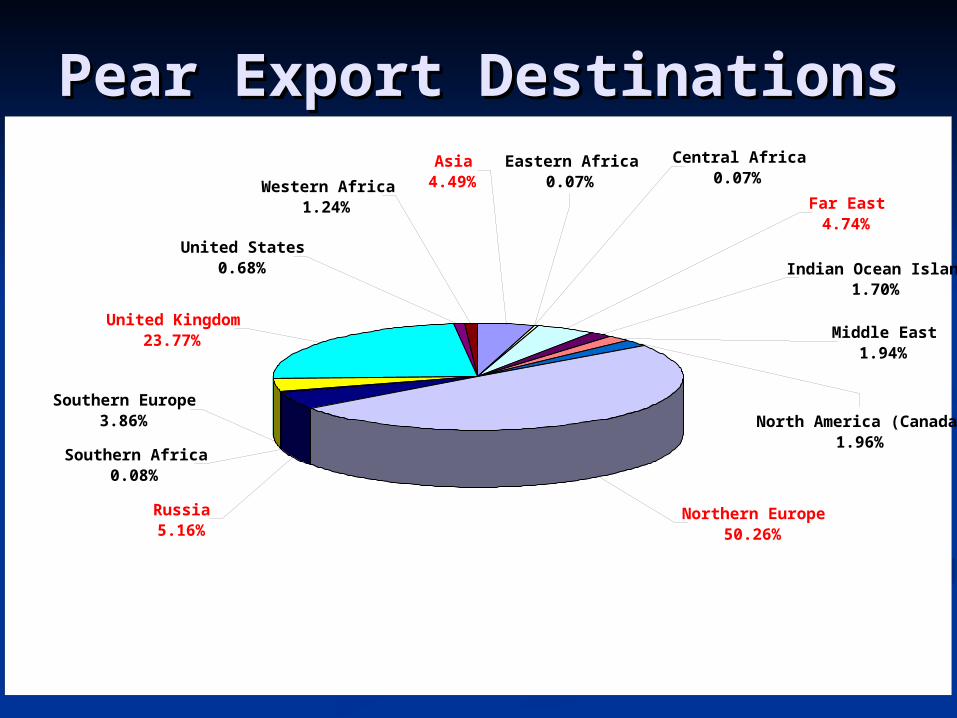
Pear Export DestinationsPear Export DestinationsAsia
4.49%Far East4.74%
Indian Ocean Island1.70%
Central Africa0.07%
Middle East1.94%
North America (Canada)1.96%
Eastern Africa0.07%
Northern Europe50.26%
Southern Africa0.08%
Russia5.16%
Southern Europe3.86%
United Kingdom23.77%
Western Africa1.24%
United States0.68%

Thank youThank you