Embed Size (px)
DESCRIPTION
2013-14 Annual Pricing Proposal - Revised 24 May 2013 - Updated
Citation preview

SA Power Networks
Pricing Proposal i April 2013
SA Power Networks
SA Power Networks Annual Pricing Proposal 2013-2014
www.sapowernetworks.com.au
24 May 2013

SA Power Networks
Pricing Proposal iii April 2013
Executive Summary This network Pricing Proposal has been prepared by SA Power Networks to comply with the requirements of the National Electricity Rules. It provides details of our pricing strategy, proposed network prices for 2013/14, and comprehensive information on the price changes for each type and size of customer. Each electricity customer’s retail bill comprises the following components, the first four of which are included in this network Pricing Proposal:
1. SA Power Networks’ distribution network charges;
2. Metering charges (by SA Power Networks or another metering provider);
3. Transmission network charges, by ElectraNet;
4. Jurisdictional Scheme Amount charges, required to fund the South Australian Government’s Feed-in Tariff credits to the owners of qualifying solar photo-voltaic (PV) electricity generators; and
5. Retail charges, including the cost of energy generation.
GST is applicable to these items.
For the purpose of comparison and information to the reader, the price changes for small customers in this Pricing Proposal are compared to the default small customer retail price applicable at February 2013. These were the prices released by AGL following State Government negotiations on retail pricing.
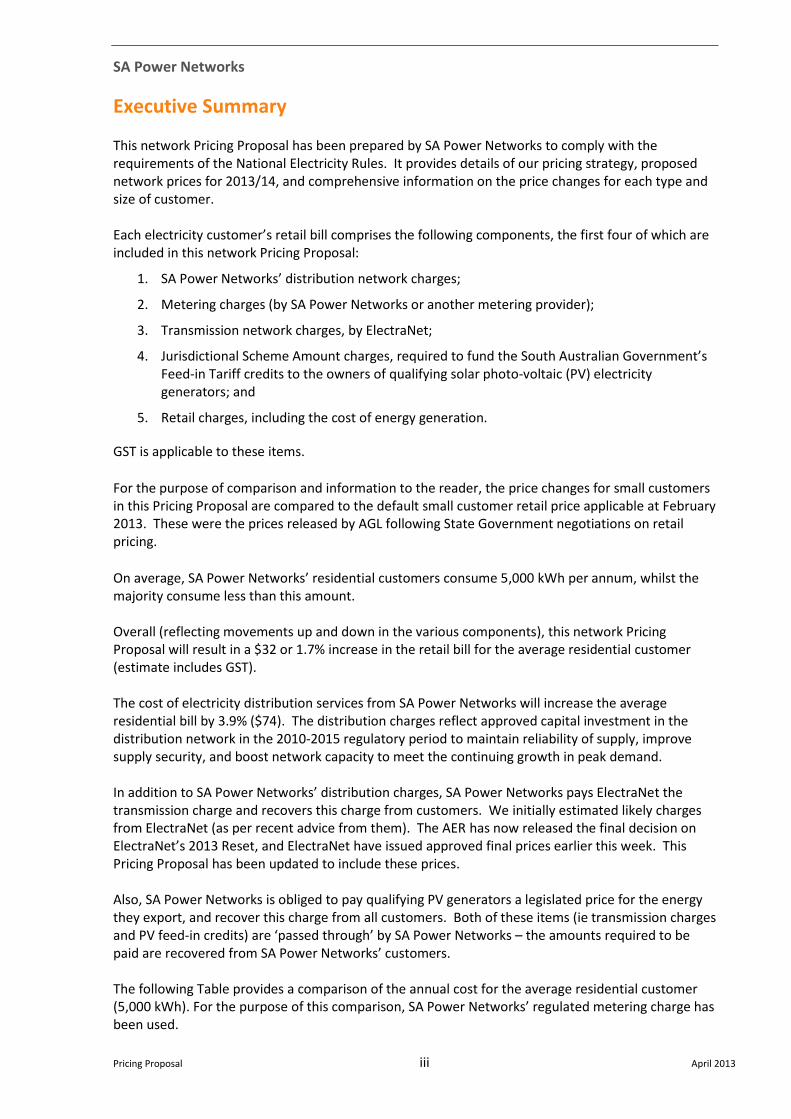
On average, SA Power Networks’ residential customers consume 5,000 kWh per annum, whilst the majority consume less than this amount. Overall (reflecting movements up and down in the various components), this network Pricing Proposal will result in a $32 or 1.7% increase in the retail bill for the average residential customer (estimate includes GST). The cost of electricity distribution services from SA Power Networks will increase the average residential bill by 3.9% ($74). The distribution charges reflect approved capital investment in the distribution network in the 2010-2015 regulatory period to maintain reliability of supply, improve supply security, and boost network capacity to meet the continuing growth in peak demand. In addition to SA Power Networks’ distribution charges, SA Power Networks pays ElectraNet the transmission charge and recovers this charge from customers. We initially estimated likely charges from ElectraNet (as per recent advice from them). The AER has now released the final decision on ElectraNet’s 2013 Reset, and ElectraNet have issued approved final prices earlier this week. This Pricing Proposal has been updated to include these prices. Also, SA Power Networks is obliged to pay qualifying PV generators a legislated price for the energy they export, and recover this charge from all customers. Both of these items (ie transmission charges and PV feed-in credits) are ‘passed through’ by SA Power Networks – the amounts required to be paid are recovered from SA Power Networks’ customers. The following Table provides a comparison of the annual cost for the average residential customer (5,000 kWh). For the purpose of this comparison, SA Power Networks’ regulated metering charge has been used.
SA Power Networks
Pricing Proposal iv April 2013
Component of price (a) 2012/13 2013/14 Increase Impact on retail
bill $ per annum $ per annum $ per annum
1. Distribution charge 580 651 71 3.7%
2. Metering charge 31 34 3 0.2%
SA Power Networks charges 611 685 74 3.9%
3. Transmission charge(c ) 158 140 -19 --1.0%
4. Jurisdictional Scheme Amount (PV) 122 98 -24 -1.3%
5. Retail (b) 1,000 1,000 0 0.0%
Total Retail Bill 1,891 1923 32 1.7%
Notes:
(a) All amounts contain GST.
(b) Using AGL standing contract retail price for February 2013.
(c) Using ElectraNet May 2013 advice of 2013/14 final prices.
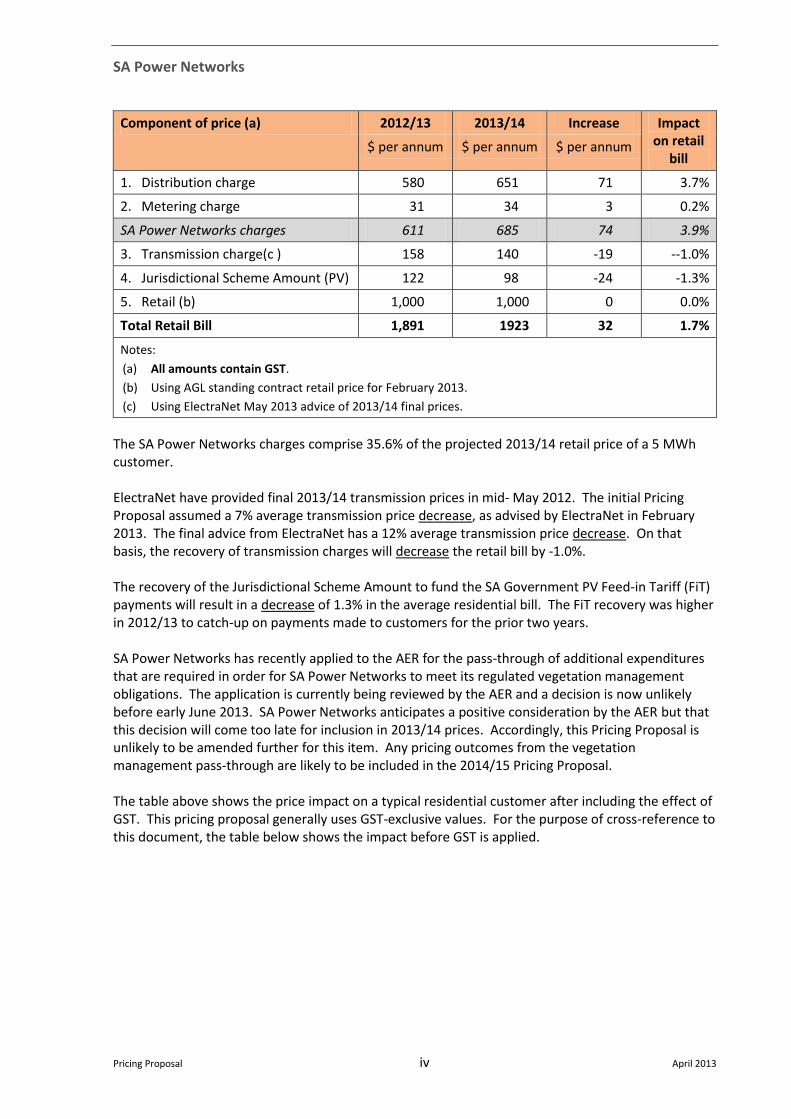
The SA Power Networks charges comprise 35.6% of the projected 2013/14 retail price of a 5 MWh customer. ElectraNet have provided final 2013/14 transmission prices in mid- May 2012. The initial Pricing Proposal assumed a 7% average transmission price decrease, as advised by ElectraNet in February 2013. The final advice from ElectraNet has a 12% average transmission price decrease. On that basis, the recovery of transmission charges will decrease the retail bill by -1.0%. The recovery of the Jurisdictional Scheme Amount to fund the SA Government PV Feed-in Tariff (FiT) payments will result in a decrease of 1.3% in the average residential bill. The FiT recovery was higher in 2012/13 to catch-up on payments made to customers for the prior two years. SA Power Networks has recently applied to the AER for the pass-through of additional expenditures that are required in order for SA Power Networks to meet its regulated vegetation management obligations. The application is currently being reviewed by the AER and a decision is now unlikely before early June 2013. SA Power Networks anticipates a positive consideration by the AER but that this decision will come too late for inclusion in 2013/14 prices. Accordingly, this Pricing Proposal is unlikely to be amended further for this item. Any pricing outcomes from the vegetation management pass-through are likely to be included in the 2014/15 Pricing Proposal. The table above shows the price impact on a typical residential customer after including the effect of GST. This pricing proposal generally uses GST-exclusive values. For the purpose of cross-reference to this document, the table below shows the impact before GST is applied.
SA Power Networks
Pricing Proposal v April 2013
Component of price (a) 2012/13 2013/14 Increase Impact on retail
bill $ per annum $ per annum $ per annum
1. Distribution charge 527 592 65 3.8%
2. Metering charge 28 31 3 0.2%
SA Power Networks charges 555 623 68 3.9%
3. Transmission charge(c ) 144 127 -17 -1.0%
4. Jurisdictional Scheme Amount (PV) 111 89 -22 -1.3%
5. Retail (b) 909 909 0 0.0%
Total Retail Bill 1,719 1748 29 1.7%
Notes:
(a) All amounts exclude GST.
(b) Using AGL standing contract retail price for February 2013.
(c) Using ElectraNet May 2013 advice of 2013/14 final prices.

SA Power Networks
Pricing Proposal vi April 2013
Shortened forms Abbreviation Definition or description
AER Australian Energy Regulator.
Augmentation Investment in new network assets to meet increased demand.
Capacity, capability The amount of energy that a part of the network is able to carry.
Capital Contributed Works
Works for which the customer(s) contribute towards the cost of supplying assets, typically because they are the sole users.
COAG Council of Australian Governments.
Contestability Customer choice of electricity supplier.
Controlled Load The DNSP controls the hours in which the supply is made available.
Cost of Supply Model
Theoretical and algorithmic model used to calculate prices, which conform to the pricing goals.
Cross subsidy Where the price to a tariff class falls outside the range between the avoidable incremental cost of supply and the cost of stand-alone supply, an economic cross subsidy from or to other customers is said to exist.
Decision The Australian Energy Regulator’s Final Decision on South Australia -distribution determination 2010–11 to 2014–15, May 2010
Demand Energy consumption at a point in time.
Demand Management
Attempt to modify demand behaviour so as to constrain demand at critical times.
Distribution Network
The assets and service which links energy customers to the transmission network.
Distributor, DNSP Distribution Network Service Provider.
DUoS Distribution Use of System. The utilisation of the distribution network in the provision of electricity to consumers (a component of NUoS). .
EDPD Electricity Distribution Price Determination (South Australian).
ESCoSA Essential Services Commission of South Australia, the South Australian Regulator of energy and other infrastructure.
FiT Feed-in Tariff, paid to customers that have solar PV generators.
FRC Full Retail Competition (sometimes called Full Retail Contestability).
High Voltage Equipment or supplies at voltages of 22 or 11 kV.
IBT, Inclining Block Tariff
A network tariff energy rate in which the rate increases above specific consumption thresholds.
JSA Jurisdictional Scheme Amount, a component of the Network Use of System charge to fund Feed-in Tariff payments to customers that have solar PV generators.
kVA, MVA Kilo-volt amps and Mega-volt amps, units of instantaneous total electrical power demand. Usually the peak demand is referenced. See also PF for the relationship between power demand quantities.
kVAr, MVAr Kilo-volt amps (reactive) and Mega-volt amps (reactive) units of instantaneous reactive electrical power demand. Usually the peak demand is referenced. See also PF for the relationship between power demand quantities.

SA Power Networks
Pricing Proposal vii April 2013
Abbreviation Definition or description
kW, MW Kilo-watts and Mega-watts, units of instantaneous real electrical power demand. Usually the peak demand is referenced. See also PF for the relationship between power demand quantities.
kWh, MWh Kilo-watt hours and Mega-watt hours, units of electrical energy consumption.
Low Voltage Equipment or supply at a voltage of 220 V single phase or 380 V, three phase.
Marginal Cost The cost of providing a small increment of service. The Long Run Marginal Cost (LRMC) includes future investment, Short Run Marginal Cost (SRMC) considers only the costs involved without extra investment.
Market Participant Businesses involved in the electricity industry are referred to as Market or Code Participants.
Supply Rate The fixed daily cost component of a Network price.
NEL National Electricity Law.
NEM National Electricity Market.
NUoS Network Use of System. The utilisation of the total electricity network in the provision of electricity to consumers (NUoS = DUoS + TUoS).
PV Photo-Voltaic
PF Power Factor, a measure of the ratio of real power to total power of a load. The relationship between real, reactive and total power is as follows:
Price Signal Prices set to convey a desired behaviour because of the costs associated with supplying the service.
Price Structure The components that make up a Price available to customers.
Proposal SA Power Networks’ Initial Pricing Proposal, submitted in accordance with the Rules (this document).
Retailer An FRC market participant (business) supplying electricity to customers.
Rules National Electricity Rules.
Subtransmission Equipment or supplies at voltage levels of 132, 66 or 33 kV.
Tariff A grouping of customers who are subject to the same network price components and conditions of supply.
Tariff class A class of customers for one or more direct control services who are subject to a particular tariff or particular tariffs.
ToU Time of Use, a system of pricing where energy or demand charges are higher in periods of peak utilisation of the network.
Transmission Network
The assets and service that enable generators to transmit their electrical energy to population centres. Operating voltage of equipment is 275, 132 or 66 kV.
TUoS Transmission Use of System charges for the utilisation of the transmission network.
PF =Re al Power (in kW or MW )
Re active Power (in kVA or MVA)
Total Power kVA = Re al Power kW 2 + Re active Power kVAr2
SA Power Networks
Pricing Proposal viii April 2013
Abbreviation Definition or description
Unmetered supply A connection to the distribution system which is not equipped with a meter and has estimated consumption. Connections to public lights, phone boxes, traffic lights and the like are not normally metered.
WAPC Weighted Average Price Cap, a form of regulatory price control, where the allowable price change is based on the weighted historic consumption of each price.

Pricing Proposal i April 2013
Contents Executive Summary ................................................................................................................................. iii
Shortened forms ..................................................................................................................................... vi
1 Introduction .................................................................................................................................... 1
1.1 National Electricity Rules ......................................................................................................... 1
1.2 Scope of SA Power Networks’ Pricing Proposal ...................................................................... 1
1.3 Structure of SA Power Networks’ Pricing Proposal ................................................................. 2
1.4 Confidential information ......................................................................................................... 3
2 Regulatory requirements ................................................................................................................ 4
2.1 Rules requirements ................................................................................................................. 4
2.2 Requirements of the AER’s 2010 Determination .................................................................... 5
2.3 Principal elements of the AER’s 2010 Decision ....................................................................... 5
2.4 Publication of information about tariffs and tariff classes ..................................................... 9
3 Business overview ......................................................................................................................... 10
3.1 SA Power Networks’ business ............................................................................................... 10
3.2 State-wide pricing ................................................................................................................. 10
3.3 Characteristics of the region ................................................................................................. 11
3.4 Climatic conditions ................................................................................................................ 11
3.5 SA Power Networks’ customer and demand profile ............................................................. 12
4 Tariff Classes .................................................................................................................................. 13
4.1 Regulatory requirements ...................................................................................................... 14
4.2 Standard control service tariffs and tariff classes ................................................................. 16
4.3 Low voltage residential tariff class ........................................................................................ 19
4.4 Low voltage business tariff class ........................................................................................... 20
4.5 High Voltage Business tariff class .......................................................................................... 23
4.6 Major Business tariff class ..................................................................................................... 25
5 Network tariff strategy .................................................................................................................. 29
5.1 Regulatory Requirements ..................................................................................................... 29
5.2 Network tariff objectives....................................................................................................... 29
5.3 The need for tariff reform ..................................................................................................... 29
5.4 Network tariff strategy .......................................................................................................... 30
5.5 Tariff reform 2005 to 2010 .................................................................................................... 30
5.6 Experimental tariff programs ................................................................................................ 30
5.7 SA Power Networks’ demand management and intelligent network trials ......................... 31
5.8 Future tariff reform options .................................................................................................. 31
5.9 Expected DUoS price trends 2010 - 2015 .............................................................................. 32
6 Standard control services tariffs ................................................................................................... 34
Pricing Proposal ii April 2013
6.1 Regulatory Requirements ..................................................................................................... 34
6.2 Tariff changes in 2013/14 ...................................................................................................... 34
6.3 Calculation of network use of system tariffs......................................................................... 35
6.4 Low Voltage Residential tariff class ....................................................................................... 35
6.5 Low Voltage Business tariff class ........................................................................................... 36
6.6 High Voltage Business tariff class .......................................................................................... 37
6.7 Major Business tariff class ..................................................................................................... 37
7 Customer Impacts ......................................................................................................................... 39
7.1 Regulatory Requirements ..................................................................................................... 39
7.2 Overall price trends during the 2010-15 regulatory control period ..................................... 40
7.3 Variations to prices ............................................................................................................... 41
7.4 Low Voltage Residential tariff class ....................................................................................... 42
7.5 Low Voltage Business tariff class ........................................................................................... 46
7.6 High Voltage Business tariff class .......................................................................................... 51
7.7 Major Business tariff class ..................................................................................................... 51
7.8 Review of customer charges ................................................................................................. 52
8 Pricing of standard control services .............................................................................................. 53
8.1 Regulatory requirements ...................................................................................................... 53
8.2 2013/14 prices for standard control services ....................................................................... 55
8.3 Compliance with the Weighted Average Price Cap .............................................................. 56
8.4 Tariff class side constraints ................................................................................................... 57
8.5 Compliance with pricing principles ....................................................................................... 58
8.6 Stand-alone costs .................................................................................................................. 59
8.7 Avoidable costs ..................................................................................................................... 59
8.8 Compliance with Rules clause 6.18.5(a) ................................................................................ 60
8.9 Long Run Marginal Costs ....................................................................................................... 60
8.10 Transaction costs ................................................................................................................... 64
8.11 Customer response to price signals ...................................................................................... 64
9 Transmission cost recovery tariffs ................................................................................................ 66
9.1 Regulatory Requirements ..................................................................................................... 66
9.2 Transmission cost recovery tariff methodology.................................................................... 67
9.3 Transmission use of system overs and unders account balance .......................................... 68
9.4 Charging parameters for transmission recovery tariffs ........................................................ 68
9.5 Transmission recovery tariffs for 2013/14 ............................................................................ 69
10 Recovery of the PV Jurisdictional Scheme Amount .................................................................. 70
10.1 PV Jurisdictional Scheme Amount overs and unders account balance ................................ 71
10.2 Charging parameters for PV JSA cost recovery tariffs ........................................................... 71
10.3 PV JSA cost recovery tariffs for 2013/14 ............................................................................... 72
11 Customer tariff class assignment and reassignment ................................................................ 73
Pricing Proposal iii April 2013
11.1 Regulatory Requirements ..................................................................................................... 73
11.2 Assignment of new customers to a tariff class during the next regulatory control period .. 75
11.3 Reassignment of existing customers to another existing or a new tariff during the next regulatory control period .................................................................................................................. 76
11.4 Objections to proposed assignments and reassignments .................................................... 77
12 Alternative Control Services – metering services ..................................................................... 78
12.1 Regulatory requirements ...................................................................................................... 78
12.2 Alternative control metering services tariff class ................................................................. 80
12.3 Assignment and reassignment of customers to the alternative control metering service tariff class .......................................................................................................................................... 80
12.4 Pricing principles ................................................................................................................... 80
12.5 Compliance with the AER determination .............................................................................. 81
12.6 Charging parameters for alternative control services metering tariffs ................................ 82
Appendices ............................................................................................................................................ 84
Appendix A. Network Use of System Tariffs and explanatory notes ............................................. 84
Appendix B. CONFIDENTIAL – Audit of 2011/12 quantities .......................................................... 84
Appendix C. STPIS Approval Letter from the AER – 2010/11 and 2011/12 for 2013/14 tariffs .... 84
Appendix D. Transmission Prices Letter from ElectraNet – 2013/14 TUoS tariffs ........................ 84
Appendix E. Long Run Marginal Cost Methodology ...................................................................... 84
Appendix F. Stand-alone and Avoided cost methodologies ......................................................... 84
Appendix G. CONFIDENTIAL – AER Weighted Average Price Cap Compliance Model (standard control) 84
Appendix H. CONFIDENTIAL – AER Weighted Average Price Cap Compliance Model (alternate control) 84
Appendix I. Not Used in 2013/14 Pricing Proposal ...................................................................... 84
Appendix J. SA Power Networks procedure for assigning and reassigning customers to tariff classes (Tariff Manual) ...................................................................................................................... 84
Appendix K. Regulatory compliance checklist ............................................................................... 84
Appendix L. WAPC Reconciliation ................................................................................................. 84
SA Power Networks
Pricing Proposal April 2013
1 Introduction
SA Power Networks is submitting this annual Pricing Proposal (Pricing Proposal) for 2013/14 to the Australian Energy Regulator (AER). The proposal has been prepared in accordance with the requirements of the National Electricity Rules (Rules), the AER’s 2010 regulatory determination and subsequent amendments to the determination made by the Australian Competition Tribunal in May 2011 and the AER in February 2012. The Pricing Proposal covers all of SA Power Networks’ direct control services. In its 2010 South Australian Decision (Decision) the AER further classified these direct control services as standard control services and alternative control services1.
1.1 National Electricity Rules
Clause 6.1.1 of the Rules confers responsibility on the AER for the economic regulation of distribution services provided by means of, or in connection with, distribution systems that form part of the national grid.
1.1.1 Classification of distribution services
In accordance with clause 6.2.1 and 6.2.2 of the Rules, the AER has classified SA Power Networks’ distribution services into the following three classes:
1. Direct control services;
2. Negotiated distribution services;
3. Unregulated distribution services.
Direct control services have been further divided into the following two subclasses:
1. Standard control services; and
2. Alternative control services.
This Pricing Proposal applies to all of the direct control services provided by SA Power Networks.
1.2 Scope of SA Power Networks’ Pricing Proposal
SA Power Networks’ Pricing Proposal sets out the proposed prices required to comply with the Weighted Average Price Cap approved by the Australian Energy Regulator (AER).
1 Australian Energy Regulator, Final Decision - South Australia distribution determination 2010–11 to 2014–15, May 2010.

SA Power Networks
Pricing Proposal 2 29/04/2013
This Pricing Proposal is submitted in accordance with, and complies with, the requirements of:
1. The National Electricity Law;
2. The National Electricity Rules, including the Transitional Rules for South Australia;
3. The AER’s 2010-15 South Australian distribution determination, including the AER’s Final Decisions on the control mechanisms and pricing X factors for standard control services and alternative control services;
4. The Australian Competition Tribunal’s decision on 19 May 2011, to vary the AER determination by permitting the inclusion of easements within the Regulatory Asset Base (RAB) and varying the corporate taxation allowance;
5. The AER’s decision on 12 December 2011, amending SA Power Networks 2010 determination to permit the recovery of the Jurisdictional Scheme Amount (JSA), for Feed-in Tariff (FiT) credits paid by SA Power Networks to small solar photo-voltaic (PV) generators. On 17 February 2012, the AER revoked and substituted SA Power Networks' distribution determination to remove the allowance for feed-in tariff payments for 2011-12 to 2014-15. These payments are now recovered through the JSA PV pass-through.
Please note that SA Power Networks has recently applied to the AER for the pass-through of additional expenditures that are required in order for SA Power Networks to meet its regulated vegetation management obligations. The application is currently being reviewed by the AER and a decision is anticipated by early June 2013. SA Power Networks anticipates a positive consideration by the AER and has proposed to the AER that these increased costs be recovered over the 2013/14 and the 2014/15 regulatory years. Accordingly, this pricing proposal will be amended once a decision from the AER is received.
1.3 Structure of SA Power Networks’ Pricing Proposal
In Part I of the Rules, clause 6.18 sets out the requirements concerning Distribution Pricing. These requirements include:
The Pricing Principles which must be followed;
The requirement for this Pricing Proposal; and
The matters that the Pricing Proposal must address.
The AER’s determination has been made pursuant to clause 6.11.1 of the Rules. Several aspects of that determination impose requirements concerning distribution pricing, including:
Classification of services;
The pricing control mechanism(s), X factors and side constraints;
Assigning and reassigning customers to tariff classes;
Recovery of transmission charges; and
The passthrough of costs, in specified circumstances. This includes the PV Jurisdictional Scheme Amount.
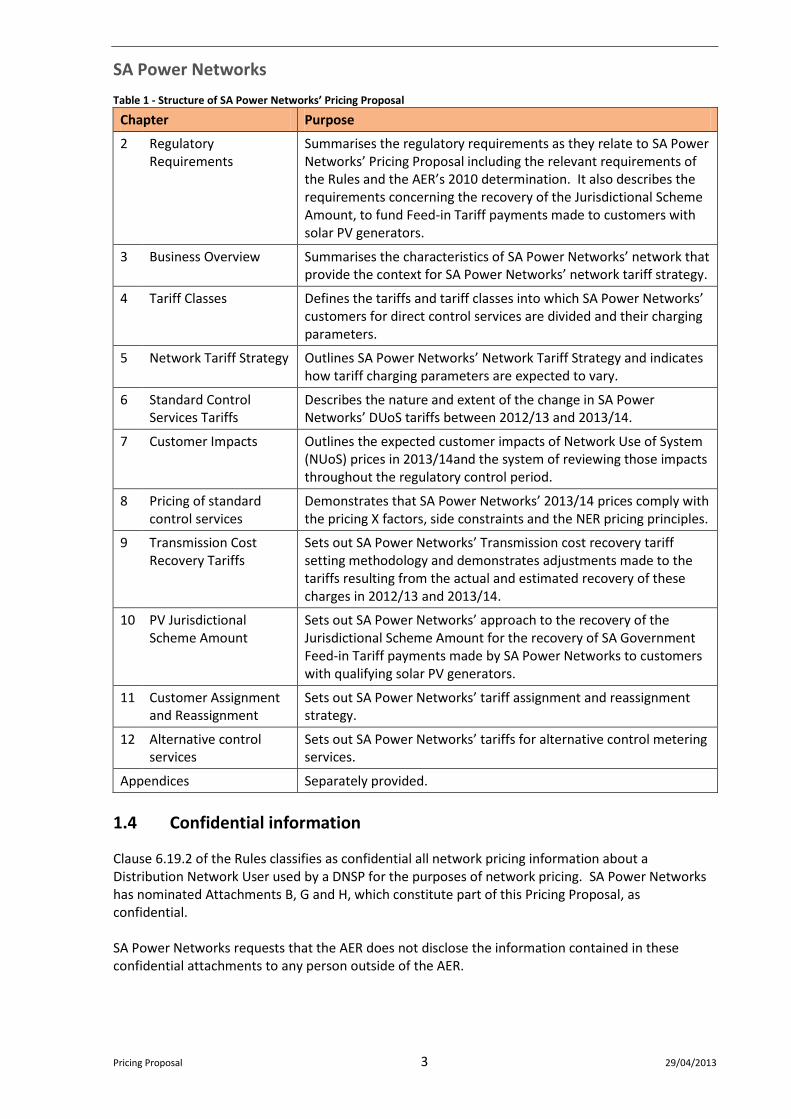
This Pricing Proposal has been structured so as to allow compliance with the specific requirements of the Rules and the AER’s determination to be readily ascertained. The substantive sections of this Pricing Proposal are set out in Table 1.
SA Power Networks
Pricing Proposal 3 29/04/2013
Table 1 - Structure of SA Power Networks’ Pricing Proposal
Chapter Purpose
2 Regulatory Requirements
Summarises the regulatory requirements as they relate to SA Power Networks’ Pricing Proposal including the relevant requirements of the Rules and the AER’s 2010 determination. It also describes the requirements concerning the recovery of the Jurisdictional Scheme Amount, to fund Feed-in Tariff payments made to customers with solar PV generators.
3 Business Overview Summarises the characteristics of SA Power Networks’ network that provide the context for SA Power Networks’ network tariff strategy.
4 Tariff Classes Defines the tariffs and tariff classes into which SA Power Networks’ customers for direct control services are divided and their charging parameters.
5 Network Tariff Strategy Outlines SA Power Networks’ Network Tariff Strategy and indicates how tariff charging parameters are expected to vary.
6 Standard Control Services Tariffs
Describes the nature and extent of the change in SA Power Networks’ DUoS tariffs between 2012/13 and 2013/14.
7 Customer Impacts Outlines the expected customer impacts of Network Use of System (NUoS) prices in 2013/14and the system of reviewing those impacts throughout the regulatory control period.
8 Pricing of standard control services
Demonstrates that SA Power Networks’ 2013/14 prices comply with the pricing X factors, side constraints and the NER pricing principles.
9 Transmission Cost Recovery Tariffs
Sets out SA Power Networks’ Transmission cost recovery tariff setting methodology and demonstrates adjustments made to the tariffs resulting from the actual and estimated recovery of these charges in 2012/13 and 2013/14.
10 PV Jurisdictional Scheme Amount
Sets out SA Power Networks’ approach to the recovery of the Jurisdictional Scheme Amount for the recovery of SA Government Feed-in Tariff payments made by SA Power Networks to customers with qualifying solar PV generators.
11 Customer Assignment and Reassignment
Sets out SA Power Networks’ tariff assignment and reassignment strategy.
12 Alternative control services
Sets out SA Power Networks’ tariffs for alternative control metering services.
Appendices Separately provided.
1.4 Confidential information
Clause 6.19.2 of the Rules classifies as confidential all network pricing information about a Distribution Network User used by a DNSP for the purposes of network pricing. SA Power Networks has nominated Attachments B, G and H, which constitute part of this Pricing Proposal, as confidential. SA Power Networks requests that the AER does not disclose the information contained in these confidential attachments to any person outside of the AER.
SA Power Networks
Pricing Proposal 4 29/04/2013
2 Regulatory requirements
This Chapter summarises the regulatory requirements pertaining to SA Power Networks’ Pricing Proposal, including the relevant requirements of the Rules and those of the AER’s 2010 distribution determination.
2.1 Rules requirements
2.1.1 Required elements of a Pricing Proposal
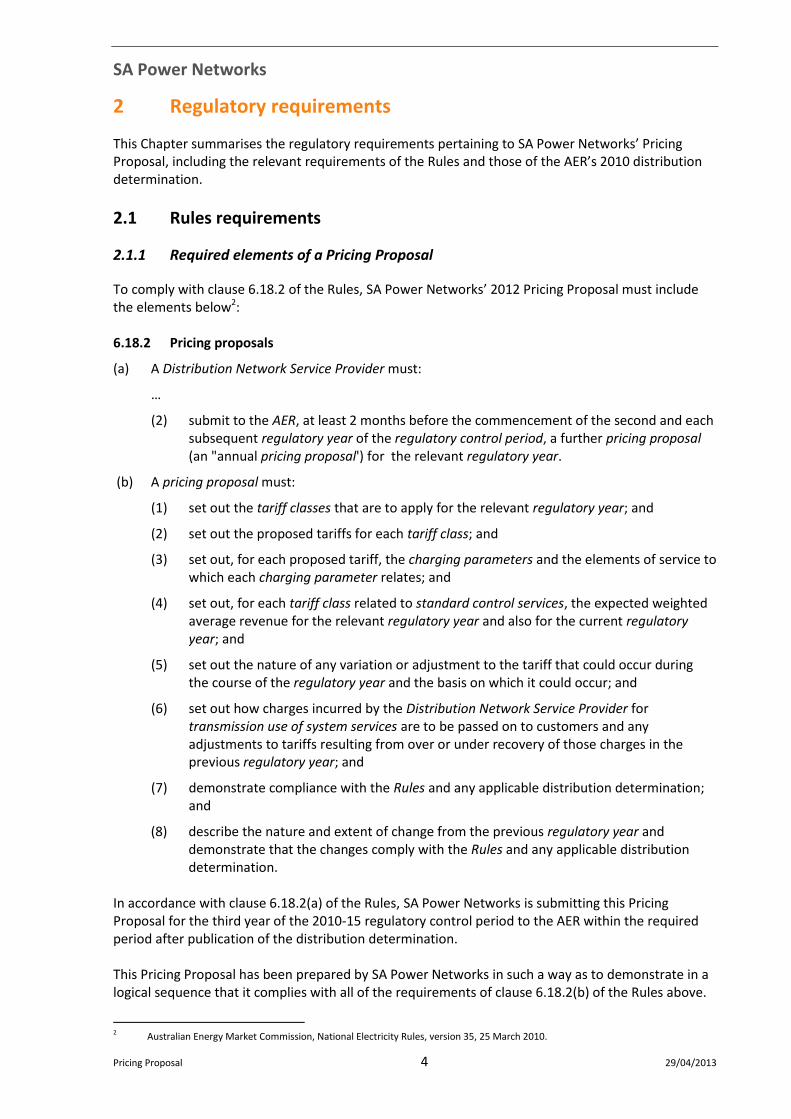
To comply with clause 6.18.2 of the Rules, SA Power Networks’ 2012 Pricing Proposal must include the elements below2: 6.18.2 Pricing proposals
(a) A Distribution Network Service Provider must:
…
(2) submit to the AER, at least 2 months before the commencement of the second and each subsequent regulatory year of the regulatory control period, a further pricing proposal (an "annual pricing proposal') for the relevant regulatory year.
(b) A pricing proposal must:
(1) set out the tariff classes that are to apply for the relevant regulatory year; and
(2) set out the proposed tariffs for each tariff class; and
(3) set out, for each proposed tariff, the charging parameters and the elements of service to which each charging parameter relates; and
(4) set out, for each tariff class related to standard control services, the expected weighted average revenue for the relevant regulatory year and also for the current regulatory year; and
(5) set out the nature of any variation or adjustment to the tariff that could occur during the course of the regulatory year and the basis on which it could occur; and
(6) set out how charges incurred by the Distribution Network Service Provider for transmission use of system services are to be passed on to customers and any adjustments to tariffs resulting from over or under recovery of those charges in the previous regulatory year; and
(7) demonstrate compliance with the Rules and any applicable distribution determination; and
(8) describe the nature and extent of change from the previous regulatory year and demonstrate that the changes comply with the Rules and any applicable distribution determination.
In accordance with clause 6.18.2(a) of the Rules, SA Power Networks is submitting this Pricing Proposal for the third year of the 2010-15 regulatory control period to the AER within the required period after publication of the distribution determination. This Pricing Proposal has been prepared by SA Power Networks in such a way as to demonstrate in a logical sequence that it complies with all of the requirements of clause 6.18.2(b) of the Rules above.
2 Australian Energy Market Commission, National Electricity Rules, version 35, 25 March 2010.

SA Power Networks
Pricing Proposal 5 29/04/2013
The other relevant sections of the Rules that have been addressed in formulating this Pricing Proposal are as follows:
6.18.3 Tariff classes
6.18.5 Pricing principles
6.18.6 Side constraints on tariffs for standard control services
6.18.7 Recovery of charges for transmission use of system services
6.18.8 Approval of pricing proposal
6.18.9 Publication of information about tariffs and tariff classes Reference to these clauses has been made in the appropriate sections of this Pricing Proposal, to demonstrate how SA Power Networks has complied with each applicable Rules provision.
2.2 Requirements of the AER’s 2010 Determination
The AER’s 2010 Decision for South Australia has been made pursuant to the provisions clause 6.11.1 of the Rules and imposes a number of requirements that are relevant to a Pricing Proposal. The relevant requirements are as follows:
Chapter 2 Classification of services (including Appendix A)
Assigning customers to tariff classes (Appendix B)
Chapter 4 Control mechanism for standard control services
Changes to tariff structures (Appendix E)
Transmission use of system unders and overs account (Appendix F)
Chapter 12 STPIS arrangements (Appendix K)
Chapter 14 DMIS arrangements (Appendix K)
Chapter 15 Pass through arrangements
Chapter 16 Pricing X factors
Chapter 17 Alternative control services Where it is necessary to demonstrate that SA Power Networks has complied with a requirement of the AER’s Decision, reference to the relevant component of the Decision has been made in the appropriate section of this Pricing Proposal.
2.3 Principal elements of the AER’s 2010 Decision
The principal elements of the AER’s Decision pertaining to direct control services (comprising standard and alternative control services) are outlined in this section.

SA Power Networks
Pricing Proposal 6 29/04/2013
2.3.1 Weighted Average Price Cap for standard control services
In Chapter 4 of the 2010 South Australia Decision, the AER has determined the WAPC formula to apply to SA Power Networks’ standard control services for the next regulatory control period3. This is as follows:
Where: SA Power Networks has ‘n’ distribution tariffs, which each have up to ‘m’ distribution tariff components, and where:
regulatory year t is the regulatory year in respect of which the calculation is being made
regulatory year t–1 is the regulatory year immediately preceding regulatory year t
regulatory year t–2 is the regulatory year immediately preceding regulatory year t–1
is the proposed distribution tariff for component j of distribution tariff i in regulatory year
t
is the distribution tariff being charged in regulatory year t–1 for component j of
distribution tariff i
is the quantity of component j of distribution tariff i that was delivered in regulatory year
t–2
Xt is the allowed real change in average prices from year t – 1 to year t of the regulatory control period as determined by the AER
St is the Service Target Performance Incentive Scheme factor to be applied in regulatory year t
Dt is the demand management incentive scheme factor to be applied in regulatory year t, which is set equal to zero for each year of the next regulatory control period
Ut is the undergrounding factor to be applied in regulatory year t
EDPDt is the EDPD transition factor for regulatory year t. It is a carryover of adjustments made in the 2005–2010 EDPD comprising the previous K, Q, PU and SI factor adjustments
passthrought is the change in approved pass through amounts, expressed in percentage form, with respect to regulatory year t as compared to regulatory year t–1, as determined by the AER
CPIt is the annual percentage change in the ABS Consumer Price Index All Groups, Weighted Average of Eight Capital Cities from March in regulatory year t–2 to March in regulatory year t–1.
3 AER, Final Decision - South Australia distribution determination 2010–11 to 2014–15, May 2010, pp. 25-26.
(1+ CPIt )´ (1- Xt )´ (1+ St )´ (1+ Dt )´ (1+Ut )´ (1+ EDPDt )± (passthrought ) ³
pt
ij ´ qt-2
ij
j=1
m
åi=1
n
å
pt-1
ij ´ qt-2
ij
j=1
m
åi=1
n
å
pt
ij
pt -1
ij
qt -2
ij
SA Power Networks
Pricing Proposal 7 29/04/2013
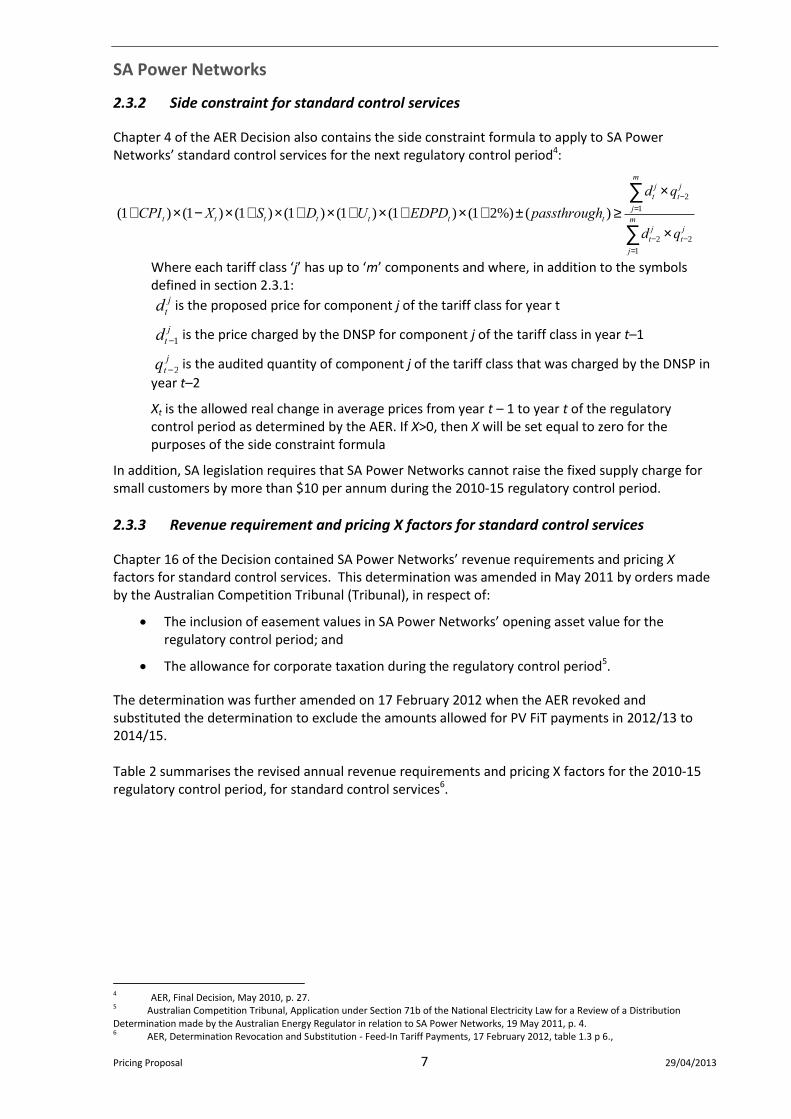
2.3.2 Side constraint for standard control services
Chapter 4 of the AER Decision also contains the side constraint formula to apply to SA Power Networks’ standard control services for the next regulatory control period4:
Where each tariff class ‘j’ has up to ‘m’ components and where, in addition to the symbols defined in section 2.3.1:
is the proposed price for component j of the tariff class for year t
is the price charged by the DNSP for component j of the tariff class in year t–1
is the audited quantity of component j of the tariff class that was charged by the DNSP in
year t–2
Xt is the allowed real change in average prices from year t – 1 to year t of the regulatory control period as determined by the AER. If X>0, then X will be set equal to zero for the purposes of the side constraint formula
In addition, SA legislation requires that SA Power Networks cannot raise the fixed supply charge for small customers by more than $10 per annum during the 2010-15 regulatory control period.
2.3.3 Revenue requirement and pricing X factors for standard control services
Chapter 16 of the Decision contained SA Power Networks’ revenue requirements and pricing X factors for standard control services. This determination was amended in May 2011 by orders made by the Australian Competition Tribunal (Tribunal), in respect of:
The inclusion of easement values in SA Power Networks’ opening asset value for the regulatory control period; and
The allowance for corporate taxation during the regulatory control period5.
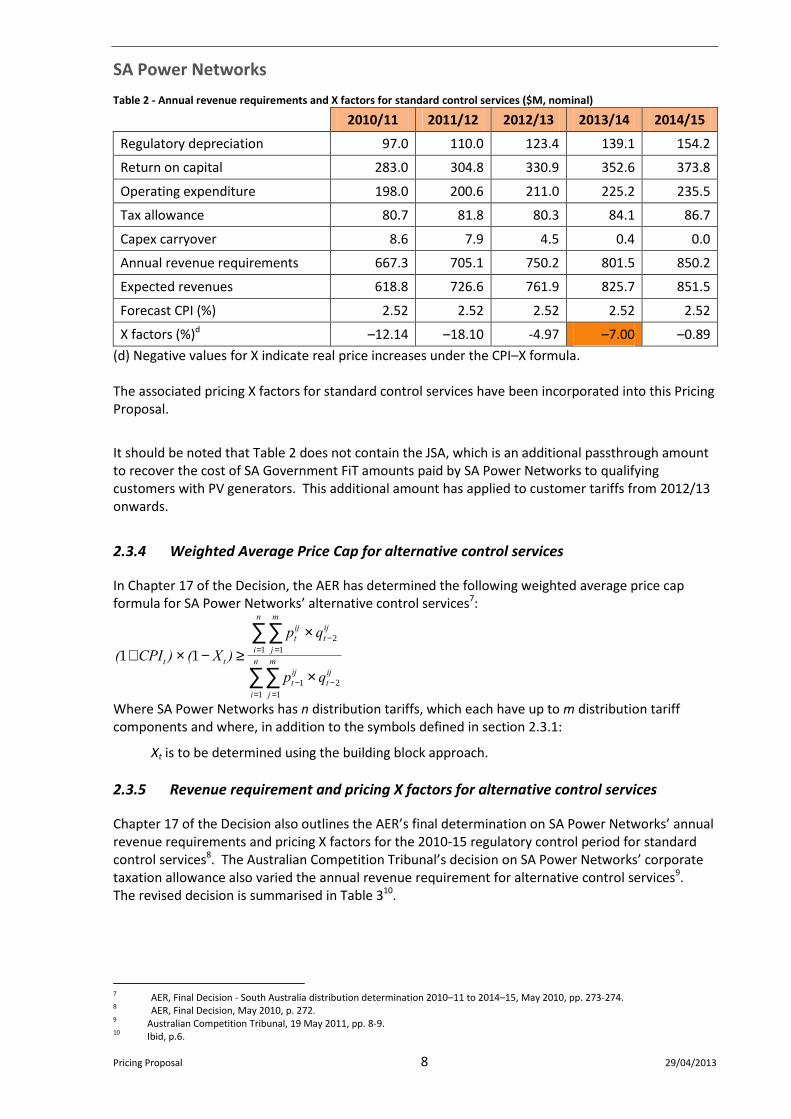
The determination was further amended on 17 February 2012 when the AER revoked and substituted the determination to exclude the amounts allowed for PV FiT payments in 2012/13 to 2014/15. Table 2 summarises the revised annual revenue requirements and pricing X factors for the 2010-15 regulatory control period, for standard control services6.
4 AER, Final Decision, May 2010, p. 27. 5 Australian Competition Tribunal, Application under Section 71b of the National Electricity Law for a Review of a Distribution Determination made by the Australian Energy Regulator in relation to SA Power Networks, 19 May 2011, p. 4. 6 AER, Determination Revocation and Substitution - Feed-In Tariff Payments, 17 February 2012, table 1.3 p 6.,
(1+CPIt )´ (1- Xt )´ (1+ St )´ (1+ Dt )´ (1+Ut )´ (1+ EDPDt )´ (1+ 2%)± (passthrought ) ³
dt
j ´ qt-2
j
j=1
m
å
dt-2
j ´ qt-2
j
j=1
m
å
dt
j
dt -1
j
qt -2
j
SA Power Networks
Pricing Proposal 8 29/04/2013
Table 2 - Annual revenue requirements and X factors for standard control services ($M, nominal)
2010/11 2011/12 2012/13 2013/14 2014/15
Regulatory depreciation 97.0 110.0 123.4 139.1 154.2
Return on capital 283.0 304.8 330.9 352.6 373.8
Operating expenditure 198.0 200.6 211.0 225.2 235.5
Tax allowance 80.7 81.8 80.3 84.1 86.7
Capex carryover 8.6 7.9 4.5 0.4 0.0
Annual revenue requirements 667.3 705.1 750.2 801.5 850.2
Expected revenues 618.8 726.6 761.9 825.7 851.5
Forecast CPI (%) 2.52 2.52 2.52 2.52 2.52
X factors (%)d –12.14 –18.10 -4.97 –7.00 –0.89
(d) Negative values for X indicate real price increases under the CPI–X formula. The associated pricing X factors for standard control services have been incorporated into this Pricing Proposal.
It should be noted that Table 2 does not contain the JSA, which is an additional passthrough amount to recover the cost of SA Government FiT amounts paid by SA Power Networks to qualifying customers with PV generators. This additional amount has applied to customer tariffs from 2012/13 onwards.
2.3.4 Weighted Average Price Cap for alternative control services
In Chapter 17 of the Decision, the AER has determined the following weighted average price cap formula for SA Power Networks’ alternative control services7:
Where SA Power Networks has n distribution tariffs, which each have up to m distribution tariff components and where, in addition to the symbols defined in section 2.3.1:
Xt is to be determined using the building block approach.
2.3.5 Revenue requirement and pricing X factors for alternative control services
Chapter 17 of the Decision also outlines the AER’s final determination on SA Power Networks’ annual revenue requirements and pricing X factors for the 2010-15 regulatory control period for standard control services8. The Australian Competition Tribunal’s decision on SA Power Networks’ corporate taxation allowance also varied the annual revenue requirement for alternative control services9. The revised decision is summarised in Table 310.
7 AER, Final Decision - South Australia distribution determination 2010–11 to 2014–15, May 2010, pp. 273-274. 8 AER, Final Decision, May 2010, p. 272. 9 Australian Competition Tribunal, 19 May 2011, pp. 8-9. 10 Ibid, p.6.
(1+ CPIt ) ´ (1- X t ) ³
pt
ij ´ qt -2
ij
j =1
m
åi=1
n
å
pt -1
ij ´ qt -2
ij
j =1
m
åi=1
n
å
SA Power Networks
Pricing Proposal 9 29/04/2013
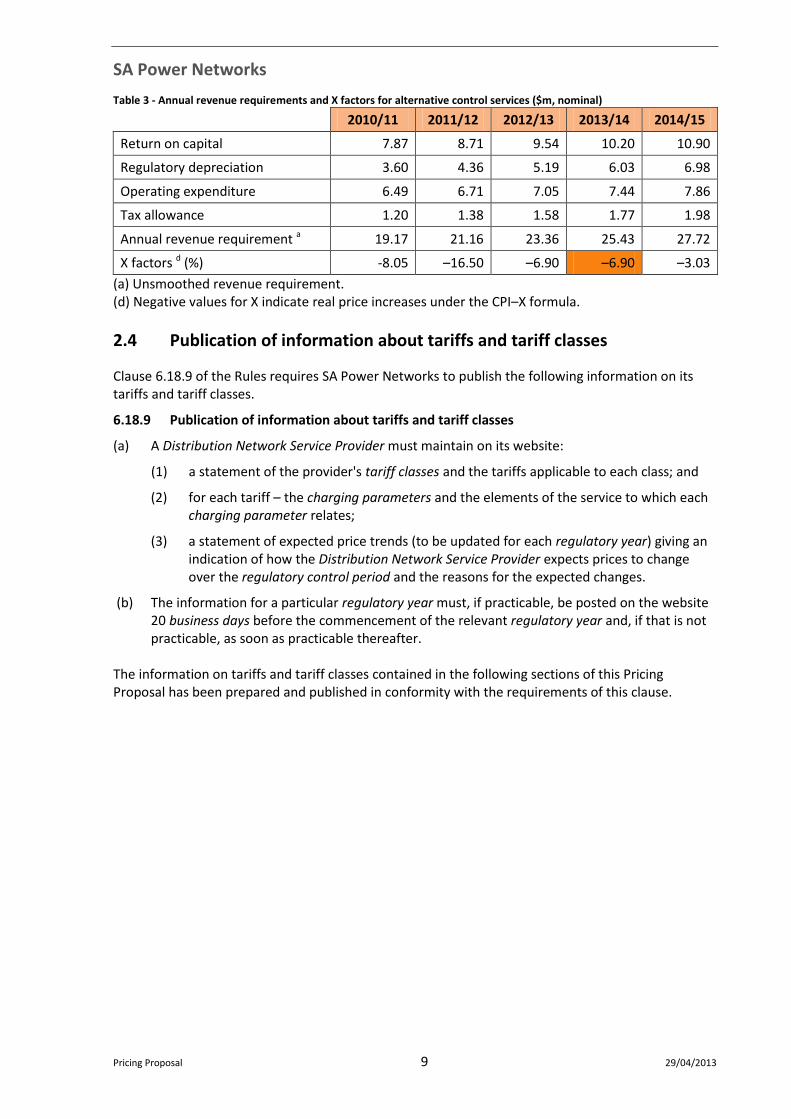
Table 3 - Annual revenue requirements and X factors for alternative control services ($m, nominal)
2010/11 2011/12 2012/13 2013/14 2014/15
Return on capital 7.87 8.71 9.54 10.20 10.90
Regulatory depreciation 3.60 4.36 5.19 6.03 6.98
Operating expenditure 6.49 6.71 7.05 7.44 7.86
Tax allowance 1.20 1.38 1.58 1.77 1.98
Annual revenue requirement a 19.17 21.16 23.36 25.43 27.72
X factors d (%) -8.05 –16.50 –6.90 –6.90 –3.03
(a) Unsmoothed revenue requirement. (d) Negative values for X indicate real price increases under the CPI–X formula.
2.4 Publication of information about tariffs and tariff classes
Clause 6.18.9 of the Rules requires SA Power Networks to publish the following information on its tariffs and tariff classes.
6.18.9 Publication of information about tariffs and tariff classes
(a) A Distribution Network Service Provider must maintain on its website:
(1) a statement of the provider's tariff classes and the tariffs applicable to each class; and
(2) for each tariff – the charging parameters and the elements of the service to which each charging parameter relates;
(3) a statement of expected price trends (to be updated for each regulatory year) giving an indication of how the Distribution Network Service Provider expects prices to change over the regulatory control period and the reasons for the expected changes.
(b) The information for a particular regulatory year must, if practicable, be posted on the website 20 business days before the commencement of the relevant regulatory year and, if that is not practicable, as soon as practicable thereafter.
The information on tariffs and tariff classes contained in the following sections of this Pricing Proposal has been prepared and published in conformity with the requirements of this clause.
SA Power Networks
Pricing Proposal 10 29/04/2013
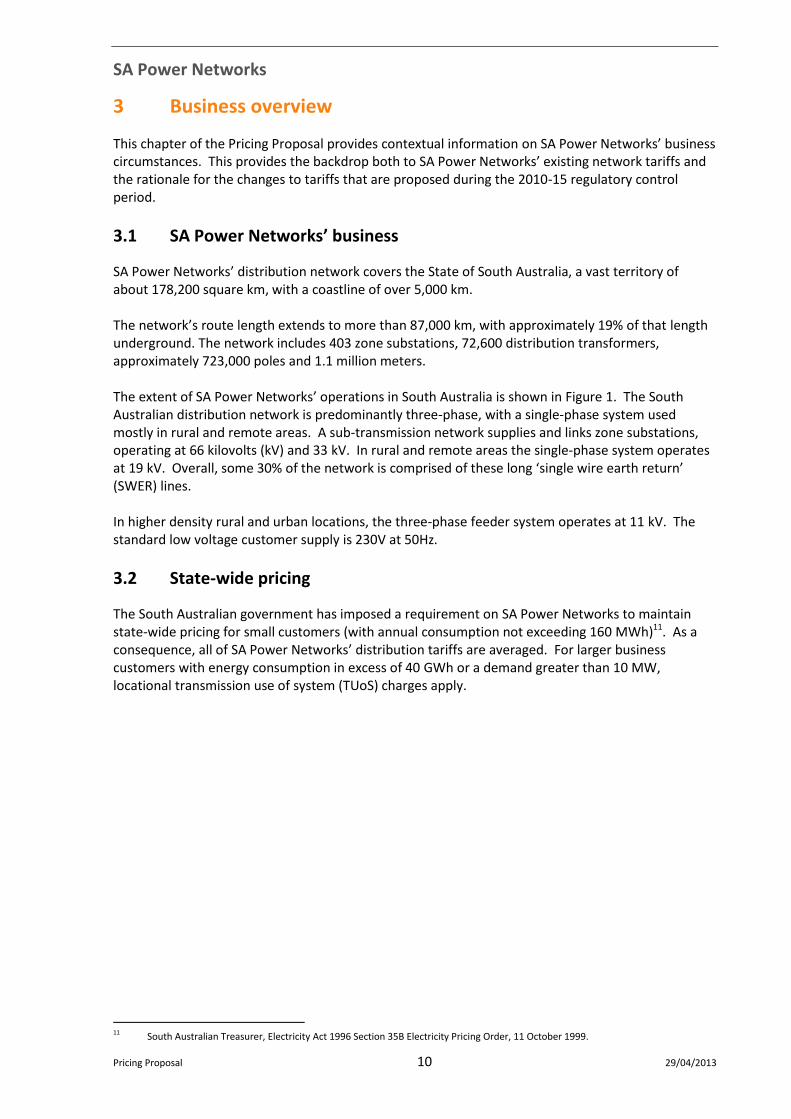
3 Business overview
This chapter of the Pricing Proposal provides contextual information on SA Power Networks’ business circumstances. This provides the backdrop both to SA Power Networks’ existing network tariffs and the rationale for the changes to tariffs that are proposed during the 2010-15 regulatory control period.
3.1 SA Power Networks’ business
SA Power Networks’ distribution network covers the State of South Australia, a vast territory of about 178,200 square km, with a coastline of over 5,000 km. The network’s route length extends to more than 87,000 km, with approximately 19% of that length underground. The network includes 403 zone substations, 72,600 distribution transformers, approximately 723,000 poles and 1.1 million meters. The extent of SA Power Networks’ operations in South Australia is shown in Figure 1. The South Australian distribution network is predominantly three-phase, with a single-phase system used mostly in rural and remote areas. A sub-transmission network supplies and links zone substations, operating at 66 kilovolts (kV) and 33 kV. In rural and remote areas the single-phase system operates at 19 kV. Overall, some 30% of the network is comprised of these long ‘single wire earth return’ (SWER) lines. In higher density rural and urban locations, the three-phase feeder system operates at 11 kV. The standard low voltage customer supply is 230V at 50Hz.
3.2 State-wide pricing
The South Australian government has imposed a requirement on SA Power Networks to maintain state-wide pricing for small customers (with annual consumption not exceeding 160 MWh)11. As a consequence, all of SA Power Networks’ distribution tariffs are averaged. For larger business customers with energy consumption in excess of 40 GWh or a demand greater than 10 MW, locational transmission use of system (TUoS) charges apply.
11 South Australian Treasurer, Electricity Act 1996 Section 35B Electricity Pricing Order, 11 October 1999.

SA Power Networks
Pricing Proposal 11 29/04/2013
3.3 Characteristics of the region
With the exception of much of the coastal area and the hinterland, South Australia is very sparsely settled. The area serviced by SA Power Networks’ distribution system is shown in Figure 1. Figure 1 - SA Power Networks’ service area
Approximately 70% of customers reside in Adelaide, including the great majority of business and commercial customers. However, the extensive area serviced by distribution means that 70% of the network infrastructure is required to deliver energy to the remaining 30% of customers. Compared with other states, there are relatively few regional centres, and they are generally small and located widely across the territory. As a result, the average customer density across the State is very low.
3.4 Climatic conditions
Adelaide and much of South Australia has a dry climate featuring greater extremes of summer temperature than most other Australian capitals. Extended periods of heatwave conditions can occur in summer (March 2008, January-February 2009 and November 2009 are recent examples of extended heatwaves). During these heatwave periods, summer daytime temperatures can exceed 40oC for several days in a row and overnight minimums can remain above 30oC for some of those days.

SA Power Networks
Pricing Proposal 12 29/04/2013
3.5 SA Power Networks’ customer and demand profile
The South Australian climate has led to lead to an extraordinary demand for air conditioning. Over 90% of homes are air conditioned with the air-conditioned floor space of these homes increasing each year. The consequent high peak network demand occurs for only a small part of the year. At other times in summer, milder weather often occurs which requires no air conditioning in most homes. Extremely ‘peaky’ conditions such as these heatwaves require network assets and capacity that is under-utilised during much of the year, driving distribution costs higher on a per unit of energy served basis than comparable interstate networks. These conditions also provide the impetus for SA Power Networks’ network tariff strategies and innovative tariff developments described in sections 5.4 to 5.8.

SA Power Networks
Pricing Proposal 13 29/04/2013
4 Tariff Classes
This section describes SA Power Networks’ standard control service tariff classes and the way in which they have been constituted to comply with the requirements of the Rules and the AER’s Determination. In the Appendix A of the Decision, AER has classified the following distribution services provided by SA Power Networks as standard control services12: A.1 ‘Standard’ network services
a. All network services except:
i. network services provided at the request of a distribution network user:
1. with higher quality or reliability standards, or lower quality or reliability standards (where permissible), than are required by the NER, the Electricity Distribution Code, or any other applicable regulatory instruments, or
2. in excess of levels of service or plant ratings required to be provided by SA Power Networks’ assets, or
ii. extension or augmentation of the distribution network associated with the provision of a new connection point or upgrading of the capability of a connection point to the extent that a distribution network user is required to make a financial contribution in accordance with the Electricity Distribution Code, or
iii. other network services that are classified as negotiated distribution services in sections B.7 to B.16 of this appendix B.
A.2 ‘Standard’ connection services
a. All connection services except:
i. connection services provided at the request of a distribution network user:
1. with higher quality or reliability standards, or lower quality or reliability standards (where permissible), than are required by the NER, the Electricity Distribution Code, or any other applicable regulatory instrument, or
2. in excess of levels of service or plant ratings required to be provided by SA Power Networks’ assets, or
ii. the provision of a new connection point or upgrading of the capability of a connection point to the extent a distribution network user is required to make a financial contribution in accordance with the Electricity Distribution Code, or
iii. other connection services that are classified as negotiated distribution services in sections B.7 to B.16 of this appendix B.
A.3 Fixed’ ‘standard’ ‘small’ customer metering services
a. The provision of energy data services in respect of meters meeting the requirements of a metering installation type 6 except the quarterly meter read service.
12 AER, Final Decision - South Australia distribution determination 2010–11 to 2014–15, May 2010, pp. 280-281.

SA Power Networks
Pricing Proposal 14 29/04/2013
A.4 Unmetered metering services
a. The provision of metering services in respect of meters meeting the requirements of a metering installation type 7.
This section of the Pricing Proposal sets out SA Power Networks’ approach to the pricing of these standard control services and demonstrates compliance with the Rules and the AER’s determination. The equivalent information for the separate tariff class associated with SA Power Networks’ alternative control metering services is included in this Pricing Proposal in Chapter 11.
4.1 Regulatory requirements
4.1.1 Rule requirements
SA Power Networks’ Pricing Proposal must contain the information on tariffs, tariff classes and charging parameters set out in clause 6.18.2 of the Rules. 6.18.2 Pricing proposals
(b) A pricing proposal must:
(1) set out the tariff classes that are to apply for the relevant regulatory year; and
(2) set out the proposed tariffs for each tariff class; and
(3) set out, for each proposed tariff, the charging parameters and the elements of service to which each charging parameter relates;
SA Power Networks is required to comply with the following requirements of clause 6.18.3 of the Rules with respect to tariff classes. 6.18.3 Tariff classes
(a) A pricing proposal must define the tariff classes into which customers for direct control services are divided.
(b) Each customer for direct control services must be a member of 1 or more tariff classes.
(c) Separate tariff classes must be constituted for customers to whom standard control services are supplied and customers to whom alternative control services are supplied (but a customer for both standard control services and alternative control services may be a member of 2 or more tariff classes).
(d) A tariff class must be constituted with regard to:
(1) the need to group customers together on an economically efficient basis; and
(2) the need to avoid unnecessary transaction costs.
4.1.2 Requirements of the AER’s Decision
The AER accepted SA Power Networks’ proposal that standard control services customer tariffs would be classified into four tariff classes13. The AER has established procedures for assigning or reassigning customers to tariff classes in Appendix B of its Decision. At the commencement of the regulatory control period, all existing
13 AER, Final Decision, May 2010, p. 23.

SA Power Networks
Pricing Proposal 15 29/04/2013
customers were assigned to the tariff class that SA Power Networks had assigned prior to 1 July 201014. Appendix B of the AER’s Decision contains procedures for the reassigning of customers to tariff classes, with which SA Power Networks must comply during the 2010-15 regulatory control period. These procedures are set out in section 11.1.2.
14 AER, Final Decision, May 2010, p. 287.

SA Power Networks
Pricing Proposal 16 29/04/2013
4.2 Standard control service tariffs and tariff classes
SA Power Networks’ network use of system tariffs are an aggregation of distribution use of system tariffs, metering service tariffs and transmission cost recovery tariffs. The components of these tariffs are illustrated in Figure 2. Figure 2 - Components of SA Power Networks network tariffs
Retailers may pass through the components of SA Power Networks’ network tariffs to customers directly, or modify their structure by bundling with the retail component, which includes the cost of purchasing generated energy from the NEM and retail costs. This section outlines the distribution tariff arrangements, which are designed to recover the cost of providing prescribed control services to customers. These services are segregated into tariffs and tariff classes, which cover all of direct control services that SA Power Networks provides, as required by clauses 6.18.3(a) and 6.18.3(b). Section 12 of this Pricing Proposal outlines the arrangements for SA Power Networks’ alternative control metering service tariffs, which in accordance with clause 6.18.3(c) of the Rules has been constituted as a separate tariff class with separate charging parameters. The transmission cost recovery section 9 describes how the transmission costs incurred by SA Power Networks are recovered from customers, again with separate charging parameters.
The process by which SA Power Networks recovers the SA Government FiT payments through the PV JSA is described in section 10. This is applied as a percentage uplift to the DUoS charge. The grouping of customers into standard control service tariffs has historically distinguished between customers on the basis of the following factors:
The nature and extent of usage of different types of customer;
For business customers, nature of connection to the network, including the capacity and location or voltage of connection;
Whether the customer opts to have quarterly or monthly billing;
SA Power Networks
Pricing Proposal 17 29/04/2013
Whether the customer also receives a controlled load service; and
The type of meter installed at the premises, with a distinction between Types 1-4 metering and Types 5-6 metering.
It should be noted that SA Power Networks uses net metering for all customer billing and does not distinguish between customers with micro-generation and those without, in either the network tariff or network tariff class. An important consideration in establishing this set of tariff classes in 2010 was to reduce the complexity of the overall arrangement by grouping customer tariffs with a similar connection and usage profile together on an economically efficient basis and thereby avoiding unnecessary transaction costs. Thus, for example, there are six tariffs for the primary supply to residential customers, all of which have identical charging parameters and price levels. Clearly, in establishing tariff classes that are to be used for the purpose of monitoring pricing compliance, it is desirable and appropriate that similar individual tariffs should be grouped together. This is particularly the case for some business tariffs, where one or a few large customers would dominate the class and the side constraint would not apply to a tariff class but those large customers. SA Power Networks’ network tariffs and tariff classes for 2013/14 are shown in Figure 3 below. The tariff classes have been constituted with regard to the provisions of clause 6.18.3(d) of the Rules concerning economic efficiency and transaction costs. As is apparent from the diagram, the suite of tariffs provides:
A range of tariffs which are dependent upon a customer’s size, consumption characteristics and voltage of connection (these factors are generally related); and
A level of sophistication in the pricing and billing, in some cases facilitated by the metering arrangements.
A number of obsolete tariffs (principally business kW demand tariffs) existed at the time of the AER’s 2010 determination. Subsequently, all customers were transferred from those tariffs by the commencement of the 2010/11 year.
SA Power Networks
Pricing Proposal 18 29/04/2013
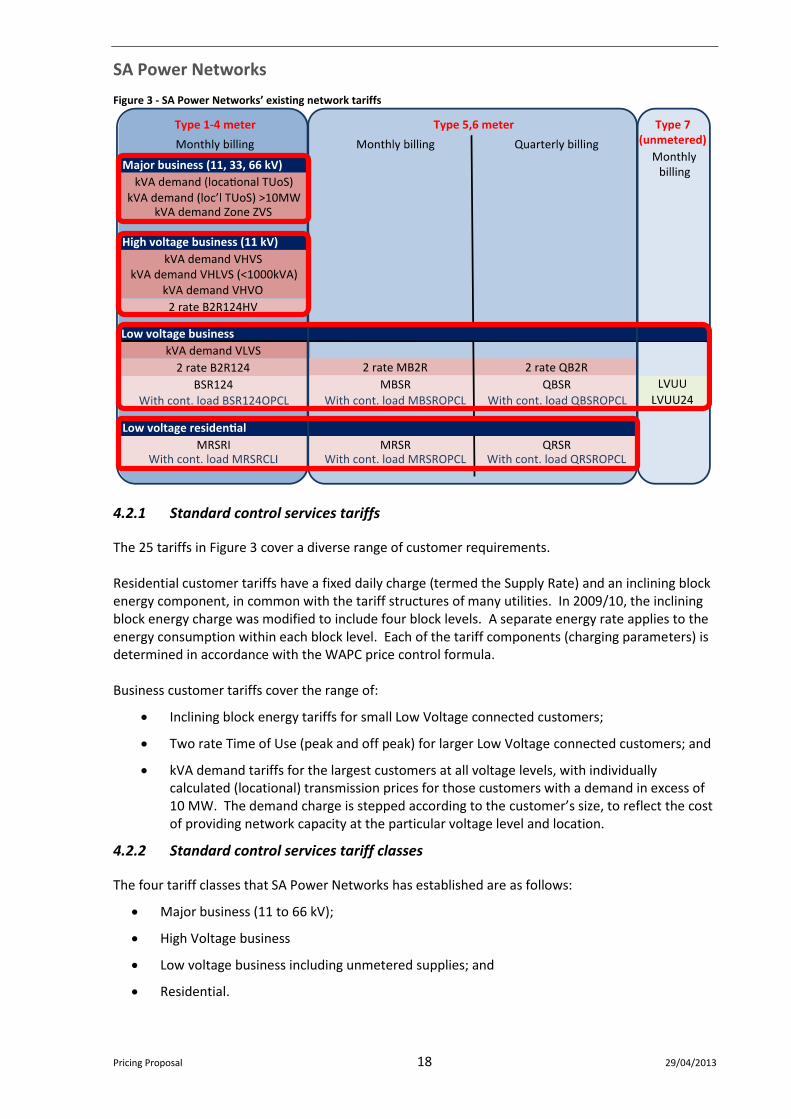
Figure 3 - SA Power Networks’ existing network tariffs
4.2.1 Standard control services tariffs
The 25 tariffs in Figure 3 cover a diverse range of customer requirements. Residential customer tariffs have a fixed daily charge (termed the Supply Rate) and an inclining block energy component, in common with the tariff structures of many utilities. In 2009/10, the inclining block energy charge was modified to include four block levels. A separate energy rate applies to the energy consumption within each block level. Each of the tariff components (charging parameters) is determined in accordance with the WAPC price control formula. Business customer tariffs cover the range of:
Inclining block energy tariffs for small Low Voltage connected customers;
Two rate Time of Use (peak and off peak) for larger Low Voltage connected customers; and
kVA demand tariffs for the largest customers at all voltage levels, with individually calculated (locational) transmission prices for those customers with a demand in excess of 10 MW. The demand charge is stepped according to the customer’s size, to reflect the cost of providing network capacity at the particular voltage level and location.
4.2.2 Standard control services tariff classes
The four tariff classes that SA Power Networks has established are as follows:
Major business (11 to 66 kV);
High Voltage business
Low voltage business including unmetered supplies; and
Residential.

SA Power Networks
Pricing Proposal 19 29/04/2013
SA Power Networks has illustrated the grouping of its individual tariffs into tariff classes in Figure 3 using red outlines. A description of the tariffs in each of the tariff classes and their charging parameters follows. More detailed information on the application of the tariffs is available from SA Power Networks’ web site. This section does not describe the range of obsolete tariffs. Note that, for completeness, those components of charging parameters associated with transmission recovery tariffs and alternative control services have been shown in the following section.
4.3 Low voltage residential tariff class
This tariff class includes the residential single rate and controlled load tariffs.
4.3.1 Low voltage residential single rate tariff
The low voltage residential single rate tariff is available to eligible residential customers taking supply at less than 1 kV. These customers ordinarily use a type 1-6 NEM compliant meter and metered energy consumption is charged in four blocks. The low voltage residential single rate tariff incorporates the charging parameters set out in Table 4. Table 4 - Low voltage residential tariff single rate charging parameters
Charging
Parameter
Units Element of service
Direct control
Transmission recovery
Jurisdictional Scheme Amount
Alternative control
Description
DUoS TUoS Metering
Supply Rate $/day X - X If applicable
Fixed daily charge
Block 1 Usage Rate
$/kWh X X X - For consumption up to and including 333.3 kWh/month
Block 2 Usage Rate
$/kWh X X X - For the next 500 kWh/month
Block 3 Usage Rate
$/kWh X X X - For the next 833.3 kWh/month
Block 4 Usage Rate
$/kWh X X X - For the balance of consumption
A negotiated service charge will apply where SA Power Networks is required to read the type 1-4 meter (eg. for tier one customers and for tier two customers < 160MWh pa). This tariff is invoiced monthly or quarterly. A negotiated distribution service charge also applies for the monthly reading of Type 5-6 meters.
4.3.2 Controlled load tariff
The low voltage controlled load tariff is available for permanently installed storage water heaters with a rated delivery of not less than 125 litres, storage space heaters and other approved applications. A time switch for the control of the heater and separate metering is installed.
SA Power Networks
Pricing Proposal 20 29/04/2013
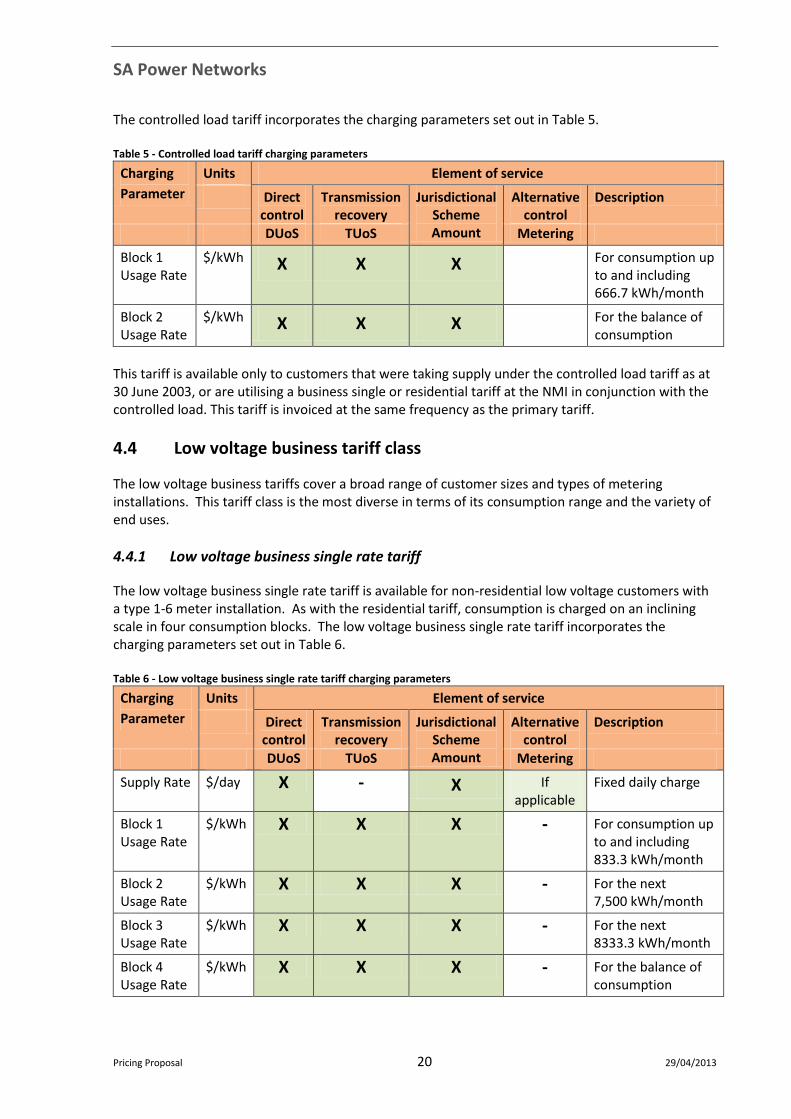
The controlled load tariff incorporates the charging parameters set out in Table 5. Table 5 - Controlled load tariff charging parameters
Charging
Parameter
Units Element of service
Direct control
Transmission recovery
Jurisdictional Scheme Amount
Alternative control
Description
DUoS TUoS Metering
Block 1 Usage Rate
$/kWh X X X For consumption up to and including 666.7 kWh/month
Block 2 Usage Rate
$/kWh X X X For the balance of consumption
This tariff is available only to customers that were taking supply under the controlled load tariff as at 30 June 2003, or are utilising a business single or residential tariff at the NMI in conjunction with the controlled load. This tariff is invoiced at the same frequency as the primary tariff.
4.4 Low voltage business tariff class
The low voltage business tariffs cover a broad range of customer sizes and types of metering installations. This tariff class is the most diverse in terms of its consumption range and the variety of end uses.
4.4.1 Low voltage business single rate tariff
The low voltage business single rate tariff is available for non-residential low voltage customers with a type 1-6 meter installation. As with the residential tariff, consumption is charged on an inclining scale in four consumption blocks. The low voltage business single rate tariff incorporates the charging parameters set out in Table 6. Table 6 - Low voltage business single rate tariff charging parameters
Charging
Parameter
Units Element of service
Direct control
Transmission recovery
Jurisdictional Scheme Amount
Alternative control
Description
DUoS TUoS Metering
Supply Rate $/day X - X If applicable
Fixed daily charge
Block 1 Usage Rate
$/kWh X X X - For consumption up to and including 833.3 kWh/month
Block 2 Usage Rate
$/kWh X X X - For the next 7,500 kWh/month
Block 3 Usage Rate
$/kWh X X X - For the next 8333.3 kWh/month
Block 4 Usage Rate
$/kWh X X X - For the balance of consumption
SA Power Networks
Pricing Proposal 21 29/04/2013
A negotiated service charge applies where SA Power Networks is required to read the Type 1-4 meter (eg. for tier one customers and for tier two customers < 160MWh pa). A negotiated charge also applies for the monthly reading of Type 5-6 meters. This tariff is invoiced monthly or quarterly.
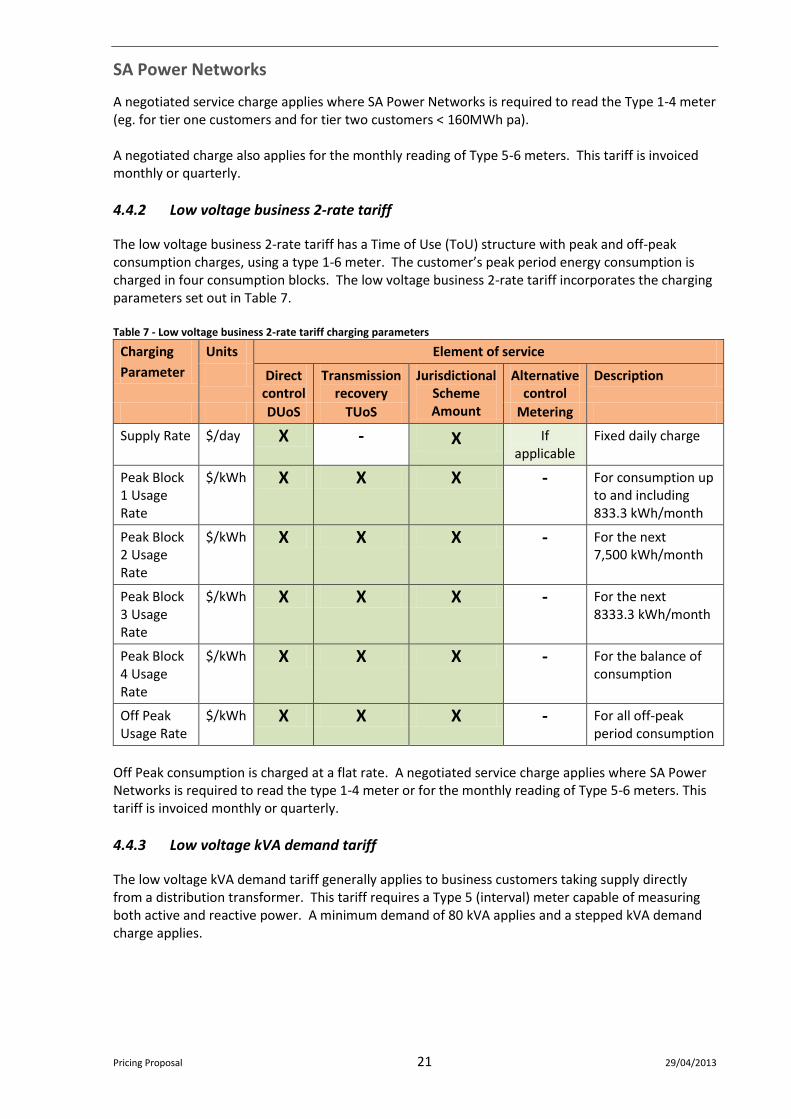
4.4.2 Low voltage business 2-rate tariff
The low voltage business 2-rate tariff has a Time of Use (ToU) structure with peak and off-peak consumption charges, using a type 1-6 meter. The customer’s peak period energy consumption is charged in four consumption blocks. The low voltage business 2-rate tariff incorporates the charging parameters set out in Table 7. Table 7 - Low voltage business 2-rate tariff charging parameters
Charging
Parameter
Units Element of service
Direct control
Transmission recovery
Jurisdictional Scheme Amount
Alternative control
Description
DUoS TUoS Metering
Supply Rate $/day X - X If applicable
Fixed daily charge
Peak Block 1 Usage Rate
$/kWh X X X - For consumption up to and including 833.3 kWh/month
Peak Block 2 Usage Rate
$/kWh X X X - For the next 7,500 kWh/month
Peak Block 3 Usage Rate
$/kWh X X X - For the next 8333.3 kWh/month
Peak Block 4 Usage Rate
$/kWh X X X - For the balance of consumption
Off Peak Usage Rate
$/kWh X X X - For all off-peak period consumption
Off Peak consumption is charged at a flat rate. A negotiated service charge applies where SA Power Networks is required to read the type 1-4 meter or for the monthly reading of Type 5-6 meters. This tariff is invoiced monthly or quarterly.
4.4.3 Low voltage kVA demand tariff
The low voltage kVA demand tariff generally applies to business customers taking supply directly from a distribution transformer. This tariff requires a Type 5 (interval) meter capable of measuring both active and reactive power. A minimum demand of 80 kVA applies and a stepped kVA demand charge applies.

SA Power Networks
Pricing Proposal 22 29/04/2013
As with the business 2-rate tariff, the energy consumption of these customers has ToU peak and off-peak consumption charges. The low voltage kVA demand tariff incorporates the charging parameters set out in Table 8. Table 8 - Low voltage kVA demand tariff charging parameters
Charging
Parameter
Units Element of service
Direct control
Transmission recovery
Jurisdictional Scheme Amount
Alternative control
Description
DUoS TUoS Metering
Supply Rate $/day X - X If applicable
Fixed daily charge
Annual Block 1 Demand Rate
$/kVA /mth
X X X - For peak demand up to and including 100 kVA
Annual Block 2 Demand Rate
$/kVA /mth
X X X - For the next 150 kVA
Annual Block 3 Demand Rate
$/kVA /mth
X X X - For the next 750 kVA
Annual Block 4 Demand Rate
$/kVA /mth
X X X - For the balance of kVA demand
Additional demand
$/kVA /mth
X - X - Demand in excess of that required during summer peak hours.
Peak Usage Rate
$/kWh X X X - For all peak period energy consumption
Off Peak Usage Rate
$/kWh X X X - For all off-peak period energy consumption
A negotiated service charge applies for the monthly reading of Type 5 meters. These tariffs are invoiced monthly.
4.4.4 Unmetered supply tariffs
Unmetered supply tariffs are applicable to supply points that are not metered. Energy consumption is calculated using the appropriate algorithm in the applicable Metrology Procedure. Unmetered tariffs comprise of an energy rate that is applied to the calculated electricity consumption. There are two unmetered supply tariffs that are assigned by SA Power Networks, depending upon the customer’s consumption profile:
Unmetered Overnight Usage supply is for overnight use for public lighting.
Unmetered 24 Hour Usage supply is for constant 24 hour per day use, typically public phones, traffic lights and telecommunications installations.
SA Power Networks
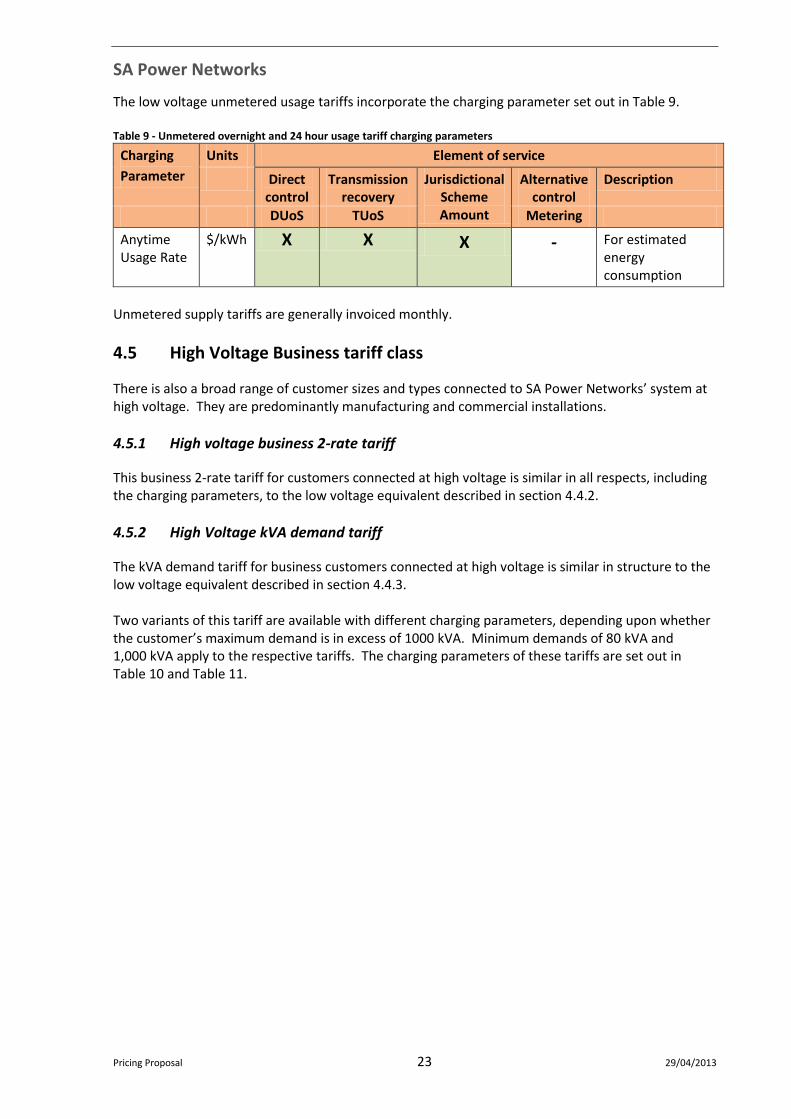
Pricing Proposal 23 29/04/2013
The low voltage unmetered usage tariffs incorporate the charging parameter set out in Table 9. Table 9 - Unmetered overnight and 24 hour usage tariff charging parameters
Charging
Parameter
Units Element of service
Direct control
Transmission recovery
Jurisdictional Scheme Amount
Alternative control
Description
DUoS TUoS Metering
Anytime Usage Rate
$/kWh X X X - For estimated energy consumption
Unmetered supply tariffs are generally invoiced monthly.
4.5 High Voltage Business tariff class
There is also a broad range of customer sizes and types connected to SA Power Networks’ system at high voltage. They are predominantly manufacturing and commercial installations.
4.5.1 High voltage business 2-rate tariff
This business 2-rate tariff for customers connected at high voltage is similar in all respects, including the charging parameters, to the low voltage equivalent described in section 4.4.2.
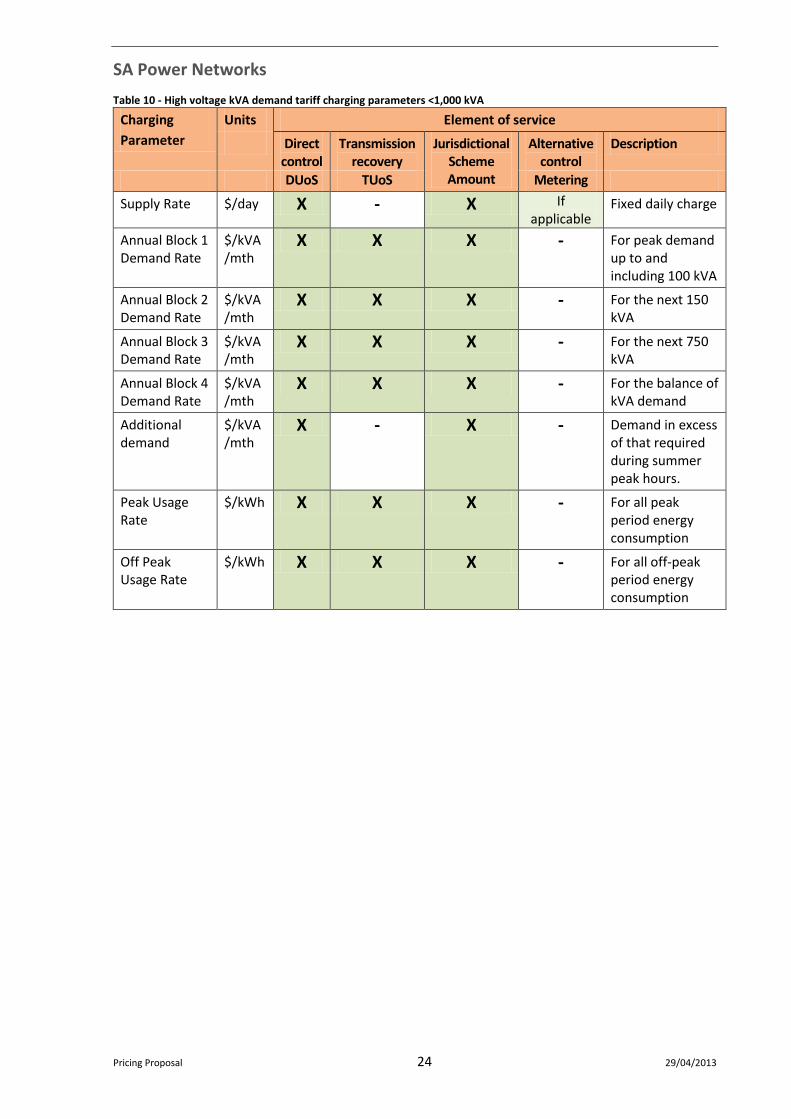
4.5.2 High Voltage kVA demand tariff
The kVA demand tariff for business customers connected at high voltage is similar in structure to the low voltage equivalent described in section 4.4.3. Two variants of this tariff are available with different charging parameters, depending upon whether the customer’s maximum demand is in excess of 1000 kVA. Minimum demands of 80 kVA and 1,000 kVA apply to the respective tariffs. The charging parameters of these tariffs are set out in Table 10 and Table 11.
SA Power Networks
Pricing Proposal 24 29/04/2013
Table 10 - High voltage kVA demand tariff charging parameters <1,000 kVA
Charging
Parameter
Units Element of service
Direct control
Transmission recovery
Jurisdictional Scheme Amount
Alternative control
Description
DUoS TUoS Metering
Supply Rate $/day X - X If applicable
Fixed daily charge
Annual Block 1 Demand Rate
$/kVA /mth
X X X - For peak demand up to and including 100 kVA
Annual Block 2 Demand Rate
$/kVA /mth
X X X - For the next 150 kVA
Annual Block 3 Demand Rate
$/kVA /mth
X X X - For the next 750 kVA
Annual Block 4 Demand Rate
$/kVA /mth
X X X - For the balance of kVA demand
Additional demand
$/kVA /mth
X - X - Demand in excess of that required during summer peak hours.
Peak Usage Rate
$/kWh X X X - For all peak period energy consumption
Off Peak Usage Rate
$/kWh X X X - For all off-peak period energy consumption
SA Power Networks
Pricing Proposal 25 29/04/2013
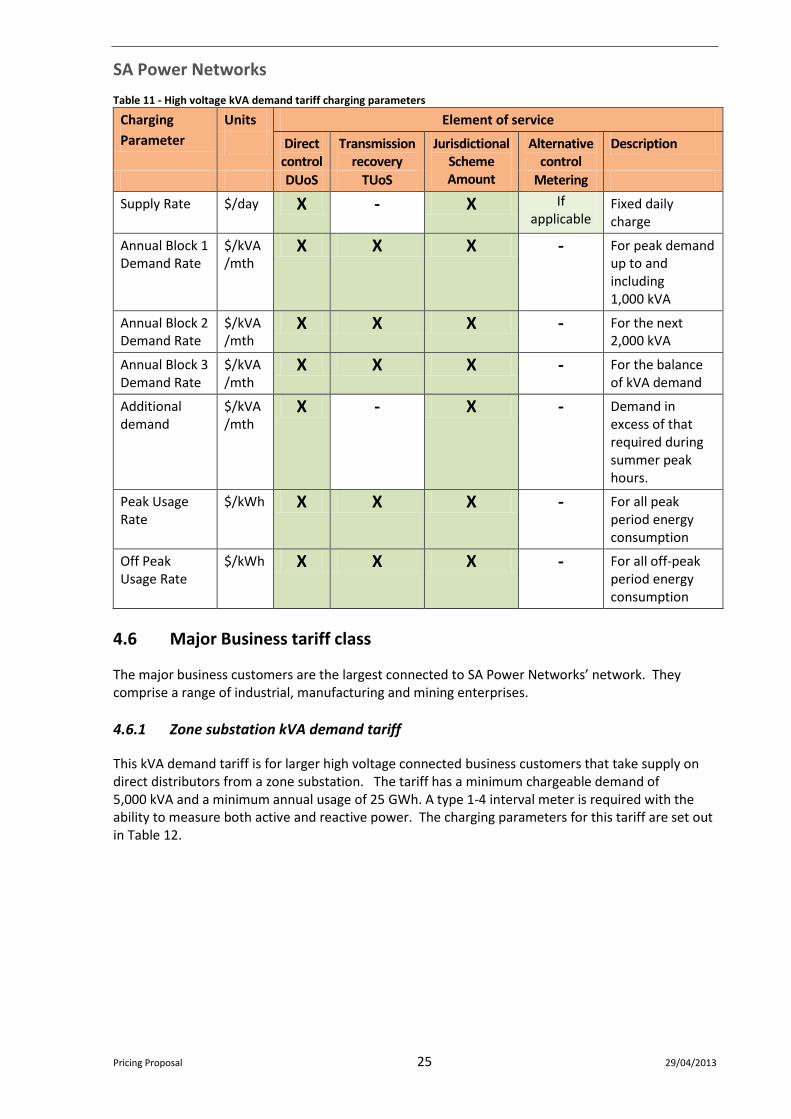
Table 11 - High voltage kVA demand tariff charging parameters
Charging
Parameter
Units Element of service
Direct control
Transmission recovery
Jurisdictional Scheme Amount
Alternative control
Description
DUoS TUoS Metering
Supply Rate $/day X - X If applicable
Fixed daily charge
Annual Block 1 Demand Rate
$/kVA /mth
X X X - For peak demand up to and including 1,000 kVA
Annual Block 2 Demand Rate
$/kVA /mth
X X X - For the next 2,000 kVA
Annual Block 3 Demand Rate
$/kVA /mth
X X X - For the balance of kVA demand
Additional demand
$/kVA /mth
X - X - Demand in excess of that required during summer peak hours.
Peak Usage Rate
$/kWh X X X - For all peak period energy consumption
Off Peak Usage Rate
$/kWh X X X - For all off-peak period energy consumption
4.6 Major Business tariff class
The major business customers are the largest connected to SA Power Networks’ network. They comprise a range of industrial, manufacturing and mining enterprises.
4.6.1 Zone substation kVA demand tariff
This kVA demand tariff is for larger high voltage connected business customers that take supply on direct distributors from a zone substation. The tariff has a minimum chargeable demand of 5,000 kVA and a minimum annual usage of 25 GWh. A type 1-4 interval meter is required with the ability to measure both active and reactive power. The charging parameters for this tariff are set out in Table 12.

SA Power Networks
Pricing Proposal 26 29/04/2013
Table 12 - Zone substation kVA demand tariff charging parameters
Charging
Parameter
Units Element of service
Direct control
Transmission recovery
Jurisdictional Scheme Amount
Alternative control
Description
DUoS TUoS Metering
Supply Rate $/day X - X If applicable
Fixed daily charge
Annual Block 3 Demand Rate
$/kVA /mth
X X X - For peak demand > 5,000 kVA
Additional demand
$/kVA /mth
X - X - Demand in excess of that required during summer peak hours.
Peak Usage Rate
$/kWh X X X - For all peak period energy consumption > 25 GWh p.a.
Off Peak Usage Rate
$/kWh X X X - For all off-peak period energy consumption
A negotiated service charge may apply for the monthly reading of Type 1-4 meters and the tariffs is invoiced monthly.
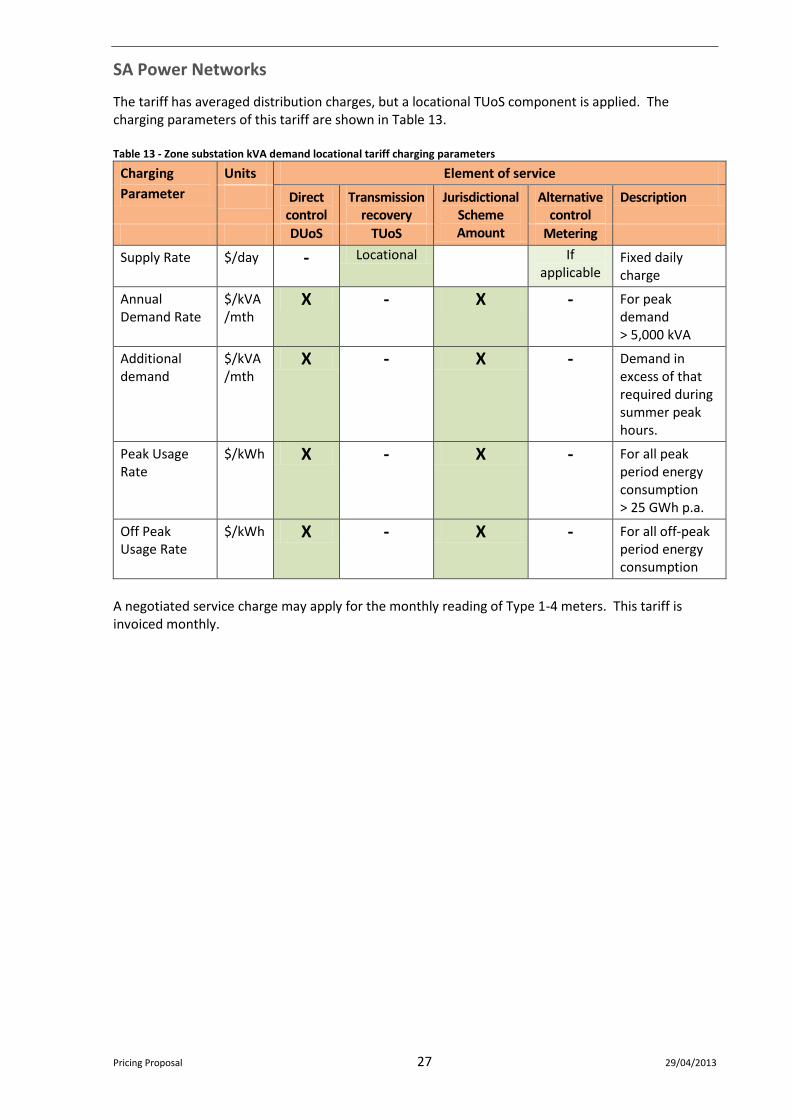
4.6.2 Zone substation kVA demand locational tariff
This kVA demand tariff is similar in structure to the high voltage zone substation kVA demand tariff described in section 4.6.1. It applies to those customers having a demand in excess of 10 MW or annual consumption greater than 40 GWh. A type 1-4 interval meter is required with the ability to measure both active and reactive power.
SA Power Networks
Pricing Proposal 27 29/04/2013
The tariff has averaged distribution charges, but a locational TUoS component is applied. The charging parameters of this tariff are shown in Table 13. Table 13 - Zone substation kVA demand locational tariff charging parameters
Charging
Parameter
Units Element of service
Direct control
Transmission recovery
Jurisdictional Scheme Amount
Alternative control
Description
DUoS TUoS Metering
Supply Rate $/day - Locational If applicable
Fixed daily charge
Annual Demand Rate
$/kVA /mth
X - X - For peak demand > 5,000 kVA
Additional demand
$/kVA /mth
X - X - Demand in excess of that required during summer peak hours.
Peak Usage Rate
$/kWh X - X - For all peak period energy consumption > 25 GWh p.a.
Off Peak Usage Rate
$/kWh X - X - For all off-peak period energy consumption
A negotiated service charge may apply for the monthly reading of Type 1-4 meters. This tariff is invoiced monthly.

SA Power Networks
Pricing Proposal 28 29/04/2013
4.6.3 Subtransmission kVA demand locational tariff
Subtransmission customers are connected to SA Power Networks’ network at 66 or 33 kV and have a minimum demand of 10 MW. The tariff for these customers is similar in structure to the high voltage zone substation kVA demand locational tariff and also has a locational TUoS component. The charging parameters for the tariff are set out in Table 14. Table 14 - Subtransmission kVA demand locational tariff charging parameters
Charging
Parameter
Units Element of service
Direct control
Transmission recovery
Jurisdictional Scheme Amount
Alternative control
Description
DUoS TUoS Metering
Supply Rate $/day - Locational If applicable
Fixed daily charge
Annual Demand Rate
$/kVA /mth
X - X - For peak demand > 10,000 kVA
Additional demand
$/kVA /mth
X - X - Demand in excess of that required during summer peak hours.
Peak Usage Rate
$/kWh X - X - For all peak period energy consumption
Off Peak Usage Rate
$/kWh X - X - For all off-peak period energy consumption
A negotiated service charge may also apply, for the monthly reading of Type 1-4 meters and the tariffs is invoiced monthly.

SA Power Networks
Pricing Proposal 29 29/04/2013
5 Network tariff strategy
This section contains the objectives that SA Power Networks applies to the development of its network tariffs. It goes on to outline the strategies SA Power Networks proposes to pursue in developing tariffs during the 2010-15 regulatory control period.
5.1 Regulatory Requirements
The information in this section concerning potential future network tariff developments is provided pursuant to clause 6.18.9 of the Rules.
6.18.9 Publication of information about tariffs and tariff classes
(a) A Distribution Network Service Provider must maintain on its website:
(3) a statement of expected price trends (to be updated for each regulatory year) giving an indication of how the Distribution Network Service Provider expects prices to change over the regulatory control period and the reasons for the expected changes.
5.2 Network tariff objectives
This section presents the high level framework that SA Power Networks applies to the development of its network tariff strategy. The major objectives of network pricing are to some extent conflicting and therefore involve making compromises. They are as follows:
Revenue sufficiency - prices are formulated to recover permitted weighted average prices under the determination.
Revenue volatility - to the extent possible, tariffs will be structured to minimise monthly and annual variations in revenue.
Pricing efficiency - through their variable components, prices will signal the economic cost of providing network service. Residual costs will be recovered in a manner which least distorts customers’ consumption decisions.
Customer equity - customers should pay a reasonable allocated share of costs and moves towards pricing cost reflectivity need to be tempered to limit their impact on some customers.
Pricing stability - to the extent possible undue variation in price levels should be avoided.
Pricing simplicity - price structures should be understandable, simple and transparent.
5.3 The need for tariff reform
As explained in section 3.5, to a greater extent than any other Australian distributor, SA Power Networks’ summer demand is sensitive to the effect of air conditioning demand. High summer peak demands occur during heat wave conditions, which correspond with periods when the elements of the system have least capacity and the power factor of loads is poor. Some 75% of the capital expenditure on SA Power Networks’ network in the 2010-15 regulatory control period is growth related. That is, the expenditure is driven by the need to augment and expand the network to adequately meet peak summer demand and provide for the connection of new customers.
SA Power Networks
Pricing Proposal 30 29/04/2013
As a consequence, the management of summer demand has a high priority in SA Power Networks’ tariff reform strategies. This leads to an emphasis on providing network price signals that will encourage both residential and business customers to manage their demand by the following means:
The price levels of existing tariff structures;
The development of more cost reflective tariff structures; and
The development of innovative new tariff structures.
5.4 Network tariff strategy
SA Power Networks has a pricing strategy that will, within the limitations of metering arrangements and efficient tariff structures, signal the costs associated with increased demand placed on the network, including the use of air conditioning. Consistent with the network tariff objectives outlined in section 5.2, SA Power Networks’ network tariff strategy aims to:
Attain revenue sufficiency under the Weighted Average Price Cap;
Signal the long run marginal cost of supply through its network tariffs;
Improve cost reflectivity and reduce revenue variability by reducing the reliance on usage based tariff components where appropriate;
Pass on the cost of ElectraNet’s transmission services to customers; and
Explore tariff based demand management opportunities, including voluntary capacity based tariffs. Sections 5.6 through 5.8 outline future tariff reform options under consideration and development.
5.5 Tariff reform 2005 to 2010
During the 2005-10 regulatory control period, SA Power Networks undertook a number of tariff reforms, including the following:
The restructuring of the single rate tariffs for residential and low voltage business tariffs to introduce a greater number of steps and progressively increasing consumption charges for the higher consumption blocks;
Businesses have been encouraged to adopt kVA demand price structures; and
Power factor correction for businesses has been facilitated through the use of an excluded/negotiated service charge for excess reactive power requirements.
5.6 Experimental tariff programs
Over the past few years, SA Power Networks has launched a number of pilot programs to better understand customer behaviour, facilitate improved pricing outcomes and development of new tariffs. SA Power Networks is constantly monitoring innovative tariffs around the world for ideas that may be suited for the South Australian circumstances. Promising new ideas will therefore be incorporated in the Pricing Strategy on an ongoing basis. The following are examples of innovative tariffs used in Australia and abroad that have been considered for a pilot within SA Power Networks:
Capacity Pricing – including the use of a capacity price component rather than relying principally on energy, for use by small customers;
SA Power Networks
Pricing Proposal 31 29/04/2013
Direct load control – where the DNSP can control appliances at the customer’s premises such as air conditioning to moderate the demand on the network; and
Voluntary load control – where the customer may be offered a discount or rebate in return for responding to the DNSP’s request to reduce their demand.
Of the available alternatives, SA Power Networks decided during 2012/13 to commence a small scale pilot of capacity pricing, for small customers equipped with interval meters. This ongoing trial includes incentives for the trial participants to manage their demand during summer in the afternoon/early evening when residential demands are at their highest. If the trial demonstrates the trialled tariff options to be effective in reducing peak network demand levels and/or growth, SA Power Networks may propose to introduce some form of capacity based tariff as an option for small customers within a few years. SA Power Networks is currently reviewing the performance of the trial, and may elect to have a small-scale small customer capacity tariff available for a limited number of customers during the 2013/14 summer. At this time, plans are not firm enough to be included in this Pricing Proposal. SA Power Networks will also be looking at options for increasing the application of demand tariffs with business customers. Currently, all existing business customers requiring more than 250 kVA must be on a demand tariff, as must all new customers requiring more than 80 kVA. For customers requiring between 80 kVA and 250 kVA, some are on the demand tariff and some are on an energy-usage tariff. Arrangements whereby those customers can move to a demand tariff will be considered over the next year. SA Power Networks will also be considering possible demand based options for business customers that require less than 80 kVA of capacity.
5.7 SA Power Networks’ demand management and intelligent network trials
SA Power Networks has embarked on the final stage of a large-scale demand management project in the suburb of North Adelaide, involving approximately 4,400 customers. The objective of this project is to further develop the direct load control programs pioneered in Glenelg and Mawson Lakes since 2006. These techniques have been coupled with a range of intelligent network solutions, using:
Network sensing devices;
Advanced metering infrastructure;
Air conditioning direct load control devices;
Wireless 4G communications and Home Area Network communications; and
Developing the associated back-office information systems.
The trial is designed to expand upon the prior programs by using more standard ‘off the shelf’ equipment and software and a roll-out approach more akin with that likely to be utilised in any future volume roll-out.
5.8 Future tariff reform options
SA Power Networks proposes to explore any benefits capable of being realised from continuing the network tariff reform process. Within the limitations of the AER’s DMIA provisions, SA Power Networks may obtain more first-hand information on customers’ usage of the network through trials and associated customer research.
SA Power Networks
Pricing Proposal 32 29/04/2013
The following network tariff reforms may be pursued by SA Power Networks during the remainder of the 2010-15 regulatory control period:
Improving the design of the ToU and demand tariffs, to enhance their cost reflectivity;
Strengthening the signal of the single-rate and peak-rate of business customer tariff’s inclining block structure as a ‘second best’ option to demand pricing, for those situations where interval meters are not available;
Continuing to assign more customers to network demand tariffs where it is economically efficient to do so; and
Exploring tariff based demand management opportunities, such as a capacity based tariff for small customers.
In relation to the reassignment of customers to individual tariffs within the tariff classes, SA Power Networks believes that it is appropriate to actively encourage and facilitate the development of more cost reflective distribution network tariffs. Such tariffs may well include those that are enabled by the use of developing technologies, such as:
Communications signalling and load management technologies; or
Remotely read interval meters.
SA Power Networks envisages that it may be seeking to implement the following tariff initiatives during the remainder of the 2010-15 determination:
Increasingly, interval meters are being chosen as an alternate meter for replacements and new connections. This would permit the introduction of more cost reflective capacity based prices for some small customers, including some residential customers. Such a tariff is the subject of the current small-scale pilot that commenced in 2012/13 described earlier.
In specific situations where network demand management is sought, SA Power Networks may offer voluntary tariffs from time to time and, should the customer or their retailer accept this offer, they would be reassigned to the new tariff.
These proposed initiatives are intended to improve the cost reflectivity of the existing tariffs and whilst involving the reassignment of customers to new tariffs, would not require their reassignment to a new or different tariff class.
5.9 Expected DUoS price trends 2010 - 2015
For tariffs in place at the commencement of the 2010-15 regulatory control period, SA Power Networks’ tariff strategy and its focus on managing demand leads to the indicative movement in tariff charging parameters summarised in Table 15. The actual price movements each year will remain subject to review at the time, following consideration of the objectives set out in section 5.2 of this Pricing Proposal.
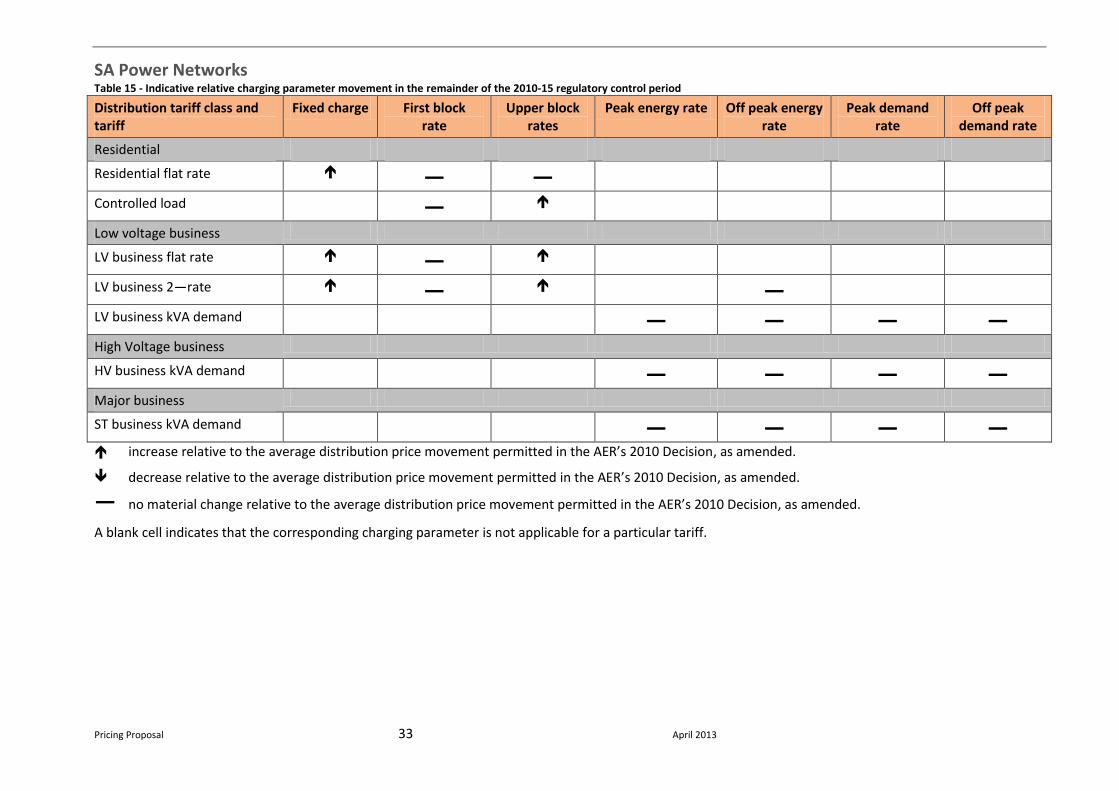
SA Power Networks
Pricing Proposal 33 April 2013
Table 15 - Indicative relative charging parameter movement in the remainder of the 2010-15 regulatory control period
Distribution tariff class and tariff
Fixed charge First block rate
Upper block rates
Peak energy rate Off peak energy rate
Peak demand rate
Off peak demand rate
Residential
Residential flat rate — —
Controlled load —
Low voltage business
LV business flat rate —
LV business 2—rate — —
LV business kVA demand — — — —
High Voltage business
HV business kVA demand — — — —
Major business
ST business kVA demand — — — —
increase relative to the average distribution price movement permitted in the AER’s 2010 Decision, as amended.
decrease relative to the average distribution price movement permitted in the AER’s 2010 Decision, as amended.
— no material change relative to the average distribution price movement permitted in the AER’s 2010 Decision, as amended.
A blank cell indicates that the corresponding charging parameter is not applicable for a particular tariff.

SA Power Networks
Pricing Proposal 34 April 2013
6 Standard control services tariffs
Within the framework of SA Power Networks’ longer term tariff strategy set out in chapter 5 of this Pricing Proposal, this section sets out the proposed rates for tariff charging components of standard control services for 2013/14 and provides a comparison with the rates in place during 2012/13. It should be noted that the information and comparisons in this section relate solely to SA Power Networks’ standard control services. NUoS charges to customers are bundled charges that contain:
SA Power Networks’ standard control services (DUoS);
Any applicable SA Power Networks’ alternate control services (metering);
Transmission cost recovery components (TUoS); and
PV JSA cost recovery components (PV JSA).
A discussion of customer impacts from all NUoS charges including the transmission cost recovery and PV JSA cost recovery is set out in chapter 7 of this Pricing Proposal.
6.1 Regulatory Requirements
The information in this section concerning the change in standard control service rates is provided pursuant to clause 6.18.9 of the Rules.
6.18.9 Publication of information about tariffs and tariff classes
(a) A Distribution Network Service Provider must maintain on its website:
(3) a statement of expected price trends (to be updated for each regulatory year) giving an indication of how the Distribution Network Service Provider expects prices to change over the regulatory control period and the reasons for the expected changes.
6.2 Tariff changes in 2013/14
The tariff changes in 2013/14 have been made within the overall tariff strategy for the 2010-15 regulatory control period set out in section 5. The distribution component of tariffs has generally increased by 12.2%, equivalent to a 3.8% increase in the average residential customer’s bill. The changes to the distribution tariffs in 2013/14 therefore comprise:
An increase in the small customer fixed charge of $7.32 pa, which is the maximum to the extent permitted by the $10 pa side constraint for small customers after allowing for a $2.68 pa metering charges increase;
An increase in the energy rates of the residential tariff first energy block of 13.7%. This ensures that, in conjunction with the fixed charge increase, that residential customers consuming 4 MWh pa and above incur the same average DUoS price increase as all other customers apart from those below 4 MWh; and
A uniform percentage increase to all other tariff rates of 12.3% including the other blocks of the residential tariff, the controlled load tariff, the unmetered tariff and the demand and energy rates of all of the business tariffs.

SA Power Networks
Pricing Proposal 35 29/04/2013
SA Power Networks expects to continue in 2014/15 with its tariff rebalancing objectives outlined in section 5, to achieve greater pricing cost reflectivity. The overall magnitude of price change is not expected to be as significant in 2014/15 (see section 7.2 below).
6.3 Calculation of network use of system tariffs
The following sections provide information on the DUoS component of SA Power Networks’ existing tariffs and the price movement proposed for 2012/13. The following Tables do not include the TUoS or PV JSA cost recovery components. It should be noted that this information is provided for the purpose of showing the relative change in the price of each tariff charging parameter. Compliance with clause 6.18.2(8) of the Rules, concerning the demonstration that price changes comply with the Rules and the AER’s Determination, is set out in Section 8 and Appendix G of this Pricing Proposal. All prices in the following sections are exclusive of GST and have been rounded.
6.4 Low Voltage Residential tariff class
6.4.1 Low voltage residential tariff
Table 16 contains the proposed 2013/14 prices for single rate residential customers. Table 16 - Proposed 2013/14 low voltage residential tariff single rate
6.4.2 Controlled load tariff
Table 17 contains the proposed 2013/14 prices for controlled load customers. Table 17 - Proposed 2013/14 controlled load tariff
Charging Parameter Units Existing Proposed Variance2012/13 2013/14
Supply Rate $ p.a. 94.43 101.74 7.31Block 1 Usage Rate ¢/kWh 8.135 9.247 1.112Block 2 Usage Rate ¢/kWh 10.726 12.049 1.323Block 3 Usage Rate ¢/kWh 12.760 14.334 1.574Block 4 Usage Rate ¢/kWh 12.760 14.334 1.574
Charging Parameter Units Existing Proposed Variance2012/13 2013/14
Block 1 Usage Rate ¢/kWh 3.133 3.519 0.386Block 2 Usage Rate ¢/kWh 4.253 4.778 0.460
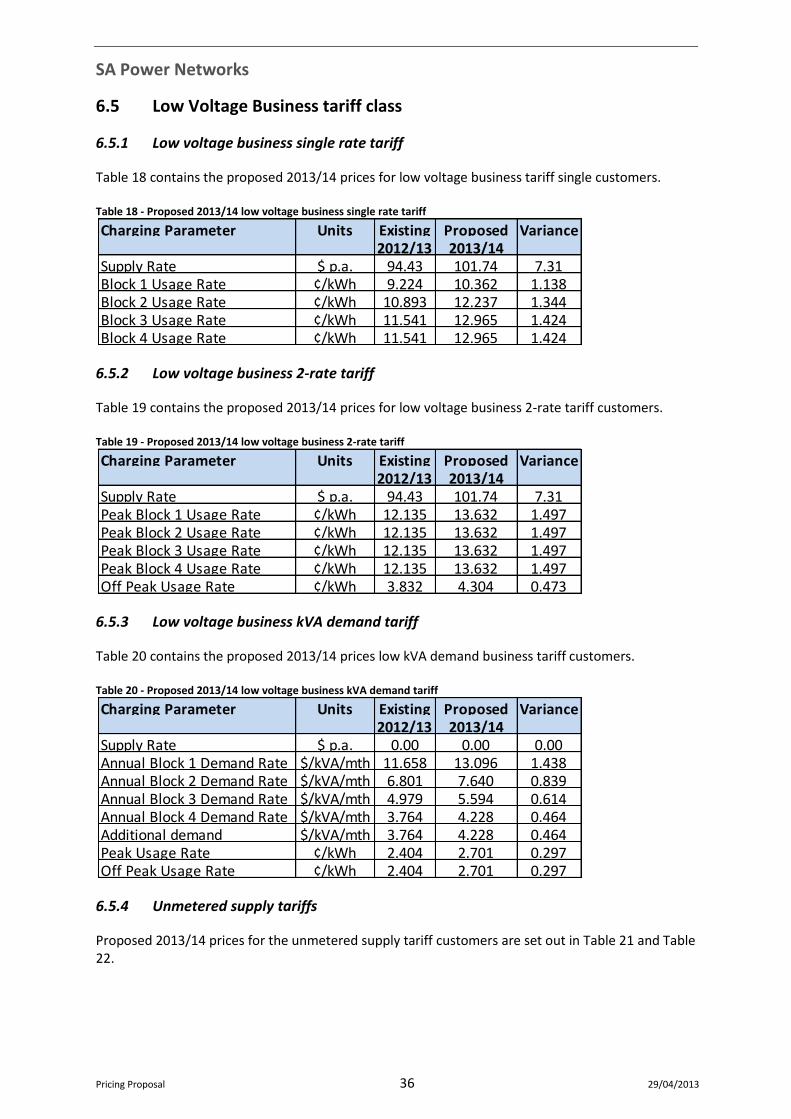
SA Power Networks
Pricing Proposal 36 29/04/2013
6.5 Low Voltage Business tariff class
6.5.1 Low voltage business single rate tariff
Table 18 contains the proposed 2013/14 prices for low voltage business tariff single customers. Table 18 - Proposed 2013/14 low voltage business single rate tariff
6.5.2 Low voltage business 2-rate tariff
Table 19 contains the proposed 2013/14 prices for low voltage business 2-rate tariff customers. Table 19 - Proposed 2013/14 low voltage business 2-rate tariff
6.5.3 Low voltage business kVA demand tariff
Table 20 contains the proposed 2013/14 prices low kVA demand business tariff customers. Table 20 - Proposed 2013/14 low voltage business kVA demand tariff
6.5.4 Unmetered supply tariffs
Proposed 2013/14 prices for the unmetered supply tariff customers are set out in Table 21 and Table 22.
Charging Parameter Units Existing Proposed Variance2012/13 2013/14
Supply Rate $ p.a. 94.43 101.74 7.31Block 1 Usage Rate ¢/kWh 9.224 10.362 1.138Block 2 Usage Rate ¢/kWh 10.893 12.237 1.344Block 3 Usage Rate ¢/kWh 11.541 12.965 1.424Block 4 Usage Rate ¢/kWh 11.541 12.965 1.424
Charging Parameter Units Existing Proposed Variance2012/13 2013/14
Supply Rate $ p.a. 94.43 101.74 7.31Peak Block 1 Usage Rate ¢/kWh 12.135 13.632 1.497Peak Block 2 Usage Rate ¢/kWh 12.135 13.632 1.497Peak Block 3 Usage Rate ¢/kWh 12.135 13.632 1.497Peak Block 4 Usage Rate ¢/kWh 12.135 13.632 1.497Off Peak Usage Rate ¢/kWh 3.832 4.304 0.473
Charging Parameter Units Existing Proposed Variance2012/13 2013/14
Supply Rate $ p.a. 0.00 0.00 0.00Annual Block 1 Demand Rate $/kVA/mth 11.658 13.096 1.438Annual Block 2 Demand Rate $/kVA/mth 6.801 7.640 0.839Annual Block 3 Demand Rate $/kVA/mth 4.979 5.594 0.614Annual Block 4 Demand Rate $/kVA/mth 3.764 4.228 0.464Additional demand $/kVA/mth 3.764 4.228 0.464Peak Usage Rate ¢/kWh 2.404 2.701 0.297Off Peak Usage Rate ¢/kWh 2.404 2.701 0.297
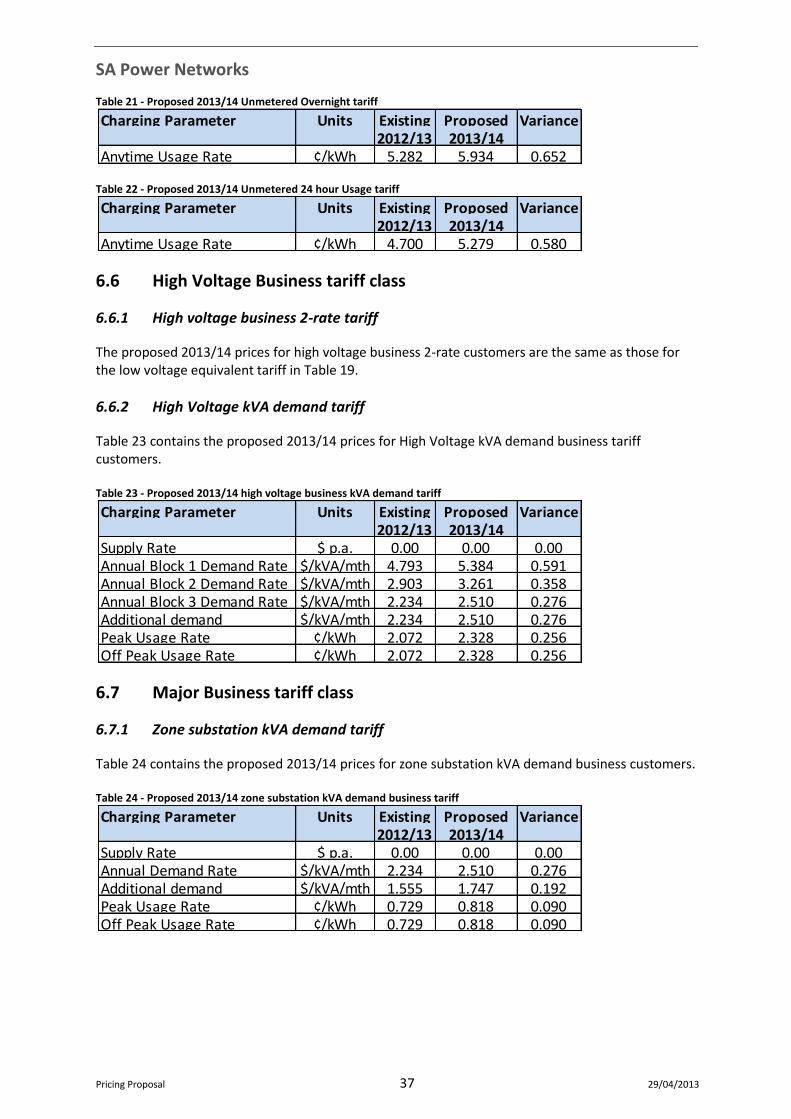
SA Power Networks
Pricing Proposal 37 29/04/2013
Table 21 - Proposed 2013/14 Unmetered Overnight tariff
Table 22 - Proposed 2013/14 Unmetered 24 hour Usage tariff
6.6 High Voltage Business tariff class
6.6.1 High voltage business 2-rate tariff
The proposed 2013/14 prices for high voltage business 2-rate customers are the same as those for the low voltage equivalent tariff in Table 19.
6.6.2 High Voltage kVA demand tariff
Table 23 contains the proposed 2013/14 prices for High Voltage kVA demand business tariff customers. Table 23 - Proposed 2013/14 high voltage business kVA demand tariff
6.7 Major Business tariff class
6.7.1 Zone substation kVA demand tariff
Table 24 contains the proposed 2013/14 prices for zone substation kVA demand business customers. Table 24 - Proposed 2013/14 zone substation kVA demand business tariff
Charging Parameter Units Existing Proposed Variance2012/13 2013/14
Anytime Usage Rate ¢/kWh 5.282 5.934 0.652
Charging Parameter Units Existing Proposed Variance2012/13 2013/14
Anytime Usage Rate ¢/kWh 4.700 5.279 0.580
Charging Parameter Units Existing Proposed Variance2012/13 2013/14
Supply Rate $ p.a. 0.00 0.00 0.00Annual Block 1 Demand Rate $/kVA/mth 4.793 5.384 0.591Annual Block 2 Demand Rate $/kVA/mth 2.903 3.261 0.358Annual Block 3 Demand Rate $/kVA/mth 2.234 2.510 0.276Additional demand $/kVA/mth 2.234 2.510 0.276Peak Usage Rate ¢/kWh 2.072 2.328 0.256Off Peak Usage Rate ¢/kWh 2.072 2.328 0.256
Charging Parameter Units Existing Proposed Variance2012/13 2013/14
Supply Rate $ p.a. 0.00 0.00 0.00Annual Demand Rate $/kVA/mth 2.234 2.510 0.276Additional demand $/kVA/mth 1.555 1.747 0.192Peak Usage Rate ¢/kWh 0.729 0.818 0.090Off Peak Usage Rate ¢/kWh 0.729 0.818 0.090
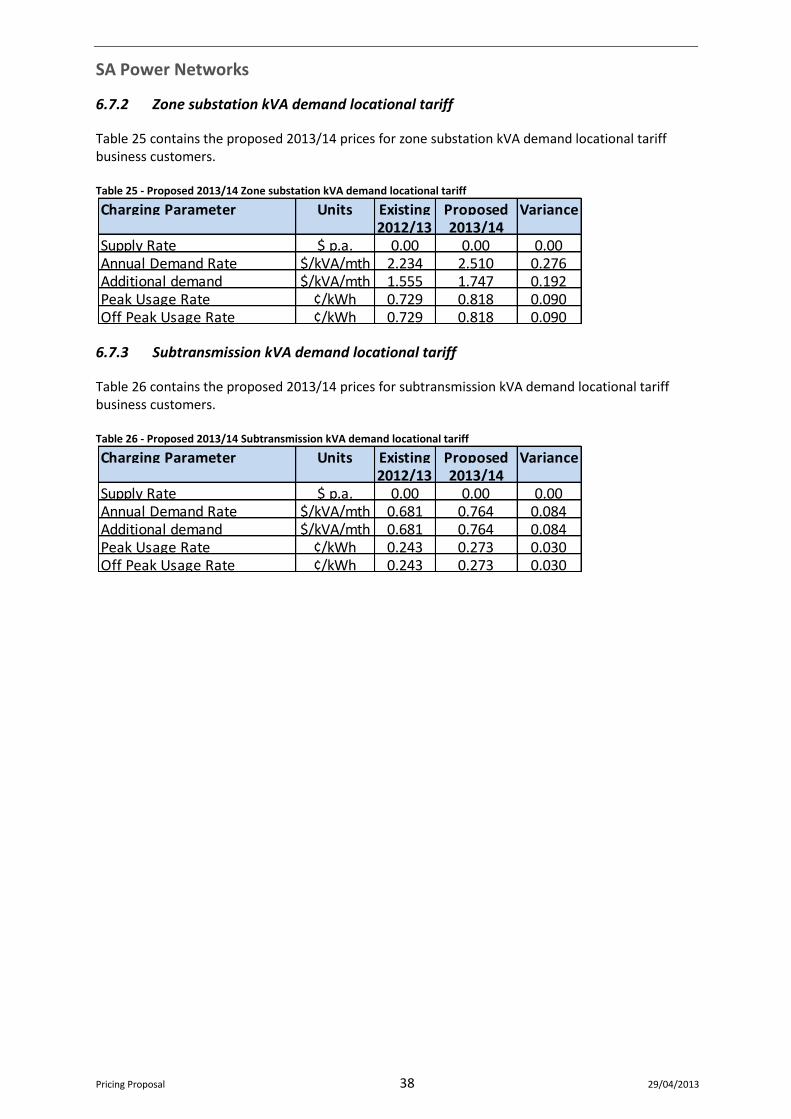
SA Power Networks
Pricing Proposal 38 29/04/2013
6.7.2 Zone substation kVA demand locational tariff
Table 25 contains the proposed 2013/14 prices for zone substation kVA demand locational tariff business customers. Table 25 - Proposed 2013/14 Zone substation kVA demand locational tariff
6.7.3 Subtransmission kVA demand locational tariff
Table 26 contains the proposed 2013/14 prices for subtransmission kVA demand locational tariff business customers. Table 26 - Proposed 2013/14 Subtransmission kVA demand locational tariff
Charging Parameter Units Existing Proposed Variance2012/13 2013/14
Supply Rate $ p.a. 0.00 0.00 0.00Annual Demand Rate $/kVA/mth 2.234 2.510 0.276Additional demand $/kVA/mth 1.555 1.747 0.192Peak Usage Rate ¢/kWh 0.729 0.818 0.090Off Peak Usage Rate ¢/kWh 0.729 0.818 0.090
Charging Parameter Units Existing Proposed Variance2012/13 2013/14
Supply Rate $ p.a. 0.00 0.00 0.00Annual Demand Rate $/kVA/mth 0.681 0.764 0.084Additional demand $/kVA/mth 0.681 0.764 0.084Peak Usage Rate ¢/kWh 0.243 0.273 0.030Off Peak Usage Rate ¢/kWh 0.243 0.273 0.030
SA Power Networks
Pricing Proposal 39 29/04/2013
7 Customer Impacts
In this chapter, customer impacts are calculated for the individual components and the total of the proposed bundled NUoS tariffs. The use of these network tariffs results in customer impacts that include the following components:
DUoS charges, for SA Power Networks’ standard control services;
Metering charges, for SA Power Networks’ alternative control services;
Transmission cost recovery tariffs, to recover costs associated with ElectraNet’s standard control services and avoided TUoS payments made by SA Power Networks to embedded generators; and
The PV Jurisdictional Scheme Amount, which recovers the cost of payments made by SA Power Networks for SA Government Feed-in Tariffs to customers with solar PV generators.
All of the customer impacts presented in this chapter are GST exclusive. This chapter provides an indication of how the price trends of tariff classes may be expected to change over the 2010-15 regulatory control period. The price changes for individual tariffs have been calculated on the basis of customer consumption volume levels, for the 12 months to March 2012.This will be a reasonable proxy for likely 2013/14 usage patterns. Where the number of customers on a tariff is sufficient, the distribution of price impacts has been presented. This chapter also sets out how SA Power Networks complies with the AER’s requirement for a system of tariff review, where the charge varies according to the usage or load profile of a customer.
7.1 Regulatory Requirements
7.1.1 Rules requirements
Rules clause 6.18.2 imposes a requirement for the Pricing Proposal to set out the nature of variations that may take place during 2013/14.
6.18.2 Pricing proposals
(b) A pricing proposal must:
(5) set out the nature of any variation or adjustment to the tariff that could occur during the course of the regulatory year and the basis on which it could occur;
Clause 6.18.9 requires the publication of price trends over the 2010-15 regulatory control period and the reasons for expected variations.
6.18.9 Publication of information about tariffs and tariff classes
(a) A Distribution Network Service Provider must maintain on its website:
(3) a statement of expected price trends (to be updated for each regulatory year) giving an indication of how the Distribution Network Service Provider expects prices to change over the regulatory control period and the reasons for the expected changes.
SA Power Networks
Pricing Proposal 40 29/04/2013
7.1.2 Requirements of the AER’s Decision
Appendix B of the AER’s Decision contains the following requirement based on clause 6.18.4(b) of the Rules, concerning the review of tariffs where the charge varies according to the usage or load profile of a customer15.
System of assessment and review of the basis on which a customer is charged 11. Where the charging parameters for a particular tariff result in a basis of charge that varies
according to the customer’s usage or load profile, SA Power Networks must set out in its pricing proposal a method of how it will review and assess the basis on which a customer is charged.
12. If the AER considers that the method provided under section 11 does not provide for an effective system of assessment and review of the basis on which a customer is charged, the AER may request additional information or request that SA Power Networks revise and resubmit a revised method.
13. If the AER considers the method provided in accordance with section 11 is reasonable it will approve that method by notice in writing to SA Power Networks.
7.2 Overall price trends during the 2010-15 regulatory control period
The expected overall price trends over the course of the determination are built up from the following components:
SA Power Networks’ distribution prices for standard control services, in accordance with the AER’s 2010 determination, as amended by the May 2011 decisions of the Australian Competition Tribunal in relation to the inclusion to easements in the regulatory asset base and the corporate taxation allowance described in section 2.3.3 and as further amended by the AER in February 2012 when the existing determination was revoked and substituted for feed-in tariff payments;
SA Power Networks’ prices for alternative control metering services, in accordance with the AER’s 2010 determination, as amended by the May 2011 decision of the Australian Competition Tribunal in relation to the corporate taxation allowance described in section 2.3.4;
Transmission related prices, determined from ElectraNet’s approved 2013/14 prices following their 2013 revenue cap determination. The 2014/15 price increases have been assumed at CPI+2.7%, in line with the AER’s reset decision; and
Forecasts for future period recovery of the SA Government PV FiT payments to qualifying generators under the JSO arrangement.
The projection for SA Power Networks’ charges only for the remainder of this 2010-15 regulatory period is shown below in Table 27. Charges may vary significantly in 2015/16 following the 2015-20 regulatory reset outcomes for SA Power Networks.
15 AER, Final Decision - South Australia distribution determination 2010–11 to 2014–15, May 2010, pp. 287.
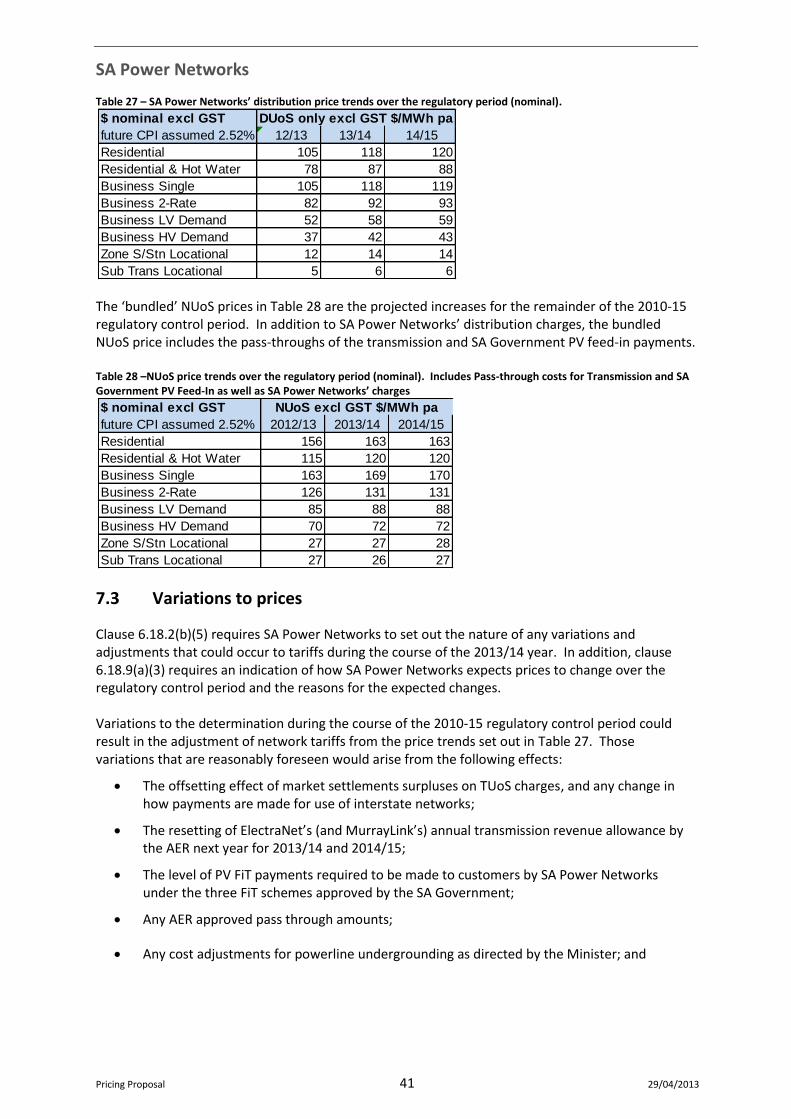
SA Power Networks
Pricing Proposal 41 29/04/2013
Table 27 – SA Power Networks’ distribution price trends over the regulatory period (nominal).
The ‘bundled’ NUoS prices in Table 28 are the projected increases for the remainder of the 2010-15 regulatory control period. In addition to SA Power Networks’ distribution charges, the bundled NUoS price includes the pass-throughs of the transmission and SA Government PV feed-in payments. Table 28 –NUoS price trends over the regulatory period (nominal). Includes Pass-through costs for Transmission and SA Government PV Feed-In as well as SA Power Networks’ charges
7.3 Variations to prices
Clause 6.18.2(b)(5) requires SA Power Networks to set out the nature of any variations and adjustments that could occur to tariffs during the course of the 2013/14 year. In addition, clause 6.18.9(a)(3) requires an indication of how SA Power Networks expects prices to change over the regulatory control period and the reasons for the expected changes. Variations to the determination during the course of the 2010-15 regulatory control period could result in the adjustment of network tariffs from the price trends set out in Table 27. Those variations that are reasonably foreseen would arise from the following effects:
The offsetting effect of market settlements surpluses on TUoS charges, and any change in how payments are made for use of interstate networks;
The resetting of ElectraNet’s (and MurrayLink’s) annual transmission revenue allowance by the AER next year for 2013/14 and 2014/15;
The level of PV FiT payments required to be made to customers by SA Power Networks under the three FiT schemes approved by the SA Government;
Any AER approved pass through amounts;
Any cost adjustments for powerline undergrounding as directed by the Minister; and
$ nominal excl GST
future CPI assumed 2.52% 12/13 13/14 14/15
Residential 105 118 120
Residential & Hot Water 78 87 88
Business Single 105 118 119
Business 2-Rate 82 92 93
Business LV Demand 52 58 59
Business HV Demand 37 42 43
Zone S/Stn Locational 12 14 14
Sub Trans Locational 5 6 6
DUoS only excl GST $/MWh pa
$ nominal excl GST
future CPI assumed 2.52% 2012/13 2013/14 2014/15
Residential 156 163 163
Residential & Hot Water 115 120 120
Business Single 163 169 170
Business 2-Rate 126 131 131
Business LV Demand 85 88 88
Business HV Demand 70 72 72
Zone S/Stn Locational 27 27 28
Sub Trans Locational 27 26 27
NUoS excl GST $/MWh pa
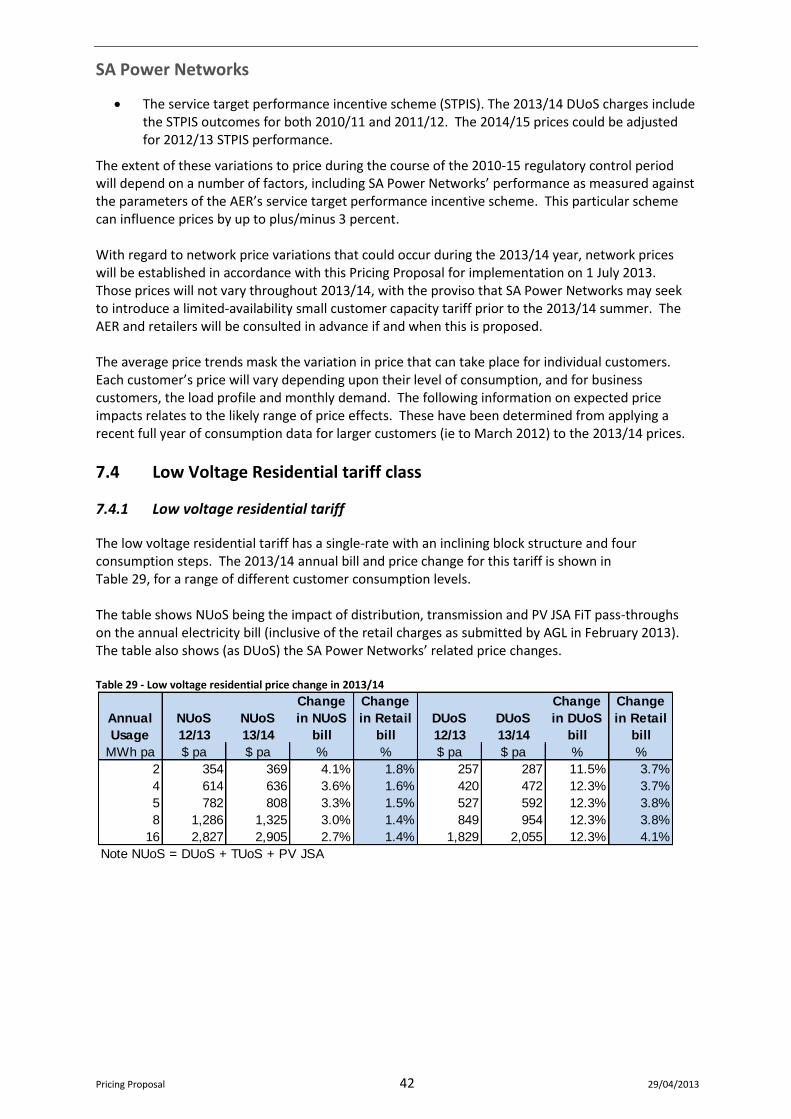
SA Power Networks
Pricing Proposal 42 29/04/2013
The service target performance incentive scheme (STPIS). The 2013/14 DUoS charges include the STPIS outcomes for both 2010/11 and 2011/12. The 2014/15 prices could be adjusted for 2012/13 STPIS performance.
The extent of these variations to price during the course of the 2010-15 regulatory control period will depend on a number of factors, including SA Power Networks’ performance as measured against the parameters of the AER’s service target performance incentive scheme. This particular scheme can influence prices by up to plus/minus 3 percent. With regard to network price variations that could occur during the 2013/14 year, network prices will be established in accordance with this Pricing Proposal for implementation on 1 July 2013. Those prices will not vary throughout 2013/14, with the proviso that SA Power Networks may seek to introduce a limited-availability small customer capacity tariff prior to the 2013/14 summer. The AER and retailers will be consulted in advance if and when this is proposed. The average price trends mask the variation in price that can take place for individual customers. Each customer’s price will vary depending upon their level of consumption, and for business customers, the load profile and monthly demand. The following information on expected price impacts relates to the likely range of price effects. These have been determined from applying a recent full year of consumption data for larger customers (ie to March 2012) to the 2013/14 prices.
7.4 Low Voltage Residential tariff class
7.4.1 Low voltage residential tariff
The low voltage residential tariff has a single-rate with an inclining block structure and four consumption steps. The 2013/14 annual bill and price change for this tariff is shown in Table 29, for a range of different customer consumption levels. The table shows NUoS being the impact of distribution, transmission and PV JSA FiT pass-throughs on the annual electricity bill (inclusive of the retail charges as submitted by AGL in February 2013). The table also shows (as DUoS) the SA Power Networks’ related price changes. Table 29 - Low voltage residential price change in 2013/14
Annual
Usage
NUoS
12/13
NUoS
13/14
Change
in NUoS
bill
Change
in Retail
bill
DUoS
12/13
DUoS
13/14
Change
in DUoS
bill
Change
in Retail
bill
MWh pa $ pa $ pa % % $ pa $ pa % %
2 354 369 4.1% 1.8% 257 287 11.5% 3.7%
4 614 636 3.6% 1.6% 420 472 12.3% 3.7%
5 782 808 3.3% 1.5% 527 592 12.3% 3.8%
8 1,286 1,325 3.0% 1.4% 849 954 12.3% 3.8%
16 2,827 2,905 2.7% 1.4% 1,829 2,055 12.3% 4.1%
Note NUoS = DUoS + TUoS + PV JSA
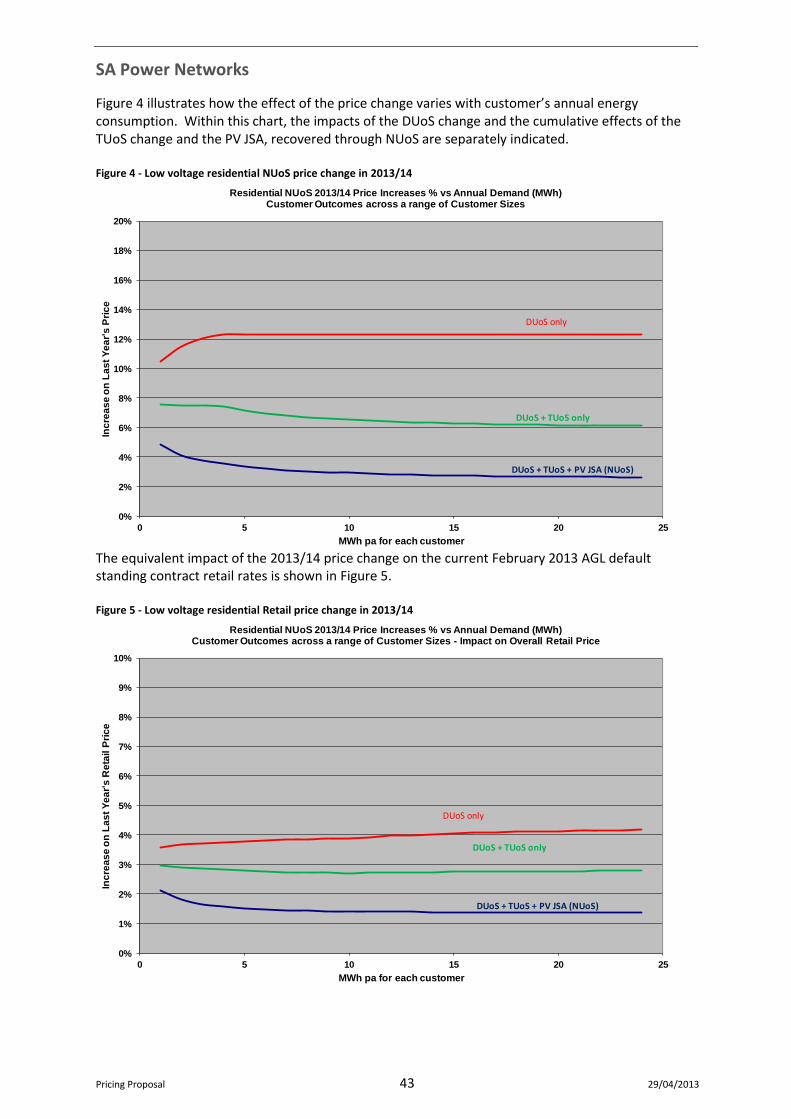
SA Power Networks
Pricing Proposal 43 29/04/2013
Figure 4 illustrates how the effect of the price change varies with customer’s annual energy consumption. Within this chart, the impacts of the DUoS change and the cumulative effects of the TUoS change and the PV JSA, recovered through NUoS are separately indicated. Figure 4 - Low voltage residential NUoS price change in 2013/14
The equivalent impact of the 2013/14 price change on the current February 2013 AGL default standing contract retail rates is shown in Figure 5. Figure 5 - Low voltage residential Retail price change in 2013/14
0%
2%
4%
6%
8%
10%
12%
14%
16%
18%
20%
0 5 10 15 20 25
Inc
rea
se
on
La
st
Ye
ar'
s P
ric
e
MWh pa for each customer
Residential NUoS 2013/14 Price Increases % vs Annual Demand (MWh)Customer Outcomes across a range of Customer Sizes
DUoS + TUoS + PV JSA (NUoS)
DUoS only
DUoS + TUoS only
0%
1%
2%
3%
4%
5%
6%
7%
8%
9%
10%
0 5 10 15 20 25
Inc
rea
se
on
La
st
Ye
ar'
s R
eta
il P
ric
e
MWh pa for each customer
Residential NUoS 2013/14 Price Increases % vs Annual Demand (MWh)Customer Outcomes across a range of Customer Sizes - Impact on Overall Retail Price
DUoS + TUoS + PV JSA (NUoS)
DUoS only
DUoS + TUoS only

SA Power Networks
Pricing Proposal 44 29/04/2013
7.4.2 Controlled load tariff
The controlled load tariff also has an inclining block structure with two consumption steps. The 2013/14 annual bill and price change shown in Table 30 for residential customers with hot water, for a range of representative consumption levels. The table shows NUoS being the impact of distribution, transmission and PV JSA FiT pass-throughs on the annual electricity bill (inclusive of the retail charges). The table also shows (as DUoS) the SA Power Networks’ related price changes. Table 30 - Low voltage residential + hot water price change in 2013/14
Annual
Usage
NUoS
12/13
NUoS
13/14
Change
in NUoS
bill
Change
in Retail
bill
DUoS
12/13
DUoS
13/14
Change
in DUoS
bill
Change
in Retail
bill
MWh pa $ pa $ pa % % $ pa $ pa % %
2 + 1 401 417 4.0% 1.7% 288 322 11.6% 3.5%
4 + 2 708 733 3.5% 1.5% 482 542 12.3% 3.6%
5 + 3 923 954 3.3% 1.4% 621 698 12.3% 3.6%
8 + 4 1,474 1,519 3.1% 1.4% 974 1,094 12.3% 3.7%
16 + 5 3,062 3,147 2.8% 1.4% 1,986 2,231 12.3% 3.9%
Note NUoS = DUoS + TUoS + PV JSA

SA Power Networks
Pricing Proposal 45 29/04/2013
Figure 6 illustrates how the effect of the price change varies with customer’s annual energy consumption where hot water is used. Within this chart, the impacts of the DUoS change and the cumulative effects of the TUoS change and the PV JSA, recovered through NUoS are separately indicated. Figure 6 - Low voltage residential + hot water NUoS price change in 2013/14
The equivalent impact of the 2013/14 price change on the current AGL default retail rates is shown in Figure 7. Figure 7 - Low voltage residential + hot water Retail price change in 2013/14
0%
2%
4%
6%
8%
10%
12%
14%
16%
18%
20%
0 5 10 15 20 25 30
Inc
rea
se
on
La
st
Ye
ar'
s P
ric
e
MWh pa for each customer - includes the Hot Water
Residential with Hot Water NUoS 2013/14 Price Increases % vs Annual Demand (MWh)Customer Outcomes across a range of Customer Sizes
DUoS + TUoS + PV JSA (NUoS)
DUoS only
DUoS + TUoS only
0%
1%
2%
3%
4%
5%
6%
7%
8%
9%
10%
0 5 10 15 20 25 30
Inc
rea
se
on
La
st
Ye
ar'
s R
eta
il P
ric
e
MWh pa for each customer - includes the Hot Water
Residential with Hot Water NUoS 2012/13 Price Increases % vs Annual Demand (MWh)Customer Outcomes across a range of Customer Sizes - Impact on Overall Retail Price
DUoS + TUoS + PV JSA (NUoS)
DUoS only
DUoS + TUoS only
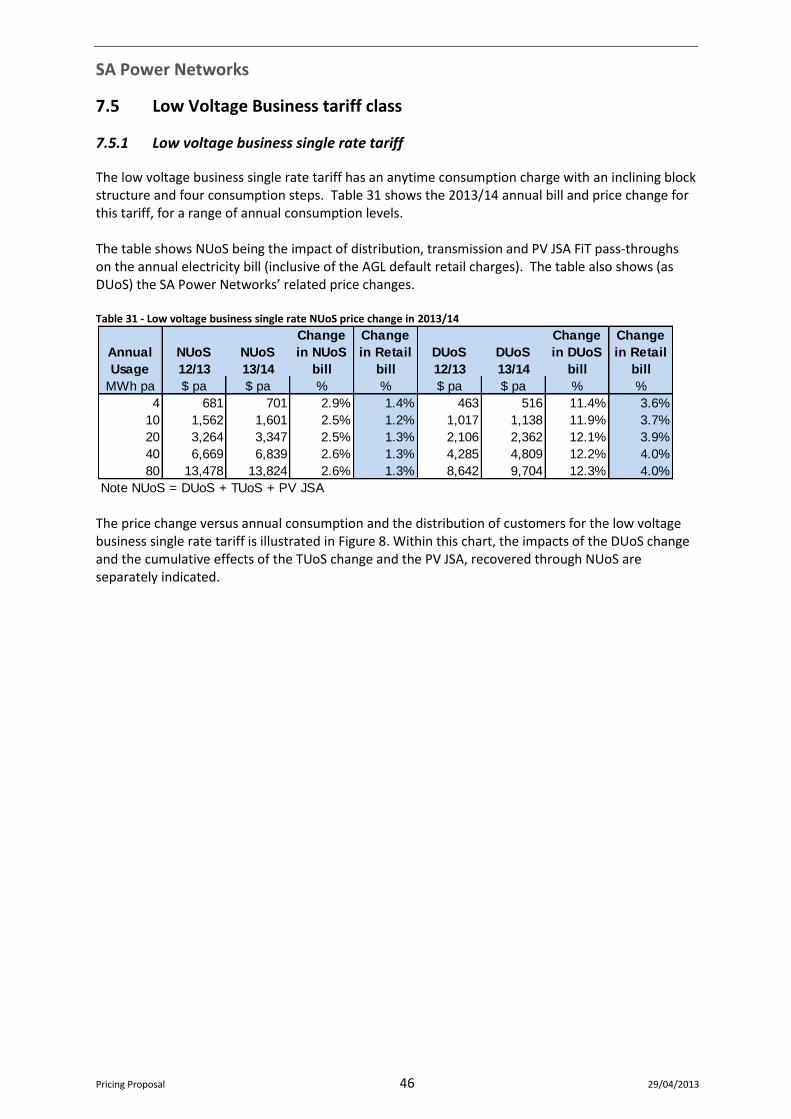
SA Power Networks
Pricing Proposal 46 29/04/2013
7.5 Low Voltage Business tariff class
7.5.1 Low voltage business single rate tariff
The low voltage business single rate tariff has an anytime consumption charge with an inclining block structure and four consumption steps. Table 31 shows the 2013/14 annual bill and price change for this tariff, for a range of annual consumption levels. The table shows NUoS being the impact of distribution, transmission and PV JSA FiT pass-throughs on the annual electricity bill (inclusive of the AGL default retail charges). The table also shows (as DUoS) the SA Power Networks’ related price changes. Table 31 - Low voltage business single rate NUoS price change in 2013/14
The price change versus annual consumption and the distribution of customers for the low voltage business single rate tariff is illustrated in Figure 8. Within this chart, the impacts of the DUoS change and the cumulative effects of the TUoS change and the PV JSA, recovered through NUoS are separately indicated.
Annual
Usage
NUoS
12/13
NUoS
13/14
Change
in NUoS
bill
Change
in Retail
bill
DUoS
12/13
DUoS
13/14
Change
in DUoS
bill
Change
in Retail
bill
MWh pa $ pa $ pa % % $ pa $ pa % %
4 681 701 2.9% 1.4% 463 516 11.4% 3.6%
10 1,562 1,601 2.5% 1.2% 1,017 1,138 11.9% 3.7%
20 3,264 3,347 2.5% 1.3% 2,106 2,362 12.1% 3.9%
40 6,669 6,839 2.6% 1.3% 4,285 4,809 12.2% 4.0%
80 13,478 13,824 2.6% 1.3% 8,642 9,704 12.3% 4.0%
Note NUoS = DUoS + TUoS + PV JSA

SA Power Networks
Pricing Proposal 47 29/04/2013
Figure 8 - Low voltage business single rate NUoS price change in 2013/14
The equivalent impact of the 2013/14 price change on the current AGL default retail rates for business single rate customers is shown in Figure 7. Figure 9 - Low voltage business single rate Retail price change in 2013/14
7.5.2 Low voltage business 2-rate tariff
The effect of the price change in 2013/14 for more complex tariff structures such as the low voltage business 2-rate will depend upon the customer consumption profile, in particular the ratio of peak to
0%
2%
4%
6%
8%
10%
12%
14%
16%
18%
20%
0 10 20 30 40 50 60 70 80 90 100
Inc
rea
se
on
La
st
Ye
ar'
s P
ric
e
MWh pa for each customer
Business Single rate NUoS 2013/14 Price Increases % vs Annual Demand (MWh)Customer Outcomes across a range of Customer Sizes
DUoS + TUoS + PV JSA (NUoS)
DUoS only
DUoS + TUoS only
0%
1%
2%
3%
4%
5%
6%
7%
8%
9%
10%
0 10 20 30 40 50 60 70 80 90 100
Inc
rea
se
on
La
st
Ye
ar'
s R
eta
il P
ric
e
MWh pa for each customer
Business Single rate NUoS 2013/14 Price Increases % vs Annual Demand (MWh)Customer Outcomes across a range of Customer Sizes - Impact on Overall Retail Price
DUoS + TUoS + PV JSA (NUoS)
DUoS only
DUoS + TUoS only
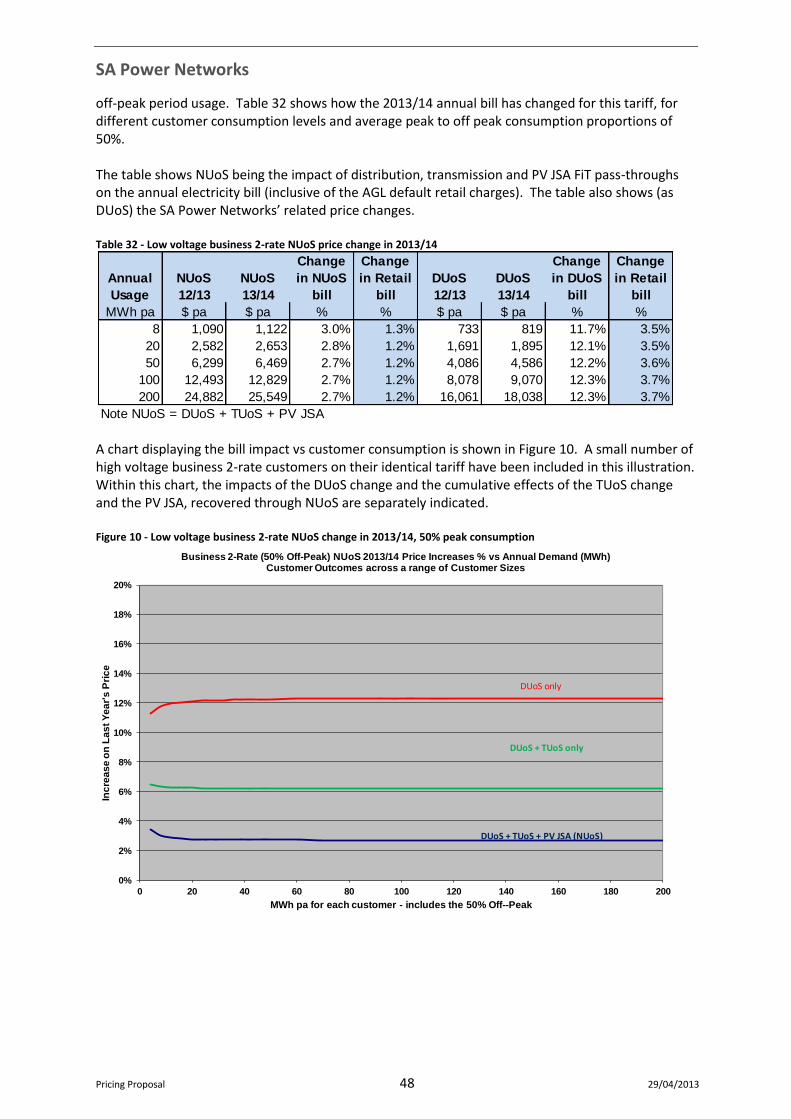
SA Power Networks
Pricing Proposal 48 29/04/2013
off-peak period usage. Table 32 shows how the 2013/14 annual bill has changed for this tariff, for different customer consumption levels and average peak to off peak consumption proportions of 50%. The table shows NUoS being the impact of distribution, transmission and PV JSA FiT pass-throughs on the annual electricity bill (inclusive of the AGL default retail charges). The table also shows (as DUoS) the SA Power Networks’ related price changes. Table 32 - Low voltage business 2-rate NUoS price change in 2013/14
A chart displaying the bill impact vs customer consumption is shown in Figure 10. A small number of high voltage business 2-rate customers on their identical tariff have been included in this illustration. Within this chart, the impacts of the DUoS change and the cumulative effects of the TUoS change and the PV JSA, recovered through NUoS are separately indicated. Figure 10 - Low voltage business 2-rate NUoS change in 2013/14, 50% peak consumption
Annual
Usage
NUoS
12/13
NUoS
13/14
Change
in NUoS
bill
Change
in Retail
bill
DUoS
12/13
DUoS
13/14
Change
in DUoS
bill
Change
in Retail
bill
MWh pa $ pa $ pa % % $ pa $ pa % %
8 1,090 1,122 3.0% 1.3% 733 819 11.7% 3.5%
20 2,582 2,653 2.8% 1.2% 1,691 1,895 12.1% 3.5%
50 6,299 6,469 2.7% 1.2% 4,086 4,586 12.2% 3.6%
100 12,493 12,829 2.7% 1.2% 8,078 9,070 12.3% 3.7%
200 24,882 25,549 2.7% 1.2% 16,061 18,038 12.3% 3.7%
Note NUoS = DUoS + TUoS + PV JSA
0%
2%
4%
6%
8%
10%
12%
14%
16%
18%
20%
0 20 40 60 80 100 120 140 160 180 200
Inc
rea
se
on
La
st
Ye
ar'
s P
ric
e
MWh pa for each customer - includes the 50% Off--Peak
Business 2-Rate (50% Off-Peak) NUoS 2013/14 Price Increases % vs Annual Demand (MWh)Customer Outcomes across a range of Customer Sizes
DUoS + TUoS + PV JSA (NUoS)
DUoS only
DUoS + TUoS only
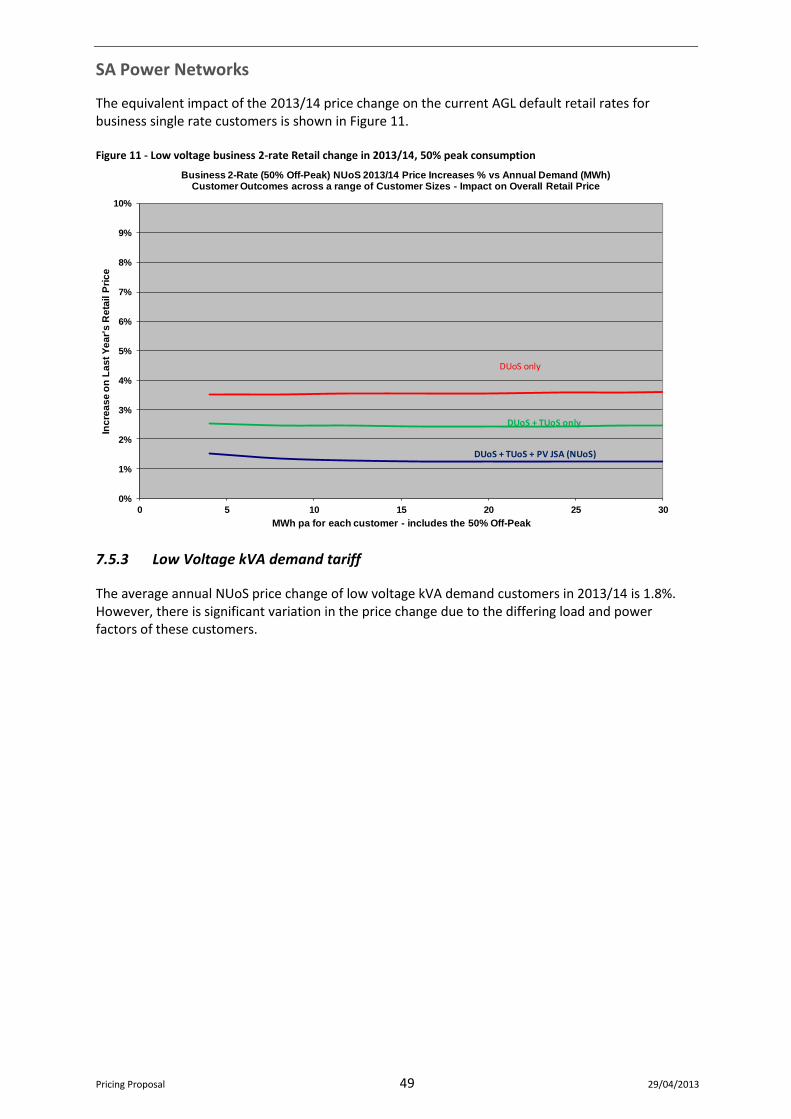
SA Power Networks
Pricing Proposal 49 29/04/2013
The equivalent impact of the 2013/14 price change on the current AGL default retail rates for business single rate customers is shown in Figure 11. Figure 11 - Low voltage business 2-rate Retail change in 2013/14, 50% peak consumption
7.5.3 Low Voltage kVA demand tariff
The average annual NUoS price change of low voltage kVA demand customers in 2013/14 is 1.8%. However, there is significant variation in the price change due to the differing load and power factors of these customers.
0%
1%
2%
3%
4%
5%
6%
7%
8%
9%
10%
0 5 10 15 20 25 30
Inc
rea
se
on
La
st
Ye
ar'
s R
eta
il P
ric
e
MWh pa for each customer - includes the 50% Off-Peak
Business 2-Rate (50% Off-Peak) NUoS 2013/14 Price Increases % vs Annual Demand (MWh)Customer Outcomes across a range of Customer Sizes - Impact on Overall Retail Price
DUoS only
DUoS + TUoS only
DUoS + TUoS + PV JSA (NUoS)
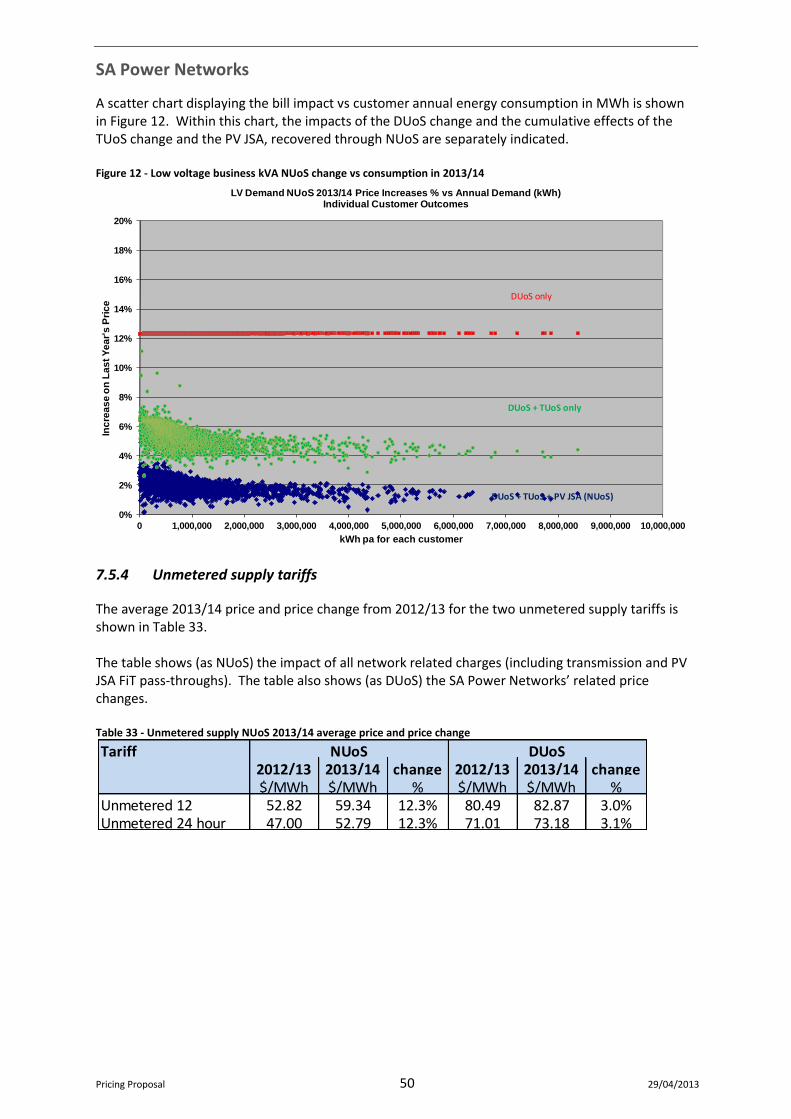
SA Power Networks
Pricing Proposal 50 29/04/2013
A scatter chart displaying the bill impact vs customer annual energy consumption in MWh is shown in Figure 12. Within this chart, the impacts of the DUoS change and the cumulative effects of the TUoS change and the PV JSA, recovered through NUoS are separately indicated. Figure 12 - Low voltage business kVA NUoS change vs consumption in 2013/14
7.5.4 Unmetered supply tariffs
The average 2013/14 price and price change from 2012/13 for the two unmetered supply tariffs is shown in Table 33. The table shows (as NUoS) the impact of all network related charges (including transmission and PV JSA FiT pass-throughs). The table also shows (as DUoS) the SA Power Networks’ related price changes. Table 33 - Unmetered supply NUoS 2013/14 average price and price change
0%
2%
4%
6%
8%
10%
12%
14%
16%
18%
20%
0 1,000,000 2,000,000 3,000,000 4,000,000 5,000,000 6,000,000 7,000,000 8,000,000 9,000,000 10,000,000
Inc
rea
se
on
La
st
Ye
ar'
s P
ric
e
kWh pa for each customer
LV Demand NUoS 2013/14 Price Increases % vs Annual Demand (kWh)Individual Customer Outcomes
DUoS + TUoS + PV JSA (NUoS)
DUoS only
DUoS + TUoS only
Tariff2012/13 2013/14 change 2012/13 2013/14 change$/MWh $/MWh % $/MWh $/MWh %
Unmetered 12 52.82 59.34 12.3% 80.49 82.87 3.0%Unmetered 24 hour 47.00 52.79 12.3% 71.01 73.18 3.1%
NUoS DUoS
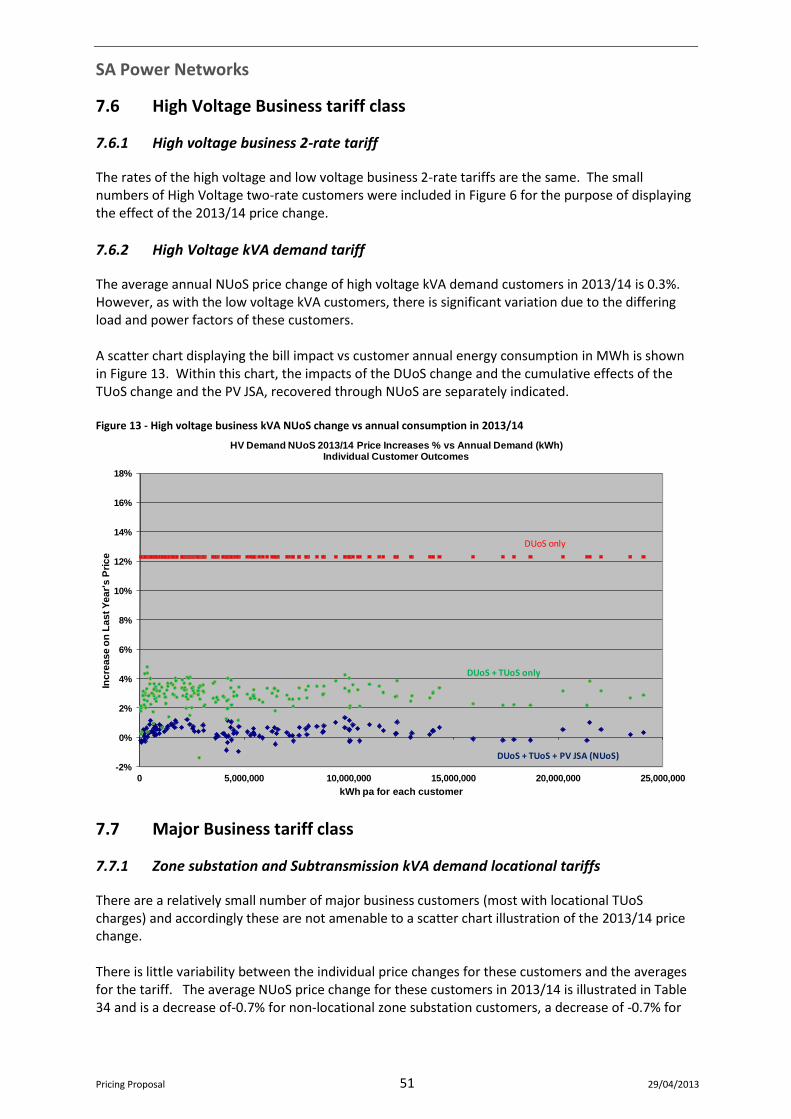
SA Power Networks
Pricing Proposal 51 29/04/2013
7.6 High Voltage Business tariff class
7.6.1 High voltage business 2-rate tariff
The rates of the high voltage and low voltage business 2-rate tariffs are the same. The small numbers of High Voltage two-rate customers were included in Figure 6 for the purpose of displaying the effect of the 2013/14 price change.
7.6.2 High Voltage kVA demand tariff
The average annual NUoS price change of high voltage kVA demand customers in 2013/14 is 0.3%. However, as with the low voltage kVA customers, there is significant variation due to the differing load and power factors of these customers. A scatter chart displaying the bill impact vs customer annual energy consumption in MWh is shown in Figure 13. Within this chart, the impacts of the DUoS change and the cumulative effects of the TUoS change and the PV JSA, recovered through NUoS are separately indicated. Figure 13 - High voltage business kVA NUoS change vs annual consumption in 2013/14
7.7 Major Business tariff class
7.7.1 Zone substation and Subtransmission kVA demand locational tariffs
There are a relatively small number of major business customers (most with locational TUoS charges) and accordingly these are not amenable to a scatter chart illustration of the 2013/14 price change. There is little variability between the individual price changes for these customers and the averages for the tariff. The average NUoS price change for these customers in 2013/14 is illustrated in Table 34 and is a decrease of-0.7% for non-locational zone substation customers, a decrease of -0.7% for
-2%
0%
2%
4%
6%
8%
10%
12%
14%
16%
18%
0 5,000,000 10,000,000 15,000,000 20,000,000 25,000,000
Inc
rea
se
on
La
st
Ye
ar'
s P
ric
e
kWh pa for each customer
HV Demand NUoS 2013/14 Price Increases % vs Annual Demand (kWh)Individual Customer Outcomes
DUoS + TUoS + PV JSA (NUoS)
DUoS only
DUoS + TUoS only
SA Power Networks
Pricing Proposal 52 29/04/2013
locational zone substation customers and a decrease of -7.5% for locational sub-transmission customers. The increase in SA Power Networks’ distribution charges for all of these customers is 12.3%. Table 34 – Major Business Customers NUoS 2013/14 average price and price change
7.8 Review of customer charges
Pursuant to clause 6.18.4(b) of the Rules, the AER has set out the requirement for a system of assessment and review of the basis on which a customer is charged where the charge varies with the customer’s usage or profile. This requirement is in Appendix B, clause 11 of the Decision. Sections 7.4 to 7.7 of this Pricing Proposal illustrate the price changes which result from SA Power Networks’ proposed prices, in 2013/14. These sections contain illustrations that demonstrate not just the average price change, but highlight the expected distribution of price changes, for customers with a range of consumption profiles and tariffs, over the full range of charging parameters. In this 2013/14 Pricing proposal, the increase in tariff price components has been uniformly applied to demand and energy. As a result, customers generally will not need to be reassigned to different tariffs in 2013/14 if their consumption and metering is unchanged.
Tariff
2012/13 2013/14 change 2012/13 2013/14 change
$/MWh $/MWh % $/MWh $/MWh %
Zone Substation 27.02 26.57 -1.7% 12.21 13.71 12.3%
Zone S/Stn Locational 27.02 26.57 -1.7% 12.21 13.71 12.3%
Sub Trans Locational 26.92 24.89 -7.5% 5.17 5.81 12.3%
NUoS DUoS

SA Power Networks
Pricing Proposal 53 29/04/2013
8 Pricing of standard control services
This section demonstrates how SA Power Networks’ network tariffs for 2013/14 comply with the requirements of the Rules and the AER’s determination in respect of the pricing X factors, side constraints and pricing principles.
8.1 Regulatory requirements
8.1.1 Rules requirements
Rules clause 6.18.2(b) specifies that SA Power Networks’ Pricing Proposal must contain information concerning the expected revenue to be derived from its tariff classes and tariffs, as follows. 6.18.2 Pricing proposals
(b) A pricing proposal must:
(4) set out, for each tariff class related to standard control services, the expected weighted average revenue for the relevant regulatory year and also for the current regulatory year; and
In setting its prices for standard control services, clause 6.18.5 of the Rules requires SA Power Networks to comply with the following pricing principles. 6.18.5 Pricing principles
(a) For each tariff class, the revenue expected to be recovered should lie on or between:
(1) an upper bound representing the stand alone cost of serving the customers who belong to that class; and
(2) a lower bound representing the avoidable cost of not serving those customers.
(b) A tariff, and if it consists of 2 or more charging parameters, each charging parameter for a tariff class:
(1) must take into account the long run marginal cost for the service or, in the case of a charging parameter, for the element of the service to which the charging parameter relates; and
(2) must be determined having regard to:
(i) transaction costs associated with the tariff or each charging parameter; and
(ii) whether customers of the relevant tariff class are able or likely to respond to price signals.
(c) If, however, as a result of the operation of paragraph (b), the Distribution Network Service Provider may not recover the expected revenue, the provider must adjust its tariffs so as to ensure recovery of expected revenue with minimum distortion to efficient patterns of consumption.
In respect of pricing side constraints, SA Power Networks is required to comply with clause 6.18.6 of the Rules: 6.18.6 Side constraints on tariffs for standard control services
(a) This clause applies only to tariff classes related to the provision of standard control services.

SA Power Networks
Pricing Proposal 54 29/04/2013
(b) The expected weighted average revenue to be raised from a tariff class for a particular regulatory year of a regulatory control period must not exceed the corresponding expected weighted average revenue for the preceding regulatory year by more than the permissible percentage.
(c) The permissible percentage is the greater of the following:
(1) the CPI-X limitation on any increase in the Distribution Network Service Provider's expected weighted average revenue between the two regulatory years plus 2%;
Note:
The calculation is of the form (1 + CPI)(1 – X)(1 + 2%)
(2) CPI plus 2%.
Note:
The calculation is of the form (1 + CPI)(1 + 2%)
(d) In deciding whether the permissible percentage has been exceeded in a particular regulatory year, the following are to be disregarded:
(1) the recovery of revenue to accommodate a variation to the distribution determination under rule 6.6 or 6.13;
(2) the recovery of revenue to accommodate pass through of charges for transmission use of system services to customers.
(e) This clause does not, however, limit the extent a tariff for customers with remotely-read interval metering or other similar metering technology may vary according to the time or other circumstances of the customer's usage.
SA Power Networks’ tariffs also subject to South Australian transitional provision Clause 9.29.5(d) of the Rules, which limits the movement of the fixed supply charge component for small customers (with a consumption less than 160 MWh per annum).
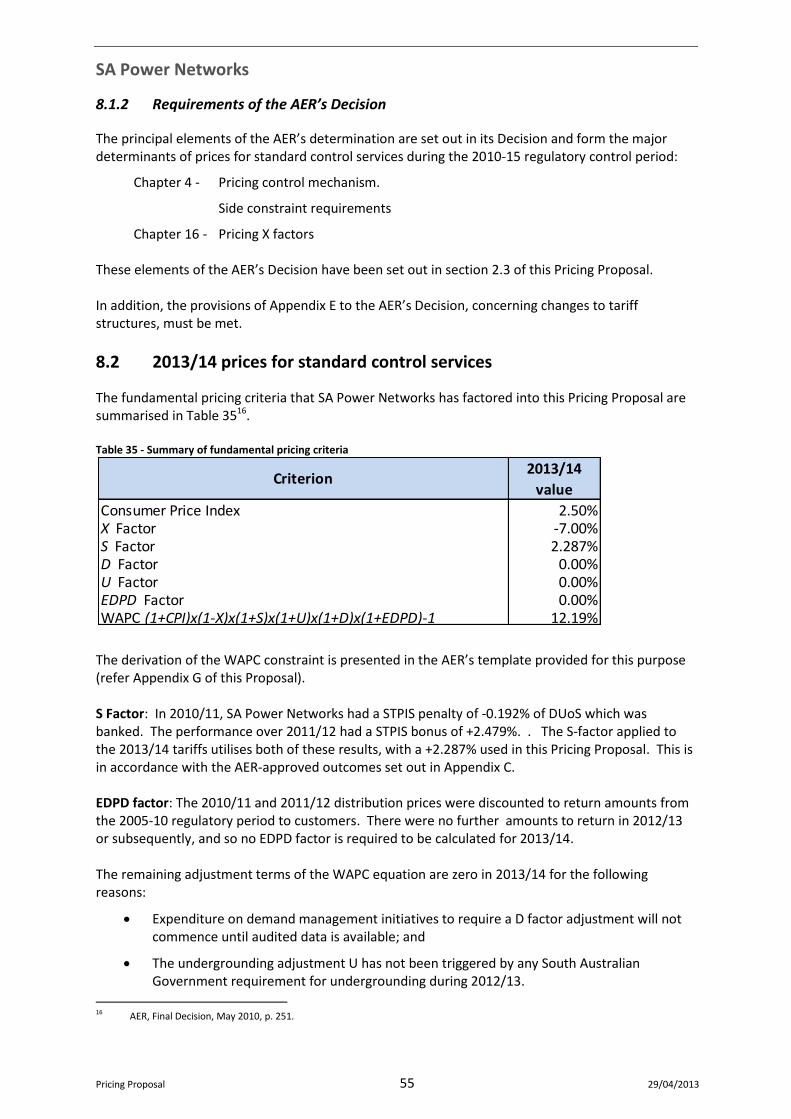
SA Power Networks
Pricing Proposal 55 29/04/2013
8.1.2 Requirements of the AER’s Decision
The principal elements of the AER’s determination are set out in its Decision and form the major determinants of prices for standard control services during the 2010-15 regulatory control period:
Chapter 4 - Pricing control mechanism.
Side constraint requirements
Chapter 16 - Pricing X factors These elements of the AER’s Decision have been set out in section 2.3 of this Pricing Proposal. In addition, the provisions of Appendix E to the AER’s Decision, concerning changes to tariff structures, must be met.
8.2 2013/14 prices for standard control services
The fundamental pricing criteria that SA Power Networks has factored into this Pricing Proposal are summarised in Table 3516. Table 35 - Summary of fundamental pricing criteria
The derivation of the WAPC constraint is presented in the AER’s template provided for this purpose (refer Appendix G of this Proposal). S Factor: In 2010/11, SA Power Networks had a STPIS penalty of -0.192% of DUoS which was banked. The performance over 2011/12 had a STPIS bonus of +2.479%. . The S-factor applied to the 2013/14 tariffs utilises both of these results, with a +2.287% used in this Pricing Proposal. This is in accordance with the AER-approved outcomes set out in Appendix C. EDPD factor: The 2010/11 and 2011/12 distribution prices were discounted to return amounts from the 2005-10 regulatory period to customers. There were no further amounts to return in 2012/13 or subsequently, and so no EDPD factor is required to be calculated for 2013/14. The remaining adjustment terms of the WAPC equation are zero in 2013/14 for the following reasons:
Expenditure on demand management initiatives to require a D factor adjustment will not commence until audited data is available; and
The undergrounding adjustment U has not been triggered by any South Australian Government requirement for undergrounding during 2012/13.
16 AER, Final Decision, May 2010, p. 251.
Criterion2013/14
value
Consumer Price Index 2.50%X Factor -7.00%S Factor 2.287%D Factor 0.00%U Factor 0.00%EDPD Factor 0.00%WAPC (1+CPI)x(1-X)x(1+S)x(1+U)x(1+D)x(1+EDPD)-1 12.19%
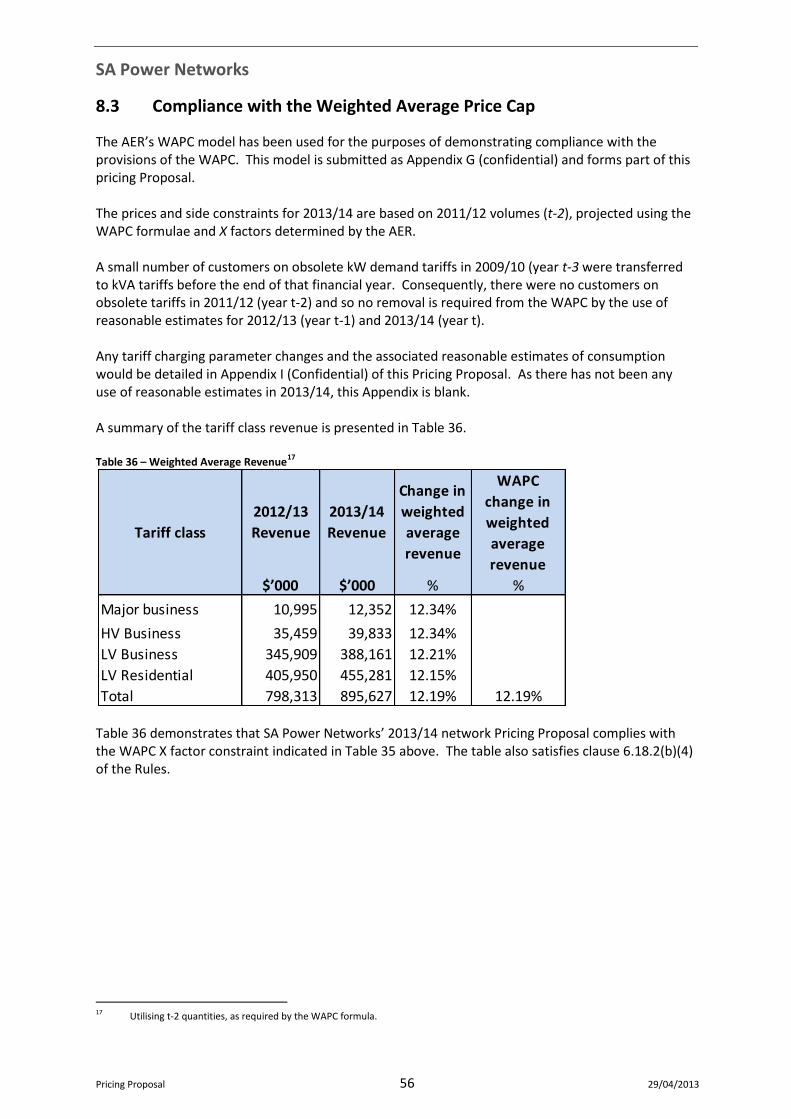
SA Power Networks
Pricing Proposal 56 29/04/2013
8.3 Compliance with the Weighted Average Price Cap
The AER’s WAPC model has been used for the purposes of demonstrating compliance with the provisions of the WAPC. This model is submitted as Appendix G (confidential) and forms part of this pricing Proposal. The prices and side constraints for 2013/14 are based on 2011/12 volumes (t-2), projected using the WAPC formulae and X factors determined by the AER. A small number of customers on obsolete kW demand tariffs in 2009/10 (year t-3 were transferred to kVA tariffs before the end of that financial year. Consequently, there were no customers on obsolete tariffs in 2011/12 (year t-2) and so no removal is required from the WAPC by the use of reasonable estimates for 2012/13 (year t-1) and 2013/14 (year t). Any tariff charging parameter changes and the associated reasonable estimates of consumption would be detailed in Appendix I (Confidential) of this Pricing Proposal. As there has not been any use of reasonable estimates in 2013/14, this Appendix is blank. A summary of the tariff class revenue is presented in Table 36. Table 36 – Weighted Average Revenue
17
Table 36 demonstrates that SA Power Networks’ 2013/14 network Pricing Proposal complies with the WAPC X factor constraint indicated in Table 35 above. The table also satisfies clause 6.18.2(b)(4) of the Rules.
17 Utilising t-2 quantities, as required by the WAPC formula.
2012/13
Revenue
2013/14
Revenue
Change in
weighted
average
revenue
WAPC
change in
weighted
average
revenue
$’000 $’000 % %
Major business 10,995 12,352 12.34%
HV Business 35,459 39,833 12.34%
LV Business 345,909 388,161 12.21%
LV Residential 405,950 455,281 12.15%
Total 798,313 895,627 12.19% 12.19%
Tariff class
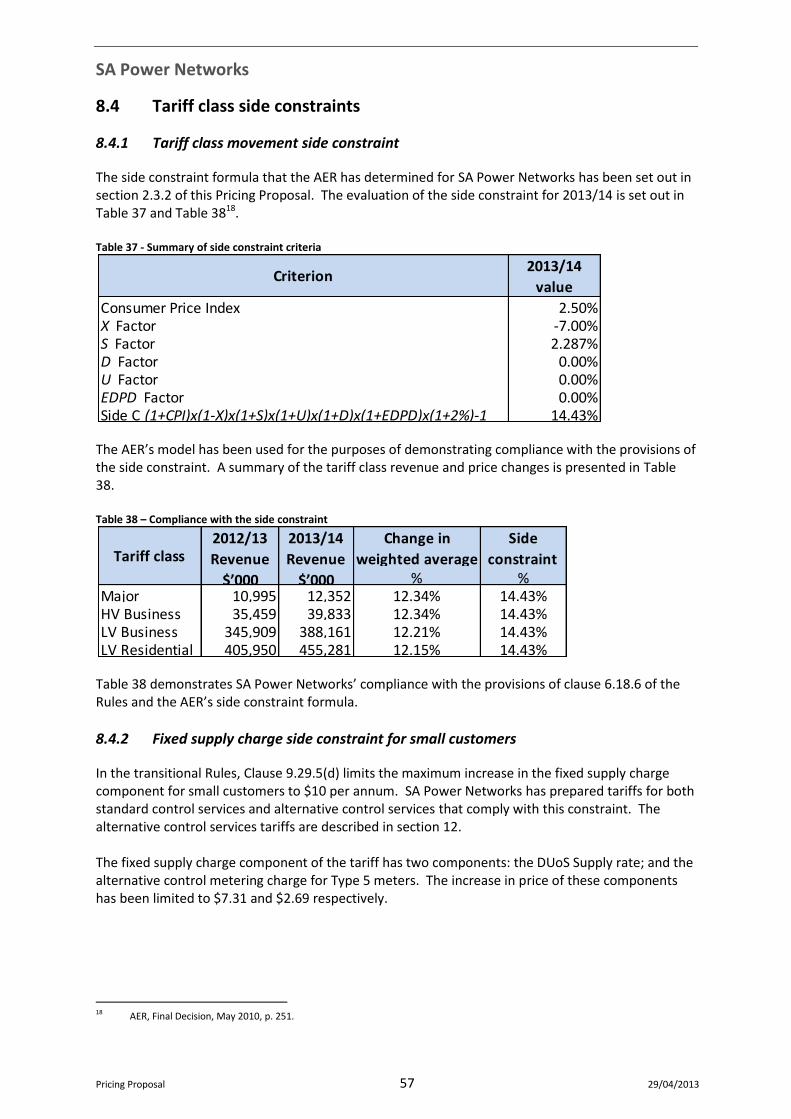
SA Power Networks
Pricing Proposal 57 29/04/2013
8.4 Tariff class side constraints
8.4.1 Tariff class movement side constraint
The side constraint formula that the AER has determined for SA Power Networks has been set out in section 2.3.2 of this Pricing Proposal. The evaluation of the side constraint for 2013/14 is set out in Table 37 and Table 3818. Table 37 - Summary of side constraint criteria
The AER’s model has been used for the purposes of demonstrating compliance with the provisions of the side constraint. A summary of the tariff class revenue and price changes is presented in Table 38. Table 38 – Compliance with the side constraint
Table 38 demonstrates SA Power Networks’ compliance with the provisions of clause 6.18.6 of the Rules and the AER’s side constraint formula.
8.4.2 Fixed supply charge side constraint for small customers
In the transitional Rules, Clause 9.29.5(d) limits the maximum increase in the fixed supply charge component for small customers to $10 per annum. SA Power Networks has prepared tariffs for both standard control services and alternative control services that comply with this constraint. The alternative control services tariffs are described in section 12. The fixed supply charge component of the tariff has two components: the DUoS Supply rate; and the alternative control metering charge for Type 5 meters. The increase in price of these components has been limited to $7.31 and $2.69 respectively.
18 AER, Final Decision, May 2010, p. 251.
Criterion2013/14
value
Consumer Price Index 2.50%X Factor -7.00%S Factor 2.287%D Factor 0.00%U Factor 0.00%EDPD Factor 0.00%Side C (1+CPI)x(1-X)x(1+S)x(1+U)x(1+D)x(1+EDPD)x(1+2%)-1 14.43%
Change in
weighted average
Side
constraint% %
Major 10,995 12,352 12.34% 14.43%HV Business 35,459 39,833 12.34% 14.43%LV Business 345,909 388,161 12.21% 14.43%LV Residential 405,950 455,281 12.15% 14.43%
Tariff class2012/13
Revenue
$’000
2013/14
Revenue
$’000

SA Power Networks
Pricing Proposal 58 29/04/2013
The fixed DUoS charges for small customers are illustrated in Table 39. Table 39 – Compliance with the fixed charge side constraint for small customers
Table 39 demonstrates SA Power Networks’ compliance with the provisions of clause 6.18.6 of the Rules and the AER’s side constraint formula.
8.5 Compliance with pricing principles
This section demonstrates SA Power Networks’ compliance with the pricing principles set out in clause 6.18.5 of the Rules, which requires SA Power Networks to ensure that the revenue recovered for each tariff class lies between:
An upper bound, representing the stand-alone cost of serving the customers who belong to that class; and
A lower bound, representing the avoidable cost of not serving those customers.
The Stand-alone and Avoidable cost methodologies are described in detail in Appendix F of this Proposal. These approaches are used to calculate the revenues for each standard control services tariff class associated with each cost methodology. These costs are compared with the weighted average revenue derived from SA Power Networks’ proposed tariffs.
8.5.1 Definition of Stand-alone and Avoidable costs
These two categories of cost may be defined for tariff classes, as follows:
The Stand-alone cost for a tariff class is the cost of supplying only the tariff class concerned, with all other tariff classes not being supplied. If customers were to pay above the stand-alone cost then it would be economically beneficial for customers to switch to an alternative provider, and economically feasible for an alternative provider to operate. This creates the possibility of inefficient bypass of the existing infrastructure; and
The Avoidable cost for a tariff class is the reduction in network cost that would take place if the tariff class were not supplied (whilst all other tariff classes remained supplied). If customers were to be charged below the avoidable cost, it would be economically beneficial for the business to stop supplying the customers and as the associated costs would exceed the revenue obtained from the customer.
There are two alternative concepts that could be used to calculate these costs:
To ignore the sunk nature of the existing network and estimate the costs which would be associated with an optimally designed network, constructed to supply standard control services to the tariff class(es) concerned; or
Sideconstraint
¢/day $ p.a. ¢/day $ p.a. $ p.a $ p.a LV residential
DUoS 25.872 $94.43 27.875 $101.74 $7.31Metering 7.675 $28.02 8.412 $30.70 $2.69
Total 33.547 $122.45 36.287 $132.45 $10.00 $10.00LV Business
DUoS 25.872 $94.43 27.875 $101.74 $7.31Metering 7.675 $28.02 8.412 $30.70 $2.69
Total 25.872 $94.43 27.875 $101.74 $7.31 $10.00
DifferenceTariff class 2012/13Fixed charge
2013/14Fixed charge

SA Power Networks
Pricing Proposal 59 29/04/2013
To base the estimation of costs on the modification of the existing network to provide standard control services to the tariff class(es) concerned
The Rules do not prescribe the methodology that should be used to calculate the Stand-alone and Avoidable costs of tariff classes of the network. SA Power Networks has chosen to base its cost estimations on the second concept, with hypothetical modification of the existing network, rather than by devising and costing optimal new network structures. This has been done for two reasons:
To avoid the very substantial resource requirements that would be involved in a full network redesign; and
In recognition that the economic regulatory framework for distribution supports the existence and value of existing (sunk) network investments and does not support the optimisation of existing networks.
The derivation of the stand-alone and avoidable cost for tariff classes uses a methodology based on SA Power Networks’ cost of supply model. This model has been in use for a decade and was formulated to permit the efficient allocation of network costs to tariff classes and the formulation of network prices. The cost allocation model has been adapted to include the allocation of non system costs to tariff classes. This model is described in the following sections. This approach was independently reviewed by KPMG, and certified to be compliant with the Rules in 2010. The approach has not been altered from that used in the 2010/11 Pricing Proposal and the sole change has been to index the outcomes by CPI in 2013.
8.6 Stand-alone costs
The stand-alone cost for each tariff class was derived from an engineering estimate of the proportions of the cost of providing network capacity that would need to remain in place to service the load in each of the four tariff classes in turn if the other three tariff classes were no longer required to be supplied. The resulting cost allocation for each tariff class has been expressed in $/kVA, using the estimated coincident contribution to SA Power Networks’ peak system demand and after adjustment for the average power factor of the tariff class. The detailed procedure used to calculate the stand-alone cost of tariff classes is set out in Appendix F of this Pricing Proposal.
8.7 Avoidable costs
In similar manner to the stand-alone cost, the avoidable cost associated with each of the four tariff classes were derived from an engineering estimate made of the network cost that could be avoided, in the event that each of the four tariff classes were to be removed in turn. As with the stand-alone cost, the avoidable network cost was expressed in $/kVA for each tariff class. The procedure used to calculate the avoidable cost of tariff classes is also set out in Appendix F of this Pricing Proposal.
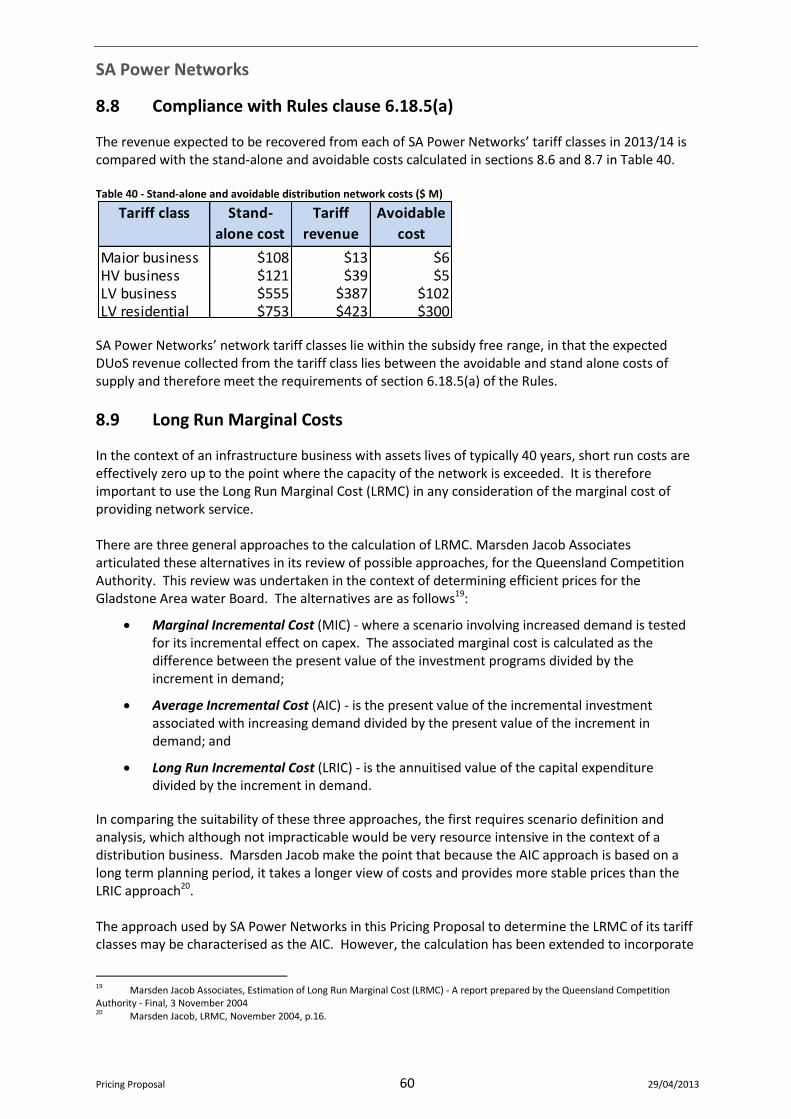
SA Power Networks
Pricing Proposal 60 29/04/2013
8.8 Compliance with Rules clause 6.18.5(a)
The revenue expected to be recovered from each of SA Power Networks’ tariff classes in 2013/14 is compared with the stand-alone and avoidable costs calculated in sections 8.6 and 8.7 in Table 40. Table 40 - Stand-alone and avoidable distribution network costs ($ M)
SA Power Networks’ network tariff classes lie within the subsidy free range, in that the expected DUoS revenue collected from the tariff class lies between the avoidable and stand alone costs of supply and therefore meet the requirements of section 6.18.5(a) of the Rules.
8.9 Long Run Marginal Costs
In the context of an infrastructure business with assets lives of typically 40 years, short run costs are effectively zero up to the point where the capacity of the network is exceeded. It is therefore important to use the Long Run Marginal Cost (LRMC) in any consideration of the marginal cost of providing network service. There are three general approaches to the calculation of LRMC. Marsden Jacob Associates articulated these alternatives in its review of possible approaches, for the Queensland Competition Authority. This review was undertaken in the context of determining efficient prices for the Gladstone Area water Board. The alternatives are as follows19:
Marginal Incremental Cost (MIC) - where a scenario involving increased demand is tested for its incremental effect on capex. The associated marginal cost is calculated as the difference between the present value of the investment programs divided by the increment in demand;
Average Incremental Cost (AIC) - is the present value of the incremental investment associated with increasing demand divided by the present value of the increment in demand; and
Long Run Incremental Cost (LRIC) - is the annuitised value of the capital expenditure divided by the increment in demand.
In comparing the suitability of these three approaches, the first requires scenario definition and analysis, which although not impracticable would be very resource intensive in the context of a distribution business. Marsden Jacob make the point that because the AIC approach is based on a long term planning period, it takes a longer view of costs and provides more stable prices than the LRIC approach20. The approach used by SA Power Networks in this Pricing Proposal to determine the LRMC of its tariff classes may be characterised as the AIC. However, the calculation has been extended to incorporate
19 Marsden Jacob Associates, Estimation of Long Run Marginal Cost (LRMC) - A report prepared by the Queensland Competition Authority - Final, 3 November 2004 20 Marsden Jacob, LRMC, November 2004, p.16.
Tariff class Stand-
alone cost
Tariff
revenue
Avoidable
cost
Major business $108 $13 $6 HV business $121 $39 $5 LV business $555 $387 $102 LV residential $753 $423 $300

SA Power Networks
Pricing Proposal 61 29/04/2013
the incremental operating cost associated with new capital investment. This is the same as the approach taken by Energy Australia in its 2009 Pricing Proposal21. SA Power Networks’ approach to the calculation of the network LRMC for its tariff classes is set out in Appendix E of this Proposal. The approach has not been altered from that used in the 2010/11 Pricing Proposal and the sole change has been to index the outcomes by CPI in 2013. These calculations are carried out at the following voltage levels of the network:
Subtransmission;
High voltage; and
Low voltage.
The marginal cost at each network voltage level has been determined using the following relationship:
Where:
growth related capex is the annualised capital expenditure to meet the additional demand and new customer connections forecast over the forecast period;
growth related opex is the incremental annual cost of operating and maintaining the newly constructed network and connection assets over the forecast period; and
incremental demand is the forecast change in kVA demand compared with the base year of 2009/10
The LRMC outcomes at the subtransmission and high voltage levels are directly applicable to the Major Business and High Voltage Business tariff classes. At low voltage, a small difference between the LRMC of the Low Voltage Business and Residential tariff classes arises because of their different power factors. A comparison of the stand-alone, avoidable, LRMC and 2013/14 tariff rates for SA Power Networks’ four tariff classes are shown in Figure 1422.
21 EnergyAustralia, Network Pricing Proposal, May 2009. 22 The stand-alone, 2010/11 tariff and avoidable tariff class rates are expressed as their $ contribution divided by the forecast coincident peak kVA for SA Power Networks’ system demand in 2010/11, with a 10% PoE.
LRMC(AIC) =PV(growth related capex) + PV(growth related opex)
PV(incremental demand)
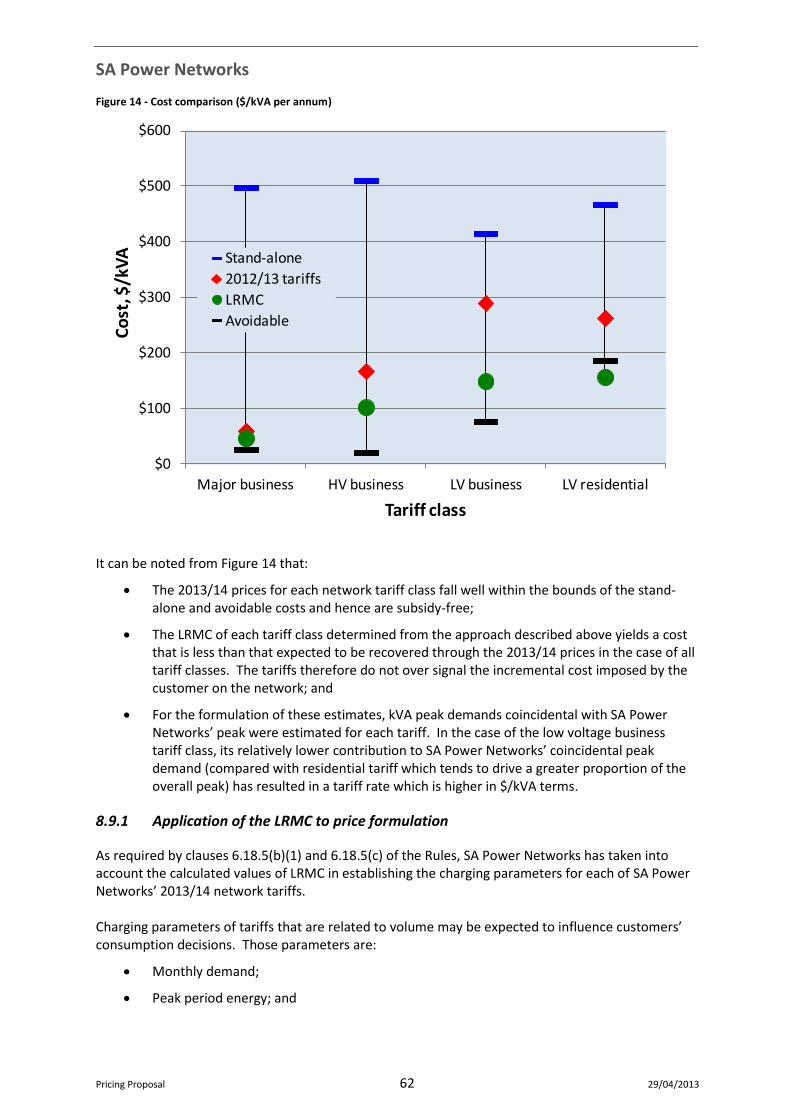
SA Power Networks
Pricing Proposal 62 29/04/2013
Figure 14 - Cost comparison ($/kVA per annum)
It can be noted from Figure 14 that:
The 2013/14 prices for each network tariff class fall well within the bounds of the stand-alone and avoidable costs and hence are subsidy-free;
The LRMC of each tariff class determined from the approach described above yields a cost that is less than that expected to be recovered through the 2013/14 prices in the case of all tariff classes. The tariffs therefore do not over signal the incremental cost imposed by the customer on the network; and
For the formulation of these estimates, kVA peak demands coincidental with SA Power Networks’ peak were estimated for each tariff. In the case of the low voltage business tariff class, its relatively lower contribution to SA Power Networks’ coincidental peak demand (compared with residential tariff which tends to drive a greater proportion of the overall peak) has resulted in a tariff rate which is higher in $/kVA terms.
8.9.1 Application of the LRMC to price formulation
As required by clauses 6.18.5(b)(1) and 6.18.5(c) of the Rules, SA Power Networks has taken into account the calculated values of LRMC in establishing the charging parameters for each of SA Power Networks’ 2013/14 network tariffs. Charging parameters of tariffs that are related to volume may be expected to influence customers’ consumption decisions. Those parameters are:
Monthly demand;
Peak period energy; and
$0
$100
$200
$300
$400
$500
$600
Major business HV business LV business LV residential
Co
st, $
/kV
A
Tariff class
Stand-alone
2012/13 tariffs
LRMC
Avoidable

SA Power Networks
Pricing Proposal 63 29/04/2013
To a much less significant extent, anytime energy.
On the other hand, charging parameters that are effectively fixed would be unlikely to affect customer consumption patterns, throughout a very broad range. SA Power Networks’ tariffs for larger business customers have a ToU structure, having demand and energy charges that apply or are higher during a defined peak consumption period. The revenue that is forecast to be recovered in 2013/14 from these peak period business kVA demand and 2-rate tariff components is compared with the LRMC for tariff classes in Table 41 and Table 42. This Table also illustrates the proportions of tariff revenue recovered from peak period charges, off-peak charges and fixed charges. In order to convert the price signalling components of tariffs to the equivalent annual $/kVA charges in this price comparison, the revenue per annum derived from the application of each price component during peak periods was divided by the kVA demand for the tariff. The associated calculations are described in Appendix E. Table 41- LRMC and volume related charging parameters for Time of Use
note Energy rate is charged in $/MWh but is expressed here in equivalent $/kVA terms over the
period of peak demand. The revenue recovery forecast by each charge during the peak period is divided by the associated peak kVA demand.
The equivalent LRMC and revenue information for SA Power Networks’ single rate energy tariffs is illustrated in Table 42. For the purpose of estimating an equivalent $/kVA rate, it was assumed that loads in excess of 80% of the peak demand (which equates to only 1.4% of all hours) contributed to the peak load that drives augmentation of the network. Table 42- LRMC and volume related charging parameters for single rate
note Energy rate is charged in $/MWh but is expressed here in equivalent $/kVA terms over the
period of peak demand. The revenue recovery forecast by each charge during the peak period is divided by the associated peak kVA demand.
The way in which the tariff class LRMC has been taken into account by SA Power Networks in establishing the 2013/14 tariff components has involved the following considerations:
Ensuring that price signalling components do not over signal the LRMC: As customers’ consumption decisions will be influenced by the charging parameters of tariffs related to
Sub-
trans
Zone sub
(loc TUoS)
Zone
sub
2-rate
LRMC $/kVA/yr $101
Price signalling
Peak demand rate $/kVA/yr $10.60 $24.30 $24.30 $58.70 $101.40
Peak energy rate $/kVA/yr $0.70 $3.80 $3.80 $8.70 $8.70 $45.30
Total peak charge $/kVA/yr $11.30 $28.10 $28.10 $67.40 $110.10 $45.30
$148$45
Major Business tariff class
kVA demand
HV
Business
tariff class
LV Business tariff
class
Residential tariff Single rate Unmetered Residential + CL
LRMC $/kVA/yr $156Price signallingEnergy rate $/kVA/yr $42.50 $18.90 $47.10
$148
LV Business tariff class

SA Power Networks
Pricing Proposal 64 29/04/2013
volume, SA Power Networks has confirmed that, expressed on a common basis, the price signalling tariff components have all been set less than the LRMC of supply. The network tariffs will therefore not over-signal the marginal cost of supply;
Use of price signalling components where practicable: Where permitted by the metering arrangements, volume related charges that reflect the customers’ demand or incremental energy consumption have been used to improve signalling of the tariff class LRMC;
Use of stepped pricing signals: SA Power Networks’ stepped energy rates are being used to signal the costs of network expansion in an incremental manner. With single rate customers the energy rate increases as consumption increases, reflecting the correspondence between customer energy consumption and the proportion of premises that are air conditioned, have poor load factors and impose additional network expansion costs;
Revenue recovery through non-distortionary charging parameters: For each tariff, price signalling charging parameters recover a proportion of the total revenue during peak consumption periods. The balance of revenue recovery takes place in the least distortionary manner possible, through fixed monthly charges and through the single rate energy rates that apply during off peak periods.
SA Power Networks’ 2013/14 tariffs have therefore been established in compliance with the provisions of clauses 6.18.5(b)(1) and 6.18.5(c) of the Rules. There are other ways in which the LRMC of network expansion is being used by SA Power Networks to guide its tariff strategy for future years, namely:
Business customers are being encouraged to take up the kVA demand tariff, which may be seen from Table 41 to more effectively pass on price signals for the use of the network than the single rate or 2-rate or single rate energy tariffs; and
The indicative future tariff charging parameter price movements set out in Table 27 have been established with a view to enhancing the alignment between SA Power Networks’ network price signals and the cost of supply.
8.10 Transaction costs
Clause 6.18.5(b)(2)(i) of the Rules requires SA Power Networks to have regard to the transaction costs arising from its network tariffs, by limiting the complexity of tariff structures and the number of charging parameters within each tariff. The charging parameters applicable to each tariff are provided in Chapter 4 of this Pricing Proposal. SA Power Networks has not introduced new tariffs or tariff structures in 2013/14 and thus transaction costs will not be increased as a result of the implementation of these prices. SA Power Networks is therefore compliant with this Rules provision.
8.11 Customer response to price signals
SA Power Networks is required to have regard to the ability of customers to respond to the price signals provided by its network tariffs, in accordance with clause 6.18.5(b)(2)(ii) of the Rules. The efficiency gains of marginal cost pricing are realised when a tariff based on the marginal cost of supply induces the customer to make behavioural change.
SA Power Networks
Pricing Proposal 65 29/04/2013
To the extent possible within the limitations imposed by network tariff structures and metering constraints, SA Power Networks signals the long run marginal cost of supply through those tariff charging parameters with the greatest price elasticity of demand, namely the variable consumption charges that are based on the customers energy use and maximum demand. In relation to the operation of clause 6.18.5(c) of the Rules, it is noted that SA Power Networks’ current estimate of LRMC falls above the all of the price signalling charging parameters in each tariff class, as described in section 8.9. If the price signalling charging parameters alone (which were set taking into account the LRMC) were used, the revenue for each tariff class would be insufficient to recover the expected revenue. The revenue shortfall is recovered through the use of tariff components which would cause minimal distortion in efficient patterns of consumption, namely:
Fixed charges; and
Anytime energy charges during off peak periods.
SA Power Networks is therefore compliant with this Rules provision.
SA Power Networks
Pricing Proposal 66 29/04/2013
9 Transmission cost recovery tariffs
This section sets out the procedures that SA Power Networks will follow to enable the recovery of transmission related charges, including any avoided TUoS charges paid to the embedded generators connected to SA Power Networks’ distribution network. ElectraNet is the Transmission Network Service Provider in South Australia and calculates location specific transmission prices for the connection points to SA Power Networks’ network, in accordance with the provisions of the Rules. ElectraNet’s 2013/14 revenue will again be offset by some amount for revenue from settlement residue auctions. ElectraNet has not advised at this time the amount of discount that has been applied in 2013/14. This section 9 has been prepared using the May 2013 pricing advice from ElectraNet which advised of an 11.6% decrease in charges. This advice has been prepared following the AER’s 2013 revenue reset for ElectraNet. The initial Pricing Proposal used an estimate of a 7% decrease in these charges.
9.1 Regulatory Requirements
9.1.1 Rules requirements
SA Power Networks’ Pricing Proposal is required under clause 6.18.2(b) of the Rules to set out how the TUoS charges it incurs are passed on to customers. 6.18.2 Pricing proposals
(b) A pricing proposal must:
(3) set out, for each proposed tariff, the charging parameters and the elements of service to which each charging parameter relates; and
…
(6) set out how charges incurred by the Distribution Network Service Provider for transmission use of system services are to be passed on to customers and any adjustments to tariffs resulting from over or under recovery of those charges in the previous regulatory year;
Clause 6.18.7 of the Rules sets out the requirement concerning the recovery of transmission related charges by SA Power Networks. 6.18.7 Recovery of charges for transmission use of system services
(a) A pricing proposal must provide for tariffs designed to pass on to customers the charges to be incurred by the Distribution Network Service Provider for transmission use of system services.
(b) The amount to be passed on to customers for a particular regulatory year must not exceed the estimated amount of the transmission use of system charges for the relevant regulatory year adjusted for over or under recovery in the previous regulatory year.
(c) The extent of the over or under recovery is the difference between:
(1) the amount actually paid by the Distribution Network Service Provider by way of transmission use of system charges in the previous regulatory year; and

SA Power Networks
Pricing Proposal 67 29/04/2013
(2) the amount passed on to customers by way of transmission use of system charges by the Distribution Network Service Provider in the previous regulatory year.
9.1.2 Requirements of the AER’s Decision
The AER has required SA Power Networks as part of its Pricing Proposal for each regulatory year of the 2010-15 regulatory control period, to provide the amounts for the following entries in its TUoS unders and overs account for the most recently completed regulatory year, the current regulatory year and the next regulatory year23:
1. Opening balance for each year.
2. Interest accrued on the opening balance for each year, calculated at the rate of the post–tax nominal rate of return as approved by the AER in its distribution determination.
3. The amount of revenue recovered from TUOS charges applied in respect of that year, less the amounts of all transmission related payments made by the DNSP in respect of that year.
4. Six months interest on the net amount in item 3, accrued at the approved post–tax nominal rate of return.
5. Summation of the above amounts to derive the closing balance for each year.
In the determination, the AER established the requirement for SA Power Networks to maintain a TUoS unders and overs account in a specific format. The AER also requires SA Power Networks to target a zero expected balance on its TUoS unders and overs account in each regulatory year during the 2010-15 regulatory control period.
9.2 Transmission cost recovery tariff methodology
The key principles of SA Power Networks’ transmission cost recovery tariff (TCR) methodology are:
The total TUoS allocated to network tariffs aligns with the total estimated transmission charge to be paid by SA Power Networks, adjusted for any overs and unders account balance;
To the extent possible given the constraints of metering and tariff structures, transmission charges are allocated to network tariffs in a manner that reflects the cost drivers present in transmission pricing;
Customers with a demand of 10 MW or consumption in excess of 40 GWh have individually calculated tariffs with transmission charges allocated in a manner that preserves the location and time signals of transmission pricing in accordance with the principles in Part J of chapter 6A of the Rules; and
Network tariffs for smaller customer classes have transmission charges allocated on an energy basis, as location signals cannot be preserved.
9.2.1 Avoided TUoS payments
With respect to avoided TUoS for embedded generators, SA Power Networks calculates the avoided TUoS for all embedded generators that export to its distribution network at the same rates for the locational component which would be applied to a load of similar size at the same connection point. These calculations are prepared on a with/without basis.
23 AER, Final Decision - South Australia distribution determination 2010–11 to 2014–15, May 2010, pp. 322-323.
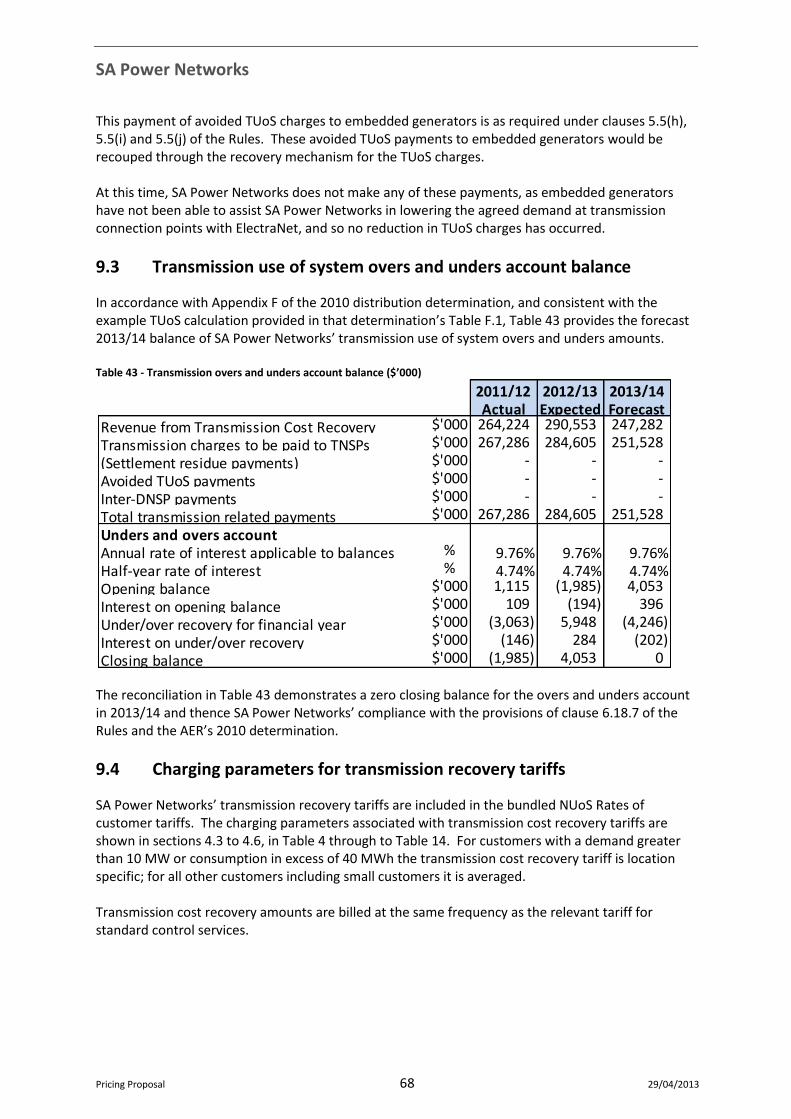
SA Power Networks
Pricing Proposal 68 29/04/2013
This payment of avoided TUoS charges to embedded generators is as required under clauses 5.5(h), 5.5(i) and 5.5(j) of the Rules. These avoided TUoS payments to embedded generators would be recouped through the recovery mechanism for the TUoS charges. At this time, SA Power Networks does not make any of these payments, as embedded generators have not been able to assist SA Power Networks in lowering the agreed demand at transmission connection points with ElectraNet, and so no reduction in TUoS charges has occurred.
9.3 Transmission use of system overs and unders account balance
In accordance with Appendix F of the 2010 distribution determination, and consistent with the example TUoS calculation provided in that determination’s Table F.1, Table 43 provides the forecast 2013/14 balance of SA Power Networks’ transmission use of system overs and unders amounts. Table 43 - Transmission overs and unders account balance ($’000)
The reconciliation in Table 43 demonstrates a zero closing balance for the overs and unders account in 2013/14 and thence SA Power Networks’ compliance with the provisions of clause 6.18.7 of the Rules and the AER’s 2010 determination.
9.4 Charging parameters for transmission recovery tariffs
SA Power Networks’ transmission recovery tariffs are included in the bundled NUoS Rates of customer tariffs. The charging parameters associated with transmission cost recovery tariffs are shown in sections 4.3 to 4.6, in Table 4 through to Table 14. For customers with a demand greater than 10 MW or consumption in excess of 40 MWh the transmission cost recovery tariff is location specific; for all other customers including small customers it is averaged. Transmission cost recovery amounts are billed at the same frequency as the relevant tariff for standard control services.
2011/12 2012/13 2013/14Actual Expected Forecast
Revenue from Transmission Cost Recovery $'000 264,224 290,553 247,282
Transmission charges to be paid to TNSPs $'000 267,286 284,605 251,528
(Settlement residue payments) $'000 - - -
Avoided TUoS payments $'000 - - -
Inter-DNSP payments $'000 - - -
Total transmission related payments $'000 267,286 284,605 251,528
Unders and overs accountAnnual rate of interest applicable to balances % 9.76% 9.76% 9.76%Half-year rate of interest % 4.74% 4.74% 4.74%Opening balance $'000 1,115 (1,985) 4,053
Interest on opening balance $'000 109 (194) 396
Under/over recovery for financial year $'000 (3,063) 5,948 (4,246)
Interest on under/over recovery $'000 (146) 284 (202)
Closing balance $'000 (1,985) 4,053 0
SA Power Networks
Pricing Proposal 69 29/04/2013
9.5 Transmission recovery tariffs for 2013/14
SA Power Networks’ 2013/14 recovery through transmission tariffs is forecast to decrease from an estimated $291 M in 2012/13 to $247 M in 2013/14. This is a 14.9% decrease, which arises for the following reasons:
The forecast annual decrease in annual ElectraNet revenue under their 2013-2018 Price Reset, and also the recovery of approved MurrayLink revenue;
The change in ‘discount’ and ‘surcharge’ in ElectraNet’s charges in 2013/14, due to settlement residues and payments for interstate networks;
The level of over/under-recovery by ElectraNet of the allowed annual revenue in 2013/14 versus 2012/13. ElectraNet endeavour to set their prices each year to achieve a zero balance at the end of each year but variations in revenue recovery and settlements residue occur every year.
The under -recovery in pricing required by SA Power Networks in 2013/14 to achieve a nil balance.
SA Power Networks has prepared prices for 2013/14 that recover these forecast ElectraNet charges. Locational customers have prices developed directly from the ElectraNet price list according to their location and usage parameters. All other customers have had prices applied on a State-wide non-locational basis, using the pricing signals provided by ElectraNet, the billing parameters available for that customer segment and the customer demand assumptions for that customer segment. For example, business customers on a demand tariff will incur a mixture of demand and energy charges for transmission, whilst residential and small business customers will incur an energy-based charge. The 2012/13 non-locational customer transmission prices have been uniformly de-escalated by 11.9% for 2013/14. This is slightly lower than the 14.9% decrease in transmission recoveries discussed above, due to the forecast reduction in sales quantities in 2013/14 and the pricing to locational-based customers. It is in line with the general change in ElectraNet charges of -11.6%. Sales quantities are expected to be lower next year for a variety of reasons including the growth in the uptake of PV generation by small customers. This has reduced their energy consumed from the network (and their billable TUoS quantities) .

SA Power Networks
Pricing Proposal 70 29/04/2013
10 Recovery of the PV Jurisdictional Scheme Amount
The solar feed-in scheme is a South Australian Government initiative which commenced in on 1 July 2008 and was to apply for 20 years. It was reviewed by the SA Government in 2009/10 and amendments to the legislation took effect from 29 July 201124. The amendments to the legislation introduced two further schemes – one which required application by September 2011 which was also to apply till June 2028 and a further scheme for subsequent applications which was to apply till 2016. Under this SA Government legislation, SA Power Networks is obliged to make FiT payments to qualifying customers that have solar PV generators, for energy they export to the grid. The purpose for the PV Jurisdictional Scheme Amount is to allow SA Power Networks to recover from all of its customers the cost of the SA Government legislated Feed-in Tariff payments that SA Power Networks is required to make to those customers that have qualifying solar PV generators. In December 2011, the AER approved an application by SA Power Networks for the 2010 Determination to be varied by a pass-through event to recover the JSA25. The amount of the JSA was determined from the actual payments made to existing customers with solar PV generators less the amount originally forecast to be incurred in 2010/11 as part of the 2010-15 Price Reset. This application was reviewed and approved by the AER. For simplicity, SA Power Networks has included this approved pass-through amount with the other solar PV payment pass-through calculations under the Jurisdictional Scheme Amount arrangements. Under the Jurisdictional Scheme Amount arrangements, SA Power Networks is required to provide information on the payments and recoveries of PV FiT in the same manner to that used for transmission (see 9.1.2 above for these requirements). These arrangements have been used below. Commencing in 2012/13, SA Power Networks will recover the PV JSA, as an additional component of its bundled NUoS charges. The PV JSA is being recovered as a uniform percentage uplift across all customer groups on each component of their DUoS charge. This has resulted in a further charge for all customers to recover the amounts incurred under the SA Government legislation. The sole exception to this approach was in the case of small residential and business customers, where the side constraint of $10.00 on the annual increase in the fixed charge did not permit the recovery of the JSA through this component. In those cases, the PV JSA Uplift applied was increased for the first block of usage charges such that a customer using all of that first block would receive the same increase as if the supply charge and first block had been increased by the average. This approach to the recovery of the PV JSA has the following characteristics:
It is simple, and readily understood;
By being applied as a uniform uplift to all charging components, it is not likely to unduly influence customers’ consumption decisions;
As it is scaled to the customer’s DUoS charge
o It does not unduly penalise high load factor commercial and industrial customers,
o It can be applied to each and every customer, and
o Is therefore equitable. 24 Government of South Australia, Electricity (Feed-In Scheme—Solar Systems) Amendment Act 2008. 25 AER, Feed-In Tariff pass through event for 2010-11, 12 December 2011.

SA Power Networks
Pricing Proposal 71 29/04/2013
The recovery of the PV JSA has been included as an additional charging component in the NUoS tariffs, as described in section 4.
10.1 PV Jurisdictional Scheme Amount overs and unders account balance
In accordance with Appendix F of the 2010 distribution determination, and consistent with the example TUoS calculation provided in that determination’s Table F.1, Table 44 provides the forecast 2013/14 balance of SA Power Networks’ PV JSA overs and unders amounts. The table includes the 2010/11 pass-through amount approved by the AER for recovery in 2012/13, the actual 2011/12 payments plus the estimated 2012/13 and forecast 2013/14 payments for each of the three approved PV FiT schemes. Table 44 – PV JSA overs and unders account balance ($’000)
The reconciliation in Table 44 demonstrates a zero closing balance for the overs and unders account in 2013/14 and thence SA Power Networks’ compliance with the provisions of clause 6.18.7 of the Rules, the AER’s February 2012 Revocation and Substitution Determination and the AER’s May 2010 determination.
10.2 Charging parameters for PV JSA cost recovery tariffs
SA Power Networks’ PV JSA cost recovery tariffs are included in the bundled NUoS Rates of customer tariffs. The charging parameters associated with PV JSA cost recovery tariffs are shown in sections 4.3 to 4.6, in Table 4 through to Table 14. There is no customer specific or location specific calculation apart from the small customer supply charge and first block usage charge described earlier in this section. PV JSA cost recovery amounts are billed at the same frequency as the relevant tariff for standard control services.
2011/12 2012/13 2013/14
Actual Expected Forecast
Revenue from PV JSA recovery Tariffs $'000 - 164,389 126,664
PV JSA Payments for Export PV - 2028 Scheme $'000 15,158 16,588 16,588
PV JSA Payments for Export PV - 2028S Scheme $'000 53,160 68,244 68,244
PV JSA for Export PV - 2016 Scheme $'000 521 13,568 21,624
PV Pass-Through 2010/11 recovery (AER) $'000 - 8,843 -
Total PV JSO payments (net of 2010/11 Opex) $'000 68,839 107,243 106,456
Opening balance of overs/(unders) account $'000
Annual interest rate applicable to balance % 9.76% 9.76% 9.76%
Half-year interest rate % 4.74% 4.74% 4.74%
Opening balance $'000 - (72,120) (19,289)
Interest on opening balance (365 days) $'000 - (7,039) (1,883)
forecast over/(under) recovery financial year $'000 (68,839) 57,146 20,208
Interest charged over/under recovery fin. year $'000 (3,281) 2,724 963
Closing balance PV JSA overs/(unders) account $'000 (72,120) (19,289) (0)
SA Power Networks
Pricing Proposal 72 29/04/2013
10.3 PV JSA cost recovery tariffs for 2013/14
SA Power Networks’ 2013/14 PV JSA recovery tariffs are forecast to recover $127M in 2013/14 ($164M in 2012/13). This will recover four series of payments:
The under-recovery in 2010/11 of PV FiT payments compared to the amount forecast in the 2010-15 Price Reset. The AER has reviewed SA Power Networks’ application and has approved an amount of $8.843M which has been recovered in 2012/13;
Payments under the original scheme (the ‘2028’ Scheme). This scheme closed to new applicants in August 2010. Payments of $17M are estimated for 2012/13 and $17M forecast for 2013/14;
Payments under the subsequent scheme (the ‘2028 Stepped’ Scheme). This scheme opened to new applicants when the 2028 scheme closed, and required applications to be approved by September 2011. The number of generators approved under this scheme is much higher than under the 2028 scheme, and the size of the PV generation in each installation is also much higher. As a result, payments under this scheme are significantly higher, with estimated payments in 2012/13 of $68M and forecast payments in 2013/14 of $68M.
Payments under the third scheme (the ‘2016’ Scheme). This scheme opened to new applicants when the 2028 Stepped scheme closed, ie from 30 September 2011. Payments are at the rate of 16 cents/kWh until June 2016, whereas the other two schemes have payments at 44 cents/kWh for qualifying generation. Applications are growing at a high rate for this scheme, with the size of installation continuing to grow, resulting in increasing levels of export. As a result, payments under this scheme are significant despite the lower FiT rate of 16 cents/kWh. Estimated payments in 2012/13 are $14M and forecast payments in 2013/14 are $22M.
There is also an interest allowance for the timing of these cashflows, as shown in Table 44 above. SA Power Networks has prepared prices for 2013/14 that are aimed at recovering these forecast PV JSA charges and achieving a zero balance at the conclusion of 2013/14.
SA Power Networks
Pricing Proposal 73 29/04/2013
11 Customer tariff class assignment and reassignment
The requirements concerning the assignment and reassignment of customer to tariff classes are set out in clause 6.18.4 of the Rules and Chapter 2 and Appendix B of the AER’s Decision.
11.1 Regulatory Requirements
11.1.1 Rules requirements
In making a distribution determination, the AER is required to formulate provisions for the assignment and reassignment of customers to tariff classes, in accordance with the principles set out in clause 6.18.4 of the Rules. This Rule covers the following matters:
Factors governing the assignment of customers to tariff classes;
Equitable treatment of customers with micro-generation;
The review of the DNSP decision on tariff class assignment; and
The review of DNSPs’ tariff structures containing energy or demand related charges.
11.1.2 Requirements of the AER’s Decision
In accordance with the principles in clause 6.18.4 of the Rules, Appendix B of the AER’s decision sets out the procedures to apply to assigning or reassigning customers to tariff classes26. These provisions are in several parts, covering the following aspects:
The initial assignment of customers at the commencement of the 2010-15 regulatory control period;
Assignment of new customers to a tariff class during the next regulatory control period;
Reassignment of existing customers to another existing or a new tariff during the next regulatory control period;
Objections to proposed assignments and reassignments; and
System of assessment and review of the basis on which a customer is charged.
The initial assignment of existing standard control services customers to their existing tariffs was discussed in section 4.1.2. The remaining elements of the AER’s Decision on tariff assignment and reassignment are set out below. Assignment of new customers to a tariff class during the next regulatory control period
2. If, after 1 July 2010, SA Power Networks becomes aware that a person will become a customer, then SA Power Networks must determine the tariff class to which the new customer will be assigned.
3. In determining the tariff class to which a customer or potential customer will be assigned, or reassigned, in accordance with section 2 or 5, SA Power Networks must take into account one or more of the following factors:
(a) the nature and extent of the customer’s usage
(b) the nature of the customer’s connection to the network27
26 AER, Final Decision, May 2010,, pp. 286-288. 27 The AER interprets ‘connection’ to include the installation of any technology capable of supporting time based tariffs.

SA Power Networks
Pricing Proposal 74 29/04/2013
(c) whether remotely–read interval metering or other similar metering technology has been installed at the customer’s premises as a result of a regulatory obligation or requirement.
4. In addition to the requirements under section 3, SA Power Networks, when assigning or reassigning a customer to a tariff class, must ensure the following:
(a) that customers with similar connection and usage profiles are treated equally
(b) that customers which have micro–generation facilities are not treated less favourably than customers with similar load profiles without such facilities.
Reassignment of existing customers to another existing or a new tariff during the next regulatory control period
5. If SA Power Networks believes that an existing customer’s load characteristics or connection characteristics (or both) have changed such that it is no longer appropriate for that customer to be assigned to the tariff class to which the customer is currently assigned or a customer no longer has the same or materially similar load or connection characteristics as other customers on the customer’s existing tariff, then it may reassign that customer to another tariff class.
Objections to proposed assignments and reassignments 6. SA Power Networks must notify the customer concerned in writing of the tariff class to
which the customer has been assigned or reassigned by it, prior to the assignment or reassignment occurring. If SA Power Networks does not know the identity of the customer then it must notify the customer’s retailer instead.
7. The notice under section 6 must include advice that the customer may request further information from the DNSP and that it may object to the proposed assignment or reassignment. This notice must specifically include:
a. either a copy of SA Power Networks internal procedures for reviewing objections or the link to where such information is available on SA Power Networks’ website
b. that if the objection is not resolved to the satisfaction of the customer under SA Power Networks’ internal review system, then to the extent that resolution of such disputes are within the jurisdiction of a state based energy Ombudsman scheme the customer is entitled to escalate the matter to such a body
c. that if the objection is not resolved to the satisfaction of the customer under the DNSP’s internal review system, then the customer is entitled to seek resolution via the dispute resolution process available under Part 10 of the NEL.
8. If, in response to a notice issued in accordance with section 6, SA Power Networks receives a request for further information from a customer, then it must provide such information. If any of the information requested by the customer is confidential then it is not required to provide that information to the customer.
9. If, in response to a notice issued in accordance with section 7, a customer makes an objection to SA Power Networks about the proposed assignment or reassignment, SA Power Networks must reconsider the proposed assignment or reassignment, taking into consideration the factors in sections 3 and 4 above, and notify the customer in writing of its decision and the reasons for that decision.
10. If a customer’s objection to a tariff assignment or reassignment is upheld by the relevant external dispute resolution body, then any adjustment which needs to be made to prices will be done by SA Power Networks as part of the next annual review of prices.
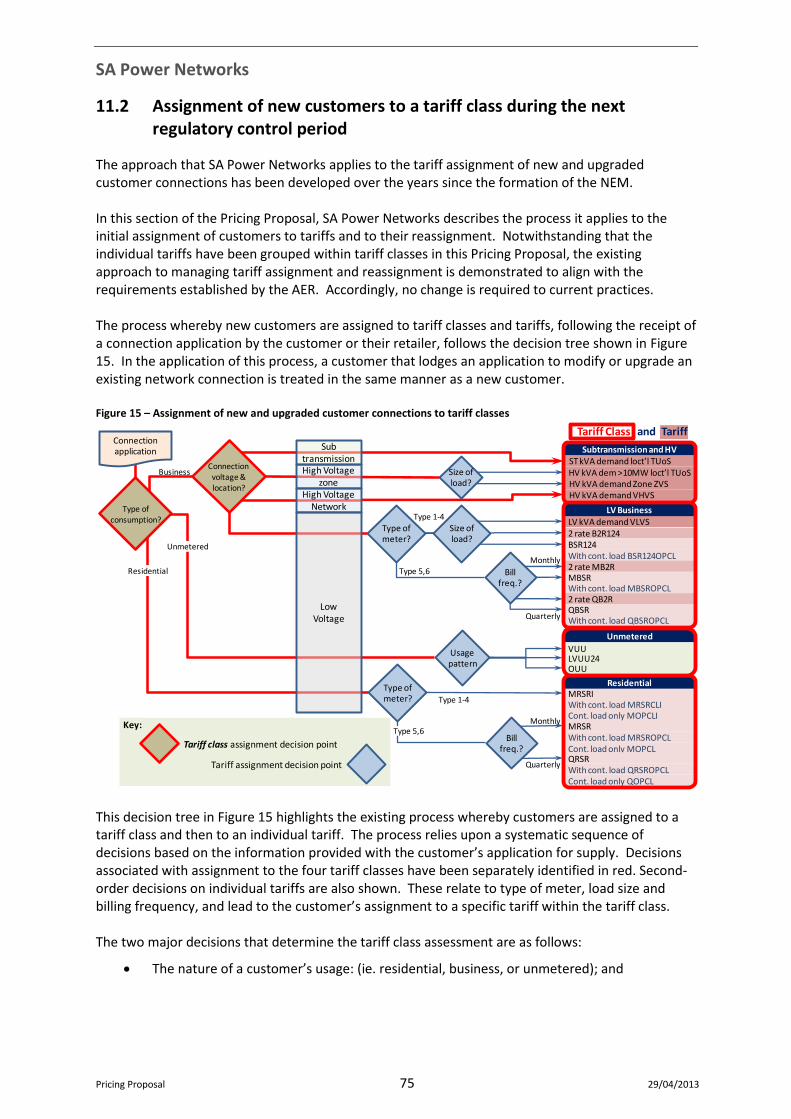
SA Power Networks
Pricing Proposal 75 29/04/2013
11.2 Assignment of new customers to a tariff class during the next regulatory control period
The approach that SA Power Networks applies to the tariff assignment of new and upgraded customer connections has been developed over the years since the formation of the NEM. In this section of the Pricing Proposal, SA Power Networks describes the process it applies to the initial assignment of customers to tariffs and to their reassignment. Notwithstanding that the individual tariffs have been grouped within tariff classes in this Pricing Proposal, the existing approach to managing tariff assignment and reassignment is demonstrated to align with the requirements established by the AER. Accordingly, no change is required to current practices. The process whereby new customers are assigned to tariff classes and tariffs, following the receipt of a connection application by the customer or their retailer, follows the decision tree shown in Figure 15. In the application of this process, a customer that lodges an application to modify or upgrade an existing network connection is treated in the same manner as a new customer. Figure 15 – Assignment of new and upgraded customer connections to tariff classes
This decision tree in Figure 15 highlights the existing process whereby customers are assigned to a tariff class and then to an individual tariff. The process relies upon a systematic sequence of decisions based on the information provided with the customer’s application for supply. Decisions associated with assignment to the four tariff classes have been separately identified in red. Second-order decisions on individual tariffs are also shown. These relate to type of meter, load size and billing frequency, and lead to the customer’s assignment to a specific tariff within the tariff class. The two major decisions that determine the tariff class assessment are as follows:
The nature of a customer’s usage: (ie. residential, business, or unmetered); and
MRSRIResidential
Subtransmission and HV
With cont. load QBSROPCL
Connectionapplication
HV kVA dem >10MW loct’l TUoSHV kVA demand Zone ZVSHV kVA demand VHVS
ST kVA demand loct’l TUoS
LV kVA demand VLVS2 rate B2R124BSR124With cont. load BSR124OPCL2 rate MB2RMBSRWith cont. load MBSROPCL
MRSRWith cont. load MRSROPCLCont. load only MOPCL
With cont. load MRSRCLICont. load only MOPCLI
Business
Type 1-4
Residential
Tariff Class and Tariff
QRSRWith cont. load QRSROPCLCont. load only QOPCL
2 rate QB2RQBSR
Monthly
Quarterly
VUU
Type 1-4
Monthly
Quarterly
LVUU24OUU
Type ofconsumption?
Tariff class assignment decision point
Tariff assignment decision point
Key:
Type ofmeter?
Size ofload?
Type ofmeter?
Usagepattern
Unmetered
LV Business
Size ofload?
Type 5,6 Billfreq.?
High Voltagezone
High VoltageNetwork
Subtransmission
Unmetered
LowVoltage
Type 5,6
Connection voltage &location?
Billfreq.?

SA Power Networks
Pricing Proposal 76 29/04/2013
For business customers only, the nature and extent of the associated connection to the network (the connection voltage, whether located within in the network or directly connected to a zone substation).
The process employed by SA Power Networks therefore appropriately takes account the factors in clause 3(a) and 3(b) of the AER’s Appendix B. Moreover, in the event that remotely–read interval metering or other similar metering technology is installed at the customer’s premises as a result of a regulatory obligation or requirement during the 2010-15 regulatory control period, SA Power Networks will review this procedure.
11.2.1 Customers with micro-generation
As SA Power Networks’ tariff class assignment process is applied to the net customer demand on the network, it does not distinguish between customers that have micro-generation and those without. The only aspects of the connection process that distinguish customers with micro-generation are technical requirements, principally to ensure public and employee safety in the event of disconnection of supply to a site with generation. SA Power Networks’ tariff assignment process therefore ensures that the requirements in clause 4(a) and 4(b) of the AER’s Appendix B are met.
11.3 Reassignment of existing customers to another existing or a new tariff during the next regulatory control period
Within each tariff class, there has been and will continue to be movement between individual tariffs. This is particularly the case with the customers on the Low Voltage Business tariff class. Whilst there has been no active review process by SA Power Networks to ensure that customers whose consumption and usage profiles change are maintained on the most advantageous tariff, customers are eligible to apply for transfer between tariffs and do so if it is to their advantage. This has been the case with business customers that have transferred from the inclining block tariff to capacity based tariffs and between different capacity-based tariffs. SA Power Networks considers that preserving this level of flexibility to permit customers the option of transferring to a tariff more appropriate to their operations within a tariff class is of great importance to customers. The four tariff classes that SA Power Networks has established are sufficiently broad to ensure that all the existing customers are within the appropriate tariff class and that it is unlikely that customers will seek to migrate or be reclassified to a different tariff class during the course of the determination. Transfer between tariff classes would be limited to circumstances where the nature of usage or level of consumption changed significantly, for example where a residence was redeveloped to become a small business such as a medical surgery or office. Notwithstanding that the reassignment of customers’ tariff classes is unlikely during the 2010-15 regulatory control period, SA Power Networks would do so in accordance with the provisions of the AER’s Decision, in particular clause 5 of the Appendix B.
11.3.1 Obsolete tariffs
In addition to the current tariffs illustrated in Figure 15, in common with most utilities, at the time of the 2010 determination SA Power Networks had a range of obsolete business tariffs that were all within the two business tariff classes. No new or modified customer connections were subsequently
SA Power Networks
Pricing Proposal 77 29/04/2013
assigned to these obsolete tariffs. As the opportunity arose, customers were transferred from obsolete tariffs to current tariffs within the same tariff class, and by 2010/11, all customers were transferred from the obsolete kW demand tariffs. When a customer was transferred from an obsolete tariff to one of the current tariffs, the choice of the appropriate tariff followed the tariff assignment decision process in section 11.2 of this Pricing Proposal. The formulation of the WAPC requires that the reasonable estimates provisions be used to create equivalent historical quantities. These reasonable estimates would be detailed in Appendix I (Confidential) but are not required for this Pricing proposal as no customers were reassigned away from obsolete tariffs in 2011/12 and 2012/13 and are not forecast to be reassigned in 2013/14.
11.4 Objections to proposed assignments and reassignments
The AER has established requirements that SA Power Networks must follow in assigning or reassigning customers to tariff classes and in responding to objections to SA Power Networks’ tariff class assignments. These are set out in the Decision as clauses 7 to 10 of the AER’s Appendix B. The requirements that SA Power Networks must follow have been documented in an internal procedure entitled ”Manual 18, Network Tariff Manual”. This document is attached as to this Pricing Proposal as Appendix K and is published on SA Power Networks’ web site.
SA Power Networks
Pricing Proposal 78 29/04/2013
12 Alternative Control Services – metering services
In the 2010 Decision, in Appendix A the AER has classified the following distribution services provided by SA Power Networks as alternative control services28:
A.5 ‘Variable’ ‘standard’ ‘small’ customer metering services
a. The provision of:
i. meter provision services in respect of meters meeting the requirements of a metering installation type 6, and
ii. quarterly meter read services in respect of meters meeting the requirements of a metering installation type 6.
b. For the purposes of this clause, meter provision services include, but are not necessarily limited to, any asset related and administrative costs associated with the provision, installation, maintenance, and replacement of the meter (including circumstances in which SA Power Networks meter is replaced by that of another meter provider).
A.6 ‘Exceptional’ large customer metering services
a. Meter provision services provided in respect of meters meeting the requirements of a metering installation type 1, metering installation type 2, metering installation type 3 or metering installation type 4 installed prior to 1 July 2000.
b. Meter provision services provided in accordance with the requirement of clause 27 of SA Power Networks’ distribution licence as in force at 30 June 2005.
c. For the purposes of this clause, meter provision services include, but are not necessarily limited to, any asset related and administrative costs associated with the provision, installation, maintenance, and replacement of the meter (including circumstances in which SA Power Networks meter is replaced by that of another meter provider).
This section of the Pricing Proposal sets out SA Power Networks’ approach to the pricing of its alternative control services and demonstrates compliance with the Rules and the AER’s determination.
12.1 Regulatory requirements
12.1.1 Rule requirements
The Rule requirements pertaining to Pricing Proposals that apply to direct control services are applicable to both standard control services and alternative control services. The Rule requirements applicable to standard control services have been set out in various earlier sections of this Pricing Proposal. For brevity, these clauses have not been repeated in this section on alternative control services. The relevant Rule clauses are as follows:
6.18.2 Pricing proposals - section 4.1.1, page 14.
6.18.3 Tariff classes - section 4.1.1, page 14.
6.18.4 Principles governing assignment or re-assignment of customers to tariff classes and assessment and review of basis of charging - section 11.1, page 73.
6.18.5 Pricing principles – section 8.5, page 58.
28 AER, Final Decision – South Australia distribution determination 2010–11 to 2014–15, May 2010, p. 281.

SA Power Networks
Pricing Proposal 79 29/04/2013
12.1.2 Requirements of the AER’s Decisions
The AER’s Draft and Final Decisions imposed the following requirements on SA Power Networks in respect of alternative control services29, 30:
1. In accordance with clause 6.12.1(12) of the NER, the control mechanism for the alternative control services provided by SA Power Networks is a weighted average price cap. The applicable WAPC formula was set out in section 17.3 of the draft AER’s draft decision. SA Power Networks is required to include proposed distribution tariff classes (n) and components (m) for both variable standard small customer metering services and the two exceptional case metering services.
2. In accordance with clause 6.12.1(13) of the NER, SA Power Networks must demonstrate compliance with the control mechanism for alternative control services by providing, as part of its annual pricing proposal, the proposed tariffs which correspond to the price terms contained in the WAPC equation.
Consistent with requirement 1, SA Power Networks’ Revised Proposal incorporated one alternative control services tariff class for metering services comprising six meter provision tariffs. The AER accepted that the approach SA Power Networks used to develop the meter tariffs of the metering services tariff class was reasonable.31 Consistent with requirement 2, SA Power Networks’ Revised Proposal stated that SA Power Networks would demonstrate compliance with the control mechanism by annually providing the proposed tariffs that correspond to the price terms contained in the WAPC approved by the AER. The AER accepted this proposal.32 The AER accepted SA Power Networks’ proposal that the alternative control services X factor for each year of the next regulatory control period be made equal to deliver a smooth price path within the next regulatory control period. The AER also accepted SA Power Networks’ proposal to initially assign all metering service tariffs to a single alternative control tariff class33. The AER’s Final Decision confirmed that the Weighted Average Price Cap form of price control detailed in section 2.3.4 of this Pricing Proposal would apply to SA Power Networks’ alternative control metering services. The AER determined a constant X factor of -8.05% for the 2010-15 regulatory control period, as detailed in section 2.3.5. Appendix B of the AER’s Final Decision sets out the procedures for assigning and reassigning customers to tariff classes. SA Power Networks assumes these procedures apply, where relevant, to both standard control and alternative control services.
29 AER, draft Decision – South Australia distribution determination 2010–11 to 2014–15, 25 November 2009, pp. 422, 427. 30 AER, Final Decision – South Australia distribution determination 2010–11 to 2014–15, May 2010, p. 274. 31 AER, Final Decision, May 2010, pp. 258-261, 266. 32 AER, Final Decision, May 2010, p. 273. 33 AER, Final Decision, May 2010, p. 257.
SA Power Networks
Pricing Proposal 80 29/04/2013
12.2 Alternative control metering services tariff class
Clause 6.18.3(c) of the Rules requires SA Power Networks to constitute separate tariff classes for customers to whom standard control services are supplied and customers to whom alternative control services are supplied. SA Power Networks’ tariff classes for standard control services are described in section 11.1.2 of this Pricing Proposal. Clause 6.18.3(d) of the Rules requires SA Power Networks, in constituting tariff classes, to have regard for the need to group customers together on an economically efficient basis and avoid unnecessary transaction costs. Consistent with these requirements, SA Power Networks has constituted a single separate tariff class for its alternative control metering services. This tariff class comprises all six alternative control metering service tariffs. These are set out in Table 45.
12.3 Assignment and reassignment of customers to the alternative control metering service tariff class
SA Power Networks has assigned all of its metering service tariff customers to a single alternative control metering service tariff class. Any new metering services customer during the 2010-15 regulatory control period will be assigned to this tariff class. As there is only a single tariff class proposed, there will be no requirement to reassign customers to another alternative control tariff class during the 2010-15 regulatory control period.
12.4 Pricing principles
Clause 6.18.5 of the Rules sets out the pricing principles that must be complied with in respect of each tariff class, including a tariff class within the classification of alternative control services. As noted in section 12.2, SA Power Networks has established a single tariff class for its alternative control metering services.
12.4.1 Stand alone and avoidable costs of alternative control services
Rule 6.18.5(a) requires the revenue of each tariff class to lie on or between the stand-alone and avoidable costs of serving the customers in the tariff class. As described in SA Power Networks’ Revised Proposal, the methodology used to determine the cost relativities in respect of each of the tariffs34 within the metering services tariff class involved the determination of the variable cost of providing the metering services relevant to each tariff.35 These variable cost reflective tariff charges were applied to estimated customer numbers of the relevant tariffs to ensure the recovery of expected revenue, as set out in SA Power Networks’ Revised Proposal. This methodology delivers revenue from the alternative control services metering services tariff class that reflects the cost that would be avoided by not serving those customers.
34 Referred to as tariff components in the Revised Proposal. 35 While only ‘Variable’ ‘standard’ ‘small’ customer metering services are variable by definition, the analysis of the costs associated with Exceptional large customer metering services was undertaken in the same way.
SA Power Networks
Pricing Proposal 81 29/04/2013
Furthermore, given that 99.9% of alternative control services customers are subject to variable standard small customer metering services, stand-alone costs have been assessed as being approximately equal to the revenue from the alternative control services metering services tariff class. SA Power Networks’ metering tariff class therefore meets the requirements of Rule 6.18.5(a).
12.4.2 Long Run Marginal Costs and revenue recovery
Rule 6.18.5(b) requires each charging parameter for a tariff class to take into account the LRMC of providing that service. The long-run marginal cost is the change in the long-run total cost of providing the service resulting from a change in the quantity of services provided. There are no fixed inputs in the long run, only variable costs. This means that long-run marginal cost is the result of changes in the cost of all inputs, or (in long-run equilibrium at least) the equivalent of the long-run average total cost. From a practical perspective, long-run marginal cost can be disaggregated into two types of marginal costs, marginal operating costs (generally with short-run characteristics) and marginal capacity costs (exhibiting long-run characteristics).36 As required by the AER’s classification of alternative control services metering services, SA Power Networks’ determination of total alternative control services metering services costs for the next regulatory control period was undertaken on a solely variable cost basis. Having undertaken a variable cost based building block approach to determining the total variable costs (and thus revenue requirement) for the next regulatory control period, SA Power Networks’ operating expenditure divided by ‘output’ therefore reflects marginal operating costs, and its asset costs divided by ‘output’ reflect marginal capacity costs - together the long-run marginal cost. SA Power Networks has thus taken into account the long-run marginal cost in the development of the metering services tariffs. As noted in SA Power Networks Revised Proposal, the tariffs for metering services were determined having regard to the variable transaction costs associated with the services relevant to each tariff (by virtue of minimising the number of unique tariffs). As noted by the AER in the Final Determination, SA Power Networks created tariffs to ensure that the tariffs relevant to customers most likely to respond to price signals – the type 6 CT and type 1-4 exceptional meter customers – are explicitly cost reflective.37 Thus the requirements of Rule 6.18.5(b)(1) and (2) have been satisfied. SA Power Networks’ metering tariffs each have a single charging parameter that recovers the whole of the expected revenue. As a consequence, Rule 6.18.5(c) is not applicable.
12.5 Compliance with the AER determination
The WAPC equation applicable to SA Power Networks’ alternative control services metering services tariff class for the next regulatory control period is set out in section 17.4 of the AER’s Final Decision. This determination was subsequently varied by the Australian Competition Tribunal, as explained in
36 Marsden Jacob Associates “Estimation of Long Run Marginal Cost (LRMC)” 3 November 2004, p.10 (http://www.qca.org.au/files/QCALRMCFinal.pdf) 37 AER, Final Decision – South Australia distribution determination 2010–11 to 2014–15, May 2010, p.259
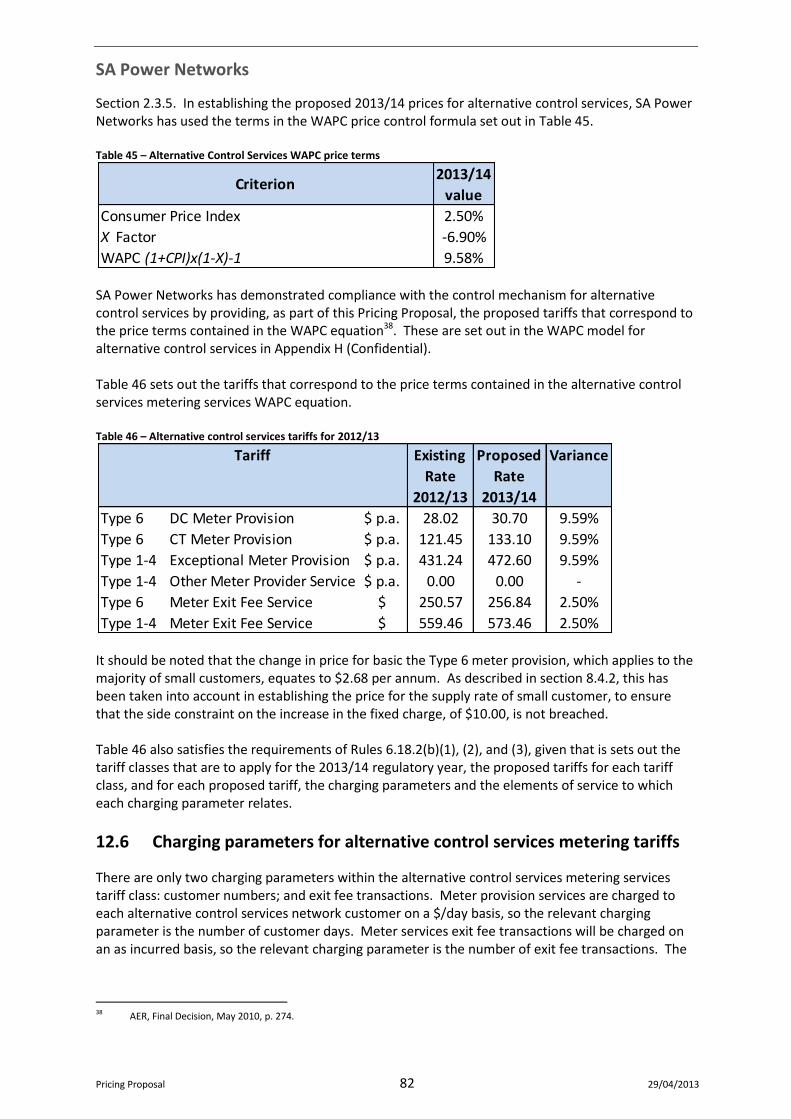
SA Power Networks
Pricing Proposal 82 29/04/2013
Section 2.3.5. In establishing the proposed 2013/14 prices for alternative control services, SA Power Networks has used the terms in the WAPC price control formula set out in Table 45. Table 45 – Alternative Control Services WAPC price terms
SA Power Networks has demonstrated compliance with the control mechanism for alternative control services by providing, as part of this Pricing Proposal, the proposed tariffs that correspond to the price terms contained in the WAPC equation38. These are set out in the WAPC model for alternative control services in Appendix H (Confidential). Table 46 sets out the tariffs that correspond to the price terms contained in the alternative control services metering services WAPC equation. Table 46 – Alternative control services tariffs for 2012/13
It should be noted that the change in price for basic the Type 6 meter provision, which applies to the majority of small customers, equates to $2.68 per annum. As described in section 8.4.2, this has been taken into account in establishing the price for the supply rate of small customer, to ensure that the side constraint on the increase in the fixed charge, of $10.00, is not breached. Table 46 also satisfies the requirements of Rules 6.18.2(b)(1), (2), and (3), given that is sets out the tariff classes that are to apply for the 2013/14 regulatory year, the proposed tariffs for each tariff class, and for each proposed tariff, the charging parameters and the elements of service to which each charging parameter relates.
12.6 Charging parameters for alternative control services metering tariffs
There are only two charging parameters within the alternative control services metering services tariff class: customer numbers; and exit fee transactions. Meter provision services are charged to each alternative control services network customer on a $/day basis, so the relevant charging parameter is the number of customer days. Meter services exit fee transactions will be charged on an as incurred basis, so the relevant charging parameter is the number of exit fee transactions. The
38 AER, Final Decision, May 2010, p. 274.
Criterion2013/14
value
Consumer Price Index 2.50%
X Factor -6.90%
WAPC (1+CPI)x(1-X)-1 9.58%
Existing
Rate
Proposed
Rate
Variance
2012/13 2013/14
Type 6 DC Meter Provision $ p.a. 28.02 30.70 9.59%
Type 6 CT Meter Provision $ p.a. 121.45 133.10 9.59%
Type 1-4 Exceptional Meter Provision $ p.a. 431.24 472.60 9.59%
Type 1-4 Other Meter Provider Service $ p.a. 0.00 0.00 -
Type 6 Meter Exit Fee Service $ 250.57 256.84 2.50%
Type 1-4 Meter Exit Fee Service $ 559.46 573.46 2.50%
Tariff
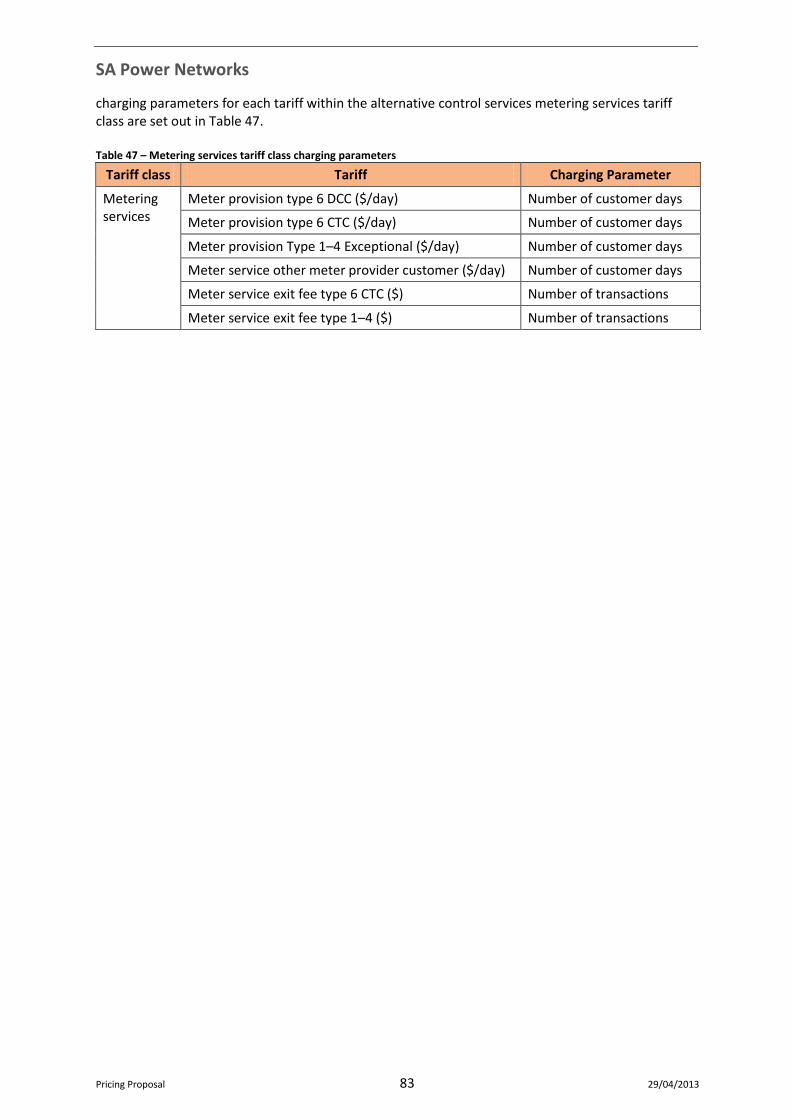
SA Power Networks
Pricing Proposal 83 29/04/2013
charging parameters for each tariff within the alternative control services metering services tariff class are set out in Table 47. Table 47 – Metering services tariff class charging parameters
Tariff class Tariff Charging Parameter
Metering services
Meter provision type 6 DCC ($/day) Number of customer days
Meter provision type 6 CTC ($/day) Number of customer days
Meter provision Type 1–4 Exceptional ($/day) Number of customer days
Meter service other meter provider customer ($/day) Number of customer days
Meter service exit fee type 6 CTC ($) Number of transactions
Meter service exit fee type 1–4 ($) Number of transactions
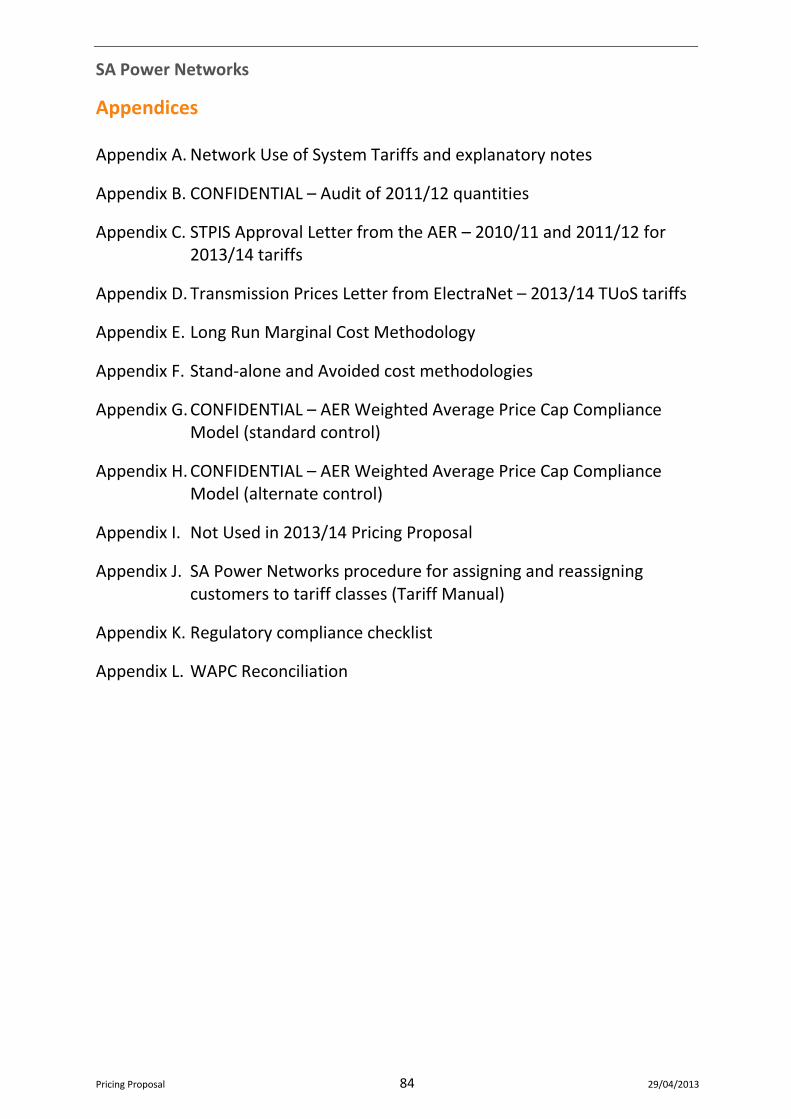
SA Power Networks
Pricing Proposal 84 29/04/2013
Appendices Appendix A. Network Use of System Tariffs and explanatory notes
Appendix B. CONFIDENTIAL – Audit of 2011/12 quantities
Appendix C. STPIS Approval Letter from the AER – 2010/11 and 2011/12 for 2013/14 tariffs
Appendix D. Transmission Prices Letter from ElectraNet – 2013/14 TUoS tariffs
Appendix E. Long Run Marginal Cost Methodology
Appendix F. Stand-alone and Avoided cost methodologies
Appendix G. CONFIDENTIAL – AER Weighted Average Price Cap Compliance Model (standard control)
Appendix H. CONFIDENTIAL – AER Weighted Average Price Cap Compliance Model (alternate control)
Appendix I. Not Used in 2013/14 Pricing Proposal
Appendix J. SA Power Networks procedure for assigning and reassigning customers to tariff classes (Tariff Manual)
Appendix K. Regulatory compliance checklist
Appendix L. WAPC Reconciliation