Embed Size (px)
Citation preview

7272019 saatelit segmentasi
httpslidepdfcomreaderfullsaatelit-segmentasi 15
AUTOMATED TECHNIQUES FOR SATELLITE IMAGE SEGMENTATION
A Guarnieri A Vettore
CIRGEO (Interdepartment Research Center for Geomatics)
via Romea 16 ndash 35020 Legnaro (Padua) ndash Italy
Phone +39-049-8272688 Fax +39-049-8272686e-mail antoniovettoreunipdit cirgeounipdit
Commission IV Working Group IV7
KEY WORDS satellite image classification image segmentation clustering
ABSTRACT
In this paper a combined method between ldquoclassicalrdquo and automatic approach for remote sensing image analysis is presentedTypically satellite images are used in order to detect the distribution of vegetation soil classes built-up areas roads and water bodyas rivers brooks lakes ecc Referring for example to Landsat-TM images the identification of such aspects is performed through theldquoclassicalrdquo approach of image classification Basically it deals with the use of pseudocolors andor combinations of various spectral
bands to acquire different thematic layers from the images In this work a further processing step is introduced namely a
segmentation algorithm is applied to color images in order to improve the image analysis both from qualitative and quantitative pointof view This algorithm belongs to the class of operations performed in the automatized unsupervised analysis of color images Lastrecent advances in the field of computer science and CPU performance have lead to a great reduction of data processing timesallowing therefore to apply also in the field of Remote Sensing more complex algorithms The proposed segmentation algorithm is
based on a feature-space approach and implements two processing techniques the ldquohistogram thresholdingrdquo [1] and the ldquoclusteringrdquo
[2] Some interesting results applied to Remote Sensing images will be provided
1 INTRODUCTION
So far tipical approach to remote sensed data analysis has been based on the use of different linear combinations betweenavailable spectral bands or creating new ones In this phase
satellite data are processed through the activity of a humanoperator which using RGB filters tries to identify severalclasses of elements appearing on them These classes aretherefore a way to group homogeneus land features such as
urban areas (roads buildings etc) vegetation (woods
cultivated and uncultivated soils) and water areas (rivers lakesetc) These layers are often represented in terms of pseudocolor images in order to better highlight a specific feature distributed
along the landThe basic concept underlying that procedure is similar to the
image segmentation the first step for the digital image processing normally adopted in the field of Computer Vision
This operation is performed through the partitioning of animage just in homogeneous and separated regions So far
segmentation techniques were applied only to gray scaleimages though the color information would allow a more
complete image representation In fact the application of thismethod was limited mainly by the computational time spent for color data processing larger than the one needed for gray color
data Today recent advances in the field of computer science
and CPU performance have lead to a great reduction of data processing times allowing therefore to apply these segmen-tation algorithms to the field of Remote Sensing as wellSeveral color image segmentation algorithms are nothing but
the development of previous gray color procedures others are
instead new ad-hoc techniques for color data which take intoaccount the physic relationship between light and colouredmaterials Such algorithms work in well defined color spaces
such as RGB HSI or HSV Anyway these reference frames arenot uniform ie color differences of same entity as perceived
or ldquomeasuredrdquo by human eye are not converted in similar
distances among the points representing such colors in theabove mentioned spaces These problem has been overcome byintroduction of uniform color spaces such as CIELuv and
CIELabAdopted color image segmentation algorithms can be classified
as follows
bull Feature-space based working on the space of coloured
figures in the image
bull Image-domain based ie they analyse the image geometry
and color
bull Physics based involving the physic relationships between
light and materials
In this work a segmentation algorithm belonging to the first
class was applied to remote sensed images in order to improvequalitatively and quantitatively the result of the ldquoclassicalrdquo
approach This means assuming that different classes of landfeatures are already identified through classical methodology a
further analysis step is introduced by application of proposedalgorithm to refine the results of previous phases The mainadvantage of this approach rely on the fact that the algorithm is
unsupervised therefore it doesnrsquot require any a-priori
information and can be fully automatizedThe paper is structured as follows in section 2 a brief overviewof feature-space based techniques is reported then in section 3the proposed algorithm is explained Some results of its
application to remote sensed images are presented in section 4while section 5 deals with the conclusions
2 THE FEATURE-SPACE BASED TECHNIQUES
Assuming that color is a constant property of the surface of eachobject appearing on the image the image segmentation can be
ISPRS
SIPT
IGU
UCI
CIG
ACSG
Table of contentsTable des matiegraveres
Authors indexIndex des auteurs
SearchRecherches
ExitSortir
Symposium on Geospatial Theory Processing and Applications
Symposium sur la theacuteorie les traitements et les applications des donneacutees Geacuteospatiales Ottawa 2002
7272019 saatelit segmentasi
httpslidepdfcomreaderfullsaatelit-segmentasi 25
addressed through two following different strategies clustering and histogram thresholding In the first technique image pixels are firstly mapped on a
certain color space in order to convert pixels to points Thenthese points are grouped in different sets (clusters) on the
ground of color information of each corresponding pixel In thisway given the above mentioned assumption the different
objects of the image can be discriminated in terms of theseclusters or cloud of points The distribution of the points insideeach cluster depends mainly upon the color change due to
shading effects and noise of the acquisition device It should be
noted that the clustering technique belongs to the unsupervised classification algorithms since no a- priori knowledge about theimage is required An example of clustering implementation is provided by the k-means algorithm it is widely used not only
for color image segmentation but also for applications involving
vectorization and data compressionThe histogram thresholding algorithm belongs to another classof segmentation techniques early applied to gray scale imagesIn this method image pixels are not mapped on a color space
but rather some ad-hoc histogram of color figures such as the
Hue are generated Through that model objects on the imagewill be identified as peaks of the histogram while the background will correspond to its depressions In the field of
color images a thresholding algorithm involves a bit more
complex implementation since it has to work in a 3D color space meaning that a 3D histogram has to be taken intoaccount Furthermore in this case histogram profiles become
quite jagged with spurious peaks which make the segmentationmore ambiguous
The proposed method is based on a combination of theclustering and histogram thresholding techniques In summary
given a remote sensed image the representative color are firstlyidentified by looking for the major color groups through thehistogram thresholding of the Hue information Then the larger
clusters in the planes of constant Hue are determined through
the k-means clustering algorithm
3 THE SEGMENTATION ALGORITHM
The segmentation process works in the CIELuv uniform
color space provided with euclidean norm ||Luv|| =|(L)2+(u)2+(v)2]12 In this space a cilindric coordinate
reference system was introduced (Huv Cuv L) whose Hueangle is defined as Huv=arctan(vu) the crominance as
Cuv=[(u)2+(v)2]12=LbullS and the saturation as S=([(u)2 +
(v)2]12)L The clustering method based on anisotropic
diffusion is a non-linear filtering technique which performs amore high selective smoothing in omogeneus regions and
almost null on the egdes while it retains all the edge-relatedinformation In this algorithm Hue H(xyt) and Saturation
S(xyt) are represented as one complex quantity theldquocrominance ldquo function K(xyt)=S(xyt)exp(j H(xyt)) whichis in turn diffused clustered and segmented The modeling of Hue and Saturation in the same function takes into account the
physic relationship existing between them It is well known that
Hue changes are negligible for low values of Saturation butnoticeable for high values The same operations are applied tothe lightness function L which is however processed
separatelyThe combination of this two parallel segmentation tasks leads to
a partitioned color image The overall scheme of developedalgorithm is showed in Figure 1
Figure 1 Scheme of the segmentation algorithmin the dashed box
The anisotropic diffusion has been numerically implemented
through the partial derivative equation of heat diffusion asstated below
)]()([)( t y x K t y xcdivt t y x K nablasdot=partpart (1)
where div is the divergence operator while nabla is the gradient
computed respect with the spatial variablesSuch equation can be discretized through a square lattice [3]
with the the complex Crominance value K(xyt) associated to
the vertices and the conductance coefficient c(xyt) associatedto the arcs (see Fig 2) as follows
t
jiW W ji E E
jiS S ji N N
t
ji
t
ji
K c K c
K c K c K K
]
[][][
1
part+part+
+part+partsdot+=+λ
(2)
7272019 saatelit segmentasi
httpslidepdfcomreaderfullsaatelit-segmentasi 35
where 0leλle025 is required for the stability of the numeric
scheme NSEW are symbols of the four vertices of the lattice
and symbol δ defines the four differences nearest-neighbour
)(
)(
)(
)(
1
1
1
1
ji ji jiW
ji ji ji E
ji ji jiS
ji ji ji N
K K K
K K K
K K K
K K K
minus=part
minus=part
minus=part
minus=part
minus
+
+
minus
(3)
Figure 2 The basic cell of 4-Nearest-Neighbours lattice
The conductance coefficient is upgraded at each iteration asfollows
|))((|][
|))((|][
|))((|][
|))((|][
t
jiW
t
jiW
t
ji E
t
ji E
t
jiS
t
jiS
t
ji N
t
ji N
K g c
K g c
K g c
K g c
part=
part=
part=
part=
(4)
The g(bull) function can be modeled according to one of thefollowing forms
( )
( ) ))(1(1)(
))(exp()(
2
2
Ak k g
Ak k g
nabla+=nabla
nablaminus=nabla(5)
The first function is best suited to highlight edges provided with
high contrast respect with the ones to low contrast while thesecond form discriminates better between large and smallregions In this algorithm the second function has been chosenin order to privilege the generation of large regions on the
image while the A costant value is dinamically computed for each iteration and set as 5 of maximum value of |(δK)|
Finally the image segmentation is obtained by separately partitioning of Crominance K d(xyt) and Lightness Ld(xyt)and then combining the results through the k-means algorithm
Given these settings the proposed algorithm based onanisotropic diffusion becomes easy to be implemented
featuring a local behavior ie the amount and the kind of smoothing are locally determined by the values of complex
crominance and are adopted for each image regionThe choice for values of parameters T1 and T2 plays a major role in the setup of clustering process The first T1 determines
the average distance among the clusters while the second T2
refers to to the average radius of a single cluster if consideredas a circle and it is not possible to fix an a-priori value suitablefor all images Anyway an estimate of T1 can be obtained from
data distribution estimating the radius of circle ρω in which a
certain percentage of the data (ω = 95) are contained
Tests peformed on remote sensed images showed that setting
T1=ρω 2 and T2=ρω 4 leads to excellent results on a large set of
images and in the same time provides a limited number of segments (often less than 7) which well represent the color
information of the image Parameter T2 can be freely set
provided that T2 lt T1 in order to avoid the overlapping of clusters
4 TEST AND RESULTS
In this section some examples of the application of the
segmentation algorithm are reported The remote sensed datawere acquired by the Landsat-TM satellite on 12261996 andon 05031997 In the first phase satellite images were processed using the classical approach working on three data
typologies natural color images infrared pseudocolor images
and enhanced pseudocolor imagesThe first class provides the user with photographic likewiseviewing of the terrain similar to color airphotos while thesecond allows to get a more in depth analysis discriminating
between different categories of the same object class For
instance it is possible to detect different forms of vegetationsince the reflectance changes are strongly related with themorphologic structure of the leaf Enhanced pseudocolor images
are obtained by combination of different bands and can be
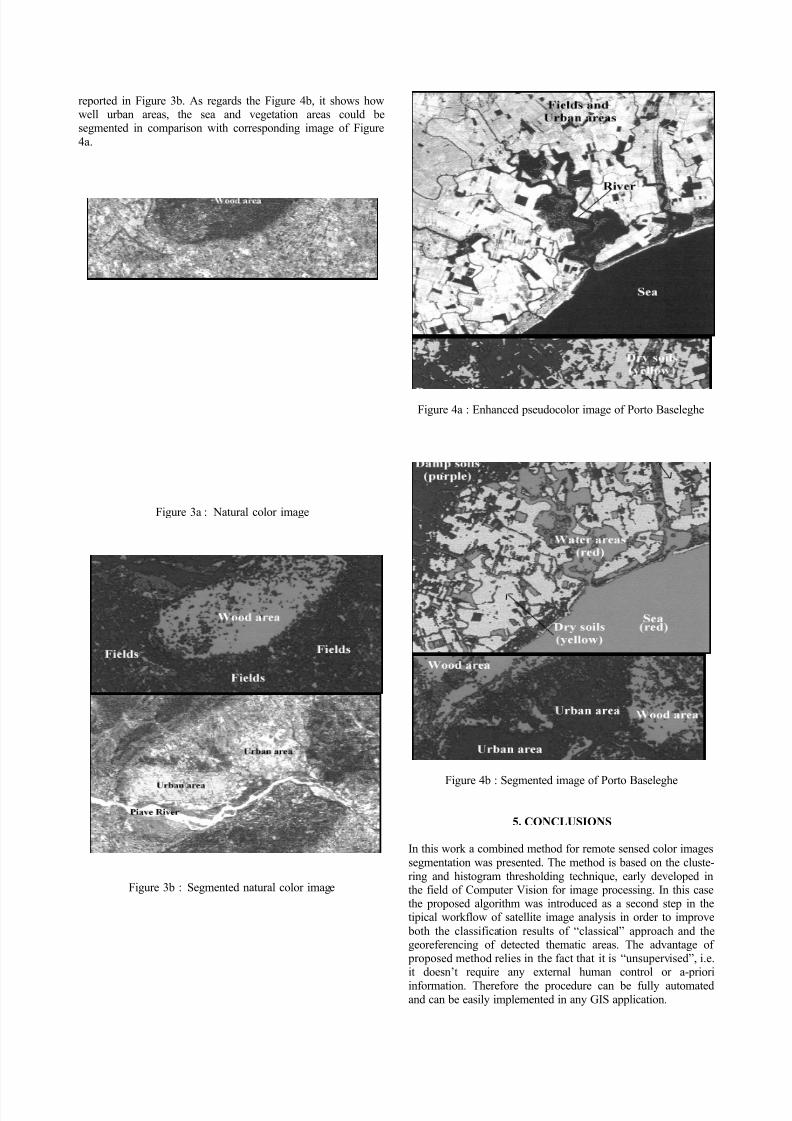
useful employed to detect the soil humidity urban andcultivated areas and so onFigure 3a shows a Landsat-TM natural image taken during
spring 1997 as result of application of RGB flter to TM1 TM2and TM3 bands Figure 4a shows a view of Porto Baseleghe
lagoon (Venice Northern Italy) by the mouth of Lemene riverwhich was taken during winter 1996 In this case the spectral
components of the image were enhanced through following
bands combinations band TM75 where TM75=(TM7-TM5)(TM7+TM5) band TM6 as (TM7-TM6)(TM7+TM6)
and finally band TM31 as (TM3-TM1)(TM3+TM1) The first
band enhances the reflectance changes due to humidity and soilcomposition the second discriminates between vegetation andurban areas while the last band allows to distinguish betweendamp or dry soils on the ground of their composition (organic
material kind of rocks)Results of application of segmentation algorithm to theseimages are showed in figures 3b and 4b in which clusters wereearly depicted in pseudocolors but in this paper have to be
converted them in gray scale Though it is not easy to appreciate
by eye the performance of the algorithm the results can besummarized as follows Referring to Figure 3 the segmentation
of this image allowed to discriminate perfectly between thewood area (in red in the resulting segmented color image) andcultivated and dry soils (respectively in green and blue) as
7272019 saatelit segmentasi
httpslidepdfcomreaderfullsaatelit-segmentasi 45
reported in Figure 3b As regards the Figure 4b it shows howwell urban areas the sea and vegetation areas could besegmented in comparison with corresponding image of Figure
4a
Figure 3a Natural color image
Figure 3b Segmented natural color image
Figure 4a Enhanced pseudocolor image of Porto Baseleghe
Figure 4b Segmented image of Porto Baseleghe
5 CONCLUSIONS
In this work a combined method for remote sensed color images
segmentation was presented The method is based on the cluste-
ring and histogram thresholding technique early developed inthe field of Computer Vision for image processing In this casethe proposed algorithm was introduced as a second step in thetipical workflow of satellite image analysis in order to improve
both the classification results of ldquoclassicalrdquo approach and thegeoreferencing of detected thematic areas The advantage of proposed method relies in the fact that it is ldquounsupervisedrdquo ieit doesnrsquot require any external human control or a-priori
information Therefore the procedure can be fully automatedand can be easily implemented in any GIS application
7272019 saatelit segmentasi
httpslidepdfcomreaderfullsaatelit-segmentasi 55
Performance of the algorithm were assessed by comparison between the results of ldquoclassicalrdquo Remote Sensing imageanalysis with the ones of the presented method which were
applied to the same set of satellite images As showed in previous section the segmentation algorithm could be success-
fully applied also to pseudocolor images providing excellentresults if the image is composed by wide and well defined
regions Unfortunately if the satellite image is fragmented andshows very similar colors distributed in a large amount of smallregions the segmentation algorithm provides often an ambi-
guous and unsatisfactory result
ACKNOWLEDGMENTS
This work was developed with the project ldquoTechniques for automatic processing of data acquired by integrated systemrdquo partly financed by MURST (Italian Ministry of University andResearch) in year 2001 as project of relevant National interest
National coordinator Giorgio Manzoni head of the Research
unit Antonio Vettore
REFERENCES
[1] Lucchese L Mitra SK 1998 An algorithm for
unsupervised color images segmentation Proc of 1998 IEEE 2nd Workshop on multimedia signal processing
Redondo Beach CA USA pp 33-38
[2] Lucchese L Mitra sK 1999 Unsupervised segmentationof color images based on k-means clustering in the chroma-ticity plane Proc of IEEE Workshop on content-based
access of images and video libraries (CBAIVL rsquo99) Fort
Collins CO USA
[3] Perona P Malik J 1990 Scale space and edge detectionusing anisotropic diffusion IEEE Trans on PAMI Vol 12
No 7 pp 629-639 July 1990

7272019 saatelit segmentasi
httpslidepdfcomreaderfullsaatelit-segmentasi 25
addressed through two following different strategies clustering and histogram thresholding In the first technique image pixels are firstly mapped on a
certain color space in order to convert pixels to points Thenthese points are grouped in different sets (clusters) on the
ground of color information of each corresponding pixel In thisway given the above mentioned assumption the different
objects of the image can be discriminated in terms of theseclusters or cloud of points The distribution of the points insideeach cluster depends mainly upon the color change due to
shading effects and noise of the acquisition device It should be
noted that the clustering technique belongs to the unsupervised classification algorithms since no a- priori knowledge about theimage is required An example of clustering implementation is provided by the k-means algorithm it is widely used not only
for color image segmentation but also for applications involving
vectorization and data compressionThe histogram thresholding algorithm belongs to another classof segmentation techniques early applied to gray scale imagesIn this method image pixels are not mapped on a color space
but rather some ad-hoc histogram of color figures such as the
Hue are generated Through that model objects on the imagewill be identified as peaks of the histogram while the background will correspond to its depressions In the field of
color images a thresholding algorithm involves a bit more
complex implementation since it has to work in a 3D color space meaning that a 3D histogram has to be taken intoaccount Furthermore in this case histogram profiles become
quite jagged with spurious peaks which make the segmentationmore ambiguous
The proposed method is based on a combination of theclustering and histogram thresholding techniques In summary
given a remote sensed image the representative color are firstlyidentified by looking for the major color groups through thehistogram thresholding of the Hue information Then the larger
clusters in the planes of constant Hue are determined through
the k-means clustering algorithm
3 THE SEGMENTATION ALGORITHM
The segmentation process works in the CIELuv uniform
color space provided with euclidean norm ||Luv|| =|(L)2+(u)2+(v)2]12 In this space a cilindric coordinate
reference system was introduced (Huv Cuv L) whose Hueangle is defined as Huv=arctan(vu) the crominance as
Cuv=[(u)2+(v)2]12=LbullS and the saturation as S=([(u)2 +
(v)2]12)L The clustering method based on anisotropic
diffusion is a non-linear filtering technique which performs amore high selective smoothing in omogeneus regions and
almost null on the egdes while it retains all the edge-relatedinformation In this algorithm Hue H(xyt) and Saturation
S(xyt) are represented as one complex quantity theldquocrominance ldquo function K(xyt)=S(xyt)exp(j H(xyt)) whichis in turn diffused clustered and segmented The modeling of Hue and Saturation in the same function takes into account the
physic relationship existing between them It is well known that
Hue changes are negligible for low values of Saturation butnoticeable for high values The same operations are applied tothe lightness function L which is however processed
separatelyThe combination of this two parallel segmentation tasks leads to
a partitioned color image The overall scheme of developedalgorithm is showed in Figure 1
Figure 1 Scheme of the segmentation algorithmin the dashed box
The anisotropic diffusion has been numerically implemented
through the partial derivative equation of heat diffusion asstated below
)]()([)( t y x K t y xcdivt t y x K nablasdot=partpart (1)
where div is the divergence operator while nabla is the gradient
computed respect with the spatial variablesSuch equation can be discretized through a square lattice [3]
with the the complex Crominance value K(xyt) associated to
the vertices and the conductance coefficient c(xyt) associatedto the arcs (see Fig 2) as follows
t
jiW W ji E E
jiS S ji N N
t
ji
t
ji
K c K c
K c K c K K
]
[][][
1
part+part+
+part+partsdot+=+λ
(2)
7272019 saatelit segmentasi
httpslidepdfcomreaderfullsaatelit-segmentasi 35
where 0leλle025 is required for the stability of the numeric
scheme NSEW are symbols of the four vertices of the lattice
and symbol δ defines the four differences nearest-neighbour
)(
)(
)(
)(
1
1
1
1
ji ji jiW
ji ji ji E
ji ji jiS
ji ji ji N
K K K
K K K
K K K
K K K
minus=part
minus=part
minus=part
minus=part
minus
+
+
minus
(3)
Figure 2 The basic cell of 4-Nearest-Neighbours lattice
The conductance coefficient is upgraded at each iteration asfollows
|))((|][
|))((|][
|))((|][
|))((|][
t
jiW
t
jiW
t
ji E
t
ji E
t
jiS
t
jiS
t
ji N
t
ji N
K g c
K g c
K g c
K g c
part=
part=
part=
part=
(4)
The g(bull) function can be modeled according to one of thefollowing forms
( )
( ) ))(1(1)(
))(exp()(
2
2
Ak k g
Ak k g
nabla+=nabla
nablaminus=nabla(5)
The first function is best suited to highlight edges provided with
high contrast respect with the ones to low contrast while thesecond form discriminates better between large and smallregions In this algorithm the second function has been chosenin order to privilege the generation of large regions on the
image while the A costant value is dinamically computed for each iteration and set as 5 of maximum value of |(δK)|
Finally the image segmentation is obtained by separately partitioning of Crominance K d(xyt) and Lightness Ld(xyt)and then combining the results through the k-means algorithm
Given these settings the proposed algorithm based onanisotropic diffusion becomes easy to be implemented
featuring a local behavior ie the amount and the kind of smoothing are locally determined by the values of complex
crominance and are adopted for each image regionThe choice for values of parameters T1 and T2 plays a major role in the setup of clustering process The first T1 determines
the average distance among the clusters while the second T2
refers to to the average radius of a single cluster if consideredas a circle and it is not possible to fix an a-priori value suitablefor all images Anyway an estimate of T1 can be obtained from
data distribution estimating the radius of circle ρω in which a
certain percentage of the data (ω = 95) are contained
Tests peformed on remote sensed images showed that setting
T1=ρω 2 and T2=ρω 4 leads to excellent results on a large set of
images and in the same time provides a limited number of segments (often less than 7) which well represent the color
information of the image Parameter T2 can be freely set
provided that T2 lt T1 in order to avoid the overlapping of clusters
4 TEST AND RESULTS
In this section some examples of the application of the
segmentation algorithm are reported The remote sensed datawere acquired by the Landsat-TM satellite on 12261996 andon 05031997 In the first phase satellite images were processed using the classical approach working on three data
typologies natural color images infrared pseudocolor images
and enhanced pseudocolor imagesThe first class provides the user with photographic likewiseviewing of the terrain similar to color airphotos while thesecond allows to get a more in depth analysis discriminating
between different categories of the same object class For
instance it is possible to detect different forms of vegetationsince the reflectance changes are strongly related with themorphologic structure of the leaf Enhanced pseudocolor images
are obtained by combination of different bands and can be
useful employed to detect the soil humidity urban andcultivated areas and so onFigure 3a shows a Landsat-TM natural image taken during
spring 1997 as result of application of RGB flter to TM1 TM2and TM3 bands Figure 4a shows a view of Porto Baseleghe
lagoon (Venice Northern Italy) by the mouth of Lemene riverwhich was taken during winter 1996 In this case the spectral
components of the image were enhanced through following
bands combinations band TM75 where TM75=(TM7-TM5)(TM7+TM5) band TM6 as (TM7-TM6)(TM7+TM6)
and finally band TM31 as (TM3-TM1)(TM3+TM1) The first
band enhances the reflectance changes due to humidity and soilcomposition the second discriminates between vegetation andurban areas while the last band allows to distinguish betweendamp or dry soils on the ground of their composition (organic
material kind of rocks)Results of application of segmentation algorithm to theseimages are showed in figures 3b and 4b in which clusters wereearly depicted in pseudocolors but in this paper have to be
converted them in gray scale Though it is not easy to appreciate
by eye the performance of the algorithm the results can besummarized as follows Referring to Figure 3 the segmentation
of this image allowed to discriminate perfectly between thewood area (in red in the resulting segmented color image) andcultivated and dry soils (respectively in green and blue) as
7272019 saatelit segmentasi
httpslidepdfcomreaderfullsaatelit-segmentasi 45
reported in Figure 3b As regards the Figure 4b it shows howwell urban areas the sea and vegetation areas could besegmented in comparison with corresponding image of Figure
4a
Figure 3a Natural color image
Figure 3b Segmented natural color image
Figure 4a Enhanced pseudocolor image of Porto Baseleghe
Figure 4b Segmented image of Porto Baseleghe
5 CONCLUSIONS
In this work a combined method for remote sensed color images
segmentation was presented The method is based on the cluste-
ring and histogram thresholding technique early developed inthe field of Computer Vision for image processing In this casethe proposed algorithm was introduced as a second step in thetipical workflow of satellite image analysis in order to improve
both the classification results of ldquoclassicalrdquo approach and thegeoreferencing of detected thematic areas The advantage of proposed method relies in the fact that it is ldquounsupervisedrdquo ieit doesnrsquot require any external human control or a-priori
information Therefore the procedure can be fully automatedand can be easily implemented in any GIS application
7272019 saatelit segmentasi
httpslidepdfcomreaderfullsaatelit-segmentasi 55
Performance of the algorithm were assessed by comparison between the results of ldquoclassicalrdquo Remote Sensing imageanalysis with the ones of the presented method which were
applied to the same set of satellite images As showed in previous section the segmentation algorithm could be success-
fully applied also to pseudocolor images providing excellentresults if the image is composed by wide and well defined
regions Unfortunately if the satellite image is fragmented andshows very similar colors distributed in a large amount of smallregions the segmentation algorithm provides often an ambi-
guous and unsatisfactory result
ACKNOWLEDGMENTS
This work was developed with the project ldquoTechniques for automatic processing of data acquired by integrated systemrdquo partly financed by MURST (Italian Ministry of University andResearch) in year 2001 as project of relevant National interest
National coordinator Giorgio Manzoni head of the Research
unit Antonio Vettore
REFERENCES
[1] Lucchese L Mitra SK 1998 An algorithm for
unsupervised color images segmentation Proc of 1998 IEEE 2nd Workshop on multimedia signal processing
Redondo Beach CA USA pp 33-38
[2] Lucchese L Mitra sK 1999 Unsupervised segmentationof color images based on k-means clustering in the chroma-ticity plane Proc of IEEE Workshop on content-based
access of images and video libraries (CBAIVL rsquo99) Fort
Collins CO USA
[3] Perona P Malik J 1990 Scale space and edge detectionusing anisotropic diffusion IEEE Trans on PAMI Vol 12
No 7 pp 629-639 July 1990

7272019 saatelit segmentasi
httpslidepdfcomreaderfullsaatelit-segmentasi 35
where 0leλle025 is required for the stability of the numeric
scheme NSEW are symbols of the four vertices of the lattice
and symbol δ defines the four differences nearest-neighbour
)(
)(
)(
)(
1
1
1
1
ji ji jiW
ji ji ji E
ji ji jiS
ji ji ji N
K K K
K K K
K K K
K K K
minus=part
minus=part
minus=part
minus=part
minus
+
+
minus
(3)
Figure 2 The basic cell of 4-Nearest-Neighbours lattice
The conductance coefficient is upgraded at each iteration asfollows
|))((|][
|))((|][
|))((|][
|))((|][
t
jiW
t
jiW
t
ji E
t
ji E
t
jiS
t
jiS
t
ji N
t
ji N
K g c
K g c
K g c
K g c
part=
part=
part=
part=
(4)
The g(bull) function can be modeled according to one of thefollowing forms
( )
( ) ))(1(1)(
))(exp()(
2
2
Ak k g
Ak k g
nabla+=nabla
nablaminus=nabla(5)
The first function is best suited to highlight edges provided with
high contrast respect with the ones to low contrast while thesecond form discriminates better between large and smallregions In this algorithm the second function has been chosenin order to privilege the generation of large regions on the
image while the A costant value is dinamically computed for each iteration and set as 5 of maximum value of |(δK)|
Finally the image segmentation is obtained by separately partitioning of Crominance K d(xyt) and Lightness Ld(xyt)and then combining the results through the k-means algorithm
Given these settings the proposed algorithm based onanisotropic diffusion becomes easy to be implemented
featuring a local behavior ie the amount and the kind of smoothing are locally determined by the values of complex
crominance and are adopted for each image regionThe choice for values of parameters T1 and T2 plays a major role in the setup of clustering process The first T1 determines
the average distance among the clusters while the second T2
refers to to the average radius of a single cluster if consideredas a circle and it is not possible to fix an a-priori value suitablefor all images Anyway an estimate of T1 can be obtained from
data distribution estimating the radius of circle ρω in which a
certain percentage of the data (ω = 95) are contained
Tests peformed on remote sensed images showed that setting
T1=ρω 2 and T2=ρω 4 leads to excellent results on a large set of
images and in the same time provides a limited number of segments (often less than 7) which well represent the color
information of the image Parameter T2 can be freely set
provided that T2 lt T1 in order to avoid the overlapping of clusters
4 TEST AND RESULTS
In this section some examples of the application of the
segmentation algorithm are reported The remote sensed datawere acquired by the Landsat-TM satellite on 12261996 andon 05031997 In the first phase satellite images were processed using the classical approach working on three data
typologies natural color images infrared pseudocolor images
and enhanced pseudocolor imagesThe first class provides the user with photographic likewiseviewing of the terrain similar to color airphotos while thesecond allows to get a more in depth analysis discriminating
between different categories of the same object class For
instance it is possible to detect different forms of vegetationsince the reflectance changes are strongly related with themorphologic structure of the leaf Enhanced pseudocolor images
are obtained by combination of different bands and can be
useful employed to detect the soil humidity urban andcultivated areas and so onFigure 3a shows a Landsat-TM natural image taken during
spring 1997 as result of application of RGB flter to TM1 TM2and TM3 bands Figure 4a shows a view of Porto Baseleghe
lagoon (Venice Northern Italy) by the mouth of Lemene riverwhich was taken during winter 1996 In this case the spectral
components of the image were enhanced through following
bands combinations band TM75 where TM75=(TM7-TM5)(TM7+TM5) band TM6 as (TM7-TM6)(TM7+TM6)
and finally band TM31 as (TM3-TM1)(TM3+TM1) The first
band enhances the reflectance changes due to humidity and soilcomposition the second discriminates between vegetation andurban areas while the last band allows to distinguish betweendamp or dry soils on the ground of their composition (organic
material kind of rocks)Results of application of segmentation algorithm to theseimages are showed in figures 3b and 4b in which clusters wereearly depicted in pseudocolors but in this paper have to be
converted them in gray scale Though it is not easy to appreciate
by eye the performance of the algorithm the results can besummarized as follows Referring to Figure 3 the segmentation
of this image allowed to discriminate perfectly between thewood area (in red in the resulting segmented color image) andcultivated and dry soils (respectively in green and blue) as
7272019 saatelit segmentasi
httpslidepdfcomreaderfullsaatelit-segmentasi 45
reported in Figure 3b As regards the Figure 4b it shows howwell urban areas the sea and vegetation areas could besegmented in comparison with corresponding image of Figure
4a
Figure 3a Natural color image
Figure 3b Segmented natural color image
Figure 4a Enhanced pseudocolor image of Porto Baseleghe
Figure 4b Segmented image of Porto Baseleghe
5 CONCLUSIONS
In this work a combined method for remote sensed color images
segmentation was presented The method is based on the cluste-
ring and histogram thresholding technique early developed inthe field of Computer Vision for image processing In this casethe proposed algorithm was introduced as a second step in thetipical workflow of satellite image analysis in order to improve
both the classification results of ldquoclassicalrdquo approach and thegeoreferencing of detected thematic areas The advantage of proposed method relies in the fact that it is ldquounsupervisedrdquo ieit doesnrsquot require any external human control or a-priori
information Therefore the procedure can be fully automatedand can be easily implemented in any GIS application
7272019 saatelit segmentasi
httpslidepdfcomreaderfullsaatelit-segmentasi 55
Performance of the algorithm were assessed by comparison between the results of ldquoclassicalrdquo Remote Sensing imageanalysis with the ones of the presented method which were
applied to the same set of satellite images As showed in previous section the segmentation algorithm could be success-
fully applied also to pseudocolor images providing excellentresults if the image is composed by wide and well defined
regions Unfortunately if the satellite image is fragmented andshows very similar colors distributed in a large amount of smallregions the segmentation algorithm provides often an ambi-
guous and unsatisfactory result
ACKNOWLEDGMENTS
This work was developed with the project ldquoTechniques for automatic processing of data acquired by integrated systemrdquo partly financed by MURST (Italian Ministry of University andResearch) in year 2001 as project of relevant National interest
National coordinator Giorgio Manzoni head of the Research
unit Antonio Vettore
REFERENCES
[1] Lucchese L Mitra SK 1998 An algorithm for
unsupervised color images segmentation Proc of 1998 IEEE 2nd Workshop on multimedia signal processing
Redondo Beach CA USA pp 33-38
[2] Lucchese L Mitra sK 1999 Unsupervised segmentationof color images based on k-means clustering in the chroma-ticity plane Proc of IEEE Workshop on content-based
access of images and video libraries (CBAIVL rsquo99) Fort
Collins CO USA
[3] Perona P Malik J 1990 Scale space and edge detectionusing anisotropic diffusion IEEE Trans on PAMI Vol 12
No 7 pp 629-639 July 1990
7272019 saatelit segmentasi
httpslidepdfcomreaderfullsaatelit-segmentasi 45
reported in Figure 3b As regards the Figure 4b it shows howwell urban areas the sea and vegetation areas could besegmented in comparison with corresponding image of Figure
4a
Figure 3a Natural color image
Figure 3b Segmented natural color image
Figure 4a Enhanced pseudocolor image of Porto Baseleghe
Figure 4b Segmented image of Porto Baseleghe
5 CONCLUSIONS
In this work a combined method for remote sensed color images
segmentation was presented The method is based on the cluste-
ring and histogram thresholding technique early developed inthe field of Computer Vision for image processing In this casethe proposed algorithm was introduced as a second step in thetipical workflow of satellite image analysis in order to improve
both the classification results of ldquoclassicalrdquo approach and thegeoreferencing of detected thematic areas The advantage of proposed method relies in the fact that it is ldquounsupervisedrdquo ieit doesnrsquot require any external human control or a-priori
information Therefore the procedure can be fully automatedand can be easily implemented in any GIS application
7272019 saatelit segmentasi
httpslidepdfcomreaderfullsaatelit-segmentasi 55
Performance of the algorithm were assessed by comparison between the results of ldquoclassicalrdquo Remote Sensing imageanalysis with the ones of the presented method which were
applied to the same set of satellite images As showed in previous section the segmentation algorithm could be success-
fully applied also to pseudocolor images providing excellentresults if the image is composed by wide and well defined
regions Unfortunately if the satellite image is fragmented andshows very similar colors distributed in a large amount of smallregions the segmentation algorithm provides often an ambi-
guous and unsatisfactory result
ACKNOWLEDGMENTS
This work was developed with the project ldquoTechniques for automatic processing of data acquired by integrated systemrdquo partly financed by MURST (Italian Ministry of University andResearch) in year 2001 as project of relevant National interest
National coordinator Giorgio Manzoni head of the Research
unit Antonio Vettore
REFERENCES
[1] Lucchese L Mitra SK 1998 An algorithm for
unsupervised color images segmentation Proc of 1998 IEEE 2nd Workshop on multimedia signal processing
Redondo Beach CA USA pp 33-38
[2] Lucchese L Mitra sK 1999 Unsupervised segmentationof color images based on k-means clustering in the chroma-ticity plane Proc of IEEE Workshop on content-based
access of images and video libraries (CBAIVL rsquo99) Fort
Collins CO USA
[3] Perona P Malik J 1990 Scale space and edge detectionusing anisotropic diffusion IEEE Trans on PAMI Vol 12
No 7 pp 629-639 July 1990