Embed Size (px)
Citation preview

Sabancı HoldingIndustrials SBU
2
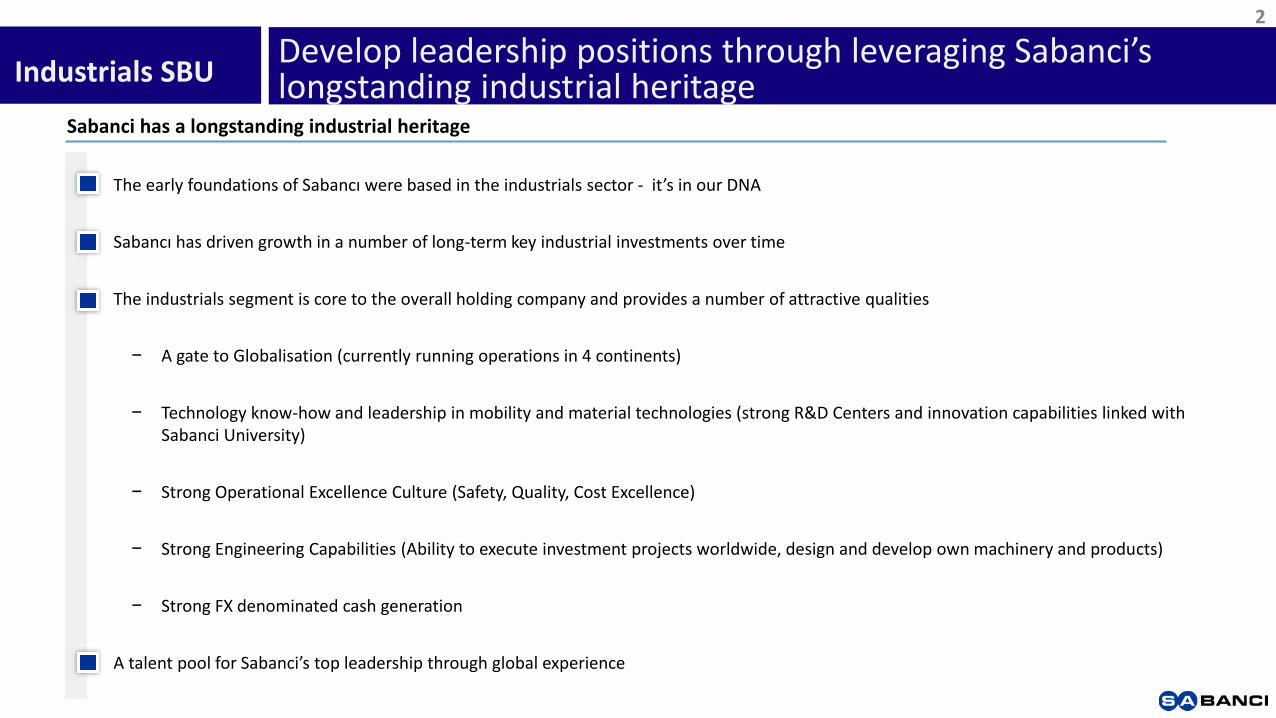
Develop leadership positions through leveraging Sabanci’slongstanding industrial heritage
Sabanci has a longstanding industrial heritage
• The early foundations of Sabancı were based in the industrials sector - it’s in our DNA
• Sabancı has driven growth in a number of long-term key industrial investments over time
• The industrials segment is core to the overall holding company and provides a number of attractive qualities
− A gate to Globalisation (currently running operations in 4 continents)
− Technology know-how and leadership in mobility and material technologies (strong R&D Centers and innovation capabilities linked with Sabanci University)
− Strong Operational Excellence Culture (Safety, Quality, Cost Excellence)
− Strong Engineering Capabilities (Ability to execute investment projects worldwide, design and develop own machinery and products)
− Strong FX denominated cash generation
• A talent pool for Sabanci’s top leadership through global experience
Industrials SBU
3
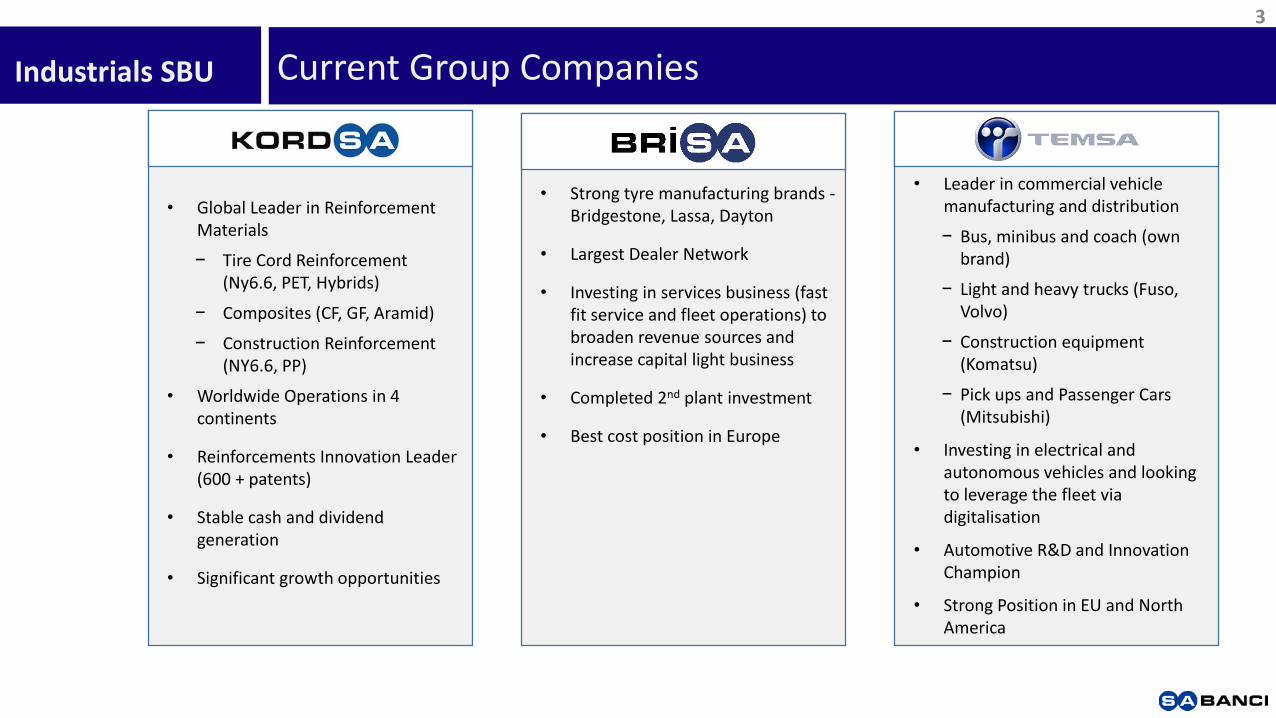
Current Group CompaniesIndustrials SBU
• Global Leader in Reinforcement Materials
− Tire Cord Reinforcement (Ny6.6, PET, Hybrids)
− Composites (CF, GF, Aramid)
− Construction Reinforcement (NY6.6, PP)
• Worldwide Operations in 4 continents
• Reinforcements Innovation Leader (600 + patents)
• Stable cash and dividend generation
• Significant growth opportunities
• Turkeys Leading Tire Company
• Strong tyre manufacturing brands -Bridgestone, Lassa, Dayton
• Largest Dealer Network
• Investing in services business (fast fit service and fleet operations) to broaden revenue sources and increase capital light business
• Completed 2nd plant investment
• Best cost position in Europe
• Turkeys Leading Tire Company
• Leader in commercial vehicle manufacturing and distribution
− Bus, minibus and coach (own brand)
− Light and heavy trucks (Fuso, Volvo)
− Construction equipment (Komatsu)
− Pick ups and Passenger Cars(Mitsubishi)
• Investing in electrical and autonomous vehicles and looking to leverage the fleet via digitalisation
• Automotive R&D and Innovation Champion
• Strong Position in EU and North America
4
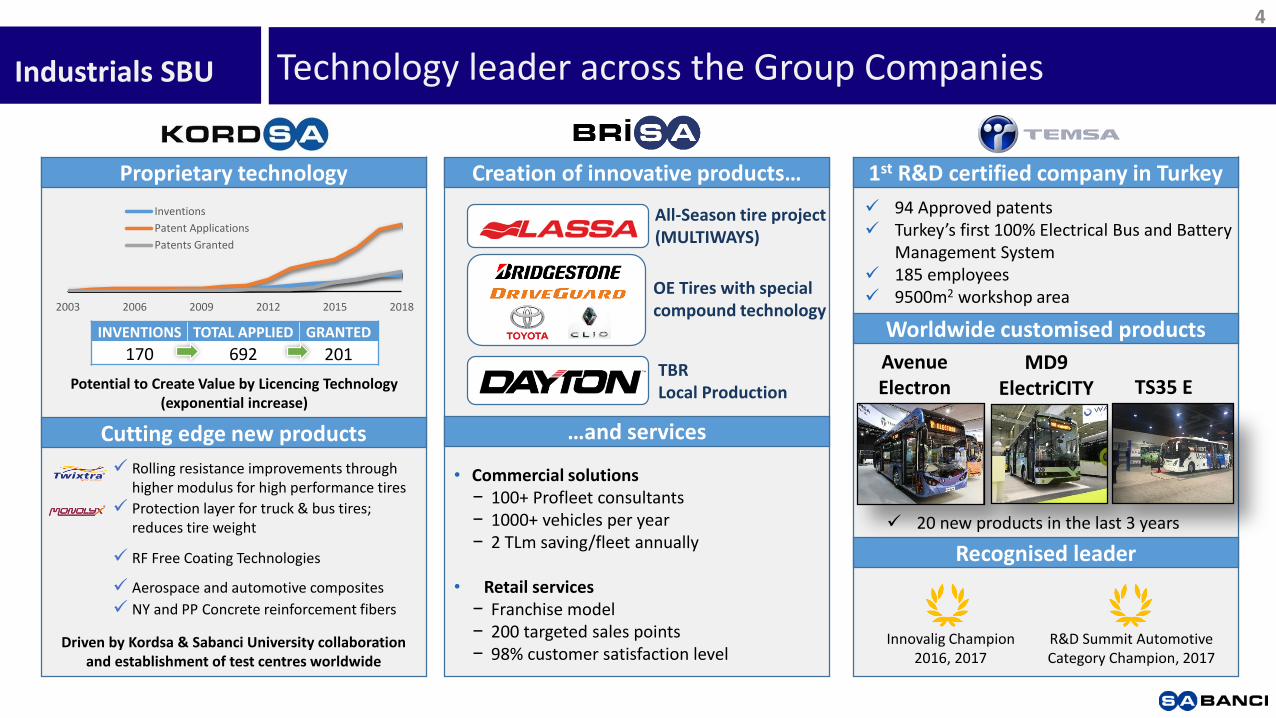
Technology leader across the Group CompaniesIndustrials SBU
Proprietary technology
2003 2006 2009 2012 2015 2018
Inventions
Patent Applications
Patents Granted
INVENTIONS TOTAL APPLIED GRANTED
170 692 201
Cutting edge new products
Rolling resistance improvements through higher modulus for high performance tires
Protection layer for truck & bus tires; reduces tire weight
RF Free Coating Technologies
Aerospace and automotive composites
NY and PP Concrete reinforcement fibers
Potential to Create Value by Licencing Technology (exponential increase)
Driven by Kordsa & Sabanci University collaboration and establishment of test centres worldwide
Creation of innovative products…
All-Season tire project (MULTIWAYS)
OE Tires with special compound technology
TBR Local Production
1st R&D certified company in Turkey
94 Approved patents Turkey’s first 100% Electrical Bus and Battery
Management System 185 employees 9500m2 workshop area
Worldwide customised products
Recognised leader
20 new products in the last 3 years
Innovalig Champion 2016, 2017
R&D Summit Automotive Category Champion, 2017
…and services
• Commercial solutions− 100+ Profleet consultants− 1000+ vehicles per year− 2 TLm saving/fleet annually
• Retail services− Franchise model− 200 targeted sales points− 98% customer satisfaction level
TS35 EMD9
ElectriCITYAvenue Electron
5
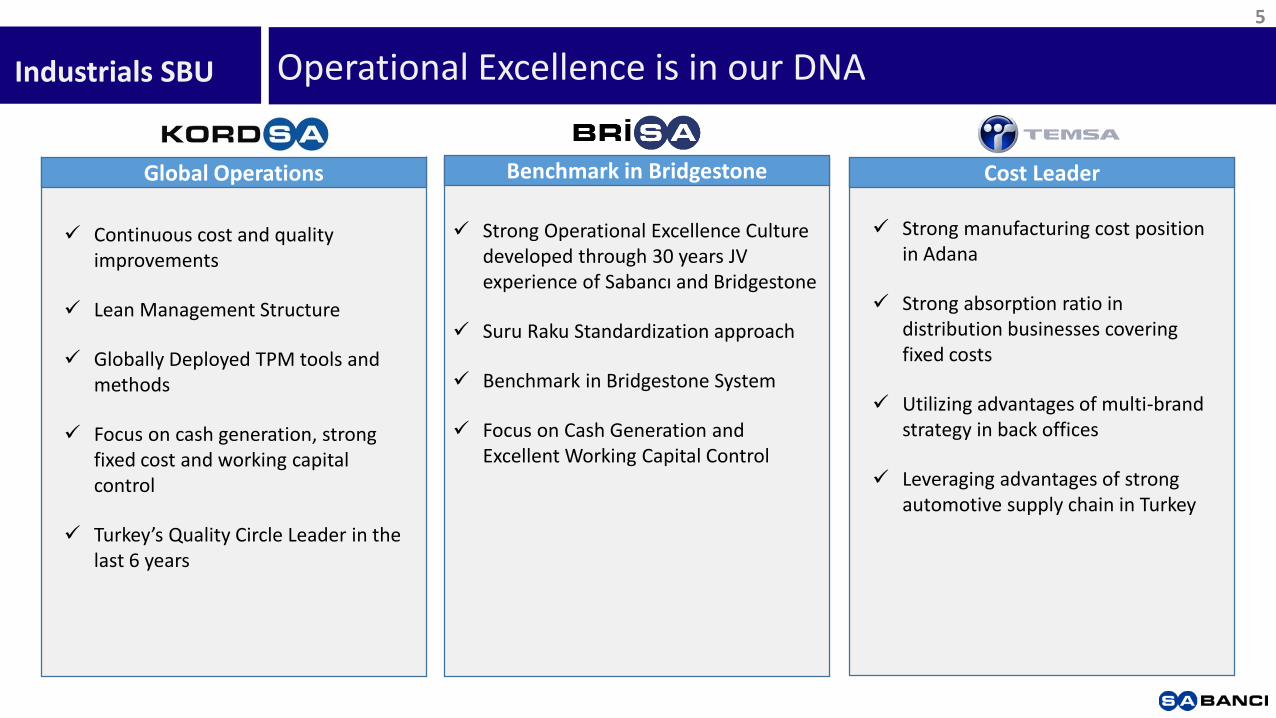
Operational Excellence is in our DNAIndustrials SBU
Global Operations Benchmark in Bridgestone Cost Leader
Strong manufacturing cost position in Adana
Strong absorption ratio in distribution businesses covering fixed costs
Utilizing advantages of multi-brand strategy in back offices
Leveraging advantages of strong automotive supply chain in Turkey
Continuous cost and quality improvements
Lean Management Structure
Globally Deployed TPM tools and methods
Focus on cash generation, strongfixed cost and working capital control
Turkey’s Quality Circle Leader in the last 6 years
Strong Operational Excellence Culture developed through 30 years JV experience of Sabancı and Bridgestone
Suru Raku Standardization approach
Benchmark in Bridgestone System
Focus on Cash Generation andExcellent Working Capital Control
6
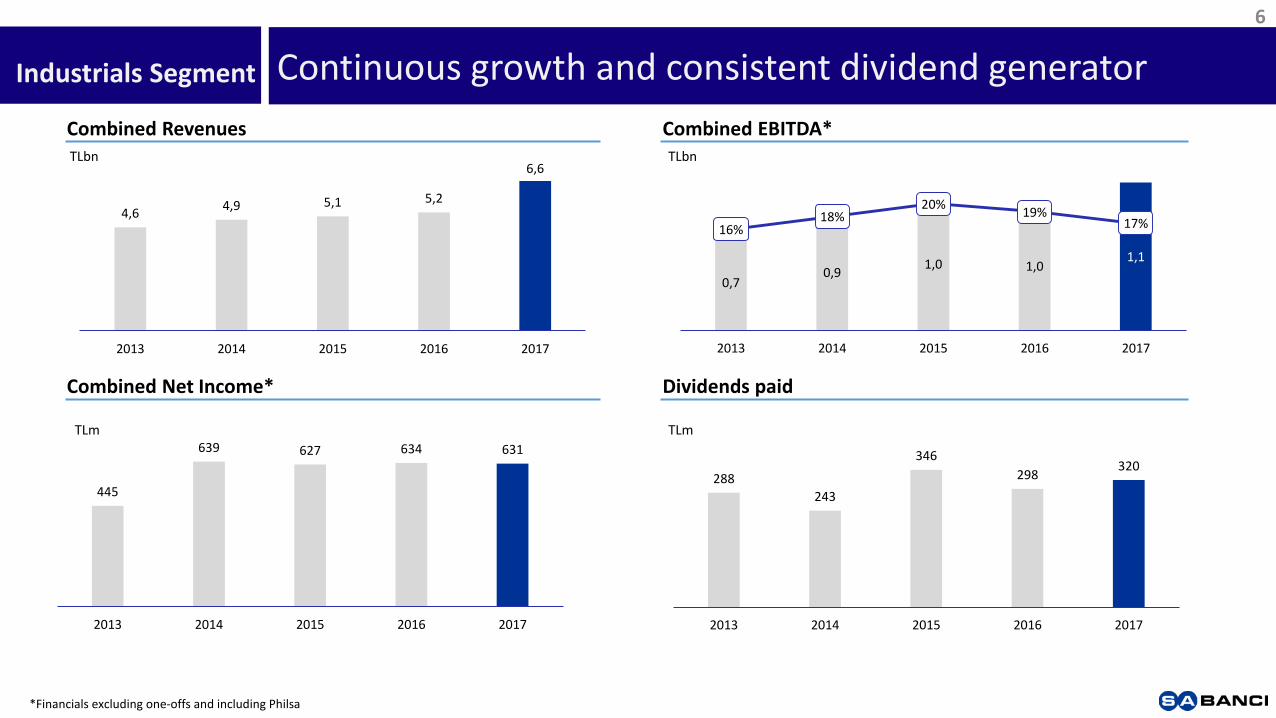
Continuous growth and consistent dividend generator
4,6 4,9 5,1 5,2
6,6
2013 2014 2015 2016 2017
0,7 0,9
1,0 1,0 1,1
16% 18%
20% 19%
17%
2013 2014 2015 2016 2017
288
243
346
298 320
2013 2014 2015 2016 2017
Combined Revenues Combined EBITDA*
Combined Net Income* Dividends paid
445
639 627 634 631
2013 2014 2015 2016 2017
TLbn TLbn
TLmTLm
Industrials Segment
*Financials excluding one-offs and including Philsa

491515
541568
687
2013 2017 2018E 2019E 2023E
949978
10091040
10731107
11421177
2016 2017 2018E 2019E 2020E 2021E 2022E 2023E
16371690
17411791
18511909
19622010
2016 2017 2018E 2019E 2020E 2021E 2022E 2023E
32563507
37874087
44174763
5164
5577
2016 2017 2018E 2019E 2020E 2021E 2022E 2023E
7
Strong growth trends for mobility and material technologies
Strong demand for advanced composites
Global Tire Market growth continue consistently
Source: LMC Tire Forecast
Million $
Million units
Industrials SBU
Reinforcement market expected to enjoy continued growthGlobal reinforcement marketkton
Global Bus Market growth will speed-upKunits
Source: Lucintel - Growth Opportunities in the Global Advanced Composites Market Source : Company Estimates
8
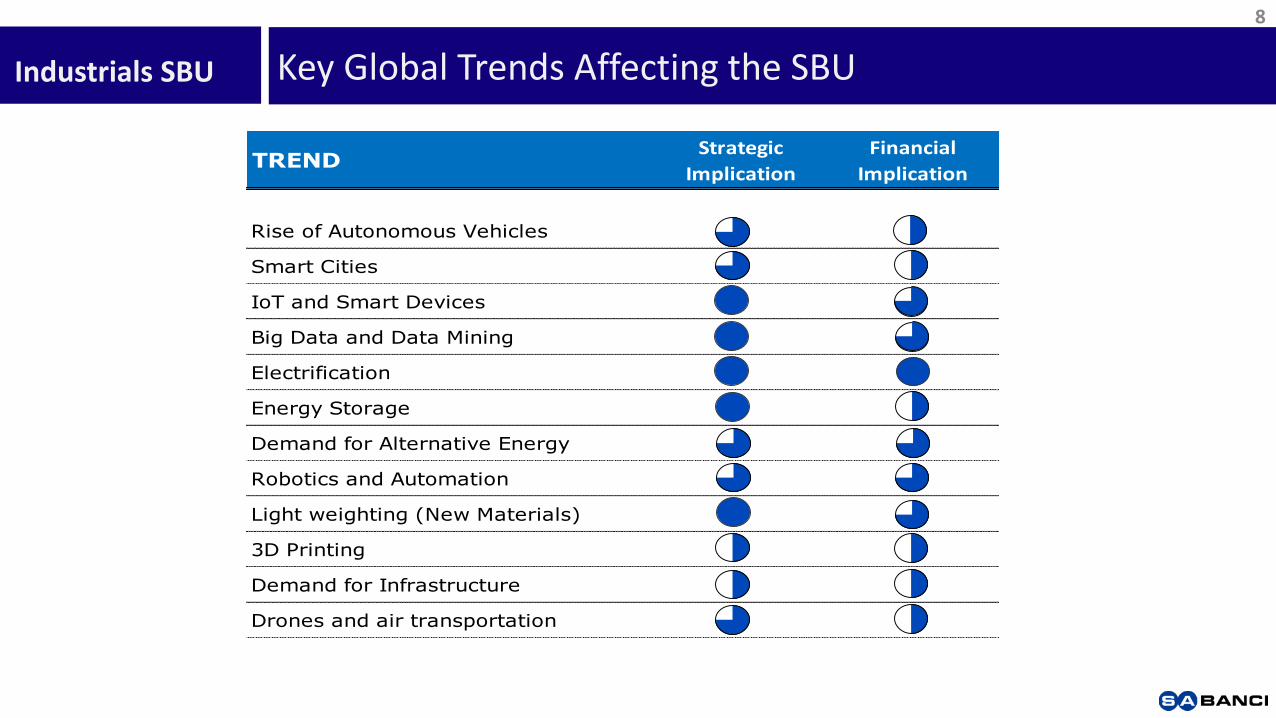
Industrials SBU Key Global Trends Affecting the SBU
TRENDStrategic
Implication
Financial
Implication
Rise of Autonomous Vehicles
Smart Cities
IoT and Smart Devices
Big Data and Data Mining
Electrification
Energy Storage
Demand for Alternative Energy
Robotics and Automation
Light weighting (New Materials)
3D Printing
Demand for Infrastructure
Drones and air transportation

9
Industrials SBU
Industry 4.0 Project Portfolio New Tyre Plant in Aksaray / Turkey Smart Mobility - Robotics
Developing next generation Industrials – “Industry 4.0”
Future TCF Digital Plant
Digital Quality
(Digital Yarn, Cord,Fabric Twins)
Robotics
Material Handling Robots,
Process Robots
Worldwide Shop Floor (IoT) System
Online Energy Monitoring
Turkey’s 1st Smart Tyre Plant
ASRS (Automated Storage and RetrivalSystem)
− Real time tracking and tracing material handling
− Auto Dopping, storage and transfer
Warehouse Control System
− Implement FIFO
Data Analitics
− Automatic decision making with real-time mc data
Visibility in Energy Consumption
Sustainable Infrastructure
− Natural Lighting, solar panels, high heat insulation coating in roof & walls, rain water collection & recycling system
Fleetics (Smart Mobility System)
− Combines data and cloud technologies to remotely monitor vehicle data in order to improve vehicle design
Autonomous Bus Driving
E-Cube
Introduction of robots in the manufacturing process
− Focused on increasing operating efficiencies
10
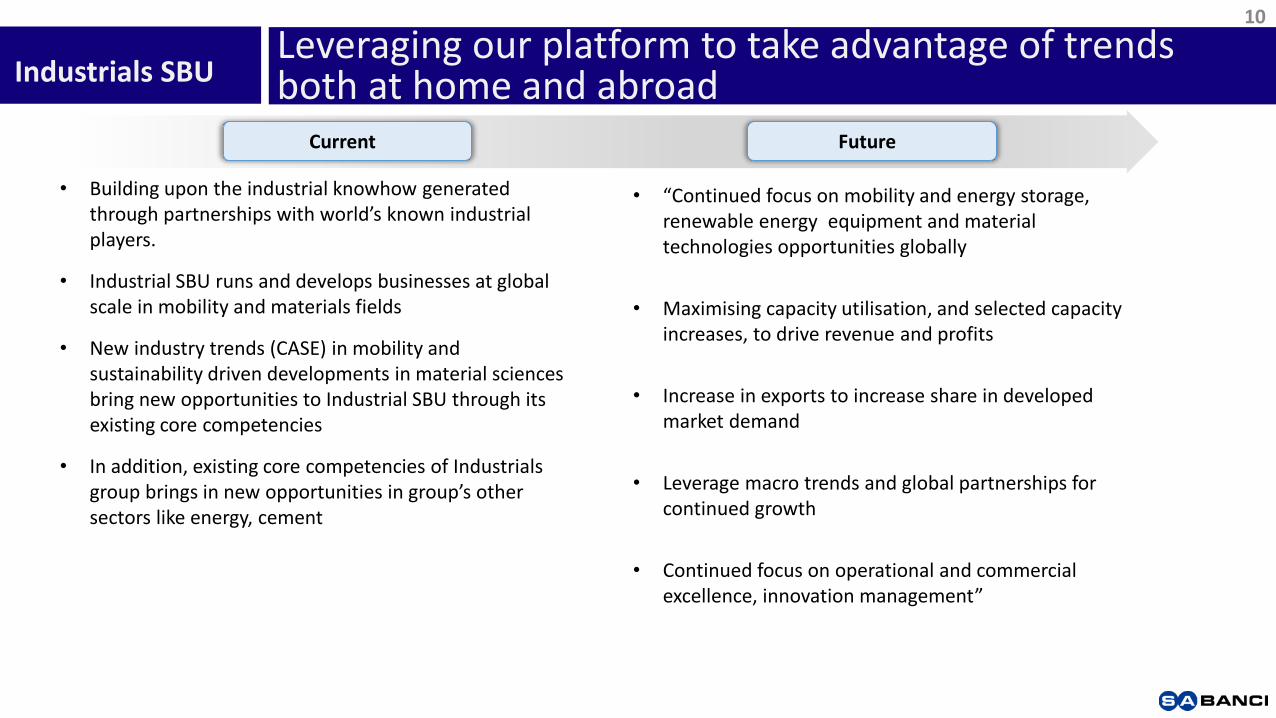
Leveraging our platform to take advantage of trends both at home and abroadIndustrials SBU
• Building upon the industrial knowhow generated through partnerships with world’s known industrial players.
• Industrial SBU runs and develops businesses at global scale in mobility and materials fields
• New industry trends (CASE) in mobility and sustainability driven developments in material sciences bring new opportunities to Industrial SBU through its existing core competencies
• In addition, existing core competencies of Industrials group brings in new opportunities in group’s other sectors like energy, cement
Current
• “Continued focus on mobility and energy storage, renewable energy equipment and material technologies opportunities globally
• Maximising capacity utilisation, and selected capacity increases, to drive revenue and profits
• Increase in exports to increase share in developed market demand
• Leverage macro trends and global partnerships for continued growth
• Continued focus on operational and commercial excellence, innovation management”
Future

11
New Generations Sabancı Industrials SBU
Capital Allocation Kordsa: Transformation to a Reinforcement Company
• Tire Reinforcement to Composites and Construction• Balanced Footprint: Tire-West to East, Composites-North America and Europe• Innovation and Technology
Temsa: Bus Manufacturer to a Mobility Player• Electrification: I Bus, Electron, E Cube• Fleetics• Local to Real Exporter
SBU: Looking for new opportunities at the intersections• Energy – Industry (Energy storage, Renewable Energy Technologies)• Material Sciences
Technology and Data Industry 4.0 in manufacturing processes Advanced Analytics Initiatives in Customer Processes RPA (Robotics Process Automation) in offices
Talent Management Developing Industry Leaders through Sabancı University Industry Leaders Program Best Practice Exchange through Quarterly Sabancı Excellence Visits Global Expatriation and Short Term Project Assignments
Kordsa Investor PresentationJuly, 2018
Disclaimer
External
The information and opinions contained in this documenthave been compiled by KORDSA Teknik Tekstil AnonimŞirketi (the “Company”) from sources believed to be reliableand in good faith, but no representation or warranty,expressed or implied, is made as to their accuracy,completeness or correctness. No undue reliance may beplaced for any purposes whatsoever on the informationcontained in this presentation or on its completeness,accuracy or fairness. This document may contain forward-looking statements by using such words as "may", "will","expect", "believe", "plan" and other similar terminologythat reflect the Company management’s current views,expectations, assumptions and forecasts with respect tocertain future events. As the actual performance of thecompanies may be affected by risks and uncertainties, allopinions, information and estimates contained in thisdocument constitute the Company’s current judgment andare subject to change, update, amend, supplement orotherwise alter without notice. Although it is believed thatthe information and analysis are correct and expectationsreflected in this document are reasonable, they may beaffected by a variety of variables and changes in underlyingassumptions that could cause actual results to differmaterially.
The Company does not undertake any obligation, anddisclaims any duty to update or revise any forwardlooking statements, whether as a result of newinformation or future events. Neither this document northe information contained within can construe anyinvestment advice, invitation or an offer to buy or sell theCompany and/or Its group companies’ shares. TheCompany cannot guarantee that the securities describedin this document constitute a suitable investment for allinvestors and nothing shall be taken as an inducement toany person to invest in or otherwise deal with any sharesof the Company and its group companies. Theinformation contained in this document is published forthe assistance of recipients, but is not to be relied uponas authoritative or taken in substitution for the exerciseof judgment by any recipient. You must not distribute theinformation in this document to, or cause it to be usedby, any person or entity in a place where its distributionor use would be unlawful. Neither the Company, its boardof directors, directors, managers, nor any of Itsemployees shall have any liability whatsoever for anydirect or consequential loss arising from any use of thisdocument or its contents.
2
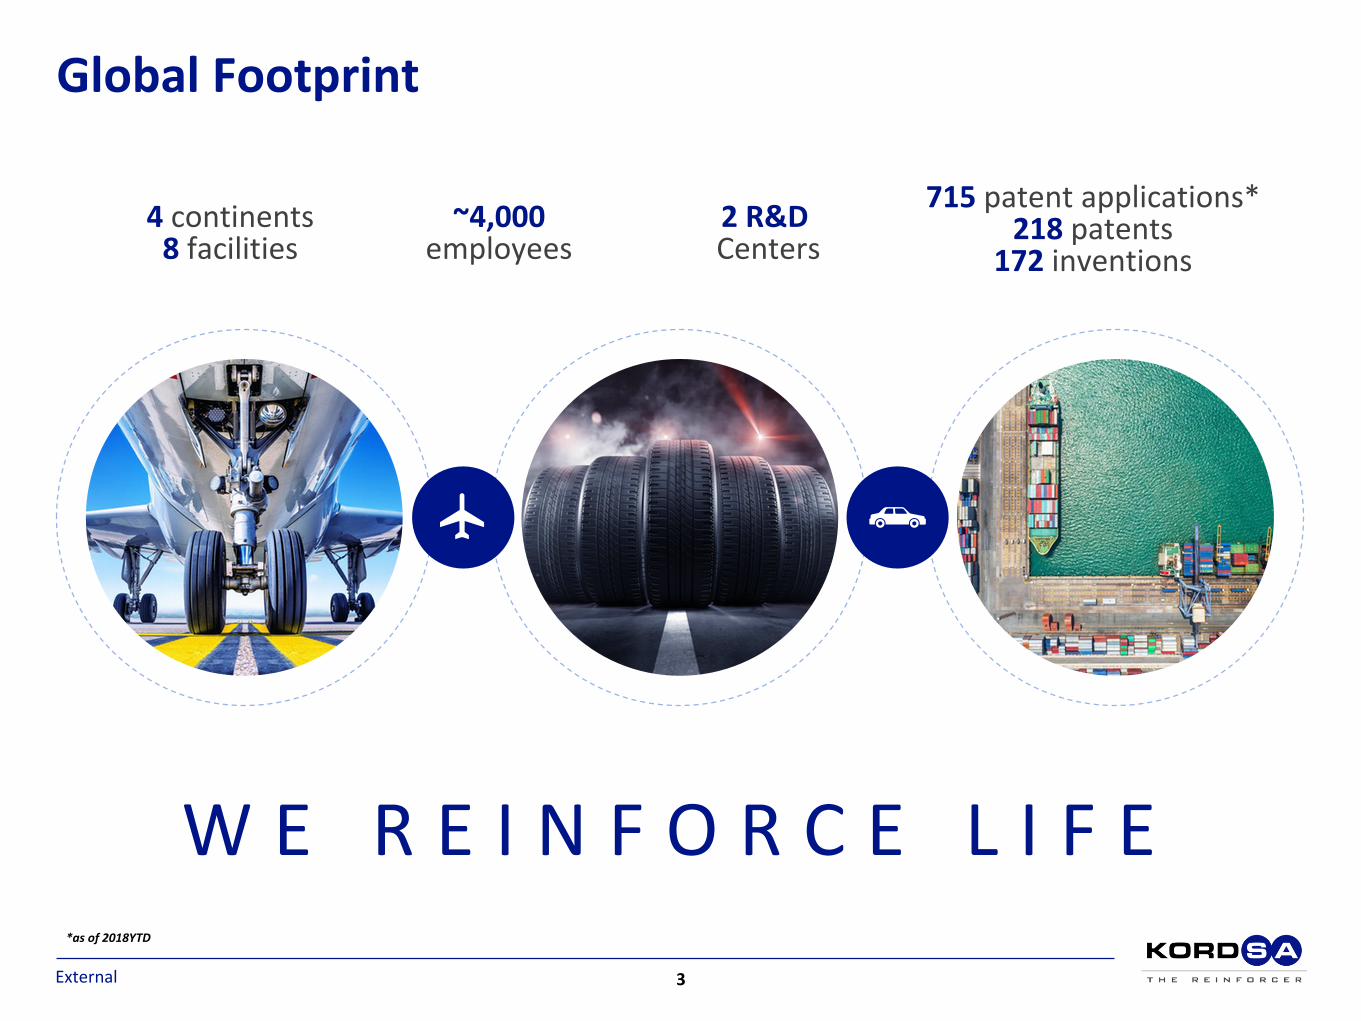
Global Footprint
4 continents8 facilities
~4,000 employees
2 R&DCenters
715 patent applications*218 patents
172 inventions
W E R E I N F O R C E L I F E
External
*as of 2018YTD
3
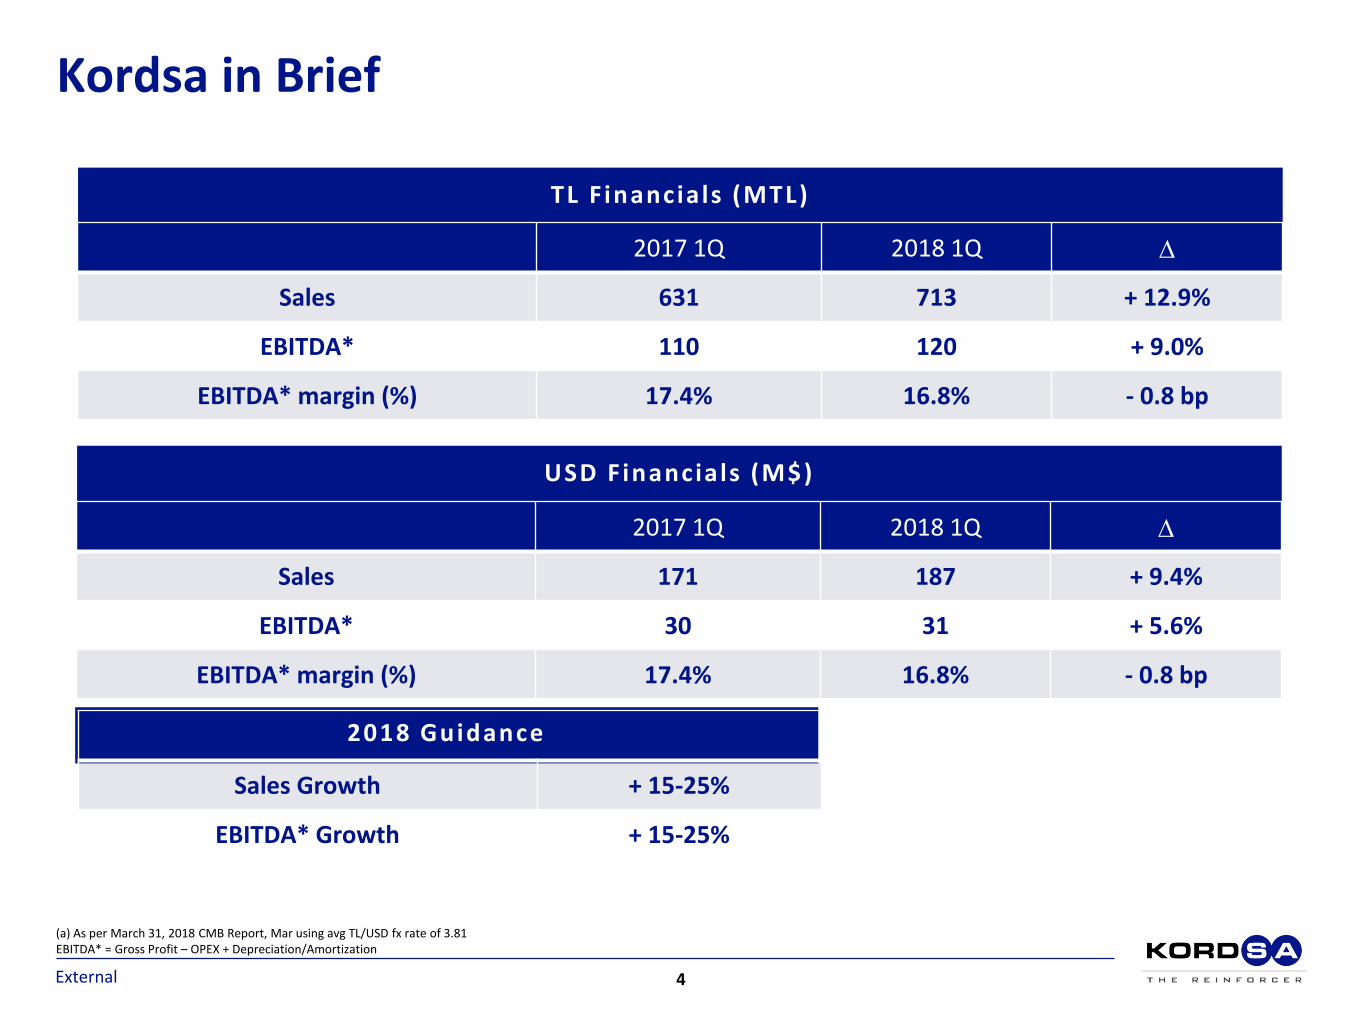
(a) As per March 31, 2018 CMB Report, Mar using avg TL/USD fx rate of 3.81EBITDA* = Gross Profit – OPEX + Depreciation/Amortization
TL F inancials (MTL)
2017 1Q 2018 1Q D
Sales 631 713 + 12.9%
EBITDA* 110 120 + 9.0%
EBITDA* margin (%) 17.4% 16.8% - 0.8 bp
External
Kordsa in Brief
USD F inancials (M$)
2017 1Q 2018 1Q D
Sales 171 187 + 9.4%
EBITDA* 30 31 + 5.6%
EBITDA* margin (%) 17.4% 16.8% - 0.8 bp
2018 Guidance
Sales Growth + 15-25%
EBITDA* Growth + 15-25%
4
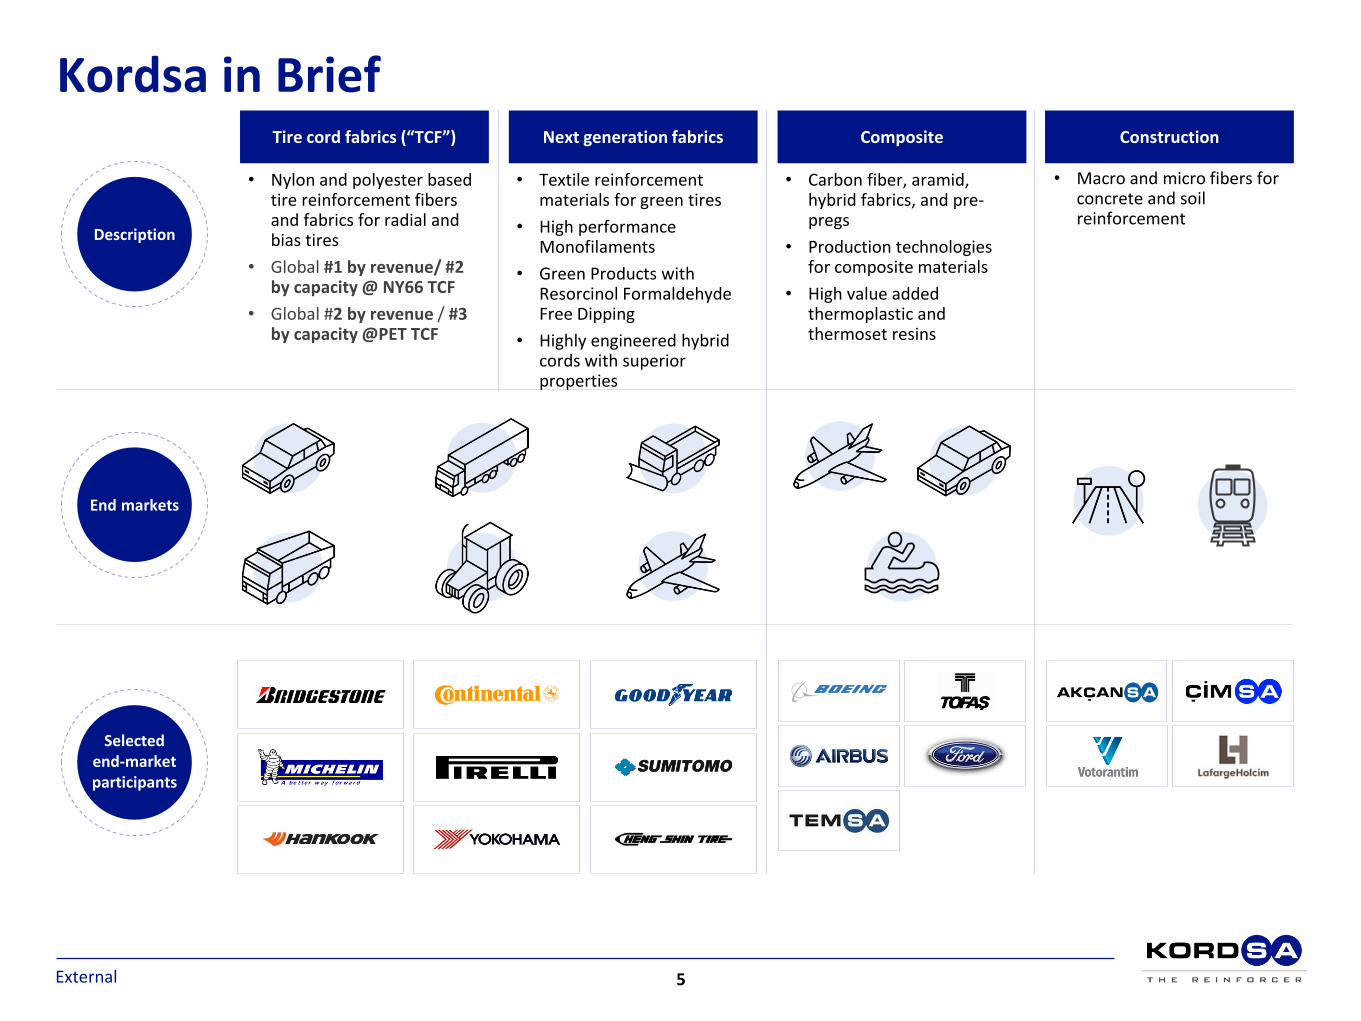
Description
End markets
Selected end-market participants
Tire cord fabrics (“TCF”) Next generation fabrics Composite
• Nylon and polyester based tire reinforcement fibers and fabrics for radial and bias tires
• Global #1 by revenue/ #2 by capacity @ NY66 TCF
• Global #2 by revenue / #3 by capacity @PET TCF
• Textile reinforcement materials for green tires
• High performance Monofilaments
• Green Products with Resorcinol Formaldehyde Free Dipping
• Highly engineered hybrid cords with superior properties
• Carbon fiber, aramid, hybrid fabrics, and pre-pregs
• Production technologies for composite materials
• High value added thermoplastic and thermoset resins
Construction
• Macro and micro fibers for concrete and soil reinforcement
External
Kordsa in Brief
5
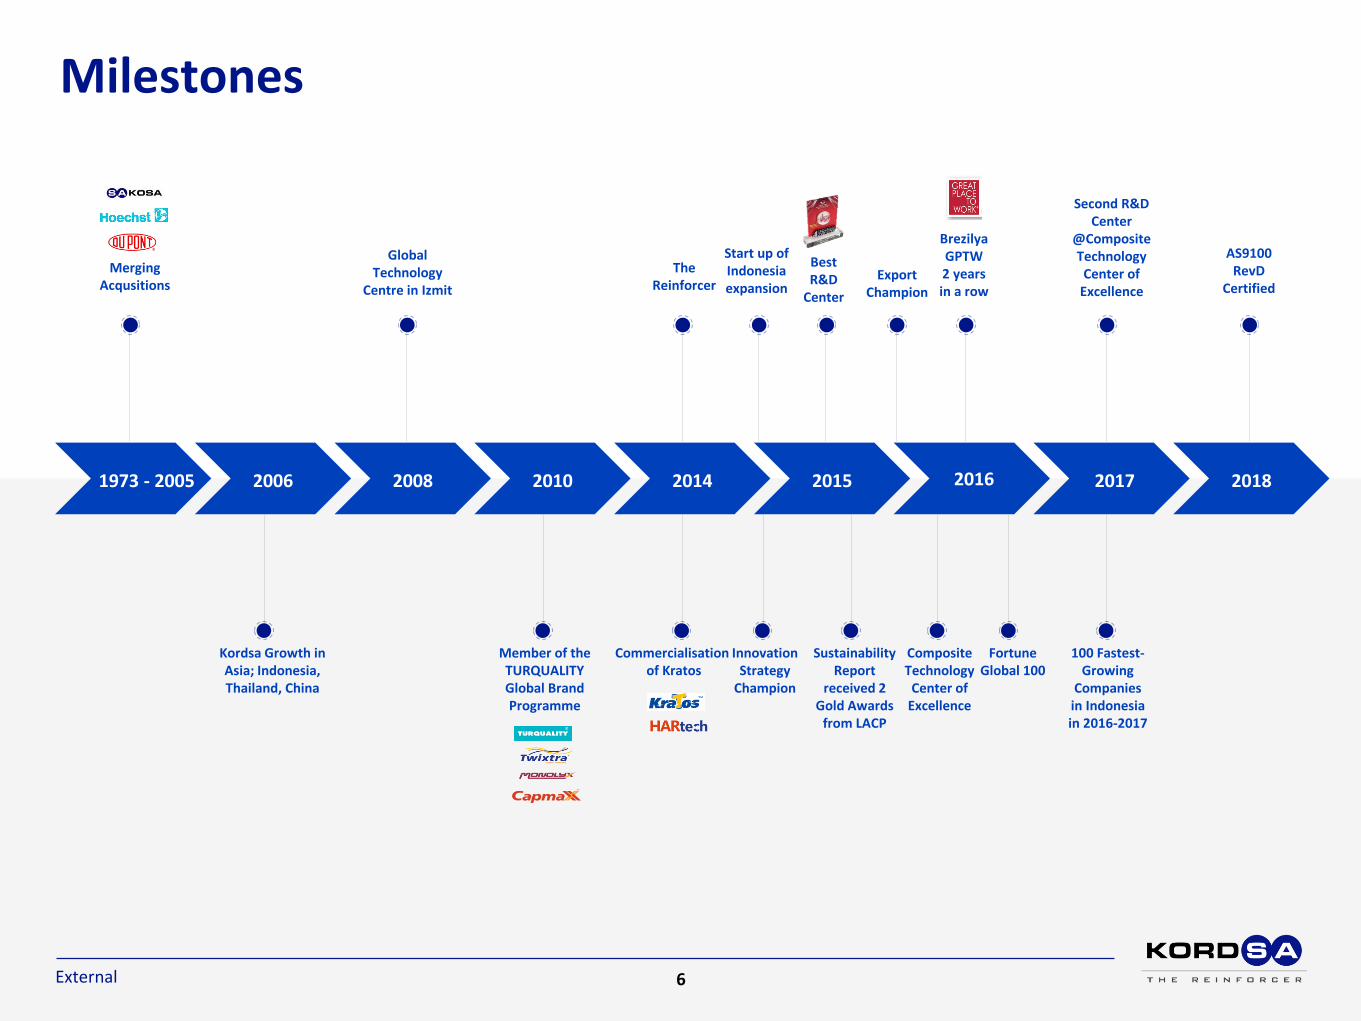
Milestones
External
1973 - 2005 2006 2008 2010 2014 2015 2016 2017 2018
MergingAcqusitions
Global Technology
Centre in Izmit
TheReinforcer
Start up of Indonesiaexpansion
Best R&D
Center
ExportChampion
Brezilya GPTW 2 yearsin a row
Second R&D Center
@Composite Technology
Center of Excellence
AS9100 RevD
Certified
Kordsa Growth in Asia; Indonesia, Thailand, China
Member of theTURQUALITY Global BrandProgramme
Commercialisationof Kratos
InnovationStrategy
Champion
SustainabilityReport
received 2 Gold Awards
from LACP
CompositeTechnology
Center of Excellence
FortuneGlobal 100
100 Fastest-Growing
Companiesin Indonesiain 2016-2017
6
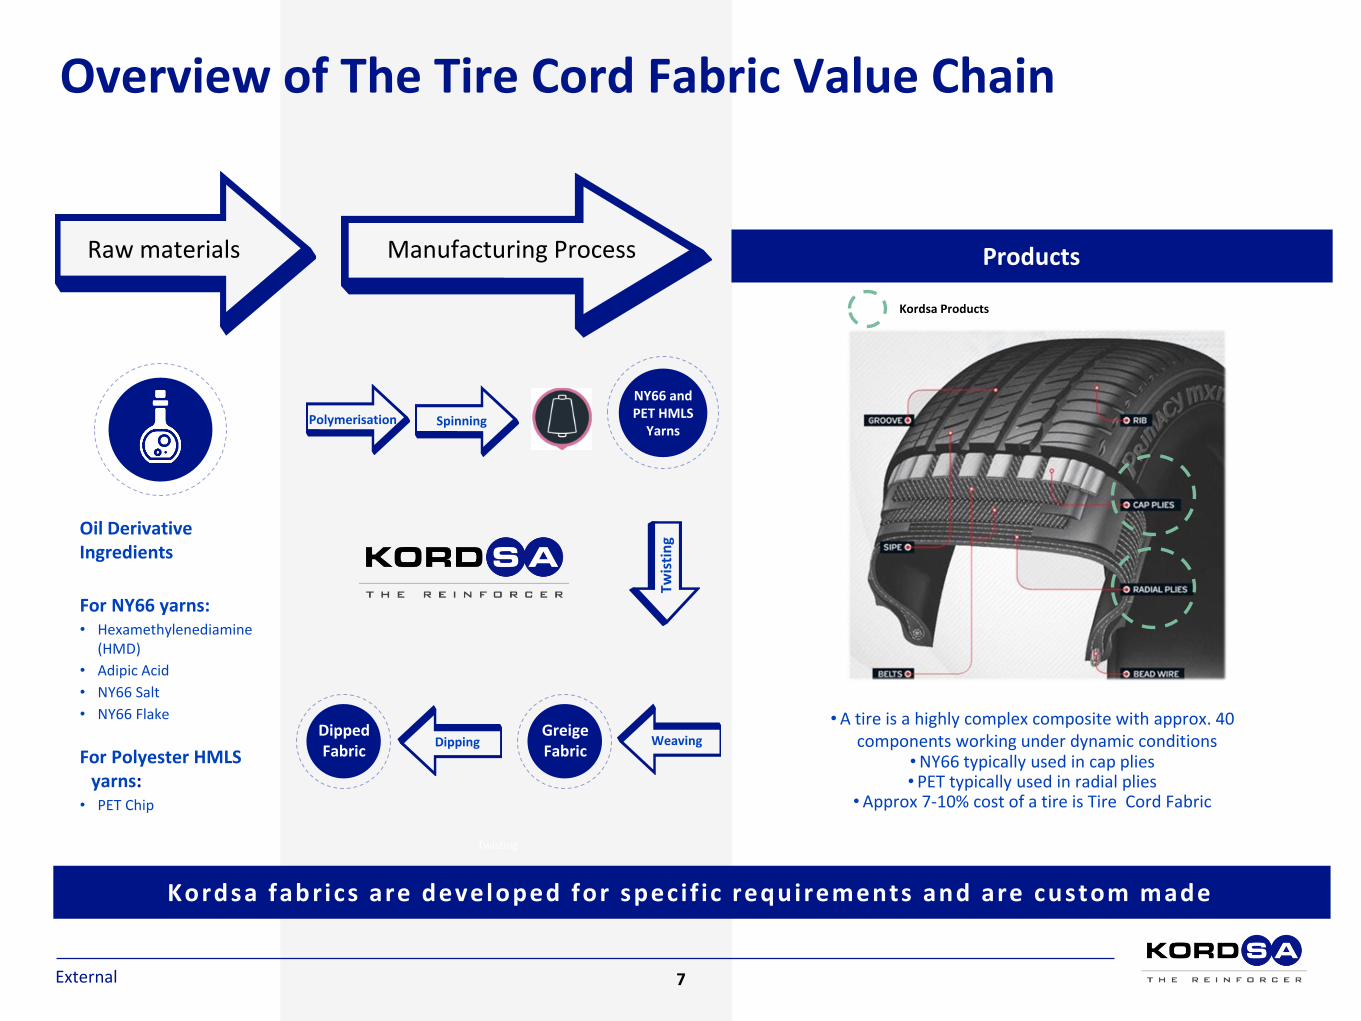
Products
Overview of The Tire Cord Fabric Value Chain
External
Raw materials Manufacturing Process
Kordsa fabrics are developed for speci f ic requirements and are custom made
Kordsa Products
Oil Derivative Ingredients
For NY66 yarns: • Hexamethylenediamine
(HMD)
• Adipic Acid
• NY66 Salt
• NY66 Flake
For Polyester HMLS yarns:
• PET Chip
Twisting
•A tire is a highly complex composite with approx. 40 components working under dynamic conditions
•NY66 typically used in cap plies• PET typically used in radial plies
•Approx 7-10% cost of a tire is Tire Cord Fabric
Spinning
NY66 andPET HMLS
YarnsPolymerisation
Twis
tin
g
WeavingDippingGreigeFabric
DippedFabric
7
Composite Parts
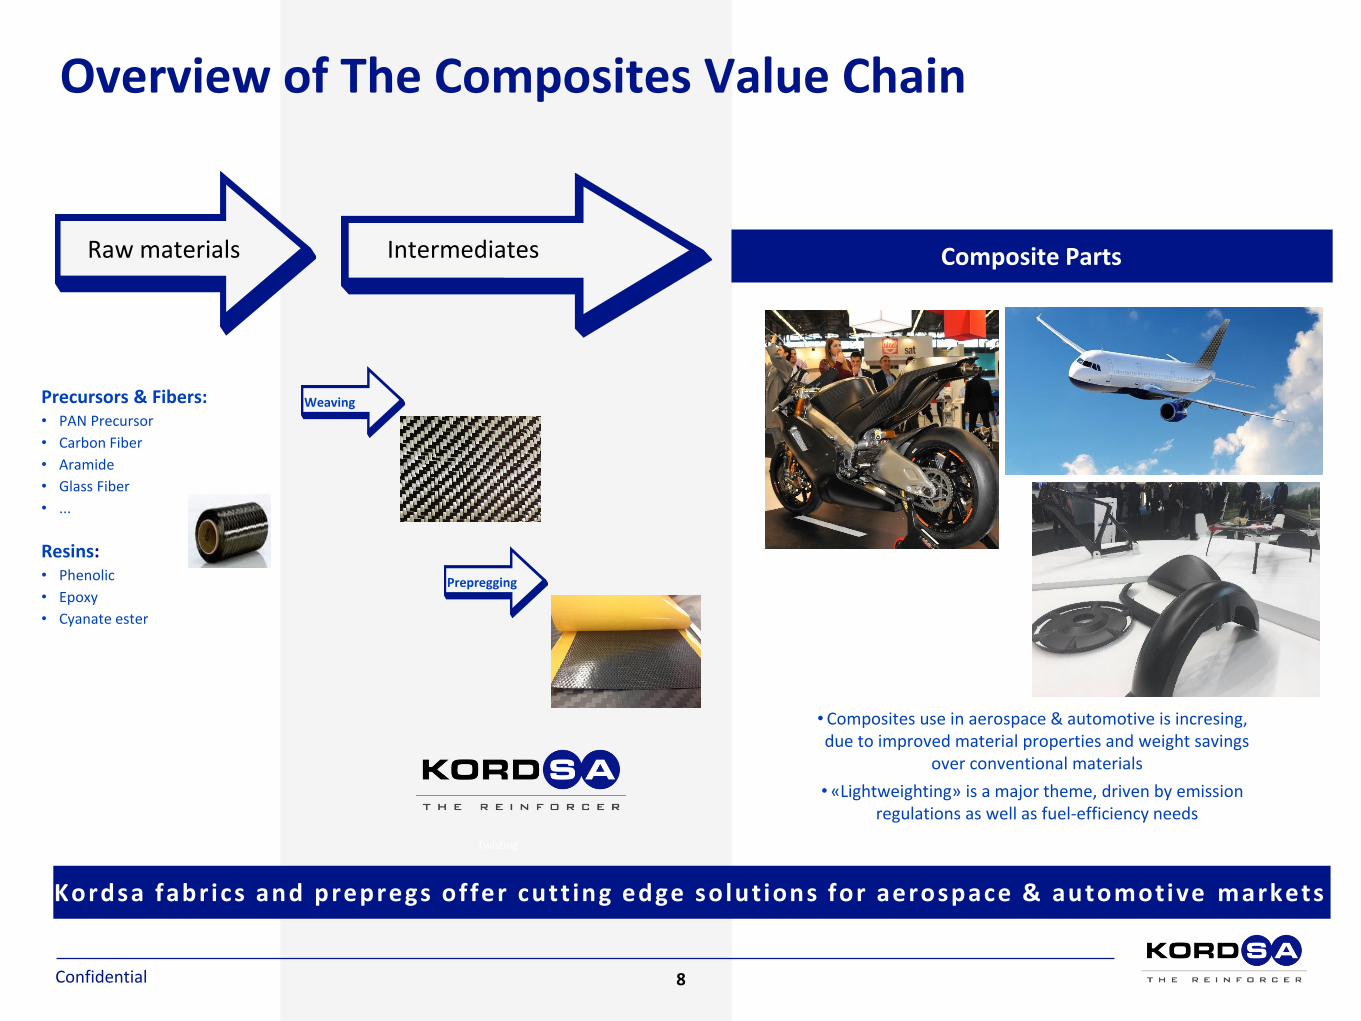
Overview of The Composites Value Chain
Confidential
Raw materials Intermediates
Kordsa fabrics and prepregs offer cutt ing edge solutions for aerospace & automotive markets
Precursors & Fibers: • PAN Precursor
• Carbon Fiber
• Aramide
• Glass Fiber
• ...
Resins:• Phenolic
• Epoxy
• Cyanate ester
Twisting
• Composites use in aerospace & automotive is incresing, due to improved material properties and weight savings
over conventional materials
• «Lightweighting» is a major theme, driven by emission regulations as well as fuel-efficiency needs
Weaving
Prepregging
8

Reinforced Concrete Structures
Overview of The Construction Reinforcement Value Chain
Confidential
Raw materials Manufacturing Process
Kordsa ’ s Kratos F iber Reinforcement are appl ied in Superstructure & Infrastructure Solutions
Major applications:
• Tunneling
• Shotcrete
• Slab on ground concretes
• Screed concrete
• Concrete roads
Oil Derivative Ingredients
For NY66 Fibers: • Hexamethylenediamine
(HMD)
• Adipic Acid
• NY66 Salt
• NY66 Flake
For PP Fibers:• Polypropylene Chips
Spinning
NY66 andPP
FibersPolymerisation
Twis
tin
g
DippingCutting Pucking
9

Strategy House
External
•Competitive Cost •Profitable Growth for Tire Industry
•Reinforcements for Composites Industry
•Product and Service Quality Leadership
•New Products for High Performing Tires
•Reinforcements forConstruction Industry
•Lean and Agile Processesand Teams •Fibers for Alternative/ Adjacent
Industries
Pillar Initiatives
Foundations
Our Values
SHE EthicsCustomer Focused
Open Minded Result Driven Global Collaboration
Continuous Improvement
10
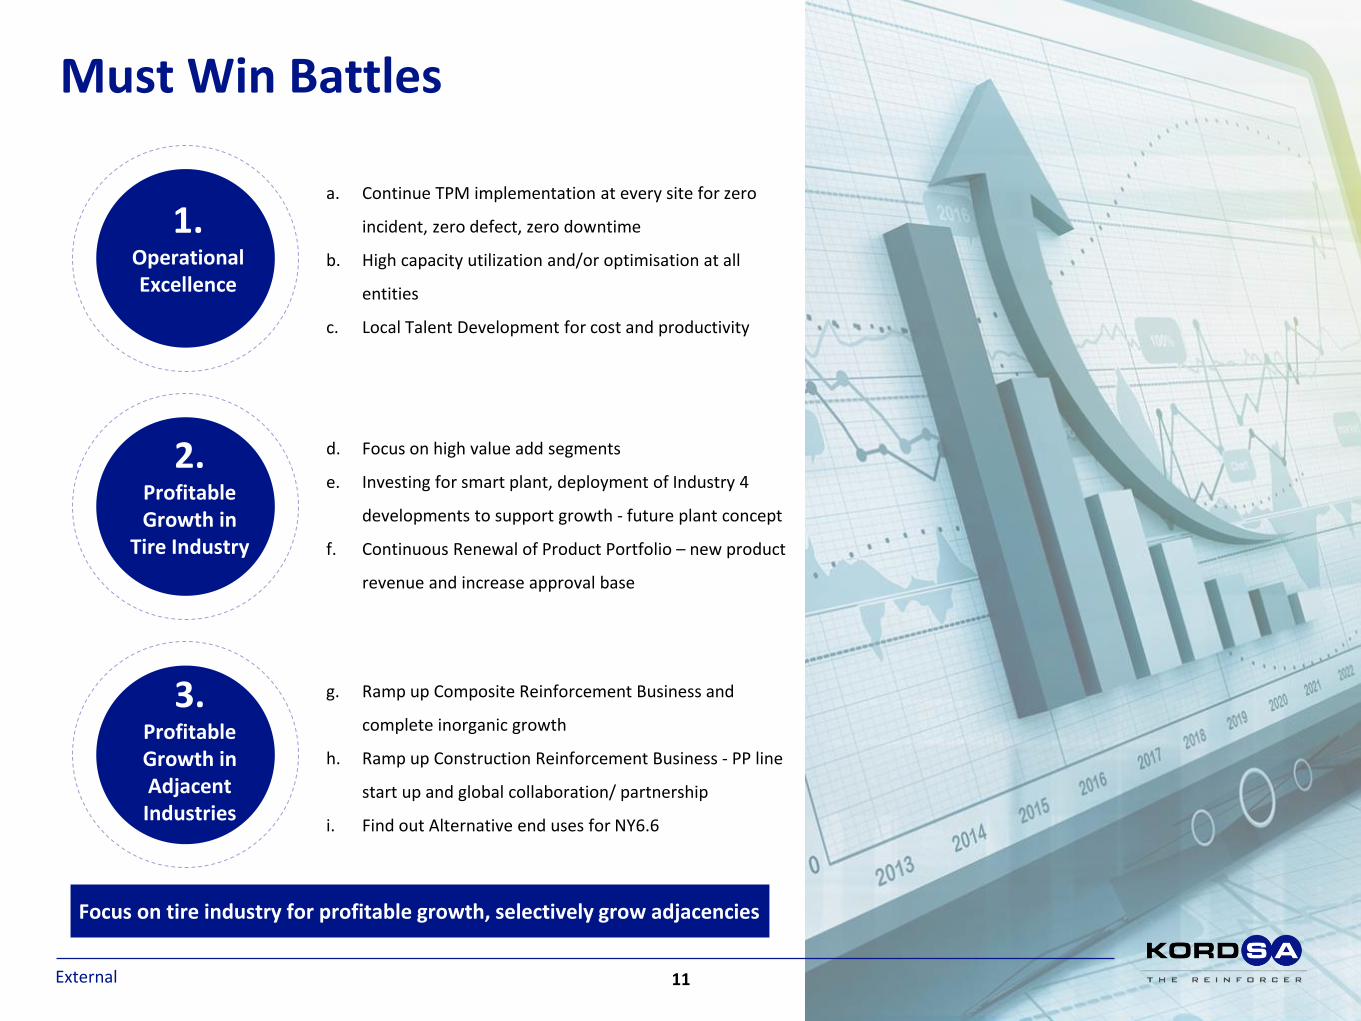
Focus on tire industry for profitable growth, selectively grow adjacencies
Must Win Battles
External
1.OperationalExcellence
2.ProfitableGrowth in
Tire Industry
3.ProfitableGrowth in AdjacentIndustries
a. Continue TPM implementation at every site for zero
incident, zero defect, zero downtime
b. High capacity utilization and/or optimisation at all
entities
c. Local Talent Development for cost and productivity
d. Focus on high value add segments
e. Investing for smart plant, deployment of Industry 4
developments to support growth - future plant concept
f. Continuous Renewal of Product Portfolio – new product
revenue and increase approval base
g. Ramp up Composite Reinforcement Business and
complete inorganic growth
h. Ramp up Construction Reinforcement Business - PP line
start up and global collaboration/ partnership
i. Find out Alternative end uses for NY6.6
11
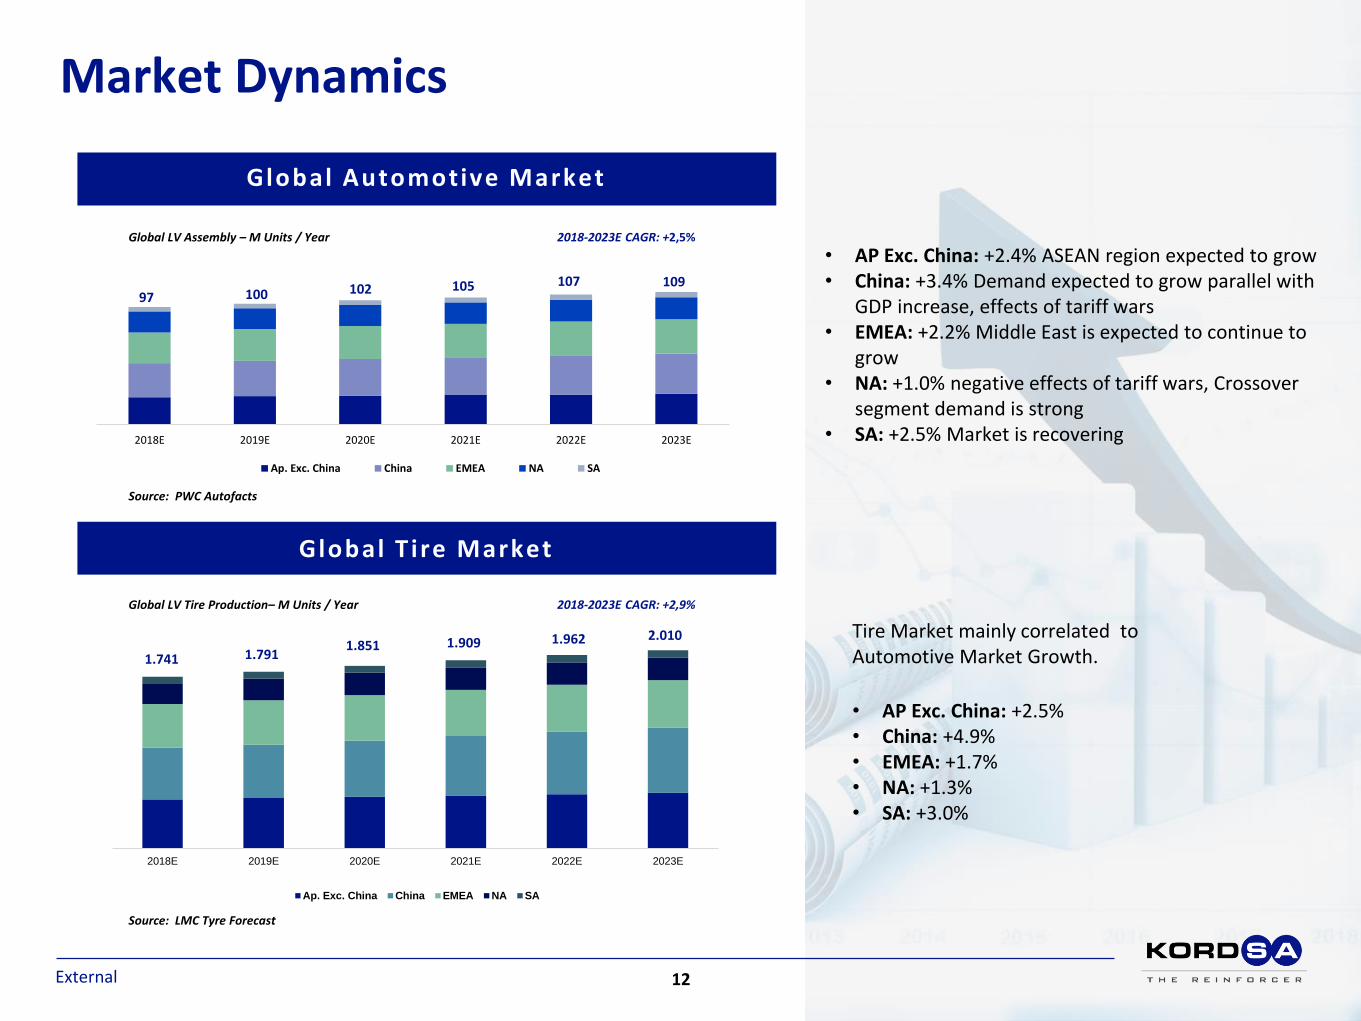
Market Dynamics
External
2018E 2019E 2020E 2021E 2022E 2023E
Ap. Exc. China China EMEA NA SA
Global T ire Market
Global Automotive Market
2018E 2019E 2020E 2021E 2022E 2023E
Ap. Exc. China China EMEA NA SA
2018-2023E CAGR: +2,5%Global LV Assembly – M Units / Year
Source: PWC Autofacts
97 100 102 105 107 109
2018-2023E CAGR: +2,9%Global LV Tire Production– M Units / Year
Source: LMC Tyre Forecast
1.741 1.7911.851 1.909 1.962 2.010
• AP Exc. China: +2.4% ASEAN region expected to grow• China: +3.4% Demand expected to grow parallel with
GDP increase, effects of tariff wars• EMEA: +2.2% Middle East is expected to continue to
grow• NA: +1.0% negative effects of tariff wars, Crossover
segment demand is strong• SA: +2.5% Market is recovering
Tire Market mainly correlated toAutomotive Market Growth.
• AP Exc. China: +2.5%• China: +4.9% • EMEA: +1.7%• NA: +1.3%• SA: +3.0%
12
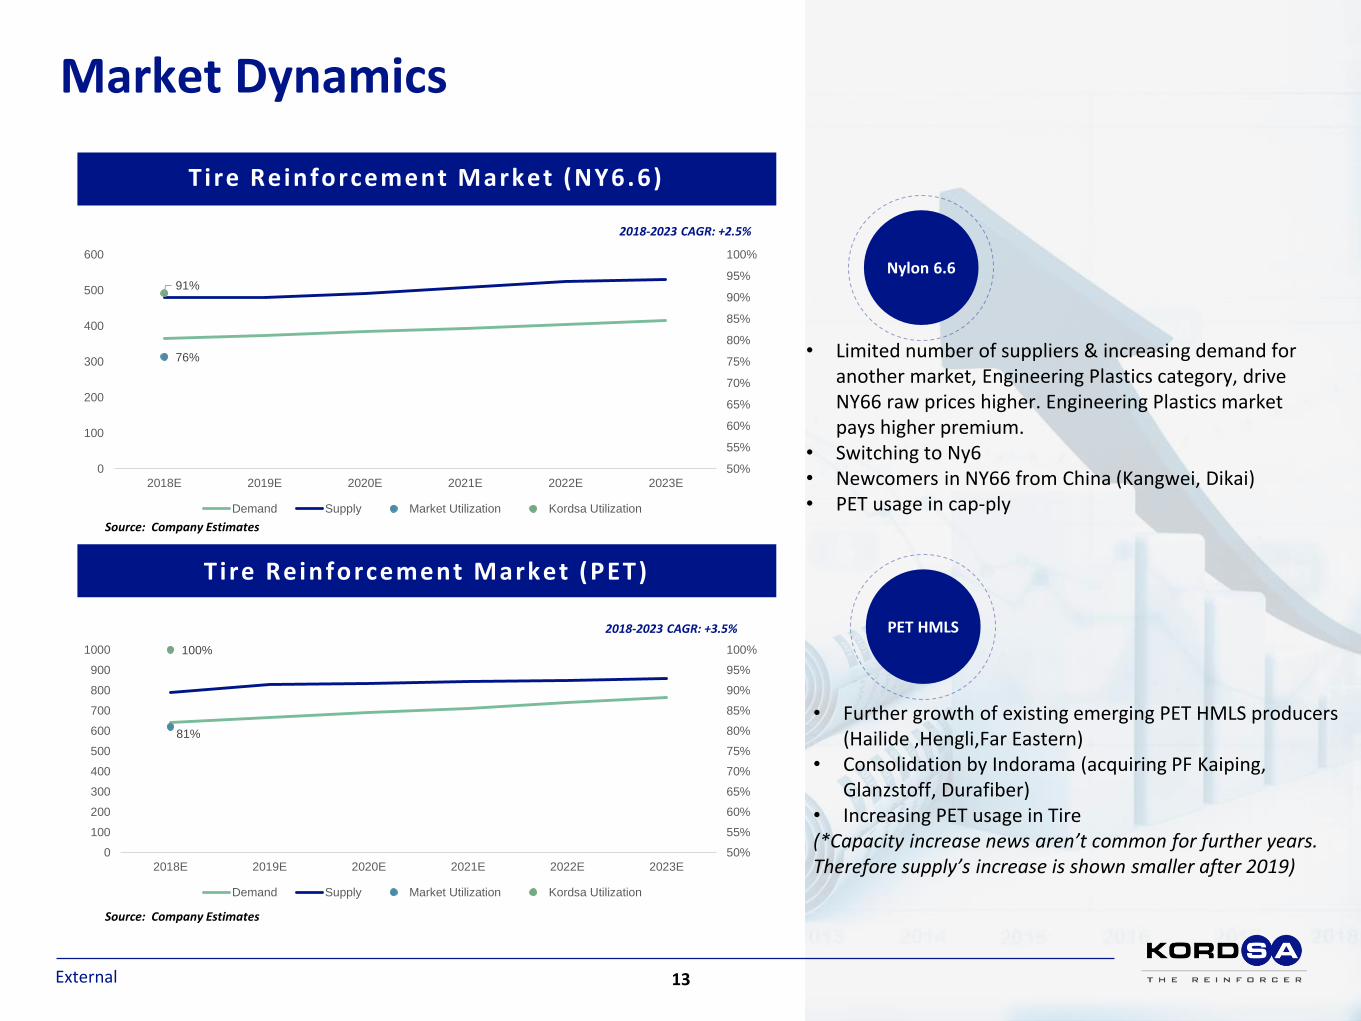
Market Dynamics
External
Tire Reinforcement Market (PET)
Tire Reinforcement Market (NY6.6)
2018-2023 CAGR: +2.5%
Source: Company Estimates
2018-2023 CAGR: +3.5%
Source: Company Estimates
• Limited number of suppliers & increasing demand foranother market, Engineering Plastics category, driveNY66 raw prices higher. Engineering Plastics market pays higher premium.
• Switching to Ny6 • Newcomers in NY66 from China (Kangwei, Dikai)• PET usage in cap-ply
Nylon 6.6
PET HMLS
• Further growth of existing emerging PET HMLS producers (Hailide ,Hengli,Far Eastern)
• Consolidation by Indorama (acquiring PF Kaiping, Glanzstoff, Durafiber)
• Increasing PET usage in Tire(*Capacity increase news aren’t common for further years. Therefore supply’s increase is shown smaller after 2019)
76%
91%
50%
55%
60%
65%
70%
75%
80%
85%
90%
95%
100%
0
100
200
300
400
500
600
2018E 2019E 2020E 2021E 2022E 2023E
Demand Supply Market Utilization Kordsa Utilization
81%
100%
50%
55%
60%
65%
70%
75%
80%
85%
90%
95%
100%
0
100
200
300
400
500
600
700
800
900
1000
2018E 2019E 2020E 2021E 2022E 2023E
Demand Supply Market Utilization Kordsa Utilization
13
Kordsa Highlights
External
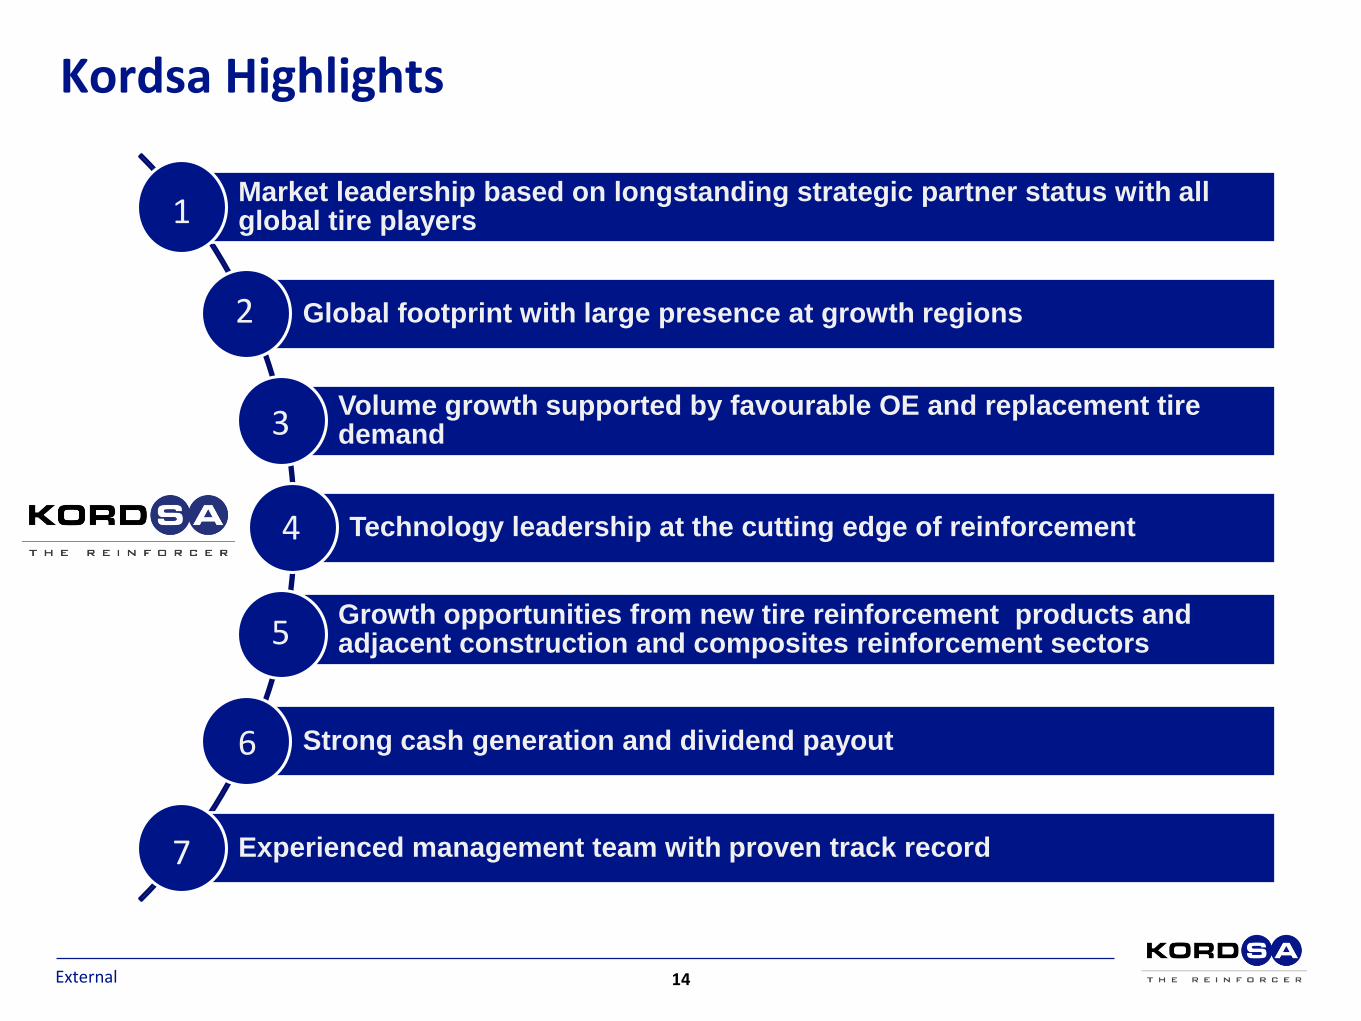
Market leadership based on longstanding strategic partner status with all global tire players
Global footprint with large presence at growth regions
Volume growth supported by favourable OE and replacement tire demand
Technology leadership at the cutting edge of reinforcement
Growth opportunities from new tire reinforcement products and adjacent construction and composites reinforcement sectors
Strong cash generation and dividend payout
Experienced management team with proven track record
1
2
3
4
5
6
7
14

External
N a t u r e o f c u s t o m e r r e l a t io n s hip a s k e y b a r r i e r t o e n t r y L e a d i n g m a r k e t s h a r e s
Length of relationship
Typical length of approval period(a)
Co-development projects
Global Tire Player 1
Since 1986 ~ 5 years
Global Tire Player 2
Since 1995 ~ 5 years
Global Tire Player 3
Since 1973 ~ 3 years
Global Tire Player 4
Since 1985 ~ 2 years
Global Tire Player 5
Since 1973 ~ 3 years
Global Tire Player 6
Since 1987 ~ 2 years
(a) For a new supplier
Strong barr iers to entry for new comers
Market Leadership Based on Longstanding Strategic Partner Status with All Global Tire Players
Other%17
Kordsa%28
D%4
C%11
B%8
A%32NY66 HDI
Market Share 2018
Other%22
Kordsa%11
D%8
C%10 B
%17
A%31PET HMLS
Market Share 2018
Source: Company Estimate
15
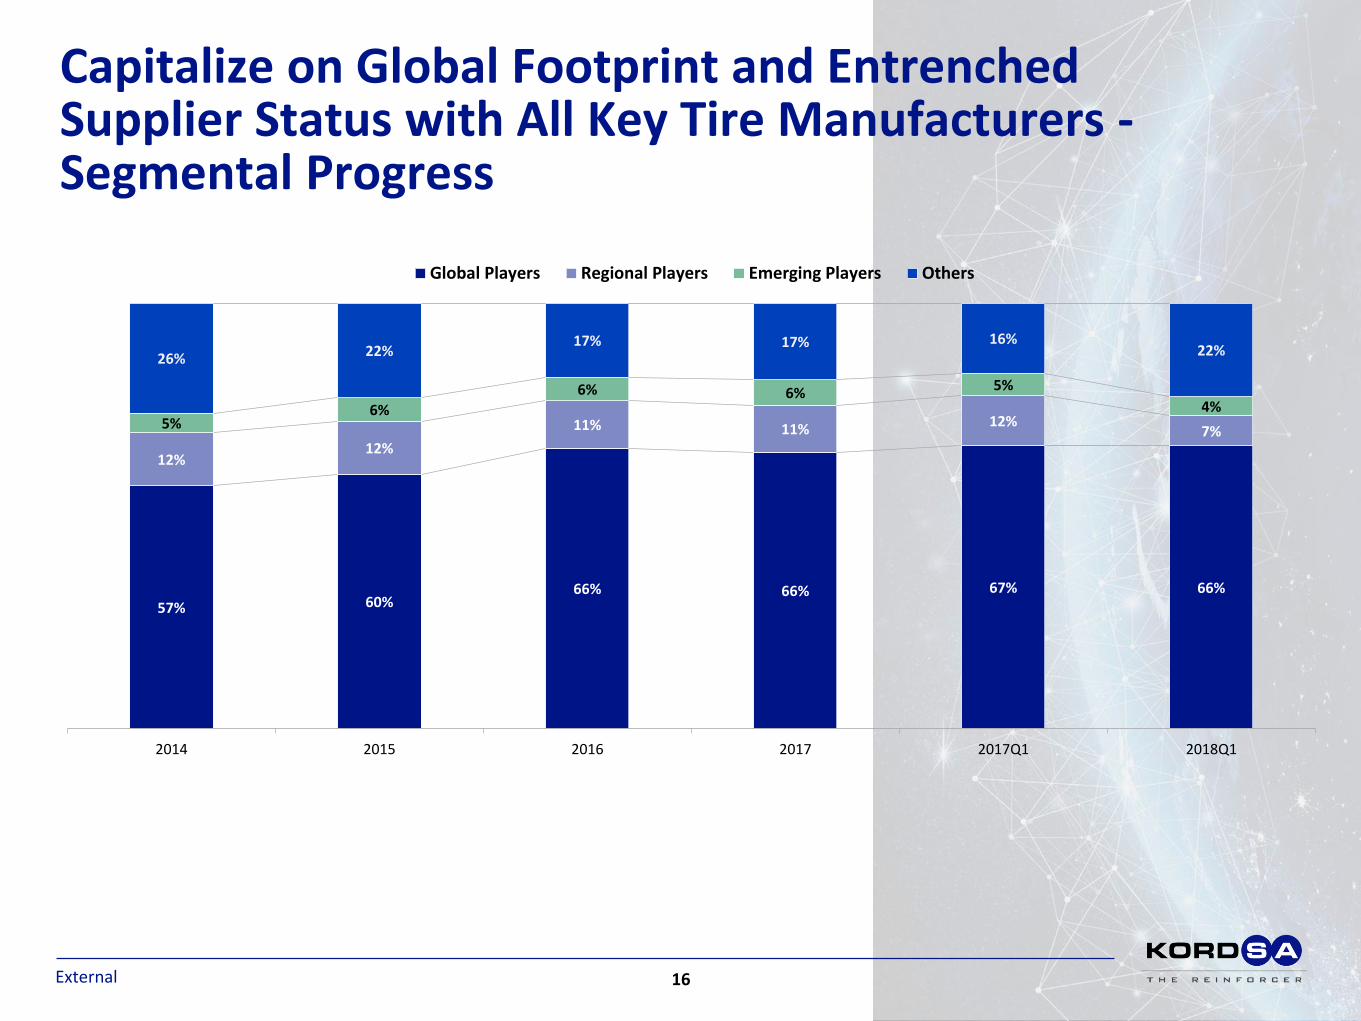
Capitalize on Global Footprint and EntrenchedSupplier Status with All Key Tire Manufacturers -Segmental Progress
External
57% 60%66% 66% 67% 66%
12%12%
11% 11%12%
7%5%6%
6% 6% 5%
4%
26% 22%17% 17% 16%
22%
2014 2015 2016 2017 2017Q1 2018Q1
Global Players Regional Players Emerging Players Others
16

Global Footprint (Revenue)
External
Regionalfootprint
versus keycompetitors
Kordsa market position
• #1 NY TCF producer
• #1 PET TCF producer
• #1 NY TCF producer in the US
• #2 NY TCF producer
• #2 PET TCF producer
• The only PET yarn, TCF and SEC producer in LATAM
THAILANDThai Indo Kordsa Co. Ltd. Ayutthaya, Thailan
Tire (TCF)
INDONESIAPt Indo Kordsa Tbk. Jakarta, Indonesia
Tire (NY6.6, PET TCF)
TURKEYHeadquarters Istanbul, Factory Izmit, Technology Center Izmit, Composite Technologies Center of Excellence
Tire (NY6.6, PET, SEC, TCF), Composite, Construction
BRAZILKordsa Brazil Salvador De Bahia, Brazil
Tire (PET, SEC, TCF)
USAKordsa Inc. Laurel Hill N.C. Chattanooga, TN. USA
Tire (NY6.6, TCF)
41%
22%
13%
25%
36%
22%
14%
28%
39%
17%15%
30%36%
18%15%
31%37%
17%14%
32%36%
17% 15%
31%
39%
19%13%
29%
EMEA NA SA APAC
2013 2014 2015 2016 2017 2017 Q1 2018 Q1
17

Kordsa TCF volume development(a)
Comments
Well – Positioned to Enable Volume Growth
External
• Fabric form contributes the highest value add• Disciplined approach to optimizing footprint• 2015 investment in Indonesia has increased polyester tire
cord fabric capacity by 18 ktons• * enables regional growth in technology-advantaged PET
segment with global and emerging customers• Further investment in PET HMLS for new generation yarns
• In TR for 6-6.5 ktons – due for completion in Q4 2018.• In Indo for 6,5 ktons – completed in Jan-2018.
(a) Volume development adjusted for divested volumes(b) Capacity expansion has finalized as of January 2015
Vo
lum
e s
old
(20
06
ind
exe
d t
o 1
00
)
L i g h t V e h i c l e T i r e m a n u f a c t u r i n g m a r k e t e v o l u t i o n
K o r d s a r e g i o n a l c a p a c i t y d e v e l o p m e n t
R e v e n u e S p l i t
36% 31%18% 15%
37% 32%
17% 14%
36% 31%17% 15%
39%29%
19%13%
EMEA APAC NA SA
2016 2017 2017Q1 2018Q1
NA%21
EMEA%32
APAC%41
NA%13
EMEA%25
NA%28
SA%20 NA
%21
EMEA%38
APAC%59
EMEA%33
APAC%32
APAC%19
SA%4
SA%6
SA%9
2005
2005 2017
2017
100
139 142 150
57%
74% 73% 73%
0%
20%
40%
60%
80%
100%
0
50
100
150
200
250
2006 2015 2016 2017
Volume Sales % of TCF
18

A n n u a l R & D e x p e n s e s c o r r e s p o n d ~ 1 % o f t h e c o n s o l i d a t e d r e v e n u e
Technology Leadership at The Cutting Edgeof Reinforcement
External
• Best performed R&D center award of the year2014 in all industries.
• R&D Center ranked best in textile category for thelast 6 years by the Turkish Ministry of Science, Industry and Technology
Strong focus on R&D Cutt ing edge new products
41
52
42 45
15**
2014 2015 2016 2017 2018E
* Once “new product life cycle” is completed in 7 years, it is transferred to “regular sales” portfolio* Incl. Replacement products and incremental new products
61*
Sale
s fr
om
ne
w p
rod
uct
s
(US$
m)
Selected col laborations(a) Leadership in Innovation and Technology”
Rolling resistance improvements through higher modulus for high performance tires
Protection layer for truck & bus tires; reduces tire weight
7% higher tenacity and better fatigue performance for aircraft tires (bias)
10% higher dimensional stability for better tire performance (improved labeling)
T802
4G PET
• Innovation Strategy ChampionTurkish Exporters Assembly/InovaLeague
• Among the national top 6 institutions of R&D patent registration in Turkey.
Top 6
1
1
(a) includes both, universities as well as individual academics from the names institutions
**18Q1 actualized
*2018expected
19

Further Growth Opportunities: Composite
Confidential
Mid-term opportunity: composites re inforcement
• Composite Technologies Center of Excellence opened in 2016 (~30
MM$ investment)
• Ongoing development programs & joint projects with aerospace &
automotive customers and major universities in both Turkey and
Europe.
• Our target markets are Aviation, Automotive, Maritime and also
Rail Systems
Current status
• Initial step of acquiring FDI & TPI in the US
• Regulatory approvals are obtained from authorities, closing
expected in Q3 2018
• Potential M&A targets are always under consideration
(Competency fit and development opportunities, market
penetration and growth)
Buy & Bui ld
20
Growth Opportunities: Construction
Confidential
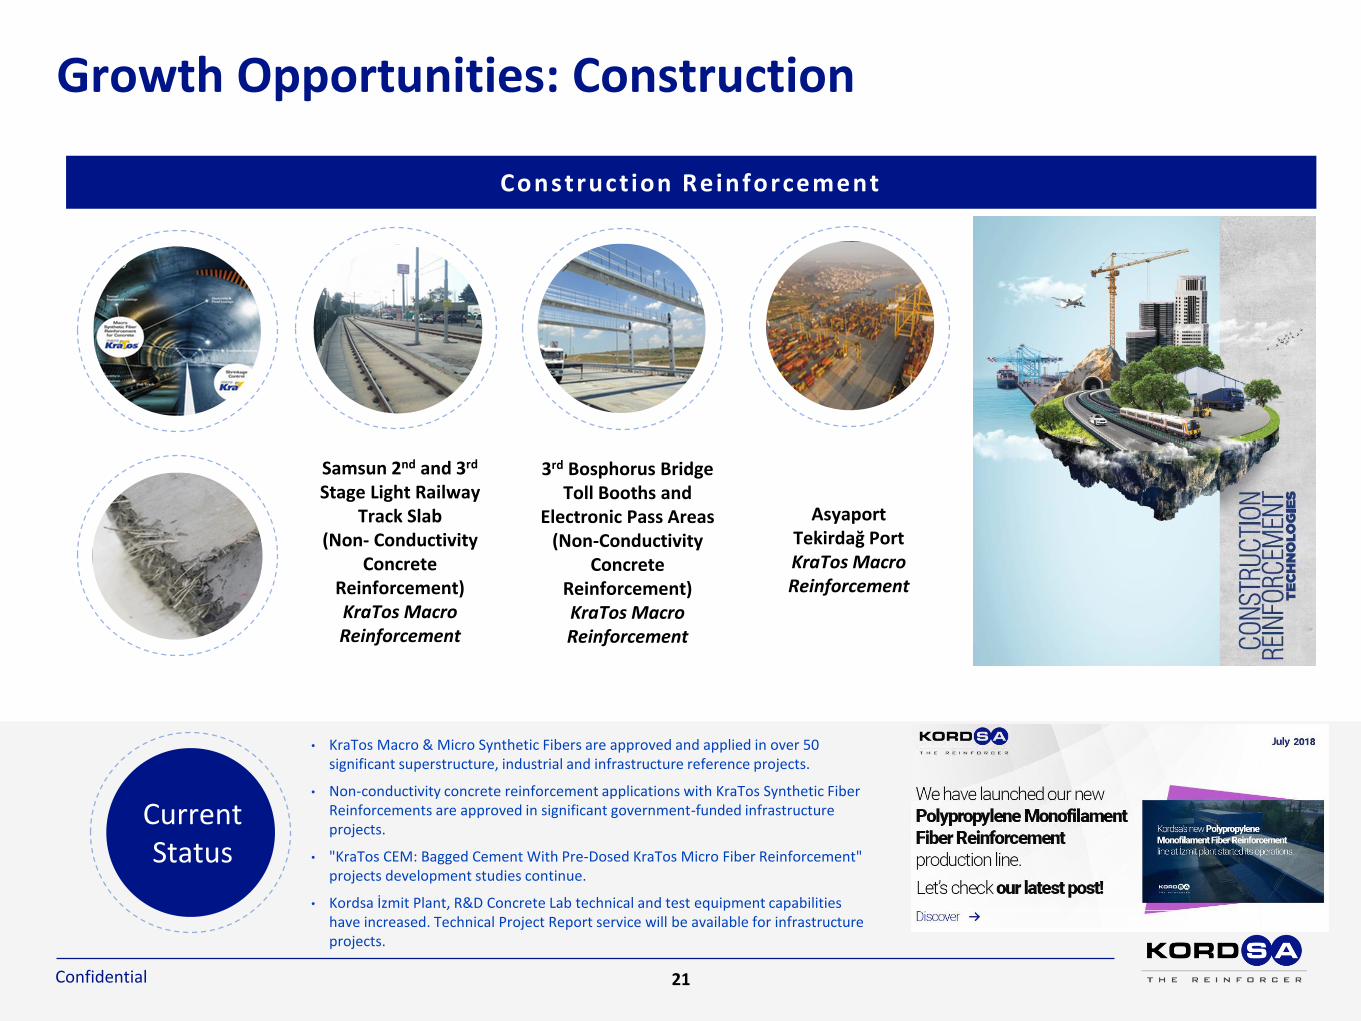
Construction Reinforcement
• KraTos Macro & Micro Synthetic Fibers are approved and applied in over 50 significant superstructure, industrial and infrastructure reference projects.
• Non-conductivity concrete reinforcement applications with KraTos Synthetic Fiber Reinforcements are approved in significant government-funded infrastructure projects.
• "KraTos CEM: Bagged Cement With Pre-Dosed KraTos Micro Fiber Reinforcement" projects development studies continue.
• Kordsa İzmit Plant, R&D Concrete Lab technical and test equipment capabilities have increased. Technical Project Report service will be available for infrastructure projects.
3rd Bosphorus Bridge Toll Booths and
Electronic Pass Areas (Non-Conductivity
Concrete Reinforcement)KraTos Macro Reinforcement
Samsun 2nd and 3rd
Stage Light Railway Track Slab
(Non- Conductivity Concrete
Reinforcement)KraTos Macro Reinforcement
Asyaport Tekirdağ PortKraTos Macro Reinforcement
CurrentStatus
21
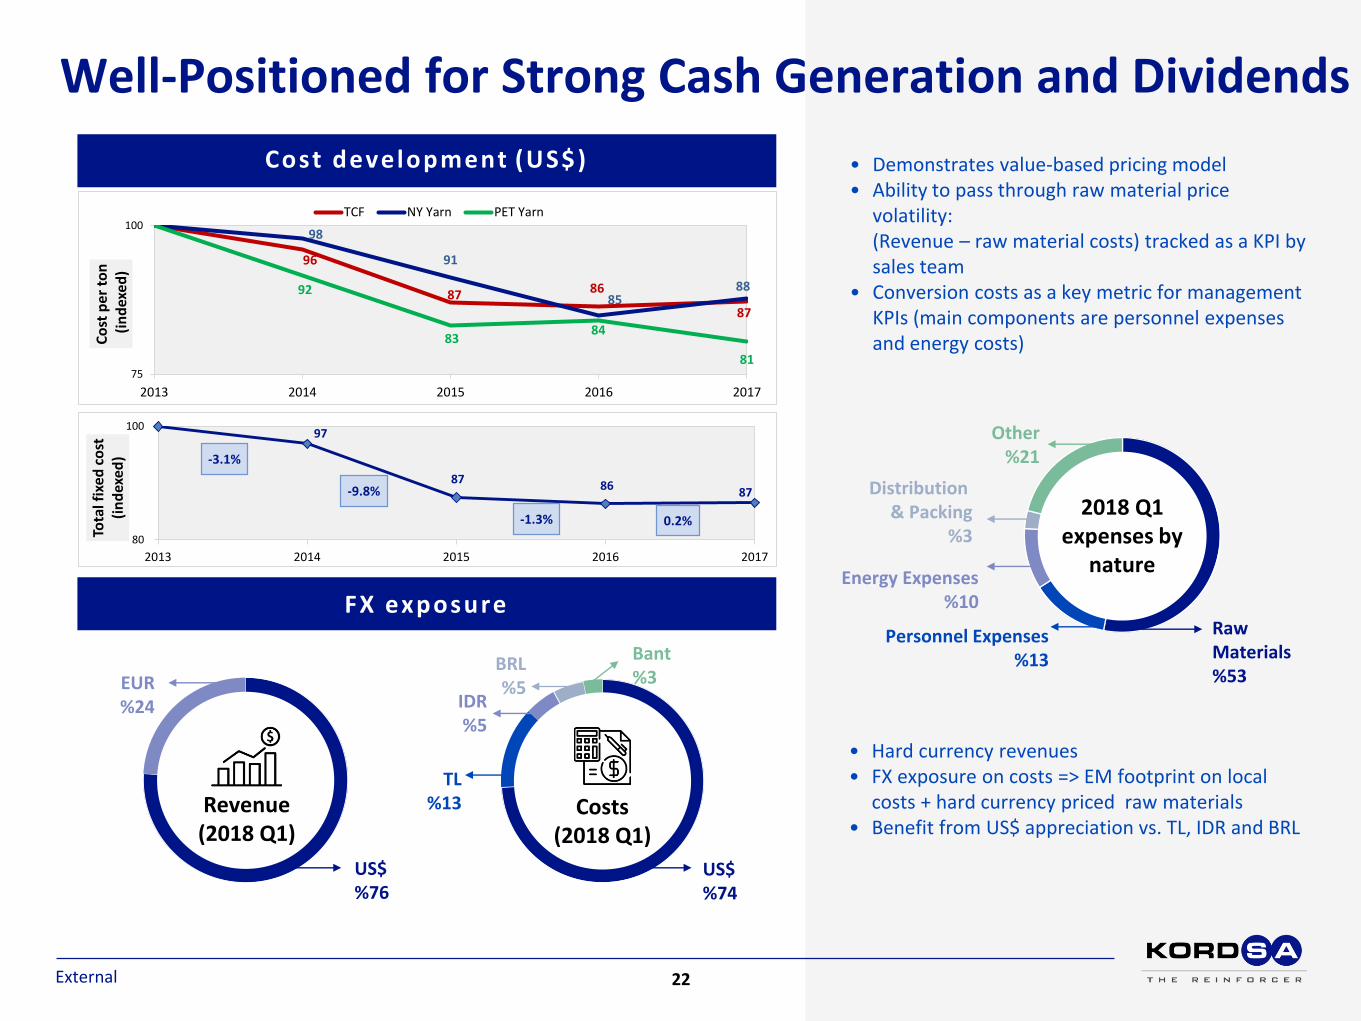
FX exposure
EUR%24
US$%76
Revenue (2018 Q1)
Costs (2018 Q1)
US$%74
TL%13
IDR%5
BRL%5
Bant%3
• Hard currency revenues• FX exposure on costs => EM footprint on local
costs + hard currency priced raw materials• Benefit from US$ appreciation vs. TL, IDR and BRL
• Demonstrates value-based pricing model• Ability to pass through raw material price
volatility: (Revenue – raw material costs) tracked as a KPI by sales team
• Conversion costs as a key metric for management KPIs (main components are personnel expenses and energy costs)
Other%21
Raw Materials%53
2018 Q1expenses by
nature
Distribution & Packing
%3
Energy Expenses%10
Personnel Expenses%13
Cost development (US$)
Well-Positioned for Strong Cash Generation and Dividends
External
96
87 86
87
98
91
858892
8384
8175
100
2013 2014 2015 2016 2017
Co
st p
er t
on
(in
dex
ed)
TCF NY Yarn PET Yarn
97
87 86 87
80
100
2013 2014 2015 2016 2017
Tota
l fix
ed c
ost
(i
nd
exed
) -3.1%
-9.8%
-1.3% 0.2%
22
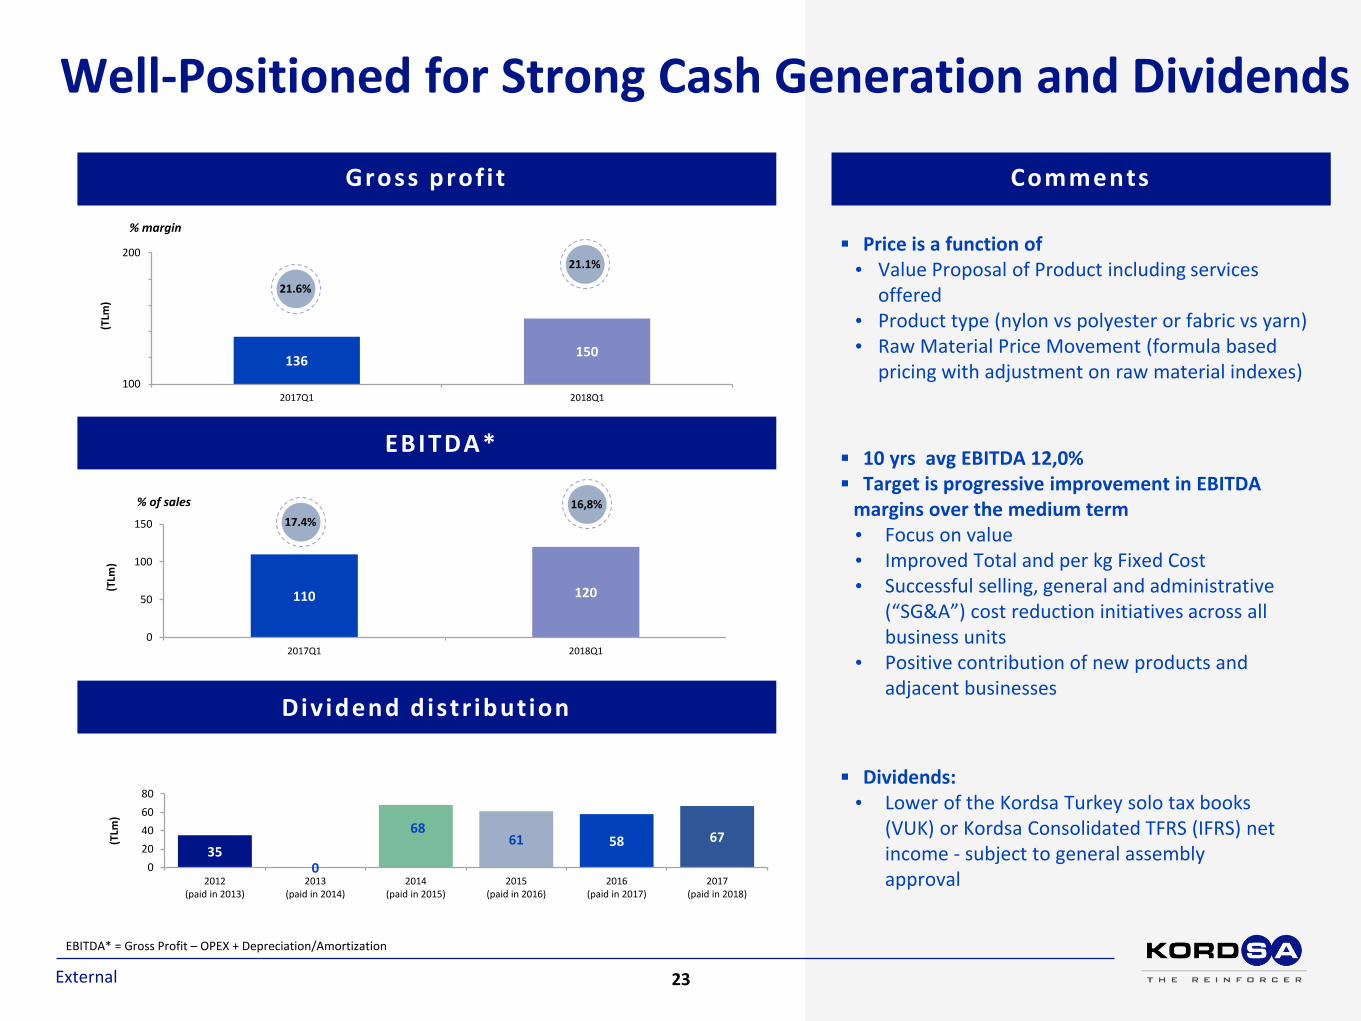
Dividend distr ibution
Gross prof i t
Well-Positioned for Strong Cash Generation and Dividends
External
EBITDA*
Price is a function of • Value Proposal of Product including services
offered• Product type (nylon vs polyester or fabric vs yarn)• Raw Material Price Movement (formula based
pricing with adjustment on raw material indexes)
10 yrs avg EBITDA 12,0% Target is progressive improvement in EBITDA
margins over the medium term • Focus on value • Improved Total and per kg Fixed Cost • Successful selling, general and administrative
(“SG&A”) cost reduction initiatives across all business units
• Positive contribution of new products and adjacent businesses
Dividends:• Lower of the Kordsa Turkey solo tax books
(VUK) or Kordsa Consolidated TFRS (IFRS) net income - subject to general assembly approval
136150
100
200
2017Q1 2018Q1
(TLm
)
110 120
0
50
100
150
2017Q1 2018Q1
(TLm
)
350
6861 58 67
0
20
40
60
80
2012(paid in 2013)
2013(paid in 2014)
2014(paid in 2015)
2015(paid in 2016)
2016(paid in 2017)
2017(paid in 2018)
(TLm
)
% margin
% of sales
Comments
21.6%
21.1%
17.4%
16,8%
EBITDA* = Gross Profit – OPEX + Depreciation/Amortization
23

Kordsa's Guidance & Financial Policy
External
EBITDA margins
Dividend policy
ReoccurringCreep Capex
Kordsa is targeting progressive improvement in EBITDA margins over the medium term
Distribution of all the distributable profits
• which is lower of the Kordsa Turkey solo tax books (VUK) orKordsa Consolidated TFRS (IFRS) net income
• in the form of cash and/or bonus shares• subject to general assembly approval
The distribution decision is agreed taking into considerationthe sizable fixed asset purchases, acquisitions, covenants of current liabilities and the Company’s mid and long termstrategies, national and global economic conditions
Kordsa does not apply payment of advanced dividends.
USD 23 million
Our company guidance for financial year 2018 is as follows:
Revenue : 15-25%
EBITDA: 15-25%
(These growth rates do not include the effects of acquisition of Fabric Development Inc. and Textile Products Inc.As of 02.07.2018:The approval process of the Committee on Foreign Investment in the US (CFIUS) has been completed to acquire "Fabric Development" and "Textile Products Inc." which provide advanced composite materials to the commercial aviation industry. The closing process for the acquisition of FDI & TPI, which is estimated to be completed within one month, has been started.)
24
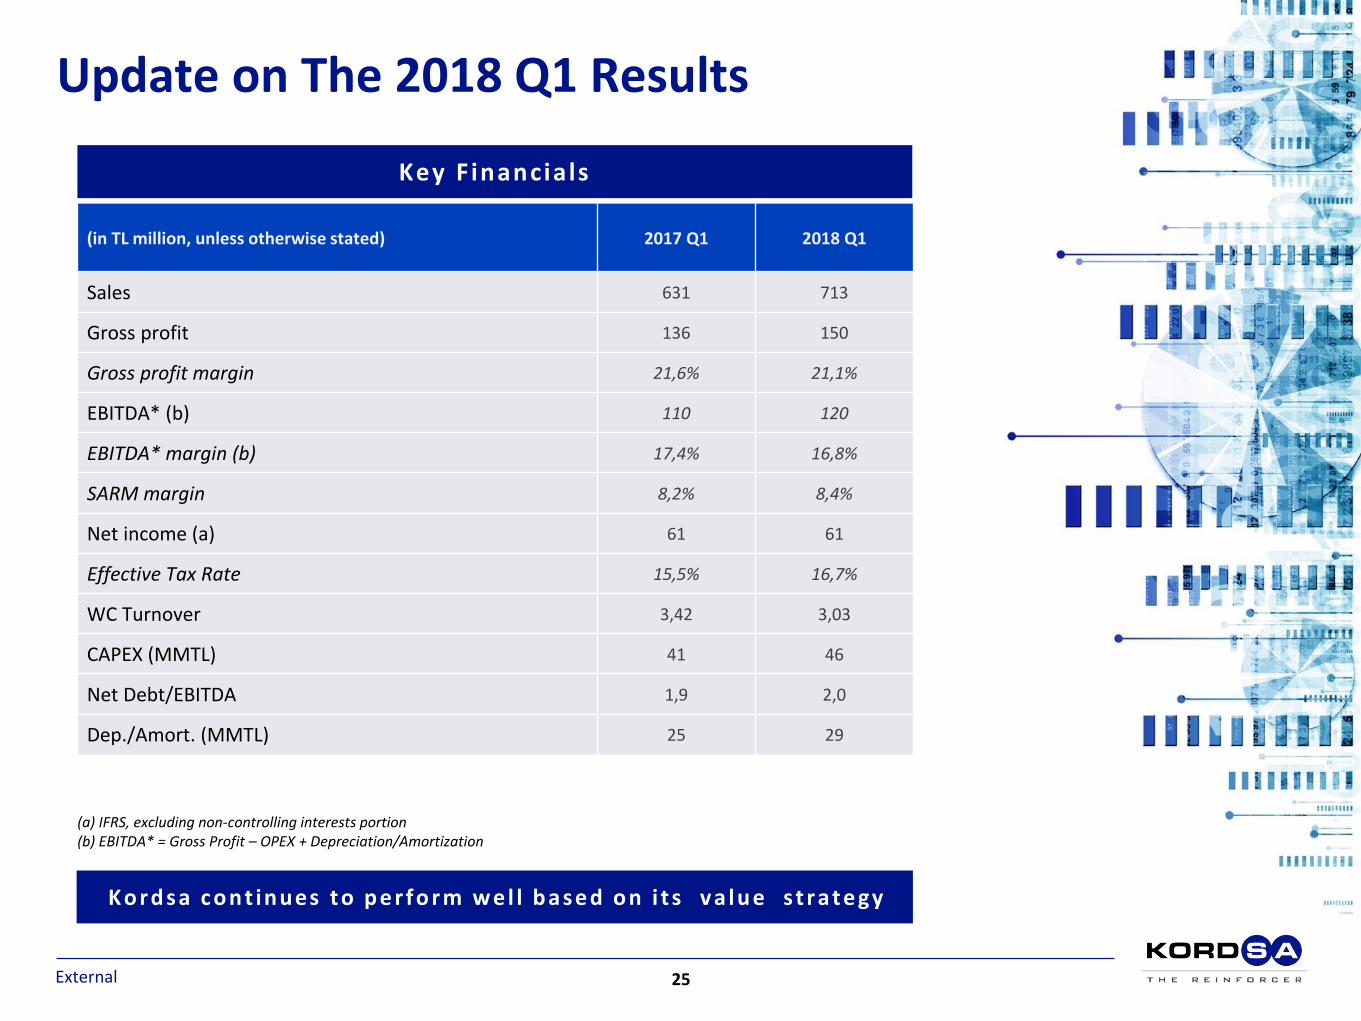
Key Financials
External
Update on The 2018 Q1 Results
(in TL million, unless otherwise stated) 2017 Q1 2018 Q1
Sales 631 713
Gross profit 136 150
Gross profit margin 21,6% 21,1%
EBITDA* (b) 110 120
EBITDA* margin (b) 17,4% 16,8%
SARM margin 8,2% 8,4%
Net income (a) 61 61
Effective Tax Rate 15,5% 16,7%
WC Turnover 3,42 3,03
CAPEX (MMTL) 41 46
Net Debt/EBITDA 1,9 2,0
Dep./Amort. (MMTL) 25 29
(a) IFRS, excluding non-controlling interests portion(b) EBITDA* = Gross Profit – OPEX + Depreciation/Amortization
Ko rd sa c o n t inues to p e rfo rm w e l l b ase d o n i t s va lu e st rate gy
25
We Reinforce LifeReinforcing 2 out of every 3 aircraft tires and
1 out of every 3 automobile tires produced in
the world
26
Appendix27
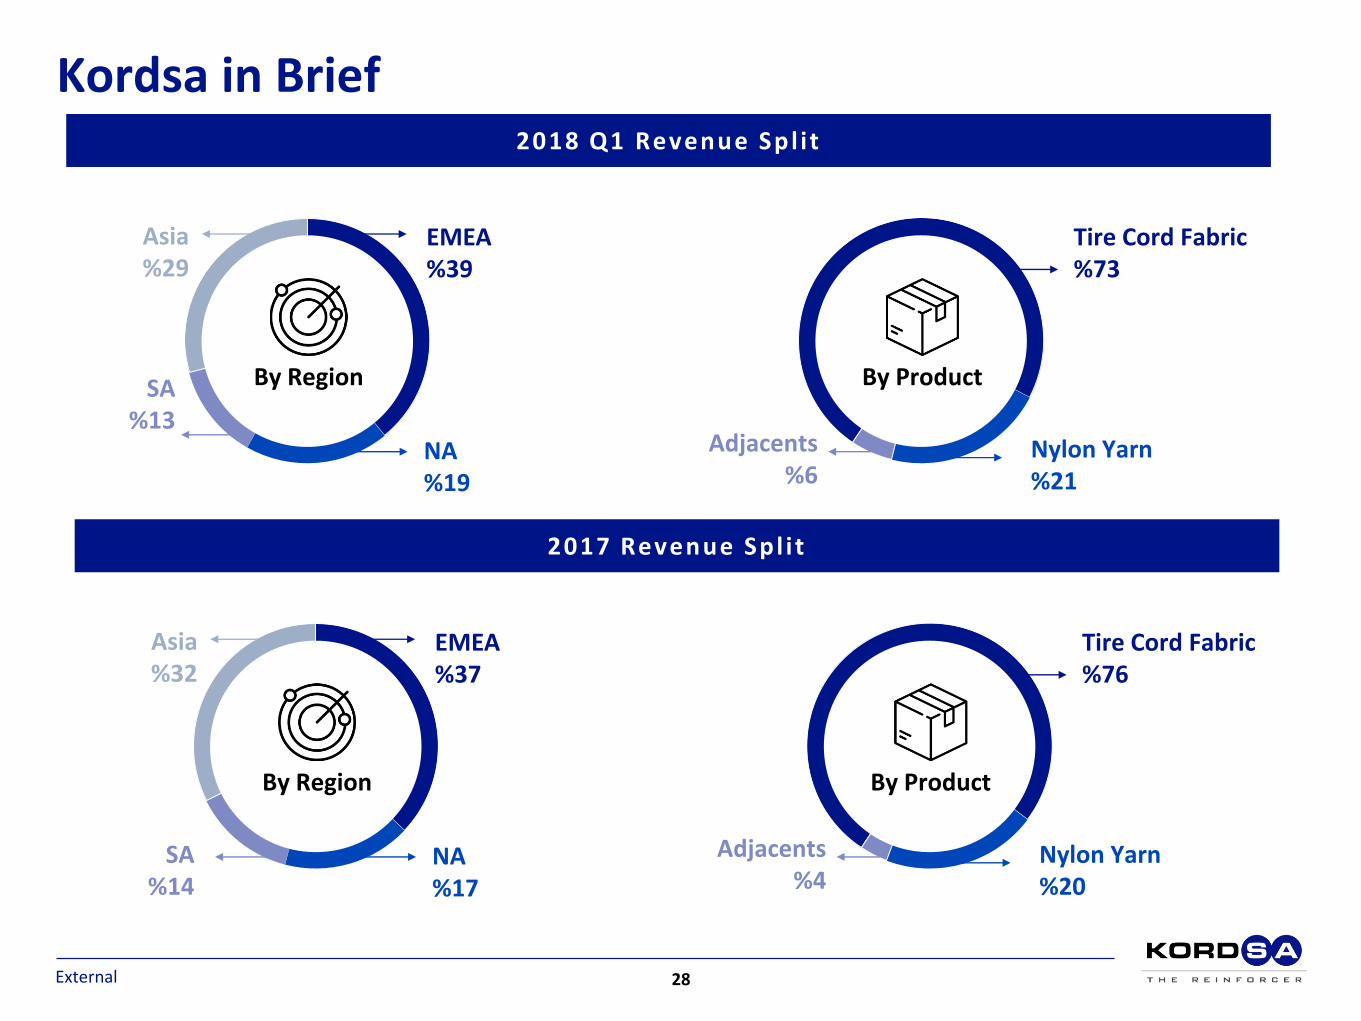
2018 Q1 Revenue Spl i t
By Product
Tire Cord Fabric%73
Nylon Yarn%21
Adjacents%6
Asia%29
EMEA%39
NA%19
SA%13
By Region
External
Kordsa in Brief
2017 Revenue Spl i t
By Product
Tire Cord Fabric%76
Nylon Yarn%20
Adjacents%4
Asia%32
EMEA%37
NA%17
SA%14
By Region
28

External
FX RatesFX Rates as of Mar,18
Monthly Avr Mar YTD 2017YE
$/TRY 3,88 3,81 3,65
EUR/$ 1,23 1,23 1,13
$/BRL 3,28 3,24 3,19
$/IDR 13.757 13.576 13.557
$/THB 31,28 31,54 33,94
Month End Mar YTD 2017YE
$/TRY 3,95 3,95 3,77
EUR/$ 1,23 1,23 1,20
$/BRL 3,32 3,32 3,31
$/IDR 13.756 13.756 13.548
$/THB 31,23 31,23 32,68
29
Confidentiality Level
SABANCI INDUSTRIAL DAY
4 JULY 2018
-------------------------------------------------------------------------------------------------------------------------------
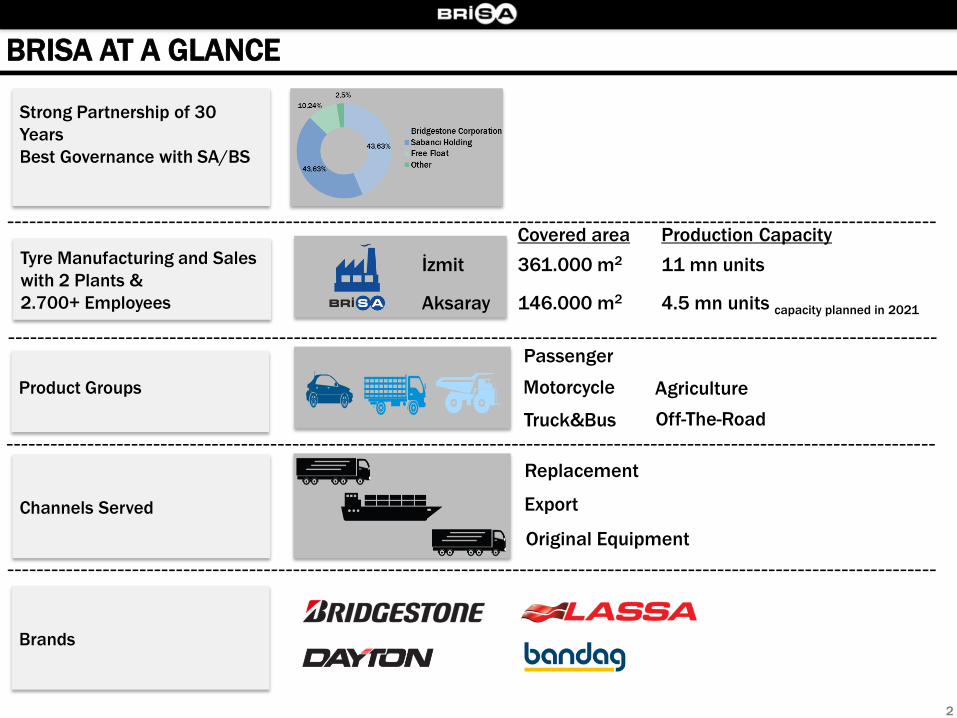
Strong Partnership of 30
Years
Best Governance with SA/BS
-------------------------------------------------------------------------------------------------------------------------------
Tyre Manufacturing and Sales
with 2 Plants &
2.700+ Employees
Product Groups
-------------------------------------------------------------------------------------------------------------------------------
Channels Served
-------------------------------------------------------------------------------------------------------------------------------
Aksaray 146.000 m2 4.5 mn units capacity planned in 2021
İzmit 361.000 m2 11 mn units
Covered area Production Capacity
BRISA AT A GLANCE
Replacement
Export
Original Equipment
Passenger
Truck&Bus
Motorcycle Agriculture
Off-The-Road
Brands
2
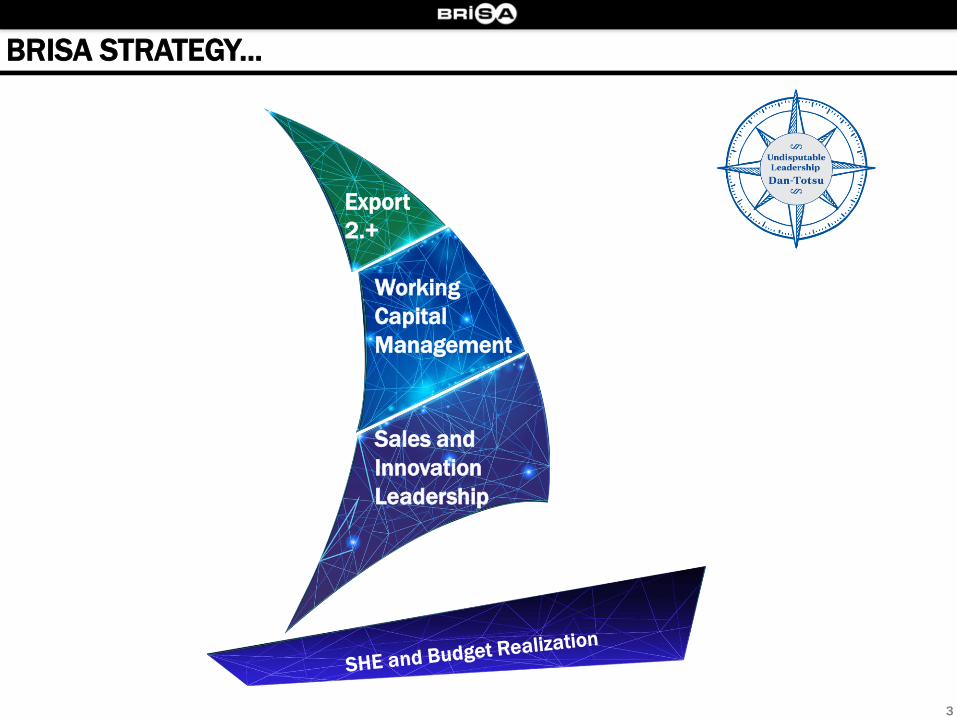
BRISA STRATEGY...
3
Working
Capital
Management
Export
2.+
Sales and
Innovation
Leadership
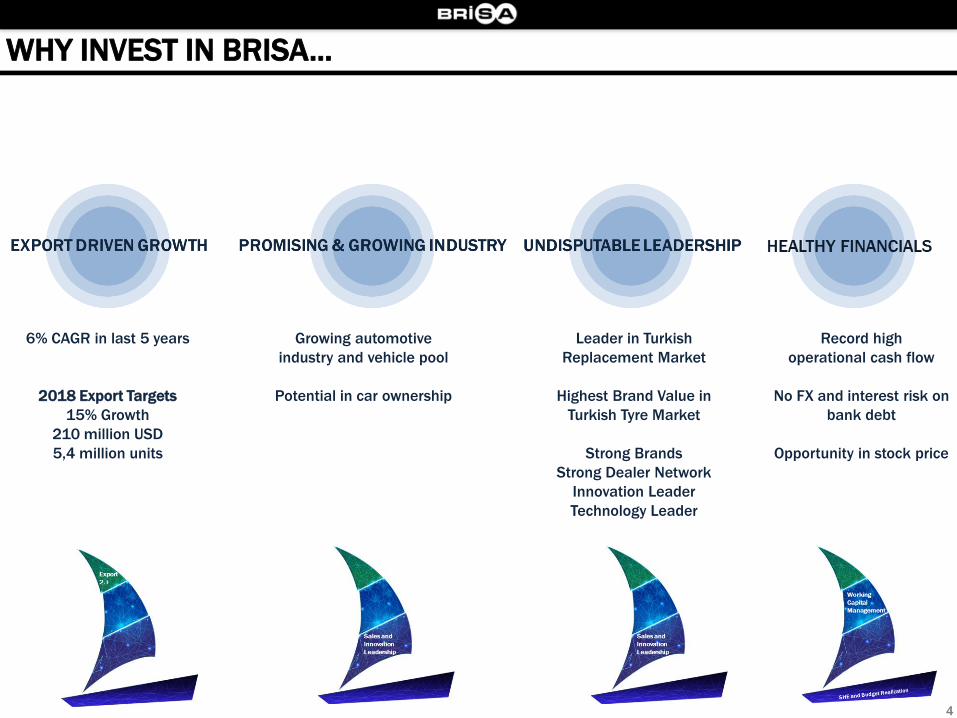
WHY INVEST IN BRISA...
6% CAGR in last 5 years
2018 Export Targets
15% Growth
210 million USD
5,4 million units
Growing automotive
industry and vehicle pool
Potential in car ownership
Leader in Turkish
Replacement Market
Highest Brand Value in
Turkish Tyre Market
Strong Brands
Strong Dealer Network
Innovation Leader
Technology Leader
Record high
operational cash flow
No FX and interest risk on
bank debt
Opportunity in stock price
4
BRISA STRATEGY...
5
Export
2.+

Focused EU Countries:
Spain, UK, Germany,
Italy, Balkans
Focused Non-EU
Countries:
CIS, North Africa, and
Asia Pacific
EXPORT DRIVEN GROWTH (32% of revenue)
6
6% average volume growth in last 5 years
2018 Target: Growth by 15%, $210mn, 5,4 million units
70 Countries,
600 branded shops
6000 sales points
Bridgestone
collaboration;
Bridgestone
export growth
Growth with
- high potential
countries
- new countries
- new customers
- new channels
-------------------------------
Outperforming market growth
rates both in EU and in others-------------------------------
-------------------------------
BRISA STRATEGY...
7
Sales and
Innovation
Leadership
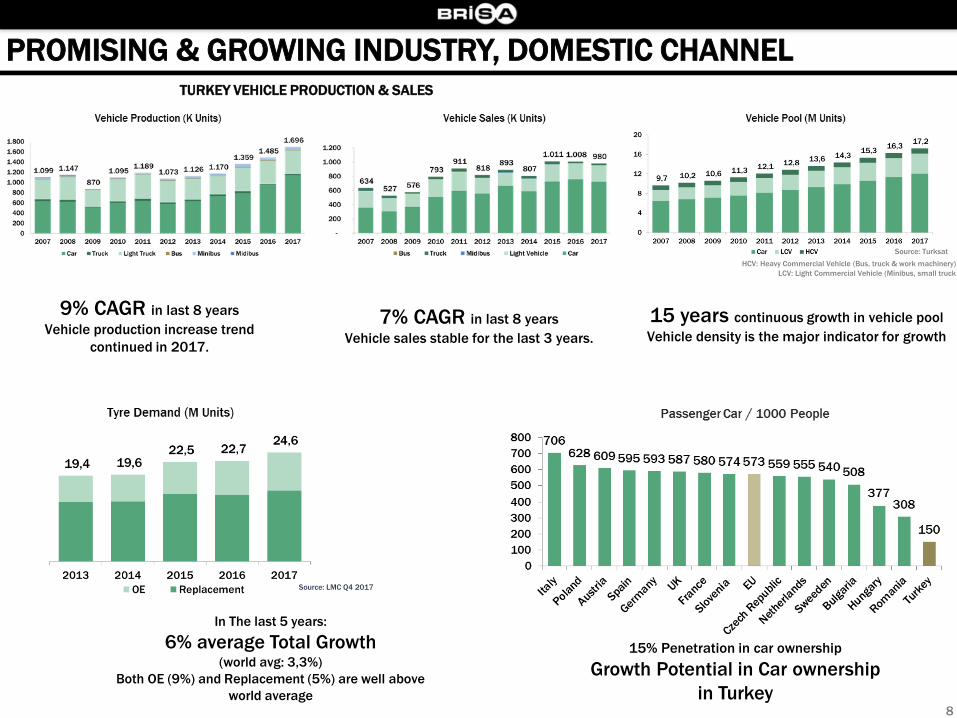
TURKEY VEHICLE PRODUCTION & SALES
PROMISING & GROWING INDUSTRY, DOMESTIC CHANNEL
9% CAGR in last 8 years
Vehicle production increase trend
continued in 2017.
7% CAGR in last 8 years
Vehicle sales stable for the last 3 years.
15% Penetration in car ownership
Growth Potential in Car ownership
in Turkey
15 years continuous growth in vehicle pool
Vehicle density is the major indicator for growth
HCV: Heavy Commercial Vehicle (Bus, truck & work machinery)
LCV: Light Commercial Vehicle (Minibus, small truck
Source: Turksat
Source: LMC Q4 2017
In The last 5 years:
6% average Total Growth (world avg: 3,3%)
Both OE (9%) and Replacement (5%) are well above
world average8
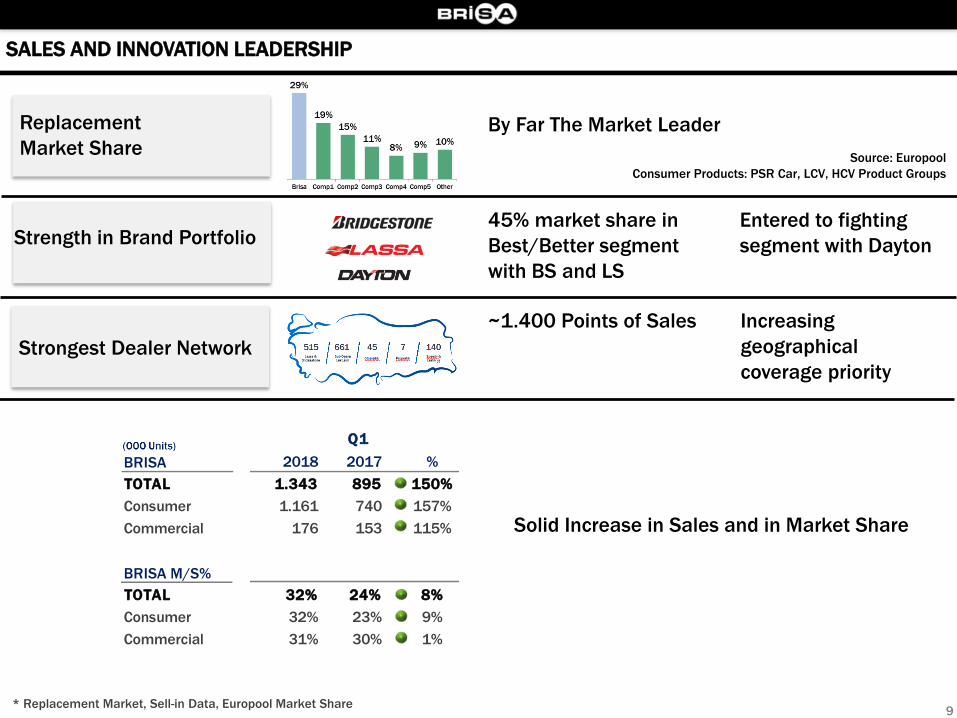
Source: Europool
Consumer Products: PSR Car, LCV, HCV Product Groups
By Far The Market LeaderReplacement
Market Share
SALES AND INNOVATION LEADERSHIP
* Replacement Market, Sell-in Data, Europool Market Share
2018 2017 %
TOTAL 4.197 3.703 113%
Consumer 3.629 3.194 114%
Commercial 569 509 112%
2018 2017 %
TOTAL 1.343 895 150%
Consumer 1.161 740 157%
Commercial 176 153 115%
TOTAL 32% 24% 8%
Consumer 32% 23% 9%
Commercial 31% 30% 1%
BRISA M/S%
RL MARKETS *
Q1
BRISA
Q1
Strength in Brand Portfolio
~1.400 Points of Sales
Strongest Dealer Network
45% market share in
Best/Better segment
with BS and LS
Entered to fighting
segment with Dayton
Increasing
geographical
coverage priority
Solid Increase in Sales and in Market Share
9
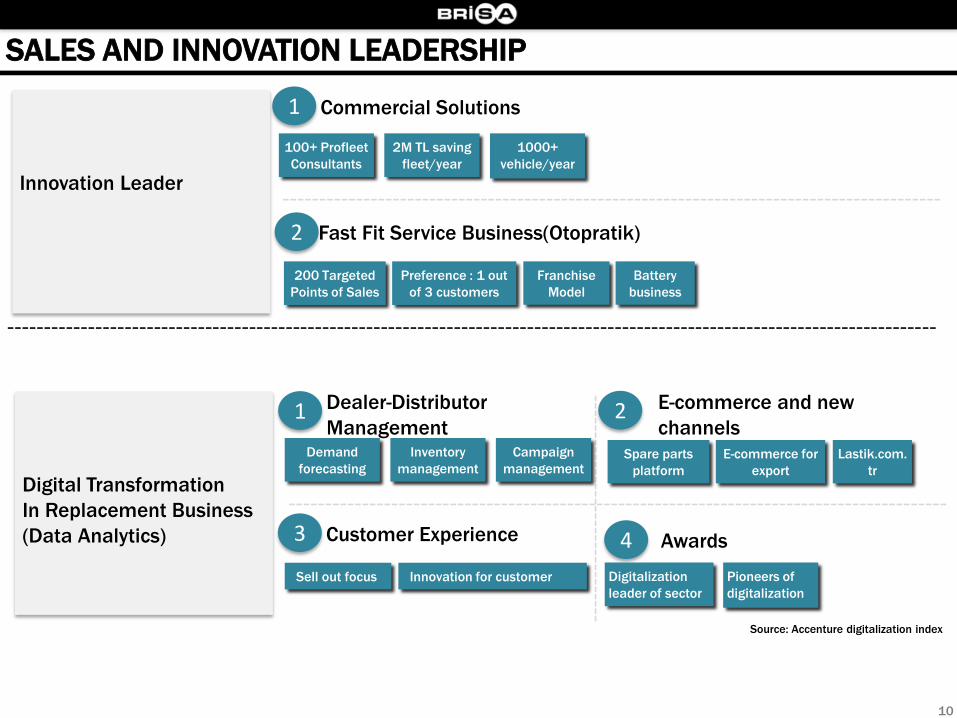
Commercial Solutions
Innovation Leader
-------------------------------------------------------------------------------------------------------------------------------
1
2 Fast Fit Service Business(Otopratik)
------------------------------------------------------------------------------------------
100+ Profleet
Consultants
2M TL saving
fleet/year
1000+
vehicle/year
200 Targeted
Points of Sales
Preference : 1 out
of 3 customers
Franchise
Model
Digital Transformation
In Replacement Business
(Data Analytics)
Dealer-Distributor
Management1 2
Customer Experience3
------------------------------------------------------------------------------------------
-------------------------------
Demand
forecasting
Inventory
management
Campaign
management
Sell out focus Innovation for customer
Spare parts
platform
E-commerce for
export
Lastik.com.
tr
E-commerce and new
channels
4 Awards
Digitalization
leader of sector
Pioneers of
digitalization
Source: Accenture digitalization index
Battery
business
SALES AND INNOVATION LEADERSHIP
10
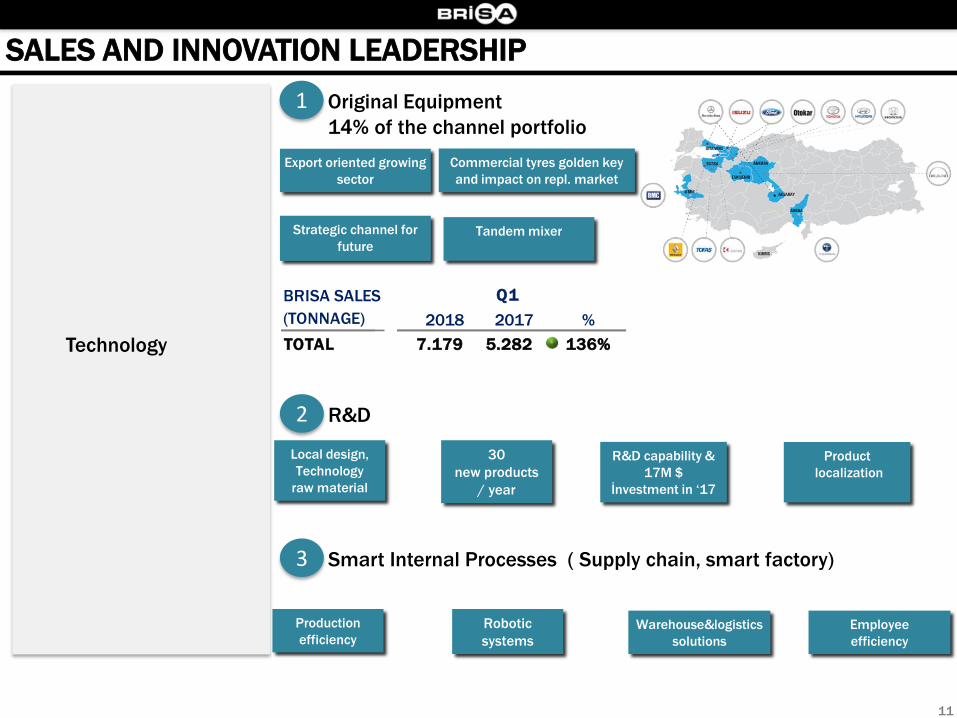
Original Equipment
14% of the channel portfolio
Technology
1
R&D2
30
new products
/ year
Local design,
Technology
raw material
Strategic channel for
future
Commercial tyres golden key
and impact on repl. market
R&D capability &
17M $
İnvestment in ‘17
Export oriented growing
sector
Smart Internal Processes ( Supply chain, smart factory)3
SALES AND INNOVATION LEADERSHIP
Product
localization
Tandem mixer
Robotic
systems
Production
efficiencyWarehouse&logistics
solutions
Employee
efficiency
2018 2017 % 2018 2017 %
TOTAL 426 424 100% 162.208 160.361 101%
PSR 285 300 95% 122.310 114.923 106%
LCV 130 116 112% 36.120 40.521 89%
HCV 11 8 134% 3.778 4.917 77%
2018 2017 %
TOTAL 1.971 1.934 102%
Consumer 1.882 1.870 101%
Commercial 88 64 139%
2018 2017 %
TOTAL 7.179 5.282 136%
VEHICLE PRODUCTION VEHICLE SALES
Q1Q1
Q1
OE MARKETS
Q1BRISA SALES
(TONNAGE)
OE MARKETS
11
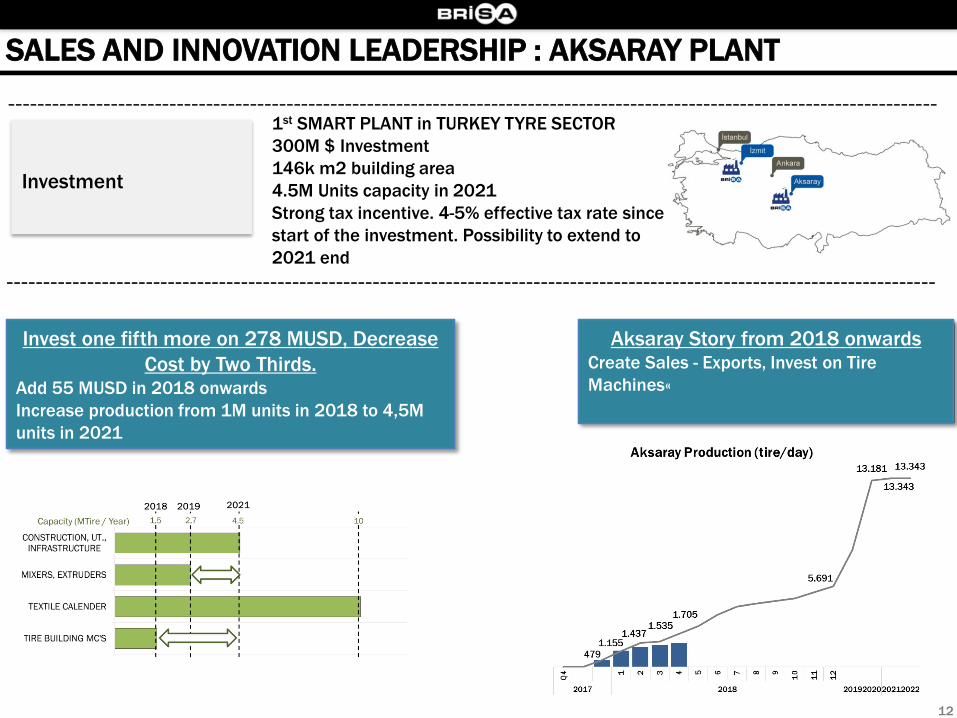
-------------------------------------------------------------------------------------------------------------------------------1st SMART PLANT in TURKEY TYRE SECTOR
300M $ Investment
146k m2 building area
4.5M Units capacity in 2021
Strong tax incentive. 4-5% effective tax rate since
start of the investment. Possibility to extend to
2021 end
-------------------------------------------------------------------------------------------------------------------------------
Investment
SALES AND INNOVATION LEADERSHIP : AKSARAY PLANT
Invest one fifth more on 278 MUSD, Decrease
Cost by Two Thirds.Add 55 MUSD in 2018 onwards
Increase production from 1M units in 2018 to 4,5M
units in 2021
Aksaray Story from 2018 onwards Create Sales - Exports, Invest on Tire
Machines«
12
WHY INVEST IN BRISA...
Record high operational cash
flow for the last 10 years
No FX and interest risk on bank
debt
Opportunity in stock price
13
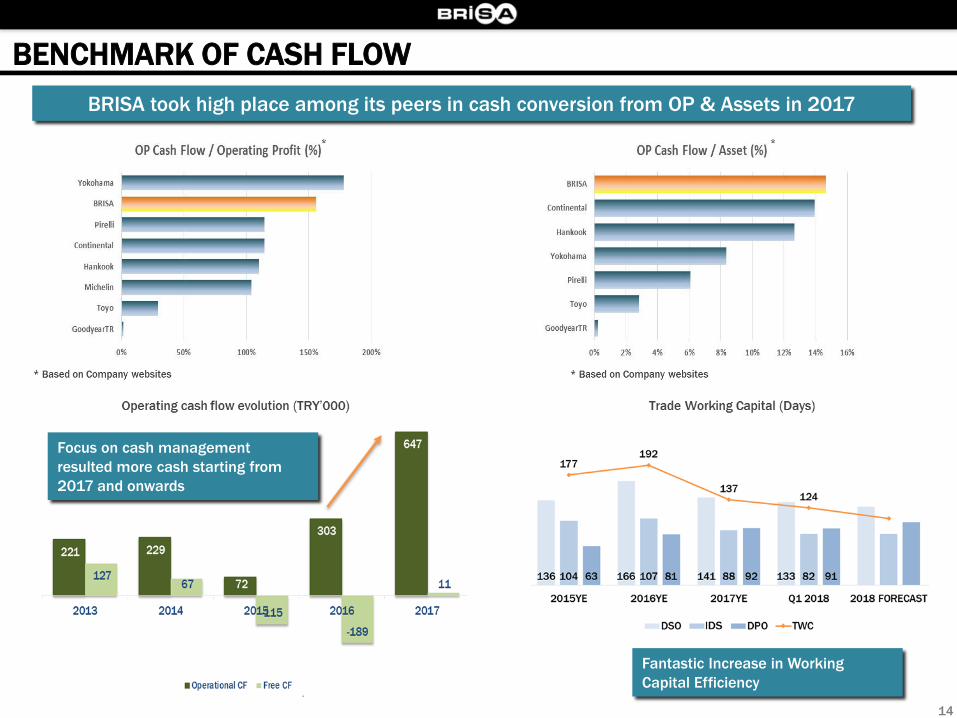
BRISA took high place among its peers in cash conversion from OP & Assets in 2017
Focus on cash management
resulted more cash starting from
2017 and onwards
BENCHMARK OF CASH FLOW
14
Fantastic Increase in Working
Capital Efficiency
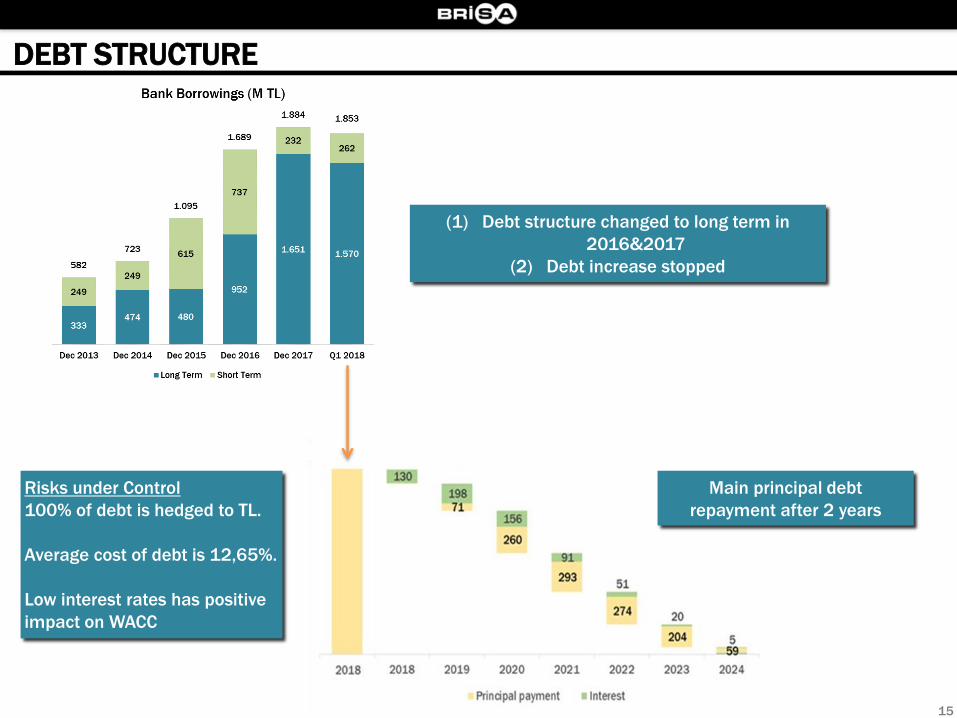
Main principal debt
repayment after 2 years
(1) Debt structure changed to long term in
2016&2017
(2) Debt increase stopped
DEBT STRUCTURE
Risks under Control
100% of debt is hedged to TL.
Average cost of debt is 12,65%.
Low interest rates has positive
impact on WACC
15
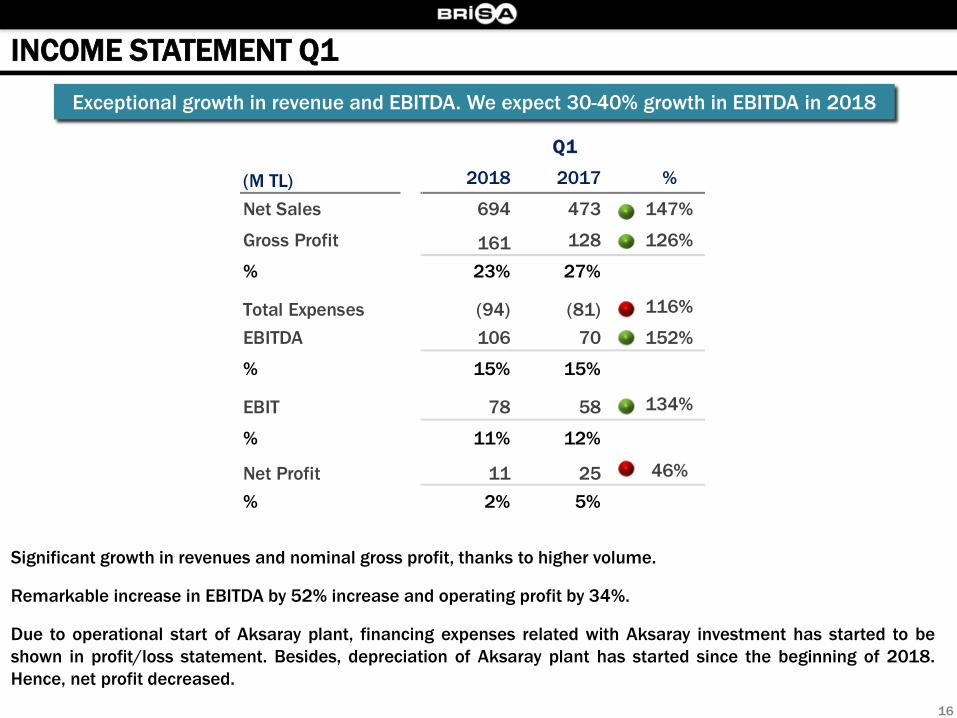
Significant growth in revenues and nominal gross profit, thanks to higher volume.
Remarkable increase in EBITDA by 52% increase and operating profit by 34%.
Due to operational start of Aksaray plant, financing expenses related with Aksaray investment has started to be
shown in profit/loss statement. Besides, depreciation of Aksaray plant has started since the beginning of 2018.
Hence, net profit decreased.
2018 2017 %
Net Sales 694 473 147%
Gross Profit 161 128 126%
% 23% 27%
Total Expenses (94) (81) 116%
EBITDA 106 70 152%
% 15% 15%
EBIT 78 58 134%
% 11% 12%
Net Profit 11 25 46%
% 2% 5%
(M TL)
Q1
INCOME STATEMENT Q1
Exceptional growth in revenue and EBITDA. We expect 30-40% growth in EBITDA in 2018
16
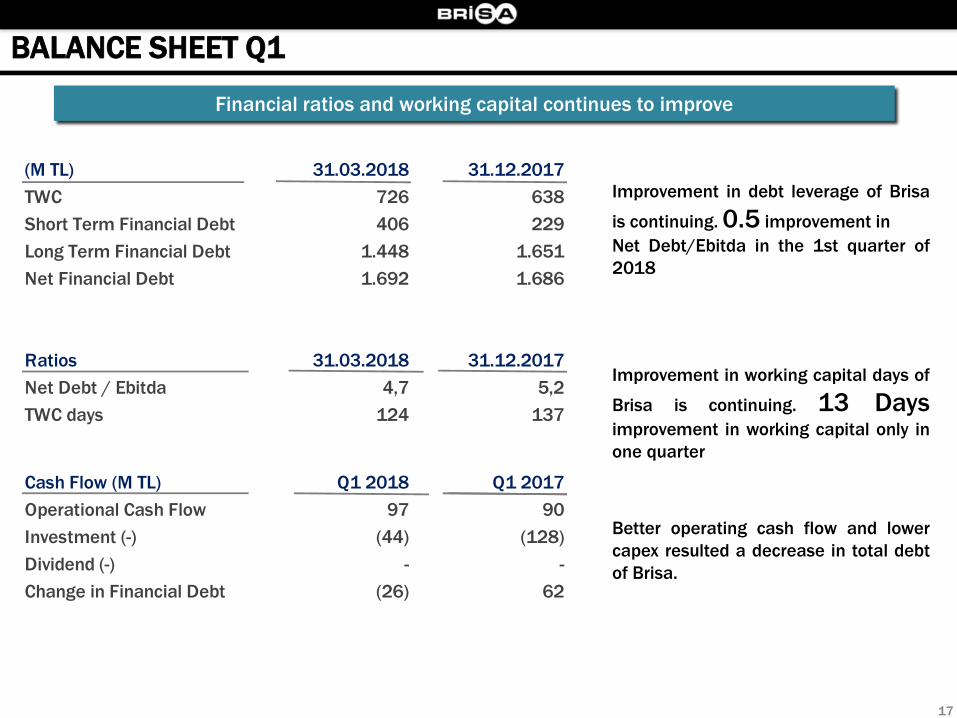
Improvement in debt leverage of Brisa
is continuing. 0.5 improvement in
Net Debt/Ebitda in the 1st quarter of
2018
Improvement in working capital days of
Brisa is continuing. 13 Daysimprovement in working capital only in
one quarter
Better operating cash flow and lower
capex resulted a decrease in total debt
of Brisa.
(M TL) 31.03.2018 31.12.2017
TWC 726 638
Short Term Financial Debt 406 229
Long Term Financial Debt 1.448 1.651
Net Financial Debt 1.692 1.686
Ratios 31.03.2018 31.12.2017
Net Debt / Ebitda 4,7 5,2
TWC days 124 137
Net Financial Debt / Equity 2,5 2,5
Total Debt / Equity 2,7 2,8
Cash Flow (M TL) Q1 2018 Q1 2017
Operational Cash Flow 97 90
Investment (-) (44) (128)
Dividend (-) - -
Change in Financial Debt (26) 62
BALANCE SHEET Q1
Financial ratios and working capital continues to improve
17
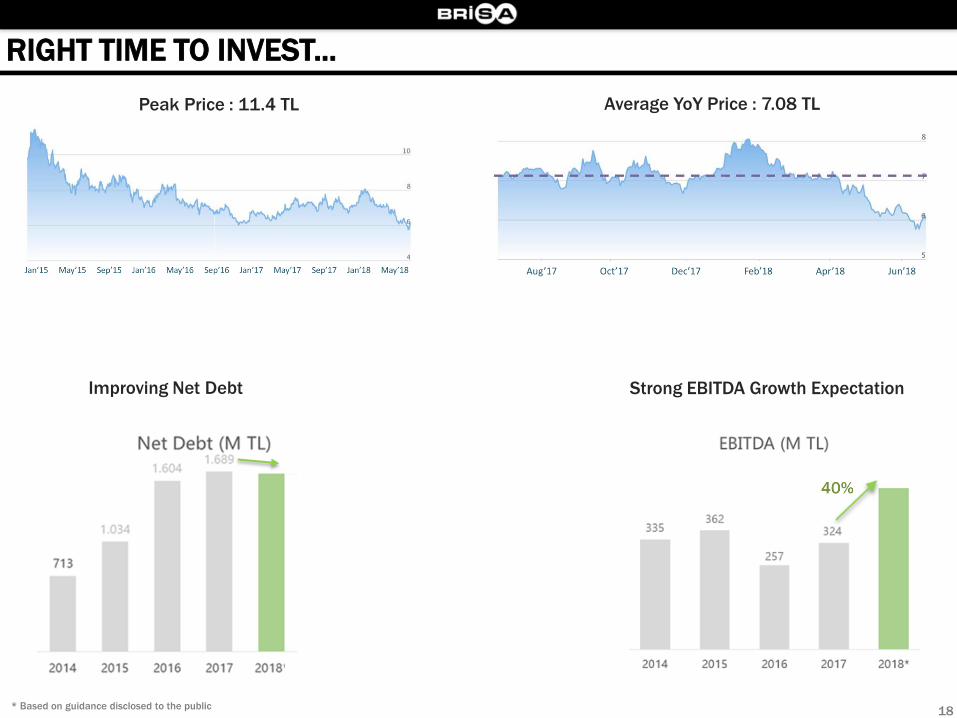
RIGHT TIME TO INVEST...
Strong EBITDA Growth ExpectationImproving Net Debt
Average YoY Price : 7.08 TL
* Based on guidance disclosed to the public
Peak Price : 11.4 TL
18