Embed Size (px)
Citation preview
-
SABESP announces 3Q18 results
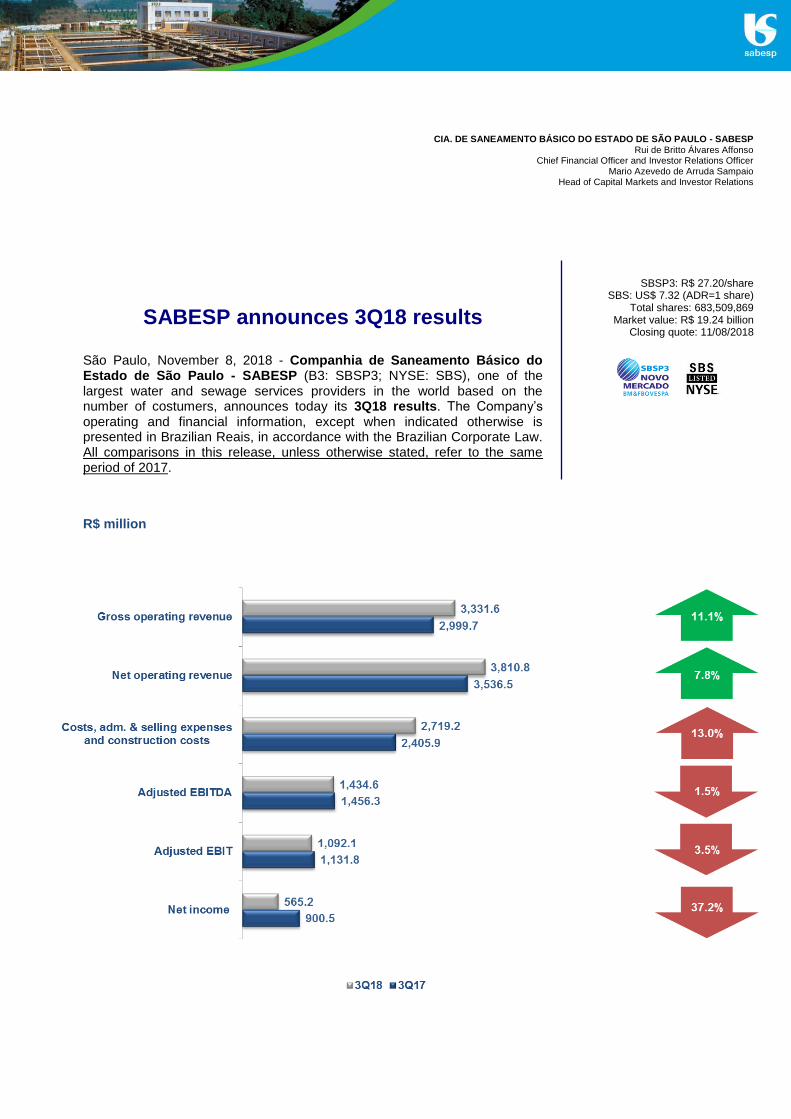
São Paulo, November 8, 2018 - Companhia de Saneamento Básico do Estado de São Paulo - SABESP (B3: SBSP3; NYSE: SBS), one of the largest water and sewage services providers in the world based on the number of costumers, announces today its 3Q18 results. The Company’s operating and financial information, except when indicated otherwise is presented in Brazilian Reais, in accordance with the Brazilian Corporate Law. All comparisons in this release, unless otherwise stated, refer to the same period of 2017.
R$ million
SBSP3: R$ 27.20/share SBS: US$ 7.32 (ADR=1 share)
Total shares: 683,509,869 Market value: R$ 19.24 billion
Closing quote: 11/08/2018
CIA. DE SANEAMENTO BÁSICO DO ESTADO DE SÃO PAULO - SABESP Rui de Britto Álvares Affonso
Chief Financial Officer and Investor Relations Officer Mario Azevedo de Arruda Sampaio
Head of Capital Markets and Investor Relations
Page 2 of 12
R$ million
3Q18 3Q17 Chg. (R$) % 9M18 9M17 Chg. (R$) %
Gross operating revenue ¹ 3,331.6 2,999.7 331.9 11.1 9,862.3 8,930.6 931.7 10.4
Construction revenue 724.1 712.9 11.2 1.6 2,038.4 2,215.2 (176.8) (8.0)
COFINS and PASEP and TRCF taxes ² (244.9) (176.1) (68.8) 39.1 (718.0) (555.9) (162.1) 29.2
(=) Net operating revenue 3,810.8 3,536.5 274.3 7.8 11,182.7 10,589.9 592.8 5.6
Costs and expenses (2,011.3) (1,711.4) (299.9) 17.5 (5,975.5) (5,528.0) (447.5) 8.1
Construction costs (707.9) (694.5) (13.4) 1.9 (1,992.6) (2,165.9) 173.3 (8.0)
Equity result 0.5 1.2 (0.7) (58.3) 4.2 4.7 (0.5) (10.6)
Other operating revenue (expenses), net 34.2 14.6 19.6 134.2 62.0 37.7 24.3 64.5
(=) Earnings before financial result, income tax and social contribution 1,126.3 1,146.4 (20.1) (1.8) 3,280.8 2,938.4 342.4 11.7
Financial result (262.8) 222.9 (485.7) (217.9) (1,293.9) (54.5) (1,239.4) 2,274.1
(=) Earnings before income tax and social contribution 863.5 1,369.3 (505.8) (36.9) 1,986.9 2,883.9 (897.0) (31.1)
Income tax and social contribution (298.3) (468.8) 170.5 (36.4) (659.4) (977.2) 317.8 (32.5)
(=) Net income 565.2 900.5 (335.3) (37.2) 1,327.5 1,906.7 (579.2) (30.4)
Earnings per share* (R$) 0.83 1.32 - - 1.94 2.79
R$ million
3Q18 3Q17 Chg. (R$) % 9M18 9M17 Chg. (R$) %
Net income 565.2 900.5 (335.3) (37.2) 1,327.5 1,906.7 (579.2) (30.4)
Income tax and social contribution 298.3 468.8 (170.5) (36.4) 659.4 977.2 (317.8) (32.5)
Financial result 262.8 (222.9) 485.7 (217.9) 1,293.9 54.5 1,239.4 2,274.1
Other operating revenues (expenses), net (34.2) (14.6) (19.6) 134.2 (62.0) (37.7) (24.3) 64.5
(=) Adjusted EBIT* 1,092.1 1,131.8 (39.7) (3.5) 3,218.8 2,900.7 318.1 11.0
Depreciation and amortization 342.5 324.5 18.0 5.5 997.4 974.5 22.9 2.3
(=) Adjusted EBITDA ** 1,434.6 1,456.3 (21.7) (1.5) 4,216.2 3,875.2 341.0 8.8
(%) Adjusted EBITDA margin 37.6 41.2 37.7 36.6
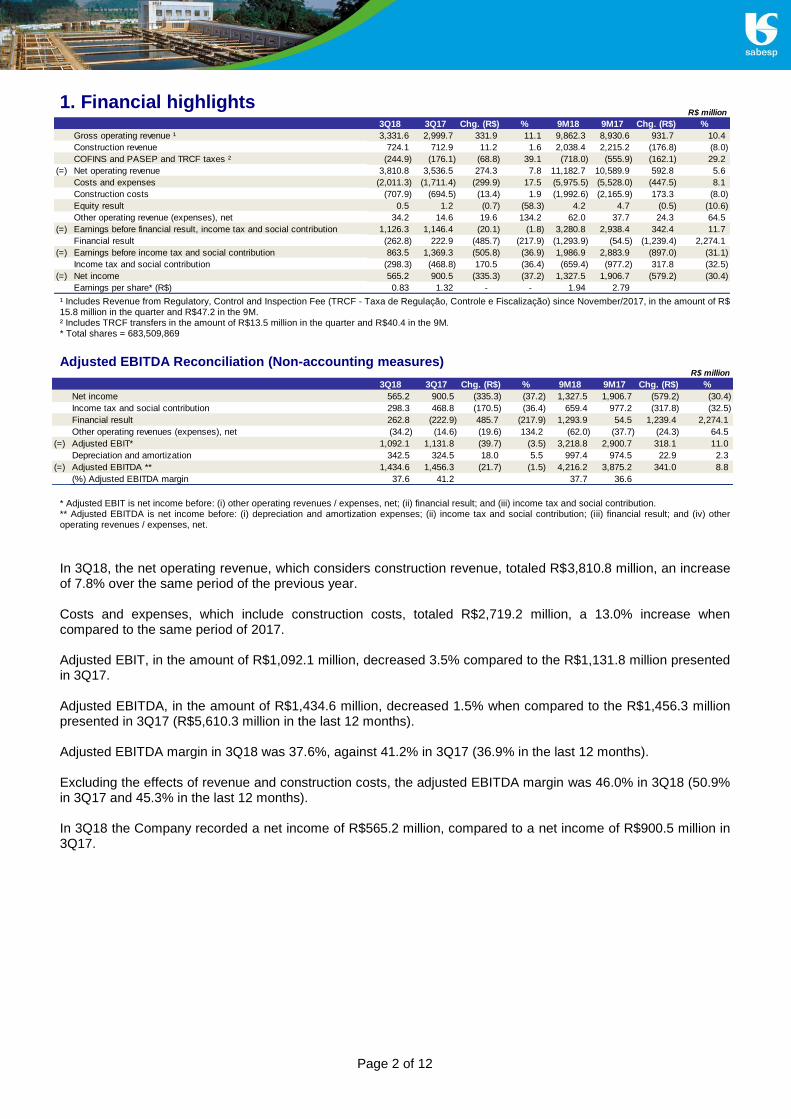
1. Financial highlights
¹ Includes Revenue from Regulatory, Control and Inspection Fee (TRCF - Taxa de Regulação, Controle e Fiscalização) since November/2017, in the amount of R$ 15.8 million in the quarter and R$47.2 in the 9M. ² Includes TRCF transfers in the amount of R$13.5 million in the quarter and R$40.4 in the 9M. * Total shares = 683,509,869
Adjusted EBITDA Reconciliation (Non-accounting measures)
* Adjusted EBIT is net income before: (i) other operating revenues / expenses, net; (ii) financial result; and (iii) income tax and social contribution. ** Adjusted EBITDA is net income before: (i) depreciation and amortization expenses; (ii) income tax and social contribution; (iii) financial result; and (iv) other operating revenues / expenses, net.
In 3Q18, the net operating revenue, which considers construction revenue, totaled R$3,810.8 million, an increase of 7.8% over the same period of the previous year. Costs and expenses, which include construction costs, totaled R$2,719.2 million, a 13.0% increase when compared to the same period of 2017. Adjusted EBIT, in the amount of R$1,092.1 million, decreased 3.5% compared to the R$1,131.8 million presented in 3Q17. Adjusted EBITDA, in the amount of R$1,434.6 million, decreased 1.5% when compared to the R$1,456.3 million presented in 3Q17 (R$5,610.3 million in the last 12 months). Adjusted EBITDA margin in 3Q18 was 37.6%, against 41.2% in 3Q17 (36.9% in the last 12 months). Excluding the effects of revenue and construction costs, the adjusted EBITDA margin was 46.0% in 3Q18 (50.9% in 3Q17 and 45.3% in the last 12 months). In 3Q18 the Company recorded a net income of R$565.2 million, compared to a net income of R$900.5 million in 3Q17.
Page 3 of 12
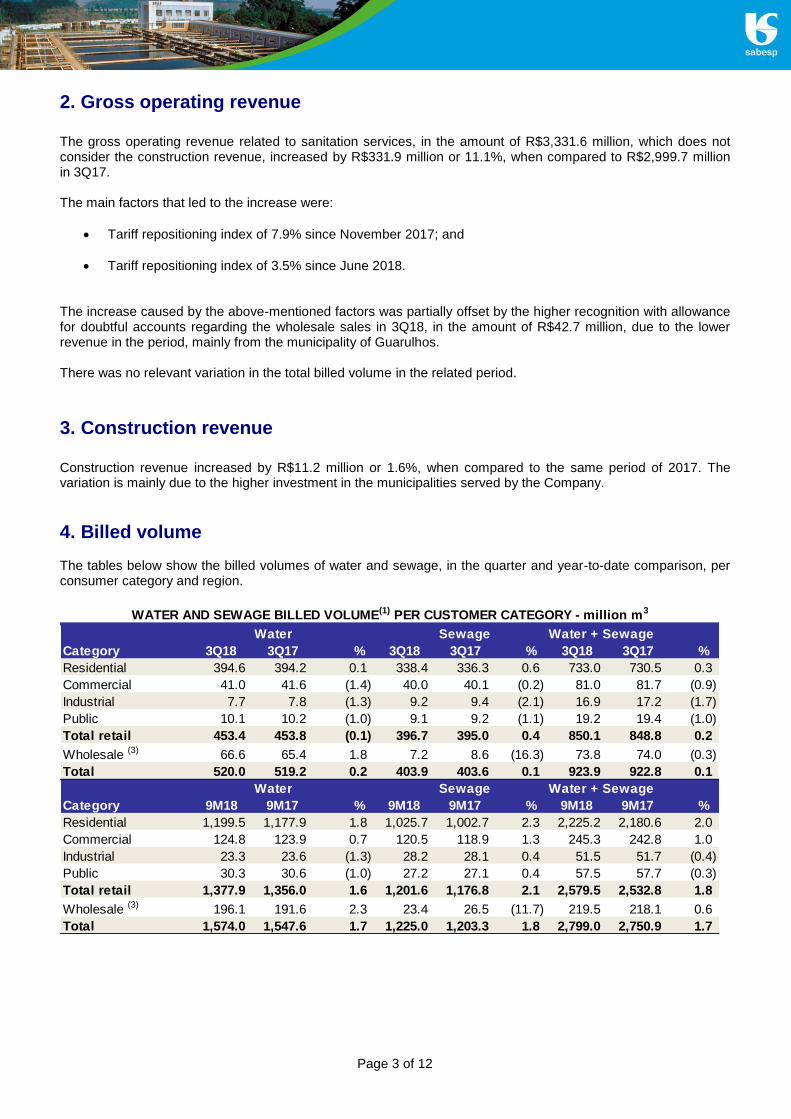
2. Gross operating revenue The gross operating revenue related to sanitation services, in the amount of R$3,331.6 million, which does not consider the construction revenue, increased by R$331.9 million or 11.1%, when compared to R$2,999.7 million in 3Q17. The main factors that led to the increase were:
Tariff repositioning index of 7.9% since November 2017; and
Tariff repositioning index of 3.5% since June 2018. The increase caused by the above-mentioned factors was partially offset by the higher recognition with allowance for doubtful accounts regarding the wholesale sales in 3Q18, in the amount of R$42.7 million, due to the lower revenue in the period, mainly from the municipality of Guarulhos. There was no relevant variation in the total billed volume in the related period.
3. Construction revenue Construction revenue increased by R$11.2 million or 1.6%, when compared to the same period of 2017. The variation is mainly due to the higher investment in the municipalities served by the Company.
4. Billed volume The tables below show the billed volumes of water and sewage, in the quarter and year-to-date comparison, per consumer category and region.
Water Sewage Water + Sewage
Category 3Q18 3Q17 % 3Q18 3Q17 % 3Q18 3Q17 %
Residential 394.6 394.2 0.1 338.4 336.3 0.6 733.0 730.5 0.3
Commercial 41.0 41.6 (1.4) 40.0 40.1 (0.2) 81.0 81.7 (0.9)
Industrial 7.7 7.8 (1.3) 9.2 9.4 (2.1) 16.9 17.2 (1.7)
Public 10.1 10.2 (1.0) 9.1 9.2 (1.1) 19.2 19.4 (1.0)
Total retail 453.4 453.8 (0.1) 396.7 395.0 0.4 850.1 848.8 0.2
Wholesale (3) 66.6 65.4 1.8 7.2 8.6 (16.3) 73.8 74.0 (0.3)
Total 520.0 519.2 0.2 403.9 403.6 0.1 923.9 922.8 0.1
Water Sewage Water + Sewage
Category 9M18 9M17 % 9M18 9M17 % 9M18 9M17 %
Residential 1,199.5 1,177.9 1.8 1,025.7 1,002.7 2.3 2,225.2 2,180.6 2.0
Commercial 124.8 123.9 0.7 120.5 118.9 1.3 245.3 242.8 1.0
Industrial 23.3 23.6 (1.3) 28.2 28.1 0.4 51.5 51.7 (0.4)
Public 30.3 30.6 (1.0) 27.2 27.1 0.4 57.5 57.7 (0.3)
Total retail 1,377.9 1,356.0 1.6 1,201.6 1,176.8 2.1 2,579.5 2,532.8 1.8
Wholesale (3) 196.1 191.6 2.3 23.4 26.5 (11.7) 219.5 218.1 0.6
Total 1,574.0 1,547.6 1.7 1,225.0 1,203.3 1.8 2,799.0 2,750.9 1.7
WATER AND SEWAGE BILLED VOLUME(1) PER CUSTOMER CATEGORY - million m3
Page 4 of 12
R$ million
3Q18 3Q17 Chg. (R$) % 9M18 9M17 Chg. (R$) %
Salaries and payroll charges and Pension plan obligations 692.2 623.4 68.8 11.0 2,002.3 1,927.8 74.5 3.9
General supplies 61.0 39.8 21.2 53.3 169.9 117.4 52.5 44.7
Treatment supplies 58.1 60.1 (2.0) (3.3) 195.5 198.9 (3.4) (1.7)
Services 366.5 288.4 78.1 27.1 1,063.2 920.9 142.3 15.5
Electricity 241.5 203.6 37.9 18.6 692.1 591.2 100.9 17.1
General expenses 216.7 184.4 32.3 17.5 685.0 633.9 51.1 8.1
Tax expenses 13.5 21.6 (8.1) (37.5) 44.1 75.9 (31.8) (41.9)
Sub-total 1,649.5 1,421.3 228.2 16.1 4,852.1 4,466.0 386.1 8.6
Depreciation and amortization 342.5 324.5 18.0 5.5 997.4 974.5 22.9 2.3
Allowance for doubtful accounts 19.3 (34.4) 53.7 (156.1) 126.0 87.5 38.5 44.0
Sub-total 361.8 290.1 71.7 24.7 1,123.4 1,062.0 61.4 5.8
Costs, administrative and selling expenses 2,011.3 1,711.4 299.9 17.5 5,975.5 5,528.0 447.5 8.1
Construction costs 707.9 694.5 13.4 1.9 1,992.6 2,165.9 (173.3) (8.0)
Costs, adm & selling expenses and construction costs 2,719.2 2,405.9 313.3 13.0 7,968.1 7,693.9 274.2 3.6
% of net revenue 71.4 68.0 71.3 72.7
(1) Unaudited (2) Including coastal and interior region (3) Reused water volume and non-domestic sewage are included in
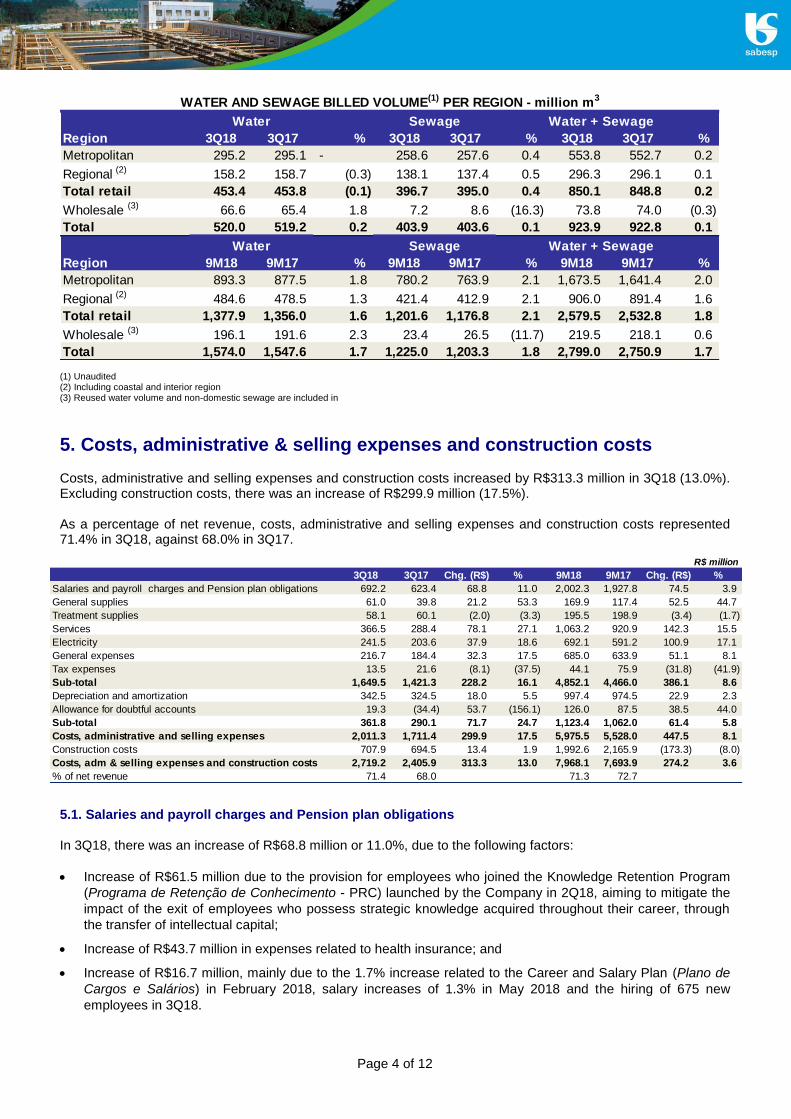
5. Costs, administrative & selling expenses and construction costs Costs, administrative and selling expenses and construction costs increased by R$313.3 million in 3Q18 (13.0%). Excluding construction costs, there was an increase of R$299.9 million (17.5%). As a percentage of net revenue, costs, administrative and selling expenses and construction costs represented 71.4% in 3Q18, against 68.0% in 3Q17.
5.1. Salaries and payroll charges and Pension plan obligations In 3Q18, there was an increase of R$68.8 million or 11.0%, due to the following factors:
Increase of R$61.5 million due to the provision for employees who joined the Knowledge Retention Program
(Programa de Retenção de Conhecimento - PRC) launched by the Company in 2Q18, aiming to mitigate the
impact of the exit of employees who possess strategic knowledge acquired throughout their career, through
the transfer of intellectual capital;
Increase of R$43.7 million in expenses related to health insurance; and
Increase of R$16.7 million, mainly due to the 1.7% increase related to the Career and Salary Plan (Plano de
Cargos e Salários) in February 2018, salary increases of 1.3% in May 2018 and the hiring of 675 new
employees in 3Q18.
Water + Sewage
Region 3Q18 3Q17 % 3Q18 3Q17 % 3Q18 3Q17 %
Metropolitan 295.2 295.1 - 258.6 257.6 0.4 553.8 552.7 0.2
Regional (2) 158.2 158.7 (0.3) 138.1 137.4 0.5 296.3 296.1 0.1
Total retail 453.4 453.8 (0.1) 396.7 395.0 0.4 850.1 848.8 0.2
Wholesale (3) 66.6 65.4 1.8 7.2 8.6 (16.3) 73.8 74.0 (0.3)
Total 520.0 519.2 0.2 403.9 403.6 0.1 923.9 922.8 0.1
Water + Sewage
Region 9M18 9M17 % 9M18 9M17 % 9M18 9M17 %
Metropolitan 893.3 877.5 1.8 780.2 763.9 2.1 1,673.5 1,641.4 2.0
Regional (2) 484.6 478.5 1.3 421.4 412.9 2.1 906.0 891.4 1.6
Total retail 1,377.9 1,356.0 1.6 1,201.6 1,176.8 2.1 2,579.5 2,532.8 1.8
Wholesale (3) 196.1 191.6 2.3 23.4 26.5 (11.7) 219.5 218.1 0.6
Total 1,574.0 1,547.6 1.7 1,225.0 1,203.3 1.8 2,799.0 2,750.9 1.7
WATER AND SEWAGE BILLED VOLUME(1) PER REGION - million m3
Water Sewage
Water Sewage
Page 5 of 12
The increases above were partially offset by the reversal of R$56.2 million in the provision for the Provision for
Consent Decree (Termo de Ajuste de Conduta - TAC), related to the employees who joined the PRC.
5.2. General Materials
Increase of R$21.2 million, or 53.3%, mainly due to the greater use of materials in the maintenance in water and sewage networks and in the maintenance of real estate and facilities, in the amount of R$8.0 million and R$5.9 million, respectively. 5.3 Services
Service expenses in the amount of R$366.5 million increased by R$78.1 million, or 27.1%, compared to the R$288.4 million recorded in 3Q17. The increase in this line was distributed in several items, the main ones were:
Increased hiring of technical services in 3Q18, in the amount of R$27.9 million, mainly related to: (i)
customer service, in the amount of R$3.7 million; and (ii) IT technical support, in the amount of R$3.5
million;
Greater services execution in maintenance, in the water and sewage systems, in the amount of R$7.8
million;
Increased surveillance expenses, in the amount of R$6.1 million; and
Maintenance of properties and facilities, in the amount of R$5.4 million.
5.4. Electricity Electricity expenses totaled R$241.5 million in 3Q18, an increase of R$37.9 million or 18.6% when compared to the R$203.6 million in 3Q17. This variation was mainly due to:
Average increase of 10.1% in free market tariffs (Ambiente de Contratação Livre - ACL), with a decrease of 1.3% in consumption;
Average increase of 11.4% in the grid market tariffs (Tarifas de Uso do Sistema de Distribuição - TUSD), with a 10.5% increase in consumption; and
Average increase of 20.4% in regulated market tariffs (Ambiente de Contratação Regulada - ACR), with a decrease of 0.9% in consumption.
In 3Q18, ACL represented 34.3% of the total amount of electricity consumed by the Company, TUSD 34.1% and ACR represented 31.6% of this amount. 5.5. General expenses An increase of R$32.3 million or 17.5%, totaling R$216.7 million in 3Q18, compared to R$184.4 million in 3Q17, mainly due to the following factors:
Higher expenses related to charging for use of water, in the amount of R$23.0 million, related to a
additional payment made to Foundation Agency of Alto Tietê Water Basin (Fundação Agência Bacia
Hidrográfica Alto Tietê - FABHAT ) from 2014 to 2016; due to the signature of a Recognition of
Obligations Term (Termo de Reconhecimento de Obrigações) between the Company and FABHAT in
3Q18; and
Page 6 of 12
Higher provision for transfer to the São Paulo Municipal Fund for Environmental Sanitation and
Infrastructure (Fundo Municipal de Saneamento Ambiental e Infraestrutura de São Paulo), in the amount
of R$15.2 million.
The above-mentioned increases were partially offset by the lower provisioning for lawsuits in 3Q18, in the amount of R$8.7 million.
5.6. Depreciation and Amortization The expenses with depreciation and amortization increased by R$18.0 million or 5.5%, mainly due to the start-up of intangible assets, in the amount of R$3.7 billion. 5.7. Allowance for doubtful accounts Increase of R$53.7 million, mainly due to:
Lower recovery of unpaid amounts of R$30.1 million in 3Q18; and
Increase in delinquency rates, with an impact of R$23.6 million.
6. Other Operating Revenues (Expenses), Net
Increase of R$19.6 million, mainly related to the higher receipt of resources from the Water Basin Decontamination Program (Programa de Despoluição de Bacias Hidrográficas) in 3Q18, in the amount of R$12.8 million.
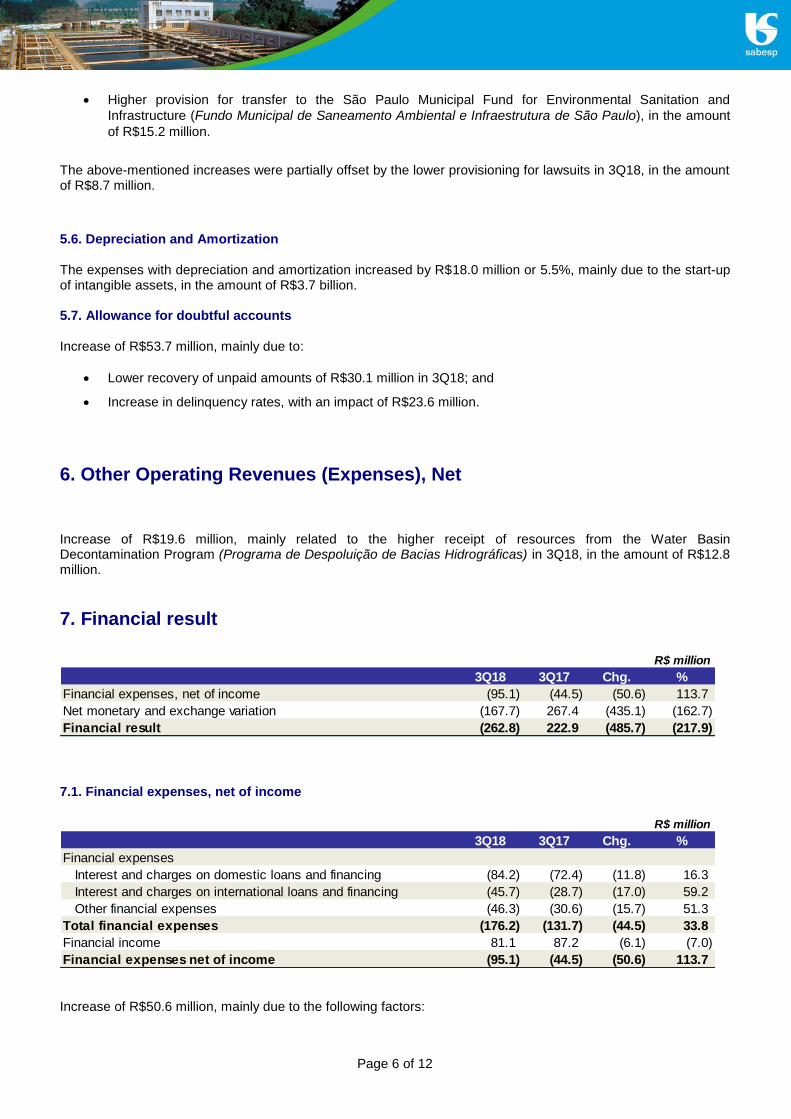
7. Financial result
7.1. Financial expenses, net of income
Increase of R$50.6 million, mainly due to the following factors:
R$ million
3Q18 3Q17 Chg. %
Financial expenses, net of income (95.1) (44.5) (50.6) 113.7
Net monetary and exchange variation (167.7) 267.4 (435.1) (162.7)
Financial result (262.8) 222.9 (485.7) (217.9)
R$ million
3Q18 3Q17 Chg. %
Financial expenses
Interest and charges on domestic loans and financing (84.2) (72.4) (11.8) 16.3
Interest and charges on international loans and financing (45.7) (28.7) (17.0) 59.2
Other financial expenses (46.3) (30.6) (15.7) 51.3
Total financial expenses (176.2) (131.7) (44.5) 33.8
Financial income 81.1 87.2 (6.1) (7.0)
Financial expenses net of income (95.1) (44.5) (50.6) 113.7
Page 7 of 12
Increase of R$11.8 million in interest and charges on domestic loans and financings, mainly due to the
lower capitalized amount to intangible assets in 3Q18 when compared to 3Q17;
Increase of R$17.0 million in interest and charges on foreign loans and financings, mainly due to the
higher outstanding amounts in 3Q18 when compared to 3Q17, resulting from the appreciation of the
dollar and yen against the real; and
Increase of R$15.7 million in other financial expenses, mainly due to: (i) recognition of interest on
investment related to the Public-Private Partnership - PPP, in 3Q18, in the amount of R$36.1 million, due
to the full startup of the São Lourenço Production System (Sistema Produtor São Lourenço) in July 2018;
and (ii) lower recognition of interest in lawsuits, in the amount of R$16.8 million.
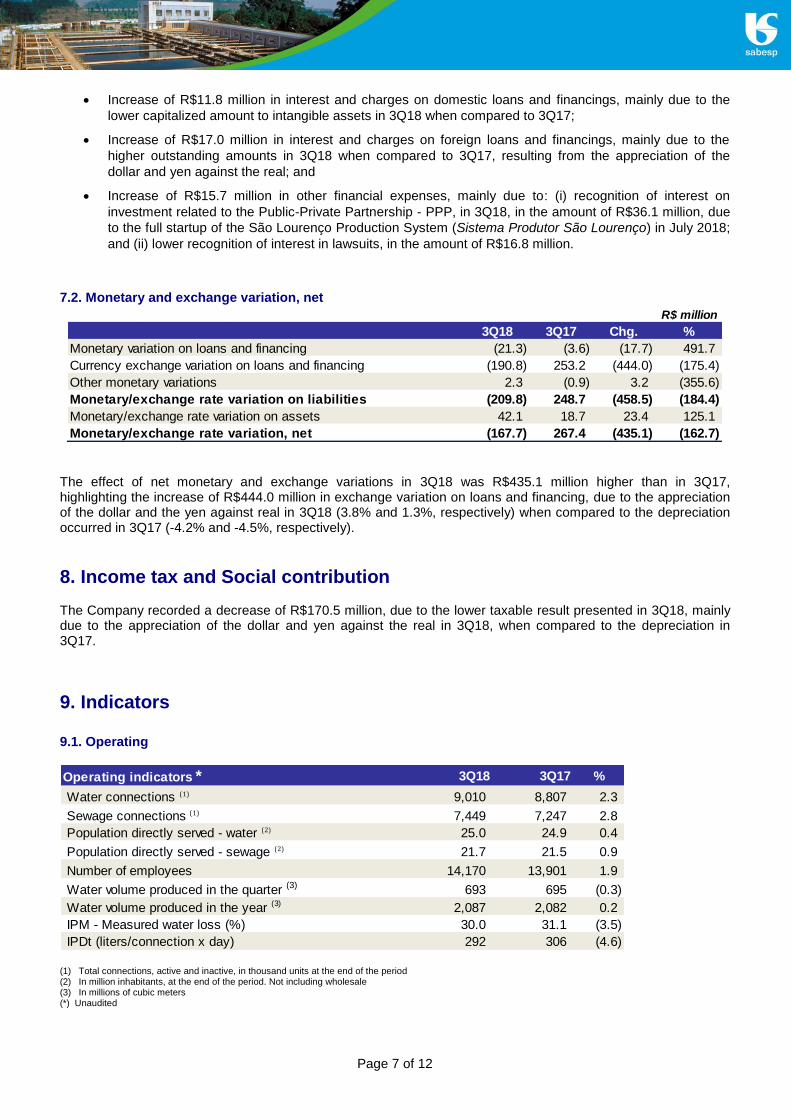
7.2. Monetary and exchange variation, net
The effect of net monetary and exchange variations in 3Q18 was R$435.1 million higher than in 3Q17, highlighting the increase of R$444.0 million in exchange variation on loans and financing, due to the appreciation of the dollar and the yen against real in 3Q18 (3.8% and 1.3%, respectively) when compared to the depreciation occurred in 3Q17 (-4.2% and -4.5%, respectively).
8. Income tax and Social contribution The Company recorded a decrease of R$170.5 million, due to the lower taxable result presented in 3Q18, mainly due to the appreciation of the dollar and yen against the real in 3Q18, when compared to the depreciation in 3Q17.
9. Indicators
9.1. Operating
(1) Total connections, active and inactive, in thousand units at the end of the period (2) In million inhabitants, at the end of the period. Not including wholesale (3) In millions of cubic meters (*) Unaudited
R$ million
3Q18 3Q17 Chg. %
Monetary variation on loans and financing (21.3) (3.6) (17.7) 491.7
Currency exchange variation on loans and financing (190.8) 253.2 (444.0) (175.4)
Other monetary variations 2.3 (0.9) 3.2 (355.6)
Monetary/exchange rate variation on liabilities (209.8) 248.7 (458.5) (184.4)
Monetary/exchange rate variation on assets 42.1 18.7 23.4 125.1
Monetary/exchange rate variation, net (167.7) 267.4 (435.1) (162.7)
Operating indicators * 3Q18 3Q17 %
Water connections (1) 9,010 8,807 2.3
Sewage connections (1) 7,449 7,247 2.8
Population directly served - water (2) 25.0 24.9 0.4
Population directly served - sewage (2) 21.7 21.5 0.9
Number of employees 14,170 13,901 1.9
Water volume produced in the quarter (3) 693 695 (0.3)
Water volume produced in the year (3) 2,087 2,082 0.2
IPM - Measured water loss (%) 30.0 31.1 (3.5)
IPDt (liters/connection x day) 292 306 (4.6)
Page 8 of 12
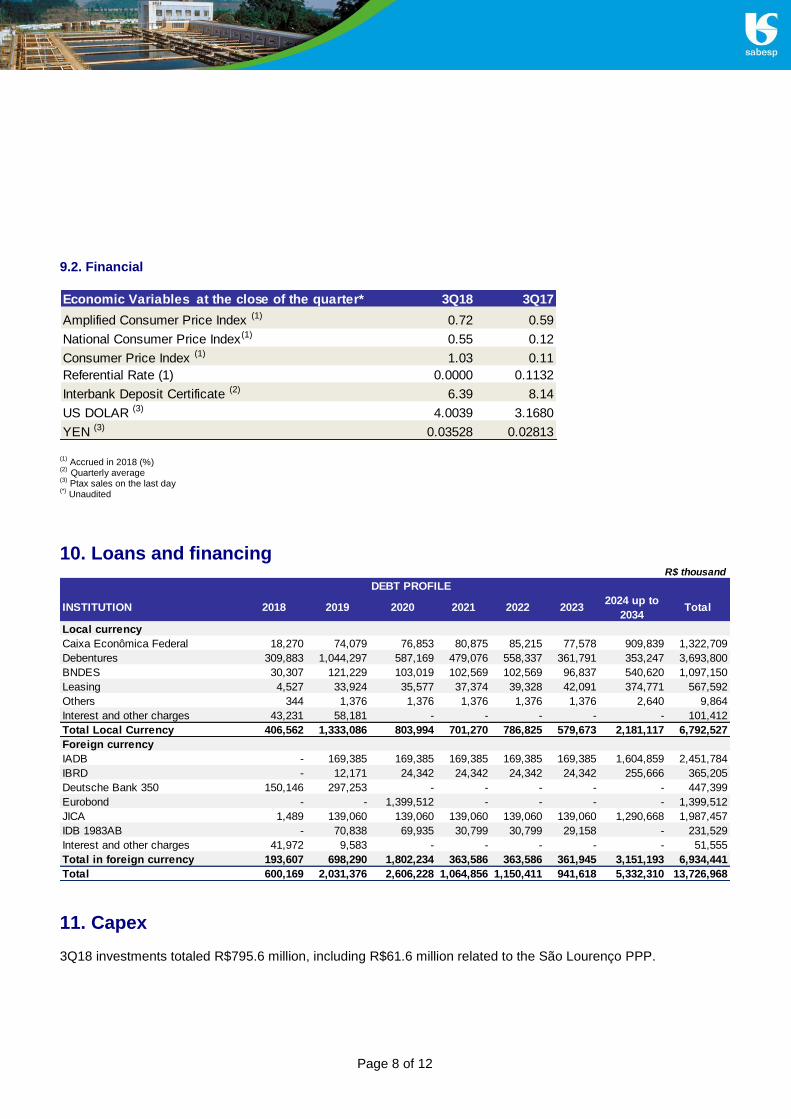
9.2. Financial
(1)
Accrued in 2018 (%) (2)
Quarterly average (3)
Ptax sales on the last day (*)
Unaudited
10. Loans and financing
11. Capex 3Q18 investments totaled R$795.6 million, including R$61.6 million related to the São Lourenço PPP.
Economic Variables at the close of the quarter* 3Q18 3Q17
Amplified Consumer Price Index (1) 0.72 0.59
National Consumer Price Index(1) 0.55 0.12
Consumer Price Index (1) 1.03 0.11
Referential Rate (1) 0.0000 0.1132
Interbank Deposit Certificate (2) 6.39 8.14
US DOLAR (3) 4.0039 3.1680
YEN (3) 0.03528 0.02813
R$ thousand
DEBT PROFILE
INSTITUTION 2018 2019 2020 2021 2022 20232024 up to
2034Total
Local currency
Caixa Econômica Federal 18,270 74,079 76,853 80,875 85,215 77,578 909,839 1,322,709
Debentures 309,883 1,044,297 587,169 479,076 558,337 361,791 353,247 3,693,800
BNDES 30,307 121,229 103,019 102,569 102,569 96,837 540,620 1,097,150
Leasing 4,527 33,924 35,577 37,374 39,328 42,091 374,771 567,592
Others 344 1,376 1,376 1,376 1,376 1,376 2,640 9,864
Interest and other charges 43,231 58,181 - - - - - 101,412
Total Local Currency 406,562 1,333,086 803,994 701,270 786,825 579,673 2,181,117 6,792,527
Foreign currency
IADB - 169,385 169,385 169,385 169,385 169,385 1,604,859 2,451,784
IBRD - 12,171 24,342 24,342 24,342 24,342 255,666 365,205
Deutsche Bank 350 150,146 297,253 - - - - - 447,399
Eurobond - - 1,399,512 - - - - 1,399,512
JICA 1,489 139,060 139,060 139,060 139,060 139,060 1,290,668 1,987,457
IDB 1983AB - 70,838 69,935 30,799 30,799 29,158 - 231,529
Interest and other charges 41,972 9,583 - - - - - 51,555
Total in foreign currency 193,607 698,290 1,802,234 363,586 363,586 361,945 3,151,193 6,934,441
Total 600,169 2,031,376 2,606,228 1,064,856 1,150,411 941,618 5,332,310 13,726,968
Page 9 of 12
12. Conference calls
In English November 9, 2018 - Friday
11:00 pm US EST / 02:00 pm (Brasília) Dial in: + 1 (412) 317-5486
Conference ID: Sabesp
Replay available for 7 days Dial in: +1 (412) 317-0088
Replay ID: 10123641
Click here for the webcast
In Portuguese November 9, 2018 - Friday
7:30 am US EST / 10:30 am (Brasília) Dial in: +55 (11) 3193-1001
Conference ID: Sabesp
Replay available for 7 days Dial in: +55 (11) 3193-1012
Replay ID: 5189882
Click here for the webcast For more information, please contact: Mario Arruda Sampaio Head of Capital Markets and Investor Relations Phone.(55 11) 3388-8664 E-mail: [email protected] Angela Beatriz Airoldi Investor Relations Manager Phone.(55 11) 3388-8793 E-mail: [email protected]
Statements contained in this press release may contain information that is forward-looking and reflects management's current view and estimates of future economic circumstances, industry conditions, SABESP performance, and financial results. Any statements, expectations, capabilities, plans and assumptions contained in this press release that do not describe historical facts, such as statements regarding the declaration or payment of dividends, the direction of future operations, the implementation of principal operating and financing strategies and capital expenditure plans, the factors or trends affecting financial condition, liquidity or results of operations are forward-looking statements within the meaning of the U.S. Private Securities Litigation Reform Act of 1995 and involve a number of risks and uncertainties. There is no guarantee that these results will actually occur. The statements are based on many assumptions and factors, including general economic and market conditions, industry conditions, and operating factors. Any changes in such assumptions or factors could cause actual results to differ materially from current expectations.
Page 10 of 12
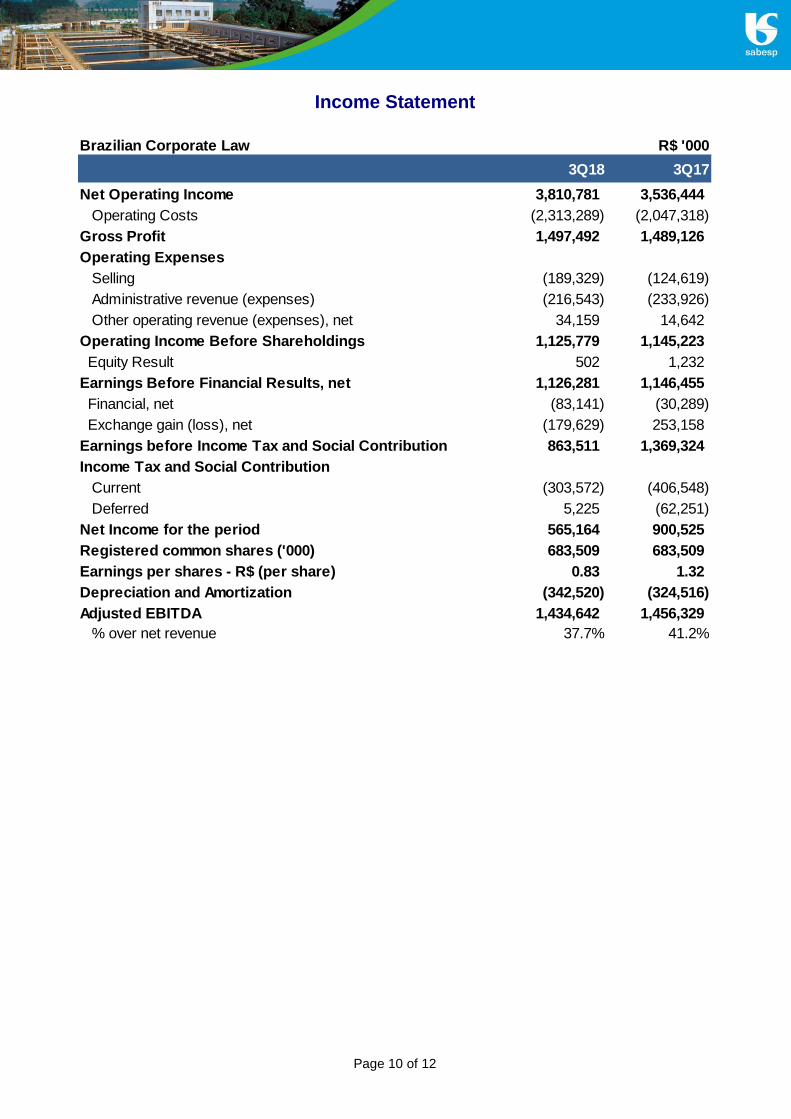
Income Statement
Brazilian Corporate Law R$ '000
3Q18 3Q17
Net Operating Income 3,810,781 3,536,444
Operating Costs (2,313,289) (2,047,318)
Gross Profit 1,497,492 1,489,126
Operating Expenses
Selling (189,329) (124,619)
Administrative revenue (expenses) (216,543) (233,926)
Other operating revenue (expenses), net 34,159 14,642
Operating Income Before Shareholdings 1,125,779 1,145,223
Equity Result 502 1,232
Earnings Before Financial Results, net 1,126,281 1,146,455
Financial, net (83,141) (30,289)
Exchange gain (loss), net (179,629) 253,158
Earnings before Income Tax and Social Contribution 863,511 1,369,324
Income Tax and Social Contribution
Current (303,572) (406,548)
Deferred 5,225 (62,251)
Net Income for the period 565,164 900,525
Registered common shares ('000) 683,509 683,509
Earnings per shares - R$ (per share) 0.83 1.32
Depreciation and Amortization (342,520) (324,516)
Adjusted EBITDA 1,434,642 1,456,329
% over net revenue 37.7% 41.2%
Page 11 of 12
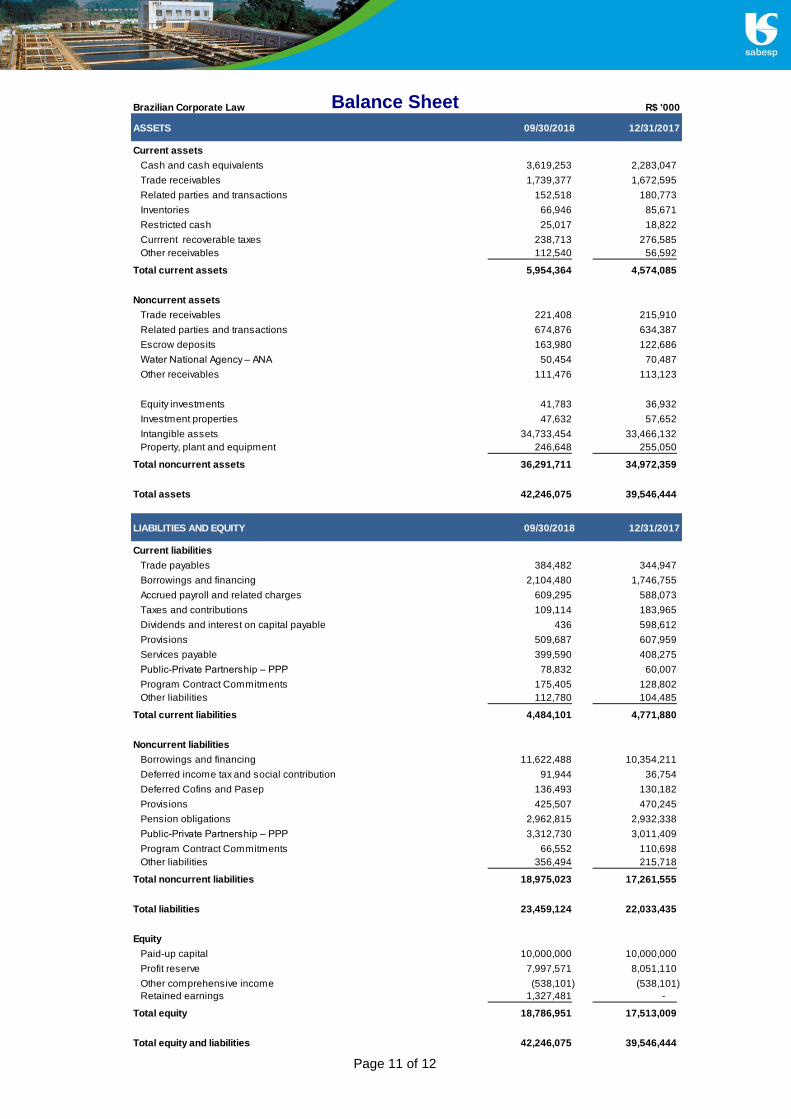
Balance Sheet
Brazilian Corporate Law R$ '000
ASSETS 09/30/2018 12/31/2017
Current assets
Cash and cash equivalents 3,619,253 2,283,047
Trade receivables 1,739,377 1,672,595
Related parties and transactions 152,518 180,773
Inventories 66,946 85,671
Restricted cash 25,017 18,822
Currrent recoverable taxes 238,713 276,585
Other receivables 112,540 56,592
Total current assets 5,954,364 4,574,085
Noncurrent assets
Trade receivables 221,408 215,910
Related parties and transactions 674,876 634,387
Escrow deposits 163,980 122,686
Water National Agency – ANA 50,454 70,487
Other receivables 111,476 113,123
Equity investments 41,783 36,932
Investment properties 47,632 57,652
Intangible assets 34,733,454 33,466,132
Property, plant and equipment 246,648 255,050
Total noncurrent assets 36,291,711 34,972,359
Total assets 42,246,075 39,546,444
LIABILITIES AND EQUITY 09/30/2018 12/31/2017
Current liabilities
Trade payables 384,482 344,947
Borrowings and financing 2,104,480 1,746,755
Accrued payroll and related charges 609,295 588,073
Taxes and contributions 109,114 183,965
Dividends and interest on capital payable 436 598,612
Provisions 509,687 607,959
Services payable 399,590 408,275
Public-Private Partnership – PPP 78,832 60,007
Program Contract Commitments 175,405 128,802
Other liabilities 112,780 104,485
Total current liabilities 4,484,101 4,771,880
Noncurrent liabilities
Borrowings and financing 11,622,488 10,354,211
Deferred income tax and social contribution 91,944 36,754
Deferred Cofins and Pasep 136,493 130,182
Provisions 425,507 470,245
Pension obligations 2,962,815 2,932,338
Public-Private Partnership – PPP 3,312,730 3,011,409
Program Contract Commitments 66,552 110,698
Other liabilities 356,494 215,718
Total noncurrent liabilities 18,975,023 17,261,555
Total liabilities 23,459,124 22,033,435
Equity
Paid-up capital 10,000,000 10,000,000
Profit reserve 7,997,571 8,051,110
Other comprehensive income (538,101) (538,101)
Retained earnings 1,327,481 -
Total equity 18,786,951 17,513,009
Total equity and liabilities 42,246,075 39,546,444
Page 12 of 12
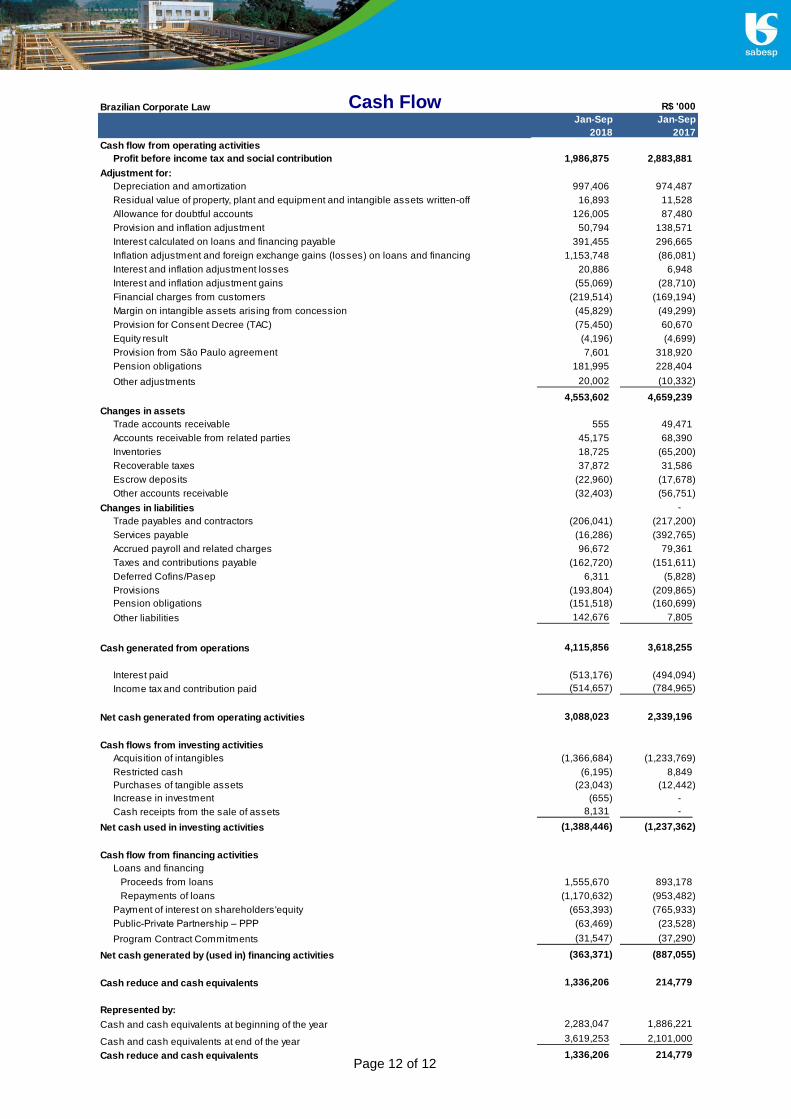
Cash Flow
Brazilian Corporate Law R$ '000
Jan-Sep
2018
Jan-Sep
2017
Cash flow from operating activities
Profit before income tax and social contribution 1,986,875 2,883,881
Adjustment for:
Depreciation and amortization 997,406 974,487
Residual value of property, plant and equipment and intangible assets written-off 16,893 11,528
Allowance for doubtful accounts 126,005 87,480
Provision and inflation adjustment 50,794 138,571
Interest calculated on loans and financing payable 391,455 296,665
Inflation adjustment and foreign exchange gains (losses) on loans and financing 1,153,748 (86,081)
Interest and inflation adjustment losses 20,886 6,948
Interest and inflation adjustment gains (55,069) (28,710)
Financial charges from customers (219,514) (169,194)
Margin on intangible assets arising from concession (45,829) (49,299)
Provision for Consent Decree (TAC) (75,450) 60,670
Equity result (4,196) (4,699)
Provision from São Paulo agreement 7,601 318,920
Pension obligations 181,995 228,404
Other adjustments 20,002 (10,332)
4,553,602 4,659,239
Changes in assets
Trade accounts receivable 555 49,471
Accounts receivable from related parties 45,175 68,390
Inventories 18,725 (65,200)
Recoverable taxes 37,872 31,586
Escrow deposits (22,960) (17,678)
Other accounts receivable (32,403) (56,751)
Changes in liabilities -
Trade payables and contractors (206,041) (217,200)
Services payable (16,286) (392,765)
Accrued payroll and related charges 96,672 79,361
Taxes and contributions payable (162,720) (151,611)
Deferred Cofins/Pasep 6,311 (5,828)
Provisions (193,804) (209,865)
Pension obligations (151,518) (160,699)
Other liabilities 142,676 7,805
Cash generated from operations 4,115,856 3,618,255
Interest paid (513,176) (494,094)
Income tax and contribution paid (514,657) (784,965)
Net cash generated from operating activities 3,088,023 2,339,196
Cash flows from investing activities
Acquisition of intangibles (1,366,684) (1,233,769)
Restricted cash (6,195) 8,849
Purchases of tangible assets (23,043) (12,442)
Increase in investment (655) -
Cash receipts from the sale of assets 8,131 -
Net cash used in investing activities (1,388,446) (1,237,362)
Cash flow from financing activities
Loans and financing
Proceeds from loans 1,555,670 893,178
Repayments of loans (1,170,632) (953,482)
Payment of interest on shareholders'equity (653,393) (765,933)
Public-Private Partnership – PPP (63,469) (23,528)
Program Contract Commitments (31,547) (37,290)
Net cash generated by (used in) financing activities (363,371) (887,055)
Cash reduce and cash equivalents 1,336,206 214,779
Represented by:
Cash and cash equivalents at beginning of the year 2,283,047 1,886,221
Cash and cash equivalents at end of the year 3,619,253 2,101,000
Cash reduce and cash equivalents 1,336,206 214,779