Embed Size (px)
Citation preview
SABMiller plc
F’11 first half resultsSix months ended September 30, 2010
November 18, 2010
Malcolm Wyman, Chief Financial Officer
Gary Leibowitz, Senior Vice President, Investor Relations

F11 H1 results© SABMiller plc 2010 2
Forward looking statements
This presentation includes ‘forward-looking statements’ with respect to certain of SABMiller plc’s plans, current goals and expectations relating to its future financial condition, performance and results. These statements contain the words “anticipate”, “believe”, “intend”, “estimate”, “expect” and words of similar meaning. All statements other than statements of historical facts included in this presentation, including, without limitation, those regarding the Company’s financial position, business strategy, plans and objectives of management for future operations (including development plans and objectives relating to the Company’s products and services) are forward-looking statements. Such forward-looking statements involve known and unknown risks, uncertainties and other important factors that could cause the actual results, performance or achievements of the Company to be materially different from future results, performance or achievements expressed or implied by such forward-looking statements. Such forward-looking statements are based on numerous assumptions regarding the Company’s present and future business strategies and the environment in which the Company will operate in the future. These forward-looking statements speak only as at the date of this document. The Company expressly disclaims any obligation or undertaking to disseminate any updates or revisions to any forward-looking statements contained herein to reflect any change in the Company’s expectations with regard thereto or any change in events, conditions or circumstances on which any such statement is based. The past business and financial performance of SABMiller plc is not to be relied on as an indication of its future performance.
All references to “EBITA” in this presentation refer to earnings before interest, tax, amortization of intangible assets and exceptional items. All references to “organic” mean as adjusted to exclude the impact of acquisitions, while all references to “constant currency” mean as adjusted to exclude the impact of movements in foreign currency exchange rates in the translation of our results. References to “underlying” mean in organic, constant currency.

F11 H1 results© SABMiller plc 2010 3
Overview
Strong SABMiller financial performance
� Improving volume trends in some markets
� Favourable input costs in H1
� Cost reductions across the group, enabling:– Margin growth in LatAm and US– Offset of volume de-leverage in Europe– Increased market investment, particularly in SA and Africa
� Group EBITA margins up by 90 bps
10% organic, constant currency EBITA growthAdjusted eps growth of 16%; free cash flow up 23% to $1.2 billion
F11 H1 results© SABMiller plc 2010 4
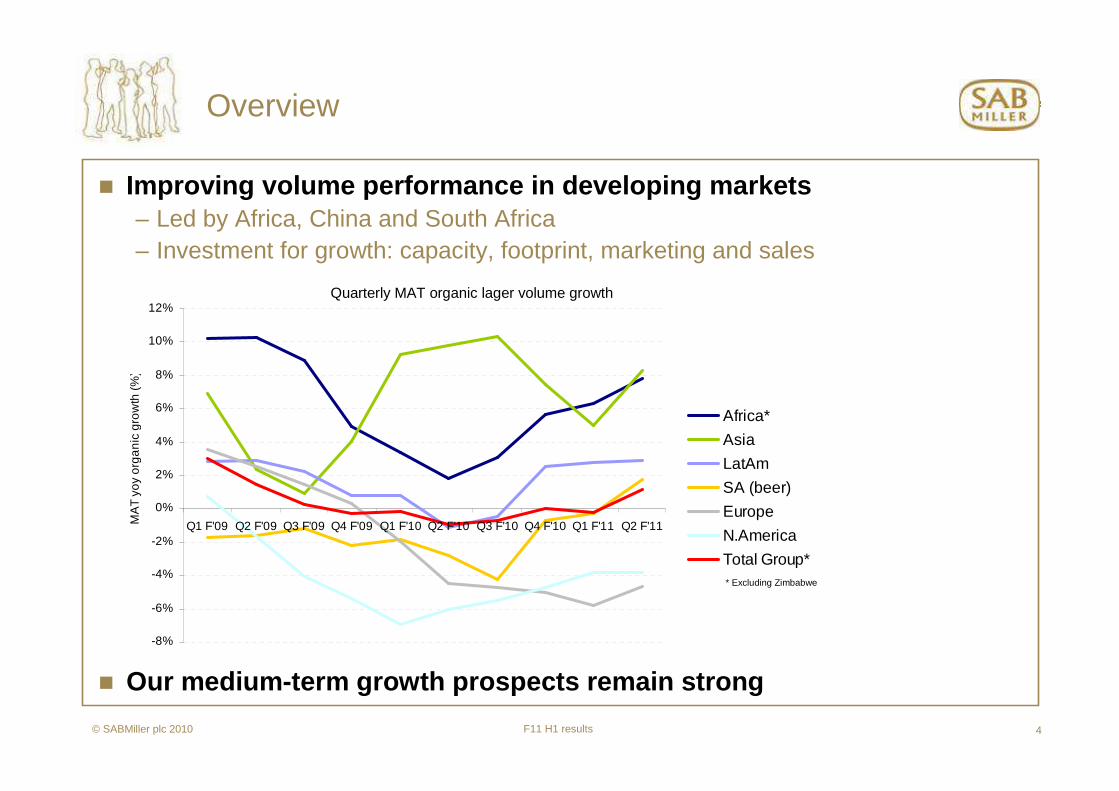
� Improving volume performance in developing markets– Led by Africa, China and South Africa– Investment for growth: capacity, footprint, marketing and sales
� Our medium-term growth prospects remain strong
-8%
-6%
-4%
-2%
0%
2%
4%
6%
8%
10%
12%
Q1 F'09 Q2 F'09 Q3 F'09 Q4 F'09 Q1 F'10 Q2 F'10 Q3 F'10 Q4 F'10 Q1 F'11 Q2 F'11MA
T yo
y or
ga
nic
gro
wth
(%
)
Africa*
Asia
LatAm
SA (beer)
Europe
N.America
Total Group*
Overview
* Excluding Zimbabwe
Quarterly MAT organic lager volume growth

F11 H1 results© SABMiller plc 2010 5
Divisional highlights: Latin America
� Lager volumes marginally down– Impact of increased Colombian beer taxes– Category development and growth in Peru
& Ecuador
� Central America - gaining share of alcohol and non alcoholic drinks– Despite challenging environment
� Improved profitability across the region – Particularly in Colombia and Peru– Despite consumer headwinds
-
200
400
600
800
1,000
1,200
1,400
1,600
F08 F09 F10 H1 F11 MAT
(US$'m)
20%
21%
22%
23%
24%
25%
26%
EBITA EBITA margin
EBITA growth of 10%* and margin +210bps despite lower volumes
F11 H1 results© SABMiller plc 2010 6
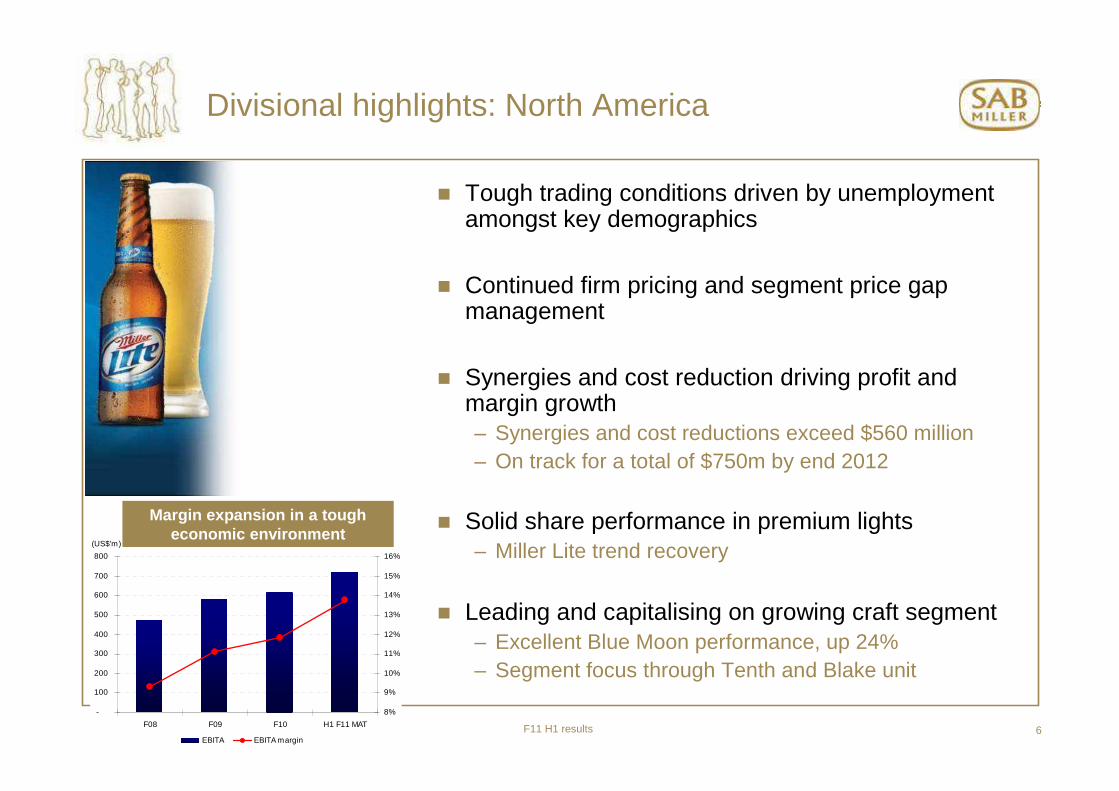
� Tough trading conditions driven by unemployment amongst key demographics
� Continued firm pricing and segment price gap management
� Synergies and cost reduction driving profit and margin growth– Synergies and cost reductions exceed $560 million– On track for a total of $750m by end 2012
� Solid share performance in premium lights– Miller Lite trend recovery
� Leading and capitalising on growing craft segment– Excellent Blue Moon performance, up 24%– Segment focus through Tenth and Blake unit
Divisional highlights: North America
-
100
200
300
400
500
600
700
800
F08 F09 F10 H1 F11 MAT
(US$'m)
8%
9%
10%
11%
12%
13%
14%
15%
16%
EBITA EBITA margin
Margin expansion in a tough economic environment
F11 H1 results© SABMiller plc 2010 7
Divisional highlights: Europe
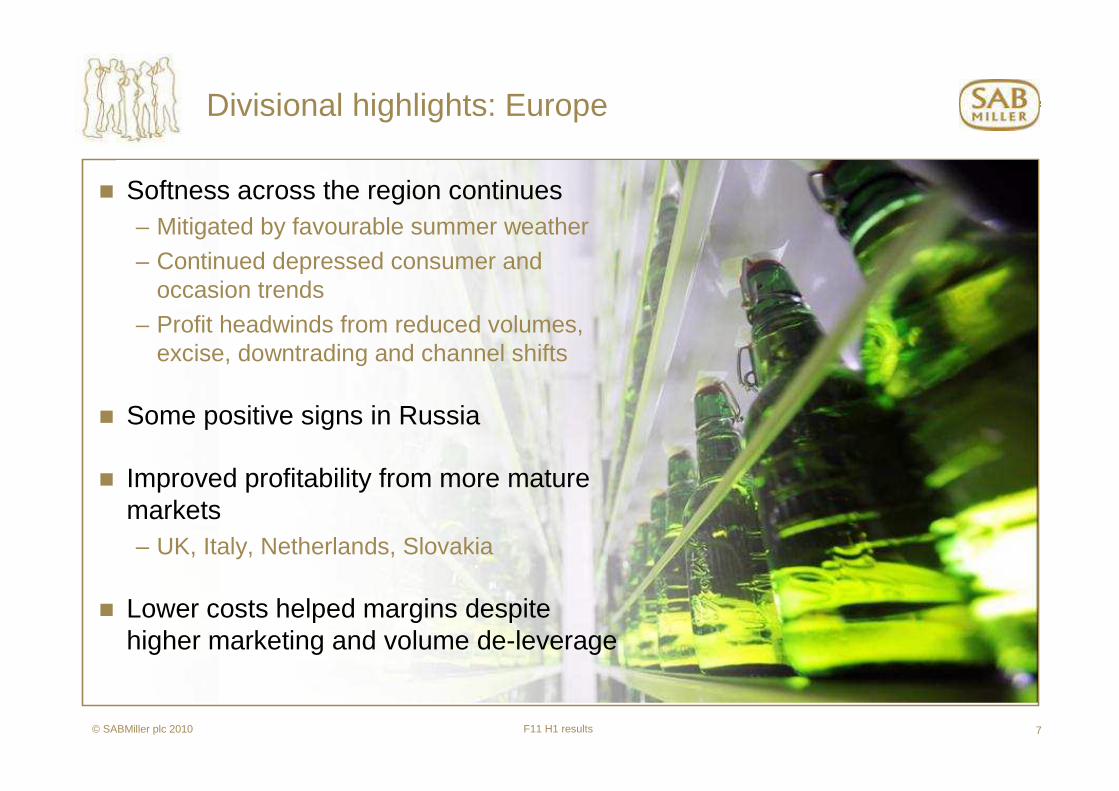
� Softness across the region continues– Mitigated by favourable summer weather
– Continued depressed consumer and occasion trends
– Profit headwinds from reduced volumes, excise, downtrading and channel shifts
� Some positive signs in Russia
� Improved profitability from more mature markets– UK, Italy, Netherlands, Slovakia
� Lower costs helped margins despite higher marketing and volume de-leverage
F11 H1 results© SABMiller plc 2010 8
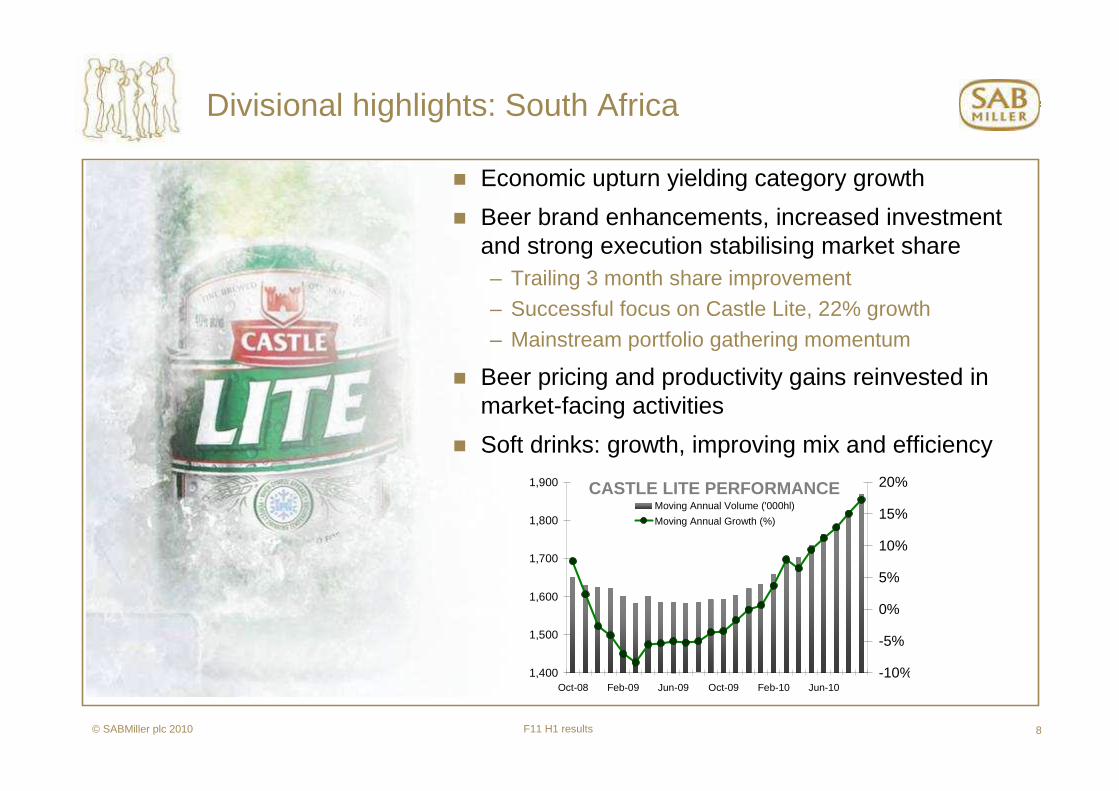
Divisional highlights: South Africa
� Economic upturn yielding category growth
� Beer brand enhancements, increased investment and strong execution stabilising market share– Trailing 3 month share improvement– Successful focus on Castle Lite, 22% growth
– Mainstream portfolio gathering momentum
� Beer pricing and productivity gains reinvested in market-facing activities
� Soft drinks: growth, improving mix and efficiency
CASTLE LITE PERFORMANCE
1,400
1,500
1,600
1,700
1,800
1,900
Oct-08 Feb-09 Jun-09 Oct-09 Feb-10 Jun-10-10%
-5%
0%
5%
10%
15%
20%
Moving Annual Volume ('000hl)
Moving Annual Growth (%)
F11 H1 results© SABMiller plc 2010 9
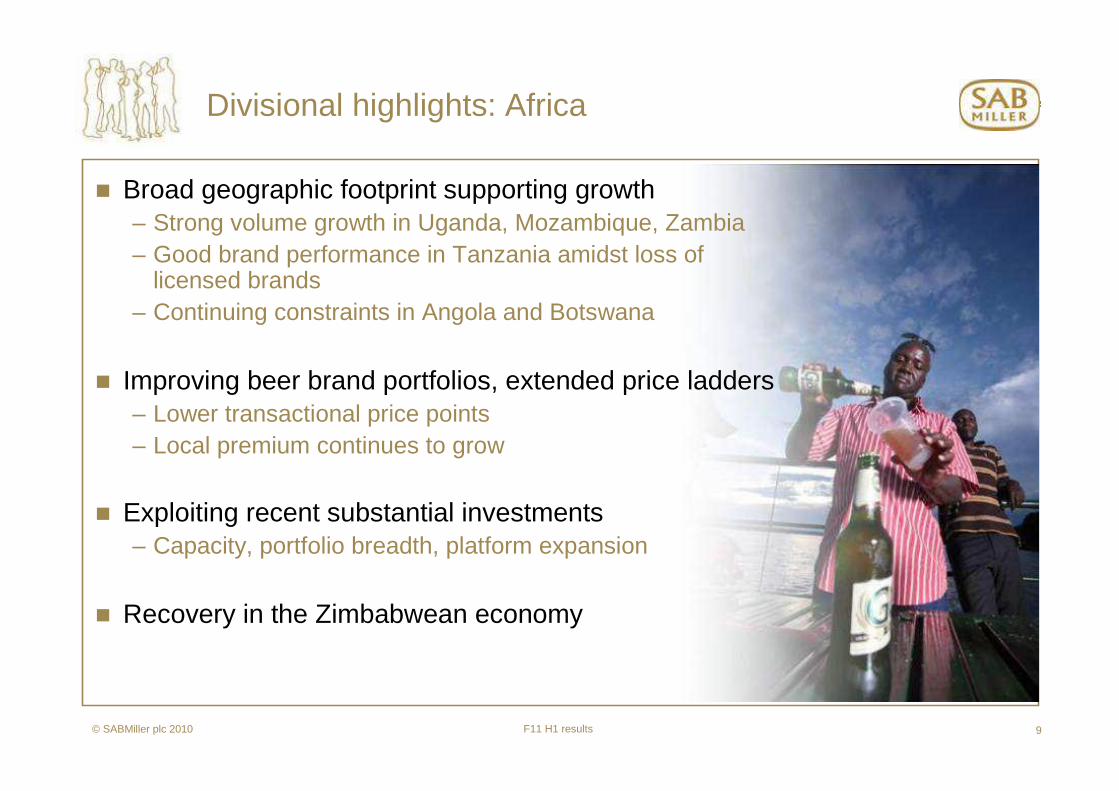
� Broad geographic footprint supporting growth– Strong volume growth in Uganda, Mozambique, Zambia– Good brand performance in Tanzania amidst loss of
licensed brands– Continuing constraints in Angola and Botswana
� Improving beer brand portfolios, extended price ladders– Lower transactional price points– Local premium continues to grow
� Exploiting recent substantial investments– Capacity, portfolio breadth, platform expansion
� Recovery in the Zimbabwean economy
Divisional highlights: Africa

F11 H1 results© SABMiller plc 2010 10
Divisional highlights: Asia
China� Organic volumes up 9%; share growth
– Led again by Central region and Northeast
� Marketing emphasis on premium Snow variants, growing premium segment share– Focused outdoor activity promotions for ‘Brave
the World’ variant
� Pricing stagnant, rising marketing spend
� Leading Chinese industry consolidation
India� Increasingly profitable growth in most states
– Led by Haywards 5000 activation
� Regulatory constraints persist in certain areas, impacting growth
F11 H1 results© SABMiller plc 2010 11
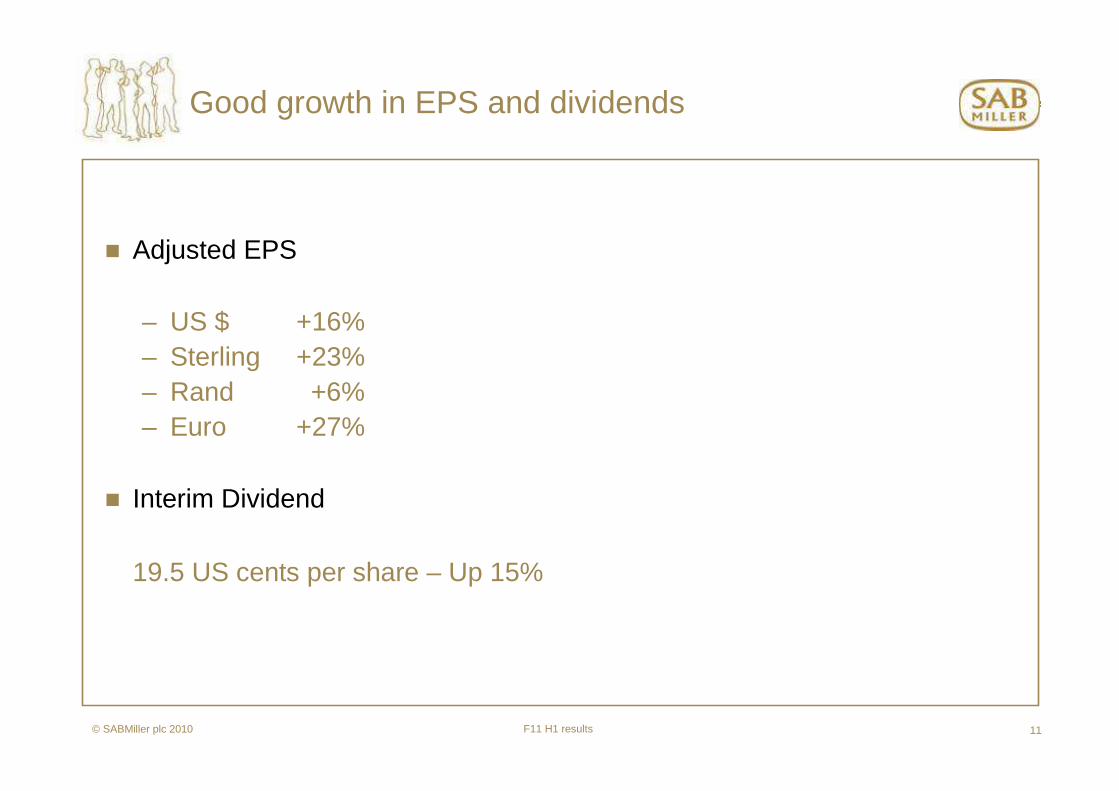
Good growth in EPS and dividends
� Adjusted EPS
– US $ +16%– Sterling +23%– Rand +6%– Euro +27%
� Interim Dividend
19.5 US cents per share – Up 15%

F11 H1 results© SABMiller plc 2010 12
Strong overall financial performance despite mixed trading conditions
� Total volumes of 143.4 mhl * +2.7%- Organic * +2.0%
� Lager organic volumes * +1.5%
� Organic group revenue * +6.3%- Constant currency * +4.5%
� Organic EBITA * +12.6%- Constant currency * +10.2%
� EBITA margin * +90 bps- Constant currency * +90bps
� Adjusted EPS growth in US$ +16%
* including share of associates and joint ventures

F11 H1 results© SABMiller plc 2010 13
14,236
13,355
6.3%2.5%
2.0%
1.8% 0.3%
Sep '09 Volume Price/mix Currency Sep '10Organic
Acquisitions Sep '10
Revenue benefits from firm pricing and volume growth
Group Revenue (including associates and joint ventu res) components of performance, US$m

F11 H1 results© SABMiller plc 2010 14
2,187
12.6% 2,46610.2% 2.4% 0.2%
Sep '09 Underlying Currency Sep '10Organic
Acquisitions Sep '10
Strong EBITA growth
EBITA (including associates and joint ventures) com ponents of performance, US$m

F11 H1 results© SABMiller plc 2010 15
Input costs reduce over the first half
� Half year constant currency decrease per hl
– Total raw materials - Down mid-single digits– Total COGS - Down low-single digits
� Lower barley and hop prices drive down brewing raw material costs
� Stronger local currencies benefit input costs
� Higher distribution costs partially offset lower raw material costs

F11 H1 results© SABMiller plc 2010 16
Exceptional items
(285)Total exceptional items
(155)- included in operating profit
Broad-Based Black Economic Empowerment scheme South Africa:
(126)- included in operating profit (IFRS2 non-cash)
(4)
Sep 10
- share of associates’ and joint ventures’
Restructuring costs:
Business capability programme costs:
US$m

F11 H1 results© SABMiller plc 2010 17
� Important benefit drivers achieve significant miles tones in first half– Trinity Procurement now leads brewing materials buying – European manufacturing organisation commences
� Process and systems changes advancing– Sales and distribution in Latin America; support systems in South Africa and corporate
� Operating costs and benefits– Design and implementation, extended timeline and enhanced scope – increase of
approx. US$160m (excluding potential adverse FX of US$40m)
– Exceptional charges in F11 15% below F10; fall year on year c.40% in F12 and again in F13; F14 similar level to F13
– Expected cost and efficiency benefits broadly in line with targets:
US$30 - 40m in F11; US$100m in F12; US$200m in F13; US$300m in F14
� Cash flow and capital expenditure– Additional capital expenditure of approx. US$100m
– Working capital improvements of US$350m delivered ahead of target
Business capability programme

F11 H1 results© SABMiller plc 2010 18
Cash flow, finance costs and taxation
� Normalised EBITDA* up 12% to US$2,577m from US$2,292m
� Normalised EBITDA* margin is 130 basis points higher than prior year
� Working capital inflow US$90m
� Capex** down US$125m to US$614m
� Free cash flow*** improved by US$234m to US$1,244m
� Adjusted finance costs up $29m to $282m
� Effective tax rate 29.0%
* EBITDA including dividends of US$515 million from MillerCoors joint venture (2009: US$427 million) The revenue included in the calculation of the normalised EBITDA margin is the revenue of our subsidiaries, including our share of the MillerCoors’ revenue.
** Includes purchases of property, plant and equipment, and intangible assets. MillerCoors capex not included*** Net cash generated from operating activities, less cash paid for the purchase of PP&E and intangible assets, net investments in existing associates and joint ventures and dividends paid to non-controlling interests, plus
cash received from the sale of PP&E and intangible assets and dividends received.

F11 H1 results© SABMiller plc 2010 19
Net debt
5.76.1Weighted average interest rate for gross debt portfolio (%)
8.79.1Normalised EBITDA Interest cover *(times)
40.836.8Gearing (%)
7,8097,235Non-current borrowings
8,3987,938Net debt
(237)(495)Borrowings-related derivative financial instruments
(779)(478)Cash and cash equivalents
1,6051,676Current borrowings
Mar 10Sep 10US$m
* This is the ratio of normalised EBITDA (including the MillerCoors dividends) to adjusted net finance costs
F11 H1 results© SABMiller plc 2010 20
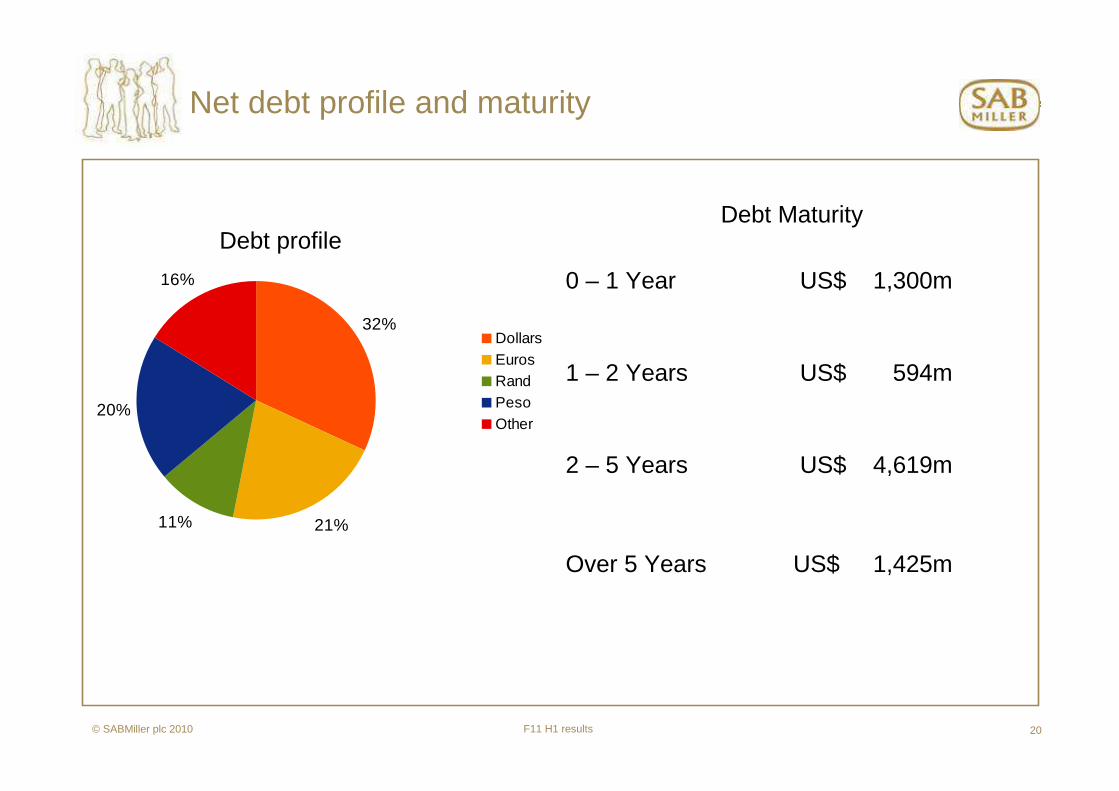
Net debt profile and maturity
Debt profileDebt Maturity
0 – 1 Year US$ 1,300m
1 – 2 Years US$ 594m
2 – 5 Years US$ 4,619m
Over 5 Years US$ 1,425m
32%
21%11%
20%
16%
DollarsEurosRandPesoOther

F11 H1 results© SABMiller plc 2010 21
Financial outlook – current financial year
� Improvement in economic conditions in emerging markets– Mixed consumer spending patterns
� Raw material input cost benefits expected to reduce in the second half– Impacted by rising barley prices– Total raw materials per hl*– Total COGS per hl*
� Ongoing focus on cash generation– Full year working capital inflows expected to moderate given significant prior
year improvements– Full year capex will approximate US$1,300m
� H2 finance costs expect to decrease marginally from H1
� Expected full year tax rate of 29.0%
*Stated in constant currency
Down low-single digits

F11 H1 results© SABMiller plc 2010 22
Conclusion
� Our medium term outlook for growth in volume, value and profitability remains strong
� Consumer market recovery is uneven, with incremental improvement in economic conditions across most of our emerging markets
� Continuing selective price increases, lower input costs, increased brand investment
� Our commercial strategies are unwavering, developing the beer category and strengthening our positions
� Our global beer footprint is a unique advantage

Supplementary information

F11 H1 results© SABMiller plc 2010 24
Reported EBITA contribution
September 2010 September 2009
26%
2%15%
11%
25%
17%
4%
Latin America
Europe
North America
Africa
Asia
South AfricaBeveragesHotels & GamingSouth Africa
4%
2%
16%
22%
27%
10%
19%
* Before corporate costs
EBITA contribution*
F11 H1 results© SABMiller plc 2010 25
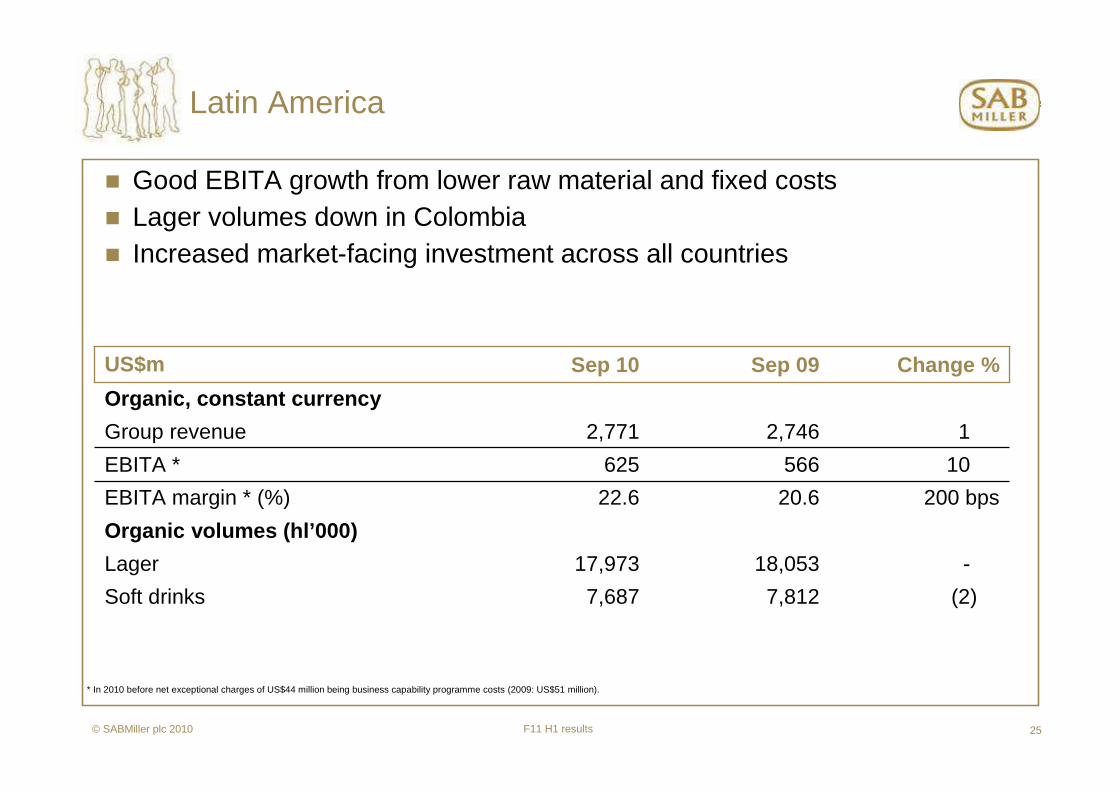
Latin America
� Good EBITA growth from lower raw material and fixed costs� Lager volumes down in Colombia� Increased market-facing investment across all countries
* In 2010 before net exceptional charges of US$44 million being business capability programme costs (2009: US$51 million).
200 bps20.622.6EBITA margin * (%)
-18,05317,973Lager
(2)7,8127,687Soft drinks
Organic volumes (hl’000)
10566625EBITA *
12,7462,771Group revenue
Organic, constant currency
Change %Sep 09Sep 10US$m
F11 H1 results© SABMiller plc 2010 26
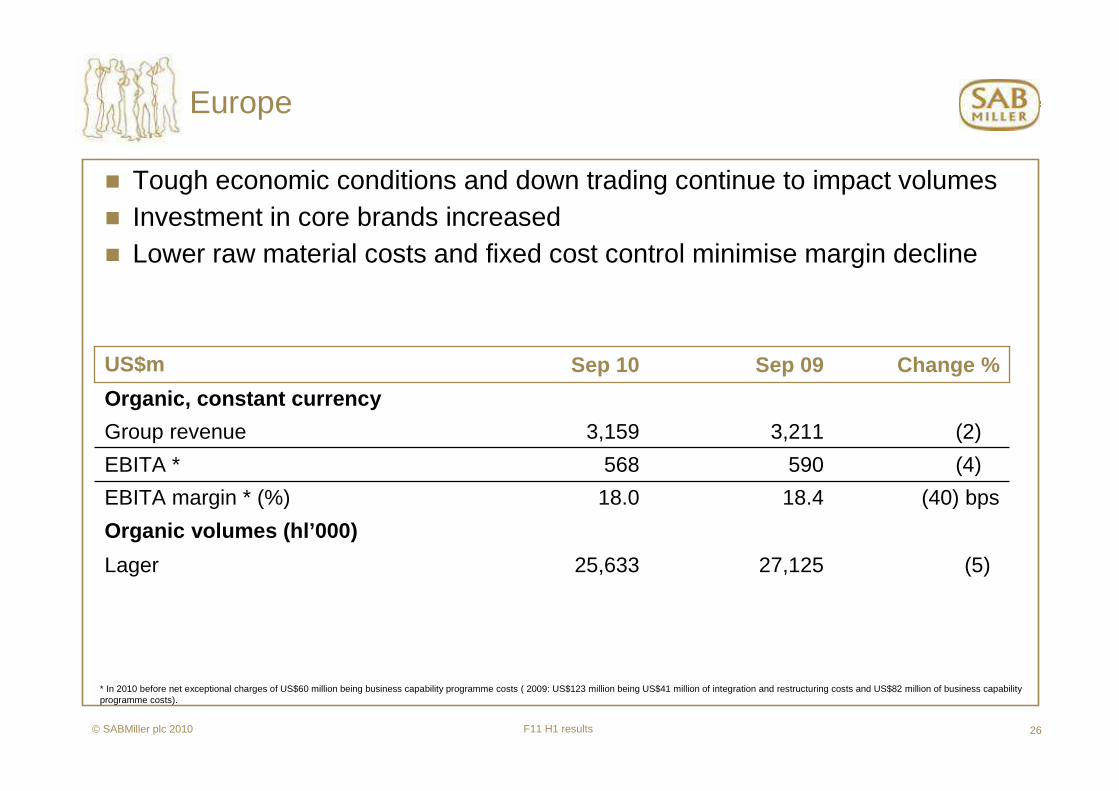
Europe
� Tough economic conditions and down trading continue to impact volumes� Investment in core brands increased� Lower raw material costs and fixed cost control minimise margin decline
* In 2010 before net exceptional charges of US$60 million being business capability programme costs ( 2009: US$123 million being US$41 million of integration and restructuring costs and US$82 million of business capability programme costs).
(40) bps18.418.0EBITA margin * (%)
(5)27,12525,633Lager
Organic volumes (hl’000)
(4)590568EBITA *
(2)3,2113,159Group revenue
Organic, constant currency
Change %Sep 09Sep 10US$m
F11 H1 results© SABMiller plc 2010 27
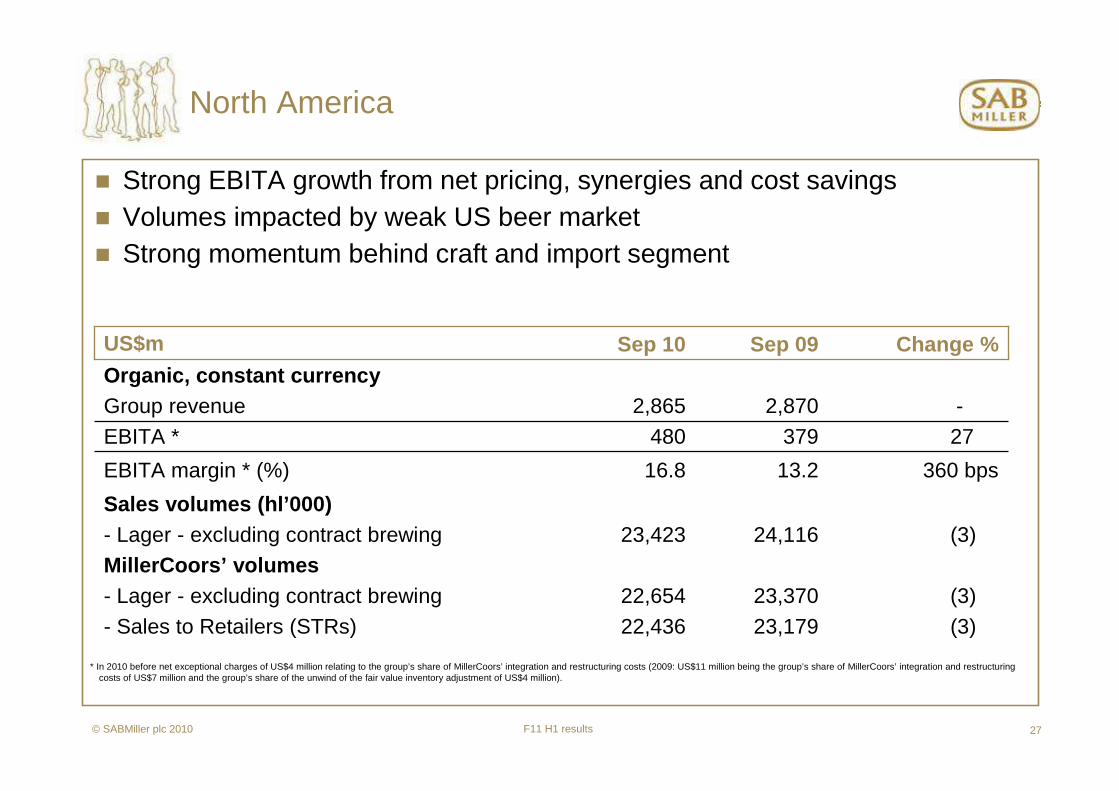
North America
� Strong EBITA growth from net pricing, synergies and cost savings� Volumes impacted by weak US beer market� Strong momentum behind craft and import segment
(3)23,37022,654- Lager - excluding contract brewingMillerCoors’ volumes
360 bps13.216.8EBITA margin * (%)
(3)24,11623,423- Lager - excluding contract brewing
(3)23,17922,436- Sales to Retailers (STRs)
Sales volumes (hl’000)
27379480EBITA *-2,8702,865Group revenue
Organic, constant currencyChange %Sep 09Sep 10US$m
* In 2010 before net exceptional charges of US$4 million relating to the group’s share of MillerCoors’ integration and restructuring costs (2009: US$11 million being the group’s share of MillerCoors’ integration and restructuring costs of US$7 million and the group’s share of the unwind of the fair value inventory adjustment of US$4 million).

F11 H1 results© SABMiller plc 2010 28
Africa
341,9782,646Other alcoholic beverages
(200) bps19.517.5EBITA margin * (%)
116,3927,124Lager
55,0375,292Soft drinks
Organic volumes (hl’000)
11246273EBITA *
231,2631,558Group revenue
Organic, constant currency
Change %Sep 09Sep 10US$m
� Results include our share of our associate in Zimbabwe� Multi-beverage portfolio delivers strong underlying volume growth� Increased marketing and capacity-related costs impact margins
* In 2010 before net exceptional charges of US$2 million being business capability programme costs (2009: US$4 million)

F11 H1 results© SABMiller plc 2010 29
Asia
� Good second quarter volume growth in China � India volumes grow, cycling a weak comparative period� EBITA growth and margin improvement
60 bps8.89.4EBITA margin* (%)
1029,22932,207LagerOrganic volumes (hl’000)
2290109EBITA* 141,0211,168Group revenue
Organic, constant currencyChange %Sep 09Sep 10US$m
* In 2010 before net exceptional charges of US$nil (2009: before exceptional charges of US$1 million being business capability programme costs).

F11 H1 results© SABMiller plc 2010 30
South Africa Beverages
� Volumes benefit from increased marketing investments� Firm pricing and volume growth deliver EBITA growth� Increased marketing costs impacts EBITA margin
* In 2010 before net exceptional charges of US$149 million, being business capability programme costs of US$23 million and costs incurred in relation to the Broad-Based Black Economic Empowerment scheme of US$126 million (2009: US$21 million being business capability programme costs).
(10) bps16.316.2EBITA margin * (%)
311,97312,274Lager37,2487,467Soft drinks7594634Other alcoholic beverages
Organic volumes (hl’000)
8333360EBITA *82,0512,224Group revenue
Organic, constant currencyChange %Sep 09Sep 10US$m

F11 H1 results© SABMiller plc 2010 31
Financial results
272,5853,288Other alcoholic beverages
3139,648143,404Total
90 bps16.417.3EBITA margin (%)
2116,887118,988Lager
520,17621,128Soft drinks
Sales volumes (hl’000)
132,1872,466EBITA
713,35514,236Group revenue
Reported currency
Change %Sep 09Sep 10US$m

F11 H1 results© SABMiller plc 2010 32
EBITA margin performance
20.6%
18.4%19.5%
8.8%
16.3% 16.4%
22.6%
18.0%16.8% 17.5%
9.4%
16.2%17.3%
13.2%
Latin America Europe NorthAmerica
Africa Asia SABeverages
Group
Sep 09 Sep 10
Organic, constant currency basis

F11 H1 results© SABMiller plc 2010 33
Reported EBITA margin performance
20.6%
18.4%19.5%
8.8%
16.3% 16.4%
22.7%
18.0%16.8% 17.2%
9.2%
16.2%17.3%
13.2%
Latin America Europe NorthAmerica
Africa Asia SABeverages
Group
Sep 09 Sep 10

F11 H1 results© SABMiller plc 2010 34
Reported volumes*
* excluding intra-group volumes** equity accounted share of volumes
(11) 3,102Romania
(2)3,155Russia
(3)2,158Italy
1029,814China **
(9)3,883Czech
-1,299Tanzania
(6)8,115Poland
42,500Ecuador
312,262South Africa
322,487India
115,252Peru
(7)8,619Colombia
Change %Sep 10Reported domestic lager volumes by country, hl ‘000

F11 H1 results© SABMiller plc 2010 35
Net debt
16%16%Other
21%20%Colombian peso
100%100%
9%11%SA rand
23%21%Euro
31%32%US dollars
Net debt currency profile*
5.7%6.1%Average interest rate (gross debt) – %
Mar 10Sep 10
* Including the effect of derivatives
F11 H1 results© SABMiller plc 2010 36
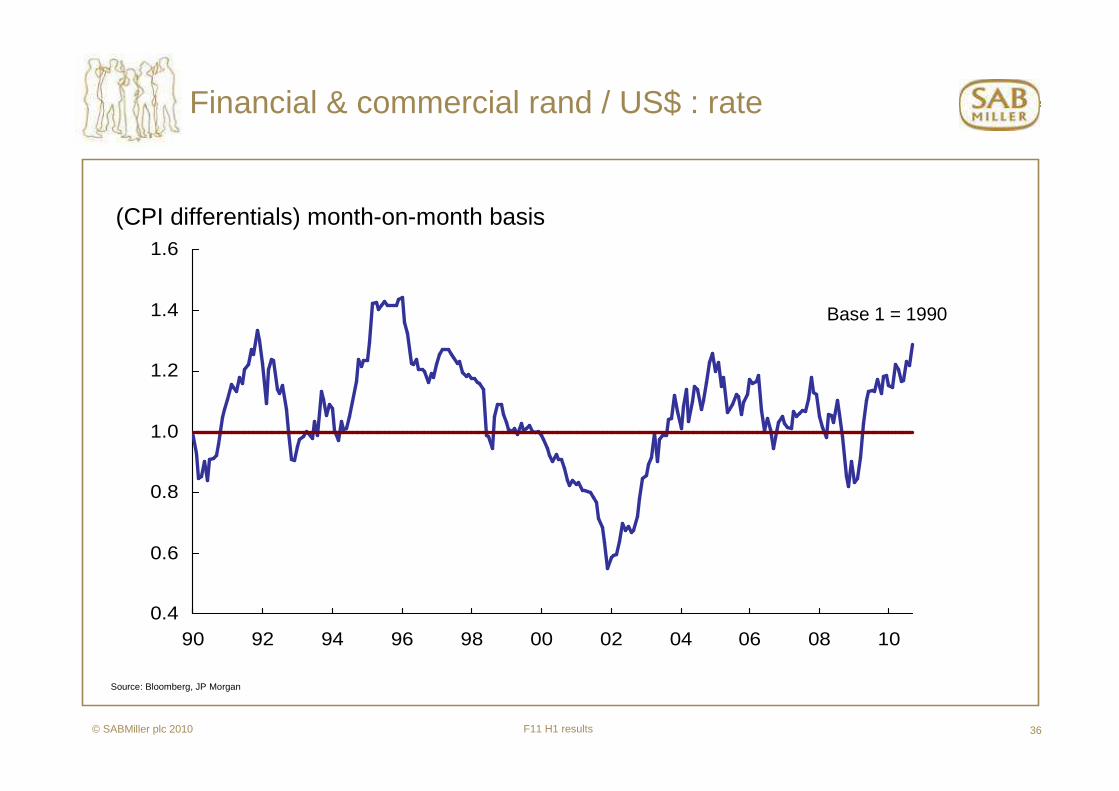
Financial & commercial rand / US$ : rate
Base 1 = 1990
Source: Bloomberg, JP Morgan
(CPI differentials) month-on-month basis
0.4
0.6
0.8
1.0
1.2
1.4
1.6
90 92 94 96 98 00 02 04 06 08 10

F11 H1 results© SABMiller plc 2010 37
7.55
47.75
6.83
74.75
6.57
28.50
1,320
184.09
2.88
30.09
17.18
2.88
0.68
18.902.88
1,92230 Sep 09
7.30
44.85
6.83
77.75
6.76
34.70
1,360
196.88
3.03
29.36
18.87
2.86
0.74
18.902.84
1,92931 Mar 10
3.13Romania
36.23Mozambique
1,493Tanzania
6. 60Botswana
80.75Kenya
6.69China
30.40Russia
18.90Honduras2.79Peru
1,800Colombia
6.96South Africa
2.91Poland
0.73Euro
44.95India
202.57Hungary
18.03Czech Republic
30 Sep 10Closing rates currency vs US$
Exchange rates
F11 H1 results© SABMiller plc 2010 38
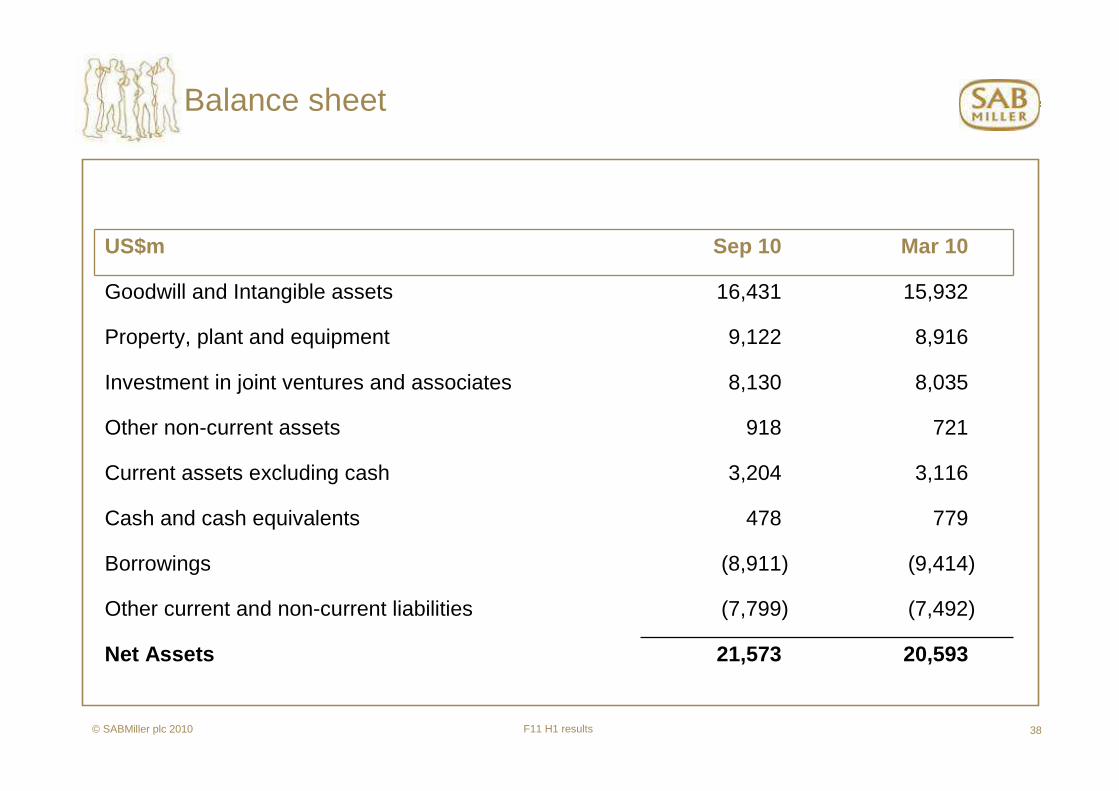
Balance sheet
21,573
(7,799)
(8,911)
478
3,204
918
8,130
9,122
16,431
Sep 10 Mar 10
20,593Net Assets
(7,492)Other current and non-current liabilities
(9,414)Borrowings
779Cash and cash equivalents
3,116Current assets excluding cash
721Other non-current assets
8,035Investment in joint ventures and associates
8,916Property, plant and equipment
15,932Goodwill and Intangible assets
US$m