Embed Size (px)
Citation preview
STRUCTURE AND EVOLUTION OF EXTREMELY HEAVY RAINFALL-PRODUCING CONVECTIVE LINE-SYSTEMS IN TOKAI
DISTRICT, JAPAN ****Sachie Kanada, Yasutaka Wakatsuki and Kazuhisa Tsuboki
Hydrospheric Atmospheric Research Center (HyARC), Nagoya University, Nagoya 464-8601,Japan
1. INTRODUCTION Heavy rainfall is very often caused in subtropical humid-climate region by meso-scale precipitating convective system. Rainfall which concentrates on small region in short time sometimes causes severe disasters such as floods or ground slides. It is often said that the horizontal distribution of rainfall is closely associated with topography and heavy rainfall often occurs in the mountainous region. For example, Staff Members of Tokyo Univ. (1969, 1970) stated in the study of typhoon rainfall that rainfall tends to increase with altitude. Yoshizaki et al. (2000) studied convective line-system that formed along the Nagasaki Peninsula. Also rainfall enhancements of upwind and downwind sides of mountain were studied by Kanada et al. (1999, 2000), respectively. On the other hand, meso-scale convective systems also concentrate heavy rainfall itself, even there is no evident mountain or topography. Many of meso-scale convective systems are line-shaped and there were many case studies about it. Bluestein and Jain (1985) analyzed 150 cases of meso-scale lines observed by radar in Oklahoma, USA, and classified them into 4 types. By further analysis Bluestein and Marx (1987) showed common environmental condition for each types. One of typical meso-scale convective line-system called squall line is also well studied by Snull and Houze (1985, 1987), Fovell and Ogura (1988) and Houze et al. (1990), but unfortunately most of them based on observations held in North America or the tropics. It is also important to reveal three-dimensional structure and evolution of meso-scale convective line-system which forms/develops in subtropical humid-climate region such as Japan. The main purpose of this study is to clarify the three-dimensional structure and time-variation of rainfall-producing convetive line-systems stagnant under active cloud-clusters and brought extremely heavy rainfall in the Tokai district, Japan. Corresponding author’s address: Sachie Kanada, Hydrospheric Atmospheric Research Center (HyARC), Nagoya University, Furo-cho, Chikusa-ku, Nagoya, 464-8601, Japan, Tel: +81-52-789-3494, Fax: +81-52-789-3436, E-Mail: [email protected]
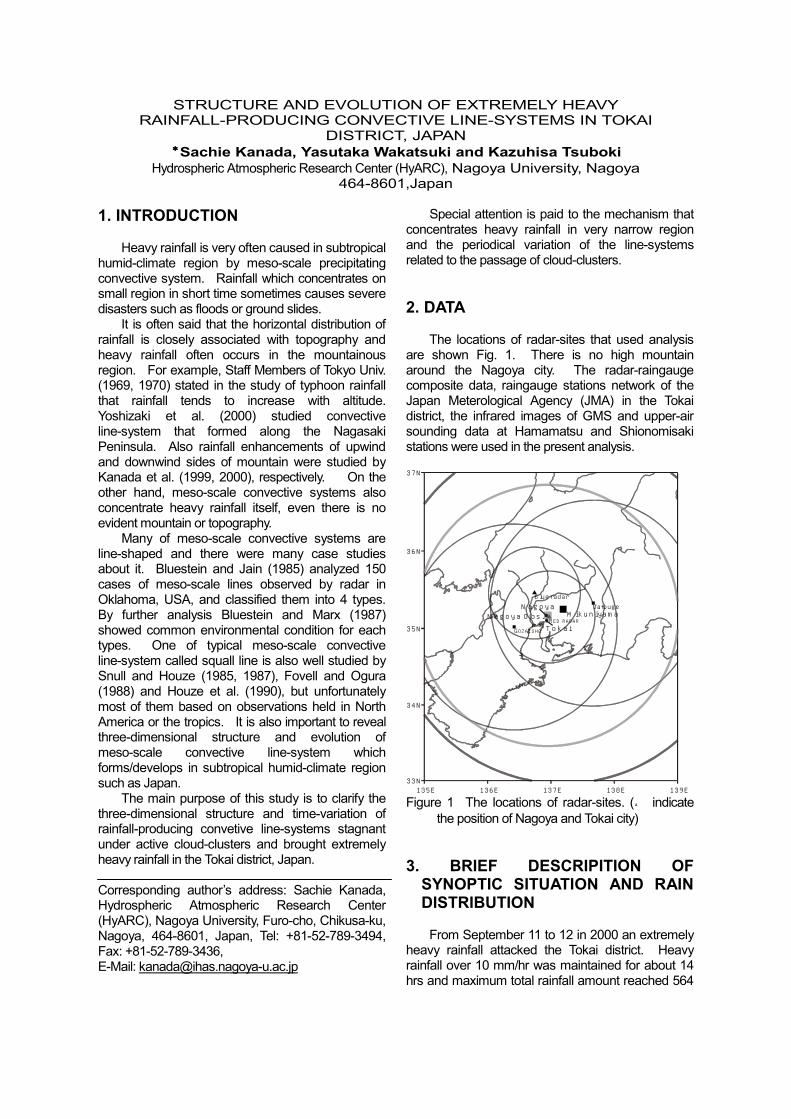
Special attention is paid to the mechanism that concentrates heavy rainfall in very narrow region and the periodical variation of the line-systems related to the passage of cloud-clusters. 2. DATA The locations of radar-sites that used analysis are shown Fig. 1. There is no high mountain around the Nagoya city. The radar-raingauge composite data, raingauge stations network of the Japan Meterological Agency (JMA) in the Tokai district, the infrared images of GMS and upper-air sounding data at Hamamatsu and Shionomisaki stations were used in the present analysis.
135E 136E 137E 138E 139E33N
34N
35N
36N
37N
B lue radar
M ik u n iya m a
GOZAISHO
JatougeN a g o y a O b s .
N a g o y a
T o k a iRED RADAR
Figure 1 The locations of radar-sites. (● indicate
the position of Nagoya and Tokai city) 3. BRIEF DESCRIPITION OF
SYNOPTIC SITUATION AND RAIN DISTRIBUTION
From September 11 to 12 in 2000 an extremely heavy rainfall attacked the Tokai district. Heavy rainfall over 10 mm/hr was maintained for about 14 hrs and maximum total rainfall amount reached 564
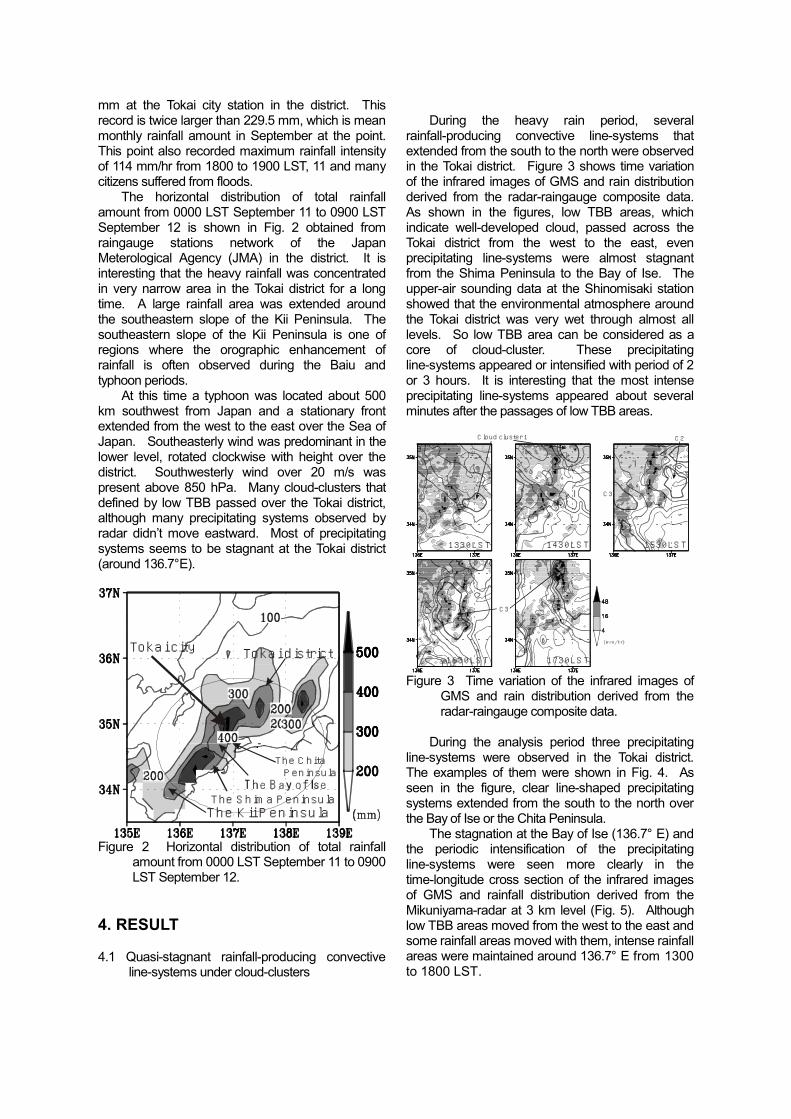
mm at the Tokai city station in the district. This record is twice larger than 229.5 mm, which is mean monthly rainfall amount in September at the point. This point also recorded maximum rainfall intensity of 114 mm/hr from 1800 to 1900 LST, 11 and many citizens suffered from floods. The horizontal distribution of total rainfall amount from 0000 LST September 11 to 0900 LST September 12 is shown in Fig. 2 obtained from raingauge stations network of the Japan Meterological Agency (JMA) in the district. It is interesting that the heavy rainfall was concentrated in very narrow area in the Tokai district for a long time. A large rainfall area was extended around the southeastern slope of the Kii Peninsula. The southeastern slope of the Kii Peninsula is one of regions where the orographic enhancement of rainfall is often observed during the Baiu and typhoon periods. At this time a typhoon was located about 500 km southwest from Japan and a stationary front extended from the west to the east over the Sea of Japan. Southeasterly wind was predominant in the lower level, rotated clockwise with height over the district. Southwesterly wind over 20 m/s was present above 850 hPa. Many cloud-clusters that defined by low TBB passed over the Tokai district, although many precipitating systems observed by radar didn’t move eastward. Most of precipitating systems seems to be stagnant at the Tokai district (around 136.7°E).
T he K ii P eninsulaT he S him a P eninsula
The C hita P eninsula
Tokai city Tokai district
Figure 2 Horizontal distribution of total rainfall
amount from 0000 LST September 11 to 0900 LST September 12.
4. RESULT 4.1 Quasi-stagnant rainfall-producing convective
line-systems under cloud-clusters
During the heavy rain period, several rainfall-producing convective line-systems that extended from the south to the north were observed in the Tokai district. Figure 3 shows time variation of the infrared images of GMS and rain distribution derived from the radar-raingauge composite data. As shown in the figures, low TBB areas, which indicate well-developed cloud, passed across the Tokai district from the west to the east, even precipitating line-systems were almost stagnant from the Shima Peninsula to the Bay of Ise. The upper-air sounding data at the Shinomisaki station showed that the environmental atmosphere around the Tokai district was very wet through almost all levels. So low TBB area can be considered as a core of cloud-cluster. These precipitating line-systems appeared or intensified with period of 2 or 3 hours. It is interesting that the most intense precipitating line-systems appeared about several minutes after the passages of low TBB areas.
C loud cluster 1 C 2
C 3
C 3
1730LS T1630LS T
1530LS T1430LS T1330LS T
Figure 3 Time variation of the infrared images of
GMS and rain distribution derived from the radar-raingauge composite data.
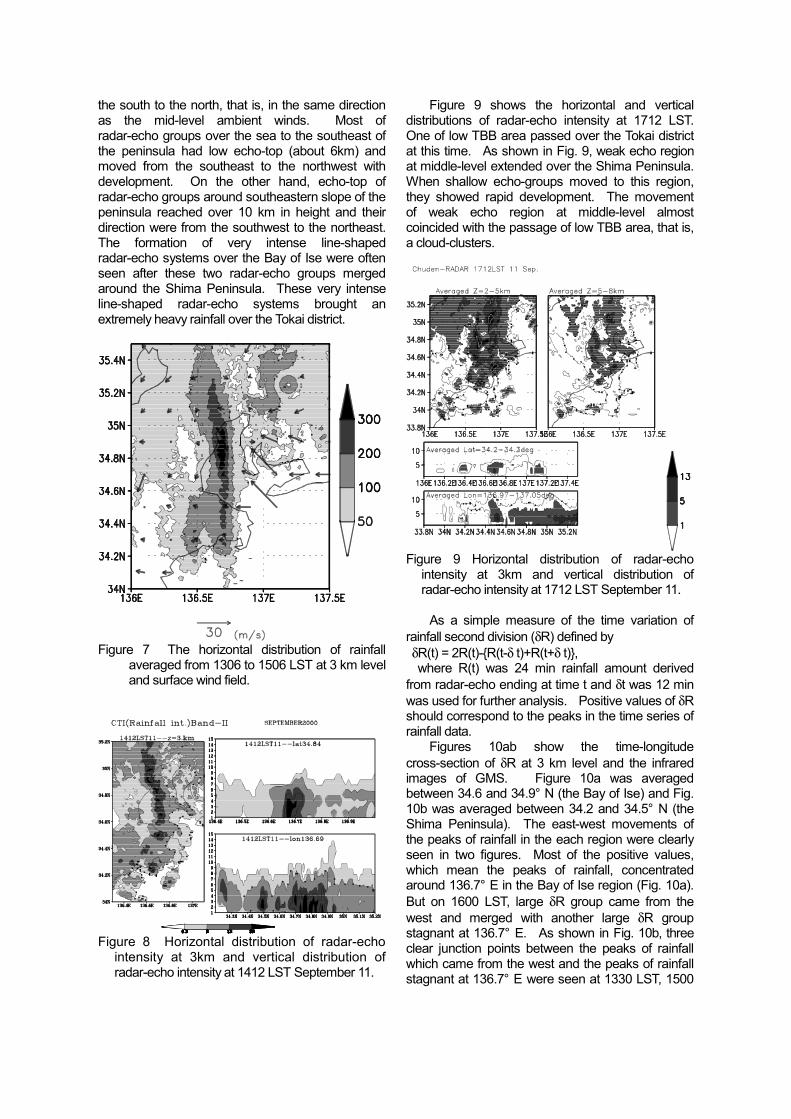
During the analysis period three precipitating line-systems were observed in the Tokai district. The examples of them were shown in Fig. 4. As seen in the figure, clear line-shaped precipitating systems extended from the south to the north over the Bay of Ise or the Chita Peninsula. The stagnation at the Bay of Ise (136.7° E) and the periodic intensification of the precipitating line-systems were seen more clearly in the time-longitude cross section of the infrared images of GMS and rainfall distribution derived from the Mikuniyama-radar at 3 km level (Fig. 5). Although low TBB areas moved from the west to the east and some rainfall areas moved with them, intense rainfall areas were maintained around 136.7° E from 1300 to 1800 LST.
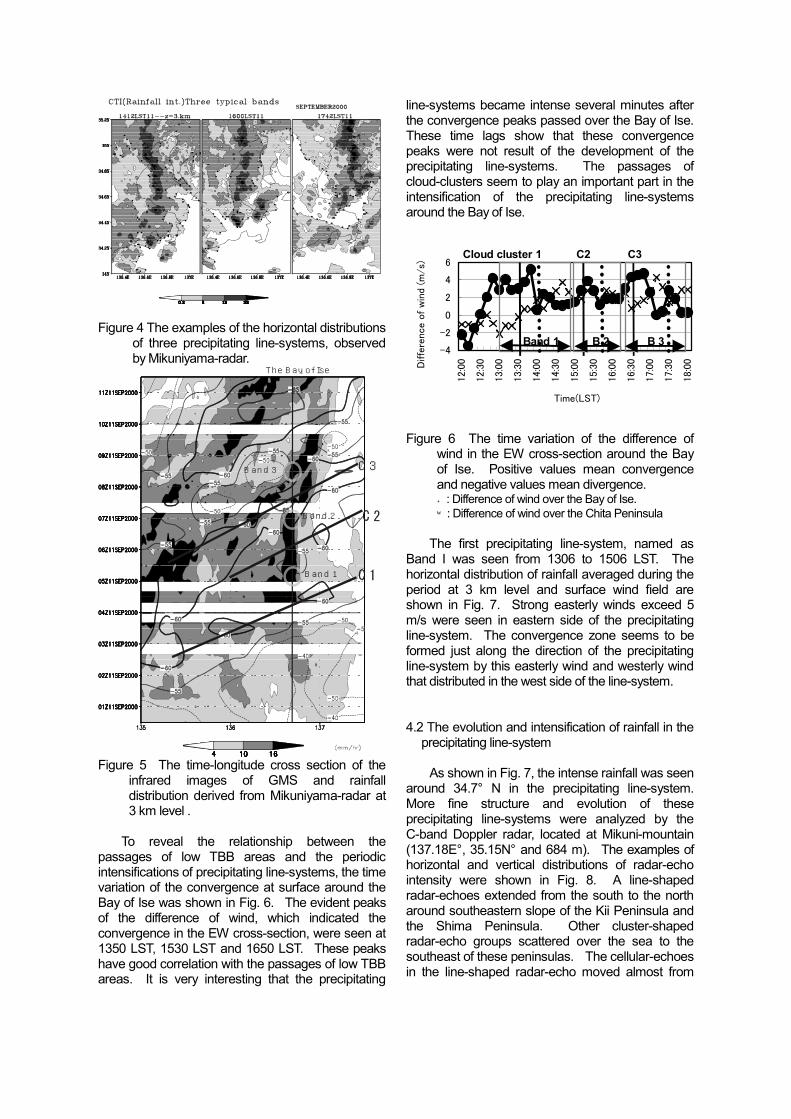
Figure 4 The examples of the horizontal distributions
of three precipitating line-systems, observed by Mikuniyama-radar.
The B ay of Ise
C 3
B and 1
B and 2
B and 3
Figure 5 The time-longitude cross section of the
infrared images of GMS and rainfall distribution derived from Mikuniyama-radar at 3 km level .
To reveal the relationship between the passages of low TBB areas and the periodic intensifications of precipitating line-systems, the time variation of the convergence at surface around the Bay of Ise was shown in Fig. 6. The evident peaks of the difference of wind, which indicated the convergence in the EW cross-section, were seen at 1350 LST, 1530 LST and 1650 LST. These peaks have good correlation with the passages of low TBB areas. It is very interesting that the precipitating
line-systems became intense several minutes after the convergence peaks passed over the Bay of Ise. These time lags show that these convergence peaks were not result of the development of the precipitating line-systems. The passages of cloud-clusters seem to play an important part in the intensification of the precipitating line-systems around the Bay of Ise.
-4
-2
0
2
4
6
12:0
0
12:3
0
13:0
0
13:3
0
14:0
0
14:3
0
15:0
0
15:3
0
16:0
0
16:3
0
17:0
0
17:3
0
18:0
0
Time(LST)
Diffe
rence o
f w
ind
(m/s)
Cloud cluster 1 C2 C3
Band 1 B 2 B 3
Figure 6 The time variation of the difference of
wind in the EW cross-section around the Bay of Ise. Positive values mean convergence and negative values mean divergence. ●: Difference of wind over the Bay of Ise. ×: Difference of wind over the Chita Peninsula
The first precipitating line-system, named as Band I was seen from 1306 to 1506 LST. The horizontal distribution of rainfall averaged during the period at 3 km level and surface wind field are shown in Fig. 7. Strong easterly winds exceed 5 m/s were seen in eastern side of the precipitating line-system. The convergence zone seems to be formed just along the direction of the precipitating line-system by this easterly wind and westerly wind that distributed in the west side of the line-system. 4.2 The evolution and intensification of rainfall in the
precipitating line-system As shown in Fig. 7, the intense rainfall was seen around 34.7° N in the precipitating line-system. More fine structure and evolution of these precipitating line-systems were analyzed by the C-band Doppler radar, located at Mikuni-mountain (137.18E°, 35.15N° and 684 m). The examples of horizontal and vertical distributions of radar-echo intensity were shown in Fig. 8. A line-shaped radar-echoes extended from the south to the north around southeastern slope of the Kii Peninsula and the Shima Peninsula. Other cluster-shaped radar-echo groups scattered over the sea to the southeast of these peninsulas. The cellular-echoes in the line-shaped radar-echo moved almost from
the south to the north, that is, in the same direction as the mid-level ambient winds. Most of radar-echo groups over the sea to the southeast of the peninsula had low echo-top (about 6km) and moved from the southeast to the northwest with development. On the other hand, echo-top of radar-echo groups around southeastern slope of the peninsula reached over 10 km in height and their direction were from the southwest to the northeast. The formation of very intense line-shaped radar-echo systems over the Bay of Ise were often seen after these two radar-echo groups merged around the Shima Peninsula. These very intense line-shaped radar-echo systems brought an extremely heavy rainfall over the Tokai district.
Figure 7 The horizontal distribution of rainfall
averaged from 1306 to 1506 LST at 3 km level and surface wind field.
Figure 8 Horizontal distribution of radar-echo
intensity at 3km and vertical distribution of radar-echo intensity at 1412 LST September 11.
Figure 9 shows the horizontal and vertical distributions of radar-echo intensity at 1712 LST. One of low TBB area passed over the Tokai district at this time. As shown in Fig. 9, weak echo region at middle-level extended over the Shima Peninsula. When shallow echo-groups moved to this region, they showed rapid development. The movement of weak echo region at middle-level almost coincided with the passage of low TBB area, that is, a cloud-clusters.
Figure 9 Horizontal distribution of radar-echo
intensity at 3km and vertical distribution of radar-echo intensity at 1712 LST September 11.
As a simple measure of the time variation of rainfall second division (δR) defined by δR(t) = 2R(t)-{R(t-δ t)+R(t+δ t)}, where R(t) was 24 min rainfall amount derived from radar-echo ending at time t and δt was 12 min was used for further analysis. Positive values of δR should correspond to the peaks in the time series of rainfall data. Figures 10ab show the time-longitude cross-section of δR at 3 km level and the infrared images of GMS. Figure 10a was averaged between 34.6 and 34.9° N (the Bay of Ise) and Fig. 10b was averaged between 34.2 and 34.5° N (the Shima Peninsula). The east-west movements of the peaks of rainfall in the each region were clearly seen in two figures. Most of the positive values, which mean the peaks of rainfall, concentrated around 136.7° E in the Bay of Ise region (Fig. 10a). But on 1600 LST, large δR group came from the west and merged with another large δR group stagnant at 136.7° E. As shown in Fig. 10b, three clear junction points between the peaks of rainfall which came from the west and the peaks of rainfall stagnant at 136.7° E were seen at 1330 LST, 1500
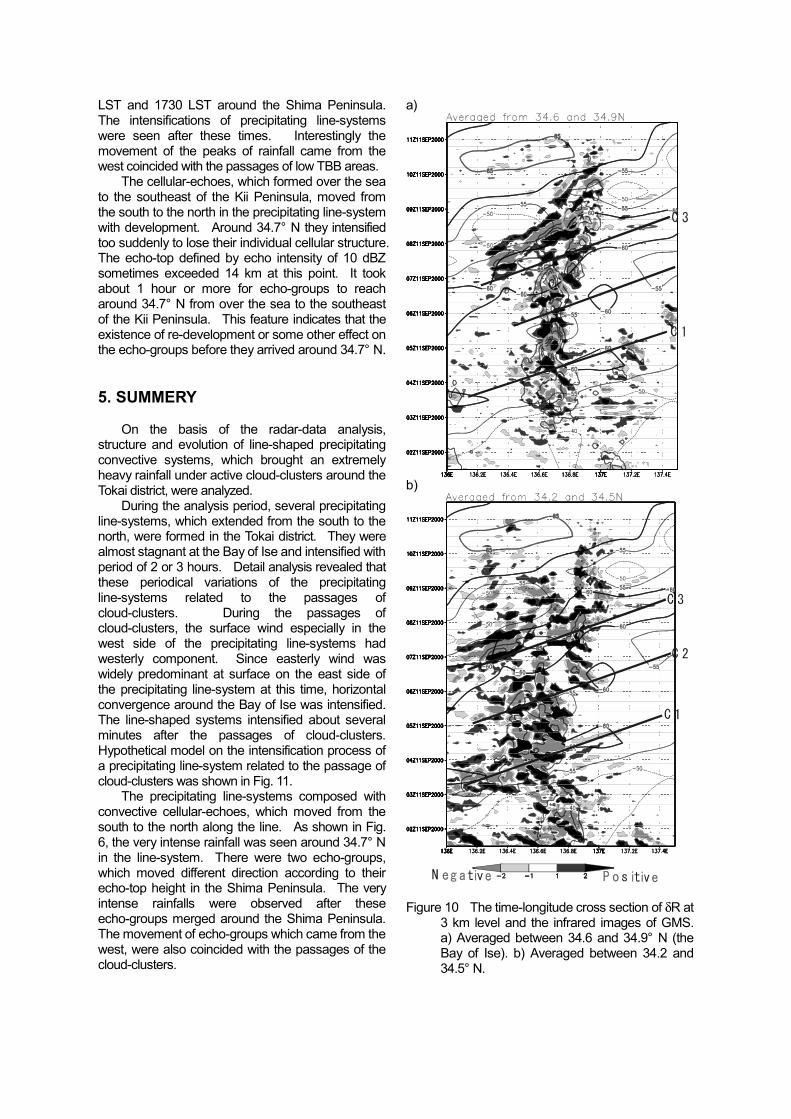
LST and 1730 LST around the Shima Peninsula. The intensifications of precipitating line-systems were seen after these times. Interestingly the movement of the peaks of rainfall came from the west coincided with the passages of low TBB areas. The cellular-echoes, which formed over the sea to the southeast of the Kii Peninsula, moved from the south to the north in the precipitating line-system with development. Around 34.7° N they intensified too suddenly to lose their individual cellular structure. The echo-top defined by echo intensity of 10 dBZ sometimes exceeded 14 km at this point. It took about 1 hour or more for echo-groups to reach around 34.7° N from over the sea to the southeast of the Kii Peninsula. This feature indicates that the existence of re-development or some other effect on the echo-groups before they arrived around 34.7° N. 5. SUMMERY On the basis of the radar-data analysis, structure and evolution of line-shaped precipitating convective systems, which brought an extremely heavy rainfall under active cloud-clusters around the Tokai district, were analyzed. During the analysis period, several precipitating line-systems, which extended from the south to the north, were formed in the Tokai district. They were almost stagnant at the Bay of Ise and intensified with period of 2 or 3 hours. Detail analysis revealed that these periodical variations of the precipitating line-systems related to the passages of cloud-clusters. During the passages of cloud-clusters, the surface wind especially in the west side of the precipitating line-systems had westerly component. Since easterly wind was widely predominant at surface on the east side of the precipitating line-system at this time, horizontal convergence around the Bay of Ise was intensified. The line-shaped systems intensified about several minutes after the passages of cloud-clusters. Hypothetical model on the intensification process of a precipitating line-system related to the passage of cloud-clusters was shown in Fig. 11. The precipitating line-systems composed with convective cellular-echoes, which moved from the south to the north along the line. As shown in Fig. 6, the very intense rainfall was seen around 34.7° N in the line-system. There were two echo-groups, which moved different direction according to their echo-top height in the Shima Peninsula. The very intense rainfalls were observed after these echo-groups merged around the Shima Peninsula. The movement of echo-groups which came from the west, were also coincided with the passages of the cloud-clusters.
a)
b)
Figure 10 The time-longitude cross section of δR at
3 km level and the infrared images of GMS. a) Averaged between 34.6 and 34.9° N (the Bay of Ise). b) Averaged between 34.2 and 34.5° N.
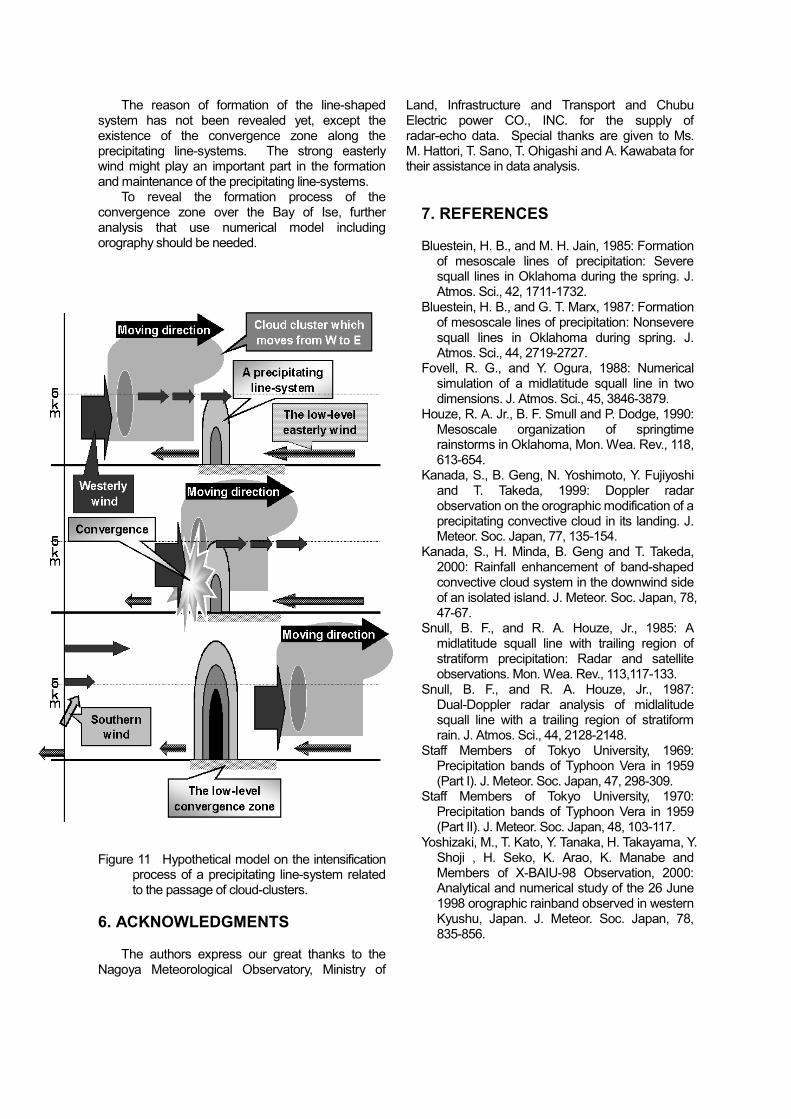
The reason of formation of the line-shaped system has not been revealed yet, except the existence of the convergence zone along the precipitating line-systems. The strong easterly wind might play an important part in the formation and maintenance of the precipitating line-systems. To reveal the formation process of the convergence zone over the Bay of Ise, further analysis that use numerical model including orography should be needed.
Figure 11 Hypothetical model on the intensification process of a precipitating line-system related to the passage of cloud-clusters.
6. ACKNOWLEDGMENTS The authors express our great thanks to the Nagoya Meteorological Observatory, Ministry of
Land, Infrastructure and Transport and Chubu Electric power CO., INC. for the supply of radar-echo data. Special thanks are given to Ms. M. Hattori, T. Sano, T. Ohigashi and A. Kawabata for their assistance in data analysis.
7. REFERENCES Bluestein, H. B., and M. H. Jain, 1985: Formation
of mesoscale lines of precipitation: Severe squall lines in Oklahoma during the spring. J. Atmos. Sci., 42, 1711-1732.
Bluestein, H. B., and G. T. Marx, 1987: Formation of mesoscale lines of precipitation: Nonsevere squall lines in Oklahoma during spring. J. Atmos. Sci., 44, 2719-2727.
Fovell, R. G., and Y. Ogura, 1988: Numerical simulation of a midlatitude squall line in two dimensions. J. Atmos. Sci., 45, 3846-3879.
Houze, R. A. Jr., B. F. Smull and P. Dodge, 1990: Mesoscale organization of springtime rainstorms in Oklahoma, Mon. Wea. Rev., 118, 613-654.
Kanada, S., B. Geng, N. Yoshimoto, Y. Fujiyoshi and T. Takeda, 1999: Doppler radar observation on the orographic modification of a precipitating convective cloud in its landing. J. Meteor. Soc. Japan, 77, 135-154.
Kanada, S., H. Minda, B. Geng and T. Takeda, 2000: Rainfall enhancement of band-shaped convective cloud system in the downwind side of an isolated island. J. Meteor. Soc. Japan, 78, 47-67.
Snull, B. F., and R. A. Houze, Jr., 1985: A midlatitude squall line with trailing region of stratiform precipitation: Radar and satellite observations. Mon. Wea. Rev., 113,117-133.
Snull, B. F., and R. A. Houze, Jr., 1987: Dual-Doppler radar analysis of midlalitude squall line with a trailing region of stratiform rain. J. Atmos. Sci., 44, 2128-2148.
Staff Members of Tokyo University, 1969: Precipitation bands of Typhoon Vera in 1959 (Part I). J. Meteor. Soc. Japan, 47, 298-309.
Staff Members of Tokyo University, 1970: Precipitation bands of Typhoon Vera in 1959 (Part II). J. Meteor. Soc. Japan, 48, 103-117.
Yoshizaki, M., T. Kato, Y. Tanaka, H. Takayama, Y. Shoji , H. Seko, K. Arao, K. Manabe and Members of X-BAIU-98 Observation, 2000: Analytical and numerical study of the 26 June 1998 orographic rainband observed in western Kyushu, Japan. J. Meteor. Soc. Japan, 78, 835-856.