Embed Size (px)
Citation preview
Sacramento Sacramento OverviewOverview
Sierra Ozone SummitSierra Ozone Summit
Sacramento Sacramento OverviewOverview
Sierra Ozone SummitSierra Ozone Summit
Larry GreeneLarry GreeneAir Pollution Control OfficerAir Pollution Control OfficerLarry GreeneLarry GreeneAir Pollution Control OfficerAir Pollution Control Officer

We’re Geographically-We’re Geographically-ChallengedChallenged
We’re Geographically-We’re Geographically-ChallengedChallenged
Summer Ground-level Ozone (smog) Summer Ground-level Ozone (smog)
NOX + VOC+Sunlight = 0zoneNOX + VOC+Sunlight = 0zone
=+
The Sacramento valley is like a bowl. Strong summer temperature inversions clamp a “lid” on the bowl, creating stagnant conditions that cause pollution to build until the inversion breaks and ocean breezes dilute and dissipate ground-level ozone air pollution.
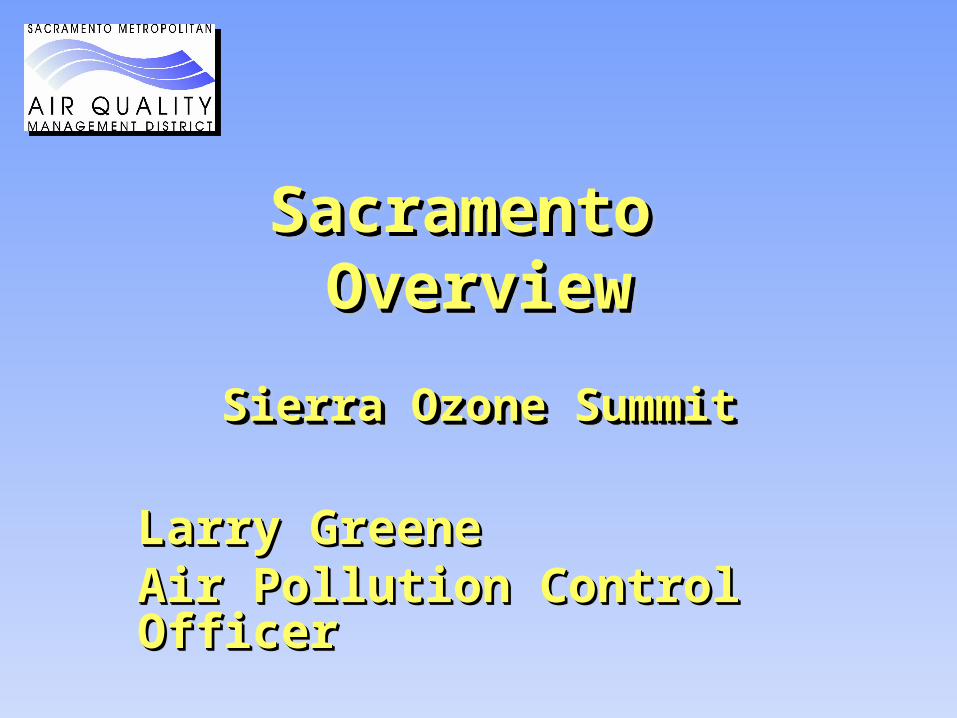
National Rankings - 2007National Rankings - 2007
Region is Consistently ranked in Region is Consistently ranked in the the Top 10Top 10 for ozone pollution for ozone pollution
1. Los Angeles1. Los Angeles 6. Sacramento6. Sacramento
2. San Joaquin Valley 2. San Joaquin Valley 7. Baton Rouge7. Baton Rouge
3. Southeast Desert, CA3. Southeast Desert, CA 8. Dallas8. Dallas
4. Houston4. Houston 9. Philadelphia9. Philadelphia
5. Nevada County, CA 10. Ventura5. Nevada County, CA 10. Ventura

FederalFederal
OzoneOzone
Non-attainmentNon-attainment
AreaArea120 m
iles

Monitor Locations and StatusMonitor Locations and Status

Air Quality Trends - OzoneAir Quality Trends - OzoneConcentrations, 1980 - 2007Concentrations, 1980 - 2007
1 hour1 hour
31% 31% improvementimprovement
8 hour8 hour
19% 19% improvementimprovement
0.000
0.020
0.040
0.060
0.080
0.100
0.120
0.140
0.160
0.180
0.200
1980 1982 1984 1986 1988 1990 1992 1994 1996 1998 2000 2002 2004 2006
Years
Par
ts p
er m
illio
n
1Hr 3Yr 4th High
8Hr 3Yr 4th Hi Avg
Fed 1Hr Standard(revoked)
CA 1Hr Standard
Fed 8Hr Avg Std(1997)
Fed 8Hr Avg Std(2008)

Emission Source Equivalents Emission Source Equivalents 1 TPD of VOC and NOx (Year 2019)1 TPD of VOC and NOx (Year 2019)
18,000 HD trucks18,000 HD trucks
200,000 cars*200,000 cars*
72 Locomotives72 Locomotives(NOx only)(NOx only)
310 Gas Stations**310 Gas Stations**(VOC only)(VOC only)
* Base on average vehicle fleet mix** No additional controls after 2005

2002 Emission
Inventory
Districts
State/Federal

Current Sacramento Regional NOx – Current Sacramento Regional NOx – 167 TPD167 TPD
Other6%
Trains5%
Other4%
FarmEquip
6%Constr&Mining+
Comm&Ind Equip.
11%Boats/Ships
5%
Automobiles6%
Lt/Med Duty Trucks
11%
Heavy Duty Diesel Trucks
35%
Boilers/Heaters/
Ag Pumps9%
Other Mobile32%
On-Road Mobile
57%
Stationary9%
Area-Wide 2%(Residential Comb &
Ag Burn)

Current Sacramento Regional VOC Current Sacramento Regional VOC – 136 TPD– 136 TPD
ConsumerProducts
10%
Arch Coatings5%
Other6%
Other6%
Other11%
Solvent/Coatings
5%
Off-RoadEquipment
10%
Rec Boats13%
Other9%
Automobiles12%
Lt./MedDuty Trucks
13%
Other Mobile30%
On-Road Mobile
33%
Stationary16%
Area-Wide 21%

NOx Inventory ForecastNOx Inventory ForecastSacramento Nonattainment AreaSacramento Nonattainment Area
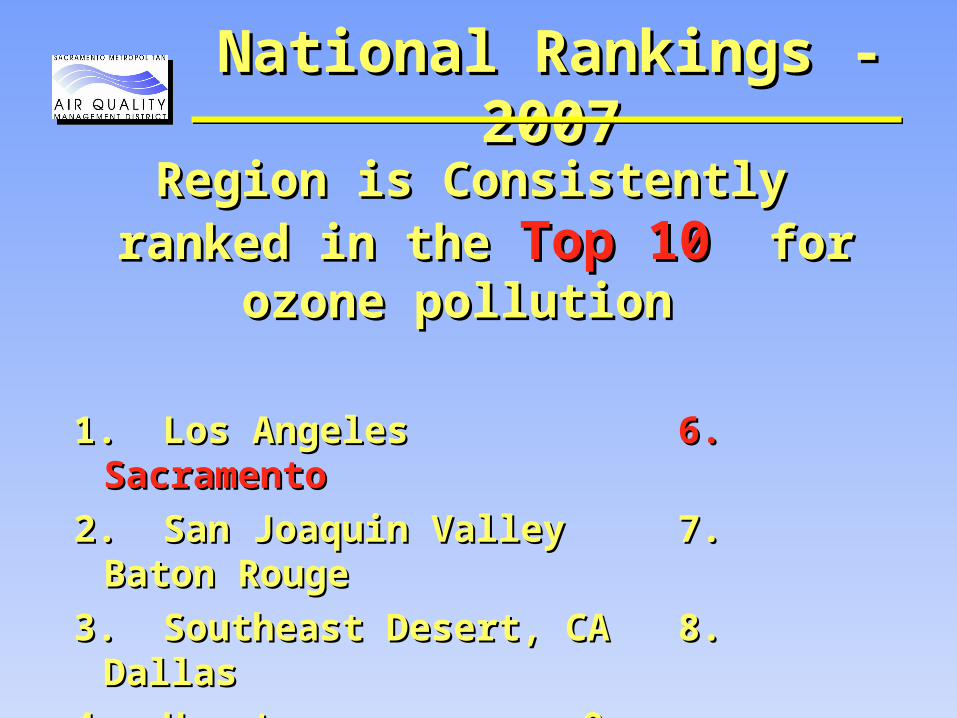
Controls in SacramentoControls in SacramentoOver 40 adopted rules affectingOver 40 adopted rules affecting
Residents and schoolsResidents and schools water heaters, water heaters, house paints, varnishes and other solventshouse paints, varnishes and other solvents wood burning applianceswood burning appliances
Industrial and commercial sourcesIndustrial and commercial sources Electric power plantsElectric power plants Automobile refinishingAutomobile refinishing Auto repair shopsAuto repair shops BakeriesBakeries Asphalt pavingAsphalt paving Cabinet shopsCabinet shops Boilers and water heatersBoilers and water heaters Landfill gasLandfill gas Boat manufacturingBoat manufacturing PrintingPrinting
Agricultural sources Agricultural sources Agricultural burningAgricultural burning Confined animal feeding operationsConfined animal feeding operations
10+ new or amended rules under consideration10+ new or amended rules under consideration

2008 Benefits From District VOC Rules2008 Benefits From District VOC RulesSacramento RegionSacramento Region
63 Tons/Day63 Tons/Day
Aerospace, 0.04Bakeries, 0.5Polyester Resin, 0.5
Fugitive V&F, 1
Adhesive, 1
Graphic Arts, 1
Wood Coating, 1
Landfill, 1
Misc Metal Parts, 2
Can Coating, 2
SOCMI, 2Solvent Cleaning
Degreasing12
ArchCoating
6Auto
Refinishing4
Other12Gas Stations
14
Bulk Terminals16

2008 Benefits From District NOx Rules2008 Benefits From District NOx RulesSacramento RegionSacramento Region
20 Tons/Day20 Tons/Day
Biomass Boilers0.5
Residential Water Heaters
1
Gas Turbines11
Boilers3
ICEngines
6

Innovative Clean Air StrategiesInnovative Clean Air StrategiesIncentive programsIncentive programs
Other strategiesOther strategies

District Mobile Source ActionsDistrict Mobile Source Actions
DMVSchool Bus
Mitigation
CMAQ
EPA
Other
-Since 1998, 3784 engines, $88 million, 6.5 tons of NOx per day. ($13 million/ton per day)

Other InnovationsOther Innovations
- Raley’s trucks
- Off road NOx devices
- Propane generators
- Idling devices
- Switch engines
- Cap Corridor trains

Nevada County ActivitiesNevada County Activities
Grass Valley in Sacramento’s Grass Valley in Sacramento’s Spare the Air Spare the Air ozone movies ozone movies
Extended movies to 24 hours Extended movies to 24 hours per day to capture Grass per day to capture Grass Valley peak ozone levelsValley peak ozone levels
Invited Northern Sierra APCD Invited Northern Sierra APCD staff to participate in staff to participate in Sacramento planning effortsSacramento planning efforts
Community invited to suggest Community invited to suggest additional control measures additional control measures
Coordinate EPA grant to fund Coordinate EPA grant to fund additional air monitoring additional air monitoring equipment in Nevada Countyequipment in Nevada County

Progress towards attainmentProgress towards attainment
Use model results Use model results to project to project attainmentattainment
Colored lines Colored lines show show attainment attainment dates for each dates for each part of the part of the regionregion
Declining VOC Emissions
Dec
linin
g N
Ox
Em
issi
ons 2002
2008
2011
2014
2018
2018Cool
Folsom
PlacervilleSloughhouse
Sac-Del Paso Manor
Grass ValleyAuburn
Emission Forecasts w/
Existing Controls
Emission Forecasts w/
New Controls
Monitoring Site Attainment Lines (84 ppb) are based on 2012 modeling, except Cool is based on 2018 modeling.
2012

Questions???Questions???Questions???Questions???


How difficult is attainment in 2012?How difficult is attainment in 2012?Effects of draconian strategiesEffects of draconian strategies
0
20
40
60
80
100
120
140
160
180
200
2002EmissionInventory
2012EmissionInventory
2012 w/oLight DutyVehicles
2012 w/oDieselTrucks
2012 w/oMotor
Vehicles
2012 w/oStationarySources
2012 w/oAgriculture
2012 w/oOffroad
Equipment
NO
x E
mis
sion
s (to
ns/d
ay)
Need 40% reductions to attain.
Attainment Goal

Population-Weighted Exposure Ozone TrendSacramento County
0.0
0.5
1.0
1.5
2.0
2.5
1986 1987 1988 1989 1990 1991 1992 1993 1994 1995 1996 1997 1998 1999 2000 2001 2002 2003 2004 2005
Year
Ozo
ne (
pp
m-h
ou
rs p
er
pers
on
)
Baseline Pop-Weighted Exposure 3-Yr Moving AvgExposure Data Source: ARB

Population-Weighted Exposure Ozone TrendNorthern Sierra AQMD
0.0
0.5
1.0
1.5
2.0
2.5
1986 1987 1988 1989 1990 1991 1992 1993 1994 1995 1996 1997 1998 1999 2000 2001 2002 2003 2004 2005
Year
Ozo
ne
(p
pm
-ho
urs
pe
r p
ers
on
)
Baseline Pop-Weighted Exposure 3-Yr Moving AvgExposure Data Source: ARB