Embed Size (px)
Citation preview

SAF Handbook
GUIDE TO SYSTEM DESIGN & ISSUE
DEFINITION
v.3.09
Spicosa WP3/WP6
February 25, 2011
Contents
I The Systems Approach Framework 3
1 Introduction 4
2 Who are ‘you’ and who are ‘we’? 5
3 How to use this Guide 7
4 The application team 8
5 Human impacts 9
6 Understanding systems and models 11
7 Understanding society 14
8 Understanding ecological economics 16
II Getting started 18
9 The steps of a SAF application 19
10 Is your application really necessary? 20
11 Agreeing the ‘Issue’ 22
1

LIST OF TABLES 2
III System Design 25
12 The tasks in System Design 26
13 Defining a Virtual System 27
14 Making a Conceptual Model 31
15 Thinking about modeling tools and data needs 34
16 Reflecting on progress so far 37
17 Appendix: Authorship, history and citation 40
List of Tables
1 The DPSIR and SAF chains exemplified . . . . . . . . . . . . 102 A descriptive definition of ‘System’ . . . . . . . . . . . . . . . 113 Example Policy Issue . . . . . . . . . . . . . . . . . . . . . . . 234 Action Points for Issue Identification . . . . . . . . . . . . 245 ‘System Design’ tasks . . . . . . . . . . . . . . . . . . . . . . 266 Capitals and services . . . . . . . . . . . . . . . . . . . . . . . 297 Action Points for System Definition . . . . . . . . . . . . . 308 Action Points for Conceptual Modelling . . . . . . . . . . 339 Action Points for Methods & Information . . . . . . . . . 3610 Action Points for Problem Scaling . . . . . . . . . . . . . . 3911 Contributors to ‘System Design’ handbook and Guide . . . . 40
List of Figures
1 The SAF as a science-policy interface . . . . . . . . . . . . . . 62 System and boundaries . . . . . . . . . . . . . . . . . . . . . . 123 An ecological-social-economic (ESE) system . . . . . . . . . . 164 Steps of a SAF application . . . . . . . . . . . . . . . . . . . 195 Is a SAF application necessary? . . . . . . . . . . . . . . . . . 216 Example conceptual model . . . . . . . . . . . . . . . . . . . 327 Illustrating data and methods needed . . . . . . . . . . . . . 348 Illustrating Problem Scaling . . . . . . . . . . . . . . . . . . . 38

3
Part I1
The Systems Approach Framework2
This part provides an introduction to SPICOSA’s ‘Systems Approach Frame-3
work’, including a summary of the main theoretical ideas involved in the SAF4
and guidance on how to use this document.5
Additional resources available at: www.coastal-saf.eu

1 INTRODUCTION 4
1 Introduction6
What you are reading is a product of the SPICOSA research project, funded7
by the European Commission from 2007 - 2011. SPICOSA stands for8
‘Science and Policy Integration for COastal System Assessment’. Its re-9
search was aimed at developing and testing a toolbox of methods for pro-10
viding multidisciplinary and trans-disciplinary advice to environmental man-11
agers and policy-makers concerning environmental problems in the coastal12
zone, in order to improve the zone’s ecological sustainability, economic ef-13
ficiency, and social equity. Sustainability relates to the capability of an14
ecosystem to go on supplying humans with ‘goods and services’. Efficiency15
is about making the best use of those resources for the satisfaction of human16
needs, and equity is about the fair distribution of such satisfaction.17
It was in response to the need for such a methodology, that the SPICOSA18
project developed and tested the ‘Systems Approach Framework’ or SAF.19
This has three main parts:20
• the use of General Systems Theory (GST) and Soft Systems Method-21
ology (SSM) to understand and model problems in coastal zones; 122
• the simulation of scenarios including problem management options;23
• the engagement of stakeholders at the science-policy interface.24
Both GST and SSM consider systems to be networks of components and25
links with certain formal properties (section 6); GST assumes the existence26
of such systems in the real world, whereas for SSM systems are merely ways27
to understand the complicated inter-relationships that exist in nature and28
society. A SAF application includes the stakeholder-aided design of a ‘soft’29
virtual system, or conceptual model, that is simpler than the ‘hard’ real-30
world coastal zone system under investigation31
As explained in section 9, a SAF application has fIve main steps:32
1. Issue Identification - the problem is diagnosed by stakeholders;33
2. System Design - a virtual system is conceived;34
3. System Formulation - a simulation model is made;35
4. System Appraisal - the model is tested and run for several scenarios;36
5. System Output - stakeholders deliberate the scenarios.37
This handbook introduces the SAF and provides a short, practical, guide to38
steps 1 and 2.39
1von Bertalanffy, L. (1968) General Systems Theory: Foundations, Development, Ap-plications. New York: George Braziller. Checkland, P. B. and Scholes, J. (1990) SoftSystems Methodology In Action. Chichester: John Wiley and Sons, Ltd.

2 WHO ARE ‘YOU’ AND WHO ARE ‘WE’? 5
2 Who are ‘you’ and who are ‘we’?40
The first drafts of the material contained in SAF handbooks were written41
for members of the Spicosa project to test during a set of ‘Study Site Appli-42
cations’, or SSA, at sites as diverse as a Swedish fjord, a Spanish beach, or a43
Turkish estuary. Based on SSA experience, we have re-written this guide to44
the first step, ‘System Design’, for a wider audience. We assume that you,45
the reader, are an environmental researcher or regulator, or a member of46
the public; that you have a concern about an environmental problem arising47
from human activity in the coastal zone; and that you want to help find48
a solution to this problem that optimizes human well-being whilst preserv-49
ing environmental sustainability. We also assume that you have a general50
knowledge of coastal zone ecology and geography.51
The Spicosa method involves three main groups of actors, or three sets52
of roles for actors to play. The relationships amongst the institutions to53
which the actors belong are shown in Figure 1, and the three groups are:54
‘stakeholders’: people or institutions that have an interest in the environ-55
mental problem because they cause it, or are impacted by it, or might56
be affected by the solution57
‘governance’: people or institutions who make laws or policy regarding58
environmental problems, or who implement those laws or policy;59
‘scientists’: the technical experts, including ecologists, economists, mathe-60
matical modelers, political scientists, social scientists, and systems an-61
alysts, who will apply the SAF to provide stakeholders and governance62
with the information they need for better deliberation of management63
or policy options.64
When we address ‘you’ in this guide, we sometimes mean ‘you’ in the65
general sense of ‘you, dear reader, from any of the three groups of actors’,66
and sometimes in a more focussed sense of ‘you, someone who will implement67
the steps of the SAF, or who will manage a team doing this’.68
When we write ‘we’ in this guide, the pronoun is meant to refer to the69
team that assembled the material for the first drafts of the ‘System Design’70
handbook, from which this short guide has been abstracted. Members of71
this team are listed at the end of the guide: ‘we’ include oceanographers,72
marine ecologists, modelers, social scientists and economists, who learnt73
interdisciplinarity and ‘systems theory’ during the writing of these drafts74
and from the experience of our Spicosa colleagues in applying the SAF.75

2 WHO ARE ‘YOU’ AND WHO ARE ‘WE’? 6
GOVERNANCE
CIVIL SOCIETY
SCIENCE
scientists
constitutional
collective
operational
government
communicationcommunicationspacespace
(know-ledge)
thetheSAFSAF(method)(method)
(deliberation)
(decision)
(decision)
model
environmentmanagers
Co-Management Scheme
stakeholders(legal and/or
moral interest)
DST
Figure 1: The SAF as an interface between ‘science’ and ‘policy’, with ‘sci-ence’ (the institution) providing scientific knowledge and expertise to ‘gov-ernance’ and ‘civil society’ . The human actors - or roles for them to play- are those of scientist, stakeholder and public official (either ‘policy-maker’in government, or environment manager applying this policy). People canplay several roles - for example acting as scientist in the day and as stake-holder during the evening. ‘DST’ stands for ‘Deliberation Support Tools’,and the ‘communications space’ allows exchange of information amongst thethree groups of actors, leading to better deliberation by the stakeholders.The argument is that communicative rationality – which emerges after freecommunication and deliberation – leads to collective rationality – the pro-cess of making decisions together that produces outcomes that are rationalfor a larger group, for instance concerning a social-ecological process thatis sustainable in the long run. (This argument derives, mainly, from JurgenHabermas (1984) The Theory of Communicative Action, Vol. 1: Reason and theRationalization of Society. Translated by T.McCarthy. Boston, MA: Beacon Press.We have added the part concerning sustainability.)

3 HOW TO USE THIS GUIDE 7
3 How to use this Guide76
This document gives an overview of the ‘Issue Identification’ and ‘System77
Design’ steps. It is a short guide, in essence a set of lists of things to do,78
with brief explanations of key ideas. We recommend that you:79
1. read the Guide once through completely, to understand the nature of80
the ‘Systems Approach Framework’;81
2. subsequently, work from the ‘to-do’ lists (in Tables 4, 7, 8, 9, and 10),82
referring to separate and more detailed handbooks when you need83
further guidance in technical tasks.84
There are a number of words, such as ‘stakeholder’, that we use, and85
want you to understand, with a particular technical meaning. These words86
are often emphasized in various ways - by the use of ‘inverted commas’ or87
italic font - and are briefly defined at points where the word appears in88
bold font. There are a few ideas that are crucial to understanding the89
SAF, and we present them (briefly) in sections 5 to 8. Following these are90
a set of sections (9 to 11) giving an overview of the SAF as a whole and91
guidance for starting a SAF application and deciding (in consultation with92
stakeholders) on the ‘Issue’ of concern. Finally, there are sections (12 to 16)93
that work through the tasks of ‘System Design’.94
The SAF web site at www.coastal-saf.eu offers additional resources. First,95
it provides a more dynamic and cross-linked version of the information con-96
tained here and in guides to other steps of a SAF application. Second, it97
houses detailed guides to methods ( some of these are listed as ‘Supporting98
Documents’ on the pages that start parts II and III of this guide). Third,99
it includes examples of results from most of the tasks and subtasks listed in100
the ‘to-do’ tables. Finally, it contains a more complete and more detailed101
glossary of Spicosa-related terms than we can provide here.102
4 THE APPLICATION TEAM 8
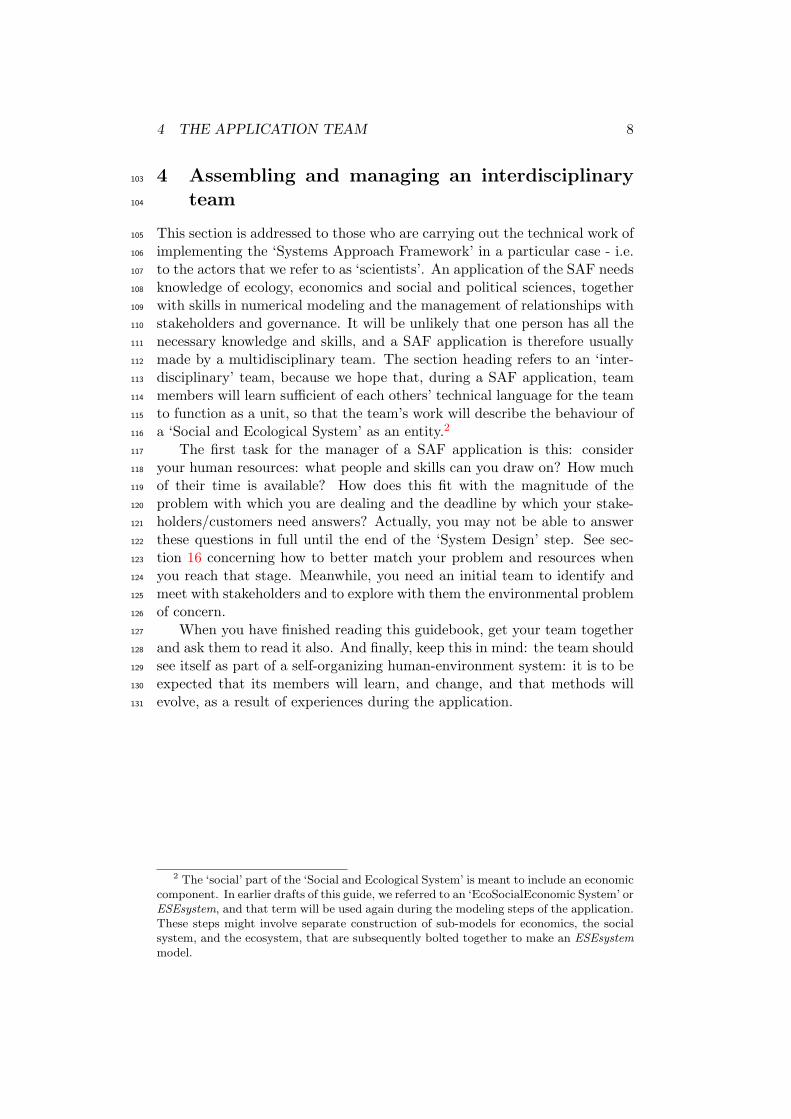
4 Assembling and managing an interdisciplinary103
team104
This section is addressed to those who are carrying out the technical work of105
implementing the ‘Systems Approach Framework’ in a particular case - i.e.106
to the actors that we refer to as ‘scientists’. An application of the SAF needs107
knowledge of ecology, economics and social and political sciences, together108
with skills in numerical modeling and the management of relationships with109
stakeholders and governance. It will be unlikely that one person has all the110
necessary knowledge and skills, and a SAF application is therefore usually111
made by a multidisciplinary team. The section heading refers to an ‘inter-112
disciplinary’ team, because we hope that, during a SAF application, team113
members will learn sufficient of each others’ technical language for the team114
to function as a unit, so that the team’s work will describe the behaviour of115
a ‘Social and Ecological System’ as an entity.2116
The first task for the manager of a SAF application is this: consider117
your human resources: what people and skills can you draw on? How much118
of their time is available? How does this fit with the magnitude of the119
problem with which you are dealing and the deadline by which your stake-120
holders/customers need answers? Actually, you may not be able to answer121
these questions in full until the end of the ‘System Design’ step. See sec-122
tion 16 concerning how to better match your problem and resources when123
you reach that stage. Meanwhile, you need an initial team to identify and124
meet with stakeholders and to explore with them the environmental problem125
of concern.126
When you have finished reading this guidebook, get your team together127
and ask them to read it also. And finally, keep this in mind: the team should128
see itself as part of a self-organizing human-environment system: it is to be129
expected that its members will learn, and change, and that methods will130
evolve, as a result of experiences during the application.131
2 The ‘social’ part of the ‘Social and Ecological System’ is meant to include an economiccomponent. In earlier drafts of this guide, we referred to an ‘EcoSocialEconomic System’ orESEsystem, and that term will be used again during the modeling steps of the application.These steps might involve separate construction of sub-models for economics, the socialsystem, and the ecosystem, that are subsequently bolted together to make an ESEsystemmodel.
5 HUMAN IMPACTS 9
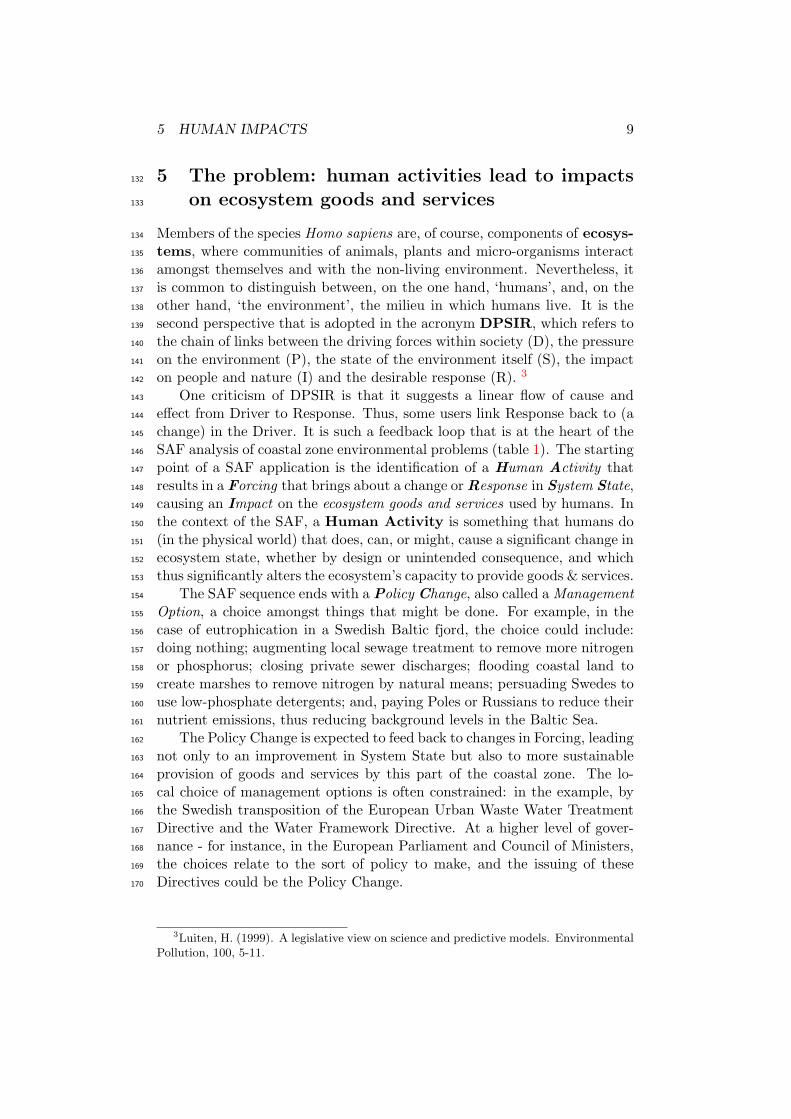
5 The problem: human activities lead to impacts132
on ecosystem goods and services133
Members of the species Homo sapiens are, of course, components of ecosys-134
tems, where communities of animals, plants and micro-organisms interact135
amongst themselves and with the non-living environment. Nevertheless, it136
is common to distinguish between, on the one hand, ‘humans’, and, on the137
other hand, ‘the environment’, the milieu in which humans live. It is the138
second perspective that is adopted in the acronym DPSIR, which refers to139
the chain of links between the driving forces within society (D), the pressure140
on the environment (P), the state of the environment itself (S), the impact141
on people and nature (I) and the desirable response (R). 3142
One criticism of DPSIR is that it suggests a linear flow of cause and143
effect from Driver to Response. Thus, some users link Response back to (a144
change) in the Driver. It is such a feedback loop that is at the heart of the145
SAF analysis of coastal zone environmental problems (table 1). The starting146
point of a SAF application is the identification of a Human Activity that147
results in a Forcing that brings about a change or Response in System State,148
causing an Impact on the ecosystem goods and services used by humans. In149
the context of the SAF, a Human Activity is something that humans do150
(in the physical world) that does, can, or might, cause a significant change in151
ecosystem state, whether by design or unintended consequence, and which152
thus significantly alters the ecosystem’s capacity to provide goods & services.153
The SAF sequence ends with a Policy Change, also called a Management154
Option, a choice amongst things that might be done. For example, in the155
case of eutrophication in a Swedish Baltic fjord, the choice could include:156
doing nothing; augmenting local sewage treatment to remove more nitrogen157
or phosphorus; closing private sewer discharges; flooding coastal land to158
create marshes to remove nitrogen by natural means; persuading Swedes to159
use low-phosphate detergents; and, paying Poles or Russians to reduce their160
nutrient emissions, thus reducing background levels in the Baltic Sea.161
The Policy Change is expected to feed back to changes in Forcing, leading162
not only to an improvement in System State but also to more sustainable163
provision of goods and services by this part of the coastal zone. The lo-164
cal choice of management options is often constrained: in the example, by165
the Swedish transposition of the European Urban Waste Water Treatment166
Directive and the Water Framework Directive. At a higher level of gover-167
nance - for instance, in the European Parliament and Council of Ministers,168
the choices relate to the sort of policy to make, and the issuing of these169
Directives could be the Policy Change.170
3Luiten, H. (1999). A legislative view on science and predictive models. EnvironmentalPollution, 100, 5-11.
5 HUMAN IMPACTS 10
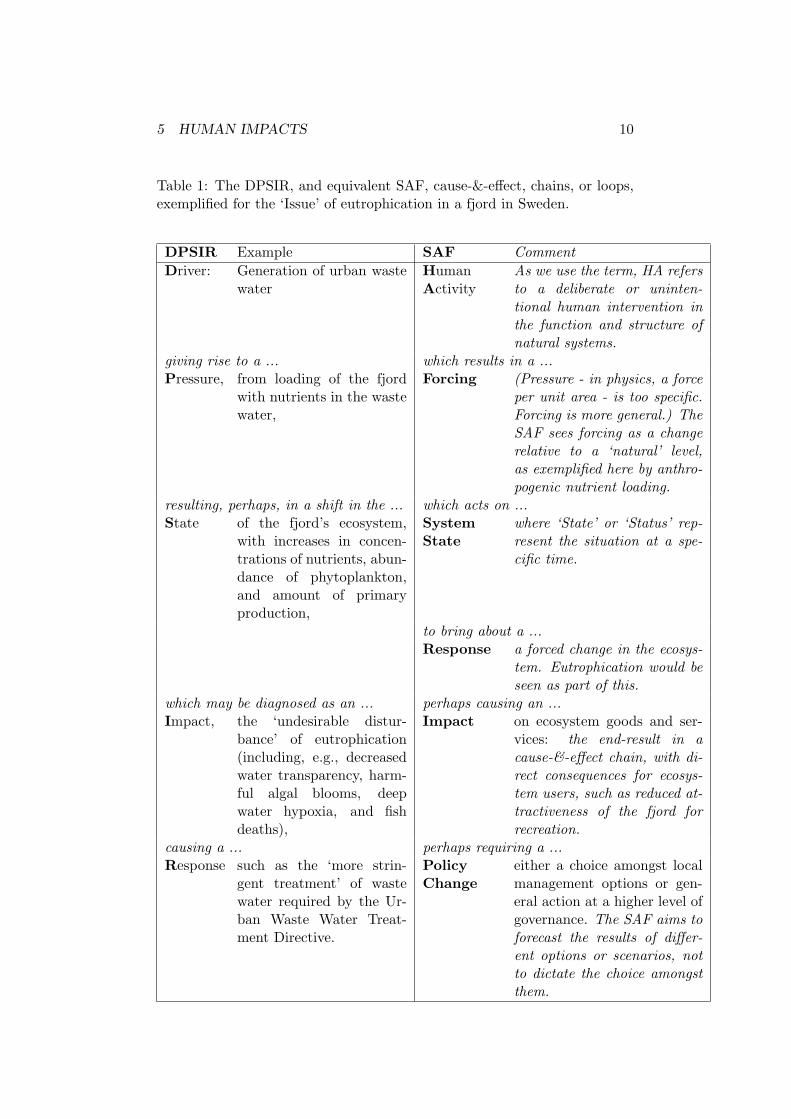
Table 1: The DPSIR, and equivalent SAF, cause-&-effect, chains, or loops,exemplified for the ‘Issue’ of eutrophication in a fjord in Sweden.
DPSIR Example SAF CommentDriver: Generation of urban waste
waterHumanActivity
As we use the term, HA refersto a deliberate or uninten-tional human intervention inthe function and structure ofnatural systems.
giving rise to a ... which results in a ...Pressure, from loading of the fjord
with nutrients in the wastewater,
Forcing (Pressure - in physics, a forceper unit area - is too specific.Forcing is more general.) TheSAF sees forcing as a changerelative to a ‘natural’ level,as exemplified here by anthro-pogenic nutrient loading.
resulting, perhaps, in a shift in the ... which acts on ...State of the fjord’s ecosystem,
with increases in concen-trations of nutrients, abun-dance of phytoplankton,and amount of primaryproduction,
SystemState
where ‘State’ or ‘Status’ rep-resent the situation at a spe-cific time.
to bring about a ...Response a forced change in the ecosys-
tem. Eutrophication would beseen as part of this.
which may be diagnosed as an ... perhaps causing an ...Impact, the ‘undesirable distur-
bance’ of eutrophication(including, e.g., decreasedwater transparency, harm-ful algal blooms, deepwater hypoxia, and fishdeaths),
Impact on ecosystem goods and ser-vices: the end-result in acause-&-effect chain, with di-rect consequences for ecosys-tem users, such as reduced at-tractiveness of the fjord forrecreation.
causing a ... perhaps requiring a ...Response such as the ‘more strin-
gent treatment’ of wastewater required by the Ur-ban Waste Water Treat-ment Directive.
PolicyChange
either a choice amongst localmanagement options or gen-eral action at a higher level ofgovernance. The SAF aims toforecast the results of differ-ent options or scenarios, notto dictate the choice amongstthem.

6 UNDERSTANDING SYSTEMS AND MODELS 11
6 Understanding systems and models171
An ecosystem is made of of living and non-living things interacting together.172
By analogy with this, we call the human part of the Coastal Zone a ‘socio-173
economic system’, and the whole thing an ‘social-ecological system’, where174
‘social’ includes ‘economic’. All this is compatible with the typical dictionary175
definition that a System is a set of things working together as a mechanism176
or interconnecting network. However, there is more to Systems Theory177
than this: systems have general properties (Table 2) above and beyond the178
properties of the ‘things’ that make up a system. An example is to be found179
in most household heating systems: the emergent property of temperature180
regulation derives from the system and not from the thermostat alone.181
Table 2: A descriptive definition of ‘System’
A system:– consists of parts and relationships or interactions amongst these parts;– often contains feedback loops which create emergent properties addi-
tional to those of the individual parts and relationships;– has boundaries in space and time, which define system extent and scale;– has an internal state, which responds to internal dynamics and trans-
boundary processes;– can contain a hierarchy of sub-systems; emergent properties of one level
appear as relationships at the next higher level.
Systems modeling is one of the main tools of the SAF. Several centuries182
ago, Adam Smith wrote: 4183
Systems in many respects resemble machines. A machine is a184
little system, created to perform, as well as to connect together, in185
reality, those different movements and effects which the [maker]186
has occasion for. A system is an imaginary machine, invented187
to connect together in the fancy those different movements and188
effects which are already in reality performed.189
The core idea here is that a system is an imaginary machine, something190
that captures the essence of reality but is less complicated. In the SAF, the191
imaginary machine, or the model, or the Virtual System as we’ll often call192
it, is constructed in three stages:193
4 The quote is from Smith’s essay on ‘Astronomy’ in Essays on Philosophical Subjects,1795, as given in the Introduction by A. Skinner to Smith’s The Wealth of Nations, PenguinBooks, London, 1986 reprint; the word ‘maker’, here, replaces ‘artist’ in the original.
6 UNDERSTANDING SYSTEMS AND MODELS 12
1. a conceptual model, typically, a drawing of system parts connected194
by arrows showing functional or cause-& effect relationships between195
the parts (as in fig. 6);196
2. a mathematical model, a set of equations that specify how each197
relationship works: exemplified on page 13;198
3. a numerical or simulation model, in most cases made using com-199
puter software to solve the equations and make quantitative predic-200
tions about the behaviour of the Virtual System (and, hopefully, the201
real system that it mimics).202
Your ‘imaginary machine’ does not need to take account of all reality in203
your coastal zone: it only has to capture the key features of the real system’s204
behaviour in relation to an identified problem, so that it can predict the205
outcome of different management options. Making the model is helped by206
recognizing that systems have boundaries and that these define the scale of207
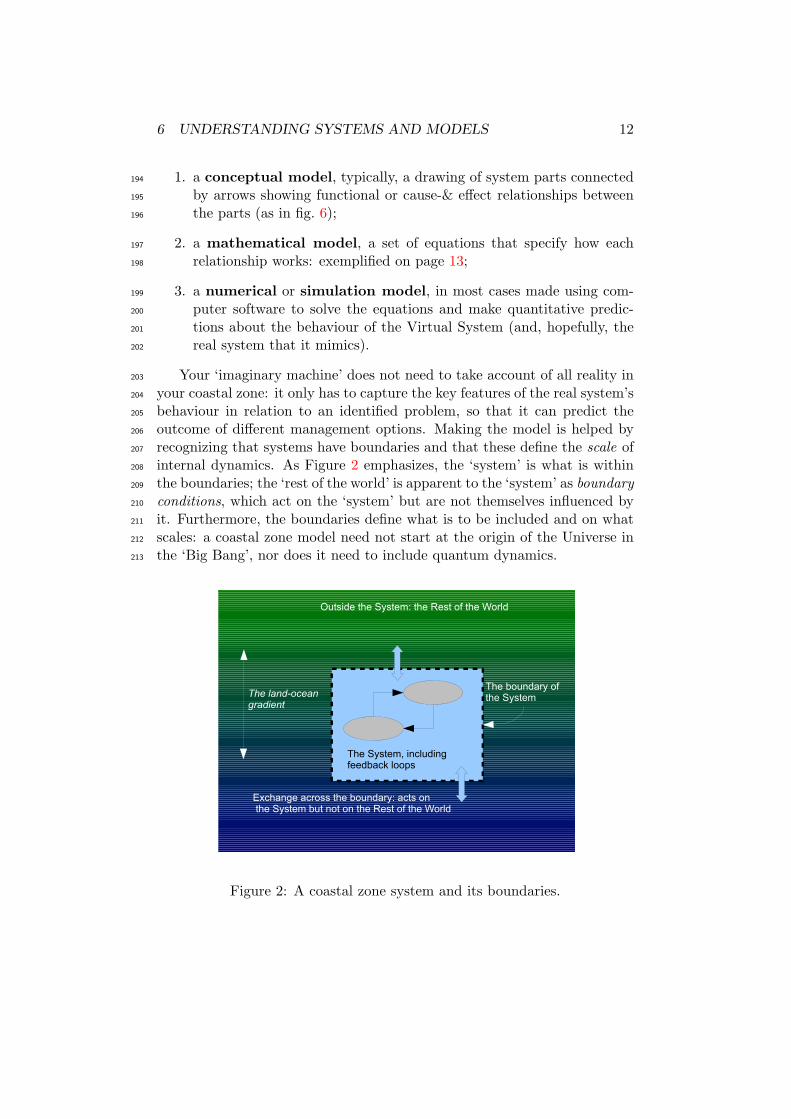
internal dynamics. As Figure 2 emphasizes, the ‘system’ is what is within208
the boundaries; the ‘rest of the world’ is apparent to the ‘system’ as boundary209
conditions, which act on the ‘system’ but are not themselves influenced by210
it. Furthermore, the boundaries define what is to be included and on what211
scales: a coastal zone model need not start at the origin of the Universe in212
the ‘Big Bang’, nor does it need to include quantum dynamics.213
The System, including feedback loops
Outside the System: the Rest of the World
Exchange across the boundary: acts on the System but not on the Rest of the World
The boundary of the SystemThe land-ocean
gradient
Figure 2: A coastal zone system and its boundaries.

6 UNDERSTANDING SYSTEMS AND MODELS 13
Box: a simple ecological model illustrating key terms
This example shows the conceptual model of a simple pelagic ecosystem as a singlebox with two state variables.
boundaryconditions:X
0, S
0
phytoplanktonX
nutrientS
SystemExchange
rate: E
e.g. contents of a fjord or estuary e.g. in the adjacent sea
The mathematical model includes a pair of differential equations, and the statevariables are the subjects of these equations:
rate of is defined by where the statechange: the equation variable is:
(phytoplankton)dX
dt= r ·X + E · (Xo −X) X (1)
(nutrient)dS
dt= − r·X
q + E · (So − S) S (2)
Change in the system depends on internal processes and on the effect of boundaryconditions. Water exchange between the system and conditions at or outside itsboundaries brings influxes E ·Xo and E ·So; the boundary effects are included in themodel by providing data either for these fluxes or for the exchange rate E and theboundary concentrations Xo and So. The outfluxes E ·X and E ·S are supposed tohave no influence on the boundary conditions. The internal processes include theeffects of phytoplankton increase rate, r, on amount of phytoplankton and, takingaccount of the coupling constant q, on amount of nutrient. Feedback from nutrientsand phytoplankton to r can be provided by an equation such as:
r = rmax · (1−X
Xmax) · S
kS + S(3)
Like q, Xmax and kS are likely to have constant values in any one application ofthe model. It is, however, better to refer to each as a parameter (Greek: ‘auxilarymeasure’), because their values may depend on the type of phytoplankton or localconditions, rather than being universally constant.
The scale of the model is set by its extent and grain. In this single-box model, spatialextent (the distance between boundaries), and grain, are the same. Thus, exchange rate, theprobability that, in a given time, any small packet of water inside the box may be swoppedwith a packet from outside the boundary, combines - and therefore does not distinguish asmore detailed models might - the effects of smaller-scale water movements. If the modelis used to simulate day-to-day changes during a year, then temporal graininess, such ashour-to-hour changes in exchange due to tide or wind, need not be explicitly represented,net effects being averaged over 24 hours. The parameter rmax might vary during a dailycycle because of the effect of changing illumination on phytoplankter photosynthesis, butthis high-frequency variation could be neglected in a seasonal cycle model by expressingrmax as a simple function of 24-hr mean illumination.
214
7 UNDERSTANDING SOCIETY 14
7 Understanding stakeholders, institutions, gov-215
ernance, laws and environmental management216
Stakeholders, and people representing governance, are key players in a SAF217
application. The two groups may overlap. Furthermore, they are also part218
of the real Coastal Zone system, and may enter into the ‘virtual system’ that219
is to be described in a model. In order to explain them further, we need to220
say something about ‘society’ (in the Coastal Zone).221
Society is made up of people and the links between them. Some of these222
links are transient and small-scale: peoples’ relationships with their neigh-223
bours, for example. In addition, the pattern of, or the information in, links224
has some existence in its own right, and is built up, handed on, and evolves,225
from generation to generation. We’re speaking of ‘culture’ and ‘norms’ here,226
the kind of rules that people obey when, in certain cultures men raise their227
hats to ladies, and in others, women cover their heads in the presence of228
males. Sets of rules that become formalized are called institutions, a word229
also used for the organizations and the buildings where people work under230
these rules. Societies can be mapped or modeled in terms of the relation-231
ships between institutions, as we’ll see, and the ‘social capital’ of a society232
lies in its institutions and its local networks of trust.233
Churches, fishermen’s co-operatives, and industrial businesses are all ex-234
amples of institutions. Over-arching all of these, in an ordered society, is235
‘Government’, made up of deliberative, executive, legal, and police, systems.236
These ruling institutions are collectively called governance, defined as the237
act or manner of, or the system for: ruling or controlling the subjects or238
citizens of a State; or, conducting the affairs of an organization. The word239
derives from the Latin ‘gubernator’ and that from a classical Greek word240
for the person who steers a ship - who is helmsman, navigator and captain.241
In modern states, and other large institutions, governance takes place on242
several scales. We distinguish three of these. The operational level is, in our243
context, the level at which the direct interaction between human activity and244
the biophysical resources takes place, and at which stakeholders or public245
officials implement rules dealing, for example with public access to the shore246
or the contents of individual sewage discharges. Rules on the collective level247
govern the management of coastal resources; they tell how the decisions248
leading up to rules on the operational level are to be made: for instance, who249
is in position to make decisions, who can block decisions, how decisions are250
made (unanimous or simple majority), the amount of information required251
etc. At the constitutional level, rules specify how changes in the management252
of coastal resources can be made - e.g., how lower level rules or governing253
bodies can be changed.254
We define environmental management as ‘governance’ extended to255
ecosystems, with the aim of sustaining an ecosystem’s ability to provide goods256

7 UNDERSTANDING SOCIETY 15
and services; it includes the prevention of pollution, the conservation of257
species and habitats, and the remediation of damaged ecosystems. An ‘envi-258
ronment manager’ is a public official who carries out environmental manage-259
ment; on the operational level, managers plan or consent individual Human260
Activities (HAs) taking account of their likely environmental impact; at the261
collective level, they make environmental plans or oversee the implementa-262
tion of environmental policy, at the constitutional level they decide policy263
or support legislators who make environmental law. It is likely that some of264
these managers will play an important part in a SAF application.265
In a democracy, of course, all citizens have a stake in their Governments,266
but there is a difference between ‘citizen-voter’ and ‘stakeholder’ as we will267
use the words here. Governments are elected to deal with many aspects268
of society. In the SAF you will focus on just one ‘Issue’, meaning a set of269
matters related to a coastal zone problem (or group of related problems)270
arising from a Human Activity. A stakeholder is an organisation, commu-271
nity or individual who has a ‘stake’ in that ‘Issue’ because they are concerned272
about it, potentially or actually affected by it, or have or want a voice in the273
making of decisions about it. The words ‘stake’, ‘interest’ and ‘concern’ are274
interlinked, and carry with them, in our usage, some sense of a moral right275
to be consulted about any proposal or plan than might have an effect – for276
better or for worse – on the stakeholder. Some stakeholders carry out the277
harmful HAs and others are affected by consequent impacts. A third group278
might presently be unaffected but might be affected by remedial measures -279
for example, they might have to pay the cost of these, or suffer a new sewage280
treatment works to be build close to their houses.281
In implementing the SAF you will need to know something about the in-282
stitutions, and the categories of stakeholders, in your coastal zones, relevant283
to the problem you address. There are tools for getting this information:284
institutional mapping : a process of analysis for identifying the rules285
governing the relations between organisations, groups and individuals,286
optionally resulting in a diagram; in a hierarchical system this analysis287
may focus on the relationships between institutions, including gover-288
nance; all of which are themselves sub-systems;289
stakeholder mapping : a subset of institutional mapping that involves290
the identification of stakeholder groups relevant to a particular matter,291
such as a HA, impact, public environmental policy, or ‘Issue’.292
Environment managers, members of governance institutions, might also293
be seen as stakeholders. We prefer to distinguish them because of their294
specialized role in a SAF application.295

8 UNDERSTANDING ECOLOGICAL ECONOMICS 16
8 Understanding ecological economics296
The ‘eco’ components in ‘ecology’ and ‘economics’ have a common origin297
in the Greek word oikos for ‘house’, and so ‘economics’ may be thought298
of as ‘rules for housekeeping’ in human society, and ‘ecology’ the ‘study of299
(nature’s) household’. However, there is a difference between the real world300
in which ecosystems are to be found, and the world of economics and money301
that some people refer to as ‘real’, but isn’t. To explain the difference, we302
will introduce the three ‘worlds’ postulated by Karl Popper. 5 They are:303
1. the real, physical, world, in which exist ecosystems including their304
fleshy human component;305
2. each human mind (Descartes: “cogito ergo sum”);306
3. the world of information, shared amongst humans in the form of nar-307
ratives, pictures, computer programs, cultural norms, laws, etc.308
Ecology is world 1 (but understanding of it is in world 2 or 3, and system309
models will be made in world 3). Economies, defined in money terms (for310
example when Gross National Product is cited), are in world 3. If we define311
the purpose of an economy as the ‘efficient satisfaction of human well-being312
needs’ then those needs are, properly, in world 2. People need food, drink,313
etc for their corporeal bodies, of course, but their perceived needs are in their314
minds. As figure 3 shows, there are three routes to satisfying these needs:315
by central allocation of resources (‘hierarchies’), by local social networks316
(‘collective arrangements’), or by way of the impersonal market.317
eco-system(state)
goods &services
social system
governance
market satisfaction
of humanwell-being
sustainability efficiency equity
hier-archies
collectivearrange-ments
natural economic social capitalcapital capital
pressure
Figure 3: An ecological-social-economic (ESE) system
5 Popper, K. (1972). Objective knowledge: an evolutionary approach, Oxford Univer-sity Press.

8 UNDERSTANDING ECOLOGICAL ECONOMICS 17
Modern markets operate with the aid of money. The ‘use-value’ of ob-318
jects can lie in any of the three worlds, but the ‘exchange-value’, or monetary319
worth, of a good or service is strictly a world 3 entity. Money is both in-320
formation (about this valuation) and institutionalized trust, a promise to321
provide some use-value on demand. The idea of ecosystem goods and322
services provides the link between world 1 ecosystems and world 3 societies323
and economies. We define them as the material and non-material things that324
ecosystems supply to humans, including ecosystems’ capacities to assimilate325
wastes as well as provide tangible and intangible resources. They are cat-326
egorized in Table 6, where we follow standard practice and refer only to327
services, classing ‘goods’ as a provisioning service.328
Ecological economists make several criticisms of classical economics.6329
One criticism is that it deals only with what humans do to satisfy well-being330
needs: what we spend, what we pay each other. A second is that it recog-331
nizes only the several sorts of human capital that have been amassed to make332
the production of goods and the supply of services more efficient: durable333
capital, intellectual capital, financial capital. Thus, classical economics does334
not take account of natural capital, which needs to be maintained if a sys-335
tem is to be sustainable, and it does not take account of ‘externalities’ -336
the uncosted effects of human activities on other humans and the environ-337
ment. Ecological economics takes these into account in seeking to ensure338
that ‘goods and services’ are used both efficiently (the aim of economic339
management) and sustainably (the aim of environment management).340
As an example, let’s look at eutrophication in a Swedish fjord. Food341
webs depend on primary production. Nutrients are compounds of nitrogen342
and phosphorus; their scarcity in most pristine coastal seas restricts the343
amount of organic matter that phytoplankton, seaweeds and seagrasses can344
manufacture using the energy of sunlight, and so set a limit to the num-345
ber of animals dependent on this food, and the amount of fish that can346
be harvested. Human activities (such as the production of sewage, or the347
fertilization of farmland) increase the supply of nutrients to the sea, and so348
increase primary production. Hence: more fish or shellfish for harvesting,349
but, also, problems such as hypoxia in fjord basins, which might kill fish,350
and decreases in water clarity, which might decrease the attractiveness of351
recreational waters to visitors. Behind such obvious effects, there is hidden352
service provided by the sea: that of recycling nutrients safely. Humans need353
to take account of the value of such services in making the economic case to354
build and operate a sewage treatment plant. Otherwise, the use of the sea355
as a dumping place for sewage might seem the cheaper option.356
6 In writing ‘ecological economists’ we are merging two somewhat distinct groups:‘environmental economists’, who emphasize efficiency of resource use; and ‘ecologicaleconomists’ proper, who emphasize sustainability and social considerations. See: vanden Bergh, J. C. J. M. (2001) Ecological economics: themes, approaches, and differenceswith environmental economics, Regional Environmental Change, 2, 13-23.
18
Part II357
Getting started358
A SAF application starts by identifying an ‘Issue’ (in discussion with stake-359
holders and/or ‘governance’), and by confirming that the SAF is an appro-360
priate tool for working on it.361
Supporting documents available from: www.coastal-saf.eu
Levrel, H., Couvet, D., Mette, A.and Raux, P. (2011)
Scenarios in the System Design, SPI-COSA Project Report, ??: ???,
Mongruel, R., Levrel, H. and Math-ews, M. M. (2011)
Defining Economic Dimensions ofCoastal Systems, SPICOSA ProjectReport, Brest: Ifremer.
Vanderlinden, J.-P., Stojanovic,T., Schmueli, D., Bremer, S.,Kostrzewa, C. and McFadden, L.(with others) (2011)
The SPICOSA Stakeholder-PolicyMapping Users Manual, with workedexamples, SPICOSA Project Report,Guyancourt: Paris, Universite deVersailles-Saint-Quentin-en-Yvelines.

9 THE STEPS OF A SAF APPLICATION 19
9 The steps of a SAF application362
Here are the steps of a SAF application (Figure 4):363
Issue Identification : consult with stakeholders and environment man-364
agers to identify the ‘Issue’, a Coastal Zone ‘problem’ involving a365
cause-&-effect chain from a HA to its impact on ecosystem goods and366
services; agree remedial ‘scenarios’ or management options with stake-367
holders;368
System Design : identify and describe a ‘virtual system’ that embodies369
sufficient real-world behaviour to allow this problem to be explored370
through modeling, and begin to prepare for simulation modeling;371
System Formulation : build conceptual, mathematical and numerical372
models for use in simulating system behaviour or its ecological, eco-373
nomic and social components; get data needed by these models;374
System Appraisal : test your model(s) against observations on the real375
system; where necessary link the separate components and use the376
final model to explore the implications of the management scenarios;377
System Output : take your results back to the stakeholders, explain what378
has been done and help the stakeholders to deliberate on their choice379
amongst options, using the results simulated for each scenario.380
SYSTEM DESIGN:define a 'virtual system' based on relevant inter-
actions in the coastal zone socio-ecosystem
SYSTEM OUTPUTreport to stakeholders & managers
and support theircontextualization, evaluation, and deliberation, of scenarios
SYSTEM FORMULATION: build conceptual
and simulation models of the ecological,
social and economicparts of the 'virtual system'
SYSTEM APPRAISAL:link model parts,
test system model against datasimulate scenarios
conduct interpretive analysis
A SAFapplicationis com-missioned:start here
SPISPI
iterate as necessary
ISSUE IDENTIFICATION(in consultation with stakeholders
and managers) diagnose dysfunction and agree policy/management
options and indicatorsa
coastal zone'socio-ecosystem'
dysfunction
Figure 4: The steps of a SAF application. ‘SPI’ is the science-policy interfaceof Fig. 1. ‘Socio-ecosystem’ abbreviates social and ecological system.
10 IS YOUR APPLICATION REALLY NECESSARY? 20
This guide deals with the ‘Issue Identification’ and ‘System Design’ steps.381
Originally they were seen as a single step, but matters relating to starting a382
SAF application proved complex, and so we’ve separated them from ‘System383
Design’ proper. Starting an application involves not only identifying an384
‘Issue’ to work with, but also answering two questions: ‘who initiates an385
application?’ and, ‘is a SAF application really necessary?’ If the answer to386
question 2 is ’no’, then the application stops at that point, perhaps already387
having done some good by clarifying the nature of the problem.388
If some ‘Issues’ are too simple to justify the time and resources required389
for a SAF application, others might seem too demanding: see section 16390
about scaling the application to the available skills and time. The System391
Formulation and System Appraisal steps make heavy demands on the time392
and skills of modelers. 7 In other cases it may be possible to go directly393
from ‘Design’ to ‘Output’, the design of a ‘virtual system’ in consultation394
with stakeholders being sufficient in itself to help stakeholders’ deliberations.395
All-in-all, do not treat this guidebook as dogma or a set of instructions that396
must be strictly observed. The SAF itself is a system, and may be adapted397
to, or evolve in response to, particular applications, so long as it remains398
informed by ‘systems thinking’.399
Finally, a caution. The SAF is a rational, ‘Enlightenment’, method.400
Given adequate data it should point to an optimum choice amongst man-401
agement options. However, what will be chosen by a particular group of402
stakeholders will be constrained by law, culture and the existing distribution403
of power in the coastal zone society. ‘System Design’ tasks include a study404
of these constraints, but it should not be the aim of the SAF application405
to change them, except insofar as the provision of knowledge is empower-406
ing. You should be satisfied with any outcome that increases coastal zone407
sustainability.408
10 Is your application really necessary?409
A SAF application is appropriate only for some social-environmental prob-410
lems. Figure 5 provides a flow diagram to help in deciding whether or not411
an application is required. This decision will, typically, be reached during412
the ‘Issue Identification’ task.413
7 Spicosa has made a library of model blocks, using ExtendSim software, to help them.

10 IS YOUR APPLICATION REALLY NECESSARY? 21
A problem identified by or presented to a
coastal zone environment manager
scientist-led, research driven, identification of
emerging problems
Stakeholder concernsarising in a public arena
such as politics or an ICZM forum
Is the problem made up of
multiple interconnected elements?
It has a single elementthat either can be dealt with
by management orcannot be solved in
the local context
Is solving the problem of high priority? (i.e. important to
stakeholders, having a
signifant impact onan important
ecosystem, etc)
provide background ofinformation about the
ecological, socialand economic systems
relate to ongoing policy (e.g. WFD implementation)
Can the problem be solvedwith existing knowledge
of the ESE system?
You have begun the SAF process and the 'System Design' step:continue with the 'Issue Resolution' task
Yes
Yes
No
EXIT
No
Really? Test: can youidentify management strategy to implement
a solution?
Yes
Yes
NoNo
Figure 5: Is a SAF application necessary? A decision diagram.

11 AGREEING THE ‘ISSUE’ 22
11 Discussing and agreeing the ‘Issue’414
A SAF application starts with the task called ‘Issue Identification’. ‘Once415
upon a time,’ our tale might begin, ‘scientists were talking together, when416
a stakeholder rushed into the room and said, “I’ve been impacted by a Hu-417
man Activity, and something must be done!”. Whereupon the scientists got418
together with other stakeholders and with environmental managers, identi-419
fied the cause-&-effect chain from HA to impact, who was responsible for420
the HA, who was affected by it, what the economic consequences were, and421
some management options for ameliorating the impact. And thus ‘Issue422
Identification was accomplished and the SAF application got underway.’423
In reality, the application might be initiated by stakeholders who seek424
better information to help them choose amongst management options al-425
ready proposed, for example, by regional planners. Or the starting gun426
might be fired by local environment managers, who have themselves identi-427
fied an environmental problem, or know that they soon have to implement428
a new law, and would like more information about the consequences of their429
planned actions. Or scientists themselves may start the process, through430
their own concern about an environmental problem, or their need to fund431
their work. In many cases the kick-off will be a messy process, involving re-432
peated meetings between the three groups of actors, during which the essence433
is slowly distilled from of an initially confusing set of problems, perceived434
impacts, and potential solutions435
This essence should be a well-defined HA-forcing-impact problem and436
its management options. We call the set of problem and options, the Issue,437
and the process of identifying it is, logically, called Issue Identification.438
Note that this task is about defining the Issue, 8 and not about solving the439
HA-impact problem, either now or later. A SAF application does not aim440
to solve problems, merely to give advice to stakeholders and environment441
managers, so that they can better deliberate about the options available to442
them. Sometimes solution will be achieved by the discussion that starts ‘Is-443
sue Identification’. The SAF application need continue only if there remain444
uncertainties or disagreements that can be reduced by scientific study.445
Questions may arise about who pays for that scientific study: we don’t446
address those here but see section 16 about adjusting the SAF application447
to fit within the resources of time, people, skills and equipment available448
to the scientific team. Consider, also, a stakeholder’s own deadlines. If a449
decision has to be made about a choice of management options within 6450
months, then later information will be no use.451
It is usually not feasible to engage with large groups of stakeholders452
during Issue Identification. Instead, aim to work with a small group of453
8In earlier versions of the SAF guides, the task was called ‘Issue Resolution’, from themetaphor of bring the problem into focus by adjusting a telescope.

11 AGREEING THE ‘ISSUE’ 23
environment managers and representatives of stakeholder concerns. We’ll454
call this the Reference Group, because matters are referred to them. 9455
Table 3 contains an example ‘Issue’, and Table 4 lists sub-tasks and456
action points for this step. The subtasks include the identification, not only457
of the environmental problem, but also of who is involved and what is likely458
to determine the economic costs and benefits of the problem and the options459
for dealing with it. Indicators of the state of the social-ecological system460
will be needed. The example uses ‘water transparency’ as an environmental461
indicator. It is easy to measure, widely understood, clearly relevant to the462
Issue of Eutrophication, and allows the success of management options to463
be assessed. The socio-economic indicator is the annual number of visitors464
to the fjord, considered as either an index of social satisfaction with water465
quality, or a proxy for money income from tourists.466
Finally, note that the SAF requires simulation and appraisal of system467
state under several scenarios. Think of these as ‘what-ifs’. What would468
happen if management option B were chosen instead of A? 10 A SAF appli-469
cation aims to compare consequences in a safe ‘virtual’ world.470
Table 3: Example Policy Issue
Site: A fjord in Sweden, south of StockholmReference group : About a dozen, including farmers, private citizens,
elected representatives, officials from municipal au-thorities and the Environment Protection Agency
Human Activities: Discharges from Sewage Treatment Plants, agricul-ture, and private sewers
Forcing: Enrichment of the fjord with nutrientsImpact: Degradation of water quality which can deter tourists(Policy) Issue: EutrophicationManagement options(scenarios):
(i) increased stripping of nitrogen from STW dis-charge; (ii) connection of private sewers to public STWplant; (iii) change in farming practices so that smaller amouts of nitrogen compounds enter the fjord
Social concerns: Desire for ‘clean’ water in fjord, distribution of costsamongst stakeholder groups.
Economic aspects: Costs of sewage treatment, benefits of leisure visitsProvisional Indicators: Water transparency, number of visitors during year
9 In earlier drafts the term ‘Stakeholder Participant Group’ was used10 Previous versions of this handbook referred to ‘policy option’. ‘Management option’
seems the better term when dealing with choices at the operational level of governance;‘policy option’ could be used when working at collective or constitutional levels.
11 AGREEING THE ‘ISSUE’ 24
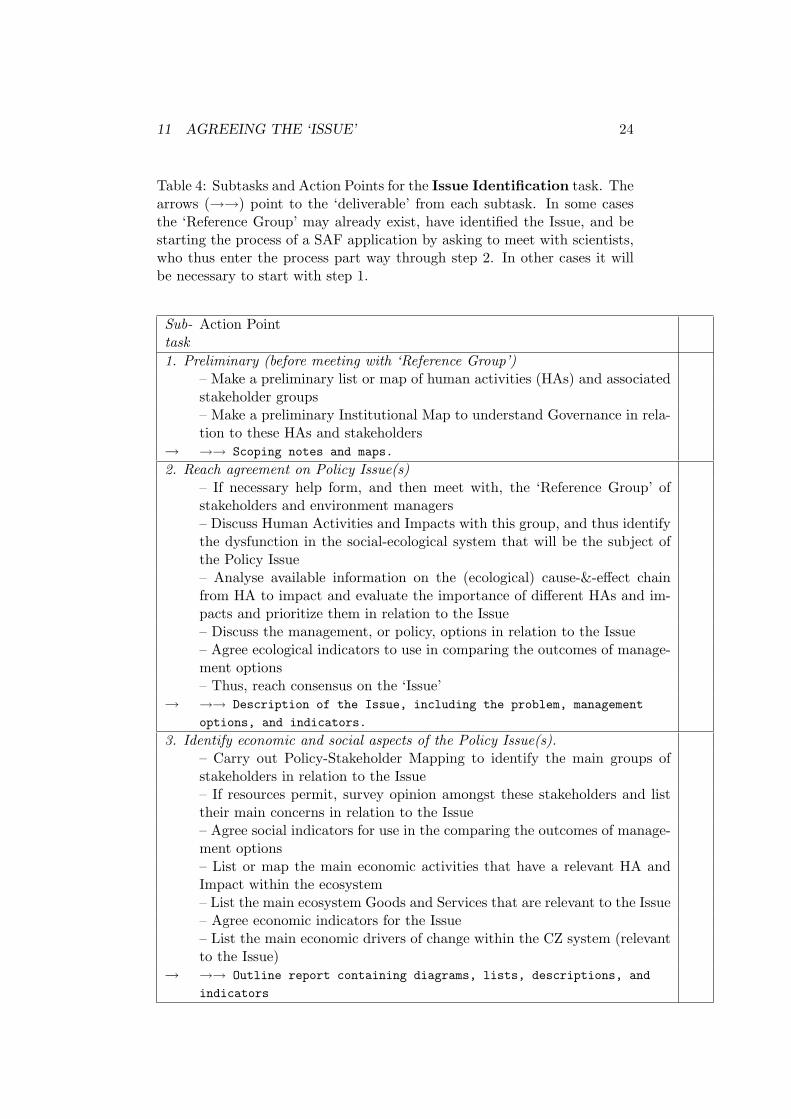
Table 4: Subtasks and Action Points for the Issue Identification task. Thearrows (→→) point to the ‘deliverable’ from each subtask. In some casesthe ‘Reference Group’ may already exist, have identified the Issue, and bestarting the process of a SAF application by asking to meet with scientists,who thus enter the process part way through step 2. In other cases it willbe necessary to start with step 1.
Sub-task
Action Point
1. Preliminary (before meeting with ‘Reference Group’)– Make a preliminary list or map of human activities (HAs) and associatedstakeholder groups– Make a preliminary Institutional Map to understand Governance in rela-tion to these HAs and stakeholders
→ →→ Scoping notes and maps.
2. Reach agreement on Policy Issue(s)– If necessary help form, and then meet with, the ‘Reference Group’ ofstakeholders and environment managers– Discuss Human Activities and Impacts with this group, and thus identifythe dysfunction in the social-ecological system that will be the subject ofthe Policy Issue– Analyse available information on the (ecological) cause-&-effect chainfrom HA to impact and evaluate the importance of different HAs and im-pacts and prioritize them in relation to the Issue– Discuss the management, or policy, options in relation to the Issue– Agree ecological indicators to use in comparing the outcomes of manage-ment options– Thus, reach consensus on the ‘Issue’
→ →→ Description of the Issue, including the problem, management
options, and indicators.
3. Identify economic and social aspects of the Policy Issue(s).– Carry out Policy-Stakeholder Mapping to identify the main groups ofstakeholders in relation to the Issue– If resources permit, survey opinion amongst these stakeholders and listtheir main concerns in relation to the Issue– Agree social indicators for use in the comparing the outcomes of manage-ment options– List or map the main economic activities that have a relevant HA andImpact within the ecosystem– List the main ecosystem Goods and Services that are relevant to the Issue– Agree economic indicators for the Issue– List the main economic drivers of change within the CZ system (relevantto the Issue)
→ →→ Outline report containing diagrams, lists, descriptions, and
indicators
25
Part III471
System Design472
This part explains, briefly, how to carry out the ‘System Design’ step in473
a SAF application. It includes tables of tasks and action points, and the474
‘deliverables’ from these actions points.475
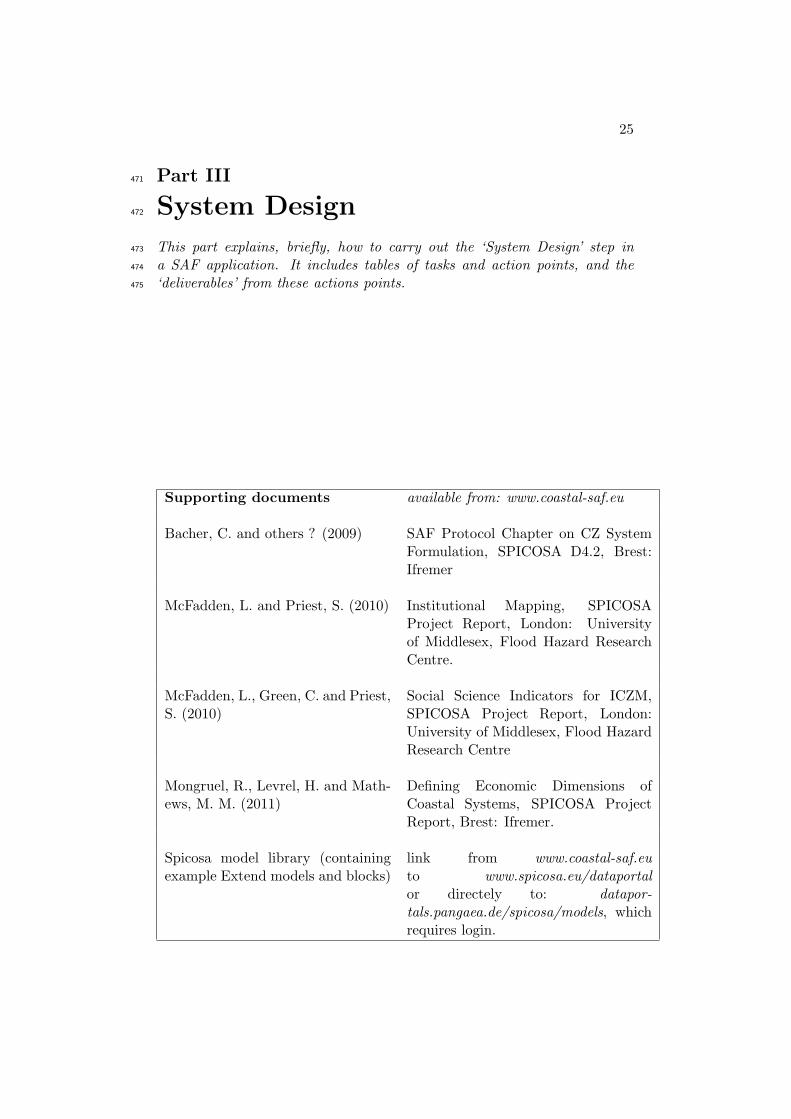
Supporting documents available from: www.coastal-saf.eu
Bacher, C. and others ? (2009) SAF Protocol Chapter on CZ SystemFormulation, SPICOSA D4.2, Brest:Ifremer
McFadden, L. and Priest, S. (2010) Institutional Mapping, SPICOSAProject Report, London: Universityof Middlesex, Flood Hazard ResearchCentre.
McFadden, L., Green, C. and Priest,S. (2010)
Social Science Indicators for ICZM,SPICOSA Project Report, London:University of Middlesex, Flood HazardResearch Centre
Mongruel, R., Levrel, H. and Math-ews, M. M. (2011)
Defining Economic Dimensions ofCoastal Systems, SPICOSA ProjectReport, Brest: Ifremer.
Spicosa model library (containingexample Extend models and blocks)
link from www.coastal-saf.euto www.spicosa.eu/dataportalor directely to: datapor-tals.pangaea.de/spicosa/models, whichrequires login.

12 THE TASKS IN SYSTEM DESIGN 26
12 The tasks in System Design476
The System Design step is made up of the tasks listed in table 5, and477
described in more detail in sections 13 through 16. There is a table of478
subtasks and action points for each task. In these detailed task tables,479
the arrows (→→) point to the ‘deliverable’ from each subtask, the concrete480
outcome that shows that the subtask has been completed. Examples of these481
deliverables may be available on the coastal-saf website.482
Table 5: The tasks and subtasks of the ‘System Design’ step of the SAF
1 System Definition: section 13, table 7.1.1. Define the Coastal Zone Virtual System1.2. Identify the external hazards1.3. Synthesize the state of the impacted system
2 Conceptual Models: section 14, table 8.2.1. Construct conceptual models of the Coastal Zone Virtual System2.2. Specify model outputs for later use.
3 Methods & Information required: section 15, table 9.3.1. Identify the modelling software and analytical methods to be used.3.2. Analyse the economic dimensions and identify suitable methodologies.3.3. Begin to acquire data.
4 Problem Scaling: section 16, table 10.4.1. Adjust the complexity of the Virtual System for scientific accuracy andbalance and for feasability in implementation4.2. Begin to specify the formats for scientific publication and popular presen-tations of results4.3. Update the ‘Designed System Report’

13 DEFINING A VIRTUAL SYSTEM 27
13 System Definition: describing the real coastal483
zone system, defining a Virtual System484
This task (Table 7) requires description of relevant features of a Coastal485
Zone and definition of a Virtual System that contains only features relat-486
ing to the identified ‘Issue’. The distinction between, on the one hand, the487
complicated real Coastal Zone system, which includes both ‘world 1’ ecosys-488
tems (with their human populations and physical infrastructure) and ‘world489
3’ economies and social institutions, and, on the other hand, the ‘world 3’490
virtual machine that will enable you to predict the outcome of management491
options or policy scenarios, is crucial to the SAF. In ‘System Design’, it is,492
of course, the Virtual System that is being designed: the real world can only493
be described. As you move on to ‘System Formulation’, some parts of this494
virtual machine will be made into mathematical and simulation models.495
During the ‘System Definition’ task of ‘System Design’, however, your496
main tools are written words, arranged in lists of key features and in narra-497
tives of the relevant politics and geography of the study area. A good narra-498
tive links the items of a list in an explanatory, sometimes causal, framework.499
Maps play a useful supporting role. There are two sorts of maps: those that500
show a territory realistically but at a much smaller scale, and those that,501
like most maps of city transport networks, emphasize functional links rather502
than exact spatial relationships. It is a small step from such simplified503
maps to those that are purely conceptual, such as those that show power504
relationships between institutions.505
Spatial averaging, categorization and typification are further aids to sim-506
plification. For instance, real world systems can often be mimicked by a507
small set of boxes, or even by one box, in a Virtual System, as illustrated508
by the simple model on page 13. Stakeholder mapping involves grouping509
stakeholders, and is aided by recognizing essential features to allow use of510
prior knowledge of types. ‘These are farmers, therefore they plough and sow511
. . . and use fertilizers.’ In the case of eutrophication as an ‘Issue’, it may512
be acceptable to define all phytoplankters as a single entity in the virtual513
system. But don’t go too far: do not homogenize two categories whose514
distinction is of the essence of the ‘Issue’. For example, the definition of eu-515
trophication includes the idea of ‘disturbance to the balance of organisms’,516
and the relevant Virtual System may thus need at least two phytoplankton517
components. Using one box to represent the whole of the physical system518
may make it difficult to simulate water exchange driven by a two-layer estu-519
arine circulation. ‘Farmers’ may actually fall into two groups: those using520
conventional methods including much inorganic fertilizer, and those using521
‘organic’ methods resulting in less leakage of nutrient.522
The task of ‘System Definition’ starts by looking at the cause-&-effect523
chain within the impacted ecosystem. The Virtual System that you are de-524

13 DEFINING A VIRTUAL SYSTEM 28
signing is, however, a social as well as an ecological system, and so you need525
also to identify relevant economic and social features. Table 6 brings an526
economic perspective. Stakeholder Mapping and Institutional Mapping will527
help to complete your lists, which should include relevant organs of govern-528
ment and their roles. Key questions here concern the interaction between529
services and capitals, the ownership of capitals and access to services by dif-530
ferent stakeholder groups, the role of laws and cultural norms in determining531
this at the operational and (local) collective levels. How do these relate to532
the Issue, which will change, or need to change, in the different management533
options? Some of them might become components of the models, others used534
to appraise the outcomes of the different scenarios.535
You need to identify the boundaries of your Virtual Coastal Zone. These536
may be administrative boundaries, or those set by topography, in the phys-537
ical world. The essential feature of the boundaries of a Virtual System is538
that they separate a domain in which modeled processes can interact, from539
an ‘outside’ which will be represented by boundary conditions. As il-540
lustrated on page 13, boundary conditions can be set either as the state541
of the external world at the Virtual System boundary, or the fluxes across542
that boundary. As an example, consider the rivers that drain into a coastal543
sea. Does the river catchment need to be part of the Virtual System, or can544
it be placed outside the boundary and its effect simulated by data about545
discharge of water, sediments, dissolved substances, etc.?546
Sub-task 2 concerns Risk. Think about what might go wrong as a re-547
sult of events beyond the boundaries of your system. What are the likely548
major hazards, and what is the likely probability of their occurrence?11 For549
example, around the Mediterranean basin, and in other tectonically active550
zones, the hazards include earthquakes and volcanic eruptions, and the pos-551
sibility of these may influence choice between management options. Some552
may be more resilient against physical damage. What about socio-economic553
hazards, such as collapse in governance, or global economic recession?554
The Reference Group of stakeholders etc. should be consulted again,555
towards the end of this task. Does your Virtual System definition corre-556
spond with the way in which they see things? Bear in mind that multiple557
representations of the real system are possible; it may be understood, and558
defined by more than one Virtual System. This does not mean that truth is559
relative to the observer. A defined Virtual System must be compatible with560
existing information about the real Coastal Zone system, and the results of561
the models of the Virtual System, must agree with observations in the real562
system. This agreement will be explored in the ‘System Appraisal’ step of563
the SAF application.564
11 Risk is formally defined in this context as the probability of something (bad) hap-pening, multiplied by the intensity of the hazard. Risk can be reduced by decreasing theprobability of occurrence, or ameliorating the hazard itself.

13 DEFINING A VIRTUAL SYSTEM 29
Table 6: Including economics in the Virtual System: capitals and servicesin relation to the clam fishery in the Lagoon of Venice
(a) Capitalscategory subcategory contents examplesphysical fixed buildings, fixed machinery,
roads, harbours, etcbuildings for storing andprocessing shellfish
movable equipment fishing boatsworking stocks of raw materials and
products for saledredged clams (whichmight be relaid)
human individual skills and knowledge boat operation, clamdredging, etc
intellectual patents, books, software,etc
training courses in fish-eries management; tradi-tional ecological knowledge
social networks, institutions fishing co-operatives, gov-ernment fisheries office, etc
natural renewable∗ stocks of living things, soiletc
the stock of wild clams inthe lagoon
non-renewable∗
fossil fuels, minerals, bio-diversity
marine biodiversity
∗ renewability is a matter of timescale: fossil fuels need millions of years
(b) Human activitieseconomic sector contents examplesprimary exploiting natural resources
(mining, fishing, forestry,some farming)
harvesting wild clams, or us-ing lagoon to grow them
secondary processing and distributingthese resources or things madefrom them
shellfish processing
tertiary supplying services to otherpeople or institutions
insuring boats, licensing shell-fisheries, fish restaurants
(c) Ecosystem services∗
category contents examplessupporting necessary for other ecosystem
servicesprimary production by la-goonal phytoplankton
provisioning products or goods, e.g. food,materials, medicines, biofuels
wild or farmed clams from thelagoon
regulating climate and water regulation,erosion control, storm protec-tion etc
waste removal as a result of la-goonal flushing
cultural nonmaterial benefits: spiri-tual, recreational, aesthetic
‘sunset over the lagoon ofVenice’
∗ Millennium Ecosystem Assessment, 2003. Ecosystems and Human Well-being:A Framework for Assessment. Island Press, Washington, D.C.

13 DEFINING A VIRTUAL SYSTEM 30
Table 7: Action Points for System Definition task. This task begins theprocess that leads from knowledge of the real coastal zone system to endin the construction and use of a mathematical model. The Virtual Systemmay also include relevant socio-economic features that can be conceptualizedbut will not simulated. It is important to ensure that all the main real-world social, economic and ecological functionality relevant to the ‘Issue’is represented within the Virtual System, although maybe in a simplifiedmanner.
Sub-task
Action Point
1. Define the Coastal Zone Virtual System:– Describe the cause-&-effect chain from Human Activity via ecosystemdysfunction to Impact that is involved in the problem.– Draw a map of the real system showing the main features to be includedin the Virtual System, including boundaries.– Identify vertical structure that is important to the coastal ecosystem’sfunctioning.– List the main ecosystem components, and their main links, to be includedin the Virtual System because they are relevant to the ‘Issue’.–Specify the physical boundary conditions: list or map the main trans-boundary exchanges that should be included in the Virtual System.– Identify the social components to be included in the Virtual System,including the main property rights and Goverance structure relating to theIssue. Draw an Institutional Map.– List the present and potential economic demands likely to be made in thereal system in relation to the Policy Issue, and which should be includedin the Virtual System.
→ →→ maps and lists.
2. Identify the external hazards:– List the main external hazards that pose a risk to the real system inrelation to the ‘Issue’. Evaluate the level of hazard, the probability of itsoccurrence, and its consequence for each management option, or begin thework needed to do this if there are complicated matters to consider.
→ →→ preliminary list of risks
3. Synthesize the state of the impacted system:– Include the outputs from sub-tasks 1 and 2 in an illustrated narrativethat defines the Virtual System in relation to the ‘Issue’ and describes theeffect of relevant Human Activities on the current state of the ecosystem,the goods and services that it provides, and the stakeholders involved.– Discuss this narrative with other scientists and the Reference Group (ofstakeholders and public officials) in order to identify knowledge gaps, takeaccount of traditional ecological knowledge and the Reference Group’s per-ception of the socio-economic system.
→ →→ First draft of the ‘Designed System’ report
14 MAKING A CONCEPTUAL MODEL 31
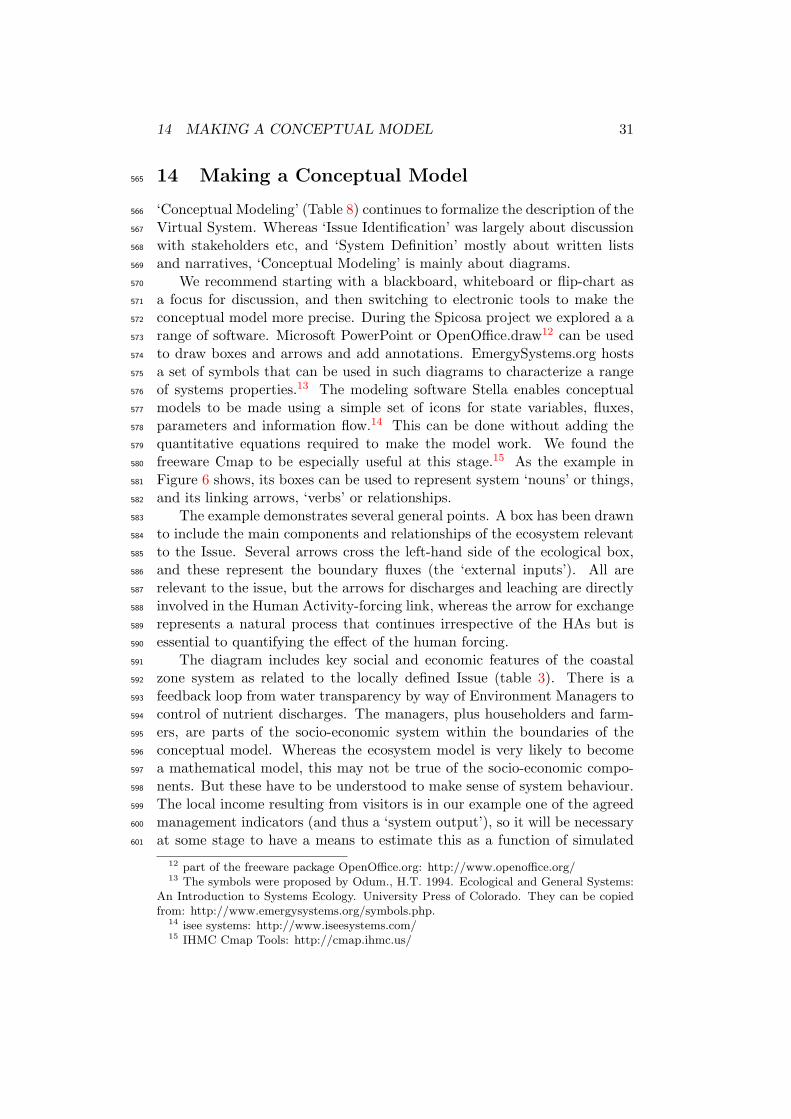
14 Making a Conceptual Model565
‘Conceptual Modeling’ (Table 8) continues to formalize the description of the566
Virtual System. Whereas ‘Issue Identification’ was largely about discussion567
with stakeholders etc, and ‘System Definition’ mostly about written lists568
and narratives, ‘Conceptual Modeling’ is mainly about diagrams.569
We recommend starting with a blackboard, whiteboard or flip-chart as570
a focus for discussion, and then switching to electronic tools to make the571
conceptual model more precise. During the Spicosa project we explored a a572
range of software. Microsoft PowerPoint or OpenOffice.draw12 can be used573
to draw boxes and arrows and add annotations. EmergySystems.org hosts574
a set of symbols that can be used in such diagrams to characterize a range575
of systems properties.13 The modeling software Stella enables conceptual576
models to be made using a simple set of icons for state variables, fluxes,577
parameters and information flow.14 This can be done without adding the578
quantitative equations required to make the model work. We found the579
freeware Cmap to be especially useful at this stage.15 As the example in580
Figure 6 shows, its boxes can be used to represent system ‘nouns’ or things,581
and its linking arrows, ‘verbs’ or relationships.582
The example demonstrates several general points. A box has been drawn583
to include the main components and relationships of the ecosystem relevant584
to the Issue. Several arrows cross the left-hand side of the ecological box,585
and these represent the boundary fluxes (the ‘external inputs’). All are586
relevant to the issue, but the arrows for discharges and leaching are directly587
involved in the Human Activity-forcing link, whereas the arrow for exchange588
represents a natural process that continues irrespective of the HAs but is589
essential to quantifying the effect of the human forcing.590
The diagram includes key social and economic features of the coastal591
zone system as related to the locally defined Issue (table 3). There is a592
feedback loop from water transparency by way of Environment Managers to593
control of nutrient discharges. The managers, plus householders and farm-594
ers, are parts of the socio-economic system within the boundaries of the595
conceptual model. Whereas the ecosystem model is very likely to become596
a mathematical model, this may not be true of the socio-economic compo-597
nents. But these have to be understood to make sense of system behaviour.598
The local income resulting from visitors is in our example one of the agreed599
management indicators (and thus a ‘system output’), so it will be necessary600
at some stage to have a means to estimate this as a function of simulated601
12 part of the freeware package OpenOffice.org: http://www.openoffice.org/13 The symbols were proposed by Odum., H.T. 1994. Ecological and General Systems:
An Introduction to Systems Ecology. University Press of Colorado. They can be copiedfrom: http://www.emergysystems.org/symbols.php.
14 isee systems: http://www.iseesystems.com/15 IHMC Cmap Tools: http://cmap.ihmc.us/

14 MAKING A CONCEPTUAL MODEL 32
changes in transparency. Finally, the two EC directives mentioned here602
may be treated as boundary conditions for governance: they influence what603
happens in the ‘virtual machine’ but are not influenced by it.604
Remember that the SAF started and will finish with stakeholders and605
environment managers. Thus, although the task of making a conceptual606
model - of formalizing understanding or hypotheses about system function607
- is engrossing for scientists, the purpose of the modeling work is to return608
some information to stakeholders. So, keep clearly in mind what the virtual609
machine is supposed to make or indicate!610
Figure 6: Example conceptual model, based on Eutrophication as an ‘Issue’(Table 3). This example uses Cmap Tools to show ideas about the contents andcausal relationships of the ‘virtual system’ as they might emerge from a preliminarydiscussion; it is not yet a full specification for the mathematical model, althoughsuggests that ‘nutrients’ and ‘transparency’ might become state variables in thismodel. An attempt has been made to distinguish actual flows of nutrients (thickerlines) from less well-defined cause-&-effect relationships or information flows. Cmapallows a hierarchy to be set up within the conceptual model, with complex low-levelobjects collapsing into simpler objects when viewed at a high level. The tab onthe ‘phytoplankton’ box indicates that it can be expanded in this way, to show asubsystem dealing with the effect of light and nutrients on micro-algal growth.

14 MAKING A CONCEPTUAL MODEL 33
Table 8: Action Points for Conceptual Modelling task. This task con-tinues the work of formalizing the Virtual System. It can be rewarding initself, in that it is likely to bring about a greater understanding of differingconceptualizations of the Virtual System by scientists of different disciplinesas well as by members of the Reference Group. But it is also part of thedevelopment of simulation models, and so it is useful to begin to think aboutthe data the model will generate in later steps of the SAF application.
Sub-task
Action Point
1. Construct conceptual models.– Choose a method for representing the Virtual System according to con-sistent rules: select a set of graphical symbols and connectors and a meansfor assembling these - either by drawing or by using software.– Prepare conceptual models of the Virtual System, which should centreon the cause-&-effect chain from Human Activity to Impact on ecosystemgoods and services. Several models may be made, either showing differentdisciplinary or heirarchical parts of the social-ecological system or display-ing different opinions of how the relevant part of the real coastal zonesystem is thought to work. Models should show the main social, ecologicaland economic compartments and variables, primary cause-&-effect rela-tionships; key forcings; external inputs (mass, energy, and information),internal inputs.– Involve the Reference Group : depending on how much discussion tookplace during the ‘System Definition’ step, consider further discussion withstakeholders and environment managers in order to represent their knowl-edge within the conceptual models.
→ →→ Conceptual models as diagrams and software
2. Specify model outputs.– Identify the Virtual System variables that might be used to demonstratereliable simulation of the coastal zone system during ‘System Appraisal’.Typically, these will be time series of state variables, or rates, that can becompared with observations.– Specify the system outputs for both qualitative and quantitative analyses:Ensure that the conceptual model diagram(s) contain(s) marker(s) for theinformation that is expected to be output from the simulation model(s),corresponding to or leading to the indicators used to evaluate the effects ofvarious scenarios in the ‘System Appraisal’ and ‘System Output’ steps.
→ →→ result of this sub-task will be included in the conceptual
model diagrams.
15 THINKING ABOUT MODELING TOOLS AND DATA NEEDS 34
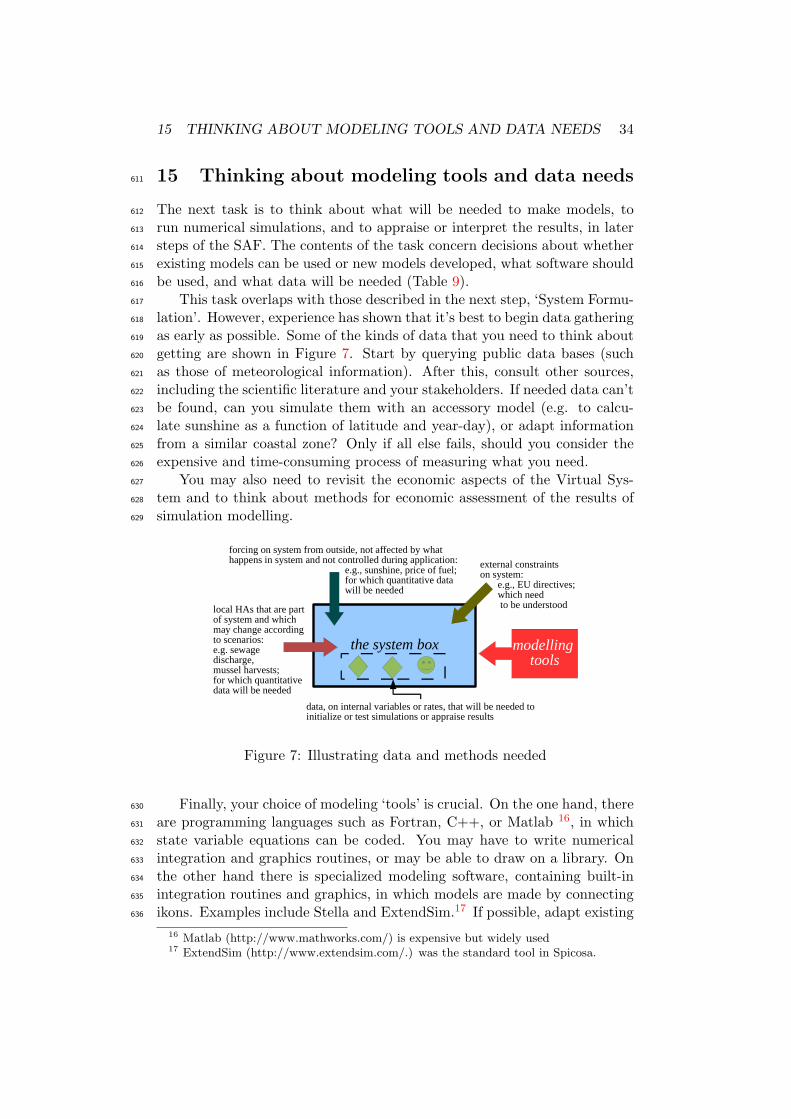
15 Thinking about modeling tools and data needs611
The next task is to think about what will be needed to make models, to612
run numerical simulations, and to appraise or interpret the results, in later613
steps of the SAF. The contents of the task concern decisions about whether614
existing models can be used or new models developed, what software should615
be used, and what data will be needed (Table 9).616
This task overlaps with those described in the next step, ‘System Formu-617
lation’. However, experience has shown that it’s best to begin data gathering618
as early as possible. Some of the kinds of data that you need to think about619
getting are shown in Figure 7. Start by querying public data bases (such620
as those of meteorological information). After this, consult other sources,621
including the scientific literature and your stakeholders. If needed data can’t622
be found, can you simulate them with an accessory model (e.g. to calcu-623
late sunshine as a function of latitude and year-day), or adapt information624
from a similar coastal zone? Only if all else fails, should you consider the625
expensive and time-consuming process of measuring what you need.626
You may also need to revisit the economic aspects of the Virtual Sys-627
tem and to think about methods for economic assessment of the results of628
simulation modelling.629
the system box
forcing on system from outside, not affected by what happens in system and not controlled during application: e.g., sunshine, price of fuel; for which quantitative data will be needed
external constraints on system: e.g., EU directives; which need to be understoodlocal HAs that are part
of system and which may change according to scenarios:e.g. sewage discharge,mussel harvests; for which quantitative data will be needed
data, on internal variables or rates, that will be needed to initialize or test simulations or appraise results
modelling tools
Figure 7: Illustrating data and methods needed
Finally, your choice of modeling ‘tools’ is crucial. On the one hand, there630
are programming languages such as Fortran, C++, or Matlab 16, in which631
state variable equations can be coded. You may have to write numerical632
integration and graphics routines, or may be able to draw on a library. On633
the other hand there is specialized modeling software, containing built-in634
integration routines and graphics, in which models are made by connecting635
ikons. Examples include Stella and ExtendSim.17 If possible, adapt existing636
16 Matlab (http://www.mathworks.com/) is expensive but widely used17 ExtendSim (http://www.extendsim.com/.) was the standard tool in Spicosa.

15 THINKING ABOUT MODELING TOOLS AND DATA NEEDS 35
models and use familiar software. Making a simulation model from scratch637
is time-consuming.638
639
640
Box: the choice of software and the use of modelers
At the start of the Spicosa project we had thought that conceptual modelling was (merely)a step on the way to the making of simulation models during ‘System Formulation’. Wefurther thought that the subject specialists who learned to use the ExtendSim softwarewould be able to create a library of validated ‘model blocks’ - for example, containingalgorithms for simulating phytoplankton growth or decision making in water supply -which could be drawn on by other modellers, so that an Issue-related Virtual Systemmodel could be assembled quickly. In effect, the software was chosen to support ‘collectiverationality’ in model-building.
There was such rationality in model building, and it was aided by the use of a commonsoftware tool, but, we learned, it mainly involved two things that we had not expected:the use of conceptual models to bring the disciplines together with each other and theReference group, and the swopping of modeling experience between skilled and traineemodelers. The task of drawing up a complete library of validated and user-friendly blocksproved beyond the resources available to the project, although example blocks are availablefrom the Spicosa model library. (You will need the ExtendSim software, and familiaritywith Extend ‘library files’ to view them.)
This is what we learnt from the project, and now recommend:
• think about the modellers as well as the software and the model; if your SAF appli-cation is stand-alone (i.e. you don’t need to swop model code with other groups), usesoftware with which your modelers are already familiar;
• you need someone with generic skills in systems theory and conceptual modelling aswell as generic modellers who are (if possible - they take a long time to train) alreadyskilled in mathematics, programming, and running and testing models;
• the strategic software choice - between programming languages and ikon-based mod-elling software - is best dictated by existing skills and by cost issues concerninglicenses;
• ikon-based models are easier for non-modellers to understand - to some extend theyexplicitly represent the conceptual model in the simulation model;
• the chosen software should include a library of routines for numerical integration,handling data-sets, graphing output and comparing it with observations;
• try to avoid reinventing wheels: once the Virtual System has been conceptualized,review the relevant discipline-based literatures for appropriate mathematical formu-lation of each process that you want to include in the simulation model, and seek codelibraries containing well-tested algorithmic implementations of these formulations.
641

15 THINKING ABOUT MODELING TOOLS AND DATA NEEDS 36
Table 9: Action Points for Methods & Information task
Sub-task
Action Point
1. Identify software, methods and formats.– Decide on strategy for simulation modelling, including whether to adaptavailable existing models, or develop new sub-models, as components forthe Virtual System simulation model.– Identify software tools for building the simulation model, deciding be-tween the use of familiar software and the acquisition of new and perhapsmore systems-oriented software.– Specify auxiliary models that may be needed to link with the main sim-ulation model (for example, to provide boundary conditions): they shouldbe available, and feasible to use with available resources.– Identify other software or analytical tools needed (e.g. GeographicalInformation Systems, tools for time-series or statistical analyses).– Identify data format (and any Intellectual Property issues) for existingdata sets, and decide how these data sets and model outputs will be stored.
→ →→ Documented decisions about strategy, tools, formats and
existing models.
2. Analyse the economic dimensions of the Coastal Zone system and identifysuitable economic assessment methodologies.
– If economic dimensions of your models are not clear from previous tasks,go through the ‘step-by-step’ approach in Mongruel et al. (2011).– Identify appropriate assessment methodologies to explore the future statesof the Coastal Zone system, and agree these with the Reference Group.
→ →→ Decisions about approaches and methods for economic
assessment.
3. Begin to acquire data.– Identify the relevant Human Activities and set in motion actions to ac-quire relevant ‘pressure’ or ‘forcing’ data.– Identify existing economic data relating to these HAs and set in motionactions to acquire these data.– Identify existing demographic and social attitude data relating to theseHAs and set in motion actions to get them.– If Coastal Zone Governance structure relative to HAs is not clear fromprevious tasks, set in motion actions to identify relevant laws and gover-nance institutions.– List ecological, social and economic data (for initial conditions, forcing orboundary conditions, and testing) that will be needed for simulations andtests, identify sources, and set in motion actions to acquire these data.– Where possible, identify model parameter values that will be needed,identify sources, and set in motion actions to acquire these data.– Decide what to do in the absence of existing data: interpolate, simulatewith auxilary models, use expert judgement, or (bearing in mind expenseand time requirements) commission observations or experiments.
→ →→ Actions taking place to get data

16 REFLECTING ON PROGRESS SO FAR 37
16 Reflecting on progress so far642
‘System Design’ is a tool like a microscope or telescope; the sequence of643
tasks in this guide can be likened to the process of bringing the object644
of attention more sharply into focus. That object is the Virtual System645
that includes the connection from the Issue-related Human Activity to its646
impact on ecosystem goods and services and their contribution to the ‘well-647
being needs’ of stakeholders. Seen in the light of this analogy, the ‘Problem648
Scaling’ task is simple: it is to consider whether the designed system, in the649
form of the conceptual model, is too simple or too complicated. You do this650
so that you can scale - i.e. adjust the number of model components and the651
data requirements - for relevance (to the Issue), for resources (of skills and652
time available to you), and in terms of scientific understanding.653
‘An idealization is a deliberate simplication of something complicated654
with the objective of making it more tractable. . . . Aristotelian idealiza-655
tion amounts to ‘stripping away’, in our imagination, all properties from a656
concrete object that we believe are not relevant to the problem at hand.657
. . . Galilean idealizations are ones that involve deliberate distortions. Physi-658
cists build models consisting of point masses moving on frictionless planes,659
economists assume that agents are omniscient, biologists study isolated pop-660
ulations, and so on.’ 18 ‘Occam’s razor’: it is vain to with more what can661
be done with fewer, suggests starting with a simple model, and adding extra662
components only when it proves impossible to get realistic results from the663
simple model. In the face of a complicated physical and human-social world,664
Occam’s razor is helpful. When applied to models of systems, however, it665
may slice away something that appears minor but which actually plays a666
critical part in a feedback loop. Linear models, such as those simulating667
cause-effect chains, can be made simple; but most systems have feedback668
loops that you may want to simulate (Figure 8).669
‘Problem Scaling’ can lead to removal of some existing parts of the con-670
ceptual model, and the addition of new parts. In ideal circumstances, such671
adjustment could take some time. In practice, your application will be re-672
stricted by the resources of people, skills, time and information available to673
you, and by the stakeholders’ time-constraints. So the Virtual System needs674
to be reconsidered in relation to those constraints, and a decision reached,675
in consultation with stakeholders, as to what can be done. If your modelers676
are experienced and already have portfolios of model components, then it677
will be possible to build, quickly, an adequately complex model. If that is678
not possible, do as much as you can! Our experience in Spicosa suggests679
that even simple models, simulating only parts of the system, can be use-680
ful, and that the business of resolving the Issue and creating a conceptual681
18 Frigg, R. and Hartmann, S. (2006) ‘Models in Science’, URL:http://plato.stanford.edu/entries/models-science/

16 REFLECTING ON PROGRESS SO FAR 38
model can help by clarifying understanding of ecological, social and eco-682
nomic constraints on the management solutions, even if no numerical model683
is built.684
A SAF application is a process carried out jointly with stakeholders and685
environment managers or policy makers. In addition to on-going discus-686
sions with the Reference Group, there will be a need to report to the wider687
community of stakeholders in the ‘System Output’ step. It is best to start688
preparing for this from the start, by documenting each application step as689
it takes place. In addition, it may be desirable to produce a scientific out-690
put, in the form of a paper in peer-reviewed journal. This will strengthen691
the perceived legitimacy of the scientific results, will disseminate what has692
been learnt out into the wider scientific community, and may be vital for693
the career prospects of the scientists involved.694
Now you should be ready to work through the action points in Table 10,695
before moving on to the SAF’s next step of ‘System Formulation’. In that696
step, what we have here called the social-ecological system (to emphasise697
its unity) becomes the ESEsystem to denote that models for ecological,698
social and economic components may be made separately, by experts in the699
different disciplines, before linking during the ‘System Appraisal’ step.700
phytoplankton clamsclamfishery
business
sunlight
nutrients wages jobs
citizens
other consumersof phytoplankton
POM
exchange withexternal (physical)
conditions
external (socio-ecological)
institutions
legal constraints
taxes
domestic and industrial sewage
rivers
contamination
phytoplankton clamsclamfishery
business
sunlight
nutrients wages jobs
negative
positive
Figure 8: Illustrating Problem Scaling. On top is a simple chain from phy-toplankton to a fishery in a coastal lagoon; the more complex version underneathincludes several feedback loops as well as boundary fluxes.

16 REFLECTING ON PROGRESS SO FAR 39
Table 10: Action Points for Problem Scaling task.
Sub-task
Action Point
1.Adjust the complexity of the Virtual System:– Adjust the complexity of the science in the Virtual System to get the bestbalance of simplicity and accurately, so that so far as is known, scientificunderstanding of the key process are represented accurately but withouttoo many parameters, so that in each part of the model there is a balancebetween contribution to explanation of variability and the amount of workthat will be needed to set up and run the simulation model. This maymean scaling down, by: removing state variables from the list; re-adjustingthe Virtual System’s extent to simplify boundary condition description;simplifying the representation of spatial heterogeneity; removing or simpli-fying subsystems; focussing on a single space and time scale, so eliminatingsome process descriptions. Or, it may mean scaling up: adding variables,feedback loops, and process descriptions.
→ →→ revised conceptual model
– Ensure feasability of implementation for the model by adjusting the com-plexity of the Virtual System to ensure that it will be possible to constructand run the simulation model(s), and assess the results, with available re-sources.
→ →→ updated management plan for the application
2. Begin to specify the format for results:– Begin to think about the need to publish scientific results, and if necessaryidentify suitable peer-reviewed journals in the natural economic and socialsciences, and note formats and requirements.– Begin to specify the format for presentations and visualizations (forpolicy-makers, stakeholders, and public) recommended for use in ‘SystemOutput’. This might include thinking about a media strategy, and includesdiscussing requirements with the Reference Group.
→ →→notes related to the outputs, perhaps with the outline of a
paper and part of a set of presentation slides
3. ‘Designed System Report’:– Compile, or update, a ‘Designed System Report’ which will be a workingdocument, to be updated in subsequent steps, and from which informationcan be drawn in ‘System Output’ and for scientific publication
→ →→ Designed System Report

17 APPENDIX: AUTHORSHIP, HISTORY AND CITATION 40
17 Appendix: Authorship, history and citation701
The original ‘System Design’ handbook was the responsibility of SPICOSA’s702
Work-Package 3, which began work at the first SPICOSA meeting in Rome,703
20-22 February, 2007. The handbook went through several drafts, culminat-704
ing in v.1.26 of 13 November 2007, which took account of feedback received705
at the workshop in the University of Plymouth, 12-14 September 2007.706
Further revisions were drafted in 2008, until in Brest in October 2008, it707
was decided to use a web-based and layered approach to the SAF handbook.708
Thus, the original v.1.26 was split into sections, which were worked on to709
a plan developed in Rome in June 2009. v.3.02 of this ‘Guide to System710
Design’, a summary of key ideas and a list of tasks and subtasks, was written711
by the WP3 leader, drawing on material from v.1.26 and incomplete drafts of712
separated sections of the handbook, and the reported experiences of SSAs.713
It was finished in February 2010, at which time WP3 was brought to an714
end. Work on modifying the guide for use on the SAF web-site continued715
in Spicosa WP6, and resulted in this version (v3.09) in February 2011.716
Table 11: Contributors to ‘System Design’ handbook and Guide
SPICOSA partner Contributor1: IFREMER Remi Mongruel & Harold Levrel3: IAMC-CNR Tom Hopkins (project joint co-ordinator)9: BUC Audun Sandberg14: UEA–CSERGE David Hadley17: NUE Teresa Fernandes
Paul Tett (WP3 leader & main editor)19: ULB Johanna d’Hernoncourt22: SAMS Vicki Hendrick
Paul Tett ( from March 2010 )24: KMGNE Anne Mette ( WP6 leader & SAF dictator)26: IVM Jan Vermaat & Alison Gilbert32: MU-FHRC Loraine McFadden & Colin Green & Sally Priest51: SZN Maurizio Ribera d’Alcona
SPICOSA, Science and Policy Integration for Coastal Systems Assessment,717
was Proposal/Contract no. 036992 in the European SIXTH FRAMEWORK718
PROGRAMME, PRIORITY 1.1.6.3: Global Change and Ecosystems. Start719
date of contract: 1 February 2007; end: 31 January 2011.720

17 APPENDIX: AUTHORSHIP, HISTORY AND CITATION 41
Cite this document asTett, P., Mongruel, R., Levrel, H., Hopkins, T., Sandberg, A., Hadley,D., Fernandes, T., Hendrick, V., Mette, A., Vermaat, J., Gilbert, A.,d’Hernoncourt, J., McFadden, L., Priest, S., Green, C., and d’Alcona, M.R.(2011)Guide to System Design, v.3.09,SPICOSA Project Report,Scottish Association for Marine Science, Oban.