Embed Size (px)
Citation preview

Safaricom Limited
FY15 Presentation

FY15 Highlights
FY15 Financial Review
Strategic Focus and Guidance
2
Contents

3
• Strong growth of non-voice service revenue.
• Continued investment and innovation.
o Significant improvements in voice and data service quality based on our ongoing Best Network in Kenya program
o Ongoing deployment of 900MHz spectrum acquired from Essar for 3G, and modernization of 100% of our 2G base stations
o 4G go live in Nairobi and Mombasa delivering faster internet speeds
o Next generation MPesa system and upgrade of ERP successfully implemented
o 2,010 km of metro fibre installed. 1,070 base stations connected to own fibre
• Maintained position as Kenya’s most admired brand, with an overall brand equity score of 86%*, a Youthfulness score of 79%* and a Net Promoter Score of 53%**
• Sustained progress on our initiative to transform lives, especially in financial inclusion
*Internally commissioned research performed by Millward Brown **Internally commissioned research performed by TNS
FY15 Highlights

4What we have achieved
Best Network in
Kenya
Growing mobile
data
• Launched Kenya’s first 4G network in Nairobi and Mombasa
• Successfully deployed the next generation (G2) MPesa system in Kenya
• 2,010 kms of metro fiber rolled out to date, with 1,070 (30%) of our base stations connected
• 720 buildings connected to our own fiber
• 100% of our Radio Network now modernised
• Trusted to build the National Police Security Network with phase 1 going live in May 2015
• Highest 3G data speeds averaging 4.3mbps and improvements in call drop rates
• Grew active mobile data customers
• Smartphone users grew by 98% to 3.4m through provision of low cost smartphones
• Provided more value in the bundles to drive affordability, growing usage by 38%

5
Rewarding and
delighting our
customers
• Increased number of web self care service users to 2.67m
• Made emergency top ups more accessible
• Flexi loyalty redemption and credit facilities for customers to acquire smart devices
Deepening
financial Inclusion
• Mpesa 30 day active customers grew
• Launched International Money Transfer to Vodacom Tanzania
• 30 day active Lipa na MPesa merchants growth of 105% to 49,413. Value transacted in
March 2015 of Kshs 11.6bn
• 30 Day active M-shwari customers now at 3m, deposit at Kshs 5.5bn and loans Kshs 2.1bn
• Launched KCB- MPesa as an alternative to M-Shwari. Customers at 1.4m
• Launched Okoa Stima an emergency loan facility to pay for electricity
What we have achieved…Cont’d

6
Growing youth
appeal
• Youth brand equity is now at 79% and Youth Net Promoter Score at 57%
• Acquired 1.28m subscribers from the youth segment
• Substantially reduced mobile data pricing to ensure affordability
Supporting
innovation
• Idea Lifecycle Management Portal: enabling ideas to be shared internally and externally
• Kshs 90m venture fund that will invest in high potential start-ups using mobile technology
What we have achieved…Cont’dPartner of choice
for business
• Increased penetration of additional products into corporate customer base (Fixed data at
21% and MPesa at 22%)
• County government penetration with 60% of counties using at least one Enterprise solution
• Grew SME active customers by 106% to 64,000 customers

7
TOTAL REVENUE
SERVICE REVENUE
NON-VOICE SERVICE REVENUE
EBITDA
NET INCOME
FREE CASH FLOW
+13% to Kshs 163.4bn
+13% to Kshs 156.2bn
+27% to Kshs 68.8bn
+17% to Kshs 71.2bn
+38% to Kshs 31.9bn
+21% to Kshs 27.5bn
Strong financial performance
PROPOSED DIVIDEND PER SHARE +36% to Kshs 0.64

FY15 Highlights
FY15 Financial Review
Strategic Focus and Guidance
8
Contents

Total revenueKshs. Billion
EBITDAKshs. Billion
Free cash flowKshs. Billion
Net incomeKshs. Billion
+12.9% +16.8% +21.3%+38.4%
9
8.3% growth in subscribers. Increasing ARPUs across Data, SMS and MPesa
12.9% growth in revenue.Robust EBITDA margin at 43.6%(incl. positive one-offs)
Driven by growth in EBITDA and flat depreciation
Positive impact from favourable trading results
Delivering on strategy: Strong financial results
144.67
163.36
FY14 FY15

12.9%
1
0
Total revenue breakdown Kshs. Billion
• 12.9% growth in total revenue
• 8.3% growth in customer base to 23.35m
• Non-voice service revenue growth of 27.4%
• Voice service revenue growth of 3.7%
Total revenue growthKshs. Billion
FY15 Total revenueKshs. Billion
Strong revenue growth
107.00
124.29
144.67
163.36
80.00
100.00
120.00
140.00
160.00
FY12 FY13 FY14 FY15

11
Service revenue: Growth across all segments
100.19
118.06
138.36
156.25

3.7%
8.3%
12
• 3.7 % growth in voice service revenue
• 8.3 % growth in customers
• Strong prepay airtime distribution network
o Top-up cards distributed in over 275,000 retail outlets and 42 own retail shops
o 37.8% of airtime top-ups directly throughMPesa
• 31.9% increase in emergency top ups (Okoa Jahazi)
• Average blended rate per minute is Kshs 2.92* for national outgoing calls
*On top of which 16% VAT and 10% excise duty is levied
Voice Revenue Kshs. Billion
Mobile customersMillion
Voice revenue: Sustained growth
68.12
75.84
84.32
87.41
60.00
70.00
80.00
90.00
FY12 FY13 FY14 FY15
19.07 19.42
21.57
23.35
10.00
15.00
20.00
25.00
FY12 FY13 FY14 FY15

27.4%
13
• Non-voice service revenue grew 27.4%, now
42.1% of total revenue
• Revenue growth of:
• SMS +14.8%
• Mobile data +59.2%
• Fixed service +21.7%
• MPesa +22.8%
• Other service revenue +32.9% (Access fees /
Okoa Jahazi)
Non - Voice Revenue Kshs. Billion
Non-voice revenue: Strong growth across all segments
32.07
42.21
54.04
68.84
20.00
30.00
40.00
50.00
60.00
70.00
FY12 FY13 FY14 FY15

22.8%
14.0%
14
• 22.8% growth in MPesa revenue, driven by:• 14.0% increase in 30 day active users to 13.86m• 6.2 chargeable transactions per month per 30 day
active users (13% growth)
• Total MPesa transactional value at Kshs 4.18tn in FY15 (26% growth)
• In March 2015, Lipa Na MPesa customers made payments of Kshs 11.6bn, of which Kshs 2.8bn was specific to merchants paying distributors
• 5.8% growth in MPesa agents compared to last financial year; now at 85,756 MPesa agent outlets
• M-Shwari: Increased active customers to 5.8m, 30 day active customer to 3.0m, Kshs 5.5bn on deposit and Kshs 2.1bn on loan with NPLs at 2.0%
• KCB - MPesa: registered customers 1.4m, Kshs 120m on deposit and Kshs 950m on loan
MPesa RevenueKshs. Billion
30-day Active MPesa CustomersMillion
MPesa: Driving financial inclusion
9.08
10.54
12.16
13.86
5.00
10.00
15.00
FY12 FY13 FY14 FY15
16.87
21.84
26.56
32.63
10.00
15.00
20.00
25.00
30.00
35.00
FY12 FY13 FY14 FY15

MPesa: value transacted (Ksh bn)
Value transacted is 34% of GDP*
Computation based on transfers and other payments (B2C, C2B, IMT, Buy goods, etc) and rebased GDP of
USD 55.2bn
*According to Kenya National Bureau of Statistics & World Bank
+84%
+31%
+27%
+33%
•CAGR
FY ’11-’FY15’
+34% CAGR
1,301
2,061
2,636
3,321
4,181
15

14.8%
16
• 14.8% growth in SMS revenue, driven by;
• 8.2% growth in 30 day active SMS users to 13.35m
• 33.8% increase in active SMS bundle users to 4.0m
• 14.1% growth in SMS usage per customer
• Average blended rate per SMS declined by 5.6 % due to increased bundle purchases
8.2%SMS CustomersMillion
SMS RevenueKshs. Billion
SMS: Attractive bundles & active users driving growth
7.77
10.15
13.62
15.63
5.00
10.00
15.00
20.00
FY12 FY13 FY14 FY15
9.58
12.47 12.3413.35
5.00
10.00
15.00
FY12 FY13 FY14 FY15

Data: Customers, usage & devices driving growth
51.1%
17
• Mobile data revenue growth of 59.2% driven by:
• 21.2% growth in 30 day active mobile data users to 11.6m – now 50% of our customer base
• 3G & 4G enabled devices in our network now at 4.4m
• Grew active data bundle users to 4m• 37.9% increase in mobile data usage per
customer • Average price per MB declined by 8.3% from
increased bundle purchases
• Fixed service revenue growth of 21.7% driven by 22.8% increase in customers to 8,624
21.2%
Mobile Data & Fixed Service Revenue
Kshs. Billion
30-day Active Mobile Data CustomersMillion
4.55
7.13
9.56
11.59
0.00
5.00
10.00
15.00
FY12 FY13 FY14 FY15
6.59
8.73
11.88
17.95
5.00
10.00
15.00
20.00
FY12 FY13 FY14 FY15

Kshs. Kshs.Kshs. Kshs. Kshs.
Mobile DataSMSVoice Service ARPUMPesa
18
ARPU decline attributed to reduction 21% in incoming rates and 3.7%
reduction in outbound usage per customer
13.1% growth in chargeable transactions per 30 day active customers
37.9% increase in usage per subscriber due to affordable bundles and smartphone penetration
14.1% increase usage driven by affordable SMS bundles
Driven by increased usage across non voice service revenue segments
* Voice, SMS and Service ARPU are calculated based on total mobile customers
* M-PESA and Mobile Data ARPUs are calculated based on respective 30 day active customers
-5.7% +9.4%+7.3% +26.4% +5.20%
Sustained ARPU growth in non-voice services

FY15 Direct costs
Kshs. Billion
19
• 9.1% increase in direct costs, compared to 12.9% increase in total revenue
• Contribution margin increased to 65.6%, up 1.5ppt
FY15 Direct costs breakdown
Kshs. Billion
Direct Costs control improves contribution margin
+9.1%
44.00
47.20
51.96
56.71
20.00
30.00
40.00
50.00
60.00
FY12 FY13 FY14 FY15
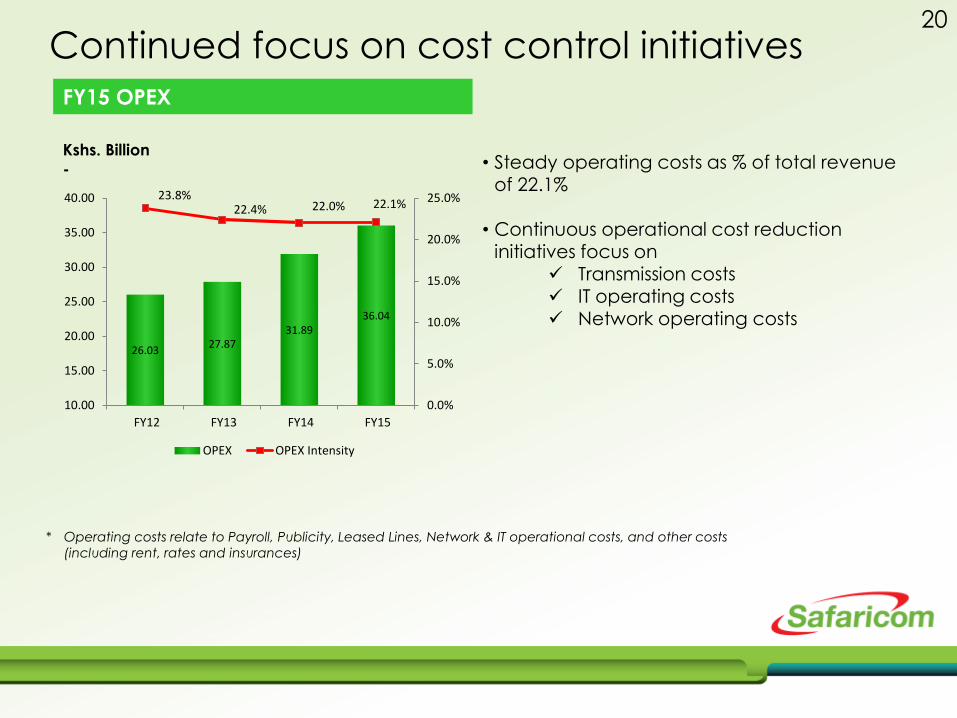
FY15 OPEX
Kshs. Billion
-
20
• Steady operating costs as % of total revenue of 22.1%
• Continuous operational cost reduction initiatives focus on
Transmission costs IT operating costs Network operating costs
* Operating costs relate to Payroll, Publicity, Leased Lines, Network & IT operational costs, and other costs
(including rent, rates and insurances)
26.0327.87
31.8936.04
23.8%22.4% 22.0% 22.1%
0.0%
5.0%
10.0%
15.0%
20.0%
25.0%
10.00
15.00
20.00
25.00
30.00
35.00
40.00
FY12 FY13 FY14 FY15
OPEX OPEX Intensity
Continued focus on cost control initiatives

• 16.7 % growth in FY15 EBITDA to Kshs 71.2bn
• FY15 EBITDA margin at 43.6%, however, the underlying EBITDA margin is 42.6% after removing material one-off items
EBITDA
21
Kshs. Billion
Strong growth in EBITDA
FY12 37.5
FY13 49.1
FY1460.9
FY1571.2
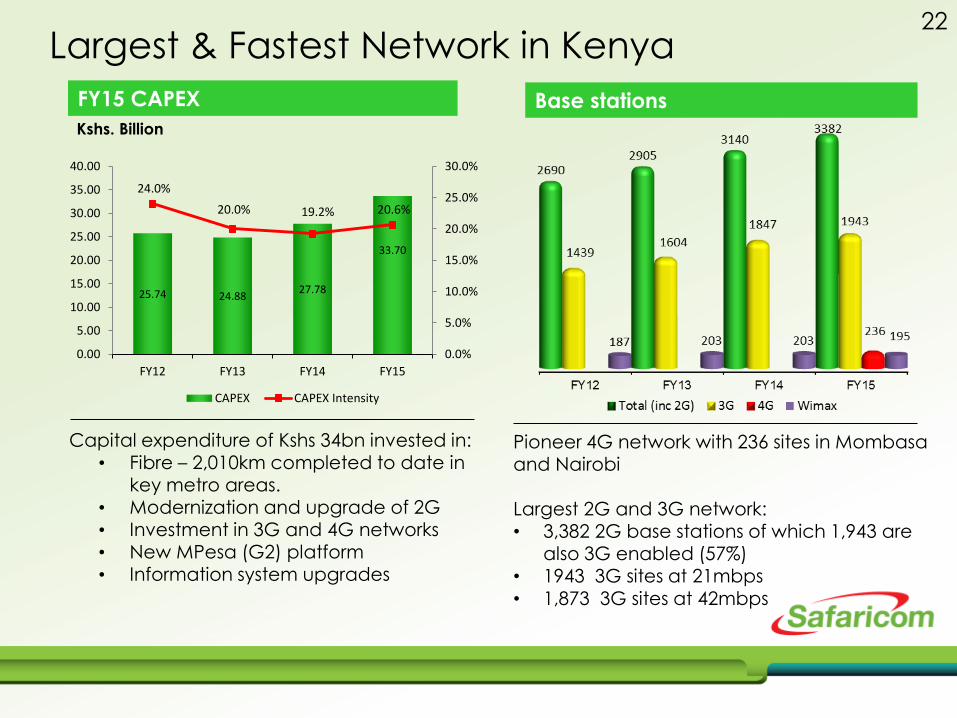
Pioneer 4G network with 236 sites in Mombasa and Nairobi
Largest 2G and 3G network:• 3,382 2G base stations of which 1,943 are
also 3G enabled (57%)• 1943 3G sites at 21mbps
• 1,873 3G sites at 42mbps
Base stationsFY15 CAPEX
Kshs. Billion
22
Capital expenditure of Kshs 34bn invested in:• Fibre – 2,010km completed to date in
key metro areas.• Modernization and upgrade of 2G • Investment in 3G and 4G networks • New MPesa (G2) platform
• Information system upgrades
25.74 24.8827.78
33.70
24.0%
20.0% 19.2% 20.6%
0.0%
5.0%
10.0%
15.0%
20.0%
25.0%
30.0%
0.00
5.00
10.00
15.00
20.00
25.00
30.00
35.00
40.00
FY12 FY13 FY14 FY15
CAPEX CAPEX Intensity
Largest & Fastest Network in Kenya
23
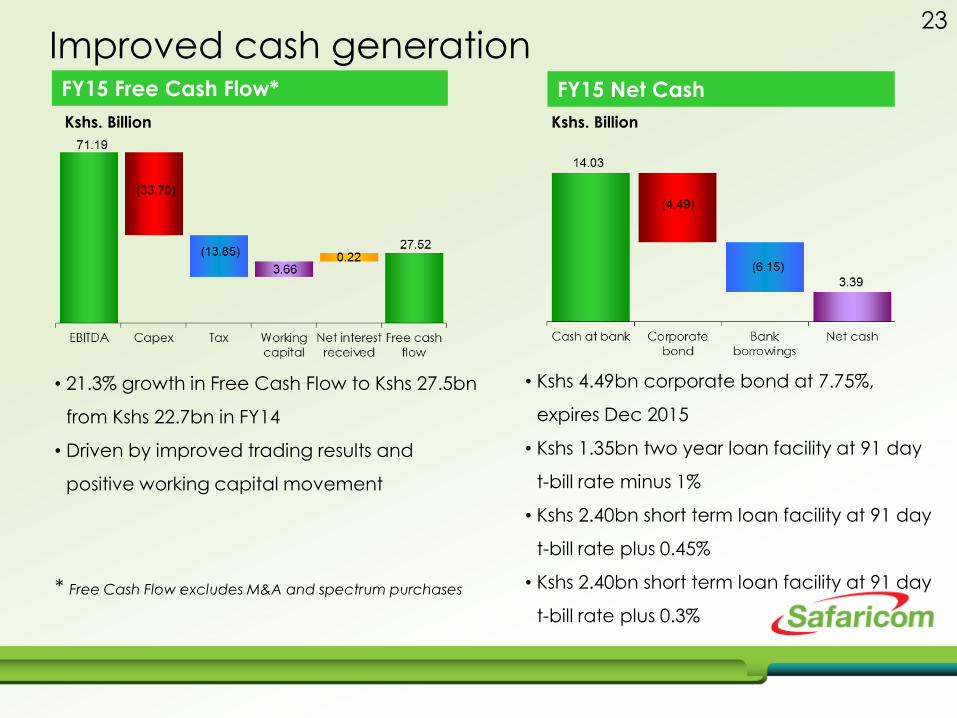
Kshs. Billion Kshs. Billion
FY15 Free Cash Flow* FY15 Net Cash
• 21.3% growth in Free Cash Flow to Kshs 27.5bn
from Kshs 22.7bn in FY14
• Driven by improved trading results and
positive working capital movement
* Free Cash Flow excludes M&A and spectrum purchases
• Kshs 4.49bn corporate bond at 7.75%,
expires Dec 2015
• Kshs 1.35bn two year loan facility at 91 day
t-bill rate minus 1%
• Kshs 2.40bn short term loan facility at 91 day
t-bill rate plus 0.45%
• Kshs 2.40bn short term loan facility at 91 day
t-bill rate plus 0.3%
Improved cash generation

FY15 FY14 GROWTH H2 FY15 H2 FY14 GROWTH
Voice revenue 87.41 84.32 3.7% 43.74 43.27 1.1%
MPesa revenue 32.63 26.56 22.8% 17.03 14.06 21.1%
Messaging revenue 15.63 13.62 14.8% 8.46 7.27 16.4%
Mobile data revenue 14.82 9.31 59.2% 8.32 5.06 64.3%
Fixed service revenue 3.13 2.57 21.7% 1.64 1.35 21.3%
Other service revenue 2.63 1.98 32.9% 1.45 1.08 35.0%
Service Revenue 156.25 138.36 12.9% 80.65 72.09 11.9%
Handset revenue 5.67 4.95 14.6% 2.57 2.72 -5.8%
Acquisition and other revenue 1.45 1.36 6.4% 0.81 0.65 23.8%
Total Revenue 163.37 144.67 12.9% 84.03 75.47 11.3%
Other income 0.58 0.13 >100% 0.02 0.12 -83.5%
Direct costs (56.71) (51.96) 9.1% (27.79) (27.17) 2.3%
Contribution margin 107.24 92.83 15.5% 56.26 48.42 16.2%
Contribution margin % 65.6% 64.2% 1.5% 66.9% 64.2% 2.8%
Operating costs (36.04) (31.89) 13.0% (18.60) (16.34) 13.8%
Operating costs % total revenue 22.1% 22.0% 0.1% 22.1% 21.6% 0.5%
EBITDA 71.19 60.94 16.8% 37.66 32.08 17.4%
EBITDA margin % 43.6% 42.1% 1.5% 44.8% 42.4% 2.4%
Depreciation, amortisation & impairment (25.57) (25.79) -0.8% (12.98) (13.08) -0.8%
Net Financing cost 0.42 (0.17) >100% 0.26 0.08 >100%
Asset Purchase Gain 0.11 0.00 >100% 0.11 0.00 >100%
Taxation (14.28) (11.97) 19.3% (7.88) (7.32) 7.7%
Net Income 31.87 23.02 38.4% 17.16 11.76 45.9%
Earnings per share 0.80 0.57 38.4% 0.43 0.29 45.9%
Free Cash Flow 27.52 22.69 21.3% 12.04 8.95 34.5%
Recommended dividend 25.64 18.83 36.2%
Recommended dividend per share 0.64 0.47 36.2%
Key Financials: 24

Contents
FY15 Highlights
FY15 Financial Review
Strategic Focus and Guidance
25

Strategic priorities26
Our strategy will be driven by;
• Putting our customers first,
• Delivering relevant products, and
• Ensuring excellence in operations

27
Continue the Best
Network In Kenya
program
• Increase 3G population coverage from 69% to 80% in FY16
• Extend 4G deployment to additional 13 towns and cities across Kenya by Dec 2015
• Implement big data capability to improve customer experience
• Continue to roll out fiber to additional 10 towns and connect another 200 base stations
• Fiber to the Building(FTTB): reach 1,000 commercial buildings
• Fiber to the Home (FTTH): reach 8,000 homes in 50 residential estates
Grow mobile data
• Increase smartphone, 3G, and 4G devices penetration to stimulate usage
• Commercialize the Safaricom Home Broadband proposition “The Big Box”
• Nurture and expand partnerships with local & global content providers
Strategic priorities for next year

28
Deepening
financial inclusion
• Leverage the new G2 MPesa system
• Drive growth of Lipa Na MPesa
• Drive uptake of saving & loans through M-shwari and KCB-MPesa
• Grow business to business payments
• Grow IMT within the region
• Improve merchant real time settlement to banks on Lipa na MPesa
Strategic priorities for next year…cont’d
Delighting our
customers
• Offer personalised value propositions
• Improve retail queue waiting time
• Remove call reasons into the call centre
• Robust acquisition of subscribers

29
Partner of choice
for business
• Continue to leverage on own fiber in key towns
• Accelerate commercialization and growth of managed services
• Develop key vertical specific propositions to drive product penetration among corporates
• Drive fixed voice growth, leveraging on Fibre to the Building
• Grow payments for business: Retail, Utility s, Public Sector and FMCG’s
Grow youth
appeal
• More behavior analysis to ensure we develop the best propositions
Strategic priorities for next year…cont’d
Encourage further
innovation
• Continue to engage with internal and external innovators
• Introduce parental control: to control internet for their children
• Provide Sandbox for more developers to connect & use SMS and USSD

FY16 Guidance
Net Income for FY16
Expected to be in the range of Kshs 32 - 34bn
Free Cash Flow for FY16*
Expected to be in the range of Kshs 25 - 26bn (a decrease on FY15 due to payments for the build of the National Police Security Network)
*Free Cash Flow as we present it excludes the impact of any M&A, license renewal fees, and spectrum
purchases
30

31
• Strong growth of non-voice service revenue.
• Continued investment and innovation.
o Significant improvements in voice and data service quality based on our ongoing Best Network in Kenya program
o Ongoing deployment of 900MHz spectrum acquired from Essar for 3G, and modernization of 100% of our 2G base stations
o 4G go live in Nairobi and Mombasa delivering faster internet speeds
o Next generation MPesa system and upgrade of ERP successfully implemented
o 2,010 km of metro fibre installed. 1,070 base stations connected to own fibre
• Maintained position as Kenya’s most admired brand, with an overall brand equity score of 86%*, a Youthfulness score of 79%* and a Net Promoter Score of 53%**
• Sustained progress on our initiative to transform lives, especially in financial inclusion
*Internally commissioned research performed by Millward Brown **Internally commissioned research performed by TNS
FY15 Highlights